Effects on marine radar close to offshore wind farmsusers.ece.utexas.edu/~ling/EU3 UK Kentish Flats...
57
Investigation of Technical and Operational Effects on Marine Radar Close to Kentish Flats Offshore Wind Farm April 2007
-
Upload
truongdang -
Category
Documents
-
view
227 -
download
0
Transcript of Effects on marine radar close to offshore wind farmsusers.ece.utexas.edu/~ling/EU3 UK Kentish Flats...
Investigation of Technical and Operational Effects on Marine
Radar Close to Kentish Flats Offshore Wind Farm
April 2007

This research was conducted independently by MARICO Marine on behalf of the British Wind Energy Association (BWEA). The project steering group was made up of BWEA, the Department of Trade and Industry (DTI), the Maritime and Coastguard Agency (MCA) and the Port of London Authority (PLA). MARICO Marine is an independent consultancy company providing solutions for the marine and offshore energy sectors worldwide (www.marico.co.uk). The project was funded solely by Round 2 offshore wind farm developers.
© 2007 BWEA Page: i

CONTENTS
1 FOREWORD 1
2 INTRODUCTION 3
2.1 RECORDING PERIOD 3 2.2 LOCATION 3 2.3 OBSERVERS 4 2.4 TERMINOLOGY 4 2.5 ASSESSMENT BY NOREL PEER GROUP 4 2.6 ACKNOWLEDGEMENTS 5
3 PROJECT SCOPE AND OBJECTIVES 6
3.1 STUDY AIMS 6
4 PROJECT LOCATION 7
5 DATA COLLECTION 8
5.1 OVERVIEW 8 5.2 PHOTOGRAPHIC RECORDING 9 5.3 DIRECT RADAR RECORDING 10 5.4 RADAR OBSERVER LOGS 11 5.5 VARIABLES ASSESSED 11 5.6 SMALL VESSEL TRIALS 11 5.7 OBSERVATION OF AIRBORNE RADAR 12 5.8 BACKGROUND DATA 12
6 LARGE VESSEL DATA ASSESSMENT 13
6.1 OBSERVED EFFECTS - GENERAL 14 6.2 LINEAR OR SMALL SECTOR MULTIPLE TARGETS 16 6.3 SECTORED DISTORTIONS 18 6.4 “MIRROR” IMAGES 20 6.5 DISTORTIONS WITHIN THE WIND FARM IMAGE 26 6.6 RADAR OPERATION 30 6.7 DEBRIEFING OF NAVIGATORS & PILOTS 31 6.8 FURTHER LARGE VESSEL ANALYSIS 32
7 SMALL CRAFT DATA ASSESSMENT 33
7.1 OBSERVATIONS FROM PASSING VESSELS 33 7.2 SMALL CRAFT OBSERVED FROM “MORVEN” 35
8 LONDON VTS: RECORDED SPURIOUS ECHOES 43
8.1 SIGNAL ENHANCEMENT 44 8.2 MULTIPLE ECHOES 45 8.3 MULTIPLE ECHOES 46
9 SUMMARY OF OBSERVATIONS 47
10 POSSIBLE MITIGATION 48
10.1 GENERAL MITIGATION 48 10.2 WIND FARM SPECIFIC MITIGATION 48
11 CONCLUSIONS 50
12 GLOSSARY 52
© 2007 BWEA Page: i

ANNEX A Radar Observers Trial Log and Procedure Form (Example)
ANNEX B Observation Data Sets
1 Key Points
2 Ship Details
3 Ship Details by Type
4 Radar Details
5 Observation Details
6 Weather
ANNEX C MORVEN Trial Procedure
ANNEX D MORVEN Trial Tracks
ANNEX E Weather Data
ANNEX F Tide Information
ANNEX G Details of Observers
© 2007 BWEA Page: ii

1 FOREWORD
Offshore wind farm developers are required to assess all aspects of proposed developments which have the potential to affect marine safety and to detail these in Environmental Statements submitted with applications for consent1.
The potential for wind farm structures to affect marine navigation and communications systems was raised early in the UK consents process2. However, until a wind farm was constructed in United Kingdom waters, developers were only able to submit data obtained from other European wind farm sites or from desk studies of proposed developments3. In the context of UK coastal waters and wind farm proposals, these approaches were not fully satisfactory.
When the first UK offshore wind farm was completed at North Hoyle, practical tests were able to be undertaken. The report on these was published4 in November 2004 and indicated that the most significant potential effects were those on marine radar systems. In the meantime, the Maritime and Coastguard Agency had refined its guidance to developers on assessing marine navigational safety risks and its requirements concerning marine communications, navigation and radar systems5.
The major deficiency in the North Hoyle report was that the development site was not near to a shipping route. However, one large commercial vessel was diverted from its normal route to pass around and through the wind farm.
This vessel, the “Norbay”, reported a number of effects on its basic radar and ARPA systems but these were not able to be recorded for later analysis.
In March 2005 the Port of London Authority submitted a paper6 to the Nautical and Offshore Renewable Energy Liaison group (NOREL) illustrating the effects of the Kentish Flats development on the radars of vessels passing through the Princes Channel.
1 “Methodology for Assessing the Marine Navigational Safety Risks of Offshore Wind Farms” [Guidance on the
Assessment of the Impact of Offshore Wind Farms] DTI 29th November 2005 2 “Assessing the Navigational Impact of Offshore Wind Farm Proposed for UK Sites – Guidance for Developers”
:Maritime and Coastguard Agency, Project MSA 10/6/200, May 2002 3 Various Environmental Statements submitted with UK Round 1 offshore wind farm applications. DTI archives 2001 to
2005 4 “Results of the electromagnetic investigations and assessments of marine radar, communications and positioning
systems undertaken at the North Hoyle wind farm by QinetiQ and the Maritime and Coastguard Agency” MCA MNA 53/10/366 or QINETIQ/03/00297/1.1 November 2004
5 Proposed UK Offshore Renewable Energy Installations (OREI) – Guidance on Navigational Safety Issues” MGN 275: Marine Guidance Note 275(M) Maritime and Coastguard Agency, August 2004
6 “Interference to radar imagery from offshore wind farms” A Report compiled by the Port of London Authority based on experience of the Kentish Flats Wind Farm Development. 2nd NOREL WP4, Shipping Policy, Department for Transport ,March 2005
© 2007 BWEA Page 1

At the next NOREL meeting, in September 2005, the BWEA (BWEA) proposed7 the setting up of a working group to:
“…build on the research that has been undertaken, both in the UK and abroad, in order to clarify the extent of the problem; consider a range of possible practical and technological solutions; and develop a set of principles that could be employed when navigating around a wind farm”
This group, comprising BWEA, MCA, PLA and DTI representatives drew up general specifications8 for trials to be undertaken, and in February 2006 Marine & Risk Consultants Ltd (MARICO Marine) were contracted by BWEA to carry these out.
The following report details MARICO Marine’s findings, which have been agreed and endorsed by all members of the NOREL working group.
This report should be interpreted within the context of this specific trial; i.e. collision avoidance in pilotage waters from about 1 nm outside a single small wind farm, not to general navigation close to or within other anticipated wind farm developments.
Note: Helicopter and other search and rescue (SAR) trials referred to in the documents are, at the time of writing this report, yet to be carried out. Preliminary trials were carried out at North Hoyle9 in March 2005.
7 “Proposal from BWEA for a Working Group” 3rd NOREL WP 8 , Shipping Policy, Department for Transport, September
2005 8 “Offshore Wind Farm Effects on Marine Radar and their Mitigation” Paper submitted by the Radar Working Group to
NOREL , Shipping Policy, Department for Transport
9 “Offshore Wind Farm Helicopter Search and Rescue - Trials Undertaken at the North Hoyle Wind Farm” Report of helicopter SAR trials undertaken with Royal Air Force Valley ‘C’ Flight 22 Squadron on March 22nd 2005 Maritime and Coastguard Agency Project MSA 10/6/239, May 2005
© 2007 BWEA Page 2

2 INTRODUCTION
This research project was designed to obtain detailed data on the reported effects observed on ship’s radar displays close to offshore wind farm structures. This document and attached Annexes contain information relevant to the work programme carried out.
Information and data collection included:-
• Collecting sets of radar recordings taken from a wide range of vessels with various type approved and non-approved radar types, including representative fishing and recreational vessels;
• Recording information gained by discussion with the Pilots, Masters, Pilot Exemption Certificate holders (PEC) Holders and Navigating Officers onboard the ships;
• Using the MARICO Marine survey vessel “MORVEN” in conjunction with some of the observed voyages to provide a controlled small target around and within the wind farm.
• Collecting data from the Port of London Authority (PLA) vessel traffic services (VTS);
• Personal comments from mariners and observers
The Search and Rescue (SAR) exercises being organised by the Maritime and Coastguard Agency (MCA) were not able to be carried out in coordination with this work as had been originally expected.
2.1 Recording Period
Recording of radar data commenced on the 30th of April 2006 and was completed on the 27th June 2006.
2.2 Location
The location for the study was in the area of the Kentish Flats wind farm to the south of the Princes Channel in the Thames Estuary.
© 2007 BWEA Page 3
2.3 Observers
Observers used in this project consisted of experienced Master Mariners or Vessel Traffic Service (VTS) qualified officers who boarded vessels at berth, or at the Pilot Station with the Pilot, to photographically record by video and still photography the vessel’s radar display(s) in use. Other relevant data and observations were also recorded.
Information and related experiences of the effects on radar from conversations and interviews have been recorded by MARICO staff throughout the period of this study.
2.4 Terminology
Terminology used in the report derives extensively from that used by mariners, but is translated where necessary to language more universally used. The term “Turbine” used throughout includes the tower, nacelle and blades.
The term “Mariners” has been used in this report to encompass Masters, Pilots, Skippers, Pilot Exemption Certificate (PEC) holders, VTS staff, Harbour Masters and other experienced senior marine personnel.
2.5 Assessment by NOREL Peer Group
The report and information recorded from the vessels boarded formed the basis for assessment by an independent Peer Group. The following companies/bodies (most of whom are members of NOREL) were passed the initial report (Issue 1) for review and comment on 22nd November 2006.
Department for Environment, Food & Rural Affairs
Royal Yachting Association
Department for Transport Shell Wind
DONG Energy Ltd Stena Line
DTI – UK Department of Trade & Industry Terma Radar Systems
Maritime and Coastguard Agency The British Chamber of Shipping
Npower Renewables The Scottish Executive
National Federation of Fishermen’s Organisations
The Crown Estates
Nautilus UK (NUMAST) Trinity House Lighthouse Authority
Port of London Authority UK Major Ports Group
Quarry Products Association UK Offshore Operators Association
Renewable Energy Systems Ltd Westminster Dredging Company
RNLI - Royal National Lifeboat Institution
© 2007 BWEA Page 4

The replies received were assessed by the sub-committee and the initial report modified to develop the current report (Issue 2) taking in to account the comments received.
2.6 Acknowledgements
The trials conducted by MARICO Marine could not have been achieved without the active and willing participation of the following:
The UK Department of Trade and Industry and Captain Colin Brown;
The UK Maritime and Coastguard Agency and Captain Paul Townsend;
Port of London Authority, Captain Roy Stanbrook, the PLA Pilots and staff at all levels;
Medway Port Authority and their Pilots and staff at all levels;
Estuary Services Limited for coordination and transportation;
Ramsgate Harbour for hospitality;
Vestas Wind Farm Maintenance Services for transportation;
A special thank you must be extended to all Masters, Crews and Managers of the vessels who provided the platforms for this research project;
The Captain and crew of “NOREN” and Barber Ship Management who assisted in proving the recording methodology during the development stage;
Crescent Marine Services and the Master of the “CRESCENT CAMILLA”;
Coblefret Ferries and the Master of the “CELANDINE”;
The owners and skippers of the fishing vessels; “CHRISTABEL”, “COLUMBINE” and “DEFIANT”;
Vessel Masters, Skippers and Owners of small craft who allowed MARICO staff to board their vessels, set up their equipment and conduct interviews;
The owners of the leisure craft, “INTREPID”, “HOLA GUAPA” and “JANUS”;
Transas Marine UK for technical support in installation of direct radar recording equipment and for allowing reproduction of screen chart displays for this report; and
Our thanks are especially due to the BWEA and all Round 2 Wind Farm Developers for commissioning this research project and for their support throughout.
© 2007 BWEA Page 5
3 PROJECT SCOPE AND OBJECTIVES
3.1 Study Aims
The study was designed to gather real data on the effects on marine radar close to and within offshore wind farms; allowing the practical consequences of those effects to be further assessed. The project obtained firm data from vessels’ radar installations onboard a large variety of vessel types, including container, RoRo, tankers, gas carriers, lash ships, dry cargo ships, fishing and recreational vessels, operating in the area of an offshore wind farm. Preliminary assessment will be made of the effects seen on the radar display and any degradation in information caused by the presence of the wind farm, including: -
a) The real time radar effects of spurious echoes and masking, as observed on the radar screen, their magnitude, relative angles and ranges at which they occur etc;
b) The practical effect that the phenomena observed on the radar display had on the trial group of mariners and their subsequent handling of vessels; and
c) Whether particular types of vessel, radar or antennae are more prone to these effects the data collected is intended to facilitate future informed assessment of the levels of likely phenomena to assist in the preparation of more knowledgeable Navigational Risk Assessments and to assist in the development of appropriate mitigation measures.
© 2007 BWEA Page 6
4 PROJECT LOCATION
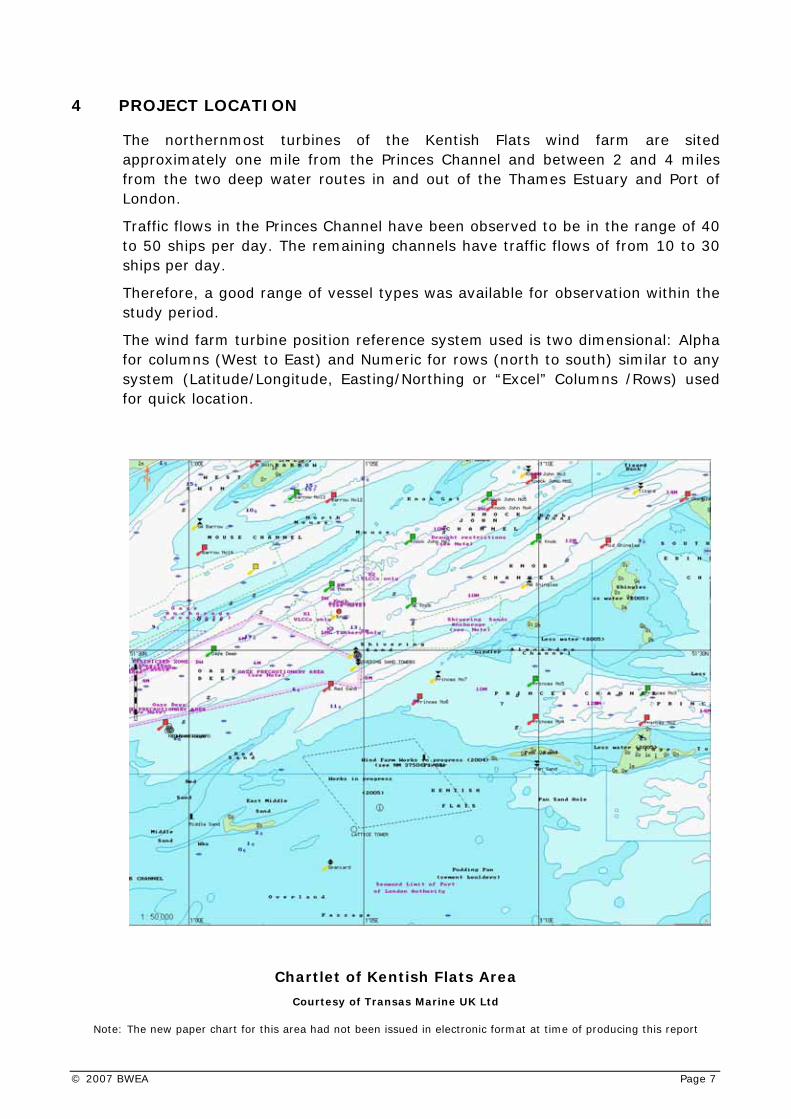
The northernmost turbines of the Kentish Flats wind farm are sited approximately one mile from the Princes Channel and between 2 and 4 miles from the two deep water routes in and out of the Thames Estuary and Port of London.
Traffic flows in the Princes Channel have been observed to be in the range of 40 to 50 ships per day. The remaining channels have traffic flows of from 10 to 30 ships per day.
Therefore, a good range of vessel types was available for observation within the study period.
The wind farm turbine position reference system used is two dimensional: Alpha for columns (West to East) and Numeric for rows (north to south) similar to any system (Latitude/Longitude, Easting/Northing or “Excel” Columns /Rows) used for quick location.
Chartlet of Kentish Flats Area
Courtesy of Transas Marine UK Ltd
Note: The new paper chart for this area had not been issued in electronic format at time of producing this report
© 2007 BWEA Page 7

5 DATA COLLECTION
5.1 Overview
A target of recording data from 50 vessel transits was set at the outset of the project. Each passage was to be counted as a separate vessel since it was noted that most vessels had very different radar response characteristics on opposing sides of the vessel. The data gathering process required cooperation from vessel operators and crews and assistance was sought from Ship Managers, Port Agents, Port of London Authority and others to facilitate the data gathering. A table of the vessel types actually used to record radar data is included in Section 6.
Information and data collected included:-
• Collecting sets of radar recordings taken from a wide range of vessels with various type approved and non-approved radar types, including representative fishing and recreational vessels, using photographic and raw data recording;
• Recording information gained by discussion with the Pilots, Masters, PEC Holders, Navigating Officers and other Mariners onboard the ships;
• Using the MARICO Marine survey vessel “MORVEN” in conjunction with some of the observed voyages to provide a controlled small target around and within the wind farm;
• Data from the Port of London Authority (PLA) vessel traffic services (London VTS); and
• Personal comments by mariners and observers.
Where possible, the information listed below supplemented the gathered data on each vessel from which observations were obtained;
• Time, date, wind and weather, including dew-point and sea temperature;
• Basic vessel and voyage information; and
• Photographic records of the vessel’s radar scanner arrangement and any significant signal obstructions or reflectors (with measurements where possible).
Radar types to be observed included type approved marine radars in the X-Band (3cm wavelength) and the S-Band (10cm wavelength) as well as non-type approved radar types as used onboard typical workboats and leisure craft but also evident on some general cargo vessels of small size or equipped for inland waterways.
The effects on each type of radar by the presence of offshore wind farms were assessed with respect to the effects on detection of a variety of targets. The following were also taken into account:
© 2007 BWEA Page 8
• Side lobe echoes ; • Reflected ( or secondary ) and other spurious echoes; • Detection of small vessels; and • Detection of small targets caused by suppression of Automatic Gain
controls.
As the Observers recorded from the working radars onboard the vessels entering and leaving port, it was necessary to seek approval by the vessel’s Master as to which radar to use. In the conditions in which the observations were made, most Masters had no preference and were satisfied to allow the observer to use whichever radar was best suited. (Poor visibility might have altered this freedom but mostly conditions were good (See Annex E - Weather Data).
Most vessels had both 3cm (X-Band) and 10cm (S-Band) radar and comparisons were constantly made throughout the observation periods. However the video record was, in most cases made on one or the other. In a few exceptional cases it was possible to temporarily move the camera to the other set for comparison but this was not realistic for the longer term.
In addition to direct recording of radar display data, a combination of photographic, video recording and debriefing interviews were used. In this way, each dataset was comparable and could be used for support and validation of the others.
5.2 Photographic Recording
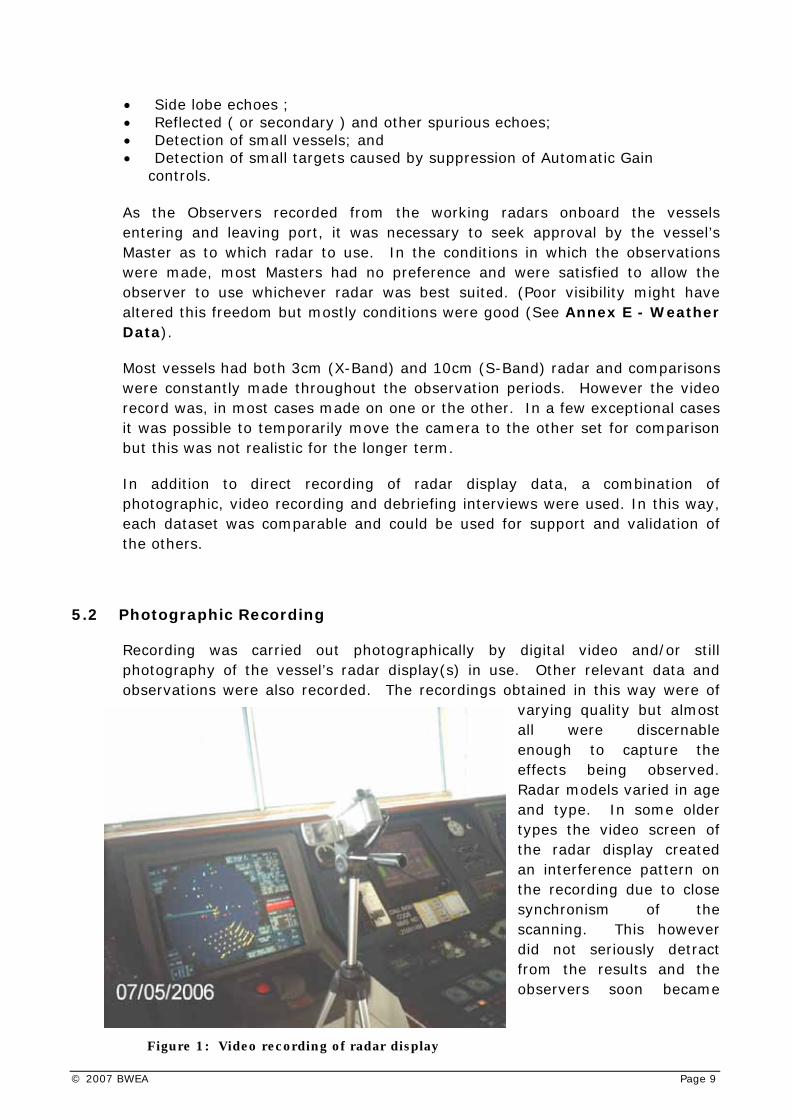
Recording was carried out photographically by digital video and/or still photography of the vessel’s radar display(s) in use. Other relevant data and observations were also recorded. The recordings obtained in this way were of
varying quality but almost all were discernable enough to capture the effects being observed. Radar models varied in age and type. In some older types the video screen of the radar display created an interference pattern on the recording due to close synchronism of the scanning. This however did not seriously detract from the results and the observers soon became
Figure 1: Video recording of radar display
© 2007 BWEA Page 9
accustomed to the scrolling effects.
Pictured above is the rig used to obtain the recordings. It is noted that the radar display of the wind farm contains small sector distortions referred to below.
Onboard one vessel, the radar was of such an age that there was no open screen. The display was of the hooded type and extreme difficulty was experienced obtaining images. All other ships however were of an open VDU type of display, either Cathode Ray Tube or the modern Flat TFT screen.
5.3 Direct Radar Recording
This method of data collection required significant co-operation from vessel owners and Masters as equipment was hard wired to the vessel’s radar and navigational equipment. A MARICO Master Mariner with experience in the use of radar integrator equipment, accompanied by a Transas installation engineer, was able to board two vessels to install equipment. The two vessels were ‘regular runners’ making voyages into and out of the Thames Estuary and in one case a near continental port. In each case recording equipment was connected directly to the vessel’s radar and other navigation equipment to record the raw radar (video, trigger pulse10, bearing and heading pulses). Other information, i.e. heading, speed and position were extracted using the AIS pilot port. The MARICO Master rode with both vessels to assess operator input and reactions. Simultaneous photographic recording of the vessel’s radar display was made during the transits past the wind farm. Further voyages were planned but were not logistically attainable, although the equipment was left on board one vessel and ran unattended for an additional six transits. These transits were assessed and found to be consistently similar to the attended transits that the data from the latter has been used exclusively.
Other relevant data and observations were also recorded, such as a comparison recording on the continental side where wind farms were encountered. Debriefing interviews and observer logs, etc., were completed. These voyages provided six attended transits past wind farms. Another important point is that the voyages were the only ones conducted on vessels where the crew held Pilotage Exemption Certificates (PEC). The vessels - the tanker “CRESCENT CAMILLA” and the RoRo “CELANDINE” - each carried two qualified PEC holders thereby providing an enhanced insight from mariners with local knowledge.
10 The trigger is a pulse generated at a specific frequency by the "synchroniser" module of the radar. The synchroniser
ensures that all circuits connected in the radar system operate in a definite time relationship with each other, and the interval between trigger pulses is of the proper length. The trigger pulse is responsible for starting the transmitter, indicator/display sweep circuitry and ranging circuitry. Alteration of the trigger pulse can be used to make adjustments to the radar, for instance, a trigger delay control can be used to adjust for faulty distance alignment.
© 2007 BWEA Page 10

5.4 Radar Observer Logs
During each trip, each radar observer filled out a Radar Observer Log to record the vessels’ type, size and other details together with weather, tide and other operational information. Information was also obtained on the position and siting of each radar scanner and other structures identified as relevant to the research work. When it was possible to do so, a photographic record of the ships layout was also obtained.
A sample of the Radar Observer Log is provided in Annex A. The data from the completed forms has been abstracted to the spreadsheets contained in Annex B.
5.5 Variables Assessed
The following variables were considered during observation and data collection:
• Effects on different radar types (X-Band, S-Band, non approved, etc); • The effects on display of small targets by varying gain control; • The effects of using swept gain control; • The effects of using other anti-clutter controls; • The effects on the ARPA capability of radars; and • The effects of observed operator actions.
The Spaniard Buoy to the southwest of the wind farm was found to be useful as a reference target for the radar as it remained identifiable throughout the trials. (It was also noted that when on the opposite side of the wind farm array to the observing ship, and some distance from it, the amplitude of the returned echo did not appear to be adversely affected.)
5.6 Small Vessel Trials
The observations were supplemented by a series of trials with smaller craft in and around the immediate vicinity of the wind farm. With the exception of one day spent on board the “CELTIC STORM” – the service vessel for the wind farm maintenance company – the remaining trials involved MARICO Marine’s survey vessel “MORVEN”. A number of runs were made by “MORVEN” through the wind farm on a predetermined set of courses and headings designed to pass close to the turbines and present various aspects and speeds to the passing observing ship. This was intended to test the ability of larger vessels to track smaller vessels within the wind farm, using manual and automatic tracking techniques.
In a later trial the same set of courses were used in a similar exercise using a group of fishing vessels, motor yachts and a sailing yacht (under power) following a pre-determined track in the wind farm. This trial was attended on board “MORVEN” by personnel from the participant organisations of the NOREL
© 2007 BWEA Page 11

group together with the Minister for Transport responsible for shipping, the Rt. Hon. Stephen Ladyman M.P.
The tracking on this occasion was conducted on “MORVEN”, which has been equipped specifically for vessel tracking surveys. Most of the participant vessels were tracked from immediately outside the wind farm but later in the exercise a short exercise was conducted from within the wind farm when MORVEN moved into the area at the specific request of the representative on board from the DTI. This demonstrated the difference in the effects on the observing vessel’s radar when inside, as opposed to outside the wind farm.
5.7 Observation of Airborne Radar
The observation of airborne radar was outside the scope of this project.
Trials had previously been undertaken by an RAF “Valley” SeaKing helicopter in the North Hoyle wind farm11 and it was the intention to cooperate with further proposed MCA helicopter SAR trials. However; these could not be carried out within the timeframe of this data gathering exercise. Similarly, investigation into the effects of wind farm structures on the operation of Search and Rescue Transponders (SARTs) or the operation of Emergency Position Indicating Radio Beacons (EPIRBs) was not carried out.
5.8 Background Data
Due to commercial sensitivity, Supervisory Control and Data Acquisition (SCADA) data from the operators of the Kentish Flats wind farm was not available. Therefore data on wind speed and direction as well as water & air temperatures, humidity and weather generally was collected independently onboard the trial vessels. This information is contained in the Annexes to this report.
11 See Report of helicopter SAR trials undertaken with Royal Air Force Valley ‘C’ Flight 22 Squadron on March 22nd 2005
Maritime and Coastguard Agency Project MSA 10/6/239, May 2005
© 2007 BWEA Page 12
6 LARGE VESSEL DATA ASSESSMENT
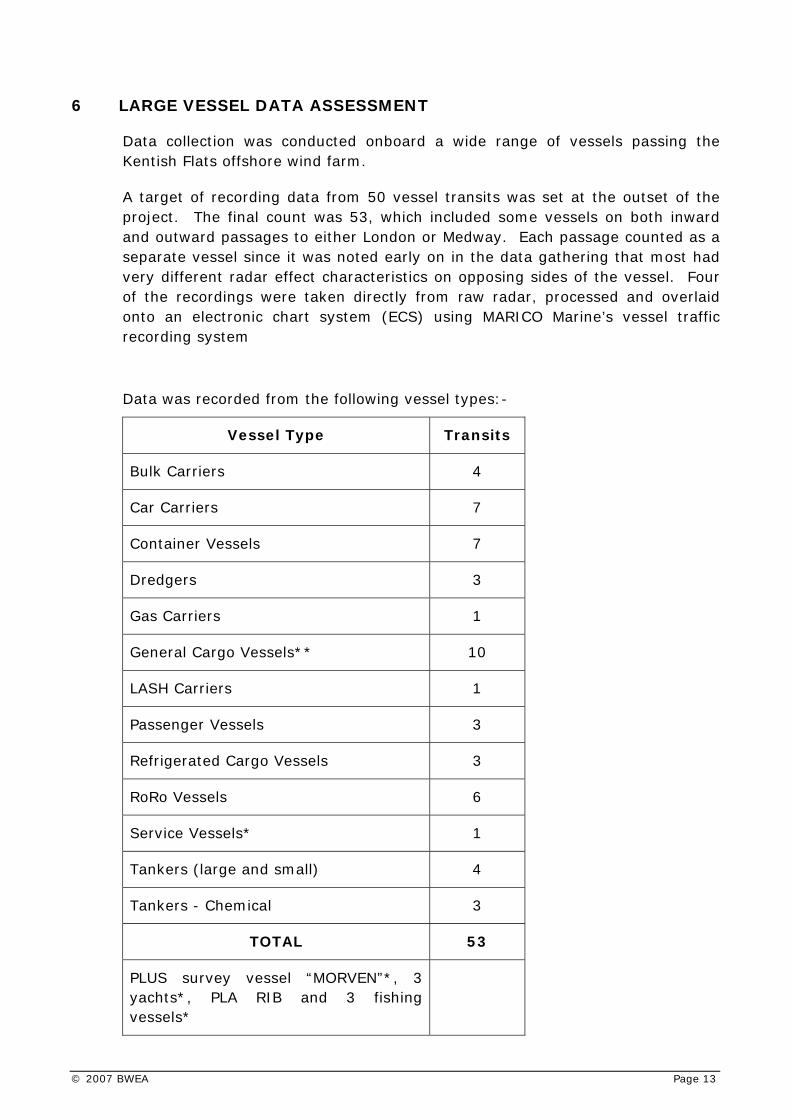
Data collection was conducted onboard a wide range of vessels passing the Kentish Flats offshore wind farm.
A target of recording data from 50 vessel transits was set at the outset of the project. The final count was 53, which included some vessels on both inward and outward passages to either London or Medway. Each passage counted as a separate vessel since it was noted early on in the data gathering that most had very different radar effect characteristics on opposing sides of the vessel. Four of the recordings were taken directly from raw radar, processed and overlaid onto an electronic chart system (ECS) using MARICO Marine’s vessel traffic recording system
Data was recorded from the following vessel types:-
Vessel Type Transits
Bulk Carriers 4
Car Carriers 7
Container Vessels 7
Dredgers 3
Gas Carriers 1
General Cargo Vessels** 10
LASH Carriers 1
Passenger Vessels 3
Refrigerated Cargo Vessels 3
RoRo Vessels 6
Service Vessels* 1
Tankers (large and small) 4
Tankers - Chemical 3
TOTAL 53
PLUS survey vessel “MORVEN”*, 3 yachts*, PLA RIB and 3 fishing vessels*
© 2007 BWEA Page 13
* Vessels marked thus were small craft operating in or close to the wind farm.
** General Cargo Vessels embraced a wide variety of mainly coastal vessels, some were intended for inland waterway use and therefore fitted with very low radar scanners, and others were more conventional.
Almost all ship managers approached expressed a keen interest in the project and provided access to their ships for collection of data.
6.1 Observed Effects - General
Very soon after observations began, it became clear that phenomena induced by large structures were evident on some but not on all vessels’ radar displays. In addition, it became evident that there was more than one effect being observed. It was noted that the pattern of these varied and the Observers endeavoured to investigate their causes as they were noted. The result has been that possible causes for many effects were identified and these have been included in this report.
Evidence of onboard influences for the observed effects on many of the vessels emphasised the fact that the wind farm structures were but one of a number of strong radar targets in the area capable of generating effects on the radar displays. Others included the World War II forts in the Thames estuary and the echoes generated by many large vessels. The wind farm was prominent in its large area geometric regular form but it was mostly possible to separate different sources of observed effects for future detailed analysis.
Therefore it was possible to observe that the effects observed fell into two main categories:-
1. Those with causes within the boundaries of trial vessels; and
2. Those with causes beyond the boundaries of the trial vessel.
Unexpectedly of these two, the first category provided by far the most data and therefore appears to be the most significant on the basis of these observations, particularly for vessels outside the wind farm. The reason for this seems to be that many of the vessels observed were fitted with radar scanners whose position with respect to onboard structures gave rise to reflected (or secondary) echoes from very large targets. The practice of mounting the two radar scanners low and athwartships, although expedient for other radar purposes, appears to have ensured an increase in reflections, shadow sectors and other unwanted effects.
The observers were actually viewing radar phenomena the reasons for which they were familiar, having been taught these during their radar training courses (required, at various levels, for all commercial and naval navigators as part of their professional competence certification). However, the strength of the radar
© 2007 BWEA Page 14
signals returned from the wind farm turbines, the area of the radar display over which the phenomena were observed and the geometrically repetitive effects would not be familiar to radar observers unused to navigating near or between wind farms.
Observations on signal strength returns from wind farms have been the subject of the reports produced by QinetiQ, the Maritime and Coastguard Agency12 and the Port of London Authority13. As in those reports, it was found that there was some scope to improve the visual detection of small targets hidden in spurious echoes on the radar display, where appropriate by manually reducing the gain. The positioning of the Spaniard Buoy; fitted with a radar reflector, adjacent to the wind farm, provided operators with a reference target for performance indication and gain setting. Providing the buoy could still be seen on the radar display, operators felt reassured that other similarly detectable targets should still be displayed.
The next category was similarly familiar to the observers but not in open waters to the extent experienced during the trial. Those effects caused by the wind farm were also accentuated by the very regular interceptions with large “slab sided” vessels such as vehicle carriers and some RoRo vessels at relatively short range. Due to the large numbers of such vessels sailing to both London and the Medway, these effects were noted frequently. Other aspects of the Thames Estuary, e.g. the existence of prominent old defence structures from World War II, have been known for many years as an influence on radar. In open waters mariners would normally pass other vessels and structures at longer ranges than experienced in the Thames Estuary pilotage area. The spurious echo types described below have been identified in the observations.
12 Results of the electromagnetic investigations and assessments of marine radar, communications and positioning
systems undertaken at the North Hoyle wind farm by QinetiQ and the Maritime and Coastguard Agency” MCA MNA 53/10/366 or QINETIQ/03/00297/1.1 November 2004
13 A Report compiled by the Port of London Authority based on experience of the Kentish Flats Wind Farm
Development. 2nd NOREL WP4, Shipping Policy, Department for Transport ,March 2005
© 2007 BWEA Page 15
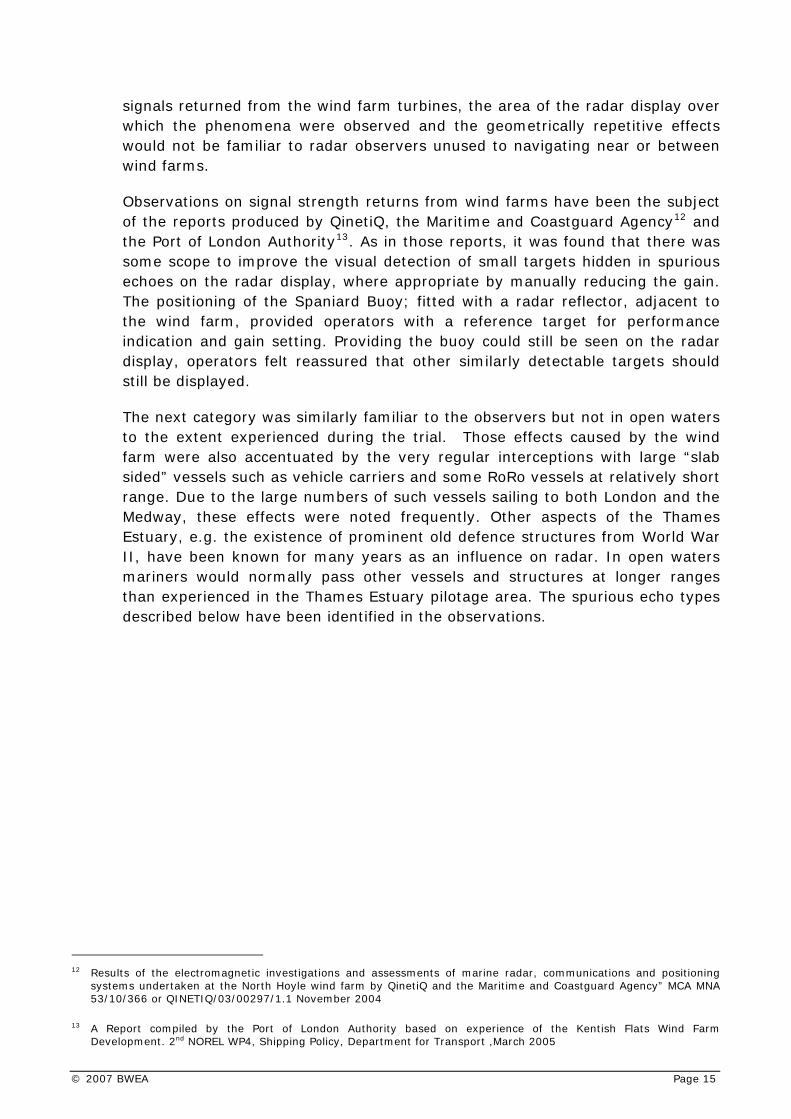
6.2 Linear or Small Sector Multiple Targets
This type of effect (A, B & C pictured below) was the most
commonly observed. On many vessels it occurred in more than one direction. The range at which the anomalous targets occur is
notably coincidental with the range of the wind turbines. The geometric regularity of the targets suggests multiple echoes but closer
analysis of the observations using the range marker showed that each such target was a reflection of a separate real target. Apparent intermediate echoes may be attributed to turbines further back into the wind farm and off-set from the line of the scanner. Their inclusion could be due to indirect reflection off neighbouring turbines. Depending on the efficiency of the radar antenna the number of spurious responses varied, but side lobe effects would also vary. Smaller scanners produced more side lobes and greater distortion when combined with the multiple reflected targets. The pattern would be a narrow sector, sometimes narrowing further to a line, along which the reflected targets would appear. Depending on the antenna efficiency, side lobe echoes could appear outside this narrow sector or line.
In every case the direction of each occurrence of linear targets was investigated on board the vessel when detected. In most cases obstructions onboard were found that aligned with the interference patterns observed. Frequently the obstructions were tubular sections of signal masts, aerial stanchions (often including the opposite side scanner when this was mounted higher than the subject scanner). In some cases exhaust uptakes from off-set funnels appeared to create the effect when they were sufficiently high. Depending on the width of the obstructions and their distance from the scanner, the width of any reflected target images was seen to vary in proportion. It was noted that stanchions as small as 50 mm in diameter were able to produce reflections of the very large radar cross section of the turbine structures.
C A
B
Figure 2: Examples of reflections
© 2007 BWEA Page 16

A similar effect was observed caused by obstructions outside the vessel. An example is shown in Figure 3 below.
Figure 3: Dredger “OSTSEE” using 3cm radar (port scanner). The reflections of the wind farm are caused by the approaching vessel on the port bow. These reflections were noted to be rotating around this vessel.
© 2007 BWEA Page 17

6.3 Sectored Distortions
The effect described here appears to be caused by the same influences as linear reflections, in that the sectors in which spurious echoes are noted correspond to the same directions and appear to be caused by the same obstructions. The effect takes the form of distorted real targets in a sector emanating from the centre of the screen.
Shown in Figure 4, below, the image from “CRESCENT CAMILLA” headed slightly north of west inbound for Coryton with her radar display overlaid on an electronic chart. The 3cm (starboard) scanner ‘D’ is in use. It is assumed that narrow sector distortion ‘A’ is due to signal mast ‘A1’, and ‘B’ is due to forward central stanchion ‘B1’. ‘C’ is a linear reflection from the Shivering Sands Forts, which are close to her starboard side. In the video recording this reflection rotates in alignment with the forts as they are passed. The same target is producing the effects close to the ship in the southern sector
Figure 4: (Above) View of Effect Figure 5: (Right) “CRESCENT CAMILLA”
C
A
B
D
A1 B1
A Distortion A1 Signal Mast B Distortion B1 Stanchion C Reflection
D 3cm Scanner
© 2007 BWEA Page 18
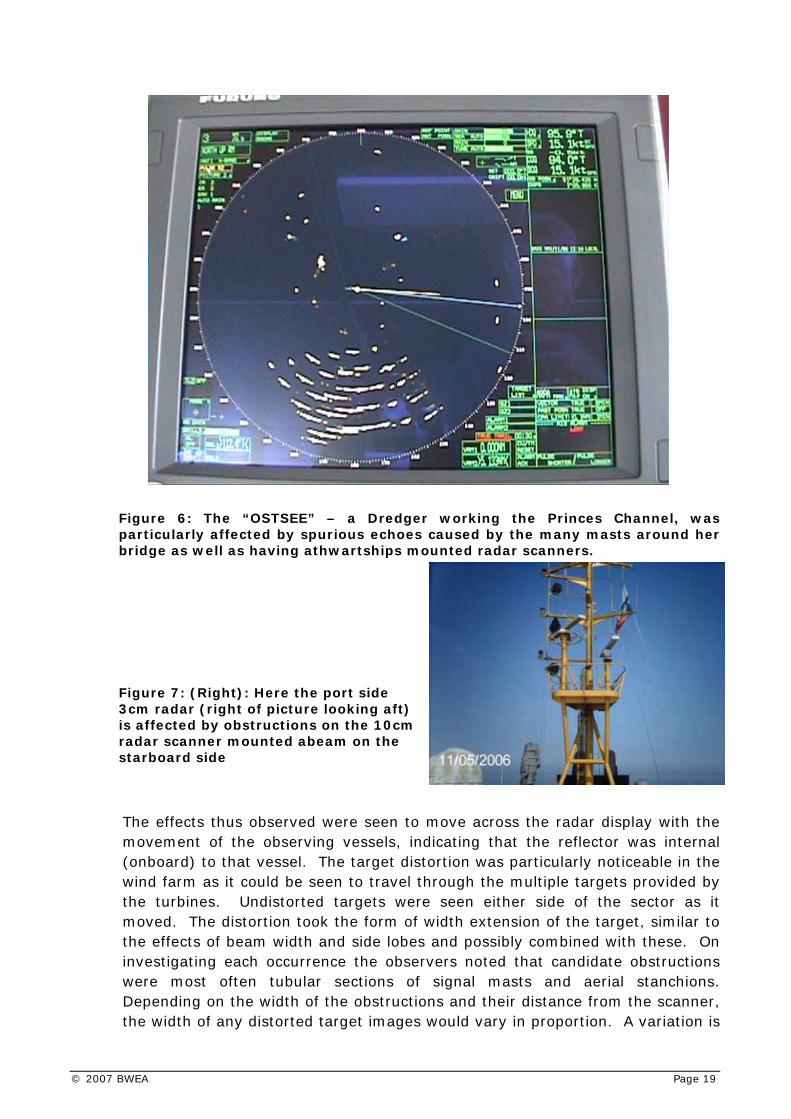
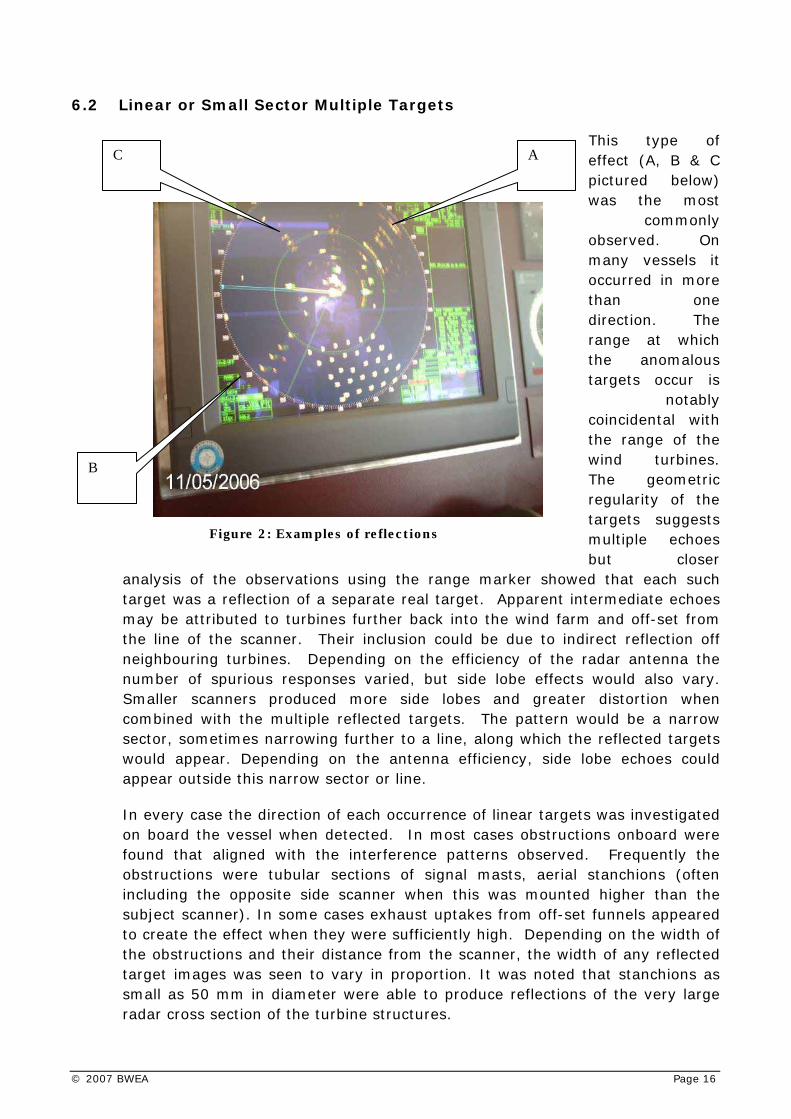
Figure 6: The “OSTSEE” – a Dredger working the Princes Channel, was particularly affected by spurious echoes caused by the many masts around her bridge as well as having athwartships mounted radar scanners. Figure 7: (Right): Here the port side 3cm radar (right of picture looking aft) is affected by obstructions on the 10cm radar scanner mounted abeam on the starboard side The effects thus observed were seen to move across the radar display with the movement of the observing vessels, indicating that the reflector was internal (onboard) to that vessel. The target distortion was particularly noticeable in the wind farm as it could be seen to travel through the multiple targets provided by the turbines. Undistorted targets were seen either side of the sector as it moved. The distortion took the form of width extension of the target, similar to the effects of beam width and side lobes and possibly combined with these. On investigating each occurrence the observers noted that candidate obstructions were most often tubular sections of signal masts and aerial stanchions. Depending on the width of the obstructions and their distance from the scanner, the width of any distorted target images would vary in proportion. A variation is
© 2007 BWEA Page 19
seen above in the images from “CRESCENT CAMILLA” in which the effects of close forts appears similar in the static display to the linear reflections (which it is) but in the video the effect is seen to be rapidly moving in relation to the forts and not moving with the vessel. The external obstruction has the same reflective effect as the internal one, albeit fairly transient depending on the speed of the subject vessel.
6.4 “Mirror” Images
The most dramatic examples of spurious echoes were seen when a complete or nearly complete mirror image of the wind farm would appear in a sector of the display away from the direction of the wind farm. During the trial period a number of examples were witnessed and prior to the trial the team had also been shown photographs taken by pilots that depicted this phenomenon.
The effect is generated if a surface (on or off a vessel); large enough to create a “mirror” image, is positioned within the radar beam. Depending on its size and/or distance from the scanner, the image thus created could be a full or partial mirror image, i.e. it might be cut off within the extremes of the “target”.
Some examples were seen of the effect elsewhere in the estuary when illuminated targets were of sufficiently large radar cross section, and close to the observing vessel, (the south Essex shoreline in the region of Southend Pier can produce a recognisable mirror image). These events were not recorded as the emphasis of this research was on the wind farm.
6.4.1 External (Plane) Reflectors
Transient complete or nearly complete mirror images of the wind farm were sometimes observed on the display. These were mostly assumed to be due either to interceptions with “slab” sided vessels passing in the close proximity to the observing vessel or to interceptions with plane surfaces in the radar beam.
Vessel overtaking situations were the most prominent vessel interceptions and would only occur if the plane surface passed a position and a suitable attitude to present a clear reflector. In other words, if the vessel (it was usually a high sided vessel such as a vehicle carrier) passed between the observing vessel and the wind farm the latter would not appear. However, if the overtaking of the “reflector” vessel occurred on the opposite side, the reflection would normally appear in the direction of the vessel overtaking as she passed. Fast video replay techniques are best at illustrating the effect and leaving little doubt as to the source of the effect. The reflection can be seen to move with the other vessel as it passes. It also alters in azimuth as the other vessel changes heading although this is usually less obvious because of the need to remain in navigation channels ensuring headings alter very little in the area under investigation.
© 2007 BWEA Page 20
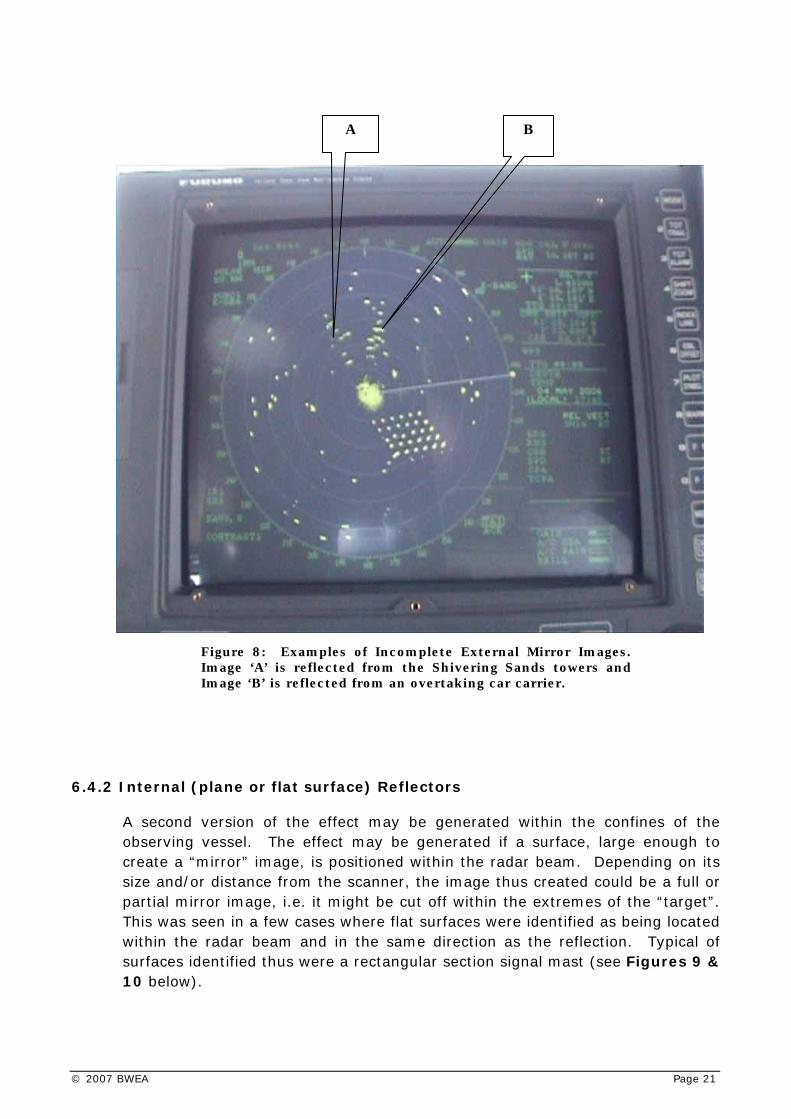
A B
Figure 8: Examples of Incomplete External Mirror Images. Image ‘A’ is reflected from the Shivering Sands towers and Image ‘B’ is reflected from an overtaking car carrier.
6.4.2 Internal (plane or flat surface) Reflectors
A second version of the effect may be generated within the confines of the observing vessel. The effect may be generated if a surface, large enough to create a “mirror” image, is positioned within the radar beam. Depending on its size and/or distance from the scanner, the image thus created could be a full or partial mirror image, i.e. it might be cut off within the extremes of the “target”. This was seen in a few cases where flat surfaces were identified as being located within the radar beam and in the same direction as the reflection. Typical of surfaces identified thus were a rectangular section signal mast (see Figures 9 & 10 below).
© 2007 BWEA Page 21
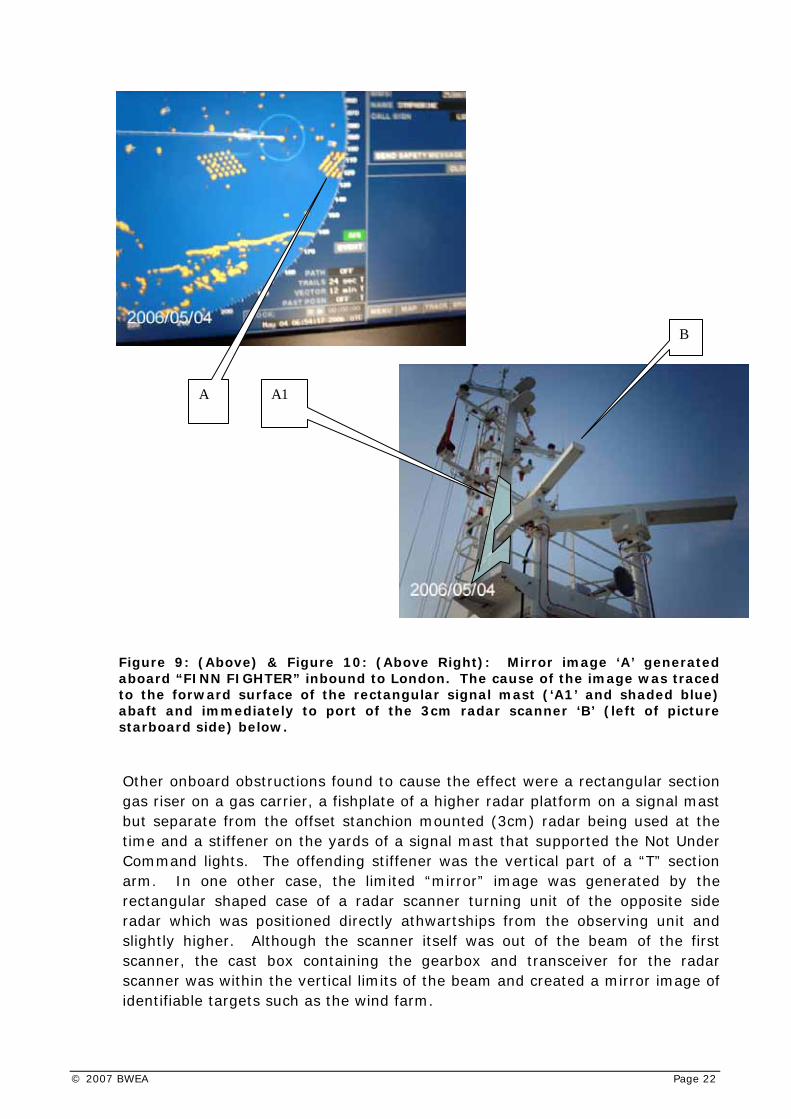
Figure 9: (Above) & Figure 10: (Above Right): Mirror image ‘A’ generated aboard “FINN FIGHTER” inbound to London. The cause of the image was traced to the forward surface of the rectangular signal mast (‘A1’ and shaded blue) abaft and immediately to port of the 3cm radar scanner ‘B’ (left of picture starboard side) below.
Other onboard obstructions found to cause the effect were a rectangular section gas riser on a gas carrier, a fishplate of a higher radar platform on a signal mast but separate from the offset stanchion mounted (3cm) radar being used at the time and a stiffener on the yards of a signal mast that supported the Not Under Command lights. The offending stiffener was the vertical part of a “T” section arm. In one other case, the limited “mirror” image was generated by the rectangular shaped case of a radar scanner turning unit of the opposite side radar which was positioned directly athwartships from the observing unit and slightly higher. Although the scanner itself was out of the beam of the first scanner, the cast box containing the gearbox and transceiver for the radar scanner was within the vertical limits of the beam and created a mirror image of identifiable targets such as the wind farm.
A A1
B
© 2007 BWEA Page 22
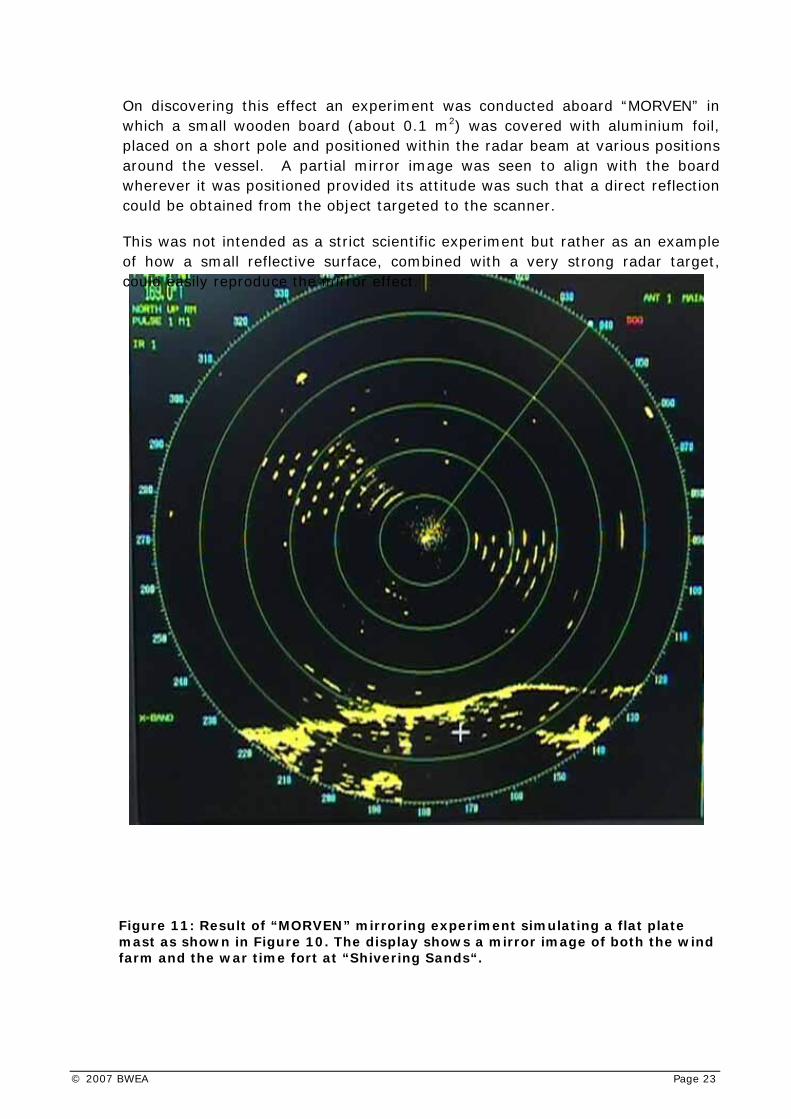
On discovering this effect an experiment was conducted aboard “MORVEN” in which a small wooden board (about 0.1 m2) was covered with aluminium foil, placed on a short pole and positioned within the radar beam at various positions around the vessel. A partial mirror image was seen to align with the board wherever it was positioned provided its attitude was such that a direct reflection could be obtained from the object targeted to the scanner.
This was not intended as a strict scientific experiment but rather as an example of how a small reflective surface, combined with a very strong radar target, could easily reproduce the mirror effect.
Figure 11: Result of “MORVEN” mirroring experiment simulating a flat plate mast as shown in Figure 10. The display shows a mirror image of both the wind farm and the war time fort at “Shivering Sands“.
© 2007 BWEA Page 23
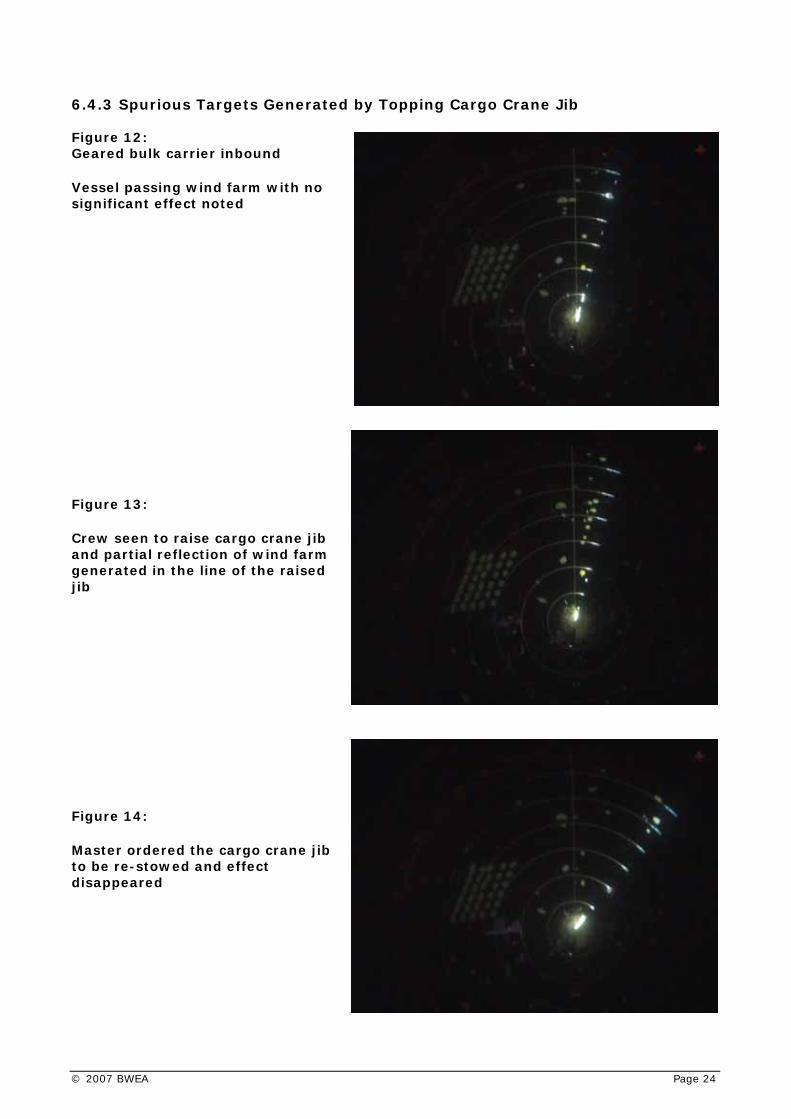
6.4.3 Spurious Targets Generated by Topping Cargo Crane Jib
Figure 12: Geared bulk carrier inbound Vessel passing wind farm with no significant effect noted
Figure 13: Crew seen to raise cargo crane jib and partial reflection of wind farm generated in the line of the raised jib Figure 14: Master ordered the cargo crane jib to be re-stowed and effect disappeared
© 2007 BWEA Page 24
© 2007 BWEA Page 25
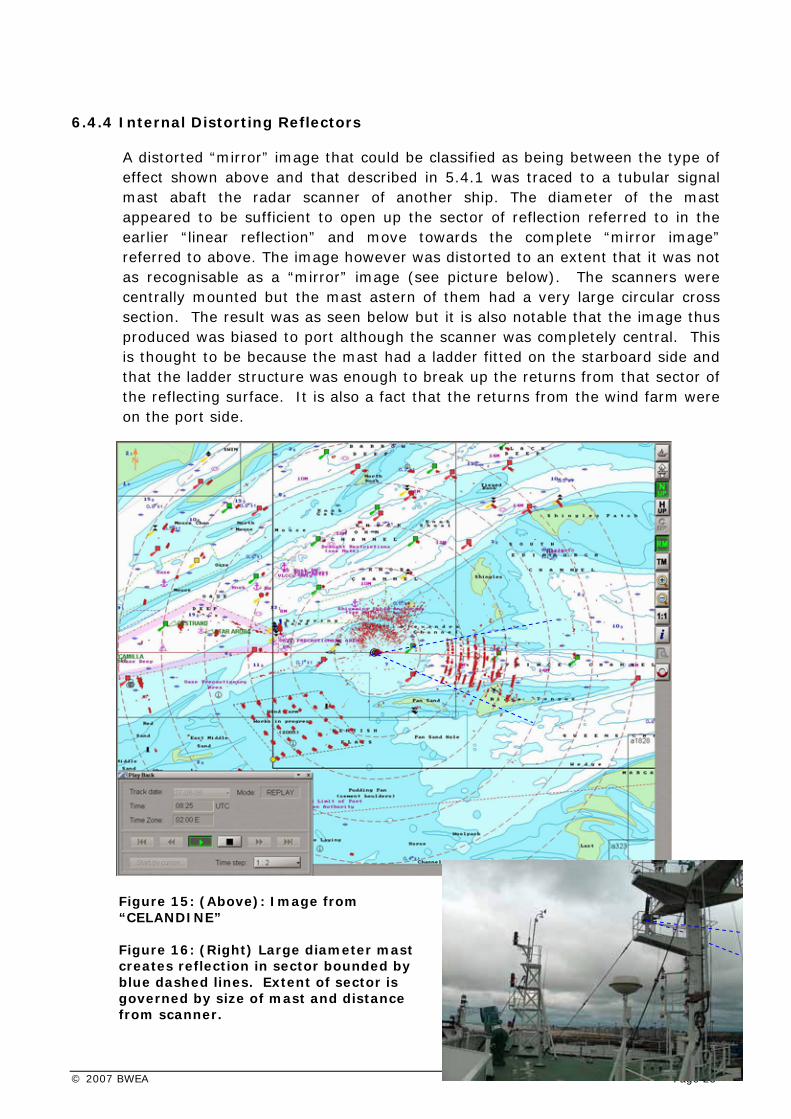
6.4.4 Internal Distorting Reflectors
A distorted “mirror” image that could be classified as being between the type of effect shown above and that described in 5.4.1 was traced to a tubular signal mast abaft the radar scanner of another ship. The diameter of the mast appeared to be sufficient to open up the sector of reflection referred to in the earlier “linear reflection” and move towards the complete “mirror image” referred to above. The image however was distorted to an extent that it was not as recognisable as a “mirror” image (see picture below). The scanners were centrally mounted but the mast astern of them had a very large circular cross section. The result was as seen below but it is also notable that the image thus produced was biased to port although the scanner was completely central. This is thought to be because the mast had a ladder fitted on the starboard side and that the ladder structure was enough to break up the returns from that sector of the reflecting surface. It is also a fact that the returns from the wind farm were on the port side.
Figure 15: (Above): Image from “CELANDINE” Figure 16: (Right) Large diameter mast creates reflection in sector bounded by blue dashed lines. Extent of sector is governed by size of mast and distance from scanner.

The spurious echoes are in the sector astern – that which represents the least threat to the vessel, unless being overtaken. It was established by observation that mirror images were not uncommon on this vessel. They were noted as the vessel passed a number of suitable targets. The reflections thus caused would, depending on the speed of the vessel, be transient and of short duration as the angles of reflection altered. Most targets would not be as clearly identifiable as the wind farm matrix and therefore the effect had not been commonly recognised by the crew. Fast play-back of the video footage contained on the attached DVDs is the best way to view the effect.
The technique also allows distinctions to be clearly made between those effects caused by:
•
•
external reflectors which change rapidly in position relative to the observing vessel; and
those that are created internally, which stay a constant azimuth angle in the direction of the reflecting obstruction, the image movement being synchronised directly with the observing vessel.
Similar to many other vessels boarded, the primary radar was operated in this particular scenario with the own ship centre offset on the radar display to gain maximum look ahead forward of the ship with the optimum resolution. Therefore the ship’s staff was not aware of the level of reflections on the display generated astern where the distance displayed was small, especially on the 10cm system.
6.5 Distortions within the Wind Farm Image
The multiple and geometrically orderly targets presented by the wind farm were seen to produce effects within the total image that were not obviously caused by any of the above. Of these we would list the following:
• Appearance of additional intermediate targets between turbines;
• Radial distortions of turbine targets; and
• Shadowing of targets behind foreground turbines.
© 2007 BWEA Page 26

6.5.1 Intermediate Targets
On a few occasions the observers detected echoes between the turbines. Often these were associated with other effects, which is why they are included in this section. Precise causes for the “additional” echoes were not immediately apparent and it is possible they may be caused by influences other than those so far considered, such as scanner side lobes, beam width extensions, reflections between turbines, etc. These effects are discussed the North Hoyle report referenced in Section 1.
On the small craft trials the effect was enhanced and more influential due to the limitations of small craft radar systems. This is addressed in Section 6 below.
Figure 17: Image from “CRESCENT CAMILLA” (Radar overlaid on electronic chart). Small echoes can be seen between the turbines in Rows 3 and 4 between Columns C to E. Wind Farm position reference system is two dimensional: Alpha for columns (west to east) and Numeric for rows (north to south) similar to any system (Latitude/Longitude, Easting/Northing or “Excel” Columns/Rows) used for quick reference to location.
© 2007 BWEA Page 27
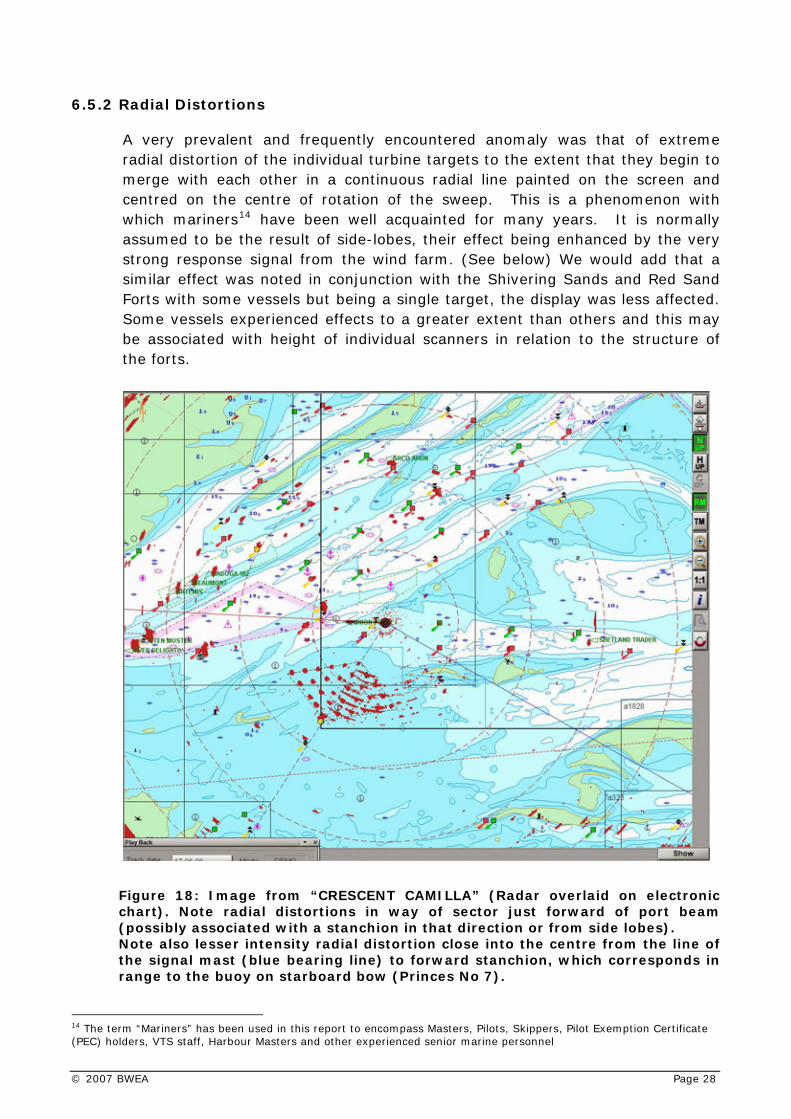
6.5.2 Radial Distortions
A very prevalent and frequently encountered anomaly was that of extreme radial distortion of the individual turbine targets to the extent that they begin to merge with each other in a continuous radial line painted on the screen and centred on the centre of rotation of the sweep. This is a phenomenon with which mariners14 have been well acquainted for many years. It is normally assumed to be the result of side-lobes, their effect being enhanced by the very strong response signal from the wind farm. (See below) We would add that a similar effect was noted in conjunction with the Shivering Sands and Red Sand Forts with some vessels but being a single target, the display was less affected. Some vessels experienced effects to a greater extent than others and this may be associated with height of individual scanners in relation to the structure of the forts.
Figure 18: Image from “CRESCENT CAMILLA” (Radar overlaid on electronic chart). Note radial distortions in way of sector just forward of port beam (possibly associated with a stanchion in that direction or from side lobes). Note also lesser intensity radial distortion close into the centre from the line of the signal mast (blue bearing line) to forward stanchion, which corresponds in range to the buoy on starboard bow (Princes No 7).
14 The term “Mariners” has been used in this report to encompass Masters, Pilots, Skippers, Pilot Exemption Certificate (PEC) holders, VTS staff, Harbour Masters and other experienced senior marine personnel
© 2007 BWEA Page 28

6.5.3 Shadowing
Some shadowing was observed in the wind farm images but not frequently. The effect when observed was transient when the observing vessel was moving and appeared to affect only a single turbine target. The strong target returns from rows further back is assumed to be due to the narrow shadow sector and the diffraction of the beam around the shadowing turbine. It is important to note that turbine targets rarely disappeared through this effect and if they did the event was fleeting, depending on the speed of the observing vessel. Smaller targets, such as small craft, were more likely to disappear but again the effect was transient provided that they were a sufficient distance from the shadowing turbine. In the latter case the greater likelihood was of a smaller target merging with the larger turbine target when they came close. (See also Small Craft Section 6 below)
Figure 19: Image from “CELANDINE” display (electronic chart overlaid with radar). Turbine D3 has almost disappeared (at the speed of the “Celandine” this occurred only for a few seconds). Note alignment of turbines with scanner (blue dashed line). Shadowing?
© 2007 BWEA Page 29
6.6 Radar Operation
The observed effects could be caused by one or more of the following:
• Side lobe effects ( azimuth effects) • Beam width extension • Reflected echoes from parts of ships’ structures or fittings • Pulse envelope extension effects (down range effects); • Reflected signals from ship’s structures returned from turbines
(secondary’s); • Signals returned after reflection turbine to turbine (secondary’s); • Multiple echoes after resonation between ship’s hull and turbines; and • Shadowing behind turbines.
No significant differences were noticed between 3cm or 10cm radars other than the established differences in appearance known to all experienced radar operators.
During the trials, observers did make adjustments to the radar controls. It was noted that, each individual using the radar tended to have their own preferred settings; this included the pilots. While some individuals clearly preferred radar displays that were set with very high gain, others concentrated more on the automated controls where provided. The overall impression gained was that the end result in terms of the Masters’ and Officers’ interpretation of the information was very consistent even if the appearance of the screens varied. None of the professionals met during this project, undertaken in pilotage waters, complained that the circumstances in the vicinity of the wind farm made their job more difficult. On the contrary, a number were actually enthused at the presence of such a distinctive feature as it provided a very visible and identifiable reference point for their spatial awareness whilst in close waters. However, deeper discussion on proliferation of wind farms left more uncertainties but no immediate concerns.
In addition to the adjustment of individual radar displays the observers watched carefully for small targets in and around the wind farm. As noted above, the positioning of the Spaniard Buoy adjacent to the wind farm, provided operators with a valuable reference target for performance indication and gain setting. Providing the buoy could still be seen on the radar display, operators were reassured that other small targets with similar cross sections, should still be displayed.
The exceptions observed relate to automatic tracking using ARPA. Acquired targets were routinely “captured” by the larger turbines as they passed close by the latter. It was noted that the capture normally took place as the two target images closed. The displayed target size is greater in azimuth than its actual size, due to the effective transmitted beam width. Closing of the two images does not necessarily imply collision or allision.
© 2007 BWEA Page 30
6.7 Debriefing of Navigators & Pilots
We found that there was a high level of interest in the research that we were carrying out and navigators and pilots were very helpful in sharing their experiences with our observers. Informal discussions were held throughout the observers’ time onboard and while a detailed questionnaire was not used, the topics discussed included:
• • • • • •
radar shadow areas; description of effects; ranges and relative angles; consequences; mitigation measures taken; and other phenomena observed elsewhere by masters/pilots/watch officers.
The comment most frequently recorded by observers concerning the reactions of regular run masters and pilots in these pilotage waters in relation to the effects caused by the Kentish Flats wind farm specifically was that they were “unconcerned”. This comment, we believe does not reflect a disinterested operator which might be misunderstood as unprofessional. However, these statements were made in the circumstances of this specific trial; i.e. collision avoidance in pilotage waters from about 1 nm outside a single small wind farm, not to general navigation close to or within other anticipated wind farm developments.
The Kentish Flats wind farm is located to one side (south) of the Princes Channel. Most of the effects observed were either in a similar direction relative to the intended course of the vessel or they were very obviously spurious reflections in other directions; e.g. the mirror image and narrow sector reflections of the wind farm matrix in way of identified obstructions. To these mariners experienced in the Kentish Flats phenomena, during these specific trials they did not represent a primary threat and were not construed as such, either mentally or automatically by acquiring the targets on the ARPA.
Some pilots, in discussion, expressed concern at escalation of wind farm development across the estuary, postulating that in some areas where right angled turns were necessary, or where vessels were running between adjacent wind farms, spurious echoes might “crowd out” real targets and cause identification of the latter to be more difficult. Although it is appreciated that these trials apply only to the Kentish Flats wind farm, this statement reflects the concerns expressed for the real situation when the Round 2 wind farm developments are completed.
On three passages pilots mentioned effects that would otherwise have been relatively unnoticed when visually verifiable. Because of restricted visibility however, spurious echoes could cause a certain amount of heightened concern. Since only one of the trial passages was partially conducted in fog the effect was not directly experienced by observers.
© 2007 BWEA Page 31
On a large proportion of the vessels visited the radar shadow sector diagrams required by national and international convention were not displayed in the wheelhouse. Although in a small number of cases (with scanners mounted very high and clear of other ship structures) shadow sectors may not have existed, it was logical that this could not be so for lower sited scanners. In most cases 10cm (S-Band) scanners were positioned high and the 3cm (X-Band) scanners tended to be positioned lower. As will become evident elsewhere in the report, the positioning of radar scanners was observed to be a major influence on the observed level of radar effects associated with large radar cross-section targets. Shadows sectors were not so much an issue as those of reflections, side-lobes and other distortions.
The positioning of radar display units in the wheelhouse appeared to have a direct influence on which of the two radars was used for navigation. It was observed that in a number of cases the 10cm radar display, being located closer to the conning position, was being used as the primary source in confined waters when the 3cm radar would have presented a higher resolution picture, other than in precipitation.
Equipment refits also appeared to have an influence on the radar set used; i.e. one vessel had a new 10cm installation with a bright daylight display. This was used exclusively whilst the older but higher resolution 3cm radar remained on standby. These observations may indicate that mariners are not using their radars to their full advantage.
The number of vessels equipped with AIS overlaid on radar or AIS overlaid onto an electronic chart system was very limited. Many masters expressed the desirability and advantages to collision avoidance in information presentation gained by such systems as against the small difficult to read LCD displays on the AIS units themselves. AIS is of course not generally carried by commercial vessels of less than 300 GT, fishing vessels, or recreational craft.
6.8 Further Large Vessel Analysis
The data recorded has been retained to allow for further expert assessment and analysis.
© 2007 BWEA Page 32
7 SMALL CRAFT DATA ASSESSMENT
The investigation of the effects of the wind farm on returned echoes from small craft was investigated in two parts.
7.1 Observations from Passing Vessels
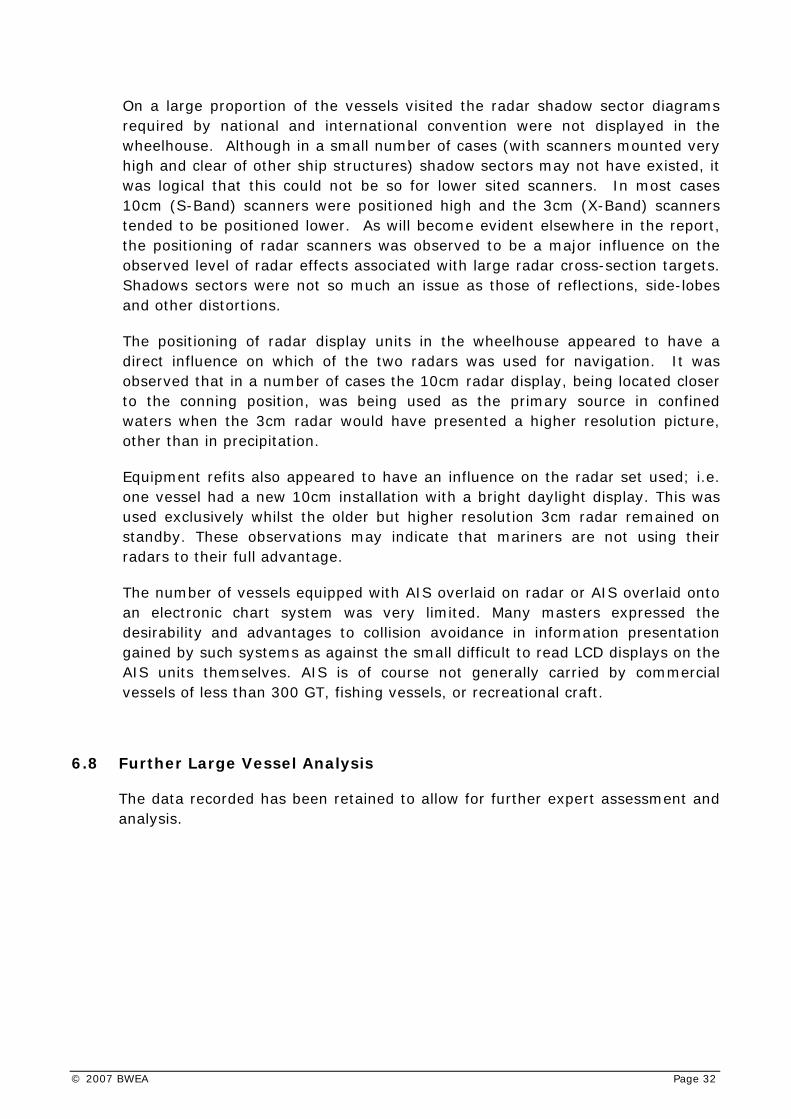
The MARICO Marine survey vessel “MORVEN” (20m long and of GRP construction) navigated through the wind farm at the same time as observers were riding passing vessels. A pre-determined track (See Annex C) was attempted but due to the speed of some passing vessels it was found advantageous to shorten the track in order to cover the different aspects of the trial in the shorter time available (see Annex D for actual tracks taken). Video recordings from the vessels showed that the target (“MORVEN”) remained visible throughout with the exception of those times when it merged with the larger wind turbine targets as it passed or stopped close by a turbine. After a short period, at the speed of the observing and observed vessels, the individual “MORVEN” echo re-appeared. It was also noted that the wind farm service vessel and others in the area were visible in the same way. When the ARPA function was employed to track the target inevitably “target capture” resulted on target vessel passing or stopping by the turbines. A human observer; however, in most circumstances would be able to monitor an acquired craft.
Figure 20: Radar image from “BIRKA CARRIER”, outbound from Tilbury; video recording. Small fishing vessel ‘A’, “MORVEN” ‘B’ and wind farm Service Vessel ‘C’ are all visible despite multiple echoes from Car Carrier ‘E’ between observing vessel and the wind farm. The Spaniard Buoy ‘F’, used as a reference, remained identifiable throughout. It is also notable that the trial vessel being on the
A
B
C
E
F
© 2007 BWEA Page 33

A
opposite side of the wind farm array did not appear to adversely affect its returned echo.
Figure 21: Image from “CELANDINE” while inbound to Purfleet (Electronic chart display overlaid with radar image). The small craft in the wind farm ‘A’ is clearly visible from a distance of about 6.5 miles. Figure 22: Photograph of the wind farm Service Vessel as she operated within the wind farm as seen above in Figure 21 as the inbound ship subsequently passed the wind farm.
© 2007 BWEA Page 34
7.2 Small Craft Observed from “MORVEN”
An exercise was run in which a number of small craft were recruited to participate in conjunction with “MORVEN”. The craft involved included a sailing yacht under power, two powered leisure cruisers, and three fishing craft. A rigid inflatable boat (RIB) was also provided by PLA. The RIB was used to ferry observers between the participant craft. This facilitated an important function of providing a pilot for the small craft so as to maintain the intended course (See Annex C) for the observations that were to be made on “MORVEN”. A number of observations were made, some from outside the wind farm but in the latter stages “MORVEN” moved inside the wind farm for a short period when requested to do so by the DTI representative on board, who was also representing the MCA.
These trials were also witnessed by the UK Shipping Minister; Dr Ladyman from onboard “MORVEN”.
7.2.1 Small Craft Observations
The observer aboard the small craft attempted to obtain video of radar on the small non-approved radar equipment fitted on board those vessels. The results were varied in quality due to the considerable motions, making the use of the camera almost impossible. However the examples shown below were taken from the two motor yachts participating in the trials and illustrate well the characteristics observed on the radar displays that were consistent in all the small craft involved.
All vessels were fitted with small scanners and therefore produced a wide beam width resulting in target images, which combined with beam width extension, were large in azimuth. However, all the vessels had scanners that were well sited above obstructions and therefore effects due to on-board structure were minimal.
Inside the wind farm the clarity of picture was surprising good and it was possible to identify the turbines individually as well as other craft, most notably “MORVEN” within the same area.
All small craft operators found the radar picture beneficial in maintaining their orientation, something which is difficult visually once within the wind farm.
© 2007 BWEA Page 35
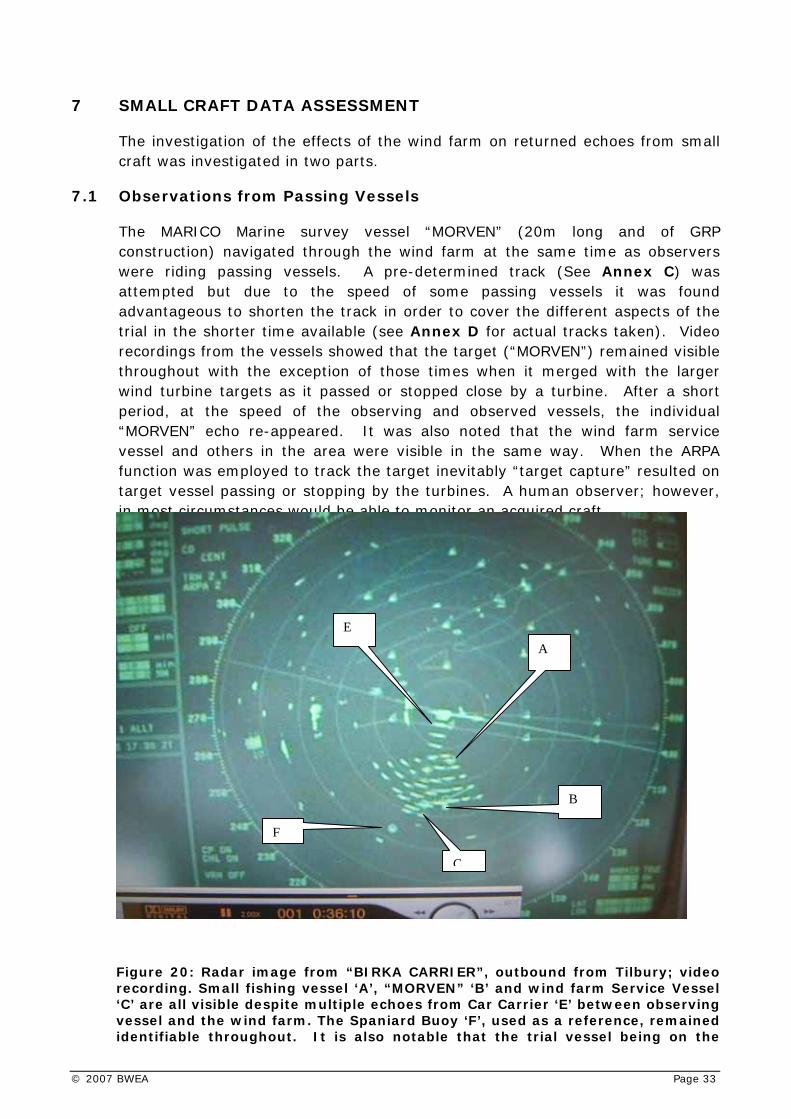
Figure 23: Above: Radar image from motor yacht “HOLA GUAPA” Display is Ship’s head up, heading SW. Turbines A1 and F5 are indicated for reference. Excessive reflected sunlight dazzles the centre of the screen but from a position within the wind farm array (between Turbines C3 and C4) the Met Mast ‘A’ with a Diving Vessel in close vicinity; the wind farm service vessel “CELTIC STORM” ‘C’ and “MORVEN” ‘D’ are clearly visible. The Spaniard Buoy ‘B’ is less obvious in the photograph but was visible on the display. Turbine responses on the display are significantly enlarged in both azimuth and depth.
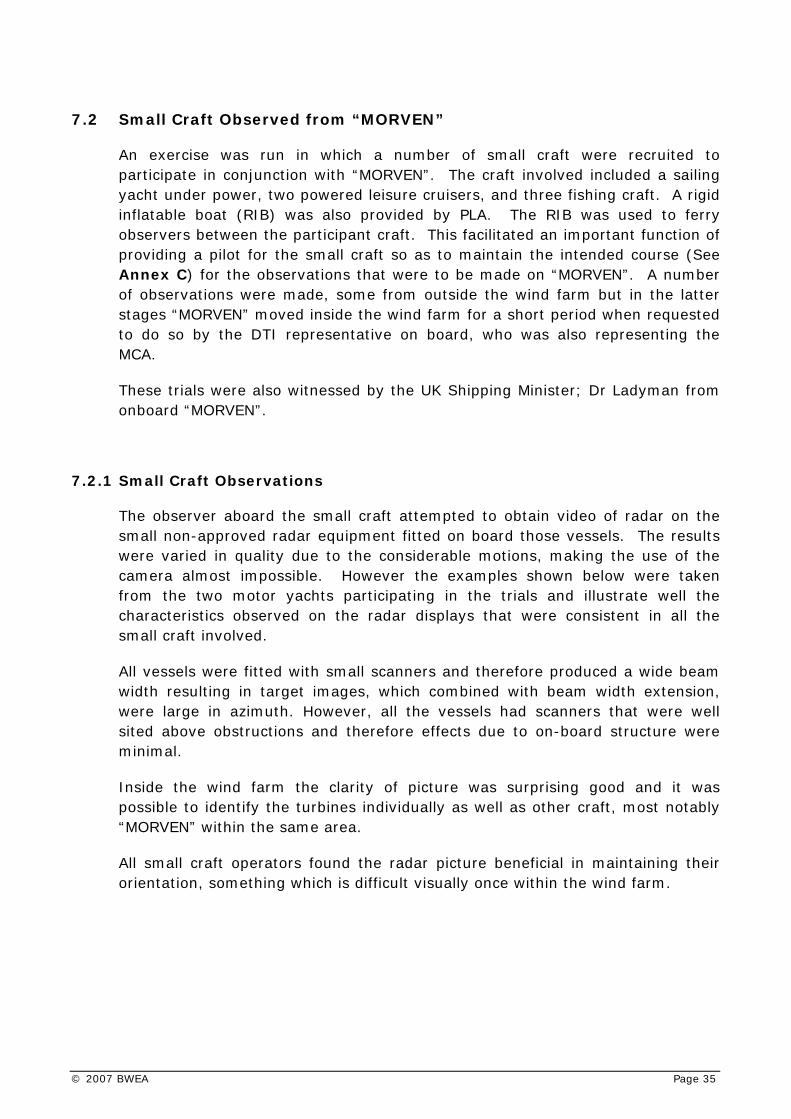
Figure 24: Motor Yacht “JANUS” radar display: Ship’s head up; heading south. “MORVEN” ‘D’ is visible within the wind farm as is “CELTIC STORM” ‘C’ between Turbines C4 and C5. The Met Mast ‘A’ is clearly visible while the Spaniard Buoy ‘B’ is only just visible. Gain adjustment may have improved this presentation. Note; Turbine A3 appears to be in shadow behind Turbine B3. Turbines A1 & F5 are identified for clarity.
A
B
C
D
A 1 F 5
A Met Mast B Spaniard Buoy C Celtic Storm D Morven A1 Turbine A1 F1 Turbine F1
D
C A
B
F 5
A 1
© 2007 BWEA Page 36

7.2.2 “MORVEN” Observations
The observations taken from “MORVEN” used a FURUNO FR 2125 BB (X Band) 25 kW radar transmitting and receiving through an 8 foot (2.4m) scanner. This radar is a type approved model that would more typically be found on a larger trading vessel. In the small craft exercises the difference between this radar and the smaller non-approved sets found on the leisure and fishing craft was significant. The power output – 25 kW - would be significantly more than the non-approved sets –typically between 2 and 4 kW - and it was noted that spurious echoes close to and inside the wind farm array was more extensive on the more powerful set.
An additional small sector interference pattern associated with the turbine towers as they were passed close by (less than 1 mile) was observed. It was recognised as a very similar phenomenon to that caused by the internal obstructions but created from close targets outside the boundaries of the vessel and probably includes scanner side lobe effects.
Figure 25: Sector Interference showing to the north
The radar display in the picture above had been adjusted not only to show the turbines more clearly but also the effects of suppressing the radar transmission to the south in two sectors in order to check if any signals were being received from the back of the scanner rather than the face.
© 2007 BWEA Page 37
7.2.3 Tracking Small Craft within the Array from Outside at Close Range
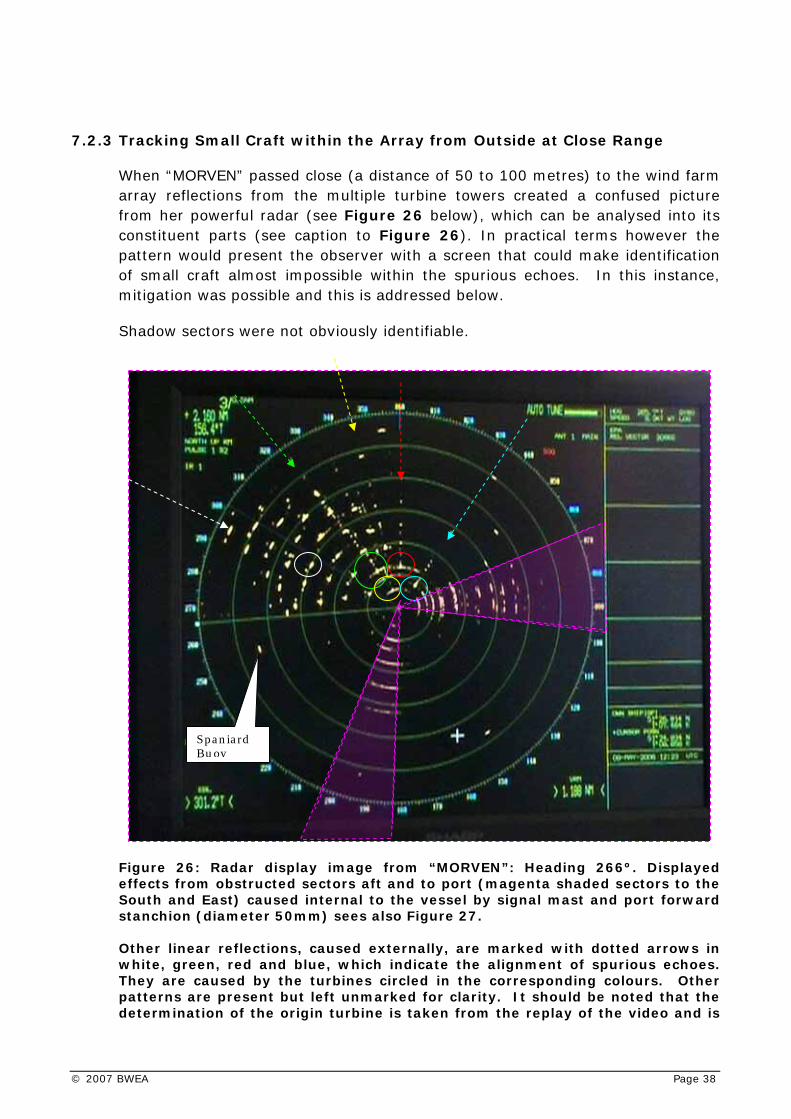
When “MORVEN” passed close (a distance of 50 to 100 metres) to the wind farm array reflections from the multiple turbine towers created a confused picture from her powerful radar (see Figure 26 below), which can be analysed into its constituent parts (see caption to Figure 26). In practical terms however the pattern would present the observer with a screen that could make identification of small craft almost impossible within the spurious echoes. In this instance, mitigation was possible and this is addressed below.
Shadow sectors were not obviously identifiable.
Figure 26: Radar display image from “MORVEN”: Heading 266º. Displayed effects from obstructed sectors aft and to port (magenta shaded sectors to the South and East) caused internal to the vessel by signal mast and port forward stanchion (diameter 50mm) sees also Figure 27. Other linear reflections, caused externally, are marked with dotted arrows in white, green, red and blue, which indicate the alignment of spurious echoes. They are caused by the turbines circled in the corresponding colours. Other patterns are present but left unmarked for clarity. It should be noted that the determination of the origin turbine is taken from the replay of the video and is
Spaniard Buoy
© 2007 BWEA Page 38
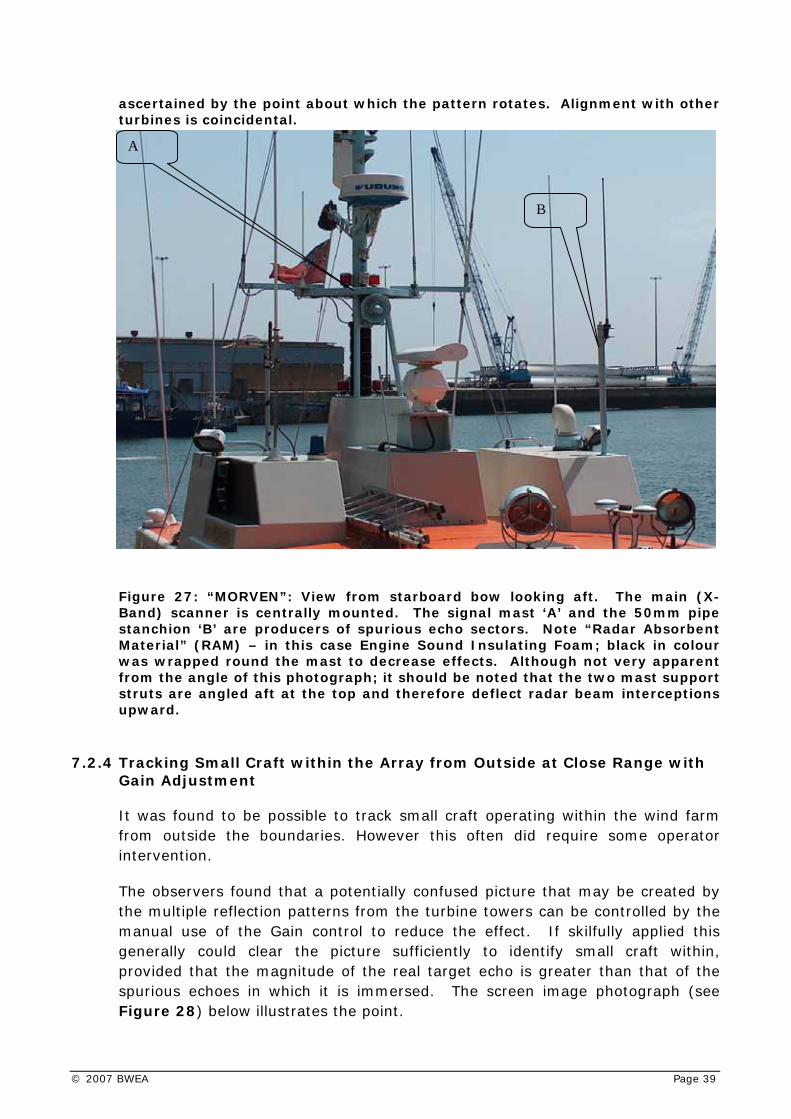
ascertained by the point about which the pattern rotates. Alignment with other turbines is coincidental. Figure 27: “MORVEN”: View from starboard bow looking aft. The main (X-Band) scanner is centrally mounted. The signal mast ‘A’ and the 50mm pipe stanchion ‘B’ are producers of spurious echo sectors. Note “Radar Absorbent Material” (RAM) – in this case Engine Sound Insulating Foam; black in colour was wrapped round the mast to decrease effects. Although not very apparent from the angle of this photograph; it should be noted that the two mast support struts are angled aft at the top and therefore deflect radar beam interceptions upward.
B
A
7.2.4 Tracking Small Craft within the Array from Outside at Close Range with Gain Adjustment
It was found to be possible to track small craft operating within the wind farm from outside the boundaries. However this often did require some operator intervention.
The observers found that a potentially confused picture that may be created by the multiple reflection patterns from the turbine towers can be controlled by the manual use of the Gain control to reduce the effect. If skilfully applied this generally could clear the picture sufficiently to identify small craft within, provided that the magnitude of the real target echo is greater than that of the spurious echoes in which it is immersed. The screen image photograph (see Figure 28) below illustrates the point.
© 2007 BWEA Page 39
The availability of the Spaniard Buoy positioned close to the southwest of the wind farm to use as a reference target proved very useful in this respect. Providing the Spaniard Buoy target could be displayed, the operator had confidence that the Gain had not been reduced to a level where small craft targets of equivalent radar cross section had been lost by over adjustment.
7.2.5 Tracking Small Craft beyond the Array from within or on Opposite Side of the Array
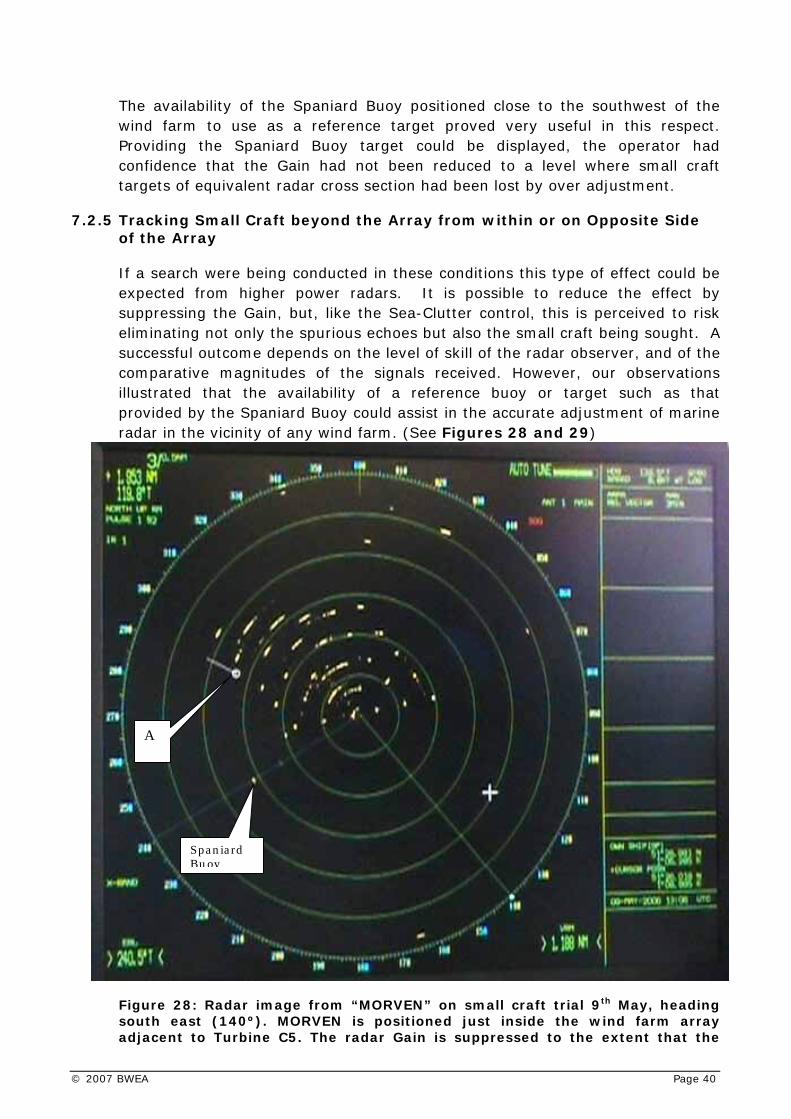
If a search were being conducted in these conditions this type of effect could be expected from higher power radars. It is possible to reduce the effect by suppressing the Gain, but, like the Sea-Clutter control, this is perceived to risk eliminating not only the spurious echoes but also the small craft being sought. A successful outcome depends on the level of skill of the radar observer, and of the comparative magnitudes of the signals received. However, our observations illustrated that the availability of a reference buoy or target such as that provided by the Spaniard Buoy could assist in the accurate adjustment of marine radar in the vicinity of any wind farm. (See Figures 28 and 29)
Figure 28: Radar image from “MORVEN” on small craft trial 9th May, heading south east (140º). MORVEN is positioned just inside the wind farm array adjacent to Turbine C5. The radar Gain is suppressed to the extent that the
A
Spaniard Buoy
© 2007 BWEA Page 40

reflections and side lobe echoes are also suppressed but not completely eliminated. The Spaniard Buoy is still visible to the south west in both circumstances. (See Figures 26 and 28) There is still sectored distortion from the signal mast aft and between Turbines A1 and B2 spurious echoes are displayed. It should also be noted that target ‘A’ to the south of Turbine A2 and outside the array is being automatically tracked by ARPA without difficulty.
© 2007 BWEA Page 41
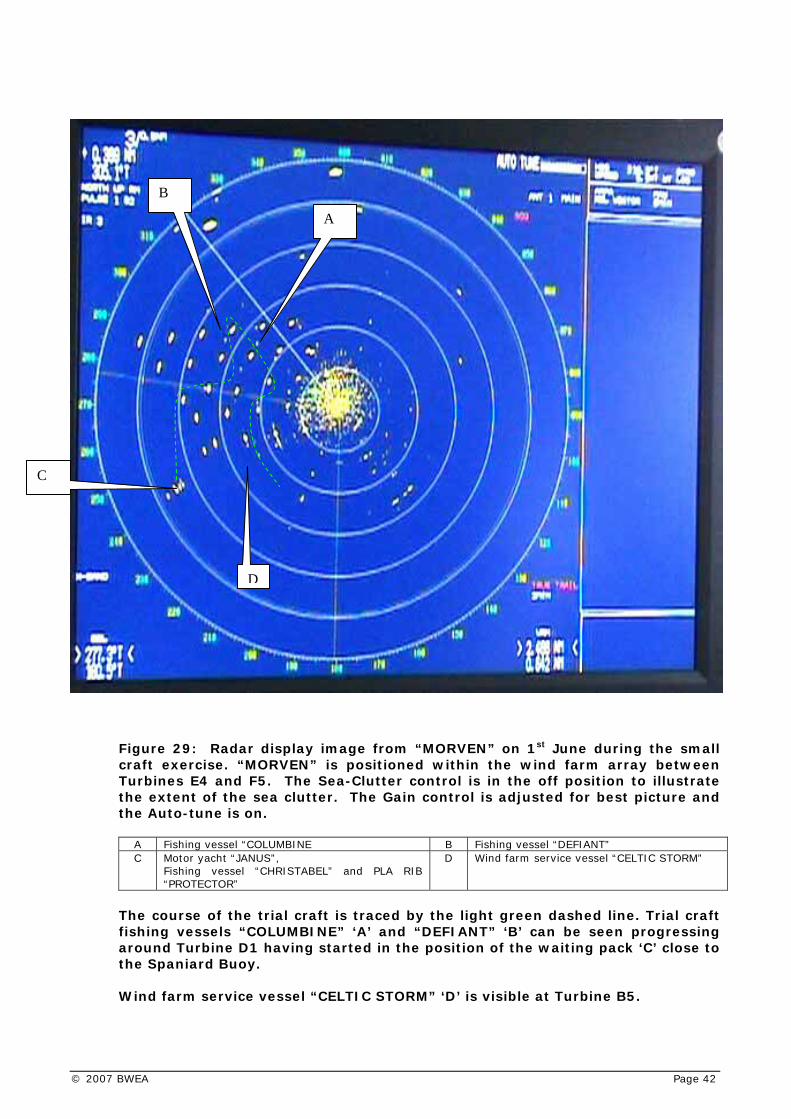
Figure 29: Radar display image from “MORVEN” on 1st June during the small craft exercise. “MORVEN” is positioned within the wind farm array between Turbines E4 and F5. The Sea-Clutter control is in the off position to illustrate the extent of the sea clutter. The Gain control is adjusted for best picture and the Auto-tune is on.
A
B
C
D
A Fishing vessel “COLUMBINE B Fishing vessel “DEFIANT” C Motor yacht “JANUS”,
Fishing vessel “CHRISTABEL” and PLA RIB “PROTECTOR”
D Wind farm service vessel “CELTIC STORM”
The course of the trial craft is traced by the light green dashed line. Trial craft fishing vessels “COLUMBINE” ‘A’ and “DEFIANT” ‘B’ can be seen progressing around Turbine D1 having started in the position of the waiting pack ‘C’ close to the Spaniard Buoy. Wind farm service vessel “CELTIC STORM” ‘D’ is visible at Turbine B5.
© 2007 BWEA Page 42

8 LONDON VTS: RECORDED SPURIOUS ECHOES
This trial includes an assessment of data recorded from the PLA London VTS. The magnification of the returned signal from the wind farm matrix could, because of the enlargement of the images of target turbines, affect identification of small targets in the close vicinity of the wind farm more so than with ship radars that were generally at a closer range and therefore more able to view the spaces between the turbine towers. The one VTS scanner that was closer was actually on the North Eastern (Turbine F1) corner turbine tower and it is sectored so that the wind farm is not in its field of view. However slab sided targets produce multiple echoes similar to those seen at North Hoyle which the VTS radar will acquire causing distraction to the operators.
Small craft trials described in Section 7 were aimed at the same criteria although they were much more limited in obtainable results due to the practical difficulties in recording aboard small craft with extreme motions.
As with the project generally, existing recorded data in the Thames Estuary was limited even if anecdotal evidence was more widespread. This was also true in the London VTS at Gravesend but one recording was obtained dating from 9th November 2005. The recording showed a phenomenon with which MARICO observers were familiar when large reflecting targets are close by. A “snapshot” from that recording is included below (See Figure 30).
The image of the display shows multiple targets generated temporarily as a vehicle carrier (the sides of this type of vessel provide large flat reflective surfaces) passes about a mile north of the north east corner of the wind farm headed for the Princes Channel. The image is produced by the radar scanner situated on the turbine tower at that corner (Turbine F1). The image shows two manifestations of the effect. The most dramatic occurrence is when the vessel passes a position due north of the scanner when five transitory targets appear in an almost straight line beyond the target for a short period. The automatic tracking device then acquires all five targets and attached vectors proportional in length to their speed. They are superimposed on the display creating a distinctive “fan” pattern that emerges from the point of origin – the scanner position. This proportionality of the vectors and the parallel courses, together with the positions of the targets immediately calls their authenticity into question. This was not lost on the London VTS Officers who, we are told, identified the effect as almost certainly spurious at the outset but clearly the automated system is not that intelligent. The transient nature of the targets however soon resolved the automated plot and they were also rejected by the radar tracking system in just over a minute.
As it stands, the effect of the enhanced returns from the wind farm does not appear to present a significant problem to either the operators or the radar software at the Port of London Authority VTS. The situation may not always be the same particularly when a number of wind farms might be within an area.
© 2007 BWEA Page 43

8.1 Signal Enhancement
Radar returns from any strongly reflecting target including wind farm turbines make multiple echoes more likely.
From the data collected during these trials it is obvious that circular metallic structures do provide a ready reflecting surface for radar beams. Using the light analogy, a shiny tube will always reflect a bar of light along its surface aligned with its axis, which is visible from multiple directions. Taking the analogy further; the effect of radar beams entering the array, deflecting off the first surface and intercepting secondary surfaces, each returning a proportion of the beam seems inevitable.
Extended lines of echoes like those illustrated by the image below from the PLA VTS radar and that of the “BIRKA CARRIER” image in Figure 20, Section 7.1 were seen.
The observers felt that the path of the radar beam could be likened to the path of a ball in the well known bar game of “pin-ball”. This effect could also partially explain why a form of selective shadowing appears in the array as it is passed when individual targets dim and re-intensify at various positions that are not necessarily behind or in the shadow of a foreground obstruction.
© 2007 BWEA Page 44

8.2 Multiple Echoes
The PLA London VTS experience is very similar to the one experienced on “MORVEN” when passing close to the wind farm and observing multiple echoes radiating from the turbine towers inducing them. The difference is that the observing scanner was then moving and the targets were fixed, the converse of the VTS situation. In the case of “MORVEN” the interfering patterns created came mainly from the front reflector or the nearest turbine encountered. In the case of the VTS the interfering pattern created appeared to come from the narrow sector of reflected radar beam and the multiple echoes were generated from the first turbines encountered within the arc of the beam.
Figure 30: Radar display image from recording of LONDON VTS for 9th November 2005. The spurious targets beyond the real target – the vehicle carrier ‘A’ – are multiple reflections from the wind turbines behind the scanner mounted on turbine tower F1. The turbine tower mounted radar scanner is sectored so any spurious returns must come from the seaward side. The labelling refers to reflections for which see explanation Section 7.3 below.
F1
A E2
D4
F1
1
4 5
3
2
© 2007 BWEA Page 45
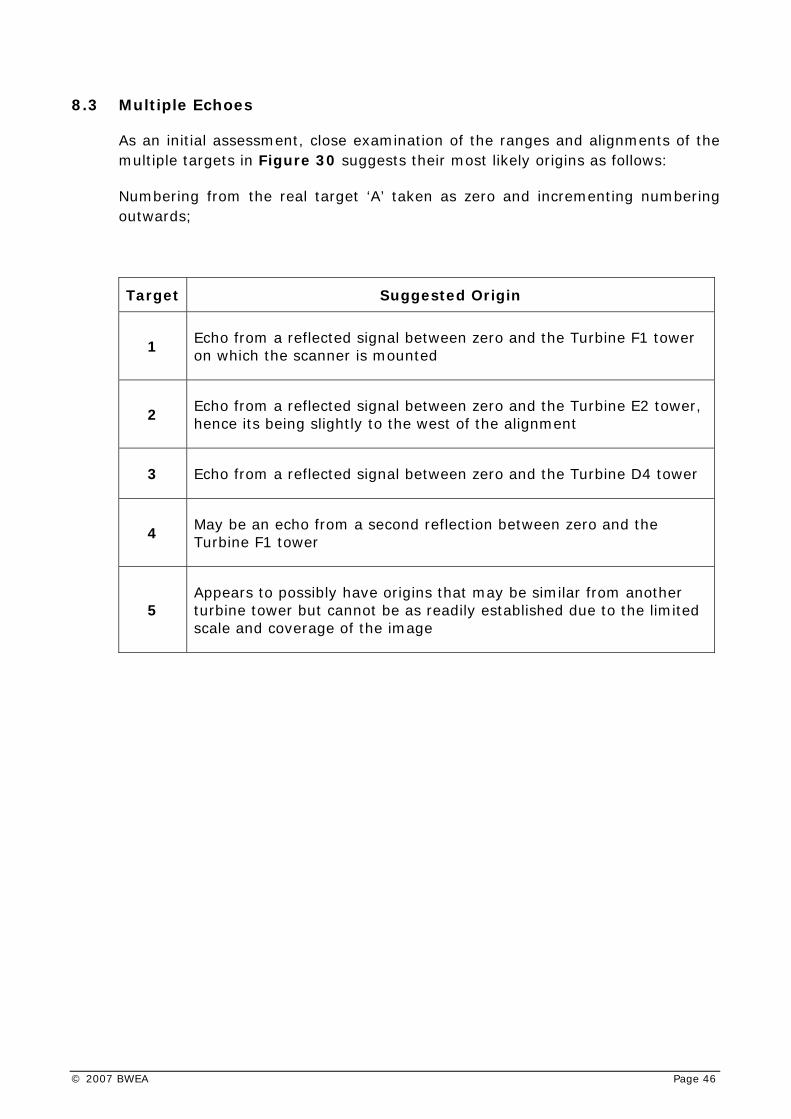
8.3 Multiple Echoes
As an initial assessment, close examination of the ranges and alignments of the multiple targets in Figure 30 suggests their most likely origins as follows:
Numbering from the real target ‘A’ taken as zero and incrementing numbering outwards;
Target Suggested Origin
1 Echo from a reflected signal between zero and the Turbine F1 tower on which the scanner is mounted
2 Echo from a reflected signal between zero and the Turbine E2 tower, hence its being slightly to the west of the alignment
3 Echo from a reflected signal between zero and the Turbine D4 tower
4 May be an echo from a second reflection between zero and the Turbine F1 tower
5 Appears to possibly have origins that may be similar from another turbine tower but cannot be as readily established due to the limited scale and coverage of the image
© 2007 BWEA Page 46
9 SUMMARY OF OBSERVATIONS
The research found that effects were generated on marine radar systems in the vicinity of wind farms. A number of different types were identified and these could be summarised as follows:-
• A wide range of radar equipment is in use onboard ships currently in service and radar scanner installation varies widely;
• Reflections off obstructions on board the vessels can create linear or small sector interfering echoes;
• Reflections off plane (flat) surfaces on board the vessels can create “mirror” images on the radar display;
• Reflections between the two categories above from larger diameter curved surfaces on board can create a distorted “mirror” image on the display;
• Reflections from plane surface external influences, such as “slab sided” vessels can create “mirror” images on the display when the surfaces were in the correct alignment;
• Initial analysis indicates that about 1/3 of trials vessels did not experience any obvious effects that could be considered significant;
• Linear, small and large sector reflections from side lobes, pulse extensions and multiple reflections from wind turbine towers can be manifested when close to the observing vessel;
• Extension of targets on the radar display is possible when aligning with recognisable formations such as the wind farm;
• Strong echoes are possible from wind farm turbines;
• Strong signals are possible from World War II Forts;
• Possible correlation with heights of scanners was identifiable in certain circumstances;
• The availability of the Spaniard Buoy provided a reference target and assisted in the adjustment of the radar for particular circumstances;
• A small number of pilots reported that they had observed interfering echoes displayed on the radar screen that, because they were in fog at the time, gave cause for concern. However, this type of effect was not seen during the trials by the MARICO observers. Pilots and other mariners should be requested to report and photograph if possible any occurrence in detail, to enable further analysis to be carried out;
© 2007 BWEA Page 47
• Limited and selective shadowing of targets was observed within the wind farm; and
• Multiple echoes from reflections off the wind turbine towers in the vicinity of the static London VTS radar scanner at the wind farm was possible when slab sided vessels pass with a suitable aspect.
10 POSSIBLE MITIGATION
10.1 General Mitigation
Although it was not envisaged originally as a part of this research, the observations force us to conclude that it could be highly beneficial for maritime operations to improve the performance of marine radar generally. We believe that improvements could be achieved by attention to the following point that was shown during the observational work to be reducing radar efficiency in general terms.
• Knowing that interfering spurious echoes can be produced by ships’ structures and fittings within the radar scanner aperture, scanners should be sited in the most advantageous position to these, after taking all other considerations into account. This will be particularly important where vessels’ trades take them close to offshore wind farms known to return very strong echoes. These considerations should include problems related to the siting of scanners off the fore and aft line.
10.2 Wind Farm Specific Mitigation
To improve the performance of marine radar in the vicinity of wind farms, the following points were suggested by the observational work:-
• Throughout the research work, the Spaniard Buoy, which presents a small target beyond the Kentish Flats wind farm, was used as a reference when adjusting the radar settings. Providing the Spaniard Buoy, which is fitted with a radar reflector, could still be seen, the operator was confident that the settings had not been reduced too far to cause smaller targets of equivalent reflecting qualities outside the wind farm to be lost to the radar display. To assist mariners and possible SAR operations, “reference” buoys could be provided adjacent to and within wind farms to be used when adjusting Gain and other control levels to assist in the detection of smaller targets. The concept of using designated reference buoys or other appropriate targets, to aid adjustment of radar settings, could provide a valuable aid to the operation of marine radar near and within wind farms;
© 2007 BWEA Page 48

• Pilots should be requested to continue to report and if possible photograph any occurrence of observed effects displayed on the radar screen with as much detail as possible, so that further analysis may be carried out;
• Although the existing radar training of mariners covers spurious echoes that might be generated by strong targets, there are benefits to be gained from the inclusion of the findings of this research in advice to mariners and in future training courses, in particular simulator training; and
• After noting the effects recorded by the London VTS, it is suggested that VTS radar scanners, particularly those mounted on or near wind turbines should be carefully sited so as to avoid coincidence of reflections from both large slab sided vessels and the wind farm turbine towers within the reflected beam width.
© 2007 BWEA Page 49

11 CONCLUSIONS
The data collected during these trials and the preliminary analysis of the effects observed have proved to be of great value when considering the navigation of vessels within and near to wind farms. The important aspect of the research was the real environment in which it took place. The trials not only involved a sizeable and varied sample of commercial shipping, Navigators, VTS and Pilots but it also involved leisure and small commercial craft. The scenarios of passing shipping and other contacts in and close by the wind farm were all covered to varying extents.
From the trials and discussions with mariners it was seen that:
• Mariners passing the Kentish Flats through a pilotage area were aware of the types of effect that was evident but stated that, in the circumstances of these trials; they were of little direct concern to them;
• The phenomena detected on marine radar displays in the vicinity of a wind farm can be produced by other strong echoes close to the observing ship, although not necessarily to the same extent. Trained mariners will recognise and understand the causes of these effects;
• Reflections and distortions by ship structures and fittings created many of the effects observed leading us to conclude that the strong returns from the wind farm was highlighting some vulnerabilities in ships’ radar scanner installations;
• The effects observed were transitory in relation to the speed of the vessels passing the wind farm site;
• The spurious echoes were frequently generated by ship’s structures and fittings combined with the reflecting qualities of the turbines;
• Other effects were produced by the inherent limitations of marine radar systems combined with the reflecting qualities of the turbines;
• In the circumstances in which these trials were conducted, navigators were able to effectively track other vessels from both within and behind the area of the wind farm;
• Selected small craft operating in and near the wind farm were detectable by radar on ships operating near the array. The return signals appeared to be relatively unaffected by passing through the array although normal or automatic gain levels could eclipse very small targets;
• Echoes of small craft within the wind farm can merge with strong echoes generated by the turbines when the craft pass close to the towers making them invisible to radar observers or automatic plotting facilities. While
© 2007 BWEA Page 50

navigating, this effect will only be temporary until the craft moves away from the turbine;
• Small craft operating within the wind farm array were less detectable by type approved, or non-approved, radars on other vessels when the latter were operating within the array. This appeared to be due to enhanced effects from the close approach to the turbine towers and the reflective effects caused by them. Careful adjustment of Gain could improve detection but skill was required on the part of the operator;
• The Spaniard Buoy was used as a reference target by observers and it was also notable that when on the opposite side of the wind farm array the quality of its returned echo did not appear to be adversely affected;
• Pilots were aware of possible interference but most have not to date found cause to analyse it more closely. Like the other mariners who were familiar with the area and the effects of the wind farm they were relatively unconcerned with them in their present form and position. However, some expressed concern at the possibilities if wind farms were sited closer to regular routes and particularly in way of channel junctions or routes through multiple wind farms
• Modern commercial cargo vessels in particular are regularly fitted with radar scanners that may not be optimally sited in relation to obstructions onboard the vessel and other considerations;
• VTS static radars can be subject to similar phenomena as above, (even when the scanner is sectored) if passing vessels provide a suitable reflecting surface; and
• AIS equipped vessels did not suffer loss of signal at any point outside or within the wind farm (“MORVEN” is AIS equipped).
Marine and Risk Consultants Limited
MARICO House Bramshaw Southampton SO43 7JB Tel 02380 811 133 Fax 02380 811 177 [email protected] www.marico.co.uk
Date: February 2007
© 2007 BWEA Page 51

12 GLOSSARY
ASMS Active Safety Management System AIS Automatic Identification System ARPA Automatic Radar Plotting Aid CCTV Closed Circuit Television CD Chart Datum CNIS Channel Navigation Information Service ColRegs International Regulations for Preventing Collision at Sea DfT Department for Transport DSC Digital Selective Calling DTI Department of Trade and Industry DWT Dead-Weight Tonnes - The mass in tonnes that a vessel can carry. Not
to be confused with the volumetric Gross Tons (see below) ECS Electronic Chart System EIA Environmental Impact Assessment ETV Emergency Towing Vessel FV Fishing vessel GIS Graphic Information System GMDSS Global Maritime Distress and Safety System GT Gross Tonnage - a volumetric measurement of the vessel used for legal
purposes. Not to be confused with displacement or deadweight tonnes. IALA International Association of Lighthouse Authorities IMO International Maritime Organisation IHO International Hydrographic Organization ISM International Safety Management Code km Kilometre LOA Length Over All m Metre MAIB Marine Accident Investigation Branch MARICO Marine & Risk Consultants Ltd MCA Maritime and Coastguard Agency MHWS Mean High Water Springs MGN Marine Guidance Note Mt Million tonnes MY Motor yacht nm Nautical Mile (approx. 1,852m) NtM Notices to Mariners OREI Offshore Renewable Energy Installation PEXA Firing Practice and Exercise Area PLA Port of London Authority RACON Radar automated transponder beacon transponder device RNLI Royal National Lifeboat Institution SEA Strategic Environmental Assessment SQL Structured Query Language THLS Trinity House Lighthouse Service TSS Traffic Separation Scheme UKHO United Kingdom Hydrographic Office UNCLOS United Nations Convention on the Law of the Sea VHF Very High Frequency VTS Vessel Traffic Services WFZ Wind Farm Zone ZOI Zone of Influence
© 2007 BWEA Page 52

BWEA Renewable Energy House 1, Aztec Row 1, Berners Road LONDON N1 0PW Tel: +44 (0)20 7689 1960 Fax: +44 (0)20 7689 1969 Email: [email protected]
© 2007 BWEA Page 53