development of a local subgrid diffusivity model for large-eddy ...

Effects of Vertical Eddy Diffusivity Parameterization on theEvolution of Landfalling Hurricanes
FEIMIN ZHANG
College of Atmospheric Sciences, Lanzhou University, Lanzhou, China, and Department of
Atmospheric Sciences, University of Utah, Salt Lake City, Utah
ZHAOXIA PU
Department of Atmospheric Sciences, University of Utah, Salt Lake City, Utah
(Manuscript received 21 July 2016, in final form 10 March 2017)
ABSTRACT
As a result of rapid changes in surface conditions when a landfalling hurricane moves from ocean to land,
interactions between the hurricane and surface heat and moisture fluxes become essential components of its
evolution and dissipation. With a research version of the Hurricane Weather Research and Forecasting
Model (HWRF), this study examines the effects of the vertical eddy diffusivity in the boundary layer on the
evolution of three landfalling hurricanes (Dennis, Katrina, and Rita in 2005).
Specifically, the parameterization scheme of eddy diffusivity formomentumKm is adjustedwith themodification
of themixed-layer velocity scale inHWRF for both stable and unstable conditions. Results show that the change in
theKm parameter leads to improved simulations of hurricane track, intensity, and quantitative precipitation against
observations during and after landfall, compared to the simulations with the original Km.
Further diagnosis shows that, compared to original Km, the modifiedKm produces stronger vertical mixing
in the hurricane boundary layer over land, which tends to stabilize the hurricane boundary layer. Conse-
quently, the simulated landfalling hurricanes attenuate effectively with the modified Km, while they mostly
inherit their characteristics over the ocean and decay inefficiently with the original Km.
1. Introduction
Landfalling hurricanes are a significant weather-
related threat both onshore and inland. They cause
great loss as a result of their strong winds, heavy rainfall,
soil erosion, and flooding (Wu andKuo 1999; Kaplan and
DeMaria 2001; Whitehead 2003). Accurate prediction of
the track, intensity, and structure associated with the
weakening of hurricanes during landfall and their further
evolution over land is of great interest in order to provide
effective warning. Yet this is a great challenge and a key
scientific issue for numerical weather prediction (NWP)
(Marks and Shay 1998; Pu et al. 2009; Wu et al. 2016).
Understanding the evolution of landfalling hurricanes is
very important for improving their forecasts.
When a hurricane moves from ocean to land, the en-
vironmental conditions change significantly. Interaction
between the hurricane and the environment over land be-
comes very important for the evolution of the hurricane. In
the early 1980s, the Hurricane Strike Project was launched
to gain some understanding of hurricane landfall. Results
from Powell (1982, 1987) showed that the loss of the oce-
anic heat and moisture source, combined with the advec-
tion of drier air on the landward side of the storm, was
responsible for cooling and drying the inflowing boundary
layer air. In addition, the asymmetric structure of the sur-
facewind fieldwas caused by the combined effects of land–
sea roughness differences, background environmental flow,
and storm translation. Observation results from Powell
(1990) confirmed that convective downdrafts are capable of
transporting low–equivalent potential temperature (ue) air
to the surface, where the mixed layer is eliminated. The
incorporation of this air into the convectionnear the core of
the stormmayweaken the storm, depending on the scale of
the disturbance and the processes governing the recovery
of the air while it is flowing toward the eyewall. Simulation
Publisher’s Note: This article was revised on 26 May 2017 to
correct the spelling of the first author’s name.Corresponding author: Dr. Zhaoxia Pu, [email protected]
JUNE 2017 ZHANG AND PU 1879
DOI: 10.1175/JAS-D-16-0214.1
� 2017 American Meteorological Society. For information regarding reuse of this content and general copyright information, consult the AMS CopyrightPolicy (www.ametsoc.org/PUBSReuseLicenses).
Unauthenticated | Downloaded 12/07/21 12:56 AM UTC

results of Hurricane Danny (1997) by Kimball (2006) fur-
ther emphasized that the erosion of the rainband convec-
tion and the approach of dry air to the storm core from the
landward side could be the mechanism that reduces hur-
ricane intensity.
Although the aforementioned studies led to significant
understanding of hurricane landfalls, most of them, as
well as some follow-on studies (e.g., Powell and Houston
1996; Farfán and Zehnder 2001), focused mainly on the
near-landfall periods when hurricanes were not far from
the ocean andwere strongly influenced by oceanic effects.
So far, very few studies have documented the evolution,
intensity changes, thermodynamic characteristics, and
precipitation features of hurricanes over land, although
the mesoscale wind and precipitation structures of a
hurricane over inland areas can cause the heaviest dam-
age (Parrish et al. 1982; Bluestein and Hazen 1989).
During the evolution of a hurricane, the exchange and
translation of momentum, heat, moisture, and substance
between hurricanes and the surface/environment are sig-
nificantly related to the planetary boundary layer (PBL).
Past studies (e.g., Emanuel 1995; Braun andTao 2000; Bao
et al. 2002; Chen et al. 2007) have revealed that simulated
hurricane intensity is quite sensitive to the exchange with
enthalpy (heat and moisture) fluxes from the ocean sur-
face. The importance of the interactions between the sur-
face and PBL is also highlighted by recent studies (e.g.,
Zhu 2008; Zhu and Furst 2013; Doyle et al. 2014). In the
NWP model, the PBL scheme is responsible for vertical
subgrid-scale fluxes because of eddy transports throughout
the atmosphere and is also closely related to cloud physics.
Li and Pu (2008) evaluated the early rapid intensification
of Hurricane Emily (2005) over the ocean with different
PBL and cloudmicrophysical schemes, finding that high-ueair feeding from the ocean surface into the hurricane
eyewall was evident in more enhanced convection and
intense storms. Shelton and Molinari (2009) found that
abnormally dry air upshear, together with cold downdrafts,
might be responsible for the weakening of hurricanes over
the ocean. Nolan et al. (2009a,b) evaluated the Yonsei
University (YSU) and Mellor–Yamada–Janjic (MYJ)
PBL schemes in an advanced research version of the
Weather Research and Forecasting (WRF; Skamarock
et al. 2008)Model using in situ data obtained from aircraft.
Results show that, for both schemes, the differences be-
tween the low-level asymmetries in the simulated and
observedwind fields over the ocean appear to be related to
eyewall asymmetries forced by environmental wind shear.
Riemer et al. (2010) and Cione et al. (2013) also indicated
that the low-level dry air (low-ue air) contributes to hurri-
cane evolution over the ocean and that the transport of dry
air within the PBL is important to hurricane decay. Zhang
et al. (2013) investigated the asymmetric structure of the
hurricane PBL in relation to the environmental vertical
wind shear in the inner-core region, based on observations
over the ocean, and the results suggest that the convective
downdraft and the ue transport within the PBL are differ-
ent in the four quadrants of the hurricane vortex. Zhu et al.
(2014) evaluated the effects of four PBL schemes in the
WRFModel on the simulation of Hurricane Isabel (2003)
over the ocean. The results showed that the vertical
transport of surface heat and moisture is critical to storm
structures in the vicinity of the hurricane eyewall.
As key parameters in PBL parameterization, eddy dif-
fusivity for momentumKm and thermal eddy diffusivityKh
control the feedback of momentum, moisture, and heat
between the surface and the atmosphere. A series of nu-
merical and observational studies has been conducted by
various groups for hurricanes over the ocean. For instance,
Kepert (2001), Smith (2003), and Zhang et al. (2011) found
that better estimations of the eddy diffusivity coefficient in
the hurricane boundary layer are helpful for hurricane
prediction over the ocean. Braun and Tao (2000) in-
vestigated the sensitivity of numerical simulations of a
hurricane to different PBL schemes in the fifth-generation
Pennsylvania State University–NCAR Mesoscale Model
(MM5), finding that the simulated intensity was related to
the vertical mixing in each PBL scheme over the ocean,
especially for theMedium-RangeForecast (MRF) scheme.
Zhang and Drennan (2012) estimated the vertical distri-
bution of vertical eddy diffusivities over the ocean through
observation. They found that the magnitudes of vertical
eddy diffusivities for momentum and latent heat fluxes
were comparable, but the eddy diffusivity for sensible heat
flux was much smaller than that for latent heat flux.
Gopalakrishnan et al. (2013) artificially reduced eddy dif-
fusivity to a quarter of its original value in the Hurricane
Weather Research and Forecasting Model (HWRF) and
produced the intensity and size of a hurricane bestmatched
with observations when it was over the ocean, indicating
the importance of eddy diffusivity in PBL parameteriza-
tion. Zhang et al. (2015) reduced Km with a 5 0.5 in
HWRF. Results with four hurricanes over the ocean
showed that predictions were improved with a smallerKm.
Compared to simulations with the original Km, the simu-
lated storms were stronger and had a shallower PBL,
stronger inflow and outflow above the PBL, stronger up-
drafts in the eyewall, and a stronger warm core.
Overall, as mentioned above, the importance of PBL
parameterization and the effects of vertical mixing (de-
termined by verticalKm andKh) in the hurricane boundary
layer has been frequently investigatedbecause of the strong
effect on simulated hurricane intensity and structure.
However, these findings and improvements are limited
mostly to when hurricanes are over the ocean. So far, to the
best of our knowledge, similar research for hurricanes over
1880 JOURNAL OF THE ATMOSPHER IC SC IENCES VOLUME 74
Unauthenticated | Downloaded 12/07/21 12:56 AM UTC

land has not yet been documented. Understanding of the
kinematic and thermal structures during hurricane landfall
and their further evolution over land is generally lacking, as
the changes in hurricane boundary layer structures and the
interaction between hurricanes and surface conditions can
be significantly different over the ocean and land.
In light of the lack of studies on the interactions be-
tween the hurricane boundary layer and the land surface/
environment, as well as the poor understanding of hurri-
cane evolution over land, the purpose of this study is to
investigate the effects of vertical mixing in the PBL on
landfalling hurricanes, with the emphasis on hurricanes
over land, based on a research version of the National
Centers for Environmental Prediction (NCEP)’s HWRF
(version 3.6a; Tallapragada et al. 2014). The detailed ther-
modynamic and kinematic characteristics of hurricanes
during their movement from ocean to land as well as their
evolution and decay processes over land are diagnosed.
The paper is divided into the following sections. Sec-
tion 2 gives a brief description of the three hurricane
cases, the data, and HWRF. The PBL parameterization
and the proposed modification of the vertical eddy dif-
fusivity parameterizations are presented in section 3.
Section 4 presents the simulation results of Hurricane
Rita (2005), Hurricane Katrina (2005), and Hurricane
Dennis (2005), as well as the discussions of the effects of
vertical mixing in the PBL on hurricane thermodynamic
and kinematic structures. The discussion and concluding
remarks are made in sections 5 and 6, respectively.
2. Description of hurricane cases, data, and HWRF
The 2005 hurricane season had a total of five named
storms that made landfall in the Gulf of Mexico, which is
one of the regions where hurricanes most frequently make
landfall in theAtlantic basin (Brettschneider 2008).Among
them, three hurricanes—Dennis (Beven 2005), Katrina
(Knabb et al. 2005), and Rita (Knabb et al. 2006)—are the
representative landfalling hurricanes because of their
damage, loss of life, severe weather, and floods caused by
storm surges. Hurricanes Dennis, Katrina, and Rita made
landfall at 1930 UTC 10 July, 1110 UTC 29 August, and
0740 UTC 24 September, respectively.
These three hurricanes were chosen because they all
strengthened to a category-4–5 hurricane (on the Saffir–
Simpson hurricane wind scale) in the central Gulf of
Mexico and weakened prior to making landfall as a
category-3 hurricane (Fig. 1b). They also resulted in se-
vere destruction and had long-term duration over land.
Considering data availability and the major emphasis of
this study, we chose the following time periods for nu-
merical simulation: from 1200 UTC 9 July to 1800 UTC
12 July 2005 for Hurricane Dennis, from 0000 UTC
28 August to 0600 UTC 31 August 2005 for Hurricane
Katrina, and from 0000 UTC 23 September to 0600 UTC
26 September 2005 for Hurricane Rita, when these tropi-
cal cyclones (TCs) all underwent intensity changes fol-
lowing an initial rating of strong category-4–5 hurricanes, a
slow weakening to category 3, and deep weakening to
FIG. 1. (a) Locations ofHWRF domains. The simulation is performed in outer, middle, and inner domains. Themiddle and inner domains
move with the simulated hurricane. Two ghost domains are used for HWRF initialization purposes only. (b) Best-track positions at 6-h
intervals for Hurricane Dennis from 1200 UTC 9 Jul to 1800 UTC 12 Jul 2005, Hurricane Katrina from 0000 UTC 28 Aug to 0600 UTC 31
Aug 2005, and Hurricane Rita from 0000 UTC 23 Sep to 0600 UTC 26 Sep 2005. The symbols in the circle indicate the hurricane intensity
scales, from NHC and derived by Saffir–Simpson category: tropical storm (TS), tropical depression (TD), remnant low (RL), and extra-
tropical (ET). The shaded contours indicate the terrain height (m). Contour intervals are different in (a) and (b). The ghost domain in (a) is
created for inner-core data assimilation; the domain sizes for ghost d02 and ghost d03 are 208 3 208 and 108 3 108, respectively.
JUNE 2017 ZHANG AND PU 1881
Unauthenticated | Downloaded 12/07/21 12:56 AM UTC

tropical storms and tropical depressions near, during, and
after their landfalls.
HWRF has been an operational model implemented at
NCEP to provide numerical guidance to the National
Hurricane Center (NHC) for the forecast of the track, in-
tensity, and structure of TCs since 2007. More importantly,
it has also become a popular and reliable model for hurri-
cane researchowing to its encouraging success in forecasting
hurricanes and significant improvements in its forecast score
during recent hurricane seasons. At the beginning of this
study, HWRF, version 3.6, released by the NCAR De-
velopmental Testbed Center (DTC) became available and
was thus adopted for this study. HWRF has a Non-
hydrostatic MesoscaleModel (NMM) dynamic core (Janjic
et al. 2010) with a two-way interactive, movable, triple-
nested grid procedure. The three domains are at horizontal
grid resolutionsof 27, 9, and 3kmthat cover areas of roughly
808 3 808, 128 3 128, and 7.18 3 7.18, respectively. Figure 1ashows the configuration of the simulation domain. Detailed
physical parameterization schemes, forcing data, and dy-
namic structures can be found in the HWRF scientific
documentation (Tallapragada et al. 2014).
The NCEP Global Forecasting System (GFS) Final
Analysis (FNL) data (18 3 18) are used for the initial and
boundary conditions in a cold-start mode. The vortex ini-
tialization scheme (Liuet al. 2006)wasperformed to relocate
the hurricane vortex at the location determined by theNHC
Tropical Cyclone vital statistics (TCVitals), then followed
by a size and intensity correction processwith adjustments to
the wind, moisture, and thermodynamics fields. The ocean
model (Mellor 2004) is not included in this study.
Satellite infrared imagery from the Geostationary
Operational Environmental Satellite 12 (GOES-12);
NHC best-track data and surface wind analysis from the
Hurricane Research Division (HRD); and precipitation
analysis from the NCEP Climatology Calibrated Pre-
cipitation Analysis (CCPA) reanalysis (Hou et al. 2014)
are used for validating the simulation results.
3. Modifying vertical eddy diffusivity in PBLparameterization
The PBL scheme used in HWRF (called the GFS
scheme) is essentially the traditional NCEP MRF
scheme, which is a first-order nonlocal scheme (Troen
and Mahrt 1986; Hong and Pan 1996):
›C
›t5
›
›z
�K
c
�›C
›z
�2g
c
�, (1)
where C is the prognostic mean variable (such as u, y, u,
q); and gc represents the nonlocal term of C. The eddy
diffusivity is Kc, and we denote Km as the momentum
eddy diffusivity for u and y and Kh as the thermal eddy
diffusivity for u and q.
In HWRF, Km is parameterized as:
Km5 kw
sz a 12
z
h
� �ph iand (2)
ws5
u*fm
, (3)
where k5 0.4 is the von Kármán constant;ws represents
themixed-layer velocity scale; u* is the surface frictional
velocity that relates to wind shear or momentum fluxes
near the ground (Stull 1988); h is the depth of the tur-
bulent PBL [viz., the PBL height (PBLH)], which is
determined based on the height above the ground at
which the bulk Richardson numberRib exceeds a critical
value; fm is the dimensionless wind profile function
evaluated at the top of the surface layer (z5 0.1h), which
can be parameterized by the Monin–Obukhov scale that
relates to both surface momentum and heat andmoisture
fluxes (Stull 1988; Hong and Pan 1996); z is the height
above the surface; p is the profile-shape exponent, taken
to be 2.0 inHWRF; anda is the nonzero constant (a5 0:7
in HWRF 3.6a; same as the 2013 version HWRF) to re-
duce the magnitude of Km as proposed by Zhang et al.
(2012) and Gopalakrishnan et al. (2013). In HWRF, the
parameterization ofws [Eq. (3)] is used under both stable
and unstable stratifications.
In the GFS scheme, Kh is parameterized as follows:
Kh5
Km
Pr
and (4)
Pr5
fh
fm
1 «bk , (5)
where fh/fm is the ratio of the dimensionless tempera-
ture gradient and wind profile at the top of the surface
layer (z5 0.1h); k5 0.4 is the vonKármán constant; and« and b are constants, taken to be 7.8 and 0.1, re-
spectively. Thus, the Prandtl number Pr is a constant in
the whole PBL under certain stability.
So far, improvements of PBL parameterization in
HWRF have focused mainly on Km, using the nonzero
constant (a 5 1) to cap the unrealistic strong vertical
mixing in the PBL based on ocean field experiments. This
method has been proved to be very useful for improving
hurricane prediction over the ocean (Gopalakrishnan et al.
2013; Zhang et al. 2012, 2015); however, very few have
focused on sensitivity studies or possible impacts of vertical
eddy diffusivity parameterization on hurricane evolution
during and after landfall.
During the previous development of the MRF
scheme, the convective velocity scale w*b
[see Eq. (7)],
1882 JOURNAL OF THE ATMOSPHER IC SC IENCES VOLUME 74
Unauthenticated | Downloaded 12/07/21 12:56 AM UTC

which is an important scaling variable in PBL that
consists of the surface buoyancy flux [denoted as
(g/uya)(w0u0y)0] and the boundary layer height, is adop-
ted from Noh et al. (2003) to parameterize vertical
eddy diffusivity in PBL. This term works quite well
when the magnitude of the vertical velocity fluctuation
in thermals is on the same order asw*b
[e.g., convective
boundary layer (Stull 1988)]. Combined with other
modifications, such as the Prandtl number and en-
trainment, the modified scheme produces profiles that
are more realistic when compared to the data from
large-eddy simulations. The real case study by Hong
et al. (2006) also showed that the new scheme por-
trayed the characteristics of intense inland convection
systems well. Moreover, these modifications have also
been conducted and applied in the well-known YSU
scheme (Hong et al. 2006). In light of these results, we
examine the sensitivity of the modification that relates
to Km to the simulation of landfall hurricanes with
HWRF, based on Stull (1988), Noh et al. (2003), and
Hong et al. (2006).
The modification is the mixed-layer velocity scale ws
to adjust Km:
ws5
�u3
*1fmkw3
*bz
h
�1/3
, (6)
while
w*b 5
"gh
uya
(w0u0y)0
#1/3
, (7)
where w*b
is the convective velocity scale for moist air;
g denotes gravity acceleration; uya is the virtual po-
tential temperature at the lowest model level; and
(w0u0y)0 represents the surface heat and moisture fluxes.
Other symbols have been introduced above. Consid-
ering the surface and atmosphere interaction is stron-
ger than usual cases during the hurricane landfall even
in a quasi-stable atmospheric condition, note here ws
[Eq. (6)] is used for both stable and unstable stratifi-
cations. This is different from the YSU scheme because
ws is termed as Eq. (3) under stable stratification only in
the YSU scheme.
Overall, the above modifications are essentially the
parameterization of ws for Km in the PBL parameteri-
zation, without any others modifications of HWRF.
A surface-layer scheme is coupled with the PBL
scheme. HWRF uses a modified Geophysical Fluid Dy-
namics Laboratory (GFDL) surface-layer parameteriza-
tion based on the Monin–Obukhov similarity theory
(Sirutis and Miyakoda 1990; Kurihara and Tuleya 1974).
Details can be found in Tallapragada et al. (2014).
4. Simulation results
To examine the effects of the modified Km on hurri-
cane simulations, at the beginning of the study, two ex-
periments are conducted for each of the three hurricane
cases:
1) CTL: the original HWRF without any modification;
2) REV1: Km only is modified and used in both stable
and unstable conditions, while the form of Kh re-
mains the same as in CTL.
The detailed configurations of the two experiments
are also summarized in Table 1.
For each experiment, three time periods are defined
to represent the evolution of the hurricanes from ocean
to land: prelandfall, when the hurricane is over the
ocean (before 36-h forecast); landfall (near 36-h fore-
cast), defined as the time when the hurricane center
crosses the coastline; and postlandfall, when the hurri-
cane travels over land (beyond 36-h forecast).
a. Track and intensity
Figures 2 and 3 compare the HWRF simulations of
track and intensity with the NHC best-track data for all
three hurricanes in different experiments. Over the
ocean, in the early forecasting phase, simulation results
from the other experiments are similar to those of CTL.
Near and over land, however, the impact of the modi-
fication of Km on hurricane track and intensity simula-
tions is evident. While much stronger hurricanes with
overestimated surface wind and underestimated surface
pressure (against the best-track data) are produced by
the original HWRF (CTL), noticeable improvements in
track and intensity simulations are found in REV1. The
large track error in CTL is also improved in REV1
(Figs. 3a,d,g). Overall, the decay processes of hurricanes
after their landfalls are much underestimated by the
simulations with the original scheme, but they are well
portrayed with the modified Km. In addition, a com-
parison of the simulated track positions among the ex-
periments in Fig. 2 also shows that the unrealistic track
positions in CTL are ably remedied by REV1. Com-
pared with CTL, the mean improvements during hurri-
cane evolution over land due to the modification of Km
TABLE 1. Parameterization configurations in each experiment.
Expt Stable conditions Unstable conditions
CTL ws 5u*fm
ws 5u*fm
REV1 ws 5�u3
*1fmkw3
*bz
h
�1/3
ws 5�u3
*1fmkw3
*bz
h
�1/3
REV2 ws 5u*fm
ws 5�u3
*1fmkw3
*bz
h
�1/3
JUNE 2017 ZHANG AND PU 1883
Unauthenticated | Downloaded 12/07/21 12:56 AM UTC
for track, minimum surface pressure, and maximum sur-
face wind are about ;87km, ;12hPa, and ;7.5ms21,
respectively, for Hurricane Rita; ;95km, 11hPa, and
;0.5ms21, respectively, for Hurricane Katrina; and
;141 km, ;4 hPa, and ;3.7m s21, respectively, for
Hurricane Dennis. The simulated landfall time is dif-
ferent than best track and does not essentially affect the
main conclusion (Nolan et al. 2009a).
Because of the similarities regarding the impacts of
the modifiedKm on all hurricanes, most of the diagnosis
results are presented for Hurricane Rita.
b. Evolution of hurricanes and synopticenvironments
Figures 4a–e and 4f–j show the GOES IR imagery for
Rita and Katrina, respectively. When hurricanes are
located over the ocean (Figs. 4a,f), the symmetrical
convective spiral bands and hurricane eye are clearly
evident. Intense convection covers most of the hurricane
core regions and outer rainbands with very high cloud
tops, indicating strongly organized hurricane structure.
During and right after landfall (Figs. 4b,c,g,h), the
symmetrical features of the spiral bands and the pres-
ence of the hurricane eye are no longer evident. The
hurricanes are obviously weakened, with decreased
cloud tops and convective regions, especially north of
the eyewalls, implying environmental infusion effects
over land.When hurricanes further evolve over land, the
cloud tops become lower and convective spiral bands
become looser, with asymmetric convective structures,
especially along the hurricane center (Figs. 4d,i). Then
the spiral structure of the storms gradually weakens and
eventually dissipates (Figs. 4e,j).
Figures 5a–d and 5e–h compare the NCEP FNL and
simulated geopotential height and temperature fields
valid at 0600 UTC 26 September 2005 and 0600 UTC
31 August 2005 for Hurricanes Rita and Katrina, re-
spectively. The overall large-scale synoptic characteristics
from the West Coast to East Coast are well captured by
HWRF simulations in both CTLs and REV1s. Specifi-
cally, the great differences between CTLs and REV1s
are mainly over the environmental flows around and
associated with the hurricane vortices (Figs. 5d,h). In
Hurricane Katrina, for example, to the east of the Great
Plains, CTL predicts a stronger trough (Fig. 5f) compared
to FNL (Fig. 5e) with closed low pressure, while REV1s
produce a trough (Fig. 5g) without the closed structure
that is compatible with FNL. Figures 5d and 5h also show
the differences in mean wind fields (i.e., 850–300hPa)
between CTL and REV1 (CTL minus REV1). They re-
veal that the flow differences between the two experi-
ments are obvious over the areas around and associated
with the hurricane vortices, where the simulated winds in
CTLs are stronger with more spiral structures than those
in REV1s. Specifically, the difference in the maximum
wind between CTL and REV1 also indicate that the flow
direction in CTL ismore northwesterly, which is opposite
of the best-track direction (as shown in Fig. 2). Therefore,
the unrealistic spiral environmental flows around and
associated with hurricane vortices given by CTL are re-
sponsible for the larger bias in the track simulations
compared with REV1.
FIG. 2. Comparison of hurricane track positions between NHC best-track and different simulation experiments at 6-h intervals.
(a) Hurricane Dennis from 1200 UTC 9 Jul to 1800 UTC 12 Jul 2005, (b) Hurricane Katrina from 0000 UTC 28 Aug to 0600 UTC 31 Aug
2005, and (c) Hurricane Rita from 0000 UTC 23 Sep to 0600 UTC 26 Sep 2005.
1884 JOURNAL OF THE ATMOSPHER IC SC IENCES VOLUME 74
Unauthenticated | Downloaded 12/07/21 12:56 AM UTC

The evolution of sea level pressure (SLP) fields
(Fig. 6) for both Rita (left) and Katrina (right) further
indicates that CTLs predict stronger hurricanes with
stronger SLP gradients compared with REV1s when
hurricanes interact with the land surface, implying a
slower decay process in CTLs after landfall. In contrast,
REV1s make the vortex decay process more efficient
after the hurricane makes landfall.
c. Precipitation
Quantitative precipitation forecasts (QPFs) for hurri-
canes are very important for improving the prediction of
inlandflooding (Elsberry 2002).Accumulatedprecipitation
was checked for all three hurricanes during their landfalls
(Fig. 7). With the original HWRF, all CTL experiments
tend to overestimate rainfall for all three hurricanes, when
comparedwith theNCEPCCPAdata, a finescale andhigh-
quality precipitation analysis that is used at NCEP for
forecast verification. With the modified Km (experiment
REV1s), however, the overestimations of precipitation
amounts are mitigated, and the simulations produce more
reasonable precipitation structures for all three hurricanes.
For instance, Figs. 7a–c show that the overestimated pre-
cipitation and missing rainfall over southeastern Missouri
in CTL are remedied in REV1 for the simulation of
HurricaneDennis. Figures 7d–f indicate that precipitation
of Hurricane Katrina produced by REV1 is closer to
CCPA, compared to CTL. The modifiedKm also leads to
an improved precipitation structure against CCPA by
remedying the much stronger rainfall in CTL during the
simulation of Hurricane Rita (Figs. 7g–i). In addition, the
rainfall to the northeast of Rita that is missed by CTL is
also well simulated by REV1 with the modified Km.
Equitable threat scores (ETSs) (Wilks 1995) were
calculated for all three cases for the 24- and 42-h accu-
mulated precipitation for the periods after the hurri-
canes made landfall, against the NCEP CCPA data.
Results in Fig. 8 show clearly that all experiments with
modified Km (REV1) lead to a better ETS, compared
with CTL, especially for light rainfall (less than 40mm).
The improved QPFs and rainfall structures could be
attributed to the improved track simulations (Fig. 2) and
better representation of convective structures (discussed
in section 5) by the modified Km.
d. Effects on vortex structure
The simulation results above have shown that the orig-
inal HWRF parameterization tends to produce hurricanes
FIG. 3. Time series of (a),(d),(g) track errors (km) and intensity in terms of (b),(e),(h)minimumcentral SLP (hPa) and (c),(f),(i) maximum
surface wind (m s21) at 6-h intervals against NHC best-track data from different experiments for (a)–(c) Hurricane Dennis from 1200 UTC
9 Jul to 1800UTC 12 Jul 2005, (d)–(f)HurricaneKatrina from 0000UTC 28Aug to 0600UTC 31Aug 2005, and (g)–(i) HurricaneRita from
0000 UTC 23 Sep to 0600 UTC 26 Sep. The solid gray line denotes the approximate hurricane landfall time.
JUNE 2017 ZHANG AND PU 1885
Unauthenticated | Downloaded 12/07/21 12:56 AM UTC

with overestimated intensity, rainfall, and spiral vortices
during their landfall, but the modified Km has evident
positive impacts on the simulation of the decay process of
hurricane vortices during and after their landfall. In fact,
landfalling hurricanes have direct interactions with the
land surface beneath them. When a hurricane makes
landfall, the immediate interface beneath it changes from
ocean to land. Thus, the thermodynamic conditions be-
neath it should change significantly because of ocean and
land contrasts. Figure 9 illustrates the azimuthally aver-
aged surface sensible heat fluxes, latent heat fluxes, and
total enthalpy fluxes during the evolution of Rita from
ocean to land, respectively. Results from both CTL and
REV1 experiments show that, when the hurricanemoves
from ocean to land, surface sensible (Figs. 9a,b) and la-
tent fluxes (Figs. 9c,d) decrease dramatically beneath and
around the vortices (i.e., with a radius of 0–300km).
Moreover, compared to CTL, the surface sensible heat
fluxes decrease while the surface latent heat fluxes in-
crease in REV1. The total enthalpy fluxes (Figs. 9e,f),
however, are essentially the same in either CTL or
REV1, indicating that the modification of Km does not
essentially change the pattern or strength of surface total
enthalpy fluxes.
Figure 10 compares the evolution of azimuthally av-
eragedKm andKh below 700hPa in the CTL and REV1
schemes, respectively. Over the ocean, before hurricane
landfall (Figs. 10a,f), the patterns of vertical mixing in
the PBL are almost the same in the two experiments.
However, vertical mixing in REV1 is slightly weaker
than that in CTL. During and after landfall (Figs. 10b–e
and 10g–j), when the hurricane interacts with the land
surface directly, the vertical mixing in REV1 is more
efficient than in CTL. In addition, vertical mixing in the
PBL continues to decrease from ocean to land in the
original parameterization, while it becomes most sig-
nificant (Km and Kh are at a maximum) at landfall time
(Figs. 10b,g) with the modified Km when the hurricane
starts to interact with the land surface directly, suggesting
that the modified parameterization has a great response
to the rapid transition of surface boundary conditions
when hurricanesmove from ocean to land.Moreover, the
pattern and the magnitude of Km and Kh parameters are
the same in either CTL or REV1, implying that vertical
mixing in the PBL is determinedmainly by the estimation
ofKm parameter in HWRF, similar to the previous study
(e.g., Hong and Pan 1996).
Comparisons ofCTL andREV1with respect to surface
enthalpy fluxes (Fig. 9) and vertical mixing in the PBL
(Fig. 10) indicate that noticeable interactions between
hurricane vortices and the land surface in both original
andmodified schemes occur mainly around the hurricane
vortices (i.e., 0–300-km radius from the hurricane center),
FIG. 4. GOES infrared imagery during hurricane evolution from
ocean to land, corresponding to (a),(f) 18-; (b),(g) 36-; (c),(h) 45-;
(d),(i) 54-; and (e),(j) 78-h forecasts for (a)–(e) Hurricane Rita and
(f)–(j) HurricaneKatrina. The initial time is 0000UTC 23 Sep 2005
for Hurricane Rita and 0000 UTC 28 Aug 2005 for Hurricane
Katrina. [Courtesy of the Naval Research Laboratory TC website
(http://www.nrlmry.navy.mil/tc_pages/tc_home.html).]
1886 JOURNAL OF THE ATMOSPHER IC SC IENCES VOLUME 74
Unauthenticated | Downloaded 12/07/21 12:56 AM UTC

resulting in great discrepancies of flow around and asso-
ciated with the hurricane vortices, as shown in Fig. 5.
Previous studies have revealed the important effects
of the cold dry air from the environment around a hur-
ricane’s warm-core center on hurricane decay (Tuleya
and Kurihara 1978; Powell 1987, 1990; Kimball 2006).
Considering the great discrepancies in the vertical mix-
ing between the original and modified PBL parameter-
izations, as well as the dramatically reduced land-surface
enthalpy fluxes around and beneath the hurricanes
FIG. 5. Comparison of geopotential height (blue contour line; m) and temperature (red contour line; 8C) among
(a),(e) NCEPFNL, (b),(f) CTL, and (c),(g)REV1 at 500 hPa valid at 0600UTC26 Sep 2005 for (a)–(d)HurricaneRita
and 0600 UTC 31 Aug 2005 for (e)–(h) Hurricane Katrina. (bottom) The differences of mean wind vectors and speed
(colored contours) from 850 to 300 hPa between CTL and REV1 (CTL minus REV1) for (d) Rita and (h) Katrina.
JUNE 2017 ZHANG AND PU 1887
Unauthenticated | Downloaded 12/07/21 12:56 AM UTC

(especially within a 0–300-km radius of the hurricane
center), we further examine the effects of the modified
Km on the kinematic and thermodynamic structures of
hurricane vortices within a radius of 300 km, which re-
flects the interaction between the hurricane’s warm core
and the associated environment before, during, and af-
ter its landfall.
Equivalent potential temperature ue represents the
parcel properties in moist entropy processes. Higher uemeans a parcel with high temperature and moisture
FIG. 6. Sea level pressure (hPa) during the evolution of (left two columns) Hurricane Rita and (right two columns) Hurricane Katrina
from ocean to land at (a),(f) 18-; (b),(g) 36-; (c),(h) 45-; (d),(i) 54-; and (e),(j) 78-h forecasts, respectively. (a)–(e) CTL and (f)–(j) REV1.
The initial time is 0000 UTC 23 Sep 2005 for Hurricane Rita and 0000 UTC 28 Aug 2005 for Hurricane Katrina.
1888 JOURNAL OF THE ATMOSPHER IC SC IENCES VOLUME 74
Unauthenticated | Downloaded 12/07/21 12:56 AM UTC

content, and vice versa. In addition, ue is also a useful
tool for diagnosing the interactions between the warm
core and the environment. For instance, Powell (1990)
pointed out that the mechanisms that act to lower ue, if
acting on large-enough scales to modify a significant
portion of the inflowing boundary layer, would result
in a cooling of the warm core and weakening of the
storm. Figure 11 shows the azimuthally averaged ue and
radial wind below 700hPa. Strong contrasts are found in
ue and radial wind before and after the hurricane made
landfall. At the 18-h forecast, when the hurricane is over
the ocean, ue and radial wind structures are quite similar
andwell represented in bothCTL andREV1 (Figs. 11a,f).
It seems that the warm-core ue and inflow/outflow are
slight stronger in REV1 than that in CTL. This is due
mainly to the slightly weaker vertical mixing in REV1
than that in CTL at this time (Figs. 10a,f), which tends
to make the hurricane stronger over ocean (e.g.,
Gopalakrishnan et al. 2013; Zhang et al. 2015). During
hurricane landfall at the 36-h forecast (Figs. 10b,g) in
both CTL and REV1, the warm core becomes weaker
than that at 18 h. Particularly, when hurricanes interact
FIG. 7. Accumulated 24-h precipitation (mm) for (a)–(c) Hurricane Dennis, valid from 1800 UTC 11 Jul to 1800 UTC 12 Jul 2005;
(d)–(f) Hurricane Katrina, valid from 0600UTC 30Aug to 0600UTC 31Aug 2005; (g)–(j) HurricaneRita, valid from 0600UTC 25 Sep to
0600 UTC 26 Sep. (a),(d),(g) CCPA; (b),(e),(h) CTL; and (c),(f),(i) REV1.
JUNE 2017 ZHANG AND PU 1889
Unauthenticated | Downloaded 12/07/21 12:56 AM UTC

with the land surface, the environmental ue around the
warm core in REV1 is weaker than that in CTL. In other
words, a more obvious cold and dry environment around
the warm core resulting from the modified Km contrib-
utes to more efficient hurricane decay. This agrees well
with previous studies that the incorporation of dry and
cold air from the environment by the hurricane’s sec-
ondary circulation along the warm core is an important
reason for hurricane decay (Powell 1990; Kimball 2006).
As a result, the warm core and the inflow/outflow
vanish earlier in REV1 (Figs. 11g–j) than that in CTL
(Figs. 11b–e). The evolution of azimuthally averaged
vertical velocity in Fig. 12 is similar to that in Fig. 11.
During and after landfall, the vertical motion in REV1 is
always weaker than that in CTL. Upon the gradual decay
of the vortex, the vertical motion dissipates in REV1
(Fig. 12j), while it is still active in CTL (Fig. 12e) at the
end of the simulation. Another noticeable characteristic
FIG. 8. Comparison of ETS for (a),(c),(e) 42-h (36–78-h forecasts) and (b),(d),(f) 24-h accumulated precipitation
(54–78-h forecasts) for (a),(b) Hurricane Dennis, (c),(d) Hurricane Katrina, and (e),(f) Hurricane Rita in different
experiments against CCPA precipitation analysis with thresholds of 20, 40, 60, 80, and 100mm.
1890 JOURNAL OF THE ATMOSPHER IC SC IENCES VOLUME 74
Unauthenticated | Downloaded 12/07/21 12:56 AM UTC

in Figs. 11 and 12 is that REV1 produces a lower PBLH
than CTL while the hurricane interacts with the land
surface.
Figure 13 shows the azimuthally averaged ue within a
radius of 300 km from the storm center at 900 hPa ue_900and the ue difference between 900 hPa and surface
(ue_900 minus ue_sfc). Compared to CTL, both ue_900 and
ue_900 2 ue_sfc decrease more rapidly after the hurricane
moves from the ocean to land in REV1, indicating
stronger vertical mixing that results in the rapid de-
crease of ue within the hurricane boundary layer.
Figure 14 compares the azimuthally averaged tem-
perature anomalies and tangential wind speeds between
1000- and 100-hPa pressure levels before, during, and
after hurricane landfall for CTL (left) andREV1 (right).
Over the ocean at the 18-h forecast (Figs. 14a,f), REV1
FIG. 9. Azimuthally averaged surface (a),(b) sensible heat fluxes (Wm22); (c),(d) latent heat fluxes (Wm22); and
(e),(f) total enthalpy fluxes (Wm22) during the evolution of Hurricane Rita from ocean to land throughout the
period of numerical simulations (from 0000UTC 23 Sep to 0600UTC 26 Sep 2005). The x axis represents the radius
from the storm center, and the y axis represents the forecast hour from the initial time. The solid black line rep-
resents the approximate landfall time.
JUNE 2017 ZHANG AND PU 1891
Unauthenticated | Downloaded 12/07/21 12:56 AM UTC

FIG. 10. Azimuthally averaged vertical eddy diffusivity (m2 s21) for momentum Km
(shaded) and the difference between thermal and momentum (Kh minus Km; contour
interval is 5 m2 s21; positive values denoted as a solid line, negative values denoted as
a dashed line) during the evolution of Hurricane Rita from ocean to land at (a),(f) 18-;
(b),(g) 36-; (c),(h) 45-; (d),(i) 54-; and (e),(j) 78-h forecasts. (a)–(e) CTL, and
(f)–(j) REV1. The initial time is 0000 UTC 23 Sep 2005.
1892 JOURNAL OF THE ATMOSPHER IC SC IENCES VOLUME 74
Unauthenticated | Downloaded 12/07/21 12:56 AM UTC

FIG. 11. Azimuthally averaged ue (thin contours; K) and radial wind (shaded; m s21)
below 700 hPa at (a),(f) 18; (b),(g) 36; (c),(h) 45; (d),(i) 54; and (e),(j) 78 h for Hurricane
Rita from 00 UTC 23 Sep 2005. (a)–(e) CTL and (f)–(j) REV1. The x axis represents the
radius from the storm center, and the bold solid line represents PBLH (m).
JUNE 2017 ZHANG AND PU 1893
Unauthenticated | Downloaded 12/07/21 12:56 AM UTC

produces slightly stronger hurricane intensity in terms of
the warm core and tangential wind speed, compared with
CTL. During and after landfall, the hurricane weakens
with obvious decreases in both the warm-core tempera-
ture and the tangential wind (Figs. 14b–e and 14g–j) that
are greater in REV1 than in CTL. Since the cooling of the
upper and middle levels of the storm is ultimately re-
sponsible for the hydrostatic increase in the central pres-
sure necessary to reduce the pressure gradient andweaken
the hurricane after landfall (Shapiro andWilloughby 1982;
Powell 1987), therefore, the simulated hurricane in REV1
decays more efficiently than that in CTL. As a conse-
quence, the hurricane intensity (surface wind, surface
pressure, and its gradient) is well portrayed inREV1 (with
modified Km) but overestimated in CTL (as shown in
Figs. 3 and 6).
The evolution of divergence and vorticity fields also
responded accordingly. Figure 15 illustrates the time-
averaged vertical profile of mean absolute vorticity
(bottom) and divergence (top) within a radius of
300 km from the storm center over ocean (ocean) and
land (right). Compared to CTL, the simulated storm by
REV1 is slightly stronger in terms of lower-level con-
vergence and upper-level divergence over the ocean
(Fig. 15a). When the hurricane moves over land, how-
ever, the convergence/divergence weaken more effec-
tively in REV1 (Fig. 15b) when compared to CTL. The
vorticity fields in Figs. 15c and 15d also indicate that
REV1 tends to produce a storm with a slightly stronger
spiral feature over the ocean but attenuates more
rapidly in case of the hurricane over land when com-
pared to CTL. According to Cram et al. (2007), strong
spiral vortices (as simulated by CTL) tend to result in
the insufficient decay of a hurricane during and after its
landfall.
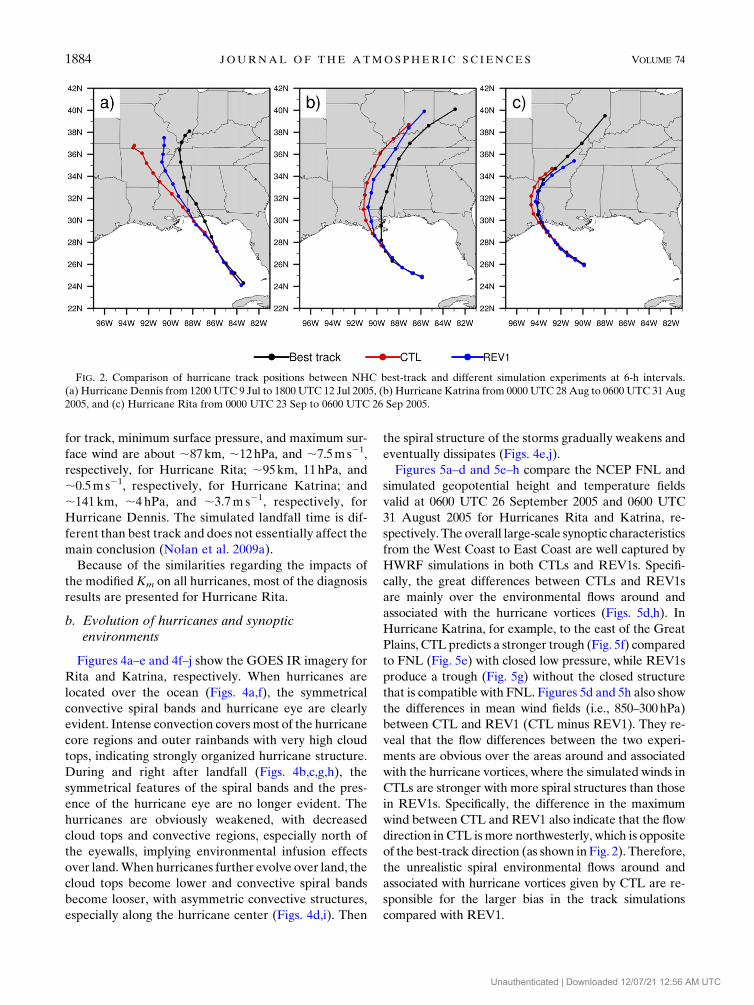
Figure 16 compares the observation-based hurricane
surface wind analysis from NOAA HRD (Powell and
Houston 1996) to the simulated surface wind at the
36-h forecast, valid at 1200 UTC 24 Sep 2005. Results
show that the peak surface wind speed of observation is
located over the ocean, while it is located over the land
in both CTL and REV1. However, compared to the
CTL, REV1 produces more reasonable surface winds
that are closer to the HRD analysis in terms of the
magnitude and distribution of wind speeds. This is es-
pecially true in the east and southeast quadrants (white
box in Fig. 16), where surface winds are over 48m s21 in
CTL in a larger area than that in REV1. Specifically,
the observedmaximumwind speeds are about 49m s21,
and the simulated maximum wind speeds are 54m s21
in CTL and 50m s21 in REV1.
Many previous studies have emphasized the impor-
tance of convective rainbands along the warm core
(Powell 1990; Houze et al. 2006), which act as a barrier
and delineate the transition between the warm-core
region and the environment surrounding the storm
(Willoughby et al. 1984). In addition, the low-level (i.e.,
850 hPa) distribution of ue is also an important in-
dicator of the interactions between hurricane vortices
and environmental air (Powell 1987). Figures 17 and 18
illustrate the horizontal distribution of ue and radar
reflectivity, respectively. When the hurricane is over
the ocean (Figs. 17a,f and 18a,f), both ue and radar re-
flectivity are well organized in the hurricane inner-core
region. The hurricane eye is clear, and outer rainbands
are concentric to the eyewall in both CTL and REV1.
Then, during hurricane landfall (Figs. 17b,g and 18b,g),
the rainbands begin to break up, and the spiral struc-
tures start to deform. Compared with CTL, ue along the
warm core is much weaker in REV1 at northwest and
northeast quadrants, which is important to the weak-
ening of the warm core. The simulated reflectivity
shows that the rainbands in REV1 are similar to CTL at
this time, with broken structures the northeast of the
hurricane center. After landfall, ue and reflectivity
continue to weaken. Figures 17c–e and 17h–j show that,
influenced by the lower ue, the warm core decays more
obviously in REV1 than in CTL. Figures 18c–e and
18h–j also depict that the simulated radar reflectivity in
REV1 is weaker and has a looser and less organized
structure than that in CTL during the evolution over
land, especially after the 54-h forecast. In particular,
the spiral storm structures disappear in REV1, while
they remain in CTL by the end of the simulation
(Figs. 17e,j and 18e,j), implying that the dissipation of
convective rainbands is effective in the simulation with
the modified Km but ineffective in the simulation with
the original parameterization. Furthermore, the
weaker convergence in the modified Km (Fig. 15) also
suggests that the convergence associated with the
convective rainbands is weaker than that in the original
scheme, therefore, inhibiting the development of con-
vective activity.
The evolution of rainband structures agrees well with
the simulated precipitation. For example, Figs. 18d–e
and 18i–j (54–78-h forecasts) indicate that the simulated
reflectivity is stronger and has a more organized struc-
ture in CTL but is weaker and less organized in REV1.
In addition, the simulated reflectivity extends to the
northeast of the hurricane center in REV1 and is missed
in CTL. These characteristics are in accord with the
simulated precipitation as shown and discussed in
Figs. 7g–i. Therefore, the overestimated rainfall amount
and the missed part of the rainfall in the northeast in the
simulationwith the original scheme are ably remedied in
the simulation with modified Km (Figs. 7g–i). Similar
1894 JOURNAL OF THE ATMOSPHER IC SC IENCES VOLUME 74
Unauthenticated | Downloaded 12/07/21 12:56 AM UTC

FIG. 12. As in Fig. 11, but for vertical velocity (310; m s21) below 700 hPa.
JUNE 2017 ZHANG AND PU 1895
Unauthenticated | Downloaded 12/07/21 12:56 AM UTC

results are also found with numerical simulations for
Hurricanes Katrina and Dennis (not shown).
5. Discussion
Previous studies have revealed that the significant
reduction of surface heat and moisture fluxes are mainly
responsible for a hurricane’s decay during its landfall
(Miller 1964; Rosenthal 1971; Powell 1982, 1987;
Kimball 2006). A recent study by Davis et al. (2008)
pointed out that insufficient enthalpy (heat and mois-
ture) exchange with the surface is an unavoidable re-
curring error which occurs when predicting landfalling
hurricanes. Results presented in sections 4 and 5 illus-
trated that the modified Km improves the simulation of
landfalling hurricanes, as it makes vertical mixing in the
PBL more efficient.
To further interpret the effects of the modified Km on
vertical mixing in the PBL, Fig. 19 shows the azimuthally
averaged u*, fm, w*b, and ws during the hurricane evo-
lution from ocean to land based on Eqs. (3) and (6). Over
the core region of the storm, the evolution of u* in the
original Km (Fig. 19a) is similar to the modified Km
(Fig. 19b), as both present a uniform feature over the
ocean and a rapid increase during and shortly after hur-
ricane landfall, as well as its gradual decrease when the
hurricane moves farther inland. Also, the decrease of u*in the modified Km is more obvious than in the original
Km during the 48–78-h forecast. This is mainly because of
the more rapid decay of hurricane surface wind.
Meanwhile, over the core region of the storm, fm
values in both experiments with original (Fig. 19c) and
modified Km schemes (very similar to Fig. 19c, not
shown) are about 0.6–1.0 over the ocean and increase
gradually when the hurricane interacts with the land
surface (greater than 1.0), suggesting that the lower level
of the hurricane is slightly unstable and close to neutral
over the ocean but becomes stable over land, according
to the flux–profile relationship (e.g., Businger et al.
1971). This could also be inferred from Fig. 9 that sur-
face sensible heat flux is positive over ocean but negative
over land. The evolution of w*b
(Fig. 19d) in the modi-
fied Km, however, is significantly larger over the ocean
but decreases rapidly when the hurricane moves inland,
suggesting that w*b
is only important when the hurri-
cane is over the ocean but is negligible when it interacts
with the land surface.
Therefore, during and after hurricane landfall, ws in
the originalKm scheme tends to decrease because of the
large fm as shown in Fig. 19e, according to Eq. (3).
However, in the modified scheme, ws approaches u* as
shown in Fig. 19f, according to Eq. (6). As a result,
vertical mixing in the PBL with the modifiedKm scheme
(Figs. 10g–j) is more efficient than that with the original
scheme (Figs. 10b–e).
On the other hand, when a hurricane evolves over the
ocean, vertical mixing in the PBL (Figs. 10a,f) in the
modified Km is very similar to the original Km with a
maximum reduction at about 22m2s21 (;13%), which is
in agreement with the results of Figs. 19e and 19f: namely,
ws in REV1 is slightly smaller than that in CTL. This
suggests that Eq. (6), which includes the vertical transport
of buoyancy fluxes (kw3
*bz/h) term, does not fundamen-
tally affect vertical mixing in the PBL when compared to
FIG. 13. Azimuthally averaged ue at 900 hPa (shaded; K) and the difference of ue between 900 hPa and surface
(ue_900 minus ue_sfc; contours, dashed for negative; K). The x axis represents the radius from the storm center, and the
y axis represents the forecast hour from the initial time. The horizontal solid black line represents the approximate
landfall time.
1896 JOURNAL OF THE ATMOSPHER IC SC IENCES VOLUME 74
Unauthenticated | Downloaded 12/07/21 12:56 AM UTC

FIG. 14. Azimuthally averaged temperature anomaly (contours; K) and tangential wind
speed (shading;m s21) from 1000 to 100 hPa during the evolution of hurricanes fromocean
to land at (a),(f) 18-; (b),(g) 36-; (c),(h) 45-; (d),(i) 54-; and (e),(j) 78-h forecasts for
Hurricane Rita starting from 0000 UTC 23 Sep 2005. (a)–(e) CTL and (f)–(j) REV1. The
x axis represents the radius from the storm center.
JUNE 2017 ZHANG AND PU 1897
Unauthenticated | Downloaded 12/07/21 12:56 AM UTC
Eq. (3). The finding here agrees with previous findings by
Nicholls (1985) andZhang et al. (2009) that the turbulence
production by buoyancy is less important in the tropical
cyclone. In addition, recent studies by Zhang et al. (2015)
and Gopalakrishnan et al. (2013) used an a method to
modulate the vertical eddy diffusivity. They found this
method could cause an unphysical inconsistency between
the boundary layer and the surface layer schemes. The
modification in this study would not fix this problem be-
cause a 6¼ 1 in this study. However, the patterns of the
simulated vertical eddy diffusivity, as shown in Figs. 10a
and 10f, agree well with their results. The maximum ver-
tical eddy diffusivity is located around the storm center.
Moreover, the magnitude of simulated Km in both CTL
and REV1 over the ocean is also consistent with the ob-
servational results from Zhang et al. (2015).
As stated in section 3, the modification of mixed-layer
velocity scale ws in the REV1 experiment [e.g., Eq. (6)]
is the same as in the YSU scheme but for both stable and
unstable conditions. To further examine the sensitivity
of the simulation of a landfall hurricane to the param-
eterization of vertical eddy diffusivity in PBL, an addi-
tional set of experiments (REV2; see Table 1) that is the
same as the YSU scheme (Hong and Pan 1996), with ws
as defined in Eqs. (3) and (6) under stable and unstable
stratifications, respectively, is conducted for Hurricane
Rita. Results (Fig. 20) indicate that the simulated hur-
ricanes are basically the same as those obtained from the
original HWRF regarding track and intensity, suggest-
ing the important role of the vertical eddy diffusivity in
the predicting landfalling hurricanes.
Moreover, results from this study show that the strong
vertical mixing in the PBL tends to result in a shallow
PBLH (determined by critical Richardson number
method; Troen and Mahrt 1986) during and after the
hurricane landfall (over land; Figs. 11, 12), which is op-
posite to the relationship over the ocean (Kepert 2012).
FIG. 16. Surface wind (m s21) at landfall time (36-h forecast, valid at 1200 UTC 24 Sep 2005) for Hurricane Rita. (a) HRD analysis
(courtesy of http://www.hwind.co/legacy_data/), (b) CTL, and (c) REV1.
FIG. 15. Time-averaged vertical profile of (a),(b) mean divergence
(3105 s21) and (c),(d) absolute vorticity (3104 s21) with a radius of
300 km from storm center over (a),(c) ocean and (b),(d) land.
1898 JOURNAL OF THE ATMOSPHER IC SC IENCES VOLUME 74
Unauthenticated | Downloaded 12/07/21 12:56 AM UTC

FIG. 17. Horizontal ue (K) at 850 hPa for Hurricane Rita during its
evolution from ocean to land at (a),(f) 18-; (b),(g) 36-; (c),(h) 45-;
(d),(i) 54-; and (e),(j) 78-h forecasts from 0000 UTC 23 Sep 2005.
(a)–(e) CTL and (f)–(j) REV1.
JUNE 2017 ZHANG AND PU 1899
Unauthenticated | Downloaded 12/07/21 12:56 AM UTC

FIG. 18. As in Fig. 17, but for composite radar reflectivity (dBZ).
1900 JOURNAL OF THE ATMOSPHER IC SC IENCES VOLUME 74
Unauthenticated | Downloaded 12/07/21 12:56 AM UTC

FIG. 19. As in Fig. 9, but for (a),(b) surface frictional velocity u* (m s21) from (a) CTL and (b) REV1;
(c) dimensionless wind shear at the top of surface layer fm from CTL; (d) convective velocity scale w*b
(m s21)
from REV1; and (e),(f) mixed-layer velocity scale ws (m s21) from (e) CTL and (f) REV1.
JUNE 2017 ZHANG AND PU 1901
Unauthenticated | Downloaded 12/07/21 12:56 AM UTC

To explain the reason behind these differences, the
definition of PBLH has to be revisited. In theory, Kepert
(2012) indicates that the maximum and mean Km could
be derived as follows:
Kmax
5 ku*hpp
(p1 1)p11and (8)
K5ku*h
(p1 1)(p1 2). (9)
It is apparent that bothKmax andK are proportional to h,
or vice versa. Specifically, in Kepert’s study, the hurri-
cane boundary layer is assumed to be near neutral,
which could be reasonable for a hurricane over the
ocean because fm is near 1.0 (Fig. 19c) and u* tends to
be uniform with time (Figs. 19a,b). During and after
hurricane landfall, however, both fm and u* change
significantly (Figs. 19a–c). The influence of u* and fm
terms on Km becomes significant (Fig. 19) over land;
thus, fm should also be considered in Eqs. (8) and (9).
Taking Eq. (3), for instance, Eqs. (8) and (9) become
Kmax
5 ku*fm
hpp
(p1 1)p11and (10)
K5k(u*/fm
)h
(p1 1)(p1 2). (11)
Therefore, both Kmax and K are not linearly pro-
portional to h. This explains the reason why the PBLH is
not proportional to vertical mixing in the PBL during
hurricanes evolution over land, or vice versa.
To further confirm the rationality of PBLH evolution in
CTL and REV1 (Figs. 11, 12), Fig. 21 compares the bulk
Richardson number (Rib 5 gDuyDz/fuy[(DU)2 1 (DV)2]g;Stull 1988), which is an important scale to represent
atmospheric stability. Results show that Rib increased
gradually during hurricane evolution from ocean to land,
especially in REV1. As a consequence, the efficient in-
crease of Rib in the PBL with the modified Km would
produce a shallow PBLH according to the definition of
PBLH in HWRF, as mentioned in section 3.
6. Concluding remarks
Hurricanes undergo a weakening process during their
evolution that depends on the surface and atmospheric
conditions over land. Based on studies of the landfalls of
three hurricanes (Dennis, Rita, and Katrina) in 2005,
this paper evaluates the effects of vertical eddy diffu-
sivity parameterizations for momentum Km on the
simulated tracks, intensities, and structures of the hur-
ricanes and their associated QPFs. It is found that the
vertical eddy diffusivity in the original HWRF tends to
produce stronger hurricanes than the observations with
much lower surface pressures, stronger surface winds,
and larger track errors during their evolution over land.
With the modified Km based on the change of the
mixed-layer velocity scale for both stable and unstable
FIG. 20. As in Fig. 3, but for the comparison between CTL and REV2 experiments against NHC best-track data.
1902 JOURNAL OF THE ATMOSPHER IC SC IENCES VOLUME 74
Unauthenticated | Downloaded 12/07/21 12:56 AM UTC

conditions, vertical mixing in the hurricane boundary
layer becomes efficient over land, leading to more re-
alistic and efficient hurricane decay over land. As a
result, the simulated hurricane track, intensity, and
QPFs are improved.
Further diagnoses show that, because of the modifi-
cation of Km, both the kinematic and thermodynamic
structures of the hurricane vortices are well portrayed.
Specifically, the impacts of vertical eddy diffusivity pa-
rameters are mainly on hurricane inner-core structures.
Overall, with the efficient vertical mixing in the hurri-
cane boundary layer, the simulated storms are weaker
and have a shallower PBL, weaker inflow/outflow,
weaker warm core, and weaker spiral wind structure, as
well as weaker, looser, and less organized convective
rainbands.
The framework proposed in this study is expected to
be useful for understanding the role of vertical mixing
in the PBL parameterization on landfalling hurricanes
and their evolution, especially over land. Results in this
study should have implications for future improve-
ments in PBL schemes. However, it should be noted
that the results of this study should not be used as a
commentary on how to improve the parameterization
of the vertical eddy diffusivity in HWRF since the
sensitivity experiments in this study focused on only
three hurricanes that made landfall in the Gulf of
Mexico and underwent decay processes. Future work
should focus on more landfall cases with a larger sam-
ple size, as well as on hurricane reintensification over
land. In addition, the mismatches between the surface-
layer and boundary layer schemes, as well as the asso-
ciated impacts on hurricane evolution, also deserve
further discussion when turbulence observations within
the hurricane boundary layer are available, especially
during and after hurricane landfall. In addition, land-
surface processes (soil state, etc.) and surface-layer pa-
rameterization should also be considered in future
work in order to fully address the interaction between
hurricane vortices and land processes.
Acknowledgments. This study is supported by National
Science Foundation AwardAGS-1243027 (Pu and Zhang),
Office of Naval Research Award N000141612491 (Pu), and
NOAAGrantNA14NWS4680025 (Pu).High-performance
computing support fromYellowstone (ark:/85065/d7wd3xhc),
provided by NCAR’s Computational and Information
Systems Laboratory (CISL) and the Center for High-
Performance Computing (CHPC) at the University of
Utah, are greatly appreciated. Comments from Prof.
Chun-Chieh Wu and three anonymous reviewers were
very helpful for improving the early version of the
manuscript.
REFERENCES
Bao, J.W., S. A.Michelson, and J. M.Wilczak, 2002: Sensitivity of
numerical simulations to parameterizations of roughness for
surface heat fluxes at high winds over the sea. Mon. Wea.
Rev., 130, 1926–1932, doi:10.1175/1520-0493(2002)130,1926:
SONSTP.2.0.CO;2.
Beven, J., 2005: Tropical cyclone report: Hurricane Dennis,
4–13 July 2005. NOAA/National Hurricane Center Rep.,
25 pp. [Available online at http://www.nhc.noaa.gov/data/
tcr/AL042005_Dennis.pdf.]
Bluestein, H. B., and D. S. Hazen, 1989: Doppler-radar analysis
of a tropical cyclone over land: Hurricane Alicia (1983) in
Oklahoma. Mon. Wea. Rev., 117, 2594–2611, doi:10.1175/
1520-0493(1989)117,2594:DRAOAT.2.0.CO;2.
Braun, S. A., and W. K. Tao, 2000: Sensitivity of high-resolution
simulations of Hurricane Bob (1991) to planetary boundary
layer parameterizations. Mon. Wea. Rev., 128, 3941–3961,
doi:10.1175/1520-0493(2000)129,3941:SOHRSO.2.0.CO;2.
FIG. 21. As in Fig. 9, but for Rib at 900 (shaded) and 850 hPa (contours) in (a) CTL and (b) REV1.
JUNE 2017 ZHANG AND PU 1903
Unauthenticated | Downloaded 12/07/21 12:56 AM UTC
Brettschneider, B., 2008: Climatological hurricane landfall proba-
bility for theUnited States. J. Appl.Meteor. Climatol., 47, 704–
716, doi:10.1175/2007JAMC1711.1.
Businger, J. A., J. C. Wyngaard, Y. Izumi, and E. F. Bradley, 1971:
Flux-profile relationships in the atmospheric surface layer.
J.Atmos. Sci., 28, 181–189, doi:10.1175/1520-0469(1971)028,0181:
FPRITA.2.0.CO;2.
Chen, S. S.,W.Zhao,M.A.Donelan, J. F. Price, andE. J.Walsh, 2007:
The CBLAST-Hurricane Program and the next-generation
fully coupled atmosphere–wave–ocean models for hurricane
research and prediction. Bull. Amer. Meteor. Soc., 88, 311–317,
doi:10.1175/BAMS-88-3-311.
Cione, J., E. A. Kalina, J. A. Zhang, and E. W. Uhlhorn, 2013:
Observations of air–sea interaction and intensity change in
hurricanes. Mon. Wea. Rev., 141, 2368–2382, doi:10.1175/
MWR-D-12-00070.1.
Cram, T. A., J. Persing, M. T. Montgomery, and S. A. Braun, 2007:
A Lagrangian trajectory view on transport and mixing pro-
cesses between the eye, eyewall, and environment using a
high-resolution simulation of Hurricane Bonnie (1998).
J. Atmos. Sci., 64, 1835–1856, doi:10.1175/JAS3921.1.
Davis, C., and Coauthor, 2008: Prediction of landfalling hurricanes
with the Advanced Hurricane WRF Model. Mon. Wea. Rev.,
136, 1990–2005, doi:10.1175/2007MWR2085.1.
Doyle, J. D., and Coauthors, 2014: Tropical cyclone prediction
using COAMPS-TC. Oceanography, 27 (3), 104–115,
doi:10.5670/oceanog.2014.72.
Elsberry, R. L., 2002: Predicting hurricane landfall precipitation:
Optimistic and pessimistic views from the symposium on pre-
cipitation extremes. Bull. Amer. Meteor. Soc., 83, 1333–1339,
doi:10.1175/1520-0477(2002)083,1333:PHLPOA.2.3.CO;2.
Emanuel, K. A., 1995: Sensitivity of tropical cyclones to surface
exchange coefficients and a revised steady-state model in-
corporating eye dynamics. J. Atmos. Sci., 52, 3969–3976,
doi:10.1175/1520-0469(1995)052,3969:SOTCTS.2.0.CO;2.
Farfán, L. M., and J. A. Zehnder, 2001: An analysis of the landfall of
Hurricane Nora (1997). Mon. Wea. Rev., 129, 2073–2088,
doi:10.1175/1520-0493(2001)129,2073:AAOTLO.2.0.CO;2.
Gopalakrishnan, S. G., F. Marks, J. A. Zhang, X. Zhang, J.W. Bao,
and V. Tallapragada, 2013: A study of the impacts of vertical
diffusion on the structure and intensity of the tropical cyclones
using the high-resolution HWRF system. J. Atmos. Sci., 70,
524–541, doi:10.1175/JAS-D-11-0340.1.
Hong, S. Y., and H. L. Pan, 1996: Nonlocal boundary layer vertical
diffusion in a medium-range forecast model. Mon. Wea.
Rev., 124, 2322–2339, doi:10.1175/1520-0493(1996)124,2322:
NBLVDI.2.0.CO;2.
——, Y. Noh, and J. Dudhia, 2006: A new vertical diffusion
package with an explicit treatment of entrainment processes.
Mon. Wea. Rev., 134, 2318–2341, doi:10.1175/MWR3199.1.
Hou, D., and Coauthors, 2014: Climatology-calibrated precipita-
tion analysis at fine scales: Statistical adjustment of stage IV
toward CPC gauge-based analysis. J. Hydrometeor., 15, 2542–
2557, doi:10.1175/JHM-D-11-0140.1.
Houze, R. A., and Coauthors, 2006: The Hurricane Rainband and
Intensity Change Experiment: Observations and modeling of
Hurricanes Katrina, Ophelia, and Rita. Bull. Amer. Meteor.
Soc., 87, 1503–1521, doi:10.1175/BAMS-87-11-1503.
Janjic, Z. I., R. Gall, andM. E. Pyle, 2010: Scientific documentation
for the NMM solver. NCAR Tech. Note NCAR/TN–
4771STR, 53 pp., doi:10.5065/D6MW2F3Z.
Kaplan, J., and M. DeMaria, 2001: On the decay of tropical cy-
clone winds after landfall in the New England area. J. Appl.
Meteor., 40, 280–286, doi:10.1175/1520-0450(2001)040,0280:
OTDOTC.2.0.CO;2.
Kepert, J. D., 2001: The dynamics of boundary layer jets within
the tropical cyclone core. Part I: Linear theory. J. Atmos.
Sci., 58, 2469–2484, doi:10.1175/1520-0469(2001)058,2469:
TDOBLJ.2.0.CO;2.
——, 2012: Choosing a boundary layer parameterization for trop-
ical cyclone modeling. Mon. Wea. Rev., 140, 1427–1445,
doi:10.1175/MWR-D-11-00217.1.
Kimball, S. K., 2006:Amodeling study of hurricane landfall in a dry
environment. Mon. Wea. Rev., 134, 1901–1918, doi:10.1175/
MWR3155.1.
Knabb, R. D., J. R. Rhome, and D. P. Brown, 2005: Tropical cy-
clone report: Hurricane Katrina, 23–30 August 2005. NOAA/
National Hurricane Center Rep., 43 pp. [Available online at
http://www.nhc.noaa.gov/data/tcr/AL122005_Katrina.pdf.]
——, ——, and ——, 2006: Tropical cyclone report: Hurricane
Rita, 18–26 September 2005. NOAA/National Hurricane
Center Rep., 33 pp.
Kurihara, Y., and R. E. Tuleya, 1974: Structure of a tropical cy-
clone developed in a three-dimensional numerical simula-
tion model. J. Atmos. Sci., 31, 893–919, doi:10.1175/
1520-0469(1974)031,0893:SOATCD.2.0.CO;2.
Li, X., and Z. Pu, 2008: Sensitivity of numerical simulation of
early rapid intensification of Hurricane Emily (2005) to cloud
microphysical and planetary boundary layer parameteriza-
tions. Mon. Wea. Rev., 136, 4819–4838, doi:10.1175/
2008MWR2366.1.
Liu, Q., N. Surgi, S. Lord, W. S. Wu, S. Parrish, S. Gopalakrishnan,
J. Waldrop, and J. Gamache, 2006: Hurricane initialization in
HWRF Model. 27th Conf. on Hurricanes and Tropical Me-
teorology, Monterey, CA, Amer. Meteor. Soc., 8A.2.
[Available online at https://ams.confex.com/ams/pdfpapers/
108496.pdf.]
Marks, F. D., and L. K. Shay, 1998: Landfalling tropical cy-
clones: Forecast problems and associated research oppor-
tunities. Bull. Amer. Meteor. Soc., 79, 305–323, doi:10.1175/
1520-0477(1998)079,0305:LTCFPA.2.0.CO;2.
Mellor, G. L., 2004: Users guide for a three-dimensional, primitive
equation, numerical ocean model. Program in Atmospheric
and Oceanic Sciences, Princeton University Rep., 56 pp.
Miller, B. I., 1964: A study on the filling of Hurricane Donna
(1960) over land. Mon. Wea. Rev., 92, 389–406, doi:10.1175/
1520-0493(1964)092,0389:ASOTFO.2.3.CO;2.
Nicholls, S., 1985: Aircraft observations of the Ekman layer during
the Joint Air–Sea Interaction Experiment. Quart. J. Roy.
Meteor. Soc., 111, 391–426, doi:10.1002/qj.49711146807.
Noh, Y., W. G. Cheon, S. Y. Hong, and S. Raasch, 2003: Im-
provement of the K-profile model for the planetary boundary
layer based on large eddy simulation data. Bound.-Layer
Meteor., 107, 401–427, doi:10.1023/A:1022146015946.
Nolan, D. S., J. A. Zhang, and D. P. Stern, 2009a: Evaluation of
planetary boundary layer parameterizations in tropical cyclones
by comparison of in situ data and high-resolution simulations of
Hurricane Isabel (2003). Part I: Initialization, maximum winds,
and outer core boundary layer structure. Mon. Wea. Rev., 137,
3651–3674, doi:10.1175/2009MWR2785.1.
——, D. P. Stern, and J. A. Zhang, 2009b: Evaluation of planetary
boundary layer parameterizations in tropical cyclones by
comparison of in situ observations and high-resolution simu-
lations of Hurricane Isabel (2003). Part II: Inner-core
boundary layer and eyewall structure. Mon. Wea. Rev., 137,
3675–3698, doi:10.1175/2009MWR2786.1.
1904 JOURNAL OF THE ATMOSPHER IC SC IENCES VOLUME 74
Unauthenticated | Downloaded 12/07/21 12:56 AM UTC

Parrish, J. R., R. W. Burpee, F. D. Marks, and R. Grebe, 1982:
Rainfall patterns observed by digitized radar during the
landfall of Hurricane Frederic (1979). Mon. Wea. Rev.,
110, 1933–1944, doi:10.1175/1520-0493(1982)110,1933:
RPOBDR.2.0.CO;2.
Powell, M. D., 1982: The transition of the Hurricane Frederic
boundary layer wind fields from the open Gulf of Mexico to
landfall. Mon. Wea. Rev., 110, 1912–1932, doi:10.1175/
1520-0493(1982)110,1912:TTOTHF.2.0.CO;2.
——, 1987: Changes in the low-level kinematic and thermodynamic
structure of Hurricane Alicia (1983) at landfall. Mon. Wea.
Rev., 115, 75–99, doi:10.1175/1520-0493(1987)115,0075:
CITLLK.2.0.CO;2.
——, 1990: Boundary layer structure and dynamics in outer hur-
ricane rainbands. Part II: Downdraft modification and mixed
layer recovery. Mon. Wea. Rev., 118, 918–938, doi:10.1175/
1520-0493(1990)118,0918:BLSADI.2.0.CO;2.
——, and S. H. Houston, 1996: Hurricane Andrew’s landfall in
south Florida. Part II: Surface wind fields and potential real-
time applications. Wea. Forecasting, 11, 329–349, doi:10.1175/
1520-0434(1996)011,0329:HALISF.2.0.CO;2.
Pu, Z., X. Li, and J. Sun, 2009: Impact of airborne Doppler radar
data assimilation on the numerical simulation of intensity
changes of HurricaneDennis near a landfall. J. Atmos. Sci., 66,
3351–3365, doi:10.1175/2009JAS3121.1.
Riemer, M., M. T. Montgomery, and M. E. Nicholls, 2010: A new
paradigm for intensity modification of tropical cyclones:
Thermodynamic impact of vertical wind shear on the inflow
layer. Atmos. Chem. Phys., 10, 3163–3188, doi:10.5194/
acp-10-3163-2010.
Rosenthal, S. L., 1971: The response of a tropical cyclonemodel to
variations in boundary layer parameters, initial conditions,
lateral boundary conditions, and domain size. Mon. Wea.
Rev., 99, 767–777, doi:10.1175/1520-0493(1971)099,0767:
TROATC.2.3.CO;2.
Shapiro, L. J., andH. E.Willoughby, 1982: The response of balanced
hurricanes to local sources of heat and momentum. J. Atmos.
Sci., 39, 378–394, doi:10.1175/1520-0469(1982)039,0378:
TROBHT.2.0.CO;2.
Shelton, K. L., and J. Molinari, 2009: Life of a six-hour hurricane.
Mon. Wea. Rev., 137, 51–67, doi:10.1175/2008MWR2472.1.
Sirutis, J. J., andK.Miyakoda, 1990: Subgrid scale physics in 1-month
forecasts. Part I: Experiment with four parameterization
packages. Mon. Wea. Rev., 118, 1043–1064, doi:10.1175/
1520-0493(1990)118,1043:SSPIMF.2.0.CO;2.
Skamarock, W. C., and Coauthors, 2008: A description of the
Advanced Research WRF version 3. NCAR Tech. Note
NCAR/TN-4751STR, 113 pp., doi:10.5065/D68S4MVH.
Smith, R. K., 2003: A simple model of the hurricane boundary
layer.Quart. J. Roy.Meteor. Soc., 129, 1007–1027, doi:10.1256/
qj.01.197.
Stull, R. B., 1988: An Introduction to Boundary Layer Meteorol-
ogy. Atmospheric and Oceanographic Sciences Library,
Vol. 13, Kluwer Academic Publishers, 670 pp., doi:10.1007/
978-94-009-3027-8.
Tallapragada, V., and Coauthors, 1986: A simple model of the
atmospheric boundary layer; sensitivity to surface evapora-
tion. Bound.-Layer Meteor., 37, 129–148, doi:10.1007/
BF00122760.
——, and Coauthors, 2014: Hurricane Weather Research and
Forecasting (HWRF) Model: 2014 scientific documentation.
Developmental Testbed Center Tech. Rep., 105 pp.
Troen, I. B., and L. Mahrt, 1986: A simple model of the atmo-
spheric boundary layer: Sensitivity to surface evaporation.
Bound.-Layer Meteor., 37, 129–148, doi:10.1007/BF00122760.
Tuleya, R. E., andY.Kurihara, 1978:A numerical simulation of the
landfall of tropical cyclones. J. Atmos. Sci., 35, 242–257,
doi:10.1175/1520-0469(1978)035,0242:ANSOTL.2.0.CO;2.
Whitehead, J. C., 2003: One million dollars per mile? The oppor-
tunity costs of hurricane evacuation. Ocean Coastal Manage.,
46, 1069–1083, doi:10.1016/j.ocecoaman.2003.11.001.
Wilks, D. S., 1995: Statistical Methods in Atmospheric Sciences: An
Introduction. Academic Press, 467 pp.
Willoughby, H. E., F. D. Marks, and R. J. Feinberg, 1984: Sta-
tionary and propagating convective bands in asymmetric
hurricanes. J. Atmos. Sci., 41, 3189–3211, doi:10.1175/
1520-0469(1984)041,3189:SAMCBI.2.0.CO;2.
Wu, C. C., and Y. H. Kuo, 1999: Typhoon affecting Taiwan: Cur-
rent understanding and future challenges.Bull. Amer. Meteor.
Soc., 80, 67–80, doi:10.1175/1520-0477(1999)080,0067:
TATCUA.2.0.CO;2.
——, T. H. Yen, Y. H. Huang, C. K. Yu, and S. G. Chen, 2016:
Statistical characteristic of heavy rainfall associated with ty-
phoon near Taiwan based on high-density automatic rain
gauge data. Bull. Amer. Meteor. Soc., 97, 1363–1375,
doi:10.1175/BAMS-D-15-00076.1.
Zhang, J. A., and W. M. Drennan, 2012: An observational
study of vertical eddy diffusivity in the hurricane boundary
layer. J. Atmos. Sci., 69, 3223–3236, doi:10.1175/
JAS-D-11-0348.1.
——, ——, P. G. Black, and J. R. French, 2009: Turbulence
structure of the hurricane boundary layer between the outer
rainbands. J. Atmos. Sci., 66, 2455–2467, doi:10.1175/
2009JAS2954.1.
——, F. D. Marks, M. T. Montgomery, and S. Lorsolo, 2011:
An estimation of turbulent characteristics in the low-level
region of intense Hurricanes Allen (1980) and Hugo
(1989). Mon. Wea. Rev., 139, 1447–1462, doi:10.1175/
2010MWR3435.1.
——, S. Gopalakrishnan, F. Marks, R. F. Rogers, and
V. Tallapragada, 2012: A developmental framework for im-
proving hurricane model physical parameterizations using
aircraft observations. Trop. Cyclone Res. Rev., 1, 419–429,doi:10.6057/2012TCRR04.01.
——, R. F. Rogers, P. D. Reasor, E. W. Uhlhorn, and F. D. Marks,
2013: Asymmetric hurricane boundary layer structure from
dropsonde composites in relation to the environmental verti-
cal wind shear. Mon. Wea. Rev., 141, 3968–3984, doi:10.1175/
MWR-D-12-00335.1.
——, D. S. Nolan, R. F. Rogers, and V. Tallapragada, 2015: Eval-
uating the impact of improvements in the boundary layer
parameterization on hurricane intensity and structure fore-
casts in HWRF.Mon. Wea. Rev., 143, 3136–3155, doi:10.1175/
MWR-D-14-00339.1.
Zhu, P., 2008: Impact of land surface roughness on surface winds
during hurricane landfall. Quart. J. Roy. Meteor. Soc., 134,
1051–1057, doi:10.1002/qj.265.
——, and J. Furst, 2013: On the parameterization of surface mo-
mentum transport via drag coefficient in low wind conditions.
Geophys. Res. Lett., 40, 2824–2828, doi:10.1002/grl.50518.
——, K. Menelaou, and Z. D. Zhu, 2014: Impact of subgrid-scale
vertical turbulent mixing on eyewall asymmetric structures
and mesovortices of hurricanes. Quart. J. Roy. Meteor. Soc.,
140, 416–438, doi:10.1002/qj.2147.
JUNE 2017 ZHANG AND PU 1905
Unauthenticated | Downloaded 12/07/21 12:56 AM UTC