![Compressed sensing and applications in positioning, audio …users.ics.forth.gr/~tsakalid/PAPERS/VALENCIA_Talk_2011... · 2015. 12. 19. · Compressed Sensing [Donoho06][Tao06] Heart](https://static.fdocuments.in/doc/165x107/60e01b5e56d1544b94735e13/compressed-sensing-and-applications-in-positioning-audio-usersicsforthgrtsakalidpapersvalenciatalk2011.jpg)
Effects of Time-Compressed Audio and Adjunct Images on ...
163
Effects of Time-Compressed Audio and Adjunct Images on Learner Recall, Recognition, and Satisfaction by Albert Dieter Ritzhaupt A dissertation submitted in partial fulfillment of the requirements for the degree of Doctor of Philosophy Department of Secondary Education College of Education University of South Florida Major Professor: Ann E. Barron, Ed.D. James A. White, Ph.D. Robert F. Dedrick, Ph.D. Jeffery D. Kromrey, Ph.D. Date of Approval: December 13, 2007 Keywords: multimedia learning, representational images, cued-recall, content recognition, learner satisfaction © Copyright 2008 , Albert D. Ritzhaupt
Transcript of Effects of Time-Compressed Audio and Adjunct Images on ...

Effects of Time-Compressed Audio and Adjunct Images on Learner Recall, Recognition, and Satisfaction
by
Albert Dieter Ritzhaupt
A dissertation submitted in partial fulfillment of the requirements for the degree of
Doctor of Philosophy Department of Secondary Education
College of Education University of South Florida
Major Professor: Ann E. Barron, Ed.D. James A. White, Ph.D.
Robert F. Dedrick, Ph.D. Jeffery D. Kromrey, Ph.D.
Date of Approval: December 13, 2007
Keywords: multimedia learning, representational images, cued-recall, content recognition, learner satisfaction
© Copyright 2008 , Albert D. Ritzhaupt
Dedication
I dedicate my dissertation to my loving and caring family for their ongoing
support of this process. In particular, my brother, Fred Ritzhaupt, and mother, Wei Wei
Ritzhaupt, have been instrumental in helping me achieve my educational and professional
goals and nurturing my need for personal growth. Without my family’s support, I could
not have successfully completed this process. Thank you.
Acknowledgements
I would like to thank the faculty mentors that have helped me in my doctoral
journey. Dr. Ann Barron has been an excellent major professor, mentor and motivator
throughout my doctoral experience. My committee members, Dr. James White, Dr
Robert Dedrick, and Dr. Jeffery Kromrey have also been very helpful in providing me
guidance and feedback. In particular, Dr Dedrick has been very supportive in providing
me guidance on the appropriate statistical methods to use in my research and
measurement theory. I would also like to thank Dr William Kealy for being an early
mentor in this process, and providing a solid foundation in experimental research design.

i
Table of Contents
List of Tables iv List of Figures vi Abstract vii Chapter One: Introduction 1
Context of the Problem 1 Purpose of Research 4
Research Questions 5 Main Effects 5 Interaction Effects 6
Hypotheses 7 Limitations and Delimitations 8 Summary 9 Definition of Terms 9
Chapter Two: Literature Review 13
Audio-Compression Technology and Higher Education 13 Time-Compression Technology 14 Application to Higher Education 16
Research on Time-Compressed Speech 17 Summary 21
Research on Multimedia with Narration 22 Summary 26
Theoretical Framework 27 Sensory Modality and Memory 28 Working Memory 29 Dual-Processing 30 Limited Capacity and Cognitive Load 32 Long-Term Memory 34
Rationale for Time-Compressed Speech in Multimedia 34 Summary 38
Chapter Three: Method 39
Research Design and Participants 39 Materials and Measures 40
Text and Adjunct Images 40 Criterion Measures 46 Computer Programs 48
Procedures 49

ii
Data Analysis 53 Pilot Study Results 53 Summary 55
Chapter Four: Results 56
Overall Descriptive Statistics 56 Relationships among Dependent Measures 61 Cued-Recall 62
Descriptive Statistics 62 Analysis of Variance 62
Content Recognition 65 Descriptive Statistics 65 Analysis of Variance 65
Learner Satisfaction 68 Descriptive Statistics 68 Exploratory Factor Analysis 70 Analysis of Variance 71
Summary 74 Chapter Five: Discussion 75
Summary of Research Questions and Results 76 Cued-Recall. 76 Content Recognition. 77 Learner Satisfaction. 78 Discussion of Results 78
Cued-Recall 79 Content Recognition 80 Cued-Recall and Content Recognition 81 Summary of Findings 83
Recommendations to Stakeholders 84 Learners 84 Instructors and Instructional Designers 85 Researchers 86
Final Summary 88 References 90 Appendices 97
Appendix A: Adjunct Pictures and Discovering Australia Text. 98 Appendix B: Recall-Australia Instrument and Rubric. 109 Appendix C: Recognition-Australia Instrument and Answers. 115 Appendix D: Satisfaction-Australia Instrument. 119 Appendix E: Background Survey. 120 Appendix F: Buffer Story - How the Water got to the Plains. 121 Appendix G: Research Introduction Script. 122 Appendix H. Computer Program Instructions and Examples. 123

iii
Appendix I: Expert Review Materials. 144 Appendix J: Example Sign Up Sheet. 149 Appendix K: Pilot Study Graphics. 150
About the Author 152

iv
List of Tables
Table 1. Previous Studies on Speech Speed 17
Table 2. Previous Studies on Speech in Multimedia Learning 22
Table 3. Research Design and Independent Variables 39
Table 4. Expert Review Summary with Pictures and Mean Response
by Category 42
Table 5. Estimated Intervention Speeds and Words per Minute (wpm) 48
Table 6. Participant Distribution to Treatment Groups 56
Table 7. Descriptive Statistics for Cued-Recall by Treatment Conditions 58
Table 8. Descriptive Statistics for Content Recognition by Treatment
Conditions 59
Table 9. Descriptive Statistics for Content Recognition by Treatment
Conditions 60
Table 10. Correlation Matrix among Dependent Measures 61
Table 11. Mean, Standard Deviation and Confidence Intervals for Scaled
Cued-recall by Audio Speed and Adjuct Image 62
Table 12. Analysis of Variance for Cued-Recall. 63
Table 13. Mean, Standard Deviation and Confidence Intervals for Scaled
Content Recognition by Audio Speed and Adjunct Image 65
Table 14. Analysis of Variance for Content Recognition 66
Table 15. Mean, Standard Deviation and Confidence Intervals for Scaled
Satisfaction by Audio Speed and Adjunct Image 68
v
Table 16. Satisfaction Scale: Response Frequency Percentages, Mean
and Standard Deviation (Likert scale items) 69
Table 17. Satisfaction Scale: Response Frequency Percentages, Mean
and Standard Deviation (Semantic Differential scale items) 70
Table 18. Analysis of Variance for Learner Satisfaction 71
Table 19. Tukey Pair-wise Comparisons of Audio Speed on Learner
Satisfaction 73

vi
List of Figures
Figure 1. Linear time-compression illustration. 15
Figure 2. Interface for time-compression in Windows Media Player 10.0. 16
Figure 4. Modified cognitive model for multimedia learning representing
previous research in time-compression. 36
Figure 5. Modified cognitive model for multimedia learning representing
current research in time-compression. 37
Figure 6. City of Sydney passage from Discovering Australia. 44
Figure 7. City of Sydney, example picture. 45
Figure 8. Feature information map with introductory passage. 50
Figure 9. Neutral map of Australia. 51
Figure 10. Research intervention sequence. 53
Figure 11. Mean percent cued-recall by Audio Speed and Adjunct Image
treatments. 64
Figure 12. Mean percent recognition by Audio Speed and Adjunct Image
treatments. 67
Figure 13. Mean percent learner satisfaction by Audio Speed and Adjunct
Image treatments. 72

vii
Effects of Time-Compressed Audio and Adjunct Images on Learner Recall, Recognition, and Satisfaction
Albert Dieter Ritzhaupt
Abstract
The purpose of this study was to investigate the effect of time-compressed
narration and representational adjunct images on undergraduate college students’ 1)
ability to recall and recognize information in a multimedia learning environment, and 2)
overall satisfaction with this type of learning environment. The goals of this research
were to shed light on time-compression technology incorporated into multimedia learning
environments, help fill the existing gap in the research literature by merging two disjoint
bodies of research, and aid instructors and instructional designers to better understand
time-compression technology while creating rigorous multimedia materials.
This research was guided by the underlying principles of multimedia learning.
The experiment was a 4 Audio Speeds (1.0 = normal vs. 1.5 = moderate vs. 2.0 = fast vs.
2.5 = fastest rate) x Adjunct Image (Image Present vs. Image Absent) factorial design.
Audio speed and adjunct image both served as between subject conditions. Cued-recall,
content recognition and learner satisfaction served as the dependent measures.
Multimedia interventions were developed to execute this design.
A total of 305 research participants were recruited from a public, southeastern
university in the United States in this study. Fifty-five percent of the participants were
male and 92% indicated that English was their primary language. Forty-nine percent of
the participants were junior classification, 4% were freshman, 19% were sophomore,

viii
26% were seniors, with the remaining indicating other. The median age of the
participants was 22, and ranges in age from 18 to 53 years old.
Data were analyzed using a series of factorial Analysis of Variance (ANOVA)
procedures. Results showed statistically significant differences at 2.5 times the normal
audio speed, in which performance on cued-recall and content recognition tasks was
significantly lower than other audio speeds. Furthermore, representational adjunct images
had a significant positive effect on cued-recall, but not content recognition. Participants
in the normal audio speed and picture present groups were significantly more satisfied
than other treatments. Recommendations for future research are provided as well as
advice for instructors, instructional designers and learners interested in time-compression
technology.

1
Chapter One
Introduction
Multimedia can be defined as the presentation of information using both words
and pictures (Mayer, 2001). Over the past century, there has been tremendous growth in
interest and research on multimedia, especially relating to learning. The design and
delivery of multimedia learning environments are based on principles and guidelines
derived from theory, empirical research, and professional experience (Sabatini, 2001).
As technology changes, further empirical research and theory development are necessary
to demonstrate its efficiency and effectiveness for learning. Because technology
advances at such a rapid pace, the process of conducting rigorous empirical research and
developing theory is ongoing.
Context of the Problem
Digitally recorded audio is commonly integrated into multimedia learning
environments (Moreno & Mayer, 2002). Audio can be broken into three main elements:
narration (speech), sound effects, and music (Beccue, Vila & Whitley, 2001). Narration
is the speech or dialog that can be used to deliver an instructional message. Narration or
speech, unlike its textual counterpart, is inherently time-dependent. In fact, the use of
narration can actually increase the time required by a learner to complete a multimedia
program (Barron & Kysilka, 1993; Koroghlanian & Sullivan, 2000).
The goal of an instructional designer in a business or industry setting is to
maximize a learner’s comprehension and satisfaction, while minimizing the amount of
time a learner will spend on a learning task. The philosophy behind this goal is simple:

2
time is money, and in a business or industry setting, both time and money are limited
resources. This goal may not be the same in the context of higher education, however.
Faculty members and instructional designers in higher education often try to develop
learning materials that will pique their students’ interests and engage them in learning
material for longer durations. After all, time on task is a well-documented instructional
requirement for effective learning (Stallings, 1980). However, students in higher
education often have an inconsistent goal in which they may attempt to minimize the
amount of time on task with the maximum level of comprehension.
Both of the aforementioned scenarios pose an interesting instructional design and
research problem. Previous research shows that conversational speech typically takes
place at approximately 150 words per minute (wpm) (Benz, 1971; Nichols & Stevens,
1957), and has demonstrated that normal speech can be increased to 200 to 300 wpm,
with minimal loss in comprehension (Barabasz, 1968; Foulke & Sticht, 1967; Goldhaber,
1970). If multimedia materials can potentially increase the amount of time a learner
spends on a learning task, than students, business and industry could potentially benefit
from the use of time-compression technology to reduce the amount of time on task.
Time-compressed speech speeds are expressed in two primary forms in research
literature. One way is to express the speed as the number of words that can be spoken in a
minute. Another way is to represent the speed as a rate in which the speed is relative to a
normal speed. For example, if the average person speaks 150 wpm, and this speech is
accelerated to 300 wpm, than the speech rate or audio rate is two times the original speed.
Both of these forms will be used in subsequent explanations.
The current body of research on the use of time-compressed speech dates back to

3
the 1950s (Fairbanks, Guttman & Miron, 1957) and focuses primarily on the
comprehension or intelligibility of speech at various speeds, while controlling for other
relevant variables. A separate, yet related, line of inquiry exists in the area of multimedia
learning, which investigates the effects of combining words and pictures in various forms
to influence learning (e.g., spoken words versus written words). Time-compressed
speech and multimedia learning research are two separate lines of inquiry, though they
are investigating similar phenomena.
There is a long standing tradition in education to use representational adjunct
pictures in instructional materials to positively influence learning (Anglin, Vaez &
Cunningham, 2004). Empirical evidence has shown the combination of words and
pictures leads to better learning than from words alone (Mayer & Gallini, 1990; Clark &
Pavio, 1991; Pavio, 1986; Pavio, 1990), when the learner attends to and is able to
understand the pictures. Further, it has been long established that a person’s memory for
pictures is better than memory for words alone (McDaneial & Pressley, 1987; Pavio,
1986; Standing, Conezio & Haber, 1970). This is known as the picture superiority effect
(Anglin, Vaez & Cunningham, 2004). Yet, the combination of pictures and time-
compressed speech has not been systematically studied.
Though this gap in the body of research still remains, the web-driven explosion of
distance learning initiatives has prompted faculty members and instructional designers to
engage in the development of audio-enhanced instruction. Faculty members are digitally
recording voice-over presentations (e.g., PowerPoint with voice), animated screen
captures with narration (e.g., Camtasia), or pure audio lectures to distribute to personal
computers and other portable media devices (e.g., Podcasts) so students can learn on

4
demand (Gill, 2007). In addition, Apple Computer has established iTunes University, a
“service for colleges and universities that provides easy access to their educational
content, including lectures and interviews, 24 hours a day, 7 days a week” (iTunes,
2007). Institutions of higher education across the United States, like Stanford University,
have partnered with iTunes University in an effort to develop a wealth of educational
materials primarily in a digital audio format. Pictures can also be presented in these
media.
Information and communication technology has shaped the way in which
instruction is created, delivered, and processed in higher education. Faculty members and
support staff (e.g., instructional designers) in higher education use a variety of authoring
tools to develop rich instructional materials, and deliver the instruction using a variety of
tools (e.g., course management systems). Students in higher education now have the
opportunity to learn in a technology-rich environment.
Time-compression technology is integrated into popular consumer products such
as iPods or software such as Windows Media Player. The key digital technology that
supports the increased or decreased rate of speech, while preserving pitch, in audio files
is called a time compression algorithm (He & Gupta, 2001). A major tenet of time
compression is to provide learners with the ability to speed up or slow down content
based on their preferences. Students in higher education use the technology to reduce the
amount of time spent listening to multimedia with audio (Galbraith & Spencer, 2002).
Purpose of Research
The purpose of this research, therefore, was to investigate the effect of time-
compressed speech and adjunct images on undergraduate college students’, from here

5
forth referred to as learners, ability to recall and recognize information in a multimedia
learning environment. Additionally, this research investigated learners’ satisfaction of
time-compressed speech and adjunct images used in multimedia learning environments.
The overarching goals of this research were to shed light on time-compression
technology incorporated into multimedia learning environments, help fill the existing gap
in the research literature by merging two disjoint bodies of research, and aid students,
instructors and instructional designers to better understand time-compression technology
while creating or using instructionally sound multimedia material.
Research Questions. The overall research question is: What is the effect of
various compressed speech speeds and adjunct images on cued-recall, content recognition
and satisfaction? More specifically, the research questions addressed in the present study
are:
Main Effects
1) Is there a significant difference in cued-recall among learners listening to
digitally recorded audio at various time-compressed audio speeds
(Normal=1.0, Moderate=1.5, Fast=2.0, and Very Fast=2.5)?
2) Is there a significant difference in content recognition among learners
listening to digitally recorded audio at various time-compressed audio
speeds (Normal=1.0, Moderate=1.5, Fast=2.0, and Very Fast=2.5)?
3) Is there a significant difference in satisfaction among learners listening to
digitally recorded audio at various time-compressed audio speeds
(Normal=1.0, Moderate=1.5, Fast=2.0, and Very Fast=2.5)?

6
4) Is there a significant difference in cued-recall among learners listening to
digitally recorded audio and presented with an adjunct image and learners
not presented with an adjunct image?
5) Is there a significant difference in content recognition among learners
listening to digitally recorded audio and presented with an adjunct image
and learners not presented with an adjunct image?
6) Is there a significant difference in satisfaction among learners listening to
digitally recorded audio and presented with an adjunct image and learners
not presented with an adjunct image?
Interaction Effects
7) Is the effect of time-compressed audio speeds (Normal=1.0,
Moderate=1.5, Fast=2.0, and Very Fast=2.5) on cued-recall for learners
presented with an adjunct image the same as the effect for learners not
presented with an adjunct image?
8) Is the effect of time-compressed audio speeds (Normal=1.0,
Moderate=1.5, Fast=2.0, and Very Fast=2.5) on content recognition for
learners presented with an adjunct image the same as the effect for
learners not presented with an adjunct image?
9) Is the effect of time-compressed audio speeds (Normal=1.0,
Moderate=1.5, Fast=2.0, and Very Fast=2.5) on satisfaction for learners
presented with an adjunct image the same as the effect for learners not
presented with an adjunct image?

7
Hypotheses. Based on the previous research on time-compressed speech and
multimedia learning, it is predicted that under conditions of time-compressed speech, a
static, adjunct image will serve as a secondary cue to retrieve relevant information from
working memory. Further, under high speeds of compressed speech, it is predicted the
verbal channel experiences a phenomena similar to cognitive overload as increased
verbal information interferes with the available working memory. Thus, the highest levels
of speech compression in a multimedia learning environment should benefit the most
from the presentation of a semantically-related, adjunct image.
In reference to the stated research questions, learners presented with an adjunct
image should perform significantly more on the cued-recall and content recognition tasks
(4 and 5) because the adjunct image will serve as a secondary cue to retrieve relevant
verbal information. Further, those individuals presented with an adjunct image should be
significantly more satisfied with the multimedia program (6). Based on the findings of
previous research, learners in the fast or very fast audio speeds should perform
significantly less than those in the moderate or normal audio conditions on cued-recall
and content recognition (1 and 2). Consequently, those learners should also be
significantly less satisfied with the multimedia program (3).
Perhaps the most important prediction is that the presentation of an adjunct image
will ameliorate the negative effects associated with the faster audio speeds. As such, it is
predicted that the learners presented with an adjunct image at the faster audio speeds will
perform significantly better on the cued-recall and content recognition task (7 and 8), and
be significantly more satisfied with the multimedia program (9).

8
Limitations and Delimitations
More than 92% of the sample indicated English as their primary language,
indicating that non-proficiency in the language should not be a confounding variable.
None of the participants indicated having hearing impairments that rendered the audio
interventions unintelligible. Neither English language proficiency nor hearing impairment
should be considered confounding variables.
Previous experience with time-compressed speech was not documented. As
pointed out by Voor and Miller (1965), increased practice of listening to time-
compressed audio speeds might influence the comprehension potential of an individual
learner. Though the content of the instructional intervention, Discovering Australia., was
purposefully selected because undergraduate students would have limited prior
knowledge of various destinations in Australia, it is still a potential confounding variable.
Finally, since all the instruments and treatments in the current study were developed for
this research, there is limited evidence of validity and reliability of the measures and the
fidelity of the intervention.
Generalizing the results of this study should be done so with caution. The results
of this study should not be generalized outside of the population of undergraduate
students in higher education or populations with similar physical, social, and perhaps
economic characteristics. This research would likely generalize to populations with
similar demographics (e.g., at least high school education, 18 – 55 years old). However,
the results would not generalize to other populations that do not exhibit similar
characteristics (e.g., senior citizens).
The type of subject matter employed in this study can be characterized as low

9
intrinsic cognitive load (Sweller & Chandler, 1994) and declarative knowledge,
indicating that the subject matter may not be as intellectually challenging or difficult to
comprehend as content used in complex scientific explanations (e.g., explanation of
momentum in physics). Previous time-compressed speech research has demonstrated the
complexity and type of subject matter influence comprehension (Duker, 1974; Foulke,
1962). For example, the comprehension of procedural knowledge, the knowledge
exercised in the performance of some task, might be more severely influenced by time-
compression than knowledge that is declarative in nature. Future research will have to
explore these delimitations.
Summary
This chapter has provided an introduction to the research, a context to explain
why this research is important, some overarching goals that this research attempted to
address, specific research questions and hypotheses, and limitations and delimitations of
the study. This chapter concludes by summarizing key technical terminology that is used
throughout this dissertation. This dissertation is organized into five chapters. The second
chapter provides an overview of related literature and theoretical framework. The third
chapter explains the method used to investigate the phenomena. The fourth chapter
presents the results of this research using the methods employed. Finally, the fifth chapter
provides a detailed discussion.
Definition of Terms
This section provides a summary of key technical terms used in this dissertation
in alphabetical order, and can be referenced accordingly.

10
Adjunct images: Representational still image that semantically relate to words.
Audio: The transmission or reception of sound, generally in the form of
narration (speech), sound effects, and music.
Audio Speed or Rate: The rate or speed of audio playback usually represented as a
whole number. For instance, if the number of words per minute
(wpm) is 150 and the compressed speech of a treatment is 300
wpm, the audio rate is 2 (300/150).
Temporal Contiguity
Principle:
Individuals learn from words (narration) and images presented
concurrently as opposed to separately (Mayer, 2001).
Chipmunk Effect A problem that occurs when manipulation of audio results in
unintelligible narration and inaudible sounds because pitch has
not been maintained.
Cognitive Load: The load on working memory during problem solving, thinking
and reasoning (Sweller, 1988).
Dual-Coding
Theory:
A theory that posits that individuals possess separate channels or
subsystems for processing verbal and nonverbal information.
Generative-
Recognize Theory
A theory that suggests recall requires two processes: the retrieval
of information from memory followed by a familiarity decision,
whereas recognition itself only requires the familiarity decision
(Haist, Shimamura & Squire, 1992).
Intelligibility: A measurable construct related to individuals being able to
identify isolated spoken words.

11
Multimedia: The presentation of information using both words and images
(Mayer, 2001).
Multimedia
Principle:
Individuals learn better from words and images than words alone
(Mayer, 2001; Mayer, 2003).
Modality Principle: Individuals learn better from narration and images than from
images, and onscreen text (Mayer, 2001).
Narration: The oral speech or dialog using words to deliver an instructional
message.
Playback: The act of reproducing previously recorded materials for viewing,
hearing or both.
Image Superiority
Effect:
Individuals remember images better than words (Anglin, Vaez &
Cunningham, 2004).
Prior Knowledge: The knowledge that stems from previous experience and
exposure to the world.
Redundancy: The presentation of the same information in both an auditory and
visual channel.
Redundancy
principle:
Individuals learn better from narration and images than from
images, narration, and onscreen text (Mayer, 2001).
Sensory memory: Refers to an individual’s ability to retain impressions of sensory
information after the original stimulus has ceased.
Speech Speed: The rate at which speech is presented, usually expressed in terms
of the number of spoken words per minute.
Speech: See narration, synonymous in the context of this research.

12
Split Attention Effect: A phenomenon in which an individual is forced to allocate
working memory between various visual and auditory elements
such as text and images.
Time compression
technology:
The techniques, methods, and apparatuses for the increased or
decreased playback of primarily audio and video media.
Verbal redundancy: The presentation of words in both a visual and auditory channel.
Working memory: Memory that provides a small working space in which limited
information can be held for a short period.

13
Chapter Two
Literature Review
The literature relevant to this study encompasses several areas. First, this chapter
discusses time-compression technology and its application in higher education. Second,
this chapter outlines and summarizes previous research on time-compressed speech and
on audio (speech) and visual (adjunct imagery) treatments in multimedia learning. Third,
the chapter presents a theoretical framework by discussing three models of multimedia
learning: cognitive theory of multimedia learning, the integrated model of text and
picture comprehension, and the integrated model of multimedia effects on learning.
Finally, a rationale to investigate time-compressed speech as a component of multimedia
is provided. It is important to note the term picture can be interpreted synonymously with
adjunct image in this chapter.
Audio-Compression Technology and Higher Education
When reading online news articles or textual web-based instruction, a learner has
the capacity to scan or skim content. Learners viewing multimedia based content using
video or audio are not always afforded this luxury. With the proliferation of video-based
and audio-based multimedia content and the heightened popularity of these media online,
the need to skim multimedia is of increasing importance (Omoigui, He, Gupta, Grudin &
Sanocki, 1999). One technique used to empower learners with this ability is time-
compression technology. Time-compression technology aims at reducing the amount of
time that a learner listens to and/or watches multimedia content.

14
Time-Compression Technology. Early time-compression technology was based on
playing back an audio recording at a faster speed than the original recording. This
technique, though functional and easy to produce, resulted in the chipmunk effect, in
which the vocal effect and intelligibility were adversely affected (Barron, 2004).
Consequently, there was a desire to improve the quality of the time-compressed audio,
while preserving the quality of the pitch and intelligibility to create a more enjoyable
audio experience. The next iteration of analog time-compression technology involved
removing small segments of the speech signal (Miller & Lichlinder, 1950). The
Fairbanks method, for instance, would remove small portions of the signal at regular
intervals (Barron, 2004), resulting in an audio recording requiring substantially less time
to complete, but with reasonable quality.
Today, time-compression technology has evolved from analog format to one of a
digital nature. More importantly, the technology is real-time: audio content can be
manipulated by a learner while the audio is playing. This makes the technology much
easier to use since the learners do not have to re-record the content at a faster or slower
rate. The key digital technology that supports the increased or decreased playback of
audio content involves time-compression algorithms. These sophisticated algorithms fall
into two broad categories: linear and non-linear. Linear time-compression applies a
consistent manipulative to the entire audio content, irrespective of the information in the
audio recording. Figure 1 visualizes how a linear time-compression algorithm works.
Short and fixed-length speech segments (called audio gaps) are discarded, and the
retained segments are then abutted after cross-correlation (averaging the edges of audio
frames before abutting) to diminish the effects of abrupt audible noises (He & Gupta,

15
2001). The result reduces the remaining audio segments by equal proportions.
Figure 1. Linear time-compression illustration.
Non-linear time-compression is more sophisticated than linear time-compression
technology. Non-linear time-compression will first analyze the audio content, and
compress based on the type of content recorded. Typically, non-linear time compression
involves compressing redundancies in audio, including but not limited, to pauses or
elongated vowels in an audio stream (He & Gupta, 2001). Consequently, compression
rates may vary from one point to another in the audio stream. Adaptive and hybrid
algorithms including both techniques have been developed in more recent years, and have
been successfully integrated into pervasive consumer products. Figure 2 shows the
interface from Windows Media Player 10, which provides a real-time increased and
decreased playback setting for either video or audio recordings. Learner can easily select
a playback speed and manipulate the audio real-time.
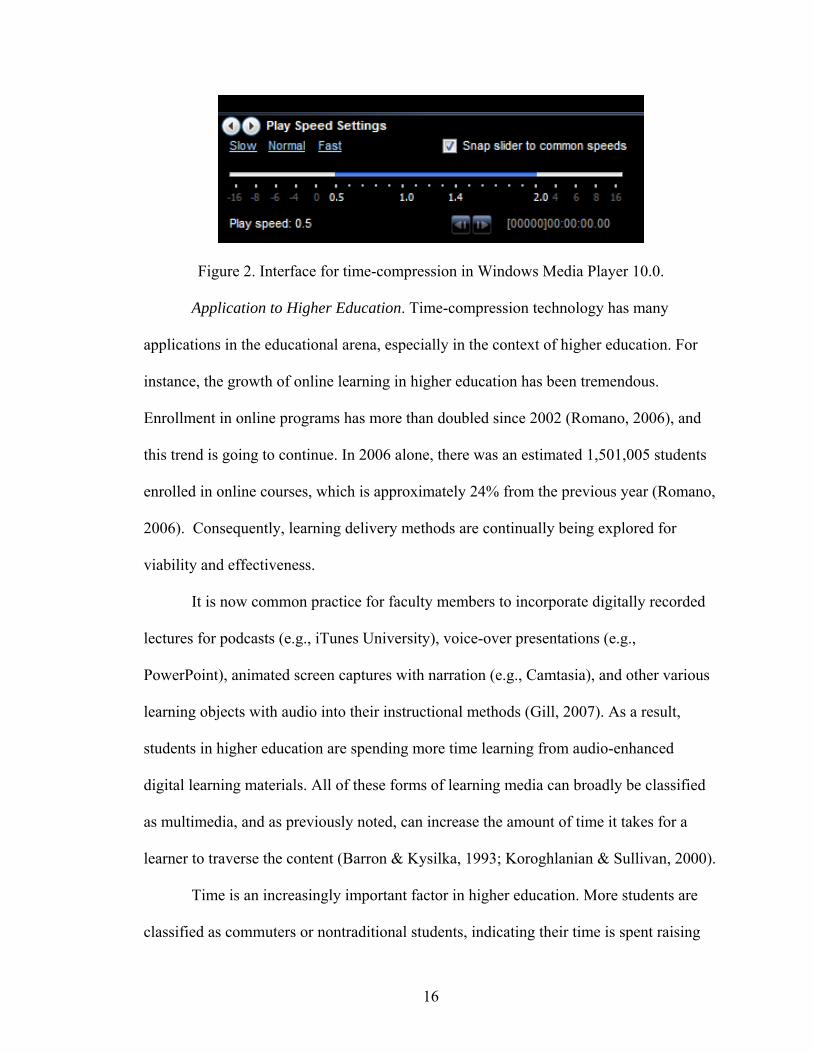
16
Figure 2. Interface for time-compression in Windows Media Player 10.0.
Application to Higher Education. Time-compression technology has many
applications in the educational arena, especially in the context of higher education. For
instance, the growth of online learning in higher education has been tremendous.
Enrollment in online programs has more than doubled since 2002 (Romano, 2006), and
this trend is going to continue. In 2006 alone, there was an estimated 1,501,005 students
enrolled in online courses, which is approximately 24% from the previous year (Romano,
2006). Consequently, learning delivery methods are continually being explored for
viability and effectiveness.
It is now common practice for faculty members to incorporate digitally recorded
lectures for podcasts (e.g., iTunes University), voice-over presentations (e.g.,
PowerPoint), animated screen captures with narration (e.g., Camtasia), and other various
learning objects with audio into their instructional methods (Gill, 2007). As a result,
students in higher education are spending more time learning from audio-enhanced
digital learning materials. All of these forms of learning media can broadly be classified
as multimedia, and as previously noted, can increase the amount of time it takes for a
learner to traverse the content (Barron & Kysilka, 1993; Koroghlanian & Sullivan, 2000).
Time is an increasingly important factor in higher education. More students are
classified as commuters or nontraditional students, indicating their time is spent raising

17
families, working full- or part-time jobs, and other time-consuming activities.
Approximately 80% of all undergraduates are employed while completing their degrees
and even among students under the age of 24, more than 50% are employed during the
school year (Riggert, Boyle, Petrosko, Ash & Rude-Parkins, 2006). Consequently,
students may want to reduce the amount of time they spend learning the materials, if it
will not adversely influence their learning. Time-compression technology may be very
useful in higher education.
Research on Time-Compressed Speech
In conversational speech, one is simultaneously listening and composing speech.
Because one can speak at approximately 150 wpm, and the rate for speed reading is 250
to 300 wpm (Taylor, 1965) and the rate for silent reading is 275 to 300 wpm (Junor,
1992), it is reasonable to hypothesize that another 125 to 150 wpm of unused processing
capacity might be available for listening to normal speech. This hypothesis has been
studied and tested by researchers under a variety of conditions starting as early as the
1950s (Barabasz, 1968; Fairbanks, Guttman & Miron, 1957; Foulke, 1968; Goldhaber,
1970; Jester & Travers, 1967; Reid, 1968; Richaume, Steenkeste, Lecocq & Moschetto,
1988). Table 1 summarizes the findings of much of the previous research. Results varied
from study to study, but some consensus is available.
Table 1. Previous Studies on Speech Speed
Researchers/Year N Population Dependent Vars. Independent Vars. Outcome
Fairbanks, Guttman
& Miron, 1957
36 Military Intelligibility,
Comprehension
Speech Speed Significant
main effects
Jester & Travers,
1967
120 Higher Ed. Comprehension Speech Speed,
Repetition,
Significant
main effects

18
Researchers/Year N Population Dependent Vars. Independent Vars. Outcome
Presentation Pattern
Barabasz, 1968 118 Higher Ed. Recall, Retention Speech Speed No
significant
difference
Reid, 1968
80 Higher Ed. Comprehension Speech Speed,
Grammatical
Complexity
Significant
main and
interaction
effects
Foulke, 1968 100 Higher Ed. Comprehension Speech Speed
Significant
main effects
Goldhaber, 1970 160 Higher Ed./
Junior Ed.
Comprehension Speech Speed,
Grade Level
Significant
main effects
Short, 1977, 1978
90 Higher Ed. Performance,
Time Spent
Speech Speed Significant
main effect
Richaume et al.,
1988
90 Unclear Intelligibility,
Comprehension
Speech Speed
Content Type
No
significant
difference
King & Behnke,
1989
120 Higher Ed.
Short-term,
Comprehensive,
Interpretive
listening
Speech Speed Significant
main effects
Ritzhaupt, Gomes &
Baron, In Press
183 Higher Ed. Performance,
Satisfaction
Audio (Speech)
Speed,
Verbal Redundancy
Significant
main effects
Fairbanks, Guttman, and Miron (1957) successfully executed one of the first
major studies that investigated the effects of time-compressed speech. They used two

19
technical messages on the subject of meteorology in their intervention. The passages of
words were recorded at 141 wpm with compression levels of 30%, 50%, 60%, and 70%;
the last produced speech at 470 wpm. Results showed significant differences with the
largest gaps in comprehension after approximately 282 wpm.
Jesters and Travers (1967) designed and executed a study with speech speed,
repetition and presentation patterns as the independent variables. Speech passages of the
same content were recorded at varying speeds (200 to 350 wpm) of the same content.
Presentation patterns refer to variations of sequencing the passages at different speeds.
One condition progressively increased the rate from the slowest presentation to the
fastest, the second decreased from the fastest to the slowest, and the third condition kept
the speeds constant at approximately 263 wpm. At the end of four trials, there were
significant main effects on speech speed, but the interaction effect between presentation
pattern and speech speed was not statistically significant.
Foulke (1968) executed a study with 12 groups based on increasing 25 wpm
increments from 125 to 400 wpm. After listening to the speech, participants were tested
for comprehension by a multiple choice test. Comprehension did not seriously deteriorate
by increasing word rate from 125 to 250 wpm, but it declined rapidly thereafter. Foulke
(1968) suggests that time is required for the perception of words, and that as word rate is
increased beyond a certain point, the perception time available to the listener becomes
inadequate, and a rapid decline of listening comprehension commences after that point.
Barabasz (1968) conducted a study with 118 students in a human behavior and
development class. Two lectures were used in a rotational research design to control for
inter-group differences. The research investigated two different speeds and used both

20
recall (administered after lecture) and retention (administered two weeks later) as
dependent measures. The findings suggest that a lecture can be reduced to one-third the
time without a significant difference in either recall or retention (Barabasz, 1968) or
approximately 225 wpm.
Goldhaber (1970) studied the effects of compressed speech as a function of
academic grade level. The study looked at speech delivered at 165 wpm and 330 wpm for
students in junior high school (80) and college (80), with comprehension as the
dependent measure. The narrative content was adjusted according to the Flesch
Readability Formula (Flesch, 1949). The results showed main effects for speech and
academic level, but no interaction effect was identified. This indicates individuals with
varying levels of formal education perform differently (high school versus middle
school), as one would anticipate.
Reid (1968) studied the effects of grammatical complexity and compressed
speech on comprehension. He used a form of the Nelson-Denny Reading Test to make
two difficulty levels of grammatical complexity and compressed speech at 175, 275, 325,
and 375 wpm. Further, the Verbal Scholastic Aptitude Test was used as a covariate.
Results suggested a significant main effect for both compressed speech and grammatical
complexity and a significant interaction effect. Compressed speech was not statistically
significant until 375 wpm level, which is more than double the speed of normal speech.
Short (1977, 1978) conducted an applied time-compression study in the context of
a Food and Nutrition course with 90 students using a self-instructional method. The
study compared students in groups that used recorded lectures on tapes with variable rate
controlled speech (VRCS) compressors and the same tapes on normal speed (NS) tape

21
recorders. Students who used VRCS compressors had an average time saving of 32%
and an average grade increase of 4.2 points on post-test scores, indicating the group with
the accelerated treatment actually performed better.
Richaume, Steenkeste, Lecocq, and Moschetto (1988) examined the effects of
normal and compressed speech at 135, 202, 270, and 300 wpm on intelligibility and
comprehension. Combining the results from three experiments, their findings suggested
that intelligibility and comprehension do not decay until approximately 300 wpm is
reached. The study also considered the complexity of the narrated stories. Their findings
suggested that the poorest scores resulted from difficult stories and highest scores from
the concrete and redundant stories. This is a strong indication that type and complexity of
content moderates the effects.
Gomes, Ritzhaupt, and Barron (in press) investigated the effects of time-
compressed audio on learner performance and satisfaction. The research design
incorporated three audio speeds at 1.0 (150 wpm), 1.4 (210 wpm), and 1.8 (270 wpm)
and verbal redundancy as a repeated measure. Findings from the research showed no
difference on performance across varying audio speeds. Additionally, the researchers
identified a positive effect in favor of verbal redundancy (verbal content presented in
narration and text) similar to previous research (Moreno & Mayer, 2002).
Summary. The findings of these various research studies suggest that speech
speeds somewhere near 275 wpm or more begin to negatively influence the dependent
measures of interest (e.g., comprehension, recall, etc.) (Fairbanks, Guttman & Miron,
1957; Foulke, 1968; Reid,1968). These studies also underscore control variables that
may influence the dependent measures of interest, such as academic level (Goldhaber,

22
1970), grammatical complexity (Reid, 1968), or repetition (Jester & Travers, 1967).
However, these previous research studies did not study the effects of time-compressed
speech in the context of multimedia (with both pictures and words) learning
environments, with the exception of the Gomes, Ritzhaupt & Barron (2006).
Research on Multimedia with Narration
Multimedia learning has been investigated from many different angles and
perspectives. Since the focus of this research is on speech (narration) integrated into
multimedia learning, research investigating sound effects and music are not included.
Table 2 summarizes the findings of previous research on audio (speech or narration) in
multimedia learning. Some of the results across studies are contradictory.
Table 2. Previous Studies on Speech in Multimedia Learning
Researchers/Year N Population Dependent Vars. Independent Vars. Outcome
Severin, 1968 264 Junior Ed. Recognition R-Audio-Picture, U-
Audio-Picture,
Audio, Picture,
Audio-Print
Significant
main effects
Mayer, Anderson,
1991
30,
24
Higher Ed. Problem-Solving
Recall
Words-With-Pictures,
Words-Before-
Pictures,
Pictures Only,
Words Only
Significant
main effects
on problem-
solving
Barron, Kysilka,
1993
60 Higher Ed. Achievement,
Completion Time,
Perceptions
Text-Only,
Full-Text-Audio,
Partial-Text-Audio
Significant
difference
on
completion

23
Researchers/Year N Population Dependent Vars. Independent Vars. Outcome
time
Tindall-Ford,
Chandler, Sweller,
1997
30,
22,
24
Trade
Apprentices
Test Scores (3
parts)
Mental Load
Audio-Visual,
Visual-Only,
Integrated
Significant
differences
on transfer
Kalyuga, Chandler,
Sweller, 1999
34 Trade
Apprentices
Test Scores
Mental Load
Reattempts
Visual,
Audio,
Visual-Audio
Significant
main effects
Beccue, Vila, and
Whitley, 2001
86 Higher Ed. Performance,
Attitudes,
Perceptions
Audio Instructions,
Gender,
Age
No
significant
difference
Moreno, Mayer,
2002
74,
69,
71
Higher Ed. Retention,
Transfer,
Matching
Verbal Redundancy
(8 different groups)
Significant
main effects
Severin (1968) designed a series of treatment conditions using the tenets of cue
summation theory, which posits the addition of a second channel (audio or visual) results
in better learning. Severin’s treatment conditions were: audio with relevant pictures,
audio and unrelated pictures, picture only, audio only, and audio and print. The sample
consisted of 246 middle school students with recognition as the dependent measure.
Results demonstrated that the related audio and picture condition was significantly
different from the audio and print condition, and the picture only treatment was
significantly different from to the audio-only treatment. He concluded that the condition
with audio and print was effectively redundant in nature, and did not lead to better
learning because the information was processed on the same channel, interfering with the

24
learning process (Severin, 1968).
Mayer and Anderson (1991) suggest that the presentation of animation and
narration is better than animation, narration, and onscreen text because the presentation of
two verbal channels, onscreen text and narration, results in cognitive overload. In the
first experiment, a words-with-pictures (concurrent narration and animation) group was
compared with a words-before-picture group. In the second experiment, a words-with-
picture group was compared with a picture-only, words-only and a no instruction group.
Consistently in both experiments, the words-with-picture group outperformed the other
treatments (Mayer & Anderson, 1991). In addition to demonstrating a redundancy effect,
the results demonstrate the presentation of the information concurrently, as opposed to
separately, lead to better learning – the temporal contiguity principle (Mayer, 2001;
Mayer & Moreno, 2002a).
Tindall-Ford, Chandler and Sweller (1997) hypothesized that the combination of
auditory text and visual diagrams (dual-presentations) can result in better learning. The
study reports three separate experiments testing a variety of conditions. The first
experiment included three treatment groups and 30 adult participants: audio-visual
format, a visual-only format, and an integrated format (combining visual onscreen text
aids on the illustration). The results from this experiment indicate either the integrated or
audio-visual format were superior to the visual-only format. The second experiment
presented information in a tabular format, forming audio-visual and visual-only groups,
and demonstrated that the audio-visual format performed significantly better than the
other treatment. The final experiment investigated the effects of the first experiment with
substantially less intellectually challenging content, or what is referred to as low intrinsic

25
cognitive load (Sweller & Chandler, 1994). Again, results were in favor of the audio-
visual treatment.
Kalyuga, Chandler and Sweller (1999) designed two experiments to ameliorate
the effects of split-attention, a phenomenon in which a leaner is forced to split his or her
attention between various visual and auditory elements such as text and diagrams. The
first experiment dealt specifically with the use of audio narration, and had the following
groups: visual plus audio text, visual text, audio text. This implementation is often cited
as a modality effect (Kalyuga, Chandler & Sweller, 1999; Mayer, 2001). The dependent
measures included test scores, a self-reported measure of mental load, and the number of
reattempts at an instructional activity. The auditory presentation of text proved superior
to the visual-only presentation, but not when the text was presented in both auditory and
visual forms. Additionally, their findings show the elimination of redundant visual
textual explanations in multimedia proved to be beneficial.
Barron and Kysilka (1993) examined the effects of three different treatment
groups of audio in multimedia learning with a sample of 60 college students: a visual
text-based version, full audio and visual version in which the text accompanied a word
for word narrative description, and a version with both text and audio, but the text was
presented in a synthesized bulleted form. Their findings demonstrated no difference in
achievement, with or without the inclusion of an audio channel. However, a significant
difference was found on the time to complete the instructional module. Perceptions
among the learners were positive and relatively comparable in all treatments.
Beccue, Vila, and Whitley (2001) examined the effects of incorporating audio
instructions in computer-based instruction (CBI) on performance, attitudes, and

26
perceptions. Their sample included 86 students enrolled in an introductory computer
science course, and the treatment groups included a group that received audio instructions
in addition to written instructions and those only receiving written instructions.
Additionally, the researchers included age and gender as factors of interest. Their
findings suggest no significant difference on the integration of audio as instructions in
CBI versus its textual counterpart. Further, no significant differences were found for age
or gender on the dependent measures.
Moreno and Mayer (2002) studied the effects of verbal redundancy in multimedia
learning using narration. The concept of redundancy is the result of modality effect, in
which two modalities, visual and audio, influence learning. In this case, both modalities
incorporate verbal information. The study consisted of three separate experiments that
specifically studied the effects of verbal redundancy using a combination of narration,
onscreen text, and pictures (animation) in eight different groups. Results show that
students consistently scored better when presented with words in a visual and auditory
form, indicating a verbal redundancy effect was found to have a significant positive effect
on retention, transfer, and matching in these experiments provided there were no other
concurrent visual elements (e.g., animations). These findings appear to conflict with
previous research (Barron & Kysilka, 2003; Severin, 1968); however, the Moreno and
Mayer study employed audio treatments that were much shorter in duration, provided
little learner control, and attempted to control for a split-attention effect.
Summary. Several different combinations of onscreen text, narration, and picture
(still picture and narration) treatments have been investigated in multimedia research.
Across these studies, the use of verbal redundancy appears to be ineffective when

27
incorporating pictures in the treatment interventions as it results in a split-attention effect.
The use of audio-visual, either as still pictures or animations in concert with related
narration, interventions appears to be an effective combination. This combination is
effectively the premise of the multimedia principle (Mayer, 2001), which has been
empirically tested in many studies and posits that better learning occurs with the
presentation of pictures and words than from words alone. Various dependent measures
have been incorporated into the research designs, including performance, achievement,
retention, recall, recognition, transfer and more, as shown in Table 2.
Theoretical Framework
Research on multimedia learning has evolved from simple media comparison
studies to the basis of explaining the psychology of learning. Previous research in
multimedia focused on the medium used for delivery rather than the instructional
interventions that positively influence learning (Clark, 1983). This fundamental shift in
research gave rise to cognitive theories in multimedia. Cognitive theories of multimedia
learning share a few related theoretical underpinnings: sensory modality (input) and
memory, working memory, limited-capacity and cognitive load, long-term memory, and
dual-processing (Hede, 2002; Mayer, 2001; Schnotz, 2005; Schnotz & Bannert, 1999).
Mayer (2001) provides the cognitive theory of multimedia learning, Schnotz and Bannert
(1999, 2005) provide the integrated model of text and picture comprehension, and Hede
(2002) outlines the integrated model of multimedia effects on learning.
Based on the research literature, it would appear that Mayer’s cognitive theory of
multimedia learning has been the most widely accepted and integrated model to explain
the phenomena. Mayer’s multimedia model is based on three tenets: dual channels,

28
limited capacity, and knowledge construction. The first tenet, dual processing, suggests
that humans have multiple channels for processing visual/pictorial and auditory/verbal
information (Mayer, 2003). The second tenet suggests that humans’ processors have a
limited capacity to process information at any given instance in time. The third tenet is
that humans are knowledge constructing processors that receive, organize, and connect
incoming information with existing knowledge (Mayer, 2003).
“The process of meaningful learning from multimedia involves five cognitive
processes: selecting words, selecting images, organizing words, organizing images, and
integrating” (Mayer, 2003, p. 304). The model suggests that when a learner engages in a
multimedia presentation, information is presented as either words or pictures. The next
step in the model is sensory memory, in which the words, figures, animations, narration,
and sounds impinge the eyes and ears of learners, who then selectively store the
information in working memory. If the information is organized in working memory by
the learner coherently representing sounds and images and connecting it with prior
knowledge, an “integrated learning outcome” results (Mayer, 2003, p. 304). The
remaining section of this chapter will contrast Mayer’s model with Hede’s and Schnotz’s
models in relation to time-compressed audio.
Sensory Modality and Memory. Sensory memory has been integrated into many
different human memory models (Atkinson & Shiffrin, 1968; Baddely, 1998; Neisser,
1967), though consensus in the research literature is not established. Sensory memory
refers to an individual’s ability to retain impressions of sensory (e.g., auditory, visual,
taste) information after the original stimulus has ceased. For example, the sound of
lightning may last for a few seconds, but after it stops, the impression of the sound is

29
temporarily stored in auditory sensory memory. Sensory memory is posited to be
temporary and has limited capacity. Information enters the cognitive system from the
outside world through our senses via channels and is placed in sensory memory (Mayer,
2001) or sensory registers (Schnotz, 2005).
Spoken words, sounds (e.g., the sound of a bird chirping triggers a visual of a
bird), and music impinge the ear drums, temporarily storing either verbal or visual
information (Mayer, 2003; Schnotz, 2005). Written words and pictures impinge the eyes,
temporarily storing either verbal or visual information (Mayer, 2003; Schnotz, 2005).
Hede’s model (2002) defines the outside information as multimedia input. The
information is “selected” from sensory memory into working memory via channels.
When using time-compressed audio, words are presented to the auditory channel
at an increased rate, creating a situation in which potentially fewer words can be selected
from sensory memory prior to movement into working memory. While pictures may be
presented at a normal rate, learners may not have the same amount of time to encode the
pictures if the presentation of the picture is tied to the narration (e.g., the picture is no
longer available when the related narration is complete). Thus, only certain aspects of the
image may be selected and moved through the visual channel into working memory.
Working Memory. Baddeley and Hitch (1974) first proposed a model of working
memory, and the model was later refined and explained by Baddely (1986) based on
scores of studies that had empirically tested the multi-dimensional construct composed of
a phonological loop for dealing with verbal material and a visio-spatial sketchpad for
visual information. Accordingly, working memory is used for “temporarily holding and
manipulating knowledge” (Mayer, 2001, p. 44). Mayer (2001) states that memory may

30
hold a verbal model and a visual model, and that the relationship between those models is
based on a process called organizing. These mental models can then be integrated with
prior knowledge into long-term memory for permanent storage.
Schnotz (2005) defined working memory differently. In his model, there are both
visual and ‘auditive’ working memory with channels to propositional representations and
mental models. The mental model refers to visual information on an individual’s visio-
spatial sketchpad and propositional representations refer to the limited number of
propositions that can be held in working memory. Hede and Schnotz’s models are
defined similarly, but with an emphasis on learner attention prior to “cognitive
processing”. Attention is analogous to “selecting” images and words in Mayer’s model.
Working memory in all models has limited capacity.
A working memory system for multimedia with time-compressed audio
withstands a disproportionate amount of information in the phonological loop because
words are presented at a faster rate than pictures. However, if pictures are tied to the
audio speeds, learners might also have less time to encode and organize information in
working memory. Depending on which model one uses, the organization of words and
pictures may result in the creation of one pictorial and verbal model (Schnotz) or one
pictorial and one verbal model (Mayer) with referential connections. These models are
then stored in long-term memory for permanent storage.
Dual-Processing. Dual Coding Theory (DCT) is a theoretical framework that
involves the activity of two distinct cognitive subsystems: a verbal system pertaining to
language (logens), and a non-verbal system pertaining to non-linguistic objects and
events (imagens) (Pavio, 1986; Pavio, 1990). DCT has many applications in education,

31
including: the representation and comprehension of knowledge, learning and memory of
instructional material, effective instruction, achievement motivation, and the learning of
motor skills (Clark & Paivio, 1991). In particular, DCT has been empirically tested in
numerous studies involving multimedia learning.
DCT identifies three types of processing: (1) representational, (2) referential, and
(3) associative processing (Pavio, 1986; Pavio, 1990). Representational refers to the
activation of verbal or non-verbal representations. Referential refers to the activation of
the verbal system by the nonverbal system or the nonverbal system by the verbal system.
Finally, associative refers to the activation of representations within the same verbal or
nonverbal system. In Mayer’s, Schnotz’s, and Hede’s multimedia models, referential
processing plays an important role in the integration of information into working
memory, and ultimately, in long-term memory.
Mayer and Schnotz models differ in that Mayer’s model assumes “sensory
modality and representational format are merged by the assumption of an auditory-verbal
channel and a visual-pictorial channel” whereas “the integrated model assumes that
verbal information is not necessarily associated with the auditory modality, but can be
conveyed by other sensory modalities” (Schnotz, 2005, p. 59). Therefore, in Schnotz’s
model, verbal information can enter through either channel. During dual processing, each
model posits the integration of new information with prior knowledge.
Time-compressed speech in multimedia learning can be explained by dual-
channels. From sensory memory, information is moved to working memory either in a
visual or verbal channel during a selection process. Time-compressed audio may
potentially maximize the capacity of the auditory-verbal channel, while the constraints on

32
the visual-pictorial channel may be less restrained. During the organization process,
referential, associative, and representational processing builds mental models for long-
term storage. The channels are limited in capacity, however, and the verbal channel may
be competing for cognitive resources in working memory.
Limited Capacity and Cognitive Load. Miller (1956) first proposed the limitations
of short-term memory. His research demonstrated that individuals, on average, can retain
seven plus or minus two (standard deviations) “chunks” of information. Since this
landmark discovery, cognitive psychology has expanded on the limitations of short-term
and working memory. Sweller (1988) discussed the limitations of working memory by
distinguishing between experts and novices in problem solving and proposed a Cognitive
Load Theory. Sweller says that “problem-solving and acquiring schemas [or learning]
may require largely unrelated cognitive processes” (Sweller, 1988, p. 261), which can
hinder the learning process. In other words, it is important for multimedia instruction to
eliminate multiple sources of information on the same channel, as well as unnecessary or
extraneous information (i.e., split attention/coherence effect) (Chandler & Sweller, 1991).
Sweller and Chandler (1994) also suggested that multimedia materials may be
influenced by an intrinsic cognitive load, speaking of the intellectual complexity of the
content, and an extrinsic cognitive load, speaking of elements of the multimedia material
that distract or interfere with learning. The inherent difficulty or simplicity of learning
material can confound research because the cognitive load reduces the amount of
working memory available. The elements of a user-interface presenting multimedia
content could also disorient the learner.
The three models under discussion each incorporate the notion of limited capacity

33
in similar ways. Hede’s model emphasizes attention and learner control as the dynamic
precursor to processing information in working memory. Both Mayer’s and Schnotz’s
models integrate the limited capacity of memory (Miller, 1956), extrinsic and intrinsic
cognitive load (Sweller & Chandler, 1994), and the elimination of non-coherent
information (Chandler & Sweller, 1991). For example, placing decorational images on
the interface of a multimedia program would be discouraged as it potentially distracts
from the relevant information.
Multimedia with time-compressed audio will, according to Cognitive Load
Theory, stretch the limitations of the verbal channel and organization process of verbal
information in working memory. Previous research in time-compression research
demonstrates that time-compressed audio will reach a ceiling effect (He & Gupta, 2001),
and comprehension severely worsens somewhere after 275 wpm. Under conditions of
time-compressed audio, learners will be forced to select fewer words and have less time
to organize the words in working memory. Depending on the design and delivery of the
multimedia components, pictures, such as adjunct images, may not overload the cognitive
channel as much, and since the load on the pictorial channel may have fewer demands on
working memory, it may make it easier to build referential connections between the
verbal and pictorial information.
Another important factor is the intrinsic cognitive load of the narrative
information. Under conditions of time-compressed audio, narrative or pictorial
information with a higher degree of intrinsic cognitive load will place an additional strain
on the verbal or pictorial channel and the organization process in working memory.
Contention for working memory between the time-compressed narrative and pictorial

34
information may be amplified by a higher degree of intrinsic cognitive load.
Long-Term Memory. Long-term memory or storage “receives processed
information from working memory but also supplies working memory with the basis for
cognitive linking whereby connections are established between new content and what is
already known” (Hede, 2002, p. 184). Long-term memory is an operational construct in
each of the aforementioned models, but is treated slightly differently in each case.
Mayer’s model assumes the construction of mental, verbal and pictorial models that then
have to be integrated with prior knowledge, whereas Schnotz’s model, “assumes that only
one mental model is constructed and that it integrates the information from both sources”
(Schnotz, 2005, p. 59). Hede (2002) distinguishes between long-term storage and
learning. He defines long-term storage (memory) in terms of declarative, procedural and
conditional knowledge, and learning as comprehension, recall, and application.
In all the models, prior knowledge is recognized as a factor influencing the
integration process. Consequently, experiments studying the effects of multimedia should
attempt to minimize the influence of prior knowledge. Additionally, these models suggest
that research involving the systematic study of multimedia and its effects on learning
should attempt to clear the remnants of working memory prior to a recall or recognition
task. This will provide the more durable effects of an intervention by facilitating the
recall of information long-term memory.
Rationale for Time-Compressed Speech in Multimedia
Much of the time-compressed speech research pre-dates the growth in multimedia
learning research literature. From a theoretical perspective, speech or narration is
effectively the same treatment as words communicated through an auditory channel. The

35
tenets of multimedia learning provide a coherent framework and perspective with which
to systematically investigate time-compressed speech. Research conducted in this manner
can integrate knowledge and serve a multi-disciplinary audience. A slight modification to
Mayer’s (2001) model of the cognitive theory of multimedia learning is provided to
illustrate previous and current research.
Previous research has shown the combination of words and pictures leads to better
learning than from words alone (Clark & Pavio, 1991; Mayer & Gallini, 1990; Pavio,
1986; Pavio, 1990). Further, it has been long established that a person’s memory for
pictures is better than memory for words alone (McDaneial & Pressley, 1987; Pavio,
1986; Standing, Conezio & Haber, 1970). This knowledge suggests that time-compressed
speech should not be studied in isolation, but by including pictures as our previous
research demonstrates doing so is a stronger instructional method (Mayer, 2001). While
researchers have known this information for more than 20 years, the combination of
pictures and time-compressed audio has not been systematically studied.
Figure 3 illustrates the previous research on time-compressed audio using
Mayer’s model. The solid red lines indicate that previous research in time-compression
had narrowly focused on information entering the auditory/verbal channel, and that the
presentation and movement of the information through the auditory/verbal channel is
analogous to the learner experiencing cognitive overload. The perforated line surrounding
the visual/pictorial channel illustrates the absence of the simultaneous representation of
related visual information.

36
Figure 3. Modified cognitive model for multimedia learning representing previous
research in time-compression.
Under conditions of time-compressed audio, the presentation of an adjunct picture
may be able to represent verbal information and by doing so, provide the additional
nonverbal memory representation that can be retrieved from memory if an individual’s
verbal information is inaccessible (Kullhavey, Lee & Caterino, 1985; Pavio, 1986). This
can be explained by a referential process between the verbal and nonverbal information.
Of particular importance is the strength of the relationship between the representational
adjunct picture and words used in multimedia materials. For instance, a speech about the
history of the Chinese government with the simultaneous presentation of a German flag is
semantically incongruent, and according to theories of multimedia learning, may interfere
with the learning process. Feature-related information should be more easily accessible in
memory than nonfeature-related or completely unrelated information (Kullhavey, Lee &
Caterino, 1985).
Figure 4 visualizes the current research study in contrast to the previous research
on time-compressed speech using Mayer’s model. Time-compressed speech still enters
and moves through the auditory/verbal channel at an abnormal rate. However, the

37
simultaneous activation of the visual/pictorial channel – represented as the bolded green
lines – provides the leaner another related channel to access relevant information.
Because the learner has access to both a verbal and pictorial model to build referential
relationships, a stronger learning outcome is predicted. The orange bolded lines represent
the connection with prior knowledge and the referential link between the verbal and
pictorial models.
Figure 4. Modified cognitive model for multimedia learning representing current research
in time-compression.
Previous research on time-compressed speech demonstrates that under conditions
of audio speeds somewhere past 275 wpm, criterion measures of interest begin to
deteriorate significantly. It is therefore anticipated that under extreme cases (audio speeds
that exceed 350 wpm) the presentation of an adjunct picture might greatly improve either
the recall or recognition of relevant information. This provides a rationale to examine the
recall and recognition of narrative information when presented with adjunct images at a
normal (1.0) speed of approximately 150 wpm, a moderate (2.5) speed of 225 wpm, a fast
(2.0) speed of 300 wpm, and a very fast (2.5) speed of approximately 375 wpm.

38
Summary
This chapter discussed time-compression technology and its application in higher
education. Additionally, this chapter has reviewed relevant literature relating to both
time-compressed speech and multimedia learning environments. Finally, this chapter has
reviewed various and relevant models of multimedia learning in relation to time-
compression technology and provided a rationale to investigate time-compressed speech
using the lenses of multimedia learning. The following chapter will discuss the method to
study this phenomenon and will refer back to the literature reviewed in this chapter when
appropriate.

39
Chapter Three
Method
This study was conducted at a comprehensive, southeastern public university
during the Fall 2007 semester. Research data were collected to examine the effect of
Time Compressed Audio Speeds and Adjunct Images on content recall, recognition and
satisfaction. The instructional material titled Discovering Australia was used for this
research study. This chapter describes the research design, the data collection process,
and the data analysis methods that were employed in this study.
Research Design and Participants
The experiment uses a 4 Audio Speeds (1.0 = normal vs. 1.5 = moderate vs. 2.0 =
fast vs. 2.5 = fastest rate) x Adjunct Image (Image Present vs. Image Absent) factorial
design. Audio Speed and Adjunct Image both served as between subject conditions.
This research design results in eight unique groups or conditions as shown in Table 3: NP
(Normal-Image Present), NA (Normal-Image Absent), MP (Moderate-Image Present),
MA (Moderate-Image Absent), FP (Fast-Image Present), FA (Fast-Image Absent), VP
(Very Fast-Image Present), and VA (Very Fast-Image Absent).
Table 3. Research Design and Independent Variables
Normal (1.0) Moderate (1.5) Fast (2.0) Very Fast (2.5)
Image Present NP MP FP VP
Image Absent NA MA FA VA
Using an a priori power analysis, with an alpha level set at α = .05, an estimated

40
medium effect size, 7-groups in Analysis of Variance (ANOVA), and a desired power of
0.8, the study called for approximately 32 participants in each group, 256 total research
participants (Cohen, 1992, p. 158). This total was reached and exceeded with a total of
305 research participants. The research participants were recruited from 48 different
college undergraduate courses. Participants were recruited from courses after making
prior arrangements with instructors, and were offered extra credit for their participation in
the study.
Fifty-five percent of the participants were male and 92% indicated that English
was their primary language. Forty-nine percent of the participants were junior
classification, 4% were freshman, 19% were sophomore, 26% were seniors, and the
remaining indicated other. Participants represented many different colleges, with 41%
from the health, 26% from engineering, 15% from education, 5% from business, and the
remaining 10% from arts and sciences. The average age of the participants was 23.64
(SD=6.61) with the maximum age of 53 years old.
Materials and Measures
Text and Adjunct Images. A descriptive narrative titled Discovering Australia was
used for this research study. This narrative was selected because it had been successfully
used in prior educational research studies pertaining to multimedia learning environments
(Kealy, Alkhabbaz, Subramanian, Bunch & Spears, 2006), its content was well-suited for
the current research intervention, and because the target population (students in higher
education in the United States) had limited knowledge about various destinations in
Australia. The text was slightly modified to suit the needs of this study. The text has a
Flesch reading ease of 36.4 and a Flesch-Kincaid twelfth grade level reading score

41
(Flesh, 1949). The narrative consisted of 11 passages of approximately 150-words per
passage: one introductory passage and 10 passages describing different locations in
Australia. Each passage was subdivided into two paragraphs. The first paragraph related
to feature-related information, while the second paragraph was nonfeature-related.
Ten semantically related images corresponding to the Discovering Australia text
were selected for research intervention. Both the text and images are shown in Appendix
A. The images were selected based on their appropriateness in representing one
paragraph of the verbal information in each of the 10 passages. Levin (1981) suggests
images can serve as decorational, representational, organizational, and transformational.
While decorational images serve no purpose and can actually hinder the learning process,
representational images mirror part or all of some related text, and have been found to
have moderate effects on learning (Carney & Levin, 2002; Levin, 1981). Organizational
images typically manifest themselves as maps or diagrams, while transformational
images make use of semiotics. The images used in this study were purposefully
representational in nature as they are intended to provide context relating to the passages
in the Discovering Australia text.
To validate the representational characteristics of the images, expert reviews were
sought to evaluate the images in relation to the selected text. An email was sent to the
Instructional Technology Student Association (an organization representing faculty,
students and other professionals in various technology-related disciplines) mailing list
soliciting expert reviews. The email indicated the ideal candidates should be doctoral
students, candidates, and graduates of instructional technology with experience in
multimedia learning, dual-coding theory, and instruction design experience. Experts

42
were informed the images were intended to be representational in nature, relate to some
of the textual information from the passage, and should help learners remember the
verbal information associated with the image from the passages. Candidates were
screened via email, and if they met the criteria, were provided a link to an online survey
shown in Appendix I. The survey had a 4-point modified Likert scale without a central
point (Strongly Disagree, Disagree, Agree, and Strongly Agree). This decision was made
so that expert reviewers were required to judge the fidelity of the images and text.
Eight expert reviewers met the selection criteria and responded to the survey. The
results of the expert review process are summarized in Table 4. Since the instrument used
by expert reviewers had a four point scale, it was deemed that any response averages that
were not, at least, three or higher in each category (representative of text, help with
memory, and image quality) were not appropriate representational adjunct images in
relation to the selected text. If an image did not meet these criteria, modifications to the
text or a new image were necessary. Nine of the 10 images were deemed appropriate
from the expert reviews as the responses to each of the scales were equal to or above
three on a four point scale.
Table 4. Expert Review Summary with Pictures and Mean Response by Category
# Image Review Criteria Mean
1 Representative of textual information 3.38
Help memory of textual information 3.38
Quality image 3.50
2 Representative of textual information 3.38
Help memory of textual information 3.13
Quality image 3.25

43
3 Representative of textual information 3.25
Help memory of textual information 3.25
Quality image 3.50
4 Representative of textual information 3.38
Help memory of textual information 3.38
Quality image 3.63
5 Representative of textual information 3.13
Help memory of textual information 2.88
Quality image 3.13
6 Representative of textual information 3.25
Help memory of textual information 3.13
Quality image 3.13
7 Representative of textual information 3.25
Help memory of textual information 3.25
Quality image 3.38
8 Representative of textual information 3.40
Help memory of textual information 3.20
Quality image 3.00
9 Representative of textual information 3.67
Help memory of textual information 3.83
Quality image 3.83
10 Representative of textual information 3.38
Help memory of textual information 3.38
Quality image 3.38

44
As can be gleaned from Table 4., only one mean was not above a three on a four
point scale. Image 5 did not meet the requirements because one of the means was below
three (Help memory of textual information = 2.88). Since the other categories both met
the criteria, the image and feedback provided by the experts were carefully reviewed by
the research team. Consequently, the text from the Discovering Australia text was
modified to reflect more information about the image.
After validating the representational characteristics of the images, the images
were incorporated into a multimedia intervention along with each passage for the Image
Present groups (NP, MP, FP, and VP). Onscreen text, aside from the Discovering
Australia title, was not incorporated into the imagery to avoid a split-attention effect. The
narrative was digitally recorded by an English speaking male, and subsequently
incorporated into the multimedia intervention. For instance, the passage shown in Figure
5 was taken from the Discovering Australia text. The first paragraph contains the
information represented in the image, and the second paragraph does not.
Figure 5. City of Sydney passage from Discovering Australia.
A picture corresponding to the first paragraph about the City of Sydney is shown
in Figure 6. The Sydney Harbour Bridge is described as the second largest steel-arch
At roughly the southeast corner of Australia lays Sydney, a city built around water that offers many recreational activities involving the sun, sand, and surf. The city’s location also supports the bustling shipping industry of Port Jackson, which is crossed by Sydney Harbour Bridge, the second longest steel-arch bridge in the world. From the south shore of the port juts the downtown area and Circular Quay, the focus for ocean liners, commuter ferries, and the financial district. Australia was first sighted by the Dutch almost four centuries ago and they were followed by the English explorer Captain James Cook who sighted the country in 1770. It wasn’t until eighteen years later that the first colony was established by Captain Arthur Phillip as a place for the many convicts who crowded the debtor prisons of England. Successive waves of convicts contributed to the swelling population of the state until 1868 when Britain finally discontinued penal settlements.
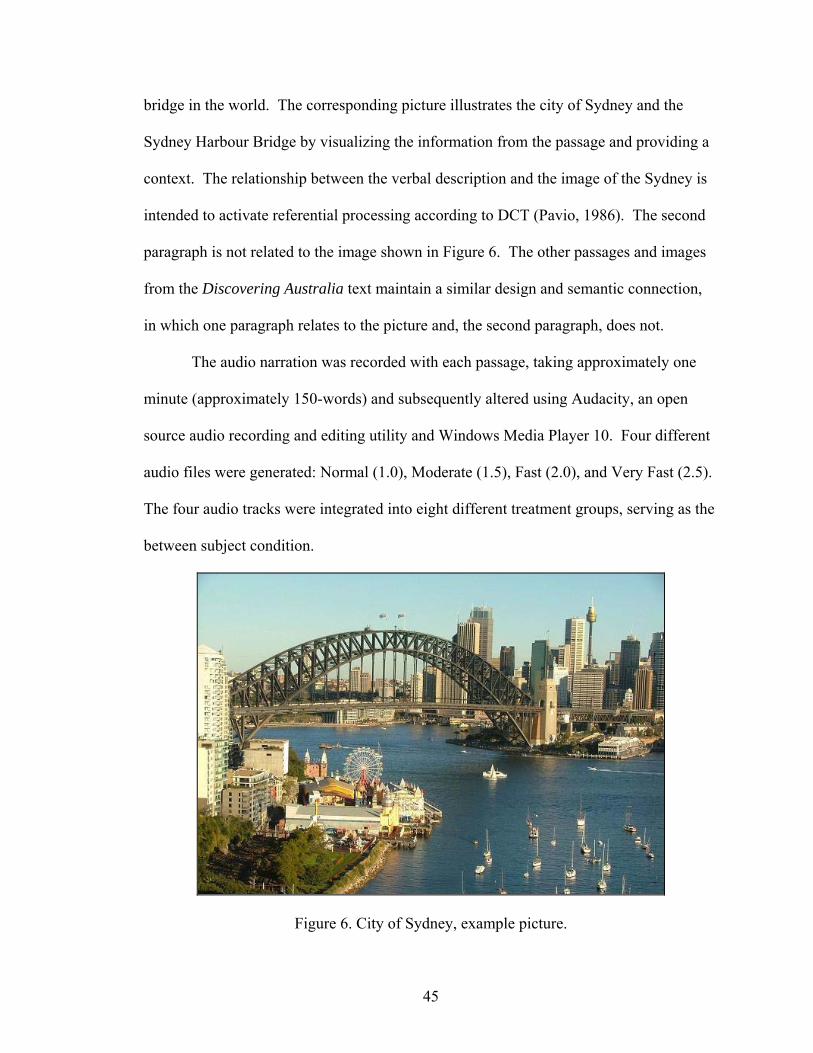
45
bridge in the world. The corresponding picture illustrates the city of Sydney and the
Sydney Harbour Bridge by visualizing the information from the passage and providing a
context. The relationship between the verbal description and the image of the Sydney is
intended to activate referential processing according to DCT (Pavio, 1986). The second
paragraph is not related to the image shown in Figure 6. The other passages and images
from the Discovering Australia text maintain a similar design and semantic connection,
in which one paragraph relates to the picture and, the second paragraph, does not.
The audio narration was recorded with each passage, taking approximately one
minute (approximately 150-words) and subsequently altered using Audacity, an open
source audio recording and editing utility and Windows Media Player 10. Four different
audio files were generated: Normal (1.0), Moderate (1.5), Fast (2.0), and Very Fast (2.5).
The four audio tracks were integrated into eight different treatment groups, serving as the
between subject condition.
Figure 6. City of Sydney, example picture.

46
Criterion Measures. Twenty constructed-response questions were created from
the Discovering Australia text (see Appendix B). The instrument is titled Recall-
Australia. An example of the feature-related cued-recall item pertaining to Figure 5 and
Figure 6 is “Describe some of the characteristics of the Sydney Harbour Bridge”. This
item prompts for the recall of feature-related information and can be activated
referentially from verbal or visual information. An example item pertaining to the
nonfeature-related content would be “Who was the explorer that sighted Australia in
1770?” This item pertains to verbal information in the passage and does not directly
describe the information in the image. No recall items were developed for the
introductory passage.
A rubric was developed to assess each individual constructed response item. The
rubrics underwent two iterations using pilot study data. One point was awarded for a
response that captured the gist of the correct answer, two points were awarded to a
response that was more elaborate in nature or precise in nature, and no points were
awarded for incorrect or no responses. Correct answers had to contain verbal information
from the passage – not simply a description of a picture. Two members of the research
team, having no knowledge of the groups, independently scored a small sample (n=20) of
the protocols from Recall-Australia using the rubric, including all 20 items in each
protocol. Inter-rater reliability was calculated at 83.5%. Next, the raters resolved scoring
differences in conference until inter-rater agreement exceeded 95%, and updated the
rubric to reflect the necessary changes.
The data were randomly split and scored by the raters. To assure the accuracy of
the scoring process, the graders remained within the same room and scored one item at a

47
time on a computer. If a situation arose in which a grader was unsure how to score the
response, the two graders would discuss the response until consensus was reached.
Additionally, the graders compared scores and answers to promote consistency, and
recalculated inter-rater reliability on a small sample. Inter-rater reliability was calculated
on two more occasions at 100% the first time and 95% the second. Internal consistency
reliability was calculated using Cronbach’s alpha at α = .79 for these data. The item-to-
total correlations for the scale ranged from r=.16 to r=.59.
Additionally, 20 multiple choice questions were created based on the narrative,
serving as content recognition. The multiple-choice questions were developed in a
consistent format following established guidelines (Gronlund, 1998). Each stem posed
one question for learners to consider, and the distracters were written as likely true/false
statements with only one correct statement. This instrument was named Recognition-
Australia (see Appendix C). The responses were scored dichotomously, and internal
consistency reliability was calculated for the scale using Kuder-Richardson 20 at K-R 20
= .631 for these data. The item-to-total correlations for the scale ranged from r=.03 to
r=.4. Both the Recall-Australia and Recognition-Australia instruments were reviewed by
instructional technology faculty and instructional technology doctoral students for clarity,
accuracy, and content validity. Both instruments were also subjected to two sets of
revisions from pilot studies.
The satisfaction instrument used 14 items from a previous study which were
adapted for the current study (Gomes, Ritzhaupt & Barron, 2006; Lyskawa, 2001). The
instrument was split into two parts. The first part uses a five point semantic differential
scale with two bipolar adjectives on both sides. For instance, on the left-most side was

48
the word “negative” and on the right-most side was the word “positive”. This scale was
slightly modified using established recommendations and common word-pairs (Osgood,
Suci, & Tannenbaum, 1957). The second part of the instrument used a modified Likert
ranging from Strongly Disagree to Strongly Agree. The items were designed to measure
a learner’s satisfaction with the intervention. For instance, one item stated “The narrator
spoke clearly in the Discovering Australia tutorial”. The instrument was named
Satisfaction-Audio (see Appendix D), and had an internal consistency reliability at α =
.94 for these data. The item-to-total correlations for the scale ranged from r=.61 to r=.8.
Computer Programs. Using the digitally recorded narrative, pictures, and
instruments, a computer program was created for each of the eight treatment groups using
Authorware 4.0. The computer program included brief instructions (shown in Appendix
H) and was installed on an equal number of personal computers with headsets attached in
a computer lab with ample space between computers to prevent participants’ casual
viewing of alternate treatments. The computer programs were designed for an 800 x 600
screen resolution, and thus, computer monitors were set to this screen resolution. The
estimated length and wpm by Audio Speed are shown in Table 5.
Table 5. Estimated Intervention Speeds and Words per Minute (wpm)
Audio Speed Presentation Length Estimated WPM*
Normal (1.0) 11 minutes 150
Moderate (1.5) 7.3 minutes 225
Fast (2.0) 5.5 minutes 300
Very Fast (2.5) 4.4 minutes 375

49
To test the usability of the interventions, research participants were assigned to
each of the eight computer programs. The purpose of the usability testing was to assure
that the instructions and the tasks to be performed while in the environment were clear.
A member of the research team observed each participant, and interviewed the
participants using a think-aloud protocol (Fonteyn, Kuipers & Grobe, 1993). The
interventions were deemed suitable as the participants indicated they understood the
instructions and tasks to be performed.
Procedures
After making prior arrangements with course instructors, the researcher visited
classes to inform students that they may receive extra-credit toward the course grade by
participating in the research study. The purpose and tasks involved in the research were
briefly outlined as a sign-up sheet (see Appendix J) was distributed, passed around, and
signed by interested participants and collected by the researcher.
Upon arriving at a research session, participants were assigned to a workstation
with the computer program already configured and a headset with equal volume settings.
The participant-to-intervention assignment involved the researcher using a stack of
randomly ordered, labeled cards that corresponded to a workstation with one of the eight
treatments installed. One of these cards was provided to each participant upon entering
the room, and the participant was instructed to sit at the corresponding workstation. The
procedure was continued across research sessions until all the cards had been used
without replacement. After the stack of cards, had been completely traversed, a new deck
of cards was formed to continue the process. Though not a completely random
assignment, this assignment method was adopted to keep the number of participants in

50
each group relatively balanced and to increase the independence of the observations.
Again, the researcher briefly outlined the tasks to be performed, informed
participants the research was a voluntary process and anonymous, urged them to try their
best and not to discuss the contents of the Discovering Australia with any peers that had
not yet completed the session (see Appendix G). Participants who chose to stay initiated
the program. After the introduction, participants started the program and read a specific
explanation of the tasks to be completed (see Appendix H). The following screen
included a button that could be clicked for a sound test. At that time, participants
adjusted the volume of their program prior to starting the intervention. Next, basic
demographic information, including classification, gender, major, age, and whether
English is their second language was collected for descriptive purposes.
Figure 7. Feature information map with introductory passage.
All participants were presented with a map, shown in Figure 7, containing feature
information about each of the locations discussed in the Discovering Australia text and
the introductory passage at the assigned speed. Participants in the NP, MP, FP, and VP

51
groups were presented with a picture and one passage of narration semantically related to
the graphical image as well as nonfeature-related content. Participants in the NA, MA,
FA, and VA groups were only presented with the narration and a neutral shape of
Australia, shown in Figure 8, without any feature information, to prevent participants
from distractions in the lab.
Prior to the start of the narration in all groups, a soft beep-like sound signaled the
participant that the narration would start. Once the narration was complete, a button
appeared, vertically-centered at the bottom of all interventions to move to the next screen.
Participants were instructed to use this time to reflect on the information from the
passage. To prevent an ordering effect, passages were randomly assigned by the program
until all passages had been traversed by the participant.
Figure 8. Neutral map of Australia.
After completing the 11 passages of narration (one for each passage of the story),
participants completed three 3-column addition problems designed to clear working

52
memory in an effort to test the more durable effects of the intervention. Participants were
then instructed that during recall task they would have 45-seconds to provide a response
(see Appendix H). Next, the participant provided answers to the items on the Recall-
Australia instrument. If the participant exceeded the time limit, any information that had
been typed was secured as the response. The screen indicated how much time they had
left with an animated count down clock.
Next, participants were provided instructions about the recognition task followed
by the items on the Recognition-Australia instrument. Presenting the Recall-Australia
instrument before the Recognition-Australia instrument was selected to prevent a testing
effect (e.g., seeing the descriptors from a multiple-choice question might influence a
constructed-response). The items in both the Recall-Australia and Recognition-Australia
instruments were randomly assigned until all items were traversed by the participant.
Next, the participants completed Satisfaction-Audio instrument.
Participants assigned to the faster audio speeds, Fast and Very Fast, were assigned
an additional reading activity titled How the Water Got to the Plain spread out over three
computer screens after responding to the instruments (see Appendix F). How the Water
Got to the Plain is an indigenous story about Australia, approximately 500-words in
length, and intended to act as a buffer while participants in the normal and moderate
audio groups finished their treatment. This diminished the influence of participants being
distracted by participants leaving the room. Finally, participants were thanked for
participating in the study and provided with the contact information of the research team.
Figure 9 illustrates the instructions, intervention and data collection in the sequence of the
computer programs.

53
Figure 9. Research intervention sequence.
Data Analysis
The Recognition-Australia, Recall-Australia, and Satisfaction-Audio responses
were scaled from zero to one. Prior to conducting any inferential statistics, basic
descriptive statistics were investigated. The results were presented in a tabular form with
regards to the two independent variables under investigation (Adjunct Image, Audio
Speed), including the mean responses, and standard deviations. A Levene’s test was used
to test for the assumption of homogeneity of the variance, and the skewness and kurtosis
were used to evaluate the normality assumption. The data are assumed to be independent
because of the methodical assignment procedures. Finally, a series of ANOVA
procedures were conducted with a Tukey follow up procedure if significant differences
were found. The p-values, F-statistic, power, partial η2 and tables summarizing the
information are reported in Chapter 4.
Pilot Study Results
Two pilot studies were conducted with the instructional materials and
instruments. Thirty-five students participated in the first pilot study, and 34 participated
in the second. The narration-only groups at a normal speed and fast speed (NA=15,
FA=20) were examined in the first pilot study, and the narration-only groups at a normal
speed and very fast speed (NA=15, VA=19) in the second pilot. The purpose of the pilot
studies was three-fold: 1) to test the multimedia materials, 2) to determine if there was a
significant difference between the FA and NA or VA and NA groups, and 3) validate and
Introduction Demographics Volume
Assigned Treatment
Recall-Australia Questions
Recognition-Australia Questions
Satisfaction Survey and Final Screen
54
improve the instrumentation prior to the final study.
There were some important differences between the current study and the first
pilot study. First, from the interviews with students in the first pilot study, it was
discovered that participants needed a signal to indicate the start of the audio in a given
passage. Second, the researcher noticed that participants were distracted by students in
the FA group finishing before them. Thus, the buffer story was added to the current
study. Finally, as an outcome of the pilot study, it was decided to increase the fastest
audio speed to 2.5 times (VA) the regular rate as there were no significant differences
between the FA and NA groups. Though significant differences were not identified on
recall or recognition, the NA group had higher overall scores in recall, recognition and
satisfaction from the first pilot study.
In the second pilot study, the Recognition-Australia instrument resulted in a lower
than expected internal consistency reliability with the K-R 20 = .60. However, this was
an improvement from the first pilot study at K-R 20 = .56, since the instrument was
modified using accepted guidelines for multiple-choice item construction. Cronbach’s
alpha for the Recall-Australia instrument was calculated at α = .79 for the second pilot
study, which is actually a decline from the first pilot study at α = .86. This can be
explained by the VA treatment group as, overall, participants in this treatment group
performed significantly less on the scale than did the FA group.
The results from the second pilot study are presented here. The NA scaled mean
scores on content recognition, cued-recall, and satisfaction were 0.61 (SD=0.16), 0.19
(SD=0.11), and 0.68 (SD=0.12). The VA scaled mean scores on content recognition,
cued-recall, and satisfaction were 0.47 (SD=0.14), 0.1 (SD=0.06), and 0.41 (SD=0.14).

55
There was a significant main effect between the NA and VA treatments on recall,
recognition, and satisfaction at F(1, 32)=10.51, p<.01, partial η2=.24, F(1, 32)=7.42,
p=.01, partial η2 =.19, and F(1, 32)=35.38, p<.01, partial η2=.53, respectively. Unlike the
first pilot study, a significant difference was identified on each of the dependent
measures.
From the second pilot study results, the final study was deemed appropriate. Only
one minor modification to an item on the Recall-Australia instrument was made prior to
the final study. Graphics illustrating the differences between the NA and VA group are
provided in Appendix K.
Summary
This chapter provided a detailed overview of the method employed in this study,
including the research design, target participants, instructional materials, procedures, and
an overview of the statistical analysis techniques used on these data. Strides were made to
connect instructional and research design decisions back to previous multimedia learning
research literature discussed within chapter 2. Finally, this chapter provided an overview
of two pilot studies that were executed prior to the final research study. The results of the
second research study were provided as well as explanations of changes made from the
first pilot study.

56
Chapter Four
Results
This chapter reports the analyses performed on these data. Data analysis is based
on 305 research participants assigned to one of eight experimental treatments varying
Audio Speed and Adjunct Image. The dependent measures included cued-recall, content
recognition and satisfaction. The results of this study are based on a series of factorial
Analysis of Variance (ANOVA) procedures using the treatments and dependent measures
described. The level of significance for all statistical analysis was set at α = .05. All data
analyses were conducted using SPSS Version 15.
Overall Descriptive Statistics
Three-hundred five research participants attended a one hour research session.
Participants were assigned to a treatment using a standard assignment procedure. Table 6
displays the participant distribution by Audio Speed and Adjunct Image conditions. All
participants completed the study, and thus, there was no missing data.
Table 6. Participant Distribution to Treatment Groups
Adjunct Image
Audio Speed Absent (A) Present (P) Total
Very Fast (V) 39 40 79
Fast (F) 38 38 76
Moderate (M) 38 38 76
Normal (N) 37 37 74
Total 152 153 305

57
Because the assignment procedure used was targeted at an even distribution of
research participants across treatment groups, the study resulted in a relatively balanced
allocation. To assure the procedure did not result in inequitable treatment assignments to
a particular demographic group, the Chi-Square test (α=.05) was executed across
treatment assignments and gender, classification, and college. These results show that the
gender, college classification, and college of a participant in the sample did not differ
significantly from the hypothesized values χ2=8.673 (p=.277), χ2=26.151 (p=.565), and
χ2=47.452 (p=.078), respectively. This is an indication that the assignment procedure was
not biased on these particular demographics.
General Linear Model (GLM) procedures for ANOVA were used to examine the
data. Type III Sums-of-Squares was selected because it corresponds to the variation
attributable to an effect after correcting for any other effects in the model and is robust to
situations with unequal distributions per condition. The general assumptions of ANOVA
are threefold, and thus, the results of the ANOVA are dependent upon how well the study
met the following assumptions:
1. The observations are normally distributed in each group.
2. The variance for the groups is equal (homogeneity of the variance).
3. The observations are independent.
Normality was investigated by exploring the skewness and kurtosis values for
each treatment group and dependent measure. As can be gleaned by Table 7, Table 8, and
Table 9, there were no severe departures from normality as the skewness and kurtosis
values are within acceptable ranges. Homogeneity of variance is robust except in

58
occasions of largely unequal group sizes. This assumption is tested in two ways. First, a
test was conducted to test the inequality of the cell sizes. The largest cell size (402) is
divided by the smallest cell size (372) to test for homogeneity of variance (1.16 < 1.5),
which falls well within the range of acceptability. Second, the Levene’s test for
dependent measure was used.
Violations of the independence of each observation are the greatest threat to this
research. Consequently, each research participant was assigned to a treatment group
using a systematic procedure. Additionally, the research participants were instructed not
to discuss the contents of the Discovering Australia tutorial with participants who had not
yet completed the research session. The independence assumption is tenable in this
research, and thus, the results should not be threatened by the assumption. All data were
scaled from 0 to 1 to improve interpretability.
Table 7 shows the overall descriptive statistics for cued-recall in each of the eight
conditions as well as the total. Average performance on cued-recall ranged from 16% to
32% across the eight treatments, while individual scores ranged from 0% to 68%.
Skewness and kurtosis for all the eight conditions on cued-recall are within the
acceptable range of -1 to 1, inclusive. This demonstrates the cued-recall data were
normally distributed in each group.
Table 7. Descriptive Statistics for Cued-Recall by Treatment Conditions.
Speed Picture M SD n Skewness Kurtosis Min. Max.
F A 0.24 0.16 38 0.23 -0.98 0.00 0.55
P 0.28 0.14 38 0.22 -0.44 0.05 0.63
Total 0.26 0.15 76 0.18 -0.76 0.00 0.63
M A 0.23 0.15 38 0.51 -0.59 0.00 0.58

59
Speed Picture M SD n Skewness Kurtosis Min. Max.
P 0.28 0.13 38 0.80 1.52 0.05 0.68
Total 0.26 0.14 76 0.53 0.16 0.00 0.68
N A 0.28 0.16 37 0.59 -0.12 0.05 0.65
P 0.32 0.13 37 0.24 -0.37 0.10 0.65
Total 0.30 0.14 74 0.39 -0.33 0.05 0.65
V A 0.16 0.08 39 0.35 -0.08 0.00 0.35
P 0.18 0.09 40 0.19 -0.70 0.03 0.38
Total 0.17 0.09 79 0.29 -0.48 0.00 0.38
Total A 0.23 0.14 152 0.66 -0.12 0.00 0.65
P 0.26 0.13 153 0.49 0.08 0.03 0.68
Total 0.25 0.14 305 0.55 -0.11 0.00 0.68
Table 8 shows the overall descriptive statistics for content recognition in each of
the eight conditions as well as the total. Average performance on content recognition
ranged from 42% to 56%, while individual scores ranged from 10% to 85%. Skewness
and kurtosis for all the eight conditions on content recognition are within the acceptable
range of -1 to 1, inclusive. This demonstrates the content recognition data did not violate
the normality assumption.
Table 8. Descriptive Statistics for Content Recognition by Treatment Conditions
Speed Picture M SD n Skewness Kurtosis Min. Max.
F A 0.49 0.17 38 -0.01 -0.82 0.15 0.85
P 0.54 0.15 38 -0.42 0.12 0.15 0.80
Total 0.52 0.16 76 -0.23 -0.55 0.15 0.85
M A 0.48 0.16 38 0.27 -0.90 0.20 0.80
P 0.53 0.14 38 0.43 -0.17 0.30 0.85

60
Speed Picture M SD n Skewness Kurtosis Min. Max.
Total 0.51 0.15 76 0.25 -0.59 0.20 0.85
N A 0.53 0.15 37 -0.02 -0.55 0.25 0.85
P 0.56 0.15 37 -0.36 -0.29 0.25 0.85
Total 0.54 0.15 74 -0.18 -0.52 0.25 0.85
V A 0.42 0.13 39 -0.27 0.81 0.10 0.70
P 0.43 0.13 40 0.68 0.93 0.15 0.80
Total 0.42 0.13 79 0.23 0.79 0.10 0.80
Total A 0.48 0.16 152 0.13 -0.50 0.10 0.85
P 0.51 0.15 153 0.07 -0.47 0.15 0.85
Total 0.50 0.15 305 0.08 -0.49 0.10 0.85
Table 9 shows the overall descriptive statistics for satisfaction in each of the eight
conditions as well as the total for all groups. Average satisfaction ranged from 41% to
72%, while individual scores ranged from 20% to 94%. Skewness and kurtosis for all the
eight conditions on satisfaction are within the acceptable range of -1 to 1, inclusive. This
demonstrates the satisfaction data did violate the normality assumption.
Table 9. Descriptive Statistics for Content Recognition by Treatment Conditions
Speed Picture M SD n Skewness Kurtosis Min. Max.
F A 0.48 0.14 38 0.67 0.85 0.21 0.89
P 0.55 0.16 38 -0.52 -0.27 0.20 0.84
Total 0.51 0.16 76 0.05 -0.43 0.20 0.89
M A 0.56 0.16 38 0.03 -0.38 0.21 0.89
P 0.60 0.15 38 0.08 -0.44 0.31 0.94
Total 0.58 0.16 76 0.02 -0.41 0.21 0.94
N A 0.68 0.14 37 -0.81 1.17 0.29 0.91

61
Speed Picture M SD n Skewness Kurtosis Min. Max.
P 0.72 0.09 37 -0.17 -0.76 0.54 0.87
Total 0.70 0.12 74 -0.97 2.10 0.29 0.91
V A 0.41 0.15 39 -0.06 -1.21 0.20 0.70
P 0.41 0.14 40 0.26 -0.57 0.20 0.71
Total 0.41 0.14 79 0.09 -0.93 0.20 0.71
Total A 0.53 0.18 152 0.04 -0.61 0.20 0.91
P 0.57 0.18 153 -0.33 -0.70 0.20 0.94
Total 0.55 0.18 305 -0.14 -0.72 0.20 0.94
Relationships among Dependent Measures
As shown in correlation matrix in Table 10, the Pearson product-moment
correlation coefficients among the dependent measures were statistically significant in
each pair-wise case. The relationship between the cued-recall and content-recognition
measures had the strongest, positive correlation at r = 0.79 (p < .01), which attests to the
parallel nature of the items and content across the two instruments and the differences
between the cognitive tasks. The relationships between both the content recognition and
cued-recall and learner satisfaction were significant and strong, but not at the same
magnitude. These correlations indicated that, generally, those participants who were able
to answer more questions correctly, were more satisfied with the experience.
Table 10. Correlation Matrix among Dependent Measures
Learner Satisfaction Content Recognition Cued-Recall
Satisfaction 1** - -
Content Recognition 0.43** 1** -
Cued-Recall 0.52** 0.79** 1**
**p < .01

62
Cued-Recall
Descriptive Statistics. Cued-recall was measured using a 20-item cued-recall
instrument named Recall-Australia, in which participants provided constructed response
answers to each question. Cronbach’s alpha was .79 for these data. Prior to analysis, the
results were scaled from 0 to 1 to improve the interpretability of the results. Table 11
presents the scaled mean, standard deviation and 95% confidence intervals for cued-recall
performance by Audio Speed and Adjunct Image.
Table 11. Mean, Standard Deviation and Confidence Intervals for Scaled Cued-recall by
Audio Speed and Adjuct Image
Adjunct Image
Absent Present
Audio Speed Mean SD C.I. LB C.I. UB Mean SD C.I. LB C.I. UB
Very Fast 0.16 0.08 0.12 0.20 0.18 0.10 0.14 0.22
Fast 0.24 0.16 0.20 0.28 0.28 0.14 0.24 0.33
Moderate 0.23 0.15 0.19 0.28 0.28 0.13 0.24 0.32
Normal 0.28 0.16 0.24 0.32 0.32 0.13 0.27 0.36
C. I. LB = Confidence Interval Lower Bound (95%); C. I. UB = Confidence Interval Upper Bound (95%).
Analysis of Variance. Prior to testing, Levene’s test was conducted to test for
homogeneity of the variance. For the recall scale, it was calculated at F(7, 297)=3.451, p
< .01, which indicates that the variance of the recall measure was not equal across groups.
Though not a satisfactory finding, ANOVA is robust to violations of homogeneity of the
variance (Stevens, 1990). All main and interaction effects for cued-recall scores were
examined in an Audio Speed x Adjunct Image factorial with both Audio Speed and
Adjunct Image serving as between subject conditions and cued-recall serving as the

63
dependent measure. The results of the ANOVA are shown in Table 12.
Table 12. Analysis of Variance for Cued-Recall.
Source Sum-of-Squares df Mean-Square F-Value p
Audio Speed 0.68 3 0.23 12.96 < .01
Adjunct Image 0.10 1 0.10 5.59 .02
Audio Speed * Adjunct Image 0.01 3 < 0.00 0.13 .95
Error 5.22 297 0.02
The results show there was not a statistically significant interaction between the
four Audio Speed and two Adjunct Image conditions on cued-recall. The interaction
effect for Audio Speed and Adjunct Image is at F(3, 297) = 0.13, p = .95, partial η2 < .01.
Therefore, the null hypothesis for research question 7 cannot be rejected at a .05 level.
Further, only 0.1% of the variability can be attributed to this interaction effect as shown
by the minute partial η2.
The results show there is a significant difference on cued-recall based on the four
Audio Speed treatments as there is a statistically significant main effect at F(3, 297) =
12.96, p < .01, partial η2= 0.12. Therefore, the null hypothesis for research question 1 can
be rejected at a .05 level. Though the main effect is statistically significant, the partial η2
of .12 indicates only 12% of the variability can be explained by the audio speed.
The results also show there is a significant difference on cued-recall based on the
presence or absence of a representational adjunct image. The main effect for Adjunct
Image is at F(1, 297) = 5.59, p = .02, partial η2 = 0.02. Therefore, the null hypothesis for
research question 4 can be rejected at a .05 level. The partial η2 of .02 shows that only 2%
of the variability can be explained by the presence of an adjunct image.

64
Figure 10 illustrates the mean cued-recall performance by the four Audio
Speeds (Normal=1.0, Moderate=1.5, Fast=2.0, and Very Fast=2.5) along the x-axis and
mean cued-recall performance along the y-axis. From the graphic, it is relatively clear the
Adjunct Image present treatment outperformed the Adjunct Image absent treatment
across all Audio Speed conditions.
0
0.05
0.1
0.15
0.2
0.25
0.3
0.35
0.4
0.45
0.5
Very Fast Fast Moderate Normal
Mea
n Pe
rcen
t Cue
d R
ecal
l
AbsentPresent
Figure 10. Mean percent cued-recall by Audio Speed and Adjunct Image treatments.
Finally, a Tukey HSD follow up procedure was used to investigate the pair-wise
comparisons among the Audio Speeds on recall. The results show the participants in the
Very Fast audio condition performed significantly less than the Normal (Mean
Difference=-0.13, p < .01), Moderate (Mean Difference=-0.09, p < .01), and Fast (Mean
Difference=-0.10, p < .01) audio conditions. Since there were only two Adjunct Image
groups, a Tukey follow up procedure cannot be used for this main effect.

65
Content Recognition
Descriptive Statistics. Content recognition was measured using a 20-item
multiple-choice instrument named Recognition-Australia. Kuder-Richardson 20 was .63
for these data. Prior to analysis, the results were scaled from 0 to 1 to illustrate the
proportion of correctly answered items. Table 13 illustrates mean, standard deviation, and
scaled and 95% confidence intervals for content recognition performance by Audio
Speed and Adjunct Image.
Table 13. Mean, Standard Deviation and Confidence Intervals for Scaled Content
Recognition by Audio Speed and Adjunct Image
Adjunct Image
Absent Present
Audio Speed Mean SD C.I. LB C.I. UB Mean SD C.I. LB C.I. UB
Very Fast 0.42 0.13 0.37 0.47 0.43 0.13 0.38 0.47
Fast 0.50 0.17 0.45 0.54 0.54 0.15 0.50 0.59
Moderate 0.48 0.16 0.43 0.53 0.53 0.14 0.48 0.58
Normal 0.53 0.15 0.49 0.58 0.56 0.15 0.51 0.60
C. I. LB = Confidence Interval Lower Bound (95%); C. I. UB = Confidence Interval Upper Bound (95%).
Analysis of Variance. A Levene’s test was conducted to test for homogeneity of
variance. For the recognition scale, it was calculated at F(7, 297)= 1.78, p = .09, which
indicates that the variances of the content recognition measure were equal across groups.
All main and interaction effects for recognition scores were examined in an Audio Speed
x Adjunct Image factorial with both Audio Speed and Adjunct Image serving as between
subject conditions and recognition serving as the dependent measure. The results of the
ANOVA are shown in Table 12.

66
Table 14. Analysis of Variance for Content Recognition
Source Sum-of-Squares df Mean-Square F-Value p
Audio Speed 0.64 3 0.21 9.74 < .01
Adjunct Image 0.07 1 0.07 3.26 .07
Audio Speed * Adjunct Image 0.02 3 0.01 0.37 .77
Error 6.47 297 0.02
The results show there was not a statistically significant interaction between the
four Audio Speed and two Adjunct Image conditions on content recognition. The
interaction effect for Audio Speed and Adjunct Image is at F(3, 297) = 0.37, p = 0.77,
partial η2 < .01. Therefore, the null hypothesis for research question 8 cannot be rejected
at a .05 level. Further, only 0.4% of the variability can be attributed to this interaction
effect as shown by the trivial partial η2.
The results show there is a significant difference on content recognition based on
the four Audio Speed treatments as there is a statistically significant main effect at F(3,
297) = 9.74, p < .01, partial η2 = 0.09. Therefore, the null hypothesis for research question
2 can be rejected at a .05 level. The main effect, analogous to the cued-recall measure,
has a relatively small partial η2, and in this case, shows that the audio speed only explains
9% of the variability.
The results also show there is not a significant difference on content recognition
based on the presence or absence of a representational adjunct image. The main effect for
Adjunct Image is at F(1, 297) = 3.26, p = .07, partial η2 = 0.01. Therefore, the null
hypothesis for research question 5 cannot be rejected at a .05 level. As in the cued-recall
scenario, the main effect for recognition has a minor partial η2 for the Adjunct Image

67
condition, and thus only explains 1% of the variability.
Figure 11 illustrates the mean recognition performance by the four Audio Speeds
(Normal=1.0, Moderate=1.5, Fast=2.0, and Very Fast=2.5) along the x-axis and mean
recognition performance along the y-axis. From the graphic, it is relatively clear the
Adjunct Image present treatment outperformed the Adjunct Image absent treatment
across all Audio Speed conditions, but this relationship is not statistically significant.
0
0.1
0.2
0.3
0.4
0.5
0.6
0.7
Very Fast Fast Moderate Normal
Mea
n P
erce
nt R
ecog
nitio
n
AbsentPresent
Figure 11. Mean percent recognition by Audio Speed and Adjunct Image treatments.
Finally, a Tukey HSD follow up procedure was used to investigate the pair-wise
comparisons among the Audio Speeds on recognition. The results show the participants
in the Very Fast audio condition performed significantly less than the Normal (Mean
Difference=-0.12, p < .01), Moderate (Mean Difference=-0.08, p < .01), and Fast (Mean
Difference=-0.10, p < .01) audio conditions. Since there were only two Adjunct Image
groups and the main effect was statistically insignificant, a Tukey follow up procedure
cannot be used to investigate this main effect.

68
Learner Satisfaction
Descriptive Statistics. Learner satisfaction was measured using a 14-item
instrument named Satisfaction-Australia, in which participants responded to a Likert and
semantic differential scale item format. Cronbach’s alpha was .94 for these data. Prior to
analysis, the results were scaled from 0 to 1 to improve the interpretability of the results
and serve as an overall indicator of learner satisfaction. The calculation was the
summation of the participant item responses divided by the summation for the highest
possible response (all on a 5-point scale). Table 15 illustrates the scaled mean and
standard deviation of learner satisfaction by Audio Speed and Adjunct Image.
Table 15. Mean, Standard Deviation and Confidence Intervals for Scaled Satisfaction by
Audio Speed and Adjunct Image
Adjunct Image
Absent Present
Audio Speed Mean SD C.I. LB C.I. UB Mean SD C.I. LB C.I. UB
Very Fast 0.41 0.15 0.37 0.46 0.41 0.14 0.37 0.46
Fast 0.48 0.14 0.43 0.52 0.55 0.16 0.51 0.60
Moderate 0.56 0.16 0.52 0.61 0.60 0.15 0.55 0.64
Normal 0.68 0.14 0.63 0.73 0.72 0.09 0.68 0.77
C. I. LB = Confidence Interval Lower Bound (95%); C. I. UB = Confidence Interval Upper Bound (95%).
The item statistics for learner satisfaction scale are presented in Table 16 and
Table 17. Table 16 illustrates the response frequency percentages and descriptive
statistics for each item used in the Likert scale items for all treatment groups. The results
are positive in that most participants found the information easy to hear and that the
narrator spoke clearly in the Discovering Australia tutorial (Mean > 3.0).

69
Table 16. Satisfaction Scale: Response Frequency Percentages, Mean and Standard
Deviation (Likert scale items)
Likert Scale Item Mean SD S.D. D. N. A. S.A.
I was comfortable with the speed of narration
in the Discovering Australia tutorial. 2.43 1.28 27.87 34.75 12.79 16.07 8.52
It was easy to understand the narrative
information in the Discovering Australia
tutorial.
2.88 1.33 19.34 25.25 14.75 29.18 11.48
It was easy to hear the information in the
Discovering Australia tutorial. 3.29 1.37 15.08 16.39 14.10 33.11 21.31
The narrator spoke clearly in the Discovering
Australia tutorial. 3.47 1.31 12.79 12.46 12.46 40.00 22.30
I think it was easy to remember the
information in the Discovering Australia
tutorial.
2.25 1.06 27.87 37.05 19.67 13.44 1.97
M=mean, SD=Standard deviation, S.D. = Strongly disagree, D. = Disagree, N. = Neither disagree, nor agree, A. = Agree, S.A. = Strongly agree.
Table 17 illustrates the response frequency percentages and descriptive statistics
for each item used in the semantic differential scale for all treatment groups. The results
show that most participants responded either positively or indifferently to the
Discovering Australia tutorial as a Positive and a Supportive experience. The aggregate
scores across treatments indicate most participants (more than 60%) felt the information
was Hard to Learn.
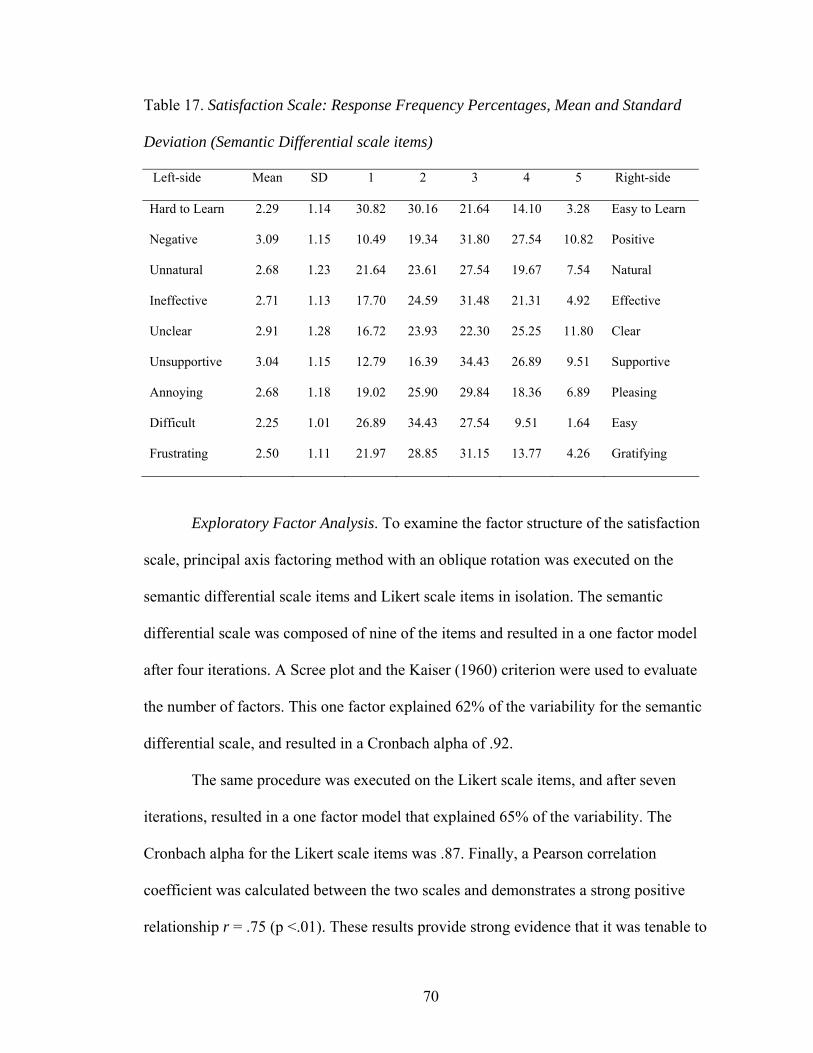
70
Table 17. Satisfaction Scale: Response Frequency Percentages, Mean and Standard
Deviation (Semantic Differential scale items)
Left-side Mean SD 1 2 3 4 5 Right-side
Hard to Learn 2.29 1.14 30.82 30.16 21.64 14.10 3.28 Easy to Learn
Negative 3.09 1.15 10.49 19.34 31.80 27.54 10.82 Positive
Unnatural 2.68 1.23 21.64 23.61 27.54 19.67 7.54 Natural
Ineffective 2.71 1.13 17.70 24.59 31.48 21.31 4.92 Effective
Unclear 2.91 1.28 16.72 23.93 22.30 25.25 11.80 Clear
Unsupportive 3.04 1.15 12.79 16.39 34.43 26.89 9.51 Supportive
Annoying 2.68 1.18 19.02 25.90 29.84 18.36 6.89 Pleasing
Difficult 2.25 1.01 26.89 34.43 27.54 9.51 1.64 Easy
Frustrating 2.50 1.11 21.97 28.85 31.15 13.77 4.26 Gratifying
Exploratory Factor Analysis. To examine the factor structure of the satisfaction
scale, principal axis factoring method with an oblique rotation was executed on the
semantic differential scale items and Likert scale items in isolation. The semantic
differential scale was composed of nine of the items and resulted in a one factor model
after four iterations. A Scree plot and the Kaiser (1960) criterion were used to evaluate
the number of factors. This one factor explained 62% of the variability for the semantic
differential scale, and resulted in a Cronbach alpha of .92.
The same procedure was executed on the Likert scale items, and after seven
iterations, resulted in a one factor model that explained 65% of the variability. The
Cronbach alpha for the Likert scale items was .87. Finally, a Pearson correlation
coefficient was calculated between the two scales and demonstrates a strong positive
relationship r = .75 (p <.01). These results provide strong evidence that it was tenable to

71
combine the two scales as an overall learner satisfaction indicator.
Analysis of Variance. Following the same procedures, Levene’s test was
conducted to test for homogeneity of variance. For the satisfaction scale, it was calculated
at F(7, 297)= 2.07, p = .05, which indicates that the variance of the satisfaction measure
was equal across groups. All main and interaction effects for satisfaction scores were
examined in an Audio Speed x Adjunct Image factorial with both Audio Speed and
Adjunct Image serving as between subject conditions and learner satisfaction serving as
the dependent measure. ANOVA results are shown in Table 18.
Table 18. Analysis of Variance for Learner Satisfaction
Source Sum-of-Squares df Mean-Square F-Value p
Audio Speed 3.39 3 1.13 54.73 < .01
Adjunct Image 0.11 1 0.11 5.26 .02
Audio Speed * Adjunct Image 0.06 3 0.02 0.92 .43
Error 6.12 297 0.02
The results show there was not a statistically significant interaction between the
four Audio Speed and two Adjunct Image conditions on learner satisfaction. The
interaction effect for Audio Speed and Adjunct Image is at F(3, 297) = 0.92, p = .43,
partial η2 = .01. Therefore, the null hypothesis for research question 9 cannot be rejected
at a .05 level. Again, at 1%, the interaction effect explains very little of the variability.
The results show there is a significant difference on learner satisfaction based on
the four Audio Speed treatments as there is a statistically significant main effect at F(3,
297) = 54.73, p < .01, partial η2 = .36. Therefore, the null hypothesis for research
question 3 can be rejected at a .05 level. The main effect, unlike the cued-recall or

72
content recognition measures, has a larger partial η2, indicating time-compression speed
explained 36% of the variability in learner satisfaction.
The results also show there is a significant difference on learner satisfaction,
similar to cued-recall and dissimilar to content recognition, based on the presence or
absence of a representational adjunct image. The main effect for Adjunct Image is at F(1,
297) =5.26, p = .02, partial η2 = .02. Therefore, the null hypothesis for research question
6 can be rejected at a .05 level. This main effect only explains 2% of the variability in
learner satisfaction.
Figure 12 illustrates the mean recognition performance by the four Audio Speeds
(Normal=1.0, Moderate=1.5, Fast=2.0, and Very Fast=2.5) along the x-axis and mean
learner satisfaction along the y-axis. From the graphic, it is relatively clear the learners
were more satisfied with Adjunct Image present treatment than the Adjunct Image absent
treatment across the Moderate, Fast, and Normal audio conditions.
0
0.1
0.2
0.3
0.4
0.5
0.6
0.7
0.8
Very Fast Fast Moderate Normal
Mea
n Pe
rcen
t Lea
rner
Sat
isfa
ctio
n
AbsentPresent
Figure 12. Mean percent learner satisfaction by Audio Speed and Adjunct Image

73
treatments.
Finally, a Tukey HSD follow up procedure was used to investigate the pair-wise
comparisons among the Audio Speeds. The results show the participants in the increased
Audio conditions were all significantly less satisfied than any time-compressed speed
other than normal. This finding is illustrated in Table 19, which shows the mean
differences and level of significance. Since there were only two Adjunct Image groups, a
Tukey follow up procedure cannot be used to investigate this main effect.
Table 19. Tukey Pair-wise Comparisons of Audio Speed on Learner Satisfaction
Audio Speeds Mean Difference p
Fast -0.10 < .01
Moderate -0.17 < .01
Very Fast
Normal -0.29 < .01
Moderate 0.07 0.028
Normal -0.19 < .01
Fast
Very Fast 0.10 < .01
Fast 0.07 .03
Normal -0.12 < .01
Moderate
Very Fast 0.17 < .01
Fast 0.19 < .01
Moderate 0.12 < .01
Normal
Very Fast 0.29 < .01

74
Summary
This chapter provided results from the execution of the method described in
chapter 3. Data analysis was based on 305 participants assigned to one of eight
experimental treatments varying Audio Speed and Adjunct Image. The dependent
measures included cued-recall, content recognition and learner satisfaction. A series of
factorial ANOVA procedures using the treatments and dependent measures was
described with an α = .05 for all statistical analyses.
To summarize, the results showed significant differences among Audio Speed on
every dependent measure. Main effects based on Adjunct Image for cued-recall and
satisfaction were also detected; however, no interaction effects were identified. The
following chapter will discuss these results in greater detail and provide some
recommendations in light of the results presented within this chapter.

75
Chapter Five
Discussion
The purpose of this research was to investigate the effects of time-compressed
audio and adjunct images on learners’ ability to recall and recognize information in a
time-compressed audio, multimedia learning environment. Additionally, this research
explored learner satisfaction of time-compressed audio and adjunct images used in
multimedia learning environments. This study explored the main and interaction effects
of four different Audio Speeds and two Adjunct Image conditions. A factorial design was
employed to examine relationships between these independent variables and their
influence on cued-recall, content recognition, and learner satisfaction.
A total of 305 research participants completed this study. The English language
was the primary language of 92% of the participants. Fifty-five percent of the participants
were male, with the remaining 45% female. Participants were recruited from 48 different
college undergraduate courses in five different colleges at a public university in the
southeastern United States. These participants comprise a strong sample of college
undergraduate students.
This chapter first summarizes the research questions and results followed by an in
depth discussion of how this study is similar and dissimilar to previous research findings.
Next, this chapter provides recommendations for learners, educators and instructional
designers about how time-compression and adjunct imagery might be integrated into
higher education. Finally, future research directions for educational researchers are
provided based on the results of the current study.

76
Summary of Research Questions and Results
Cued-Recall.
1. Is there a significant difference in cued-recall among learners listening to digitally
recorded audio at various time-compressed audio speeds (Normal=1.0,
Moderate=1.5, Fast=2.0, and Very Fast=2.5)?
A significant difference on cued-recall was detected among the four Audio
Speeds, and thus, the null hypothesis was rejected at the .05 level of significance.
2. Is there a significant difference in cued-recall among learners listening to digitally
recorded audio and presented with an adjunct image and learners not presented
with an adjunct image?
A significant difference on cued-recall was detected between the two
Adjunct Image conditions, and thus, the null hypothesis was rejected at the .05
level of significance.
3. Is there a significant interaction in cued-recall among learners listening to
digitally recorded audio with an adjunct image present or absent at various time-
compressed audio speeds (Normal=1.0, Moderate=1.5, Fast=2.0, and Very
Fast=2.5)?
A significant interaction on cued-recall was not identified among the four
Audio Speeds and two Adjunct Image conditions, and thus, the results fail to
reject the null hypothesis at the .05 level of significance.

77
Content Recognition.
1. Is there a significant difference in content recognition among learners listening to
digitally recorded audio at various time-compressed audio speeds (Normal=1.0,
Moderate=1.5, Fast=2.0, and Very Fast=2.5)?
A significant difference on content recognition was detected among the
four Audio Speeds, and thus, the null hypothesis was rejected at the .05 level of
significance.
2. Is there a significant difference in content recognition among learners listening to
digitally recorded audio and presented with an adjunct image and learners not
presented with an adjunct image?
A significant difference on content recognition was not identified between
the two Adjunct Image conditions, and thus, the results fail to reject the null
hypothesis at the .05 level of significance.
3. Is there a significant interaction in content recognition among learners listening to
digitally recorded audio with an adjunct image present or absent at various time-
compressed audio speeds (Normal=1.0, Moderate=1.5, Fast=2.0, and Very
Fast=2.5)?
A significant interaction on content recognition was not identified among
the four Audio Speeds and two Adjunct Image conditions, and thus, the results
fail to reject the null hypothesis at the .05 level of significance.
78
Learner Satisfaction.
1. Is there a significant difference in satisfaction among learners listening to digitally
recorded audio at various time-compressed audio speeds (Normal=1.0,
Moderate=1.5, Fast=2.0, and Very Fast=2.5)?
A significant difference on learner was detected among the four Audio
Speeds, and thus, the null hypothesis was rejected at the .05 level of significance.
2. Is there a significant difference in satisfaction among learners listening to digitally
recorded audio and presented with an adjunct image and learners not presented
with an adjunct image?
A significant difference on learner satisfaction was detected between the
two Adjunct Image conditions, and thus, the null hypothesis was rejected at the
.05 level of significance.
3. Is there a significant interaction in satisfaction among learners listening to
digitally recorded audio with an adjunct image present or absent at various time-
compressed audio speeds (Normal=1.0, Moderate=1.5, Fast=2.0, and Very
Fast=2.5)?
A significant interaction on learner satisfaction was not identified among
the four Audio Speeds and two Adjunct Image conditions, and thus, the results
fail to reject the null hypothesis at the .05 level of significance.
Discussion of Results
The following discussion highlights the effects between audio speeds and adjunct
images on cued-recall, content recognition, and learner satisfaction. Emphasis is placed
on new findings in relation to previous research. As previously discussed, the overarching
79
goals of this research were to illuminate time-compression technology in relation to
multimedia learning, fill the existing void and merge research literature, and to help
instructional designers, educators and students better understand time-compression
technology and adjunct imagery.
Cued-Recall. The results obtained from this research show that both audio speed
and adjunct images influence cued-recall, independently. However, the two independent
variables did not interact significantly in influencing cued-recall. This finding is
inconsistent with the predictions that under the highest audio-speed conditions, the
adjunct images would have the greatest effect on cued-recall.
The significant difference identified from audio speed was an expected outcome
as previous research has shown that a learner’s ability to comprehend information begins
to decline somewhere near 275 wpm (Fairbanks, Guttman, & Miron, 1957; Foulke, 1968;
Reid, 1968). The partial η2 = 0.12 shows that approximately 12% of the variability can be
explained by the audio speed, which is an interesting finding in that the fast audio
treatments were approximately 300 wpm. This may be an indication that the digital time-
compression algorithms employed have substantially improved the intelligibility of the
audio content from older methods of time-compression used in the 1950s and 1960s (e.g.,
SOLA). The Tukey HSD follow up procedure confirmed the significant differences were
identified between the Very Fast speed compared to the Fast, Moderate and Normal
speeds. This suggests the ceiling may have been raised due to substantial improvements
to time-compression technology. This research suggests the ceiling effect is somewhere
in the range of 300 to 375 wpm for this type of content.
The significant difference identified from adjunct images was also an expected

80
outcome as this is the basis for the multimedia effect or principle of learning (Mayer,
2001; Mayer & Moreno, 2002). This research lends credence to the multimedia principle
having a durable effect in educational research, even in conditions with accelerated
information penetrating the auditory/verbal channel. The proportion of variability
explained by the presentation of an adjunct image is only 2% (partial η2 = 0.02).
However, this may be attributable to the purposeful design of the Recall-Australia
instrument having 10 feature-related and 10 nonfeature-related items. This research also
demonstrates the value of other principles of multimedia learning. As mentioned, care
was taken in this research to avoid the split-attention effect and to enforce the redundancy
principle, which suggests individuals learn better from narration and images than from
narration, images and onscreen text (Mayer, 2001).
Content Recognition. Unlike the cued-recall findings, only audio speed
significantly influenced content recognition. The mean scaled performance on the content
recognition task is substantially higher than cued-recall, even though it was testing
similar content. This is an indication of the nature of the recognition task may be “easier”
for learners to complete when compared to cued-recall, and also an indication that
guessing may have contributed to measurement error in this research. The main effect for
adjunct image and the interaction effect between audio speed and adjunct image were
hypothesized to have a statistically significant effect on content recognition. The p-value
(p=.072) for the main effect showed variation, but failed to reach the .05 level.
The audio speed had a minor partial η2 = 0.09, and again, the Very Fast condition
resulted in significantly poorer performance than the other three audio speeds. The
adjunct image not having a significant effect may be attributable to three things. First, the
81
weak internal consistency reliability for this sample (K-R 20 = .63) is an indication that
the measures are not ideal. Second, the purposeful design of the Recognition-Australia
instrument having 10 feature-related and 10 nonfeature-related items may have
diminished the image effects. Thirdly, there was a substantial amount of overlap in the
confidence intervals for the two adjunct image conditions, which can be seen in Table 13.
The lack of an interaction effect for both the cued-recall and content recognition task
provides strong evidence that the two conditions may not interact in a meaningful way as
to positively influence learning.
Cued-Recall and Content Recognition. At this point, it is worth noting the
inherent differences between the content recognition and cued-recall tasks. As pointed
out by Haist, Shimamura, and Squire (1992), there are two general explanations for why
recognition tasks are typically easier for learners than recall. One explanation, known as
the Strength Theory (McDougall, 1904), suggests that recall tasks require more
information in working memory than does recognizing. An alternative explanation,
known as Generative-Recognize Theory (Hollingworth, 1913), suggests recall requires
two processes: the retrieval of information from memory followed by a familiarity
decision (Haist, Shimamura & Squire, 1992). In contrast, the recognition task only
requires the familiarity decision.
The results from the current study can be best explained with the Generative-
Recognize Theory. The strength and direction of the relationship between cued-recall and
content recognition was r = .79 (p < .01), a strong and positive correlation. This
relationship indicates the parallelism of the content between the cued-recall and content
recognition tasks learners had to make in relation to the familiarity decisions. The items

82
on both the Recall-Australia and Recognize-Australia instruments probed for similar
information, but in different forms. The learners consistently performed better on the
content recognition task as opposed to the cued-recall task, which speaks of the additional
processing required to retrieve information into working memory (e.g., recall process).
The time-compressed audio condition had moderate effects on cued-recall and
content recognition, explaining approximately 12% and 9% of the variability,
respectively. The adjunct image was less influential on cued-recall and content
recognition, explaining only 2% and 1% of the variability, respectively. In this case, the
adjunct image condition only significantly influenced the cued-recall measure. This is an
indication that the acceleration of information on the auditory/verbal channel is a
generalizable effect on these measures. However, the adjunct image condition did not
meet this criterion, and appears to be more helpful for the retrieval of information in
working memory as opposed to a familiarity decision.
Learner Satisfaction. The results obtained from the learner satisfaction scale show
some interesting findings. A statistically significant main effect was detected for both the
audio speed and adjunct image conditions. The audio speed treatment shows the greatest
degree of variability explained with the partial η2 = .36. This finding demonstrates that
36% of the variability in satisfaction is attributable to the time-compressed audio speed.
As the audio playback speed was increased, this effect had a general negative influence
on learner satisfaction. This is a powerful message in that the Tukey HSD follow up
procedures showed that all conditions were statistically significant from the normal audio
speed, which was shown to be most satisfying.
The negative influence of accelerated playback is contrary to previous research

83
that demonstrated that an audio speed of 1.4 times the normal rate was statistically more
satisfying than a speed of 1.8 the normal rate (Ritzhaupt, Gomes & Barron, in press).
This may be attributable to the aforementioned study using different subject-matter or the
previous study employing verbal redundancy in the multimedia program. Regardless, the
satisfaction indicators in the present study do not reflect these findings. Time-compressed
audio, in the present study, negatively influenced learner satisfaction at all levels relative
to the normal speed.
The availability of a representational adjunct image had a positive influence on
learner satisfaction. The learners presented with the picture were significantly more
satisfied with the learning experience. However, the condition only explains 2% of the
variability in learner satisfaction, and did not have enough statistical strength to
ameliorate the negative influence of the accelerated playback.
Summary of Findings. The significant main effect for the adjunct image condition
shows that learners are generally more satisfied when a representational adjunct image is
present than when it is not. It is conceivable that the satisfaction indicators would have
been greater if the representational adjunct images traced to all the questions on the
Recall-Australia and Recognize-Australia instruments. Though there was no interaction
effect between the four audio speeds and two adjunct image conditions, the main effects
on cued-recall and satisfaction demonstrate that quality adjunct imagery had a positive
effect and that faster audio speeds were less satisfying.
The findings of this study are consistent with previous research in that at higher
audio speeds a learner’s ability to retain the information begins to drastically decline, as
demonstrated with the very fast audio treatment resulting in significantly less

84
performance on both the cued-recall and content recognition tasks. The finding pertaining
to the adjunct image effect on cued-recall is also consistent with previous research in that
it demonstrates the durable effect of the multimedia principle under conditions of
accelerated playback. Learners learn better from pictures and words than from words
alone (Mayer, 2001), even under conditions of time-compressed audio. However, the
results also suggest that pictures assist learners in the retrieval of information from
working memory, but do not assist in a familiarity decision.
Recommendations to Stakeholders
Based on the findings of the current research and the literature review, this section
offers some recommendations for learners, instructors and instructional designers as well
as recommendations for the design of future research studies.
Learners. Learners are ultimately the key stakeholders in this research. This
research recommends that learners can choose to use time-compression technology, but
should exercise this choice with extreme care and caution. The results demonstrate a
generalizable negative effect on cued-recall and recognition after audio speeds two times
the normal rate or over approximately 300 wpm. Additionally, this research has only
employed subject matter that might be described as declarative knowledge or low
intrinsic cognitive load. Using time-compression technology with complex subject-matter
might lower the ceiling effect, and has been shown to result is less comprehension
(Richaume, Steenkeste, Lecocq, & Moschetto, 1988).
With these considerations in mind, learners should first identify which software
and hardware devices are available that support time-compression technology. Common
consumer products, such as iPods and personal computers with Window Media Player,

85
have the technology readily available. Second, if available in the instruction, learners
should attempt to attend to representational pictures while listening to time-compressed
narration as these research results indicate doing so will assist in the retrieval of relevant
information into working memory. Third, learners should identify a speed at which they
are most comfortable to assure a satisfying learning experience. As learners become
comfortable at accelerated speeds, some research suggests that they can increase the
playback to higher levels (Voor & Miller, 1965; Norris, 1996). However, this research
cannot support this decision.
Instructors and Instructional Designers. From an educator and instructional
designer perspective, this research highlights the importance of including semantically
congruent adjunct imagery into multimedia instruction. If educators and instructional
designers are aiming at assisting learners with recall-like tasks, the use of a relevant
image has been documented to show positive effects on both cued-recall and leaner
satisfaction.
With the explosive growth in educational podcasts (e.g., iTunes University) and
other audio-only media, more emphasis should be placed on developing instruction that
includes both digital audio and pictures to improve a learner’s ability to retain the
information. Current technology for creating podcasts (e.g., mpeg video files) already
supports this functionality and can be authored using standard tools. While instructors
and instructional designers should not assume their learners will make use of the
representational imagery, providing the imagery and encouraging the use by learners is
recommended.
This research also encourages instructional designers and educators to be mindful

86
about whether learners will choose to use time-compression technology when engaged in
their instruction. Designing instruction with digitally recorded audio stored in appropriate
formats (e.g., mpeg, mp3, mp4, etc.) affords learners the option to choose whether or not
to use time-compression technology. Learners should not be required to use time-
compression technology within their courses or training programs as this research shows
that learners assigned to faster audio speeds were generally less satisfied.
Instructors and instructional designers should provide guidelines to learners if
they choose to use the technology. This research suggests that audio speeds up to two
times the normal rate may not adversely influence learning, though it may be less
satisfying. The inherent difficulty level of the materials is also an important factor. Until
more research investigates these differences, care should be taken not to encourage
learners to use the technology with complex subject-matter. Finally, if instructors and
instructional designers are targeting learners to perform well on recall-like tasks, they
should encourage their learners to make use of the related imagery, if available, in the
multimedia materials.
Researchers. This research also provides some guidance for future research
efforts. This research did not provide evidence of a statistically significant interaction
between audio speed and adjunct images as predicted. Future research efforts may seek to
retest this hypothesis under different conditions to detect whether a congruent adjunct
image might serve as the secondary cue for verbal information under the fastest time-
compressed audio constraints. The current evidence suggests there is no relationship.
Ultimately, learners should have the choice to control the audio settings at a
comfortable speed to which they are able to retain information. Conceivably, doing so

87
would not only improve a learner’s cued-recall and content recognition of the
information, but also serve to increase a learner’s level of satisfaction with the
instruction. Future research should aim at designing experiments to include learner
control as a meaningful variable.
Some of the limitations and delimitations of this research relate to the
instrumentation and intervention employed. The cued-recall and content recognition
instruments included both feature-related and nonfeature-related items. Future research
might only include feature-related items to observe the full effects of the multimedia
principle in relation to time-compressed audio. Additionally, the topic selected, Australia,
is classifiable as low intrinsic cognitive load (Sweller & Chandler, 1994). As pointed out
by Barron (2004) and Richaume, Steenkeste, Lecocq, and Moschetto (1988), content type
is likely a moderating variable in relation to time-compressed audio research.
The current research employed representational adjunct images as the picture
condition. Again, Levin (1981) suggested images can serve as decorational,
representational, organizational, and transformational. Representational images only
mirror part or all of some related text, and in previous research without time-compression
have been found to have moderate effects on learning (Carney & Levin, 2002; Levin,
1981). The use of organization images in the research interventions, such as maps or
diagrams that illustrate magnitude (e.g., pie charts), may have had a more powerful
impact on the dependent measures of interest.
One of the goals of this research was to connect the time-compressed speech
research literature with multimedia research literature. The results currently indicate no
statistically significant interaction between the time-compressed audio speed and adjunct
88
images conditions in the context of a multimedia learning environment. However, the
combination of multimedia explanations of learning and previous time-compressed
speech research has been documented in this research. Multimedia models can be used to
explain, control, and predict the effects of time-compression technology on human
learning. Future studies might elect to employ multimedia models to explain, predict and
control the effects of time-compression on human learning.
Final Summary
This study was executed to investigate the effect of time-compressed narration
and representational adjunct images on learners’ ability to recall and recognize
information in a multimedia learning environment, and their overall satisfaction with this
type of learning environment. This research was guided by the underlying principles of
multimedia learning.
The experiment was 4 Audio Speeds (1.0 = normal vs. 1.5 = moderate vs. 2.0 =
fast vs. 2.5 = fastest rate) x Adjunct Image (Image Present vs. Image Absent) factorial
design. Three-hundred five research participants were recruited from a public,
southeastern university in the United States, and were assigned to one of eight treatments.
Fifty-five percent of the participants were male and 92% indicated that English was their
primary language. The median age of the participants was 22, with individual ages
ranging from 18 to 53 years old.
Data were analyzed using a series of ANOVA procedures. Results showed
statistically significant differences at two and half times the normal audio speed, in which
performance on cued-recall and content recognition tasks was significantly lower than
other audio speeds. The representational adjunct images had a significant positive effect
89
on cued-recall, but not content recognition, indicating that the images assisted with the
retrieval of information from working memory, but not on a familiarity decision.
Participants in the normal audio speed and picture present groups were
significantly more satisfied than those in the other treatments. However, an interaction
effect on cued-recall, content recognition and learner satisfaction was not detected. The
results of this study have shed light on time-compression technology and adjunct imagery
and their effects on human learning.

90
References
Atkinson, R. C., & Shiffrin, R. M. (1968). Human memory: A proposed system and its
control processes. In K.W. Spence (Ed.), The psychology of learning and
motivation: Advances in research and theory (pp. 89–195). New York: Academic
Press.
Baddely, A. D. (1986). Working memory. Oxford, England: Oxford University Press.
Baddeley, A.D., & Hitch, G.J. (1974). Working Memory, In G.A. Bower (Ed.), The
psychology of learning and motivation: advances in research and theory (pp. 47-
89, New York: Academic Press.
Barabasz, A. F. (1968). A study of recall and retention of accelerated lecture presentation.
Journal of Communication, 18(3), 283-287.
Barron, A. E. (2004) Auditory Instruction. In D. H. Jonassen, Handbook of research on
educational communications and technology (ed., pp. 949-978) Mahwah, NJ:
Lawrence Erlbaum, 2004.
Barron, A. E., & Kysilka, M. (1993). The effectiveness of digital audio in computer-
based training. Journal of Research on Computing in Education, 15, 277-289.
Beccue, B., Vila, L., & Whitley, L. K. (2001). The effects of adding audio instructions to
a multimedia computer based training environment. Journal of Educational
Multimedia and Hypermedia, 10(1), 47-67.
Benz, C. R. (1971). Effects of time compressed speech upon the comprehension of a
visual oriented television lecture. Unpublished doctoral dissertation, Wayne State
University.
Carney, R. N. & Levin J. R. (2002). Pictorial illustrations still improve students’ learning

91
from text. Educational Psychology Review, 14(1), 5-26.
Chandler P. & Sweller, J. (1991). Cognitive load theory and format of instruction.
Cognition and Instruction, 8(4), 293-332.
Clark, J. M. (1983). Reconsidering research on learning from media. Review of
Educational Research, 53(4), 445-459.
Clark, J. M. & Paivio, A. (1991). Dual coding theory and education. Educational
Psychology Review, 3(3), 149-170.
Cohen, J. (1992). A Power Primer. Psychological Bulletin, 112(1), 155-159.
Duker, S. (1974). Time compressed speech. Metuchen, NJ: Scarecrow.
Fairbanks, G., Guttman, N., & Miron, M. S. (1957). Auditory comprehension of repeated
high-speed messages. Journal of Speech and Hearing Disorders, 22, 23-32.
Flesch, R. (1949). The art of readable writing. Net York: Harper.
Foulke, E. A. (1962). A comparison of two methods of compressing speech. Symposium
at the Southeastern Psychological Association, Louisville, KY.
Foulke, E., A., Sticht, T. G. (1967). The intelligibility and comprehension of accelerated
speech. Proceedings of the Louisville Conference on Time Compressed Speech,
Louisville, KY, pp. 21-28.
Fonteyn, M. E., Kuipers, B., Grobe, S. J. (1993). A description of think aloud method
and protocol analysis. Qualitative Health Research, 3, 430 - 441.
Galbraith J., & Spencer, S. (2002). Asynchronous video-based instruction with variable
speed playback: Is faster better? Proceedings of the World Conference on
Educational Multimedia, Hypermedia, and Telecommunications (ED-Media),
Denver, CO.
92
Gill, T. G. (2007). Quick and dirty multimedia. Decision Sciences Journal of Innovative
Education, 5(1), 197-206.
Goldhaber, G. M. (1970). Listener comprehension of compressed speech as a function of
the academic grade level of the subjects. Journal of Communication, 20(1), 167-
173.
Gronlund, N. E. (1998). Assessment of student achievement. Needham Heights, MA:
Allyn and Bacon.
Haist, F., Shimamura, A. P., & Squire L. R. (1992). On the relationship between recall
and recognition memory. Journal of Experimental Psychology: Learning,
Memory, and Cognition, 18(4), 691-702.
Hede, A. (2002). An integrated model of multimedia effects on learning. Journal of
Educational Multimedia and Hypermedia, 11(2), 177-191.
Hollingworth, H. L. (1913). Characteristic differences between recall and recognition.
American Journal of Psychology, 24, 532-544.
iTunes University. Apple, Inc. Retrieved on April 1, 2007 from:
http://www.apple.com/education/products/ipod/itunes_u.html.
Kaiser, H. F. (1960). The application of electronic computers to factor analysis.
Educational and Psychological Measurement, 20, 141-151.
Kalyuga, A., Chandler, P., Sweller, J. (1999). Managing split Attention and redundancy
in multimedia instruction, Applied Cognitive Psychology, 13, 351-371.
Kealy, W. A., Alkhabbaz, S., Subramanian, C., Bunch, J., & Spears, C. (2006). Effect of
task expectancy on reader motivation to study on-demand adjunct displays. Paper
presented at the Annual Meeting of the American Educational Research

93
Association, San Francisco.
King, P. E., Behnke, R. R. (1989). The effect of time-compressed speech on
comprehensive, interpretive, and short-term listening. Human Communication
Research, 15(3), 428–443.
Koroghlanian, C. M., & Sullivan, H. J. (2000). Audio and text density in computer-based
instruction. Journal of Educational Computing Research, 22(2), 217–230.
Kullhavey, R. W., Lee, B. J., & Caterino, L. C. (1985). Conjoint retention of maps and
related discourse. Contemporary Educational Psychology, 10, 28-37.
Levin, J. R. (1981). On functions of pictures in prose. In Pirozzolo, F. J., and Wittrock,
M. C. (eds.), Neuropsychological and Cognitive Processes in Reading, Academic
Press, New York, pp. 203–228.
Mayer, R. E. (2001). Multimedia Learning. New York: Cambridge University Press. Mayer, R. E. (2003). Elements of a science of e-learning. Journal of Educational
Computing Research, 29(3), 297-313.
Mayer, R. E. & Anderson, R. B. (1991). Animations need narrations: An experimental
test of a dual-coding hypothesis. Journal of Educational Psychology, 83, 484-490.
Mayer, R. E., & Gallini, J. K. (1990). When in an illustration worth ten thousand words?
Journal of Educational Psychology, 82(4), 715-726.
Mayer, R. E. & Moreno, R., (2002a). Aids to computer-based multimedia learning.
Learning and Instruction, 12, 107-119.
Mayer, R. E. & Moreno, R., (2002b). Animation as an aid to multimedia learning.
Educational Psychology Review, 14(1), 107-119.
McDaneial, M. A., Pressley, M. (1987). Imagery and Related Mnemonic Processes:

94
Theories, Individual Differences, and Applications. New York City, New York:
Springer-Verlag.
McDougall, R. (1904). Recognition and recall. Journal of Philosophy, Psychology, and
Scientific Methods, 1, 229-233.
Miller, G. A. (1956), The magical number seven, plus or minus two: Some limits on our
capacity for processing information. Psychological Review, 63, 81-97.
Moreno, R., & Mayer, R. E. (2002). Verbal redundancy in multimedia learning: When
reading helps listening. Journal of Educational Psychology, 94(1) 156-163.
Neisser, U. (1967). Cognitive psychology. NewYork: Appleton-Century-Crofts.
Nichols, R. G., & Stevens, L. A. (1957). Are you listening? New York: McGraw-Hill.
Omoigui, N., He, L., Gupta, A., Grudin, J., & Sanocki, E. (1999). Time-compression:
systems concerns, usage, and benefits. Proceedings of the SIGCHI conference on
Human factors in computing systems: the CHI is the limit, Pittsburgh,
Pennsylvania, pp. 136 – 143.
Osgood, C. E., Suci, G. J., & Tannenbaum, P. H. (1957). The measurement of meaning.
Chicago: University of Illinois Press.
Paivio, A. (1986). Mental representations. New York: Oxford University Press.
Paivio, A. (1990). Mental representations: A dual coding approach. New York: Oxford
University Press.
Riggert, S. C., Boyle, M., Petrosko, J. M., Ash, D., Rude-Parkins, C. (2006). Student
employment and higher education: Empiricism and contradiction. Review of
Educational Research, 76(1), 63-92.
Ritzhaupt, A. D., Gomes, N. D., Barron, A. E. (in press). The effects of time-compressed
95
audio and verbal redundancy on learner performance and satisfaction. Computers
in Human Behavior.
Rockwell, S.K., Schauer, J., Fritz, S.M. & Marx, D.B. (1999). Incentives and obstacles
influencing higher education faculty and administration to teach via distance.
Online Journal of Distance Administration, 2 (3). Retrieved on January 1, 2008
from: http://www.westga.edu/~distance/rockwell24.html.
Sabatini, J. P. (2001). Designing multimedia learning systems for adult learners: Basic
skills with a workforce emphasis. National Center on Adult Literacy: Working
Paper Series.
Severin, W. (1968). Cue summation in multiple-channel communication. Report from the
Media and Concept Learning Project (Tech. Rep. No. 37). Washington DC:
Bureau of Research.
Stallings, J. (1980). Allocated academic learning time revisited, or beyond time on task.
Educational Researcher, 9(11), 11-16.
Stevens, J. (1990). Intermediate statistics: A modern approach. Hillsdale, NJ: Lawrence
Erlbaum Associates, Inc.
Sweller, J. (1988). Cognitive load during problem solving: Effects on learning. Cognitive
Science, 12, 257-285.
Schnotz, W. (2005). An integrated model of text and picture comprehension. In: Mayer,
(Ed.), The Cambridge handbook of multimedia learning, Cambridge University
Press, New York. pp. 49-69.
Schnotz, W., Bannert, M. (1999). Supports and interference effects in learning from
multiple representations. In Bangera, S. (Ed.), European Conference on Cognitive
Science, 27-30 Oct. 1999, Instituto di Psicologia, Nazionale delle Ricerche,

96
Rome, Italy, pp.447-452.
Short, H. S. (1977). A comparison of variable time-compressed speech and normal rate
speech based on time spent and performance in a course taught by self-
instructional methods. British Journal of Educational Technology 8(2), 146–157.
Short, S. H. (1978). The use of rate controlled speech to save time and increase learning
in self-paced instruction. NSPI Journal, 17(4), 13- 14.
Standing, L. G., Conezio, J., Haber, N. (1970). Perception and memory for pictures:
Single trial learning for 2500 visual stimuli. Psychonomic Science, 19, 73-74.
Sweller, J. & Chandler P. (1994). Why some material is difficult to learn. Cognition and
Instruction, 12, 185-233.
Tindall-Ford, S., Chandler, P., & Sweller, J. (1997). When two sensory modes are better
than one. Journal of Experimental Psychology, 3(4), 257–287.
Voor, J. B., & Miller, J. M. (1965). The effect of practice on the comprehension of time
compressed speech. Speech Monographs, 32, 452–454.
Webb, J. M., Saltz, E. D., McCarthy, M. T., & Kealy, W. A. (1994). Conjoint influence
of maps and auded prose on children's retrieval of instruction. Journal of
Experimental Education, 62(3), 195-208.

97
Appendices

98
Appendix A: Adjunct Pictures and Discovering Australia Text.
Introduction to Australia (146 words), All See the First Map Picture Australia was the last great land on earth to be discovered by European explorers. This is an immense island continent of approximately three million square miles that’s bounded by four seas and an ocean. It is vast, unique, and full of contrasts in vegetation, climate and lifestyle—from deserts to snow-capped mountains, from ocean reefs to tropical rainforests, from its cosmopolitan coastal cities to its desolate Outback. Until the 20th century Australia was a British colony when, in 1901, it gained its independence from Great Britain. Today it is a democratic, federal-state system that, like a few other members of the British Commonwealth including New Zealand, Canada, Belize, and Jamaica, recognizes the British monarch as its sovereign Head of State. Though the value of maintaining this royal bond has been questioned in recent years, Australia remains a strong ally and trading partner of the United Kingdom.

99
Appendix A: (Continued)
Great Victoria Desert (153 Words) Feral camels that roam Australia’s vast wilderness, gorging on Acacia trees and a juicy plant nicknamed "pig face," are able to squeeze every little bit of moisture out of their food. These animals are the preferred beasts of burden for tribesman and hunters, primarily because they do not require large amounts of water as they travel. Despite its large size, the camel has effectively adapted to the country’s arid environmental conditions by having no need to sweat. The Great Victoria Desert is an arid region located in the central and western parts of Australia. Known as the "Red Center," it is a dry and barren region of sand hills, salt lakes, and sparse grasslands that extends about 450 miles from east to west. With its endless sand dunes, roaming feral camels, groves of desert oaks, wild flowers, and timeless silence, the area provides an awe-inspiring splendor that rivals Australia’s famous beaches and rainforests.

100
Appendix A: (Continued)
Great Dividing Range (146 words) Even though Australia is one of the world's flattest landmasses, the Great Dividing Range contains considerably large mountains, some over 7,000 feet high, extending almost the entire length of the eastern coast. This range includes the Blue Mountains, named for the color that is caused by their dense eucalyptus forests. As oil from the trees evaporates, the gas breaks up the sunlight to reflect light in the blue part of the spectrum, a phenomenon known as “Rayleigh scattering.” The modern development and expansion of Australia began in the early 1800's with the explorations of Blaxton, Lawson and Wentworth and the squatter movement that soon followed. This opened the way to agriculture and ranching industries that have made Australia the world’s greatest producer of wool as well as the largest exporter of beef. Yet, despite its enormous farming and livestock, Australia remains primarily an urban society with most of its population distributed along the coastline.

101
Appendix A: (Continued)
Coral Sea (154 words) Australia is home to six known species of sea-turtles including the Leather Back, the world’s largest recorded turtle measuring eight feet long and weighing almost one ton. This is also the most endangered type of sea turtle due largely to their accidental drowning in the shrimp nets and other fishing gear used during fishing operations. Both sea turtles and their land-dwelling relatives called tortoises are prehistoric animals that have existed on Earth for millions of years. Off Australia's northeastern coast and forming the southwest arm of the Pacific Ocean, lies the Coral Sea and, within it, the Great Barrier Reef. Many of the islands in the vicinity are uninhabited stretches of coral that serve merely as meteorological stations since they haven’t a supply of fresh water. During World War II, this was the site of the first naval battle in history in which the opposing surface ships, aircraft carrier groups, never saw one another.

102
Appendix A: (Continued)
Sydney (155 words) At roughly the southeast corner of Australia lays Sydney, a city built around water that offers many recreational activities involving the sun, sand, and surf. The city’s location also supports the bustling shipping industry of Port Jackson, which is crossed by Sydney Harbour Bridge, the second longest steel-arch bridge in the world. From the south shore of the port juts the downtown area and Circular Quay, the focus for ocean liners, commuter ferries, and the financial district. Australia was first sighted by the Dutch almost four centuries ago and they were followed by the English explorer Captain James Cook who sighted the country in 1770. It wasn’t until eighteen years later that the first colony was established by Captain Arthur Phillip as a place for the many convicts who crowded the debtor prisons of England. Successive waves of convicts contributed to the swelling population of the state until 1868 when Britain finally discontinued penal settlements.
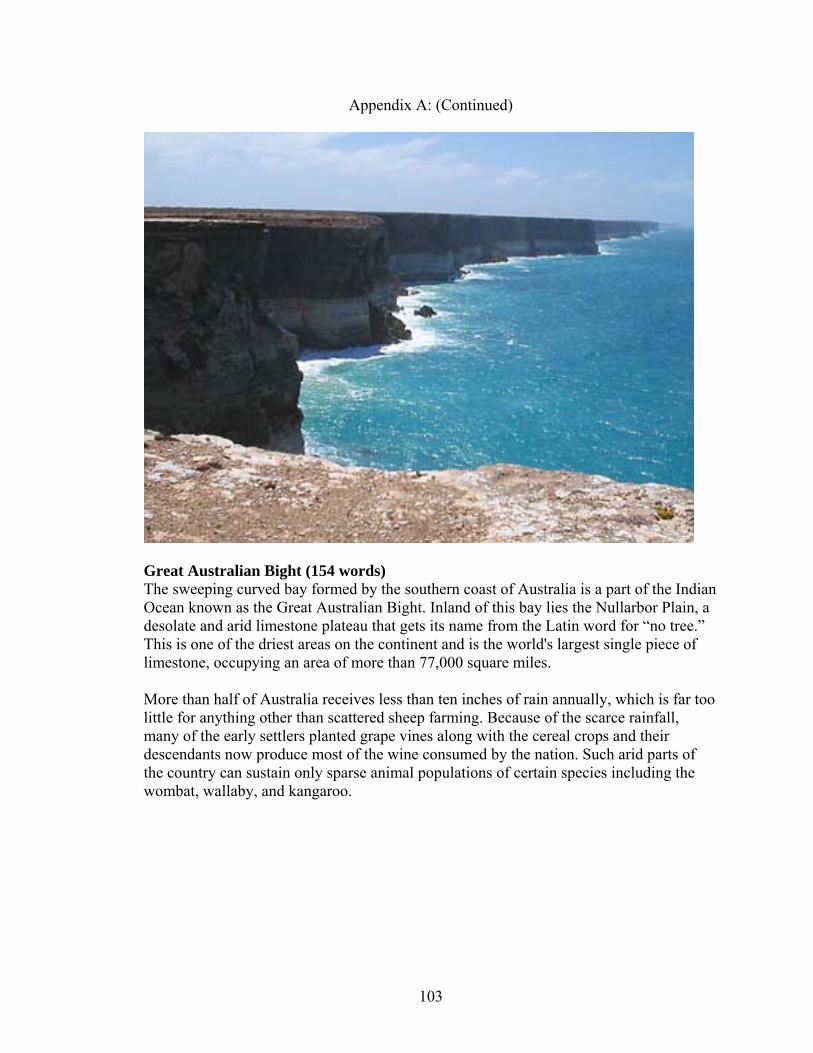
103
Appendix A: (Continued)
Great Australian Bight (154 words) The sweeping curved bay formed by the southern coast of Australia is a part of the Indian Ocean known as the Great Australian Bight. Inland of this bay lies the Nullarbor Plain, a desolate and arid limestone plateau that gets its name from the Latin word for “no tree.” This is one of the driest areas on the continent and is the world's largest single piece of limestone, occupying an area of more than 77,000 square miles. More than half of Australia receives less than ten inches of rain annually, which is far too little for anything other than scattered sheep farming. Because of the scarce rainfall, many of the early settlers planted grape vines along with the cereal crops and their descendants now produce most of the wine consumed by the nation. Such arid parts of the country can sustain only sparse animal populations of certain species including the wombat, wallaby, and kangaroo.

104
Appendix A: (Continued)
Gulf of Carpentaria (154 words) Along the northern coast of Australia extends the Gulf of Carpentaria named after Pieter de Carpentier, the Governor General of the Dutch East Indies who explored the area in 1605. The gulf’s coastal wetlands support two species of crocodiles, the saltwater crocodile and the relatively harmless freshwater variety that usually only bites when handled or cornered. A freshwater crocodile can be distinguished from a saltwater crocodile by its narrow snout and evenly shaped and sized needle-like teeth. Using sophisticated radiocarbon dating techniques, anthropologists have deduced that the aborigines canoed to Australia in successive waves from Southeast Asia roughly 30,000 to 50,000 years ago. Today, they live mostly in rural areas, often choosing to remain near their birth sites that are considered sacred places to which they will return to die. The exact location of birth determines a person's position within a clan or kinship group and provides the individual with a secret personal name.

105
Appendix A: (Continued)
Perth (153 words) Situated on the southwest corner of Australia lays Perth, a modern metropolis of almost one and a half million people that is the country’s forth-largest city. Its impressive skyline is superbly situated on the banks of the Swan River that was named by Dutch navigators of the seventeenth century who first witnessed its black swans. Today, Perth and the surrounding area is home to several industries of which the travel and tourism industry is among the largest. Prior to European settlement in the 1800s Southwestern Australia had been inhabited by the Aborigine people for over 40,000 years, as evidenced by archaeological findings. Thirteen or more tribes occupied the southwest corner of Western Australia, living as hunter and gatherers. The lakes on the coastal plain were particularly important to them, providing both spiritual and physical sustenance. Hostile encounters between European settlers and Aborigine tribes lead to the eventual disposition of tribes to surrounding areas.

106
Appendix A: (Continued)
Timor Sea (154 words) Australia’s waters teem with a variety of sea life including migrant whales and dolphins. Additionally, the coastal areas contain several dangerous sea creatures such as the box jellyfish, the most deadly and venomous of all stinging marine life, whose trailing tentacles carry venomous cells. Though sharks also pose a threat, it’s one that’s greatly exaggerated since, on the average, less than one shark fatality per year has occurred for all Australian waters during the past 150 years. Off the northwestern coast of Australia lays the Timor Sea, which is named after the Malaysian word for "Orient.” This area contains significant oil deposits that are only now being mined in accordance with an oil treaty that was established between Australia and East Timor in 2002. The deal is expected to bring the tiny island nation of 800,000 people about $7 billion dollars over the next 20 years with the oil revenues to commence in 2005.

107
Appendix A: (Continued)
Macdonnell Ranges (152 words) The low-lying, eroded mountains of the Macdonnell Ranges are abruptly rising walls that are the result of the earth's ancient faulting and folding. This region features a number of chasms, gorges, and interesting rock formations including Uluru, a world-famous mountain made of sedimentary sandstone. Protruding 1140 feet above the surrounding plain and measuring more than five miles around its base, the rock's varying colors at different times of the day give it a magical quality. Two dozen wild rabbits were imported from England by Thomas Austin in 1859 and, within a few decades, overran the continent, creating an economic and ecological disaster. The infestation was temporarily reduced in the 1950’s by the introduction of a rabbit disease that is transmitted by fleas. Since then, many of the county’s 200-300 million rabbits have acquired an immunity from the disease and scientists are now considering introducing viruses that cause sterility in the animals.

108
Appendix A: (Continued)
Great Sandy Desert (152 words) The Great Sandy Desert is rated as the fourth largest desert in the world, encompassing an area of roughly 150,000 square miles. Enormous sand dunes have formed there due to the prevailing winds and the absence of large relief features like mountains. In one such area, there are sand dunes a quarter of a mile apart and extend for over 370 miles, there’s little or no vegetation except occasional trees and clumps of sparse, grassland. Australia has some of the best examples of meteorite impact sites anywhere in the world, including one discovered in January 2002 that’s about 75 miles wide. Scientists estimate it was created by a three-mile wide asteroid that crashed into Earth 360 million years ago, wiping out 85 percent of all species. An impact of similar magnitude occurred near Mexico’s Yucatan Peninsula approximately 65 million years ago and is the likely cause for why dinosaurs became extinct.

109
Appendix B: Recall-Australia Instrument and Rubric.
[Recall-1] Why do tribesman and hunters prefer camels as their beasts of burden? Points Acceptable Answers 2 Must have two of the following:
Require less water Because they do not sweat Long distances without water Able to absorb moisture out of food
1 Must have one of the following: Require less water Because they do not sweat Long distances without water Able to absorb moisture out of food
0 No answer provided or incorrect answer [Recall-2] What is another common name given to the Great Victoria Desert? Points Acceptable Answers 2 Red center 1 Red desert
Red spot Red sand Red something Center desert Something Center
0 No answer provided or incorrect answer [Recall-3] What are the Blue Mountains named after? Points Acceptable Answers 2 Must have two of the following:
Sun reflecting light blue part of the spectrum Eucalyptus trees Evaporating gas or oils
1 Must have one of the following: Sun reflecting light blue part of the spectrum Eucalyptus trees Evaporating gas or oils
0 No answer provided or incorrect answer

110
Appendix B: (Continued) [Recall-4] What products is Australia the greatest producer of in the world? Points Acceptable Answers 2 One of the following:
Wool and Beef Wool and Cattle Sheep Fur and Beef or Cattle
1 One of the following: Wool Beef Sheep Fur Cattle
0 No answer provided or incorrect answer [Recall-5] What is the world’s largest recorded sea-turtle, native to Australia? Points Acceptable Answers 2 One of the following:
Leatherback sea-turtle Leatherback
1 One of the following: Leather 8-feel long One ton
0 No answer provided or incorrect answer [Recall-6] Which Australian body of water is home to the Great Barrier Reef? Points Acceptable Answers 2 Coral sea 1 One of the following:
Sea in the Northeast Pacific Ocean Coral without specification of a sea
0 No answer provided or incorrect answer [Recall-7] Describe some characteristics of the Sydney Harbour Bridge. Points Acceptable Answers 2 Both characteristics must be present:
World’s 2nd longest or longest Steel-arch (or Steel) bridge
1 One of the following characteristics must be present: World’s 2nd longest or longest Steel-arch (or Steel) bridge Connects to Port Jackson
0 No answer provided or incorrect answer

111
Appendix B: (Continued) [Recall-8] Who was the explorer that sighted Australia in 1770? Points Acceptable Answers 2 One of the following:
Captain James Cook James Cook Captain Cook
1 One of the following: Captain James Cook
0 No answer provided or incorrect answer [Recall-9] Describe the Nullarbor Plain in the southern coast of Australia. Points Acceptable Answers 2 One of the following:
Dry and desolate limestone plateau Arid and limestone plateau Desert-like plateau Largest single piece of limestone
1 Dry or arid Barren or desolate Limestone Plateau Small scrubs or few plants
0 No answer provided or incorrect answer [Recall-10] What crops did the early settlers of Australia plant because of scarce rainfall? Points Acceptable Answers 2 One of the following:
Wine and cereal (or Wheat) Grapes and cereal (or Wheat)
1 One of the following: Wine Grapes Cereal (barley/wheat)
0 No answer provided or incorrect answer

112
Appendix B: (Continued) [Recall-11] Describe the physical characteristics of the freshwater crocodile. Points Acceptable Answers 2 Two of the following characteristics:
A narrow snout Smaller and skinnier than saltwater crocodile Evenly shaped or needle-like teeth
1 One of the following characteristics: A narrow snout Smaller and skinnier than saltwater crocodile Evenly shaped or needle-like teeth
0 No answer provided or incorrect answer [Recall-12] Where did the aborigines living along the Gulf of Carpentaria canoe from? Points Acceptable Answers 2 Southeast Asia 1 One of the following:
Asia East Asia South Asia
0 No answer provided or incorrect answer [Recall-13] What body of water does the city of Perth run along? Points Acceptable Answers 2 Swan river 1 One of the following:
Black swan river Swan River Black river
0 No answer provided or incorrect answer [Recall-14] Why were the Aborigine people in Southwestern Australia displaced from their homelands? Points Acceptable Answers 2 Both of the following characteristics:
Hostile encounter (or similar description) European settlers (or similar description)
1 One of the following characteristics: Hostile encounter (or similar description) European settlers (or similar description)
0 No answer provided or incorrect answer

113
Appendix B: (Continued) [Recall-15] What is the most deadly sea creature in Australia’s costal areas? Points Acceptable Answers 2 Box jellyfish 1 One of the following:
Jellyfish Jelly with stinging tentacles
0 No answer provided or incorrect answer [Recall-16] What body of water contains a vast amount of natural oil deposits? Points Acceptable Answers 2 Timor sea 1 One of the following:
Timor without designation of sea Sea in the west Malaysian word for Orient
0 No answer provided or incorrect answer [Recall-17] Describe the Uluru Mountain in the Macdonnell Ranges. Points Acceptable Answers 2 Must have two of the following characteristics:
Sandstone Five mile base Varying colors throughout the day 1140 feet above ground
1 Must have one of the following characteristics: Sandstone Five mile base Varying colors throughout the day 1140 feet above ground
0 No answer provided or incorrect answer [Recall-18] How are scientists planning to address the wild rabbit infestation in Australia? Points Acceptable Answers 2 Viruses causing sterility (Correct answers must include sterility
description and mention of a virus or bacteria) 1 One of the following characteristics:
Sterility Viruses Stop reproduction Infertility
0 No answer provided or incorrect answer

114
Appendix B: (Continued)
[Recall-19] Why have enormous sand dunes formed in the Great Sandy Desert? Points Acceptable Answers 2 Answer must include both characteristics:
Lack of relief features like mountains Prevailing winds
1 Must include one of the following characteristics: Lack of relief features like mountains or trees Prevailing winds
0 No answer provided or incorrect answer [Recall-20] Describe what scientists estimate was the result of the famous meteorite that landed in Australia 360 million years ago. Points Acceptable Answers 2 Must have both characteristics:
Impact wiped out 85 percent of the species Left a 75 mile crater (or close numbers with both characteristics)
1 Must have one of the following characteristics: Impact wiped out 85 percent of the species Left a 75 mile crater (or close numbers with characteristics)
0 No answer provided or incorrect answer

115
Appendix C: Recognition-Australia Instrument and Answers.
[Recogntion-1] Which of the following reasons best explains why tribesman and hunters in Australia prefer camels as their primary beasts of burden?
a. They are much faster than horses. b. They require little food to travel. c. They are able to carry heavy loads. d. They require little water to travel.
Correct Answer: d [Recogntion-2] Which of the following is another common name for the Great Victoria Desert?
a. Red center b. Treeless realm c. Sand domain d. Burning zone
Correct Answer: a [Recogntion-3] Which of following explains the name given to the Blue Mountains?
a. The blue color cause by the large wetlands b. The blue color caused by the wild flowers c. The blue color caused by their eucalyptus forests d. The blue color caused by the morning sky
Correct Answer: c [Recogntion-4] Which of the following two products is Australia the greatest producer of in the world?
a. Beef and wool b. Beef and cereal c. Wines and cereal d. Wines and wool
Correct Answer: a [Recogntion-5] Which of the following best describes the Leatherback sea-turtle?
a. Up to 8 ft long, the world’s largest sea-turtle b. Up to 6 ft long, the world’s largest sea-turtle c. Up to 8 ft long, the world’s second largest sea-turtle d. Up to 6 ft long, the world’s second largest sea-turtle
Correct Answer: a

116
Appendix C: (Continued) [Recogntion-6] Which of the following Australian seas is home to the Great Barrier Reef?
a. The Great Australian sea b. The Timor sea c. The Sand sea d. The Coral sea
Correct Answer: d [Recogntion-7] Which of the follow reasons describes why the Sydney Harbour Bridge is famous?
a. It is the world’s longest steel-arch bridge b. It is the world’s 2nd longest steel-arch bridge c. It is the world’s longest suspension bridge d. It is the world’s 2nd longest suspension bridge
Correct Answer: b [Recogntion-8] Which of the following explorers sighted Australia in 1770?
a. Captain James Cook b. Captain Arthur Phillip c. Captain George Vancouver d. Captain John Perth
Correct Answer: a [Recogntion-9] Which of the following most accurately describes the Nullarbor Plain?
a. A densely populated sandstone plateau b. A desolate limestone plateau c. A densely populated limestone plateau d. A desolate sandstone plateau
Correct Answer: b [Recogntion-10] Which of the following crops did early settlers in Australia plant because of scarce rainfall?
a. Apples and grapes b. Apples and oranges c. Cereal and grapes d. Cereal and oranges
Correct Answer: c

117
Appendix C: (Continued) [Recogntion-11] Which of the following best describes the physical characteristics of a freshwater crocodile?
a. A wide snout with evenly shaped teeth b. A narrow snout with evenly shaped teeth c. A wide snout with unevenly shaped teeth d. A narrow snout with unevenly shaped teeth
Correct Answer: b [Recogntion-12] Which of the following locations did the aborigines living along the Gulf of Carpentaria canoe from?
a. New Zealand b. Southeast Asia c. Eastern Africa d. Western India
Correct Answer: b [Recogntion-13] Which body of water does the city of Perth run along?
a. The Coral sea b. The Great Australian sea c. The Swan River d. The Timor sea
Correct Answer: c [Recogntion-14] Which of the following best describes why Aborigine people in Southwestern Australia displaced from their homelands?
a. The hostile encounters with European settlers b. The despairing droughts in the region c. The industrialization of the waterways d. The spreading malaria plague
Correct Answer: a [Recogntion-15] Which of the following is the most deadly sea creature in Australia’s costal areas?
a. The Great White Sharks b. The Saltwater Crocodiles c. The Box Jellyfish d. The Sea snake
Correct Answer: c

118
Appendix C: (Continued) [Recogntion-16] Which body of water contains a vast amount of natural oil deposits?
a. The Sand sea b. The Coral sea c. The Swan river d. The Timor sea
Correct Answer: d [Recogntion-17] Which of the following best describes the Uluru Mountain found within the Macdonnell Ranges?
a. Made of sedimentary sandstone spanning five miles at its base b. Made of sedimentary limestone spanning five miles at its base c. Made of sedimentary sandstone spanning ten miles at its base d. Made of sedimentary limestone spanning ten miles at its base
Correct Answer: a [Recogntion-18] Which of the following best describes how scientists are planning to address the wild rabbit infestation?
a. Introduce a damaging liver bacteria b. Increase predator population in infested areas c. Introduce a virus causing sterility d. Introduce feeding stations with traps
Correct Answer: c [Recogntion-19] Which of the following best explains why enormous sand dunes have formed in the Great Sandy Desert?
a. The limited amount of rain b. The sparse vegetation c. The absence of mountains d. The absence of a large river
Correct Answer: c [Recogntion-20] Which of the following best describes what scientists estimate was the result of a famous meteorite that landed in Australia 360 million year ago?
a. The impact wiped out 85 percent of the species, and left a 75 mile crater b. The impact wiped out 85 percent of the species, and left a 50 mile crater c. The impact wiped out 75 percent of the species, and left a 50 mile crater d. The impact wiped out 75 percent of the species, and left a 85 mile crater
Correct Answer: a

119
Appendix D: Satisfaction-Australia Instrument.
Instructions: Please select the position on the scales below that best describes your impression of the Discovering Australia tutorial. 1. Hard to Learn 1 2 3 4 5 Easy to Learn 2. Negative 1 2 3 4 5 Positive 3. Unnatural 1 2 3 4 5 Natural 4. Ineffective 1 2 3 4 5 Effective 5. Unclear 1 2 3 4 5 Clear 6. Unsupportive 1 2 3 4 5 Supportive 7. Annoying 1 2 3 4 5 Pleasing 8. Difficult 1 2 3 4 5 Easy 9 Frustrating 1 2 3 4 5 Gratifying 1. Strong Disagree 2. Disagree 3. Neither agree, nor disagree 4. Agree 5. Strongly Agree 10. I was comfortable with the speed of narration in the Discovering Australia tutorial. 11. It was easy to understand the narrative information in the Discovering Australia tutorial. 12. It was easy to hear the information in the Discovering Australia tutorial. 13. The narrator spoke clearly in the Discovering Australia tutorial. 14. I think it was easy to remember the information in the Discovering Australia tutorial.

120
Appendix E: Background Survey.
1. What is your classification?
a. Freshman b. Sophomore c. Junior d. Senior e. Other
2. What college are you completing your degree in?
a. College of Computing, Engineering, and Construction b. College of Education c. Coggin College of Business d. Brooks College of Health e. College of Arts and Sciences
3. What is your gender?
a. Male b. Female
4. How old are you?
a. Type Response
5. Is English your primary language? a. Yes b. No

121
Appendix F: Buffer Story - How the Water got to the Plains.
Way, way back in the first time, when everything was new, there was a group of Aboriginal people living on a mountain. It was a lovely place, but everyone was worried. It had not rained for a long, long time and they were very short of water. They had some wells but these, except for one, were empty. When it had rained before, the water had just run down the side of the mountain, into the sea, which was far, far away. Now, on the other side of the mountain, there were just some big, dry plains where nothing grew. Weeri and Walawidbit were two greedy men. They decided to steal the last of the water for themselves and then run away. In secret, they made a large water-carrier, which was called an eel-a-mun. When everyone was asleep, they stole the water from the last well and hurried off. When the people woke up, there was no water for them. This was very bad, because there were little children and babies needing water and also the old people. And also, it was very hot. The Elders called all the people together and it was then that they saw that two men were missing. Looking around, they found the tracks of the two men. Quickly, the warriors followed these tracks, which led down the other side of the mountain to the big plains and they could see the men in the distance. The water-carrier was very heavy and Weeri and Walawidbit were walking slowly. This was because they thought they were safe. However, when they saw the warriors coming they ran, too. The best spearmen in the group ran to a cliff which jutted out and threw all the spears they had. One hit the eel-a-mun and dropped off. However, it did make a hole in the water-carrier. On and on across the plains ran the two men. They did not notice that the water was leaking out until the carrier was almost empty. This was why they had been able to run faster and by this time, the warriors had caught up. Now, this was way back in the first time, when very strange things happened. So the warriors took the men back home and the Elders called a big meeting. It was decided that the two men had to be punished for stealing and also, for thinking of themselves first and not the community. So the Wonmutta, the clever man, made some very strong magic and Weeree was changed into the very first emu. He went running down the mountain, out onto the plains, in shame. Walawidbit was changed into the very first blue-tongued lizard and he crawled away to hide in the rocks. But, a wonderful thing had happened. Wherever the water had leaked onto the plains, there were now beautiful billabongs, or waterholes. There was grass and flowers and lovely water lilies and then there were shrubs and trees. And soon, the birds came and everyone was happy because there was enough water for everyone. And that is how the water got to the plains.

122
Appendix G: Research Introduction Script.
The following script was read to research participants prior to beginning the process… I would like to thank everyone for attending this research session. There are a few important things that I need to review. First, I want to remind everyone that this is a voluntary process, and I am not forcing you to be here. At any moment during this session, you are welcome to leave. Second, this research has nothing to do with human personality or aptitude. This research pertains to your ability to remember verbal information in a computer-assisted learning environment. You may be exposed to time-compressed audio, in which the speed of the narration is very fast. You also may or may not have helpful multimedia. The computer assigns you to these conditions. I do not know which one you will experience. After completing the tutorial, you have to recall information. You will be asked to respond to constructed response items in which you have to type an answer, and also multiple-choice questions. Next, you will have to complete a short satisfaction survey, in which I ask you to respond truthfully. Third, this research is anonymous, which means that you cannot be connected to the data. Because this research is both low-risk and low-involvement, I ask that you simply try your best and take it seriously. After you complete the session, I ask that you quietly gather your belongings and get your participation card from me before leaving. This card demonstrates to your professors that you have attended the session. If you loose the card, I will not be able to replace it. Finally, I ask that you not discuss the contents of the tutorial with your peers until after they have completed the session as this threatens the integrity of this research. Are there any questions?
Please press the tab key on your keyboard to begin the process.

123
Appendix H. Computer Program Instructions and Examples. Introduction screen initiated after pressing tab key.

124
Appendix H: (Continued)
Background survey introduction screen

125
Appendix H: (Continued)
Example background survey screen.

126
Appendix H: (Continued)
Sound check screen
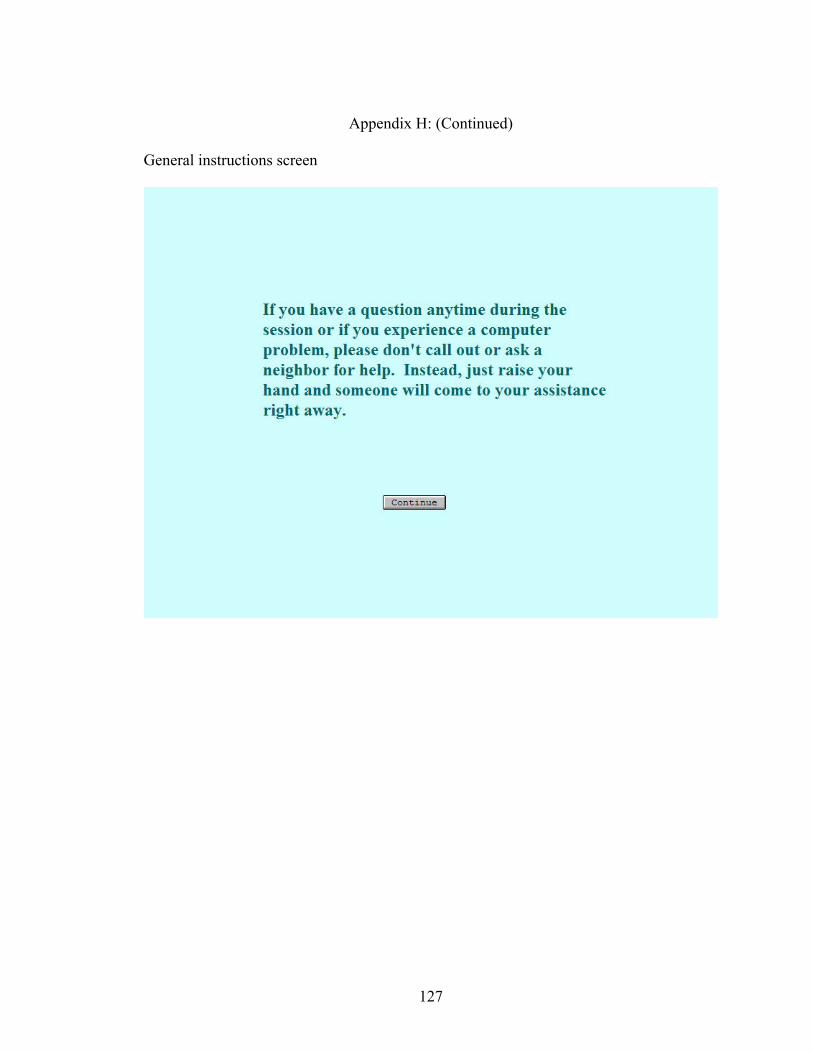
127
Appendix H: (Continued)
General instructions screen

128
Appendix H: (Continued) Instructions about tasks to be accomplished

129
Appendix H: (Continued) Picture only treatments were shown this screen.

130
Appendix H: (Continued) Example screen from Discovering Australia tutorial

131
Appendix H: (Continued) Screen between passages in intervention.

132
Appendix H: (Continued) Short-term memory clearing task after Discovering Australia tutorial

133
Appendix H: (Continued) Instructions for recall task

134
Appendix H: (Continued) Example recall task with animated countdown clock

135
Appendix H: (Continued) Instructions for recognition task

136
Appendix H: (Continued) Example content recognition task

137
Appendix H: (Continued) Instructions for satisfaction instrument

138
Appendix H: (Continued) Example Semantic Differential Satisfaction scale item

139
Appendix H: (Continued) Example Likert Satisfaction scale item
140
Appendix H: (Continued) Instructions for buffer story, only provided to Fast and Very Fast groups

141
Appendix H: (Continued) Example for buffer story screen, only provided to Fast and Very Fast groups

142
Appendix H: (Continued) Closing screen 1

143
Appendix H: (Continued) Closing screen 2

144
Appendix I: Expert Review Materials. This is the email sent to the Instructional Technology Student Association soliciting expert reviews. The link to the survey was not provided in the initial email so potential participants could be screened for meeting the minimal requirements. Hello Everyone: For those of you that do not know me, my name is Albert Ritzhaupt. I am a doctoral candidate in the Instructional Technology program. As part of my dissertation, I need to validate instructional materials for my research experiments. This research specifically pertains to a learner's ability to remember auditory verbal information under conditions of time-compressed speech when representational adjunct pictures are available. If you would be willing to help me with this process, please send me an email at: [email protected]. I have created a simple web-driven survey instrument to facilitate the process. It should not take more than 30 minutes of your time. The ideal expert reviewers are doctoral students, candidates, and graduates in instructional technology that are familiar with the basic concepts of dual-coding theory, multimedia learning, and have experience with developing instructional materials. I need probably 10 or more experts to help. Upon receiving your email, I will send you a hyperlink to the instrument. The survey itself is anonymous. Thanks in advance for anyone willing to help a helpless doctoral student trying to graduate :-) Cheers, Albert Ritzhaupt
Appendix I: (Continued)

145
This is the introductory screen provided to experts to review the adjunct images selected for this research study.
Validation of Representational Pictures Introduction I am a doctoral candidate in the College of Education, Instructional Technology program. As part of my dissertation, I need to validate instructional materials for my research experiments. This research specifically pertains to a learner's ability to remember auditory verbal information under conditions of time-compressed speech when representational adjunct pictures are available. If you have any questions, please send them to me at [email protected]. Summary and Instructions There is a long standing tradition in education to use adjunct pictures in instructional materials to positively influence learning (Anglin, Vaez, & Cunningham, 2004). Empirical evidence has shown the combination of words and pictures leads to better learning than from words alone (Mayer & Gallini, 1990; Clark & Pavio, 1991; Pavio, 1986; Pavio, 1990), when the learner attends to and is able to understand the pictures. This is known as the multimedia effect. Further, it has been long established that a person’s memory for pictures is better than memory for words alone (McDaneial & Pressley, 1987; Pavio, 1986; Standing, Conezio, Haber, 1970). This is known as the picture superiority effect. Levin (1981) suggests pictures can serve as decorational, representational, organizational, and transformational. While decorational pictures serve no purpose in instructional materials and can actually hinder the learning process, representational pictures have been found to have positive effects on learning (Levin, 1981; Carney & Levin, 2002). Representational pictures should literally depict some or all of the text content and provide a context relating to the text in some meaningful way. The pictures used in the present research are purposefully intended to be representational in nature as they are intended to provide context, and serve as a secondary cue to retrieve relevant information from working memory about a related text - a referential process according to dual coding theory. Referential processing refers to the activation of verbal information by nonverbal information or vice-versa. On the following pages you will first be asked to read ten small paragraphs each related representational pictures. The pictures and text presented will be used in research experiments pertaining to time-compressed speech and adjunct pictures, thus it is important to make sure the pictures and text have a meaningful semantic relationship to activate referential processing. You will be asked some questions about each of the pictures and text that you read. Your responses are anonymous. Please respond to the questions truthfully and to the best of your ability. Thank you for your time and help in this matter. Click begin to start the process.
Begin
Appendix I: (Continued)

146
Bottom of Form This is a sample of what the expert reviewers saw to assess whether the pictures and text had a strong enough relationship to be considered representational images. Experts reviewed all ten pictures using this information. Top of Form
Validation of Representational Pictures Instructions: Please read the following paragraph while attending to the picture shown. Respond to the following questions pertaining to the picture and text. Click next to continue and secure your response.
Paragraph Feral camels that roam Australia’s vast wilderness, gorging on Acacia trees and a juicy plant nicknamed "pig face," are able to squeeze every little bit of moisture out of their food. These animals are the preferred beasts of burden for tribesman and hunters, primarily because they do not require large amounts of water as they travel. Despite its large size, the camel has effectively adapted to the country’s arid environmental conditions by having no need to sweat.
Appendix I: (Continued)

147
In my expert opinion, the picture... is representational of some of the text. Strongly Disagree Disagree Agree Strongly Agree
would help a learner remember information within the text. Strongly Disagree Disagree Agree Strongly Agree
is suitable for instructional materials. Strongly Disagree Disagree Agree Strongly Agree
If you responded either strongly disagree or disagree to the above statements, please provide short a justification.
Please provide any other important or helpful comments about the picture and text.
Next>>
148
Appendix I: (Continued) This is the confirmation screen presented to expert reviews after reviewing all the images used in the intervention. Validation of Representational Pictures
Thanks Dear Expert Reviewer, Thank you again for helping me in my dissertation study. Should you have any questions or concerns related to this study, please feel free to contact me: Email: [email protected] Cell Phone: 999-999-9999 As previously stated, this information you provided is anonymous and will be used to add to the body of knowledge. Cheers, Albert Ritzhaupt

149
Appendix J: Example Sign Up Sheet.
Research Study Participation
This research study will take about 40-60 minutes and involves time compressed multimedia instruction (especially the audio component). This research does not deal with human personality or aptitude. To participate, please sign your name after one of the numbers below. Only 15 people can be taken at a session because of the number of computers available. All sessions will be held in room 15-1104 in the School of Computing building at the date and times listed. Please make note of the session you sign up for and be sure to arrive promptly at that time. Day of week Day of week Day of week Start –End Start –End Start –End Etc…

150
Appendix K: Pilot Study Graphics. This graphic illustrates the content recognition results from pilot study 2.
0
0.1
0.2
0.3
0.4
0.5
0.6
0.7
Very Fast Normal
Mea
n Pe
rcen
t Con
tent
Rec
ogni
tion
This graphic illustrates the cued-recall results from pilot study 2.
0
0.05
0.1
0.15
0.2
0.25
0.3
0.35
0.4
0.45
0.5
Very Fast Normal
Mea
n P
erce
nt C
ued-
Rec
all

151
Appendix K: (Continued) This graphic illustrates the learner satisfaction results from pilot study 2.
0
0.1
0.2
0.3
0.4
0.5
0.6
0.7
0.8
Very Fast Normal
Mea
n Pe
rcen
t Lea
rner
Sat
isfa
ctio
n

152
About the Author
Albert Dieter Ritzhaupt was born in Dunedin, Florida. His family used to own a
four-start gourmet restaurant known as Seaport Inn located in Port Richey, Florida, where
he spent most of his adolescent life. He graduated from Ridgewood High School in 1999,
moved to Orlando to attend Valencia Community College’s honors program. After
finishing his Associate of Arts, he moved to Jacksonville to attend the University of
North Florida (UNF).
At UNF, Albert completed his Bachelor of Science in Computer and Information
Sciences, Honors in the Major, Magna Cum Laude in the summer of 2003. Next, he
completed a Master of Business Administration with 18-graduate credit hours in
computer and information sciences in the fall of 2004, while teaching as an adjunct
instructor and working as a software developer. It was during this time that Albert
discovered his true passion: the meaningful integration of information and
communication technology for the improvement of education at all levels.
The journey brought Albert to the University of South Florida’s Instructional
Technology doctoral program. Albert began his Ph.D. studies in the summer of 2005.
During this time, he worked on numerous research projects and instructional technology
initiatives as software developer and statistical analyst, and served as a full-time
instructor at a community college and later a university. In the fall of 2007, Albert
successfully defended his dissertation, and he plans to graduate in the spring of 2008.
Albert looks forward to continuing his teaching, exploration and research, and writing in
the future as a professor at a university.


![TS 102 371 - V1.1.1 - Digital Audio Broadcasting (DAB ......Eureka-147 Digital Audio Broadcasting (DAB) (TS 102 818 [1]) should be compressed, profiled and broadcast. Within the present](https://static.fdocuments.in/doc/165x107/5ec7985e2c3e7a6ceb082fe5/ts-102-371-v111-digital-audio-broadcasting-dab-eureka-147-digital.jpg)