Effects of the WIC Food Package Revisions on Food Purchases...Effects of the WIC Food Package...
35
Effects of the WIC Food Package Revisions on Food Purchases National WIC Association Conference May 19, 2015 Tatiana Andreyeva, PhD Associate Professor Director of Economic Initiatives Rudd Center for Food Policy & Obesity University of Connecticut
Transcript of Effects of the WIC Food Package Revisions on Food Purchases...Effects of the WIC Food Package...

Effects of the WIC Food Package
Revisions on Food Purchases
National WIC Association Conference
May 19, 2015
Tatiana Andreyeva, PhD
Associate Professor
Director of Economic Initiatives
Rudd Center for Food Policy & Obesity
University of Connecticut

WIC Revisions
• Increase whole grain & fiber intake
- Added whole grain bread/alternates
- Added fruit and vegetables
• Reduce fat & sugar intake - Lower juice and milk allowances
- Restriction on milk fat content
• Promote breast-feeding
To align WIC foods with Dietary Guidelines for
Americans and AAP’s child feeding guidelines
2

Effects of WIC Revisions
Improved access to healthy foods Gains to participants and community at large
Purchase behavior aligned with WIC food package
revisions
Increased consumption of recommended foods
Mixed evidence on breast feeding initiation; small
increase in duration
Preliminary data of declining obesity rates in low-
income young children
3
Scope of Research
4
Assess changes in WIC participants’
purchases of foods targeted in the revisions:
juice, milk, whole grains, fruits and vegetables
Evaluate the healthfulness of all food
purchases of WIC participating households
after implementation of the WIC revisions

Loyalty-Card Based Data
All loyalty card purchases made within chain – Tracked over time at a
loyalty card (HH) level
De-identified data – No HH info
Known method of payment – WIC, SNAP, other
5

Study Sample
New England grocery store chain
2 states, over 60 stores
Diverse towns and income areas
Regular WIC participants pre and post revisions
Jan-Sep 2009 and Jan-Sep 2010
Used WIC benefits each quarter
N = 2,137 households; ~200,000 purchases
About ½ WIC participants also on SNAP
6

Categorization of Purchases
Product and size classification at the UPC level:
7
Product description & category groupings
Gladson & IRI Nutrition
Data
Manual search
using online resources
• 31,932 unique food UPCs purchased
• Size in ounces
• Product nutritional information and ingredient lists from commercial providers (Gladson and IRI)
• 100% juice, type of milk, whole grains, fruit and vegetables
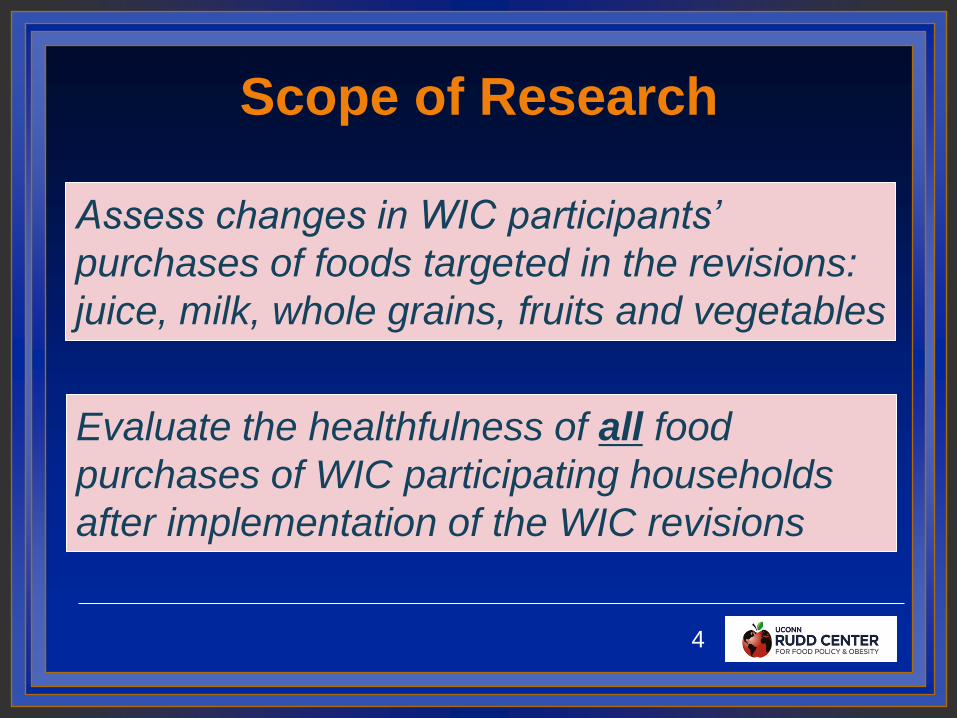
Categorization of Purchases
Whole grain categorization:
UPCs labeled as:
— 100% Whole Grain
— Some Whole Grain
— Refined Grain
— No Grain in product
Food Patterns Equivalents Database Methodology
and a guide for National School Lunch and Breakfast
programs used to identify whole v. refined grains
8

Studies of Targeted Foods
9
Outcomes
– Volume/amount purchased
– Spending (fruit and vegetables only)
Payment analysis
– Total purchases
– WIC funds
– Non-WIC funds
GLM model estimation

Juice Purchase Changes
10 Source: Andreyeva et al. Pediatrics 2013.

Juice Purchase Changes
100% Juice % change Monthly purchases per
household, ounces
2009 2010
Total,
WIC & non-WIC
-23.5*** 238 182
Purchased with
WIC benefits
-43.5*** 154 87
Purchased with
non-WIC funds
13.6*** 84 95
Source: Andreyeva et al. Pediatrics 2013. ***p<0.001
24% less juice purchased after WIC revisions
Small compensation to non-WIC juice (1/5th)
11

Other Beverage Purchases
12 Source: Andreyeva et al. Pediatrics 2013.

Other Beverage Purchases
Beverage % change Monthly purchases per
household, ounces
2009 2010
100% juice -23.5*** 238 182
Fruit drinks 20.9*** 73 88
Soft drinks -12.1*** 288 254
New age
beverages
21.3*** 75 91
13
Limited compensation to other beverages
Source: Andreyeva et al. Pediatrics 2013. ***p<0.001

Milk Study
Less milk and cheese
No whole milk for women, 2-5 yr old children
Soy-based alternatives
Same monthly allowances by state
Significant changes in WIC milk and cheese
Analyzed products
Cow’s milk of any fat (208 UPCs)
WIC-eligible cheese (199 UPCs)
14

Milk: WIC Purchases
% change Monthly purchases per
household, ounces
2009 2010
Total milk -19.5*** 375 302
Whole milk -63.2*** 205 75
2% milk 72.1*** 82 142
1% milk n.s. 76 72
Skim milk n.s. 13 14
WIC cheese -77.2*** 14 3
Note: Data for CT. Source: Andreyeva et al. JAND 2013. ***p<0.001 15
Decline in milk and cheese purchases

Milk Purchases in CT vs. MA
16 Source: Andreyeva et al. JAND 2013.
2% fat max 1% fat max
Milk with highest allowable fat purchased

Milk: Non-WIC Purchases
% change Monthly purchases per
household, ounces
2009 2010
Total milk n.s. 126 127
Whole milk n.s. 73 62
2% milk n.s. 27 29
1% milk 37.2** 20 28
Skim milk n.s. 4 6
WIC cheese 17.1*** 10 12
Note: Data for CT. Source: Andreyeva et al. JAND 2013. ***p<0.001; **p<0.05. 17
No compensation from non-WIC funds

Milk: Total Purchases
% change Monthly purchases per
household, ounces
2009 2010
Total milk -14.2*** 503 431
Whole milk -49.4*** 280 142
2% milk 56.2*** 110 172
1% milk n.s. 97 101
Skim milk n.s. 18 22
WIC cheese -37.2*** 24 15
Note: Data for CT. Source: Andreyeva et al. JAND 2013. ***p<0.001 18
½ less whole milk purchased, less milk overall

Whole Grain Study
Analyzed products
Bread (1,130 UPCs)
• 100% whole grain, some whole grain, non-whole grain
Rice (194 UPCs)
• White, brown
Tortillas (58 UPCs)
• Whole wheat, soft corn, non-whole grain
19

Bread and Rice Purchases
% change Monthly purchases per
household, ounces
2009 2010
White bread -11.5*** 60 53
100% whole
grain bread
311.9*** 6 20
White rice n.s. 5.5 5.7
Brown rice 837.6*** 0.3 2.4
Source: Andreyeva , Luedicke. Am J Prev Med 2013. ***p<0.001
Increased whole grain purchases, all driven by WIC
20

Bread Purchases Composition
Replacing refined grains with whole grains
Source: Andreyeva , Luedicke. Am J Prev Med 2013.
21

Fruit and Vegetable Study
Analyzed products
Fresh vegetables by DGA type (954 UPCs)
Fresh fruit (701 UPCs)
Canned, frozen fruit and vegetables
Fruit and vegetables added to WIC food
packages
Fresh, canned, frozen plain fruit & vegetables,
except white potatoes
Cash-value vouchers
22

Fruit and Vegetable Purchases
% change
Monthly purchases per
household, ounces
2009 2010
Vegetables (excluding white potatoes)
Fresh 17.5*** 76 89
Total 8.7*** 152 166
Fruit
Fresh 28.6*** 113 147
Total 25.9*** 127 160
23
Increase in fruit and vegetable purchases, especially for fresh fruits
Source: Andreyeva, Luedicke. Public Health Nutrition, 2014. ***p<0.001

Fruit and Vegetable Purchases
5
15
25
0
10
20
30
Cup
s
Jan2009Jan2009 Sept2009Jan2009 Sept2009 Jan2010Jan2009 Sept2009 Jan2010 Sept2010
WIC Non-WIC
Any payment
B
Purchases of Fresh Vegetables* (Cups)
5
15
25
0
10
20
30
Cup
s
Jan2009Jan2009 Sept2009Jan2009 Sept2009 Jan2010Jan2009 Sept2009 Jan2010 Sept2010
WIC Non-WIC
Any payment
B
Purchases of Fresh Fruit (Cups)
24
All improvement is due to WIC
Small substitution (5% loss in non-WIC purchases)

Summary of Findings
¼ less juice purchased • No compensation with non-WIC funds
• Little shift to fruit drinks and sodas
½ less whole milk purchased • Milk with highest allowable fat purchased
• Total milk reduced
Increased whole grain purchases • Substitution of refined grain bread
• No changes in non-WIC purchases
Increased fruit and vegetable purchases • Small reduction in non-WIC purchases
• Little role of WIC in total FV spending (15-25%)
25

Scope of Research
26
Evaluate the healthfulness of all food
purchases of WIC participating households
after implementation of the WIC revisions
Joint work with Amanda Tripp

Nutritional Categorization
Each product classified as “Healthy,” “Neutral,” or
“Moderation” based on USDA ERS 2012 Study
Must meet minimum nutritional thresholds to be
classified as healthy:
27
Category Sodium Saturated Fat Added Sugar
Vegetable, Fruit,
Dairy & Grains
< 480mg per
serving
<= 3g per
serving
< 4g per
serving
Meat < 480mg per
serving
<= 4g per
serving
< 4g per
serving
Mixed Dishes < 600mg per
serving
< 5g per serving < 5g per
serving

Nutritional Categorization
28
Healthy Foods
• Foods below nutritional thresholds
• Snack foods: Below thresholds & contain whole grains
• Beverages: Unsweetened water
Neutral Foods
• Foods below thresholds, but not meeting minimal serving sizes
• Infant formula and baby foods
• Snack foods: Below thresholds, no whole grains
• Beverages: Diet/low calorie beverages, coffee, tea
Moderation Foods
• Foods exceeding nutritional thresholds per serving

Purchases by Nutritional Status
29
0
250
500
750
100
01
25
0
Volu
me
(o
z.)
Jan2009Jan2009 Sept2009Jan2009 Sept2009 Jan2010Jan2009 Sept2009 Jan2010 Sept2010
Ounces Health Ounces Neutral
Ounces Moderation
Ounces Purchased by Health Type Healthy Ounces
make up 50.4% of
ounces purchased
in pre period and
51.5% of ounces
purchased in post
period

Food Purchases by Payment
30
0
500
100
01
50
02
00
0
Volu
me
(o
z.)
Jan2009Jan2009 Sept2009Jan2009 Sept2009 Jan2010Jan2009 Sept2009 Jan2010 Sept2010
Total Ounces WIC $ Ounces
Other $ Ounces
Ounces Purchased by Source

Changes in Ounces by Category
31

Changes in Ounces and Spending
32

Summary of Findings
Healthy foods comprise majority of food and
beverage purchases
Overall reduction in food purchases post
revisions, driven by WIC purchases Decline in Juice, Milk and Infant formula/foods
Proportion of healthy foods increased while
moderation foods declined post WIC revisions Overall healthfulness of foods purchased improved, driven by
WIC food package revisions
33
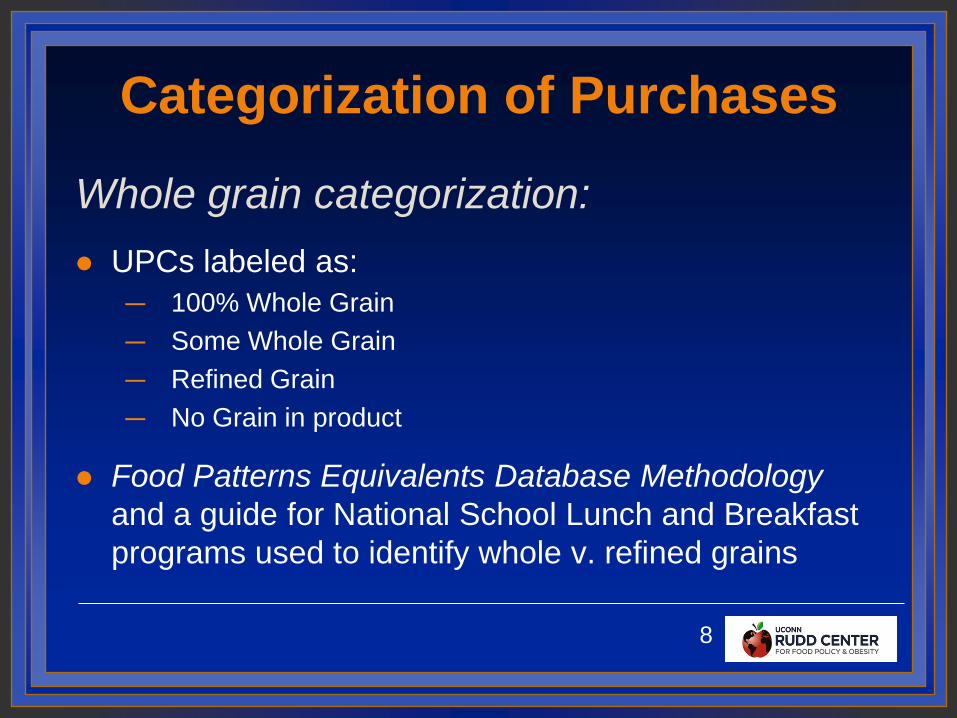
Limitations
Limited geographic scope
Single grocery store chain, does not represent all food purchases
No socio-demographic data at household level
No control group
Short time period
Does not capture food intake
34

Acknowledgements
Research funding
USDA Economic Research Service
Institute for Research on Poverty RIDGE
Center for National Food and Nutrition
Assistance Research program
Research team
Joerg Luedicke, Amanda Tripp, Kathryn
Henderson, Marlene Schwartz, Khadija
Turay, Ann Middleton
Confidential grocery store chain
35