Effects of the type of reference scale on descriptive ...
11
ORIGINAL ARTICLE Effects of the type of reference scale on descriptive sensory analysis of cooked rice: Universal aromatic scale versus rice aromatic scale Sara E. Jarma Arroyo | Han-Seok Seo Department of Food Science, University of Arkansas, Fayetteville, Arkansas Correspondence Han-Seok Seo, Department of Food Science, University of Arkansas, 2650 North Young Avenue, Fayetteville, AR 72704, USA. Email: [email protected] Funding information National Institute of Food and Agriculture Hatch Act, Grant/Award Number: 229718 Abstract This study aimed to determine whether panelists’ attribute-intensity ratings and performances in descriptive sensory analysis could vary with the type of reference scale used. Seven panelists, three times each, evaluated flavor attributes of eight cooked-rice samples using either the univer- sal aromatic scale (UAS) or the rice aromatic scale (RAS). Both scales could differentiate cooked rice samples with respect to individual flavor attributes, although the RAS was more sensitive to several attributes such as cardboard and metallic flavors. While both types of reference scale exhibited good repeatability, the RAS demonstrated better performance in terms of panel agree- ment and discriminability than did the UAS. Both scales produced similar clustering of cooked rice samples based on flavor attribute intensities. In conclusion, while either type could be effectively used as a quantitative frame of reference in descriptive sensory analysis of cooked rice, the RAS performed better than the UAS with respect to detecting and scoring subtle sample differences in flavor attribute intensities. Practical applications Despite its popular use as a quantitative frame of reference in the descriptive sensory analysis for a broad range of products, the UAS has the limitation that panelists may use only a narrow range of the entire scale when products to be tested have either very low or very high intensities. This study showed such a limitation in several flavor attributes of cooked rice samples with typically weak flavors. Our findings provide a better understanding regarding how choice of a quantitative frame of reference influences descriptive sensory analysis of cooked rice. 1 | INTRODUCTION In the descriptive sensory analyses, panelists are asked to describe sen- sory attributes perceivable in certain food products, and to rate per- ceived intensities for the detected attributes (Lawless & Heymann, 2010). During panel training and sample evaluation, to specify qualita- tive (e.g., perceived attributes) and quantitative (e.g., perceived inten- sities) components of sample products, a frame of reference, defined as “the background information and reference points (frame of comparison) that evaluators (trained panelists or consumers) mentally use when choos- ing words and intensities to describe and quantify perceptions” (Mu~ noz & Civille, 1998, p. 59), has been used. Such a frame of reference is char- acterized by both qualitative and quantitative components. While the qualitative component of reference helps panelists define and specify sensory attributes of sample products, the quantitative component helps them establish the boundaries of the attribute intensities of the sample products (Mu~ noz & Civille, 1998; Murray, Delahunty, & Baxter, 2001). A quantitative frame of reference is typically based on the lowest and highest boundaries of the attribute intensities perceived by panel- ists in the test samples. Mu~ noz and Civille (1998) systematically reviewed three types of quantitative frame of reference, the universal scale, the product-specific scale, and the attribute-specific scale, in terms of philosophy, advantages, and disadvantages. First, the universal scale was designed for evaluating attribute intensities across any cate- gory of products on an absolute-intensity-basis scale by establishing the highest intensity point that could be perceived across products (Meilgaard, Civille, & Carr, 2015; Mu~ noz & Civille, 1998). For example, the aromatic note of vegetable oil and the cinnamon note of Big Red chewing gum are set up as 2.0-point and 12.5-point intensities, J Sens Stud. 2017;32:e12295. https://doi.org/10.1111/joss.12295 wileyonlinelibrary.com/journal/joss V C 2017 Wiley Periodicals, Inc. | 1 of 11 Received: 15 March 2017 | Revised: 31 July 2017 | Accepted: 31 July 2017 DOI: 10.1111/joss.12295
Transcript of Effects of the type of reference scale on descriptive ...
OR I G I N A L A R T I C L E
Effects of the type of reference scale on descriptive sensoryanalysis of cooked rice: Universal aromatic scale versus ricearomatic scale
Sara E. Jarma Arroyo | Han-Seok Seo
Department of Food Science, University of
Arkansas, Fayetteville, Arkansas
Correspondence
Han-Seok Seo, Department of Food
Science, University of Arkansas, 2650
North Young Avenue, Fayetteville, AR
72704, USA.
Email: [email protected]
Funding information
National Institute of Food and Agriculture
Hatch Act, Grant/Award Number: 229718
AbstractThis study aimed to determine whether panelists’ attribute-intensity ratings and performances in
descriptive sensory analysis could vary with the type of reference scale used. Seven panelists,
three times each, evaluated flavor attributes of eight cooked-rice samples using either the univer-
sal aromatic scale (UAS) or the rice aromatic scale (RAS). Both scales could differentiate cooked
rice samples with respect to individual flavor attributes, although the RAS was more sensitive to
several attributes such as cardboard and metallic flavors. While both types of reference scale
exhibited good repeatability, the RAS demonstrated better performance in terms of panel agree-
ment and discriminability than did the UAS. Both scales produced similar clustering of cooked rice
samples based on flavor attribute intensities. In conclusion, while either type could be effectively
used as a quantitative frame of reference in descriptive sensory analysis of cooked rice, the RAS
performed better than the UAS with respect to detecting and scoring subtle sample differences in
flavor attribute intensities.
Practical applicationsDespite its popular use as a quantitative frame of reference in the descriptive sensory analysis for
a broad range of products, the UAS has the limitation that panelists may use only a narrow range
of the entire scale when products to be tested have either very low or very high intensities. This
study showed such a limitation in several flavor attributes of cooked rice samples with typically
weak flavors. Our findings provide a better understanding regarding how choice of a quantitative
frame of reference influences descriptive sensory analysis of cooked rice.
1 | INTRODUCTION
In the descriptive sensory analyses, panelists are asked to describe sen-
sory attributes perceivable in certain food products, and to rate per-
ceived intensities for the detected attributes (Lawless & Heymann,
2010). During panel training and sample evaluation, to specify qualita-
tive (e.g., perceived attributes) and quantitative (e.g., perceived inten-
sities) components of sample products, a frame of reference, defined
as “the background information and reference points (frame of comparison)
that evaluators (trained panelists or consumers) mentally use when choos-
ing words and intensities to describe and quantify perceptions” (Mu~noz &
Civille, 1998, p. 59), has been used. Such a frame of reference is char-
acterized by both qualitative and quantitative components. While the
qualitative component of reference helps panelists define and specify
sensory attributes of sample products, the quantitative component
helps them establish the boundaries of the attribute intensities of the
sample products (Mu~noz & Civille, 1998; Murray, Delahunty, & Baxter,
2001).
A quantitative frame of reference is typically based on the lowest
and highest boundaries of the attribute intensities perceived by panel-
ists in the test samples. Mu~noz and Civille (1998) systematically
reviewed three types of quantitative frame of reference, the universal
scale, the product-specific scale, and the attribute-specific scale, in
terms of philosophy, advantages, and disadvantages. First, the universal
scale was designed for evaluating attribute intensities across any cate-
gory of products on an absolute-intensity-basis scale by establishing
the highest intensity point that could be perceived across products
(Meilgaard, Civille, & Carr, 2015; Mu~noz & Civille, 1998). For example,
the aromatic note of vegetable oil and the cinnamon note of Big Red
chewing gum are set up as 2.0-point and 12.5-point intensities,
J Sens Stud. 2017;32:e12295.https://doi.org/10.1111/joss.12295
wileyonlinelibrary.com/journal/joss VC 2017Wiley Periodicals, Inc. | 1 of 11
Received: 15 March 2017 | Revised: 31 July 2017 | Accepted: 31 July 2017
DOI: 10.1111/joss.12295
respectively, on a “universal aromatics scale” ranging from 0 to 15
points (Meilgaard et al., 2015). Second, the product-specific scale was
designed for evaluating attribute intensities only within the boundaries
of the specific product category with a separate product-specific scale
generated for each product category. In this way, the highest reference
point of the product specific scale is determined based on the highest
attribute-intensity that panelists perceive within the specific product
category (Meilgaard et al., 2015; Mu~noz & Civille, 1998). Finally, the
attribute-specific scale is used for evaluating perceived intensities with
respect to a certain specific attribute (e.g., vanilla flavor attribute)
across related products (Mu~noz & Civille, 1998).
Which type of reference scale would be most useful in descriptive
sensory analysis? Selecting an adequate frame of quantitative refer-
ence scaling appears to be dependent on many factors, including pur-
poses of sensory analysis, availabilities of reference samples, panel
training conditions, product types, and attribute-intensity boundaries.
For example, when researchers want to compare intensities of sensory
attributes not only among products within a product category but also
among products across product categories, the universal scale can be
most effective since perceived intensities are rated based on the same
references that represent absolute intensities across any category of
products. Because it provides such absolute references, the universal
scale may require less time and cost for researchers, both in preparing
references and training panelists, compared to the product-specific
scale and the attribute-specific scale. The universal aromatic scale
(UAS) has therefore often been used as a frame of quantitative refer-
ence in descriptive sensory analysis, especially in the Spectrum method
(Sensory Spectrum, Inc., Chatham, NJ), for a variety of food products
including strawberry yogurt (Lovely & Meullenet, 2009), rice cake (Cho
et al., 2014), poultry meat (Luckett, Kuttappan, Johnson, Owens, & Seo,
2014), and uncooked (Rodríguez-Arzuaga, Cho, Billiris, Siebenmorgen, &
Seo, 2016) and cooked rice (Champagne et al., 2004, 2005; Meullenet,
Marks, Griffin, & Daniels, 1999). The primary disadvantage of the UAS,
however, is that panelists may only use a narrow range of the entire
scale when products to be tested have either lower or higher intensities
compared to the lowest or the highest of the reference point, respec-
tively, resulting in determination of no significant difference between
the test products (Mu~noz & Civille, 1998).
Uncooked and cooked rice samples are examples that represent
such limitations of the universal scale. More specifically, in previous
studies that used the UAS as a quantitative reference for descriptive
sensory analyses of uncooked (Rodríguez-Arzuaga et al., 2016) and
cooked (Champagne et al., 2004, 2005; Meullenet et al., 1999) rice
samples, the highest intensity ratings for most attributes were generally
lower than 3.0-point on the scale ranging from 0 to 15. Using this
method, most attributes of aromas and flavors showed no significant
differences between cooked rice samples evaluated in such previous
studies (Champagne et al., 2004; Meullenet et al., 1999; Rodríguez-
Arzuaga et al., 2016). In a similar vein, Champagne (2008) emphasized
that, since the UAS has an insufficient number of reference points
between integers, its use may lead to large SDs between panelists’ rat-
ings, resulting in an apparent lack of significant difference between
cooked rice samples with respect to aromas and flavors. However, it is
worth noting that the cooked rice samples were found to differ signifi-
cantly in many attributes of aromas and flavors when they were eval-
uated with either the product-specific scale (Yau & Huang, 1996) or
the attribute-specific scale (Limpawattana & Shewfelt, 2010; Park, Kim,
& Kim, 2001; Suwansri, Meullenet, Hankins, & Griffin, 2001; Yau & Liu,
1998) as a quantitative frame of reference. Since both the product-
specific scale and the attribute-specific scale allow panelists to use the
entire scale range, small but detectable aromatic differences between
cooked rice samples are more likely to be detected. This assumption,
however, should be validated because these previously reported stud-
ies were conducted under a variety of experimental conditions in terms
of rice samples, treatments, and panel training. The present study
therefore aims at determination of flavor characteristics of cooked rice
samples by using the two types of quantitative reference scale, the uni-
versal scale (the UAS), and the product-specific scale (the rice aromatic
scale [RAS]). In addition, panelist performance in the descriptive sen-
sory analysis of cooked rice samples was evaluated as a function of the
type of quantitative reference scale used.
2 | MATERIALS AND METHODS
2.1 | Panelists
This study was conducted according to the Declaration of Helsinki for
studies on human subjects. The protocol used in this study was
approved by the Institutional Review Board of the University of Arkan-
sas (Fayetteville, AR). Seven professionally-trained panelists at the Uni-
versity of Arkansas Sensory Service Center (Fayetteville, AR)
participated in this study. Each panelist had an experience of greater
than 1,000 hr in evaluating a wide spectrum of food products including
both uncooked and cooked rice products.
2.2 | Quantitative references used in the descriptive
sensory analysis
To generate descriptors of flavor attributes to be tested in this study, 7
panelists were asked to evaluate flavor attributes of cooked rice sam-
ples prepared from each of 20 different rice-grain products. More spe-
cifically, panelists were asked to identify flavor attributes commonly
present in the 20 cooked samples of commercially available milled and
brown rice-grain products. During a 6-hr panel discussion led by a
panel leader, the seven flavor attributes shown in Table 1 were chosen
and defined.
Two types of quantitative reference, the “UAS” and the “RAS,”
were used in the descriptive sensory analysis of cooked rice. The UAS
(Sensory Spectrum, Inc., Chatham, NJ) was used with a modification:
soda note in Nabisco Premium Original Saltine Crackers (Mondel�ez
Global LLC, East Hanover, NJ)53.0; cooked-apple note in Mott’s Nat-
ural Applesauce (Mott’s LLP, Plano, TX)57.0; and orange note in
Minute Maid Frozen Orange Juice Concentrate (The Coca-Cola Co.,
Atlanta, GA)510.0 (Table 1). Because all panelists had extensive expe-
rience with descriptive sensory analysis of cooked rice based on the
2 of 11 | JARMA ARROYO AND SEO

UAS, and they were to evaluate only seven flavor attributes in this
study, the panelists went through a short 3-hr training session. All pan-
elists were trained to be familiar with the definitions and intensities of
the flavor attributes in cooked rice based on the UAS. Practices with
feedback were continued until the panelists showed accurate and con-
sistent usages of the reference scale for evaluating intensities of indi-
vidual flavor attributes.
For the RAS, three reference samples of cooked rice were chosen
based on two aspects: (a) a wide range of intensities for the seven fla-
vor attributes to be tested and (b) easy accessibility in the market. Dur-
ing a couple of 3-hr training sessions, two or three intensity values on
a scale ranging from 0 to 15 with 0.1 increments were determined by
using two or three reference samples of cooked rice (Table 1). The
intensity points of references were determined through panel discus-
sion led by a panel leader. Next, panelists were trained to be familiar
with such reference intensities for each attribute until they accurately
and correctly used the reference scale for their evaluation of flavor
attribute intensities in cooked rice.
2.3 | Descriptive sensory analysis of cooked rice
Eight rice-grain products, six of which were milled-rice products (two
medium-grain, two long-grain, and two long-grain-jasmine) and two of
which were brown-rice products (two long-grain) were purchased from
local supermarkets and grocery stores (Northwest Arkansas, AR). The
cultivars of the commercial rice-grain products were unknown.
Each rice-grain product (300 g) was cooked in an electronic rice
cooker (RC3314W, Black & Decker, Beachwood, OH) using a 1:2 (w/w)
rice-to-water ratio. The cooked rice was held in the rice cooker for
5 min and then gently fluffed andmixed to ensure its homogeneity. Sub-
sequently, 30 g of the cooked rice was placed in a glass bowl (4-oz), cov-
ered with a glass lid, and presented at 71618C.
Panelists were asked to evaluate the eight cooked-rice samples
with respect to seven flavor attributes (Table 1) on scales ranging from
0 to 15 with 0.1 increments, using the UAS as a quantitative frame of
reference. Since the panelists had extensive experience with descrip-
tive sensory analysis of cooked rice based on the UAS, to minimize
potential confusion and influence of the RAS, the UAS condition was
administrated prior to the RAS condition. The samples were randomly
presented to the panelists in a sequential monadic fashion, and a 10-
min break was allowed between sample presentations. During the
break, spring water (Clear Mountain Spring Water, Taylor Distributing,
Heber Springs, AR) was used for palate cleansing. The entire analysis
was repeated three times on two different days.
Panelists were trained with the RAS two weeks after completing
the descriptive sensory analysis of cooked rice with the UAS. During a
TABLE 1 Descriptors, definitions, and references for flavor attributes of cooked rice
References
Descriptors DefinitionsUniversal aromaticscale (UAS): intensity
Rice aromatic scale(RAS): intensity
Starchy The aromatic associated with the starch of aparticular grain source.
UAS_A: 3.0UAS_B: 7.0UAS_C: 10.0
RAS_B: 6.0RAS_C: 11.0RAS_A: 13.0
Grainy A general term used to describe the aro-matic of raw or cooked grains, whichcannot be tied to a specific grain type.
UAS_A: 3.0UAS_B: 7.0UAS_C: 10.0
RAS_A: 4.0RAS_C: 5.0RAS_B: 10.0
Wet cardboard The aromatic associated with early stages ofoxidation.
UAS_A: 3.0UAS_B: 7.0UAS_C: 10.0
RAS_C: 1.0RAS_A: 3.0RAS_B: 6.0
Nutty The aromatic associated with nuts or nut-meats that cannot be tied to a specificorigin.
UAS_A: 3.0UAS_B: 7.0UAS_C: 10.0
RAS_A: 1.0RAS_B: 12.0
Metallic The aromatic associated with metal, tinny orirony.
UAS_A: 3.0UAS_B: 7.0UAS_C: 10.0
RAS_B: 2.0RAS_A: 6.0RAS_C: 8.0
Burlap The aromatic associated with burlap. UAS_A: 3.0UAS_B: 7.0UAS_C: 10.0
RAS_C: 2.0RAS_B: 7.0
Floral The aromatic associated with a nonspecificfloral note.
UAS_A: 3.0UAS_B: 7.0UAS_C: 10.0
RAS_A: 4.0RAS_C: 12.0
UAS_A5 soda note in Nabisco Premium Original Saltine Crackers (Mondel�ez Global LLC, East Hanover, NJ); UAS_B5 cooked-apple note in Mott’s Nat-ural Applesauce (Mott’s LLP, Plano, TX); UAS_C5 orange note in Minute Maid Frozen Orange Juice Concentrate (The Coca-Cola Co., Atlanta, GA);RAS_A5 300 g of Extra Long Grain Rice (Riceland Foods, Stuttgart, AR) was cooked in an electronic rice cooker (RC3314W, Black & Decker, Beach-wood, OH) using a 1:2 (vol/vol) rice-to-water ratio. The cooked rice was held in the rice cooker for 5 min and then gently fluffed and mixed to ensureits homogeneity. Subsequently, 30 g of the cooked rice was placed in a glass bowl (4-oz), covered with a glass lid, and presented at 71618C;RAS_B5300 g of Brown Rice (Riceland Foods, Stuttgart, AR, USA) was prepared in the same manner above; RAS_C5 300 g of Jasmine Rice (RiceSelect, Houston, TX, USA) was prepared in the same manner above.
JARMA ARROYO AND SEO | 3 of 11
period of two weeks, to reduce potential influences of previous test
conditions such as cooked rice and reference frame, panelists were
asked to participate in descriptive sensory analysis of another product
(pickled cucumbers) for 6 hr according to the Spectrum method
(Sensory Spectrum, Inc., Chatham, NJ). No additional training with rice
products was given during the period of two weeks. Following the
training session with the RAS, panelists were asked to evaluate flavor
attributes of the eight cooked-rice samples. The experimental proce-
dure, except for the type of reference scale, was identical for the two
descriptive sensory analyses. The entire procedure was repeated three
times on two different days.
2.4 | Statistical analysis
Data analyses were performed using JMP Pro (version 12.0, SAS Insti-
tute, Inc., Cary, NC), XLSTAT software (Addinsoft, New York, NY), and
PanelCheck software (http://www.panelcheck.com). To determine
whether the effects of rice sample on attribute intensities could vary
with the type of reference scale, a three-way analysis of variance
(ANOVA) was performed treating “sample” as a fixed effect and both
“panel” and “repetition” as random effects for the flavor attributes of
cooked rice samples rated using either the UAS or the RAS. If a signifi-
cant difference in means was indicated by the ANOVA, post hoc com-
parisons were performed using a Tukey’s honest significant difference
(HSD) test, with a statistically significant difference defined as p< .05.
To be determined was whether the type of reference scale used
could affect panel performances in the descriptive sensory analysis in
terms of four aspects: use of scale, repeatability, agreement, and dis-
criminability. In the above ANOVA, the effects of “panel” and “repeti-
tion” were used to test panel performances in terms of use of scale
and repeatability. Moreover, mean square errors (MSE), estimates of
random error variance from the ANOVA model, were computed to
measure repeatability with respect to individual panelists (Tomic et al.,
2010). Tucker-1 plots (Tucker, 1966) were used to visualize how simi-
larly or differently individual panelists rated each flavor attribute based
on either the UAS or the RAS. In this way, the Tucker-1 plots were
used for evaluating panel performance in terms of agreement. Finally,
to evaluate individual panelists’ ability to discriminate among rice sam-
ples, F values and their corresponding p values were computed by one-
way ANOVAs (Tomic et al., 2010). In addition, the percentages of fla-
vor attributes successfully discriminated by individual panelists at a 5%
level of significance were computed in either the UAS or the RAS
condition.
To determine whether the type of reference scale could influence
the pattern of clustering cooked rice samples based on flavor attribute
intensities, both agglomerative hierarchical clustering (AHC) and princi-
pal component analysis (PCA) were used. AHC was performed using
Euclidian distance and Ward’s method, and a dendrogram of AHC was
used to visualize clustering based on dissimilarity between cooked rice
samples. A bi-plot of PCA was used to describe the distribution of
cooked rice samples based on the first two factor-scores of seven fla-
vor attributes evaluated using either the UAS or the RAS. The degree
of similarity between the PCA configurations of the flavor attributes
evaluated using either the UAS or the RAS was also measured using
the regression vector (RV) coefficient that can be considered as a cor-
relation coefficient in a multidimensional configuration (Schlich, 1996).
As the RV coefficient was closer to 1.0, the two multidimensional
spaces or configurations were considered as being more similar
(Findlay, Castura, Schlich, & Lesschaeve, 2006; Schlich, 1996). In addi-
tion, the normalized RV (NRV), a normalized deviation between the
observed RV and the calculated RV, was computed to test significance
of the RV coefficient (Findlay et al., 2006; Schlich, 1996). If the NRV
coefficient is greater than 2.0, a similarity between the two multivariate
configurations or shapes are significantly greater than randomly-
obtained similarity (Findlay et al., 2006; Schlich, 1996).
3 | RESULTS AND DISCUSSION
3.1 | Variations in the flavor attribute intensities of
eight cooked-rice samples with respect to the type of
reference scale
Table 2 shows the results of a three-way ANOVA treating “sample” as
a fixed effect and both “panel” and “repetition” as random effects for
the seven flavor attributes of eight cooked-rice samples evaluated
using either the UAS or the RAS. While the UAS showed significant
rice-sample effects on five out of seven flavor attributes, the RAS
showed such effects on all attributes.
Both types of reference scale showed similar patterns of differenti-
ating cooked rice samples with respect to the intensities of grainy and
nutty flavor attributes. Specifically, two brown-rice samples (BRO_G
and BRO_H) were rated as more intense than milled rice samples in
grainy and nutty flavor attributes evaluated using either the UAS or the
RAS (Table 3). These results were consistent with previous findings
that grainy, nutty, and puffed corn flavor attributes in cooked rice
decreased with an increase in the degree of milling (Champagne et al.,
1997; Park et al., 2001).
The effects for rice samples with respect to cardboard and metallic
flavor attributes were found to vary with the type of reference scale.
More specifically, when the RAS was used in the descriptive sensory
analysis, two brown-rice samples, in comparison to other milled-rice
samples, showed significantly greater and smaller intensities with
respect to cardboard and metallic flavor attributes, respectively. How-
ever, those differences were not observed when the UAS was used
(Table 3), indicating that the RAS is more sensitive to detect differences
in terms of cardboard and metallic flavors than the UAS. Previous stud-
ies have found that brown rice has greater intensity of metallic attrib-
ute than milled rice (Bett-Garber, Lea, Champagne, & McClung, 2012;
Billiris, Siebenmorgen, Meullenet, & Mauromoustakos, 2012), but such
differences have not been observed for all cultivars (Bett-Garber et al.,
2012; Limpawattana & Shewfelt, 2010; Park et al., 2001), so further
study is needed to determine whether trained panelists can differenti-
ate among intensities of metallic flavor between cooked rice samples.
Reference scale-induced variations with respect to the effect of
rice sample were also observed in starchy, burlap, and floral flavor
attributes. With respect to starchy flavor attribute, all milled-rice
4 of 11 | JARMA ARROYO AND SEO

samples were rated significantly more intense than the two brown-rice
samples in the RAS condition (Table 3). Since the milling process
removes the hull and the outer bran layers from the rice kernels, the
starchy endosperm is exposed, in turn releasing starchy aromatic flavor
in milled rice (Roberts, 1979), so a starchy flavor intensity is greater in
milled rice than in brown rice (Billiris et al., 2012; Limpawattana &
Shewfelt, 2010). A similar pattern, i.e., a greater intensity of starchy fla-
vor in milled rice than in brown rice, was obtained when using the
UAS, but the JAS_F sample (milled jasmine-rice) did not significantly
differ from the brown rice samples with respect to the intensity of
starch flavor (Table 3). In addition, for the burlap flavor attribute often
found in brown rice (Billiris et al., 2012), the JAS_F sample (milled jas-
mine-rice) was rated as the most intense among the eight samples,
including the two brown-rice samples in the UAS condition, while the
JAS_F sample as well as other milled-rice samples were rated less
intense than the brown rice sample (BRO_G) for the RAS condition.
Since the burlap aroma/flavor attribute mainly results from rice bran
(Rodríguez-Arzuaga et al., 2016), the attribute-intensity was found to
be greater in brown rice than in highly milled rice, so the RAS seems to
perform better in evaluating cooked rice with respect to the burlap fla-
vor attribute. Finally, six milled-rice samples showed significantly
greater intensities of the floral flavor attribute than brown rice samples
under both the UAS and the RAS conditions; this is to some extent in
line with the previous finding that a deep milling process resulted in a
greater intensity of floral flavor (Champagne et al., 1997). The intensity
ratings of the floral flavor attribute were found to be different among
the milled rice samples when rated using the UAS, but not when rated
using the RAS. Specifically, the LONG_C sample was rated as more
TABLE 2 F values in the three-way analysis of variance of seven flavor attributes rated using either the universal aromatic scale or the ricearomatic scale
Panel (P) Sample (S) Repetition (R) P 3 S P 3 R S 3 R
Universal Aromatic Scale
Starchy 4.78** 5.40*** 0.63 N.S. 3.87*** 3.47*** 0.88 N.S.
Grainy 4.83** 11.19*** 0.69 N.S. 7.86*** 6.27*** 1.47 N.S.
Cardboard 2.81* 0.76 N.S. 0.32 N.S. 15.90*** 3.49*** 1.52 N.S.
Nutty 1.01 N.S. 54.16*** 1.40 N.S. 1.66* 1.90* 0.91 N.S.
Metallic 23.63*** 0.88 N.S. 1.81 N.S. 3.13*** 4.61*** 0.58 N.S.
Burlap 4.24** 3.51** 0.13 N.S. 10.30*** 1.41 N.S. 1.17 N.S.
Floral 3.16* 69.62*** 3.91 N.S. 1.76* 2.49** 0.48 N.S.
Rice Aromatic Scale
Starchy 1.67 N.S. 48.47*** 0.46 N.S. 1.27 N.S. 1.54 N.S. 1.29 N.S.
Grainy 1.25 N.S. 23.85*** 0.02 N.S. 4.79*** 1.48 N.S. 2.81**Cardboard 3.19* 9.90*** 0.40 N.S. 2.16** 1.12 N.S. 1.36 N.S.
Nutty 3.64* 96.93*** 0.53 N.S. 2.74*** 0.43 N.S. 1.64 N.S.
Metallic 0.68 N.S. 21.41*** 1.49 N.S. 1.70* 2.19* 0.91 N.S.
Burlap 10.37*** 11.27*** 0.07 N.S. 5.84*** 0.55 N.S. 0.78 N.S.
Floral 3.29* 16.70*** 0.06 N.S. 2.64*** 1.85 N.S. 1.47 N.S.
*, **, and ***: a significance at p< .05, p< .01, and p< .001, respectively; N.S.5no significance at p< .05.
TABLE 3 Mean intensity ratings (6 SD) for seven flavor attributes rated using either the universal aromatic scale or the rice aromatic scale
Starchy Grainy Cardboard Nutty Metallic Burlap Floral
Universal Aromatic Scale
MED_A 5.87 (6 0.80) a 3.73 (6 0.70) b 3.53 (6 0.47) a 0.21 (6 0.56) b 3.25 (6 1.69) a 3.06 (6 1.33) c 3.25 (6 1.53) bMED_B 5.83 (6 0.83) a 3.71 (6 0.77) b 3.64 (6 0.41) a 0.13 (6 0.34) b 3.15 (6 1.84) a 3.42 (6 1.33) bc 3.53 (6 1.38) abLONG_C 5.81 (6 0.84) a 3.76 (6 0.75) b 3.57 (6 0.40) a 0.08 (6 0.24) b 3.08 (6 1.82) a 3.61 (6 0.48) b 4.02 (6 0.78) aLONG_D 5.88 (6 0.74) a 3.73 (6 0.75) b 3.57 (6 0.41) a 0.04 (6 0.17) b 3.14 (6 1.65) a 3.47 (6 0.34) bc 3.61 (6 1.05) abJAS_E 5.76 (6 0.82) a 3.93 (6 0.91) b 3.56 (6 0.45) a 0.04 (6 0.17) b 3.20 (6 1.66) a 3.56 (6 0.41) b 3.78 (6 0.85) abJAS_F 5.13 (6 1.12) b 3.64 (6 0.80) b 3.58 (6 0.50) a 0.05 (6 0.22) b 3.40 (6 2.07) a 5.29 (6 0.95) a 3.19 (6 0.96) bBRO_G 4.92 (6 0.62) b 5.56 (6 1.14) a 3.87 (6 0.88) a 3.97 (6 1.76) a 2.93 (6 1.53) a 3.41 (6 1.66) bc 0.14 (6 0.65) cBRO_H 4.83 (6 0.64) b 5.49 (6 1.40) a 3.99 (6 0.90) a 3.94 (6 2.15) a 2.71 (6 1.62) a 3.63 (6 1.72) b 0.19 (6 0.60) c
Rice Aromatic Scale
MED_A 11.58 (6 1.79) a 4.06 (6 0.61) b 2.86 (6 1.19) b 0.55 (6 0.77) b 6.31 (6 1.38) a 2.07 (6 2.67) c 4.24 (6 1.35) aMED_B 12.28 (6 2.31) a 3.72 (6 0.79) b 2.92 (6 1.57) b 0.89 (6 1.58) b 5.99 (6 1.66) a 2.55 (6 2.98) c 3.27 (6 1.80) aLONG_C 12.00 (6 0.94) a 4.26 (6 0.74) b 2.78 (6 0.92) b 0.48 (6 0.68) b 6.11 (6 1.20) a 1.88 (6 2.69) c 3.71 (6 1.82) aLONG_D 12.28 (6 0.85) a 4.18 (6 0.89) b 2.90 (6 1.20) b 0.52 (6 0.80) b 5.92 (6 1.37) a 1.85 (6 2.61) c 3.71 (6 1.17) aJAS_E 11.83 (6 1.05) a 4.12 (6 0.53) b 2.66 (6 0.84) b 0.79 (6 1.75) b 6.29 (6 1.29) a 2.12 (6 2.80) c 3.71 (6 1.72) aJAS_F 11.20 (6 1.93) a 4.24 (6 0.81) b 2.96 (6 1.69) b 0.61 (6 0.98) b 7.04 (6 1.47) a 5.51 (6 4.22) b 4.00 (6 1.92) aBRO_G 6.40 (6 1.33) b 9.13 (6 1.71) a 5.22 (6 1.11) a 10.35 (6 2.23) a 2.87 (6 1.19) b 6.88 (6 0.90) a 0.24 (6 0.77) bBRO_H 6.17 (6 1.23) b 8.57 (6 2.50) a 5.20 (6 1.35) a 10.35 (6 2.17) a 3.06 (6 1.67) b 6.76 (6 1.24) ab 0.19 (6 0.60) b
BRO, MED, LONG, and JAS represent brown rice, milled medium-grain, milled long-grain, and milled jasmine rice samples, respectively. Mean intensityratings with different letter within a column for each scale represent a significant difference at p< .05.
JARMA ARROYO AND SEO | 5 of 11

intense than the MED_A and the JAS_F samples when using the UAS,
but not when using the RAS (Table 3).
3.2 | Variations in the panel performances with
respect to the type of reference scale
The effects of the reference scale type on panel performance were
examined in terms of four aspects: (a) use of scale, (b) agreement, (c)
repeatability, and (d) discriminability (Næs, Brockhoff, & Tomic, 2010).
3.2.1 | Use of scale
There were significant effects of “panel” on flavor attributes in both
types of reference scale, indicating that individual panelists used the
scoring scale differently; such individual variations among panelists
with respect to the use of scale have been commonly encountered in
the results of other descriptive analyses (Chambers & Smith, 1993;
Luckett et al., 2014; Martin, Molimard, Spinnler, & Schlich, 2000;
Samant et al., 2016). As shown in Table 2, the number of flavor attrib-
utes that showed a significant effect with respect to “panel” was
smaller for the RAS condition (4 out of 7) than for the UAS condition
(6 out of 7), meaning that individual variations in use of scale would be
more serious when using the UAS than the RAS.
3.2.2 | Agreement
The Tucker-1 correlation loading plots (Figure 1) illustrate variations
with respect to panel agreements on ratings of individual flavor attrib-
utes using the UAS. In the Tucker-1 correlation loading plots, the inner
and outer ellipses correspond to 50% and 100% variations. As shown
in Figure 1, with respect to grainy (b), nutty (d), and floral (g) flavor
attributes, all seven panelists were clustered closely together at the
outer ellipse, indicating that the panelists show a high level of agree-
ment with respect to those attributes. However, disagreements among
panelists were also observed with respect to other flavor attributes.
FIGURE 1 (a–g) Tucker-1 correlation loading plots of seven flavor attributes for eight cooked-rice samples that seven panelists evaluatedusing the universal aromatic scale. Inner and outer ellipses correspond to 50% and 100% variations. Small dots in each plot represent indi-vidual ratings for cooked rice samples with respect to each attribute. Brown and red squares represent a significant effect of rice sample onthe flavor attribute at p< .05 and p< .001, respectively; gray squares represent no significance at p< .05
6 of 11 | JARMA ARROYO AND SEO

More specifically, for starch, metallic, and burlap flavor attributes,
“Panel_2” was located far from the other panelists on the correlation-
loading plot, indicating disagreement between Panel_2 and the others
in terms of attribute evaluation (Næs et al., 2010). In addition, for card-
board and metallic flavor attributes, individual panelists were more
widely distributed along the inner and outer ellipses, and “Panel_3”
and/or “Panel_5” especially lay at the inner ellipse, representing that
not all panelists agreed in terms of the extent to which they rated the
intensities of those attributes.
Overall, the RAS showed better performance with respect to panel
agreement for individual flavor attributes than did the UAS. More spe-
cifically, all panelists, except for “Panel_3” for cardboard flavor, were
clustered closely together at the outer ellipses on the Tucker-1 correla-
tion loading plots describing flavor attributes rated using the RAS
(Figure 2). Such great performances on panel agreement might be
highly related to the significant effects of “sample” on all flavor attrib-
utes rated using the RAS (Table 2).
3.2.3 | Repeatability
As shown in Table 2, there were no significant effects of “repetition”
on the flavor attribute intensities of the eight cooked-rice samples eval-
uated using either the UAS or the RAS. There were also no significant
interactions between “sample” and “repetition” with respect to all fla-
vor attributes, except for the grainy flavor attribute rated using the
RAS (p5 .002), in either the UAS or the RAS condition. In other words,
panelists rated intensities of flavor attributes of the eight cooked-rice
samples in a similar manner across the three repeated test-sessions,
regardless of the type of reference scale used in the descriptive sen-
sory analysis.
Table 4 shows the MSE values of seven panelists with respect to
individual flavor attributes evaluated using either the UAS or the RAS.
Since the MSE value represents how well a panelist can repeat her/
himself, it has been used as a measure of her/his repeatability in the
descriptive sensory analysis (Lea, Rødbotten, & Næs, 1995; Tomic
et al., 2010). If a particular panelist almost perfectly repeated her/
FIGURE 2 (a–g) Tucker-1 correlation loading plots of seven flavor attributes for eight cooked-rice samples that seven panelists evaluated usingthe rice aromatic scale. Inner and outer ellipses explain 50% and 100% variations. Small dots in each plot represent individual ratings for cookedrice samples with respect to each attribute. Red squares represent a significant effect of rice sample on the flavor attribute at p< .001
JARMA ARROYO AND SEO | 7 of 11

himself when evaluating samples, the MSE value would be close to 0
(Tomic et al., 2010). Even though several panelists exhibited MSE val-
ues greater than 1.0 for nutty (“Panel_2”), metallic (“Panel_2”), and floral
(“Panel_6” and “Panel_7”) flavor attributes, they produced lower MSE
values with the UAS than with the RAS, possibly due to their using a
limited range of the scoring scale when they evaluated cooked rice
samples with the UAS (Champagne, 2008).
3.2.4 | Discriminability
The F values and their corresponding p values computed by ANOVAs
are considered as a measure of discrimination performance of individ-
ual panelists (Næs et al., 2010). In general, when a panelist shows a
high F value with a lower p value at a 5% level of significance in the
result of the ANOVA for a certain sensory attribute, she/he is consid-
ered to have the ability to discriminate among the presented samples
with respect to that attribute (Tomic et al., 2010). Under this assump-
tion, panelists showed better performances in discriminating among
cooked rice samples with respect to individual sensory attributes when
they used the RAS rather than the UAS. More specifically, as shown in
Table 5, while only two panelists (“Panel_1” and “Panel_7”) could differ-
entiate among cooked rice samples with respect to all seven attributes
when they evaluated with the UAS, four panelists could differentiate
among them with the RAS (Table 5). Notably, “Panel_3” and “Panel_4,”
who showed poor performances under the UAS condition (43% and
57%, respectively), improved their performances under the RAS condi-
tion (86% for both). Panelists’ better performances with the RAS might
result from using the entire spectrum of the scoring scale under the
RAS condition.
3.3 | Variations in the pattern of clustering eight
cooked-rice samples with respect to the type of
reference scale
Even though the two types of reference scale exhibited variations with
respect to the effects of rice sample on the intensities of individual fla-
vor attributes (Tables 2 and 3), they showed no remarkable differences
in the pattern of clustering eight cooked-rice samples based on inten-
sity ratings of flavor attributes (Figures 3 and 4). More specifically, in
Figure 3, representing the dendrogram drawn by the AHC of the eight
cooked-rice samples evaluated using either the UAS (a) or the RAS (b),
samples were grouped into the three clusters, i.e., Cluster 1 (BRO_G
and BRO_H), Cluster 2 (JAS_F), and Cluster 3 (MED_A, MED_B,
LONG_C, LONG_D, and JAS_E) under both the UAS and the RAS con-
ditions. As shown in Figure 3, the Euclidean distances between the
class central objects were found to be smaller when cooked rice
TABLE 4 Mean square error (MSE) values of seven panelists forindividual flavor attributes evaluated using either the universal aro-matic scale or the rice aromatic scale
Starchy Grainy Cardboard Nutty Metallic Burlap Floral
Universal Aromatic Scale
Panel_1 0.05 0.00 0.03 0.00 0.02 0.02 0.01Panel_2 0.09 0.36 0.02 4.21 1.29 0.22 0.02Panel_3 0.31 0.10 0.04 0.55 0.23 0.09 0.10Panel_4 0.49 0.17 0.09 0.56 0.15 0.42 0.62Panel_5 0.12 0.09 0.08 0.08 0.00 0.24 0.19Panel_6 0.22 0.28 0.05 0.01 0.16 0.53 1.62Panel_7 0.22 0.16 0.05 0.07 0.70 0.33 1.45
Rice Aromatic Scale
Panel_1 1.88 0.64 2.05 0.48 3.44 6.57 1.17Panel_2 0.34 0.30 2.00 0.15 0.27 0.19 1.42Panel_3 1.26 0.28 0.44 0.02 2.41 0.21 0.53Panel_4 2.03 0.60 0.72 6.58 1.88 1.69 1.89Panel_5 1.97 0.53 1.42 0.59 0.85 0.47 1.59Panel_6 2.21 3.07 0.52 0.01 1.41 0.61 1.12Panel_7 4.08 0.34 0.32 2.07 0.18 1.81 0.73
TABLE 5 Discrimination performances of the seven panelists for individual flavor attributes evaluated using either the universal aromaticscale or the rice aromatic scale
Starchy Grainy Cardboard Nutty Metallic Burlap Floral Discrimination power (%)
Universal Aromatic Scale
Panel_1 5.28**a 204.44*** 7.35*** 4,768.45*** 4.63** 4.46** 758.99*** 100%Panel_2 6.78** 33.08*** 180.61*** 6.44** 1.61 N.S. 12.96*** 399.38*** 86%Panel_3 1.73 N.S. 1.27 N.S. 0.93 N.S. 11.35*** 1.31 N.S. 15.12*** 73.37*** 43%Panel_4 3.68* 10.43*** 1.76 N.S. 6.09** 1.05 N.S. 2.21 N.S. 12.17*** 57%Panel_5 11.45*** 29.64*** 0.67 N.S. 104.61*** 0.00 N.S. 8.07*** 58.14*** 71%Panel_6 10.89*** 11.50*** 1.92 N.S. 906.10*** 1.56 N.S. 30.51*** 5.51** 71%Panel_7 11.48*** 8.74*** 23.80*** 128.61*** 7.60*** 6.36** 7.60*** 100%
Rice Aromatic Scale
Panel_1 14.30*** 39.92*** 2.37 N.S. 155.41*** 2.52 N.S. 4.08* 8.16*** 71%Panel_2 75.01*** 73.72*** 3.39* 564.20*** 46.25*** 181.55*** 11.30*** 100%Panel_3 7.70*** 2.83* 1.26 N.S. 3,591.20*** 4.10* 8.05*** 9.98*** 86%Panel_4 13.65*** 42.28*** 4.28* 3.10* 1.59 N.S. 2.85* 7.62*** 86%Panel_5 13.78*** 29.55*** 5.65** 88.22*** 9.44*** 51.36*** 6.25** 100%Panel_6 6.45** 3.37* 12.05*** 6,069.57*** 6.59** 48.31*** 7.91*** 100%Panel_7 6.50** 64.68*** 27.60*** 35.17*** 88.03*** 25.28*** 17.28*** 100%
Discrimination power (%) represents the percentage of flavor attributes significantly discriminated by each panelist.aF values computed by the analysis of variance of each panelist for individual flavor attributes; *, **, and ***: a significance at p< .05, p< .01, andp< .001, respectively; N.S.5no significance at p< .05.
8 of 11 | JARMA ARROYO AND SEO
samples were evaluated using the UAS rather than the RAS, possibly
due to panelist use of the limited range of the scoring scale when using
the UAS compared to that when using the RAS.
As shown in Figure 4, a similar pattern of clustering was also
observed on the bi-plots of the PCA for the eight cooked-rice samples
based on seven flavor attributes evaluated using either the UAS (a) or
the RAS (b). In both the UAS and the RAS conditions, the PC 1 (hori-
zontal axis) could separate the two brown-rice samples (BRO_G and
BRO_H) from the milled rice samples, and PC 2 (vertical axis) could dif-
ferentiate the milled jasmine-rice sample (JAS_F) from the others. In
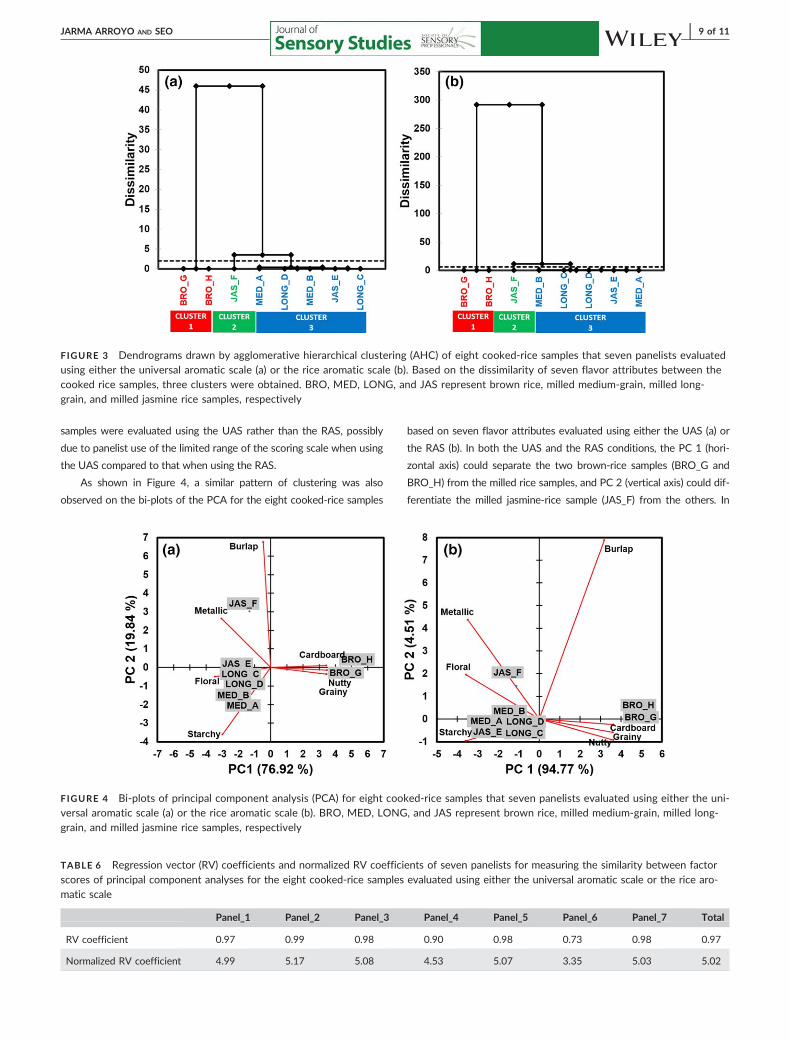
FIGURE 3 Dendrograms drawn by agglomerative hierarchical clustering (AHC) of eight cooked-rice samples that seven panelists evaluatedusing either the universal aromatic scale (a) or the rice aromatic scale (b). Based on the dissimilarity of seven flavor attributes between thecooked rice samples, three clusters were obtained. BRO, MED, LONG, and JAS represent brown rice, milled medium-grain, milled long-grain, and milled jasmine rice samples, respectively
FIGURE 4 Bi-plots of principal component analysis (PCA) for eight cooked-rice samples that seven panelists evaluated using either the uni-versal aromatic scale (a) or the rice aromatic scale (b). BRO, MED, LONG, and JAS represent brown rice, milled medium-grain, milled long-grain, and milled jasmine rice samples, respectively
TABLE 6 Regression vector (RV) coefficients and normalized RV coefficients of seven panelists for measuring the similarity between factor
scores of principal component analyses for the eight cooked-rice samples evaluated using either the universal aromatic scale or the rice aro-matic scale
Panel_1 Panel_2 Panel_3 Panel_4 Panel_5 Panel_6 Panel_7 Total
RV coefficient 0.97 0.99 0.98 0.90 0.98 0.73 0.98 0.97
Normalized RV coefficient 4.99 5.17 5.08 4.53 5.07 3.35 5.03 5.02
JARMA ARROYO AND SEO | 9 of 11

particular, under the UAS condition 81.85% of variance for the JAS_F
sample, contributed mainly by burlap (69.05%), starch (19.82%), and
metallic (10.51%) flavor attributes was explained by PC 2. In addition,
using the RAS, 82.86% of variance for the JAS_F sample, that was
accounted for mainly by burlap (71.25%) and metallic (21.89%) flavor
attributes was explained by PC 2.
A measure of the similarity between the factor scores of PCA for
the eight cooked-rice samples evaluated using either the UAS or the
RAS was represented by both RV and NRV coefficients (Table 6).
Almost all panelists produced RV coefficients closer to 1.0, indicating
that the two multidimensional spaces drawn by the UAS and the RAS
can be considered similar (Findlay et al., 2006; Schlich, 1996). More-
over, the NRV coefficients were greater than 2.0 for all panelists, rep-
resenting significant similarities between the two multidimensional
configurations produced by using either the UAS or the RAS (Findlay
et al., 2006; Schlich, 1996). Based on the results for both RV and NRV
coefficients, the pattern of clustering the eight cooked-rice samples
seems to be less affected by the type of reference scale.
4 | CONCLUSIONS
To summarize, this study demonstrated how the type of reference
scale used in the descriptive sensory analysis of cooked rice samples,
i.e., the UAS versus the RAS, affects not only intensity ratings of flavor
attributes, but also panel performance. While both types of reference
scale could differentiate rice samples with respect to individual flavor
attributes, the RAS was likely to be more sensitive to attributes such as
cardboard and metallic flavors. Since panelists could use a wider scor-
ing scale spectrum when using the RAS rather than the UAS, the panel-
ists showed better agreement for the RAS in scoring the intensities of
rice samples. However, both types of reference scale showed superior
performance not only in producing consistent scores for attribute
intensities across three repetitions, but also in clustering cooked rice
samples based on attribute intensities. In conclusion, while either type
of reference scale can be effective in providing a quantitative frame of
reference in descriptive sensory analysis of cooked rice samples, the
RAS can perform better in detecting and scoring subtle sample differ-
ences in flavor attribute intensities than the UAS.
ACKNOWLEDGMENTS
This study was based upon work that is supported, in part, by the
National Institute of Food and Agriculture Hatch Act funding, U.S.
Department of Agriculture (#229718).
CONFLICT OF INTEREST
The authors declare that they have no conflict of interest.
REFERENCES
Bett-Garber, K. L., Lea, J. M., Champagne, E. T., & McClung, A. M.
(2012). Whole-grain rice flavor associated with assorted bran colors.
Journal of Sensory Studies, 27, 78–86.
Billiris, M. A., Siebenmorgen, T. J., Meullenet, J.-F., & Mauromoustakos,
A. (2012). Rice degree of milling effects on hydration, texture, sen-
sory and energy characteristics. Part 1. Cooking using excess water.
Journal of Food Engineering, 113, 559–568.
Chambers, E., IV, & Smith, E. A. (1993). Effects of testing experience on
performance of trained sensory panelists. Journal of Sensory Studies,
8, 155–166.
Champagne, E. T. (2008). Rice aroma and flavor: A literature review.
Cereal Chemistry, 85, 445–454.
Champagne, E. T., Bett, K. L., Vinyard, B. T., Webb, B. D., McClung, A.
M., Barton, F. E., II, . . . Kohlwey, D. (1997). Effects of drying condi-
tions, final moisture content, and degree of milling on rice flavor.
Cereal Chemistry, 74, 566–570.
Champagne, E. T., Bett-Garber, K. L., Thompson, J., Mutters, R., Grimm,
C. C., & McClung, A. M. (2005). Effects of drain and harvest dates on
rice sensor and physicochemical properties. Cereal Chemistry, 82,
369–374.
Champagne, E. T., Thompson, J. F., Bett-Garber, K. L., Mutters, R., Miller,
J. A., & Tan, E. (2004). Impact of storage of freshly harvested paddy
rice on milled white rice flavor. Cereal Chemistry, 81, 444–449.
Cho, S., Yoon, S. H., Min, J., Lee, S., Tokar, T., Lee, S.-O., & Seo, H. S.
(2014). Sensory characteristics of Seolgitteok (Korean rice cake) in
relation to the added levels of brown rice flour and sugar. Journal of
Sensory Studies, 29, 371–383.
Findlay, C. J., Castura, J. C., Schlich, P., & Lesschaeve, I. (2006). Use of
feedback calibration to reduce the training time for wine panels.
Food Quality and Preference, 17, 266–276.
Lawless, H. T., & Heymann, H. (2010). Sensory evaluation of food – Princi-
ples and practices (2nd ed., Chapter 10, pp. 227–257). New York, NY:
Springer.
Lea, P., Rødbotten, M., & Næs, T. (1995). Measuring validity in sensory
analysis. Food Quality and Preference, 6, 321–326.
Limpawattana, M., & Shewfelt, R. L. (2010). Flavor lexicon for sensory
descriptive profiling of different rice types. Journal of Food Science,
75, S199–S205.
Lovely, C., & Meullenet, J.-F. (2009). Comparison of preference mapping
techniques for the optimization of strawberry yogurt. Journal of Sen-
sory Studies, 24, 457–478.
Luckett, C. R., Kuttappan, V. A., Johnson, L. G., Owens, C. M., & Seo, H.
S. (2014). Comparison of three instrumental methods for predicting
sensory texture attributes of poultry deli meat. Journal of Sensory
Studies, 29, 171–181.
Martin, N., Molimard, P., Spinnler, H. E., & Schlich, P. (2000). Comparison
of odour sensory profiles performed by two independent trained
panels following the same descriptive analysis procedures. Food Qual-
ity and Preference, 11, 487–495.
Meilgaard, M. C., Civille, G. V., & Carr, B. T. (2015). Sensory evaluation
techniques (5th ed., Chapter 5, pp. 51–70, Chapter 11, pp. 201–222,Chapter 12, pp. 223–306). Boca Raton, FL: CRC Press LLC.
Meullenet, J.-F. C., Marks, B. P., Griffin, K., & Daniels, M. J. (1999).
Effects of rough rice drying and storage conditions on sensory pro-
files of cooked rice. Cereal Chemistry, 76, 483–486.
Mu~noz, A. M., & Civille, G. V. (1998). Universal, product and attribute
specific scaling and the development of common lexicons in descrip-
tive analysis. Journal of Sensory Studies, 13, 57–75.
Murray, J. M., Delahunty, C. M., & Baxter, I. A. (2001). Descriptive sen-
sory analysis: Past, present and future. Food Research International,
34, 461–471.
Næs, T., Brockhoff, P. B., & Tomic, O. (2010). Statistics for sensory and
consumer science (Chapter 2, pp. 5–38). West Sussex, UK: Wiley.
10 of 11 | JARMA ARROYO AND SEO
Park, J. K., Kim, S. S., & Kim, K. O. (2001). Effect of milling ratio on sen-
sory properties of cooked rice and on physicochemical properties of
milled and cooked rice. Cereal Chemistry, 78, 151–156.
Roberts, R. L. (1979). Composition and taste evaluation of rice milled to
different degrees. Journal of Food Science, 44, 127–129.
Rodríguez-Arzuaga, M., Cho, S., Billiris, M. A., Siebenmorgen, T., & Seo,
H. S. (2016). Impacts of degree of milling on the appearance and
aroma characteristics of raw rice. Journal of the Science of Food and
Agriculture, 96, 3017–3022.
Samant, S. S., Crandall, P. G., O’Bryan, C. A., Lingbeck, J. D., Martin, E.
M., Tokar, T., & Seo, H. S. (2016). Effects of smoking and marination
on the sensory characteristics of cold-cut chicken breast filets: A
pilot study. Food Science and Biotechnology, 25, 1619–1625.
Schlich, P. (1996). Defining and validating assessor compromises about
product distances and attribute correlations (Chapter 9). In T. Næs &
E. Risvik (Eds.), Multivariate analysis of data in sensory science (pp.
259–306). New York, NY: Elsevier Science.
Suwansri, S., Meullenet, J. F., Hankins, J. A., & Griffin, K. (2001). Prefer-
ence mapping of domestic/imported jasmine rice for U.S.-Asian con-
sumers. Journal of Food Science, 67, 2420–2431.
Tomic, O., Luciano, G., Nilsen, A., Hyldig, G., Lorensen, K., & Næs, T.
(2010). Analysing sensory panel performance in a proficiency test
using the PanelCheck software. European Food Research and Technol-
ogy, 230, 497–511.
Tucker, L. R. (1966). Some mathematical notes on three-mode factor
analysis. Psychometrika, 31, 279–311.
Yau, N. J. N., & Huang, J. J. (1996). Sensory analysis of cooked rice. Food
Quality and Preference, 7, 263–270.
Yau, N. J. N., & Liu, T. T. (1998). Instrumental and sensory analysis of
volatile aroma of cooked rice. Journal of Sensory Studies, 14, 209–233.
How to cite this article: Jarma Arroyo SE, Seo H-S. Effects of
the type of reference scale on descriptive sensory analysis of
cooked rice: Universal aromatic scale versus rice aromatic scale.
J Sens Stud. 2017;32:e12295. https://doi.org/10.1111/joss.
12295
JARMA ARROYO AND SEO | 11 of 11