Effects of Texture on Mechanical Properties of Aluminum...
6
Effects of Texture on Mechanical Properties of Aluminum Alloy Sheets and Texture Optimization Strategy Mitsutoshi Kuroda Department of Mechanical Engineering, Yamagata University, Yonezawa, Yamagata 992-8510, Japan Abstract. It is known that the crystallographic texture affects very much the mechanical properties of sheet metals. In this paper, rolled aluminum alloy sheets are considered as target materials. Typical texture components usually observed in rolled aluminum alloy sheets are the deformation textures of Cu, Brass and S, and the recrystallization textures of Cube and Goss. First, the effects of these components on mechanical properties, such as variations of Lankford’s r-value for different tensile directions and forming limit strains, are investigated using full crystal plasticity analyses. In general, the most appropriate volume fractions of the texture components for a user-defined particular requirement, e.g. the smallest possible in-plane anisotropy, or the largest possible formability for a particular strain path, are unknown. Then, a texture optimization strategy is considered, i.e. a genetic algorithm is adopted to solve texture optimization problems. We describe a genetic algorithm with real-valued genes, which is called the real-coded GA. This algorithm is used to search for optimum textures that satisfy the requirements of smallest possible in-plane anisotropy and largest possible formability in biaxial stretch, as examples, to verify the efficiency of the method. INTRODUCTION It has been recognized that, in general, mechanical properties of metal sheets, such as plastic anisotropy and formability, can be improved by a proper crystallographic texture control. The texture has great influence on the plastic anisotropy of the final recrystallized sheets, such as the thickness reduction character that is usually represented by Lankford’s r-value. Furthermore, the texture significantly affects the formability that usually is evaluated in terms of forming limit diagrams. In rolled metal sheets, crystallographic textures are classified into deformation (rolling) textures and recrystallization textures [1]. Grains in these textures exhibit certain preferred orientations resulting from their rotations during the fabrication process. In aluminum alloys, the texture develops around the Cu, Brass and S orientations during the rolling process, and around the Cube and Goss orientations during annealing process [2]. Effects of these texture components on mechanical properties have been investigated [2, 3, 4, 5] to some extent. However, procedures to search for the ‘best’ texture for a user-defined particular design requirement have not yet been studied adequately. Since the correlation between the texture (grain orientation distribution) and the mechanical properties is not so simple in general, it is not easy to find an exact solution. In this paper, first, effects of texture on mechanical properties (i.e., anisotropy and formability) are investigated using crystal plasticity analysis. Next, a genetic algorithm (GA) is proposed to solve texture optimization problems. This algorithm is applied to search for optimum textures for the smallest possible in-plane anisotropy and for the largest possible formability [6]. MODELING OF TEXTURES In the case of aluminum alloys, the typical rolling texture components are Cu ({112} < 11 1 > ), Brass ({110} < 1 12 > ) and S ({123} < 63 4 > ) [2, 8]. The recrystallization texture components that frequently develop during annealing are Cube ({100}<001>) and Goss ({110}<001>) [2]. In actual materials, some spreading of grain orientations around the above particular crystallographic orientations is observed. A complete texture of aluminum alloy sheet can be modeled approximately by blending different volume fractions of these texture components with spreading of grain orientations. The detailed procedure to model the texture components with spreading of grain orientations is described as follows. The rotation about an axis n (a unit vector) with an angle is generally expressed [3] as R = n n + (I n n) cos + (I n) sin , (1) where I is the second-order unity tensor, and and denote tensor and outer products, respectively. In the present texture analysis, the misorientation from the aforementioned ideal orientations is represented by the rotation tensor R. Here, is defined as the misorientation angle, which follows a Gaussian distribution [2] with the mean value equal to zero and the standard deviation 0 . It is known that typical 445
Transcript of Effects of Texture on Mechanical Properties of Aluminum...

Effects of Texture on Mechanical Properties of Aluminum Alloy Sheets and Texture Optimization Strategy
Mitsutoshi Kuroda
Department of Mechanical Engineering, Yamagata University, Yonezawa, Yamagata 992-8510, Japan
Abstract. It is known that the crystallographic texture affects very much the mechanical properties of sheet metals. In this paper, rolled aluminum alloy sheets are considered as target materials. Typical texture components usually observed in rolled aluminum alloy sheets are the deformation textures of Cu, Brass and S, and the recrystallization textures of Cube and Goss. First, the effects of these components on mechanical properties, such as variations of Lankford’s r-value for different tensile directions and forming limit strains, are investigated using full crystal plasticity analyses. In general, the most appropriate volume fractions of the texture components for a user-defined particular requirement, e.g. the smallest possible in-plane anisotropy, or the largest possible formability for a particular strain path, are unknown. Then, a texture optimization strategy is considered, i.e. a genetic algorithm is adopted to solve texture optimization problems. We describe a genetic algorithm with real-valued genes, which is called the real-coded GA. This algorithm is used to search for optimum textures that satisfy the requirements of smallest possible in-plane anisotropy and largest possible formability in biaxial stretch, as examples, to verify the efficiency of the method.
INTRODUCTION It has been recognized that, in general, mechanical properties of metal sheets, such as plastic anisotropy and formability, can be improved by a proper crystallographic texture control. The texture has great influence on the plastic anisotropy of the final recrystallized sheets, such as the thickness reduction character that is usually represented by Lankford’s r-value. Furthermore, the texture significantly affects the formability that usually is evaluated in terms of forming limit diagrams. In rolled metal sheets, crystallographic textures are classified into deformation (rolling) textures and recrystallization textures [1]. Grains in these textures exhibit certain preferred orientations resulting from their rotations during the fabrication process. In aluminum alloys, the texture develops around the Cu, Brass and S orientations during the rolling process, and around the Cube and Goss orientations during annealing process [2]. Effects of these texture components on mechanical properties have been investigated [2, 3, 4, 5] to some extent. However, procedures to search for the ‘best’ texture for a user-defined particular design requirement have not yet been studied adequately. Since the correlation between the texture (grain orientation distribution) and the mechanical properties is not so simple in general, it is not easy to find an exact solution. In this paper, first, effects of texture on mechanical properties (i.e., anisotropy and formability) are investigated using crystal plasticity analysis. Next, a genetic algorithm (GA) is proposed to solve texture optimization problems. This algorithm is applied to
search for optimum textures for the smallest possible in-plane anisotropy and for the largest possible formability [6].
MODELING OF TEXTURES In the case of aluminum alloys, the typical rolling texture components are Cu ({112} < 111 > ), Brass ({110} < 112 > ) and S ({123} < 634 > ) [2, 8]. The recrystallization texture components that frequently develop during annealing are Cube ({100}<001>) and Goss ({110}<001>) [2]. In actual materials, some spreading of grain orientations around the above particular crystallographic orientations is observed. A complete texture of aluminum alloy sheet can be modeled approximately by blending different volume fractions of these texture components with spreading of grain orientations. The detailed procedure to model the texture components with spreading of grain orientations is described as follows. The rotation about an axis n (a unit vector) with an angle is generally expressed [3] as
R = n n + (I n n) cos + (I n)sin , (1)
where I is the second-order unity tensor, and and denote tensor and outer products, respectively. In
the present texture analysis, the misorientation from the aforementioned ideal orientations is represented by the rotation tensor R. Here, is defined as the misorientation angle, which follows a Gaussian distribution [2] with the mean value equal to zero and the standard deviation 0 . It is known that typical
445

values of 0 are in the range of 5˚–15˚. In the present computational procedure, at first a value of is taken according to the Gaussian distribution and an n , designated as n(1)
= (n1, n2 , n3 ) , is randomly chosen. The rolling direction (RD), transverse direction (TD), and normal direction (ND) are chosen to coincide the fixed Cartesian coordinates x1 , x2 and x3 , respectively. In order to reflect the orthotropic symmetry of rolled sheet, we consider all the four equivalent orientations of the particular component family {hkl}<uvw>. These four orientations can be represented in terms of Euler angles (Roe’s notation is used here): ( , , ), ( , , ), ( , + , ) and ( , , ), where / 2 and are, respectively, the latitude and the longitude of the [001] axis relative to the spatially fixed Cartesian coordinate system ( x1 , x2 , x3 ), and is the rotation angle of the [100] and [010] axes about the [001] angle. Then, the above mentioned four orientations are rotated, respectively, by n(1)
= (n1, n2 , n3 ) with + , n(2)
= ( n1, n2 , n3 ) with , n(3)= ( n1, n2 , n3 )
with + , and n(4 )= (n1, n2 , n3 ) with . The
procedure is repeated until the desired number of grains is obtained. Figure 1 shows the {111} pole figures for Cu, Brass, S, Cube and Goss components with 0 =10˚ and 1600 grains. The orthotropy is kept completely. In the present study, a texture of rolled aluminum alloy sheets is assumed to consist of the five texture components and some amount of randomly oriented grains. The volume fraction of every grain is taken to be identical.
CRYSTAL PLASTICITY ANALYSIS In order to evaluate mechanical properties of polycrystalline sheet aluminum alloys, crystal plasticity computations are employed. The crystal plasticity model used here is along the lines presented by Asaro and Needleman [7]. The slip rate is assumed to be given by the following viscoplastic power law:
( )= 0 sgn(
( ) )( )
g( )
1/m
, (2)
where
( ) is the slip rate of the th slip system, 0 is
a reference slip rate, ( ) is the resolved shear stress, g( )
is the current hardness, and m is a viscosity parameter. The evolution equation for g( ) is assumed to be
g( )= h ( ) . (3)
Here h is given by
h = h0
h0 a
0N+1
N 1
, a =( ) dt , (4)
where h0 is the initial slip hardening rate, N is a hardening exponent, t is the time, and 0 is the initial value of g( ) . As a model for polycrystals, an extended Taylor model [7] is adopted, in which the deformation in each grain is taken to be identical to the macroscopic deformation of the continuum. Taking the volume fraction of each grain to be identical, the macroscopic Cauchy stress, , is obtained from averaging the values over the total number of grains; i.e.
=1
Ng
(k )
k=1
Ng
, (5)
where (k ) is the Cauchy stress in kth grain (k =1, ...,
Ng; Ng represents the total number of grains).
TYPICAL EFFECTS OF TEXTURE
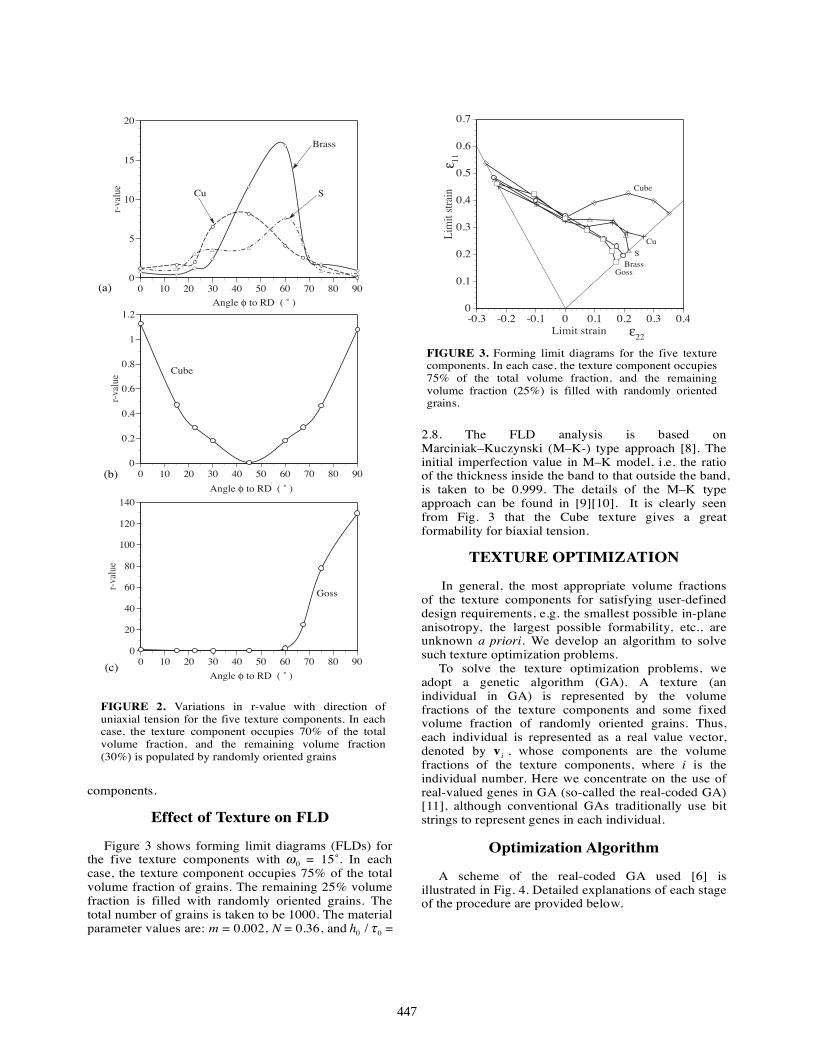
Effect of Texture on r-Value Figure 2 illustrates variations in Lankford’s r-value with the direction of uniaxial tension for the five texture components with 0 = 10˚ [6]. The r-value is defined by the ratio of width to thickness strain rates. Here, it is evaluated at 3% plastic strain. Computations (with the extended Taylor model) of uniaxial tensile test have been performed for = 0˚, 22.5˚, 45˚, 67.5˚ and 90˚, where represents the tensile direction relative to RD. In each case, the texture component occupies 70% of the total volume fraction of grains. The remaining 30% volume fraction is populated by randomly oriented grains. The total number of grains, Ng, is taken to be 1600 for the computations. The results shown in Fig. 2 are consistent with those reported in Barlat and Richmond [2]. The distributions of r-value are strongly nonuniform for all the texture
(a) (b) (c) (d) (e)
FIGURE 1. {111} pole figures for computationally generated textures with 1600 grains: (a) Cu component; (b) Brass component; (c) S component; (d) Cube component; (e) Goss component.
446
components.
Effect of Texture on FLD Figure 3 shows forming limit diagrams (FLDs) for the five texture components with 0 = 15˚. In each case, the texture component occupies 75% of the total volume fraction of grains. The remaining 25% volume fraction is filled with randomly oriented grains. The total number of grains is taken to be 1000. The material parameter values are: m = 0.002, N = 0.36, and h0 / 0 =
2.8. The FLD analysis is based on Marciniak–Kuczynski (M–K-) type approach [8]. The initial imperfection value in M–K model, i.e. the ratio of the thickness inside the band to that outside the band, is taken to be 0.999. The details of the M–K type approach can be found in [9][10]. It is clearly seen from Fig. 3 that the Cube texture gives a great formability for biaxial tension.
TEXTURE OPTIMIZATION In general, the most appropriate volume fractions of the texture components for satisfying user-defined design requirements, e.g. the smallest possible in-plane anisotropy, the largest possible formability, etc., are unknown a priori. We develop an algorithm to solve such texture optimization problems. To solve the texture optimization problems, we adopt a genetic algorithm (GA). A texture (an individual in GA) is represented by the volume fractions of the texture components and some fixed volume fraction of randomly oriented grains. Thus, each individual is represented as a real value vector, denoted by v i , whose components are the volume fractions of the texture components, where i is the individual number. Here we concentrate on the use of real-valued genes in GA (so-called the real-coded GA) [11], although conventional GAs traditionally use bit strings to represent genes in each individual.
Optimization Algorithm A scheme of the real-coded GA used [6] is illustrated in Fig. 4. Detailed explanations of each stage of the procedure are provided below.
0
5
10
15
20
0 10 20 30 40 50 60 70 80 90
r-va
lue
Angle φ to RD ( ˚ )
Cu
Brass
S
0
0.2
0.4
0.6
0.8
1
1.2
0 10 20 30 40 50 60 70 80 90
r-va
lue
Angle φ to RD ( ˚ )
Cube
Goss
0
20
40
60
80
100
120
140
0 10 20 30 40 50 60 70 80 90
r-va
lue
Angle φ to RD ( ˚ )
(a)
(b)
(c)
FIGURE 2. Variations in r-value with direction of uniaxial tension for the five texture components. In each case, the texture component occupies 70% of the total volume fraction, and the remaining volume fraction (30%) is populated by randomly oriented grains
FIGURE 3. Forming limit diagrams for the five texture components. In each case, the texture component occupies 75% of the total volume fraction, and the remaining volume fraction (25%) is filled with randomly oriented grains.
0
0.1
0.2
0.3
0.4
0.5
0.6
0.7
-0.3 -0.2 -0.1 0 0.1 0.2 0.3 0.4
Lim
it st
rain
Limit strain
ε 11
ε22
Goss
Cube
BrassS
Cu
447

Initial Population
In the initial population, the individuals are classified into two groups. In the first group, each individual has nonzero values of volume fractions of the five texture components, which are arbitrarily determined utilizing a randomizer in a computer language, and a certain constant volume fraction of randomly oriented grains. In the second group, each individual consists of one of the five texture components and the constant volume fraction of randomly oriented grains (e.g. if the constant volume fraction of randomly oriented grains is taken to be 30%, the remaining volume fraction, 70%, corresponds to one of Cu, Brass, S, Cube or Goss component). Thus, the second group includes only the five individuals. For a particular objective function, one of such textures may be the best solution. For all the individuals, the volume fraction of randomly oriented grains is fixed to a certain value as a restrictive condition. The optimum volume fractions of the five texture components under this condition will be searched by the real-coded GA computation.
Evaluation of Individuals
Probability of survival into the next generation is determined according to a fitness value. In the present application, the fitness value for a minimization
problem is calculated by
v i( ) = 1 f v i( ) / fmax , (6)
where f v i( ) (assumed to be positive) is the value of the objective function of the i-th individual, and fmax is the maximum value of f v i( ) at the current generation. Meanwhile, the fitness value for a maximization problem is simply given by
v i( ) = f v i( ) . (7)
Selection of Higher Fitness Individuals
A roulette selection is adopted to select individuals to survive into the next generation. The probability of survival is assumed to be commensurate with the fitness value, i.e.
p(v i ) = (v i ) (v j )j=1
n
, (8)
where p(v i ) is the probability of survival for i-th
individual and n is the number of the individuals. In addition, the elite preservation strategy is also used. The individual that has the highest fitness value is outright transferred into the next generation. This elite individual is neither subjected to crossover, nor to mutation.
Crossover
Two individuals, v and v , are randomly chosen as parents. Then, these two individuals are subjected to the following crossover,
v1(v ,v ) = (1 μ)v + μv ,
v2 (v ,v ) = μv + (1 μ)v , (9)
where v1 and v2 are newly generated offspring, and μ is a linear interpolation factor. This procedure is repeated Nc times, and finally 2 Nc of new offspring are totally generated. Two interpolation factors, μ1 and μ2 , which satisfy μ1 + μ2 = 1 , give exactly the same crossover. Considering this, the range of μ is set to be 0 μ 0.5 . Values of μ close to zero generates offspring similar to their parents, while those close to 0.5 produce offspring dissimilar to their parents. Within this range, the values of μ are generated utilizing a Gaussian distribution function with the mean value of zero and the standard deviation μ0 . Values of μ close to zero are more frequently generated than those close to 0.5. This means that offspring relatively similar to their parents are generated more frequently. This is consistent with the law of nature. So, it is considered that the present procedure includes an effect of the mutation, which generates offspring dissimilar to their parents according to some small probability. Therefore, we do not adopt any explicit mutation
FIGURE 4. Scheme of real-coded genetic algorithm.
448
procedure in the algorithm.
Terminal Condition
The computation is terminated when all the individuals have identical volume fractions of the texture components.
Examples
Minimization Problem: In-Plane Anisotropy
As a first example, we consider a minimization problem of in-plane anisotropy [6]. In this application, the degree of in-plane anisotropy is evaluated by the following f:
f =
(r0 r )2 + 2(r22.5 r )2 + 2(r45 r )2
+2(r67.5 r )2 + (r90 r )2
8 (10)
r =r0 + 2r22.5 + 2r45 + 2r67.5 + r90
8 (11)
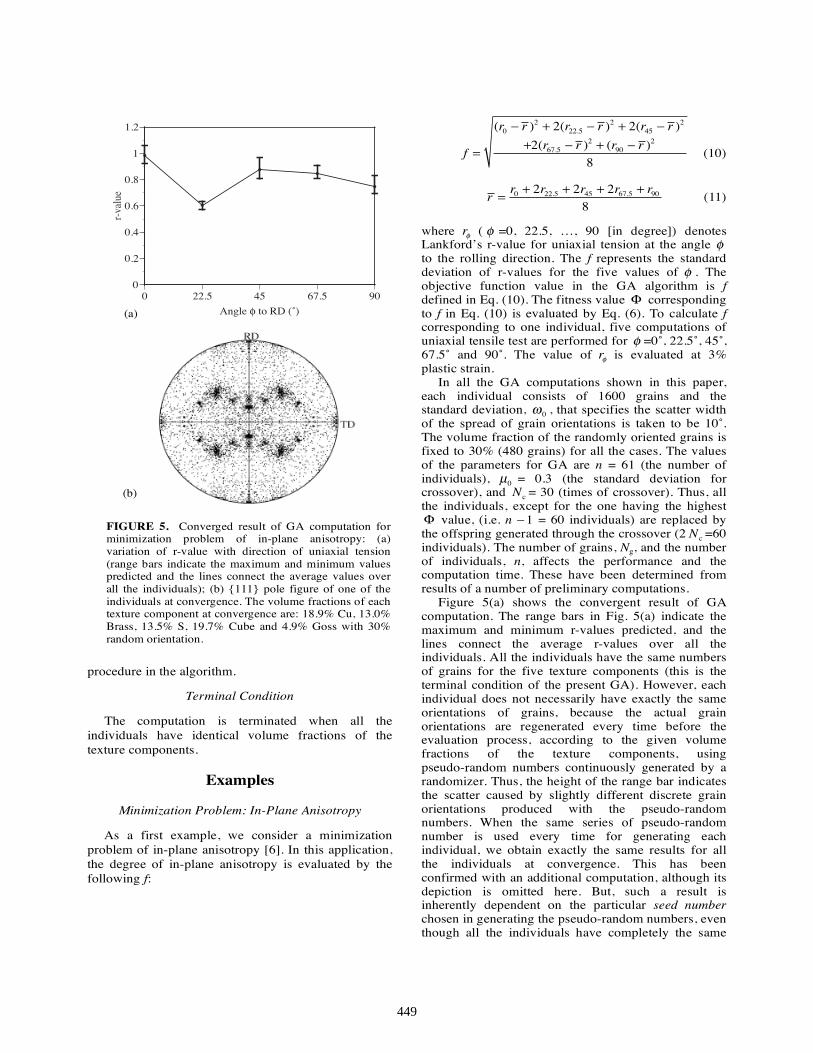
where r ( =0, 22.5, …, 90 [in degree]) denotes Lankford’s r-value for uniaxial tension at the angle to the rolling direction. The f represents the standard deviation of r-values for the five values of . The objective function value in the GA algorithm is f defined in Eq. (10). The fitness value corresponding to f in Eq. (10) is evaluated by Eq. (6). To calculate f corresponding to one individual, five computations of uniaxial tensile test are performed for =0˚, 22.5˚, 45˚, 67.5˚ and 90˚. The value of r is evaluated at 3% plastic strain. In all the GA computations shown in this paper, each individual consists of 1600 grains and the standard deviation, 0 , that specifies the scatter width of the spread of grain orientations is taken to be 10˚. The volume fraction of the randomly oriented grains is fixed to 30% (480 grains) for all the cases. The values of the parameters for GA are n = 61 (the number of individuals), μ0 = 0.3 (the standard deviation for crossover), and Nc = 30 (times of crossover). Thus, all the individuals, except for the one having the highest
value, (i.e. n 1 = 60 individuals) are replaced by the offspring generated through the crossover (2 Nc =60 individuals). The number of grains, Ng, and the number of individuals, n, affects the performance and the computation time. These have been determined from results of a number of preliminary computations. Figure 5(a) shows the convergent result of GA computation. The range bars in Fig. 5(a) indicate the maximum and minimum r-values predicted, and the lines connect the average r-values over all the individuals. All the individuals have the same numbers of grains for the five texture components (this is the terminal condition of the present GA). However, each individual does not necessarily have exactly the same orientations of grains, because the actual grain orientations are regenerated every time before the evaluation process, according to the given volume fractions of the texture components, using pseudo-random numbers continuously generated by a randomizer. Thus, the height of the range bar indicates the scatter caused by slightly different discrete grain orientations produced with the pseudo-random numbers. When the same series of pseudo-random number is used every time for generating each individual, we obtain exactly the same results for all the individuals at convergence. This has been confirmed with an additional computation, although its depiction is omitted here. But, such a result is inherently dependent on the particular seed number chosen in generating the pseudo-random numbers, even though all the individuals have completely the same
0 22.5 45 67.5 900
0.2
0.4
0.6
0.8
1
1.2r-
valu
e
Angle φ to RD (˚)
FIGURE 5. Converged result of GA computation for minimization problem of in-plane anisotropy: (a) variation of r-value with direction of uniaxial tension (range bars indicate the maximum and minimum values predicted and the lines connect the average values over all the individuals); (b) {111} pole figure of one of the individuals at convergence. The volume fractions of each texture component at convergence are: 18.9% Cu, 13.0% Brass, 13.5% S, 19.7% Cube and 4.9% Goss with 30% random orientation.
(a)
(b)
449
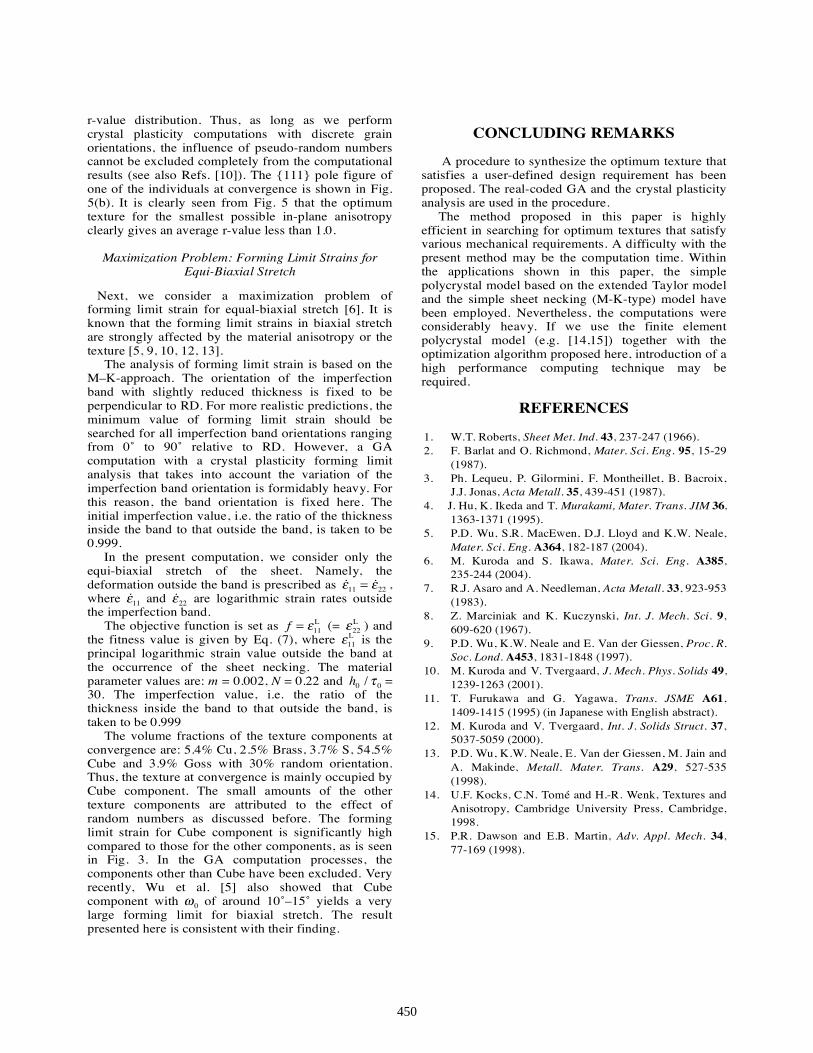
r-value distribution. Thus, as long as we perform crystal plasticity computations with discrete grain orientations, the influence of pseudo-random numbers cannot be excluded completely from the computational results (see also Refs. [10]). The {111} pole figure of one of the individuals at convergence is shown in Fig. 5(b). It is clearly seen from Fig. 5 that the optimum texture for the smallest possible in-plane anisotropy clearly gives an average r-value less than 1.0.
Maximization Problem: Forming Limit Strains for Equi-Biaxial Stretch
Next, we consider a maximization problem of forming limit strain for equal-biaxial stretch [6]. It is known that the forming limit strains in biaxial stretch are strongly affected by the material anisotropy or the texture [5, 9, 10, 12, 13]. The analysis of forming limit strain is based on the M–K-approach. The orientation of the imperfection band with slightly reduced thickness is fixed to be perpendicular to RD. For more realistic predictions, the minimum value of forming limit strain should be searched for all imperfection band orientations ranging from 0˚ to 90˚ relative to RD. However, a GA computation with a crystal plasticity forming limit analysis that takes into account the variation of the imperfection band orientation is formidably heavy. For this reason, the band orientation is fixed here. The initial imperfection value, i.e. the ratio of the thickness inside the band to that outside the band, is taken to be 0.999. In the present computation, we consider only the equi-biaxial stretch of the sheet. Namely, the deformation outside the band is prescribed as
11 = 22 , where
11 and 22 are logarithmic strain rates outside
the imperfection band. The objective function is set as f = 11
L (= 22L ) and
the fitness value is given by Eq. (7), where 11L is the
principal logarithmic strain value outside the band at the occurrence of the sheet necking. The material parameter values are: m = 0.002, N = 0.22 and h0 / 0 = 30. The imperfection value, i.e. the ratio of the thickness inside the band to that outside the band, is taken to be 0.999 The volume fractions of the texture components at convergence are: 5.4% Cu, 2.5% Brass, 3.7% S, 54.5% Cube and 3.9% Goss with 30% random orientation. Thus, the texture at convergence is mainly occupied by Cube component. The small amounts of the other texture components are attributed to the effect of random numbers as discussed before. The forming limit strain for Cube component is significantly high compared to those for the other components, as is seen in Fig. 3. In the GA computation processes, the components other than Cube have been excluded. Very recently, Wu et al. [5] also showed that Cube component with 0 of around 10˚–15˚ yields a very large forming limit for biaxial stretch. The result presented here is consistent with their finding.
CONCLUDING REMARKS
A procedure to synthesize the optimum texture that satisfies a user-defined design requirement has been proposed. The real-coded GA and the crystal plasticity analysis are used in the procedure. The method proposed in this paper is highly efficient in searching for optimum textures that satisfy various mechanical requirements. A difficulty with the present method may be the computation time. Within the applications shown in this paper, the simple polycrystal model based on the extended Taylor model and the simple sheet necking (M-K-type) model have been employed. Nevertheless, the computations were considerably heavy. If we use the finite element polycrystal model (e.g. [14,15]) together with the optimization algorithm proposed here, introduction of a high performance computing technique may be required.
REFERENCES 1. W.T. Roberts, Sheet Met. Ind. 43, 237-247 (1966). 2. F. Barlat and O. Richmond, Mater. Sci. Eng. 95, 15-29
(1987). 3. Ph. Lequeu, P. Gilormini, F. Montheillet, B. Bacroix,
J.J. Jonas, Acta Metall. 35, 439-451 (1987). 4. J. Hu, K. Ikeda and T. Murakami, Mater. Trans. JIM 36,
1363-1371 (1995). 5. P.D. Wu, S.R. MacEwen, D.J. Lloyd and K.W. Neale,
Mater. Sci. Eng. A364, 182-187 (2004). 6. M. Kuroda and S. Ikawa, Mater. Sci. Eng. A385,
235-244 (2004). 7. R.J. Asaro and A. Needleman, Acta Metall. 33, 923-953
(1983). 8. Z. Marciniak and K. Kuczynski, Int. J. Mech. Sci. 9,
609-620 (1967). 9. P.D. Wu, K.W. Neale and E. Van der Giessen, Proc. R.
Soc. Lond. A453, 1831-1848 (1997). 10. M. Kuroda and V. Tvergaard, J. Mech. Phys. Solids 49,
1239-1263 (2001). 11. T. Furukawa and G. Yagawa, Trans. JSME A61,
1409-1415 (1995) (in Japanese with English abstract). 12. M. Kuroda and V. Tvergaard, Int. J. Solids Struct. 37,
5037-5059 (2000). 13. P.D. Wu, K.W. Neale, E. Van der Giessen, M. Jain and
A. Makinde, Metall. Mater. Trans. A29, 527-535 (1998).
14. U.F. Kocks, C.N. Tomé and H.-R. Wenk, Textures and Anisotropy, Cambridge University Press, Cambridge, 1998.
15. P.R. Dawson and E.B. Martin, Adv. Appl. Mech. 34, 77-169 (1998).
450