Effects of Switching Frequency Modulation on Input Power ... · PDF fileInternational Journal...
18
International Journal of Power Electronics and Drive System (IJPEDS) Vol.8, No.2, June 2017, pp. 882~899 ISSN: 2088-8694, DOI: 10.11591/ijpeds.v8i2.pp882-899 882 Journal homepage: http://iaesjournal.com/online/index.php/IJPEDS Effects of Switching Frequency Modulation on Input Power Quality of Boost Power Factor Correction Converter Deniss Stepins*, Jin Huang** * Departement of Electronics and Telecommunications, Riga Technical University ** School of Electrical and Electronic Engineering, Huazhong University of Science and Technology Article Info ABSTRACT Article history: Received Feb 13, 2017 Revised Apr 30, 2017 Accepted May 15, 2017 Switching frequency modulation (SFM) as spread-spectrum technique has been used for electromagnetic interference reduction in switching power converters. In this paper, a switching-frequency-modulated boost power factor correction (PFC) converter operating in continuous conduction mode is analysed in detail in terms of its input power quality. Initially, the effect of SFM on the input current total harmonic distortion, power factor and low- frequency harmonics of the PFC converter are studied by using computer simulations. Some advices on choosing parameters of SFM are given. Then the theoretical results are verified experimentally. It is shown that, from a power quality point of view, SFM can be harmful (it can significantly worsen the power quality of the PFC converter) or almost harmless. The results depend on how properly the modulation parameters are selected. Keyword: Power factor correction Total harmonic distortion Frequency modulation Power quality Electromagnetic interference Copyright © 2017 Institute of Advanced Engineering and Science. All rights reserved. Corresponding Author: Deniss Stepins, Departement of Electronics and Telecommunications, Riga Technical University, 12 Azenes street, Riga, Latvia, Email: [email protected] 1. INTRODUCTION Nowadays, switched-mode power supplies (SMPS) are very popular for efficient electric power conversion in electronic equipment. A conventional AC-mains-connected SMPS usually has a full-wave diode rectifier with a large capacitive output filter. This results in significant AC line current (which in an ideal case should be sinusoidal) distortion and, consequently, noticeable degradation of the input power quality (PQ) of the SMPS [1], [2]. Poor power quality can lead not only to ineffective utilisation of the electrical grid but can also cause damage to electronic equipment [1] – [4]. The main parameters characterizing power quality are the power factor (PF) and total harmonic distortion (THD) of the input current [5]. PF, by definition, is the real power P real ratio to apparent power P app PF = P real /P app = P real /(V inrms ∙I inrms ), (1) where V inrms and I inrms are the input voltage and current RMS values, respectively. The PF is the function of phase angle φ between input voltage and current fundamental harmonics as well as the THD of the input current [5] ) cos( 2 1 THD PF . (2) As the THD of the SMPS input current increases, PF decreases, leading to degradation of input PQ. In an ideal case, input voltage is in phase with input current and is purely sinusoidal, so it has only one spectrum
Transcript of Effects of Switching Frequency Modulation on Input Power ... · PDF fileInternational Journal...
International Journal of Power Electronics and Drive System (IJPEDS)
Vol.8, No.2, June 2017, pp. 882~899
ISSN: 2088-8694, DOI: 10.11591/ijpeds.v8i2.pp882-899 882
Journal homepage: http://iaesjournal.com/online/index.php/IJPEDS
Effects of Switching Frequency Modulation on Input Power
Quality of Boost Power Factor Correction Converter
Deniss Stepins*, Jin Huang** * Departement of Electronics and Telecommunications, Riga Technical University
** School of Electrical and Electronic Engineering, Huazhong University of Science and Technology
Article Info ABSTRACT
Article history:
Received Feb 13, 2017
Revised Apr 30, 2017
Accepted May 15, 2017
Switching frequency modulation (SFM) as spread-spectrum technique has
been used for electromagnetic interference reduction in switching power
converters. In this paper, a switching-frequency-modulated boost power
factor correction (PFC) converter operating in continuous conduction mode
is analysed in detail in terms of its input power quality. Initially, the effect of
SFM on the input current total harmonic distortion, power factor and low-
frequency harmonics of the PFC converter are studied by using computer
simulations. Some advices on choosing parameters of SFM are given. Then
the theoretical results are verified experimentally. It is shown that, from a
power quality point of view, SFM can be harmful (it can significantly worsen
the power quality of the PFC converter) or almost harmless. The results
depend on how properly the modulation parameters are selected.
Keyword:
Power factor correction
Total harmonic distortion
Frequency modulation
Power quality
Electromagnetic interference Copyright © 2017 Institute of Advanced Engineering and Science.
All rights reserved.
Corresponding Author:
Deniss Stepins,
Departement of Electronics and Telecommunications,
Riga Technical University,
12 Azenes street, Riga, Latvia,
Email: [email protected]
1. INTRODUCTION
Nowadays, switched-mode power supplies (SMPS) are very popular for efficient electric power
conversion in electronic equipment. A conventional AC-mains-connected SMPS usually has a full-wave
diode rectifier with a large capacitive output filter. This results in significant AC line current (which in an
ideal case should be sinusoidal) distortion and, consequently, noticeable degradation of the input power
quality (PQ) of the SMPS [1], [2]. Poor power quality can lead not only to ineffective utilisation of the
electrical grid but can also cause damage to electronic equipment [1] – [4]. The main parameters
characterizing power quality are the power factor (PF) and total harmonic distortion (THD) of the input
current [5]. PF, by definition, is the real power Preal ratio to apparent power Papp
PF = Preal/Papp = Preal/(Vinrms∙Iinrms), (1)
where Vinrms and Iinrms are the input voltage and current RMS values, respectively. The PF is the function of
phase angle φ between input voltage and current fundamental harmonics as well as the THD of the input
current [5]
)cos(
21 THD
PF . (2)
As the THD of the SMPS input current increases, PF decreases, leading to degradation of input PQ. In
an ideal case, input voltage is in phase with input current and is purely sinusoidal, so it has only one spectrum

IJPEDS ISSN: 2088-8694 883
Effects of Switching Frequency Modulation on Input Power Quality of Boost PFC Converter (D. Stepins)
component at the mains frequency (fmains). In a real case, the input AC current is distorted and the harmonics
of fmains appear in its spectrum. By definition, the THD of the SMPS input current is as follows
THD2
2
1
2M
m
m
I
I, (3)
where Im is the amplitude of the input current m-th harmonic; I1 is the input current fundamental harmonic
amplitude (at fmains); M is an integer whose value depends on PQ international standards requirements. For
example, according to IEC 1000-3-2, the low-frequency harmonics should be measured up to M = 40. Thus,
if fmains = 50 Hz, then the PQ analyser measures harmonics up to fmax = 2 kHz.
It is interesting to note that international PQ standards are usually more concerned not with THD and
PF but with the low-frequency content of the input current. When performing compliance measurements in
order to meet standard requirements, SMPS input current harmonics must be lower than the maximally
permissible values set by the standard. For example, per IEC 1000-3-2 for class-D equipment, low-frequency
harmonics (the RMS values of odd harmonics) must be lower than 3.4 mA/W for the 3rd
harmonic, 1.9
mA/W for the 5th
harmonic, 1 mA/W for the 7th
harmonic, 0.5 mA/W for the 9th
harmonic, and 3.85/m mA/W
for 11 ≤ m ≤39 [6].
To reduce the THD of the SMPS input current and improve the PF, usually active power factor
correction (PFC) converters are used [7] – [10]. Although active PFC converters are very useful for
improving the PQ, the PFC converters are switched-mode in nature and are therefore major sources of
electromagnetic interference (EMI). Reduction of conducted EMI can be achieved by using EMI suppression
filters, snubbers, proper design of printed circuit boards, soft-switching techniques, interleaving, spread-
spectrum technique, etc. [10] – [15]. In fact, the spread-spectrum technique has become very popular
technique for SMPS EMI reduction in the scientific community owing to its good EMI reduction potential
along with easiness of implementation and adding little or no additional cost to SMPS [12], [14], [16] – [19].
Spreading the spectrum of SMPS voltages and currents and EMI noise reduction (Figure 1) can be achieved
by modulating one of the pulse-width-modulated (PWM) control signal parameters such as the pulse position
[20], duty ratio [21], or frequency [22].
Periodic switching frequency modulation (SFM) is often used in practical designs because it has some
important advantages over other spread-spectrum techniques [22] - [24]. Similarly to other EMI reduction
techniques, SFM also has some disadvantages: it can increase output voltage and input current ripples of
SMPS, as well as worsen the PQ of PFC converters and resonant inverters for induction heating appliances
[16], [19], [22] – [28].
Figure 1. Spectra of SMPS input current before and after the use of spread-spectrum technique
PFC converters can operate in either continuous conduction mode (CCM) or discontinuous conduction
mode (DCM). PFC converters are designed to operate in DCM for low-power applications, but in CCM for
mid- or high-power applications. A comrehensive study of the effect of SFM on the PQ of flyback PFC
converters operating in DCM was presented in [16]. An improved control method to reduce the THD of input
current and improve PF of DCM PFC converters with SFM was proposed in [16]. Despite the fact, that the
effect of SFM on PQ of PFC converters operating in DCM is examined very well, there are only few papers
[22], [23] considering the effect of SFM on the PQ of PFC converters operating in CCM. In [22], [23] some
experimental results are presented showing that the THD of input current of boost CCM PFC converter
increases owing to use of SFM. However, the study presented in the papers is purely experimentally based,
has some ambiguities and is not comprehensive, nor does it explain how the choice of SFM parameters
2 4 6 8 10 12 14
x 105
40
60
80
100
120
140
frequency
Without
spread
spectrum
With spread spectrum
Am
pli
tud
e
fsw 2fsw 3fsw 4fsw

IJPEDS ISSN: 2088-8694 884
IJPEDS Vol. 8, No. 2, June 2017 : 882 – 899
affects CCM boost PFC input current THD and low-frequency content. Moreover causes of worsening PQ
owing to use of SFM are not revealed in the papers. This paper focuses on this issue. The main new research
in this paper is an original analysis of the effect of SFM on boost PFC converter input current low-frequency
content, THD, and the power factor. This paper also includes detailed description of SIMULINK model,
thorough experimental verification of the simulation results and some advice on choosing SFM parameters.
This paper is organized as follows. In Section 2, operating principle of boost PFC converter is
presented. In Section 3, SIMULINK model of the boost PFC converter is explained in details. In Section 4, a
rigorous theoretical analysis of the effect of SFM parameters on input current low-frequency harmonics and
THD is presented. Causes of the increase in THD are revealed. Additionally, a summary of the analysis and
some practical advice for choosing effective SFM parameters are given at the end of Section 4. Section 5
presents a deep experimental study of the PQ of the SFM PFC converter and verifies the simulation results.
2. BOOST PFC CONVERTER OPERATING PRINCIPLE
Boost converter operating in CCM is very popular for power factor correction when power levels
exceed 300W [7], [8], [29]. There are two control methods of boost CCM PFC converters: peak current
control and average current control methods. The latter much more often used in practical PFC converters
because of higher immunity to noises [30]. Simplified schematic diagramm of the boost PFC converter with
average current control is shown in Figure 2. It consists of boost power stage and two control loops: input
current and output voltage control loops. In order to get high PF and low THD, averaged input current must
be in phase with input voltage and it must have the same shape as input voltage. Therefore, the main purpose
of the current controller is to compare PFC input current waveform with PFC input voltage waveform in
order for the averaged input current waveform to follow the input voltage waveform [30]. Input current
controller consits of current error amplifier with compensation network (R5, R6, C2, C3), multiplier and input
current sense resistor Rs. Current control loop has much wider bandwidth than voltage control loop. The
multiplier could be considered as programmable current source with output current proportional to the
divider output voltage and scaled rectified input voltage (voltage across resistor R2) [31]. The voltage across
the current sense resistor Rs (which is proportional to the PFC converter rectified input current) is subtracted
from the voltage across R4 (which is proportional to the multiplier output current and therefore, to the scaled
rectified input voltage) and then it is amplified with the current error amplifier. The pulse width modulator
(PWM) then creates rectangular control signal with variable duty cycle in order to shape the input current.
L
Cout
loa
d
+
-Divider
Vref
X/
X2
Squarer
RC filter
X
-
+
-
+
Current error
amplifier
Rs
PWM
Output voltage
controller
input
R7
R8
R3
C1
R4
R5
R6
C2
R1
R2
Voltage
error
amplifier
C3
boost power stage
Input current
controller
Figure 2. Simplified schematic diagramm of the boost PFC converter

IJPEDS ISSN: 2088-8694 885
Effects of Switching Frequency Modulation on Input Power Quality of Boost PFC Converter (D. Stepins)
Output voltage controller is neccessary in order to get regulated output voltage. It consists of voltage
error amplifier with compensation network (R3, R7, C1), squarer, divider, RC filter and reference voltage
source. Voltage control loop usually has much narrower bandwidth than current control loop, because
crossofer frequency of the loop must be much lower than twice mains frequency (fmains) in order for the input
current distortion to be low [31]. Usually crossover frequency of the voltage control loop is chosen to be
about 10 Hz [31]. Output voltage of the RC filter (which, in fact, is DC voltage with very small AC ripples)
is proportional to PFC converter input voltage amplitude Vinm. Squarer, divider, RC filter and multiplier are
necessary in order for the voltage control loop gain to be independent on PFC boost converter input voltage
amplitude.
3. DESCRIPTION OF BOOST PFC SIMULINK MODEL
For the analysis SIMULINK model of the boost PFC converter is created and explained. The model
(Figure 3) can be used for simulation of boost PFC converter with and without SFM. The model is partly
based on the schematic diagramm shown in Figure 2 with some simplifications. In order for simulation
results to be comparable with experimental results, values of power inductors’ inductance, output capacitor’s
capacitance as well as numerical values of coefficients of SIMULINK block transfer functions are calculated
based on 360W boost PFC converter desribed in [31].
In the model parasitic equivalent series resistances of output capacitor and power inductor are taken
into account. However the inductor is assumed to be linear. In order to take into account real power
MOSFET and its control circuit (including PWM) turn-on switching delays (tdon) and turn-off switching
delays (tdoff) (which in fact can have major influence on low-frequency content of switching-frequency
modulated dc/dc power converetrs voltages [16], [19], [32], [33]), turn-on and turn-off delay blocks
consisting of two “Transport Delay” blocks, logic operators AND and OR are added to the model (Figure 3).
Using that blocks we can independently enter tdon and tdoff values.
FM sawtooth signal generator
Continuous
load
Voltage Measurement1
v+-
Voltage Measurement
v+-
Universal Bridge
A
B
+
-
Transport
Delay1
Transport
Delay
Transfer Fcn1
1
0.33s+6.89
Transfer Fcn
63.36e-6s+1
32.6e-12 s +7.26e-6s2
Signal
Generator
Series RLC Branch1
Series RLC Branch
Relational
Operator
>=
Product
Logical
Operator1OR
Logical
OperatorAND
Integrator
1
s
Gain3
2*pi *30e3
Gain2
0.05
Gain1
2*pi*100e3
Gain
2.28e-3
Fcn
1.15+5*(acos(cos(u)))/pi
Diode
Data Type Conversion1doubleData Type Conversiondouble
Current Measurement1
i+ -
Constant5 1.28
Constant4
410
Constant
0.059
Clock
Abs1
|u|
AC Voltage
Source
Switch
g 12
0.5e-3 H
compensation circuit
compensation circuit
turn-on
delay block
tdon tdoff
turn-off
delay block
current controller
PWM
Figure 3. Boost PFC converter SIMULINK model. Note the model can be used with and without SFM

IJPEDS ISSN: 2088-8694 886
IJPEDS Vol. 8, No. 2, June 2017 : 882 – 899
RC filter, squarer and divider (shown in Figure 2) are substituted with block „Constant” in this
model in order to speed up the simulations. Actually, the block „Constant” numerical value of 0.059 is equal
to 1/(4.1)2, where 4.1 V is DC voltage at the output of RC filter. Current sense resistor Rs is modeled using
two SIMULINK blocks: „Current measurement 1” and „Gain 2”. Input current control open loop gain can be
described by formula [34]:
T(s)=Hs(s)HPWM(s)Hc(s)Hcic(s), (4)
where Hs(s) is the current sensor gain; HPWM(s) is the PWM gain; Hc(s) is the current loop compensation
circuit gain and Hcic(s) is the control-to-input current gain. For this model the transfer functions are:
Hs(s)=0.05; HPWM(s)=0.2; Hcic(s)=Vout/(sL)=0.8/s; Hc(s)=(63.36∙10-6
s+1)/(32.6·10-12
s2+7.26∙10
-6s) (5)
Based on (4) and (5) input current control open loop gain T(s) versus frequency is depicted in Figure 4.
101
102
103
104
105
-50
0
50
100
150
frequency (Hz)
T(s
) (d
B)
Figure 4. Input current control open loop gain of boost PFC converter model shown in Figure 3
Generator of frequency-modulated sawtooth signal is shown in Figure 5. It consists of modulating
signal m(t) (with unitary amplitude) generator, integrator, adder, amplifiers “Gain 1” and “Gain 3” and
function block “Fcn”. Output signal of “Gain 1” block is 2πfsw0t, but output signal of “Gain 3” block is
2πΔfswm(t). Where fsw0 is central switching frequency and Δfsw is switching frequency deviation. The output
voltage of FM sawtooth signal generator can be described by formula:
/)))(22(cos(acos515.1)(0
0mod
t
swsw dmftftv . (6)
Function “acos” is necessary in order to get sawtooth voltage from cosine. The most important waveforms of
FM sawtooth signal generator are shown in Figure 6.
Signal
Generator
Integrator
1
s
Gain 3
Gain1Fcn
1.15+5*(acos(cos(u)))/pi
Clock
vmod(t)
tf sw 02
02 swf
Modulation
m(t)
)(2 tmf sw
swf2
uto PWM
t
swsw dmftfu0
0 )(22
Figure 5. SIMULINK model of FM sawtooth signal generator

IJPEDS ISSN: 2088-8694 887
Effects of Switching Frequency Modulation on Input Power Quality of Boost PFC Converter (D. Stepins)
Figure 6. Simulated instantaneous switching frequency fsw(t) and output signal (vmod(t)) of FM sawtooth
signal generator. (Parameters: switching frequency deviation Δfsw=30kHz; modulation frequency fm=10kHz; central switching
frequency fsw0=100kHz)
4. THEORETICAL ANALYSIS OF INPUT CURRENT
This section presents a comprehensive theoretical analysis of the effects of SFM on boost PFC
converter input current low-frequency content and THD. For the analysis SIMULINK model (Fig.3) is used.
4.1. Without SFM
If SFM is not used, then the PFC converter input AC current iacin spectrum is made of fmains
harmonics with frequencies mfmains (where m = 1, 2, 3…) as well as high-frequency components with
frequencies nfsw0 ± kfmains (where n = 1, 2, 3…, k = 1, 2, 3). This is depicted in Figure 7(c).
4.2. With SFM
To study the effect of SFM on boost PFC converter input PQ, difference between the switch turn-on
and turn-off swiching delays (|Δtd|=|tdoff-tdon|) is taken into account. As it can be deduced from Figure 7(c) and
Figure 8(c), SFM, from one hand, has an advantage in terms of conducted EMI reduction, because high-
frequency side-bands with noticeably lower amplitudes than for unmodulated PFC converter appear around
fsw0 and its harmonics, but from other hand, it has disadvantage, because modulation frequency fm
subharmonics (with frequencies fm-(2y-1)·fmains, where y=1, 2, 3, ...) and interharmonics (with frequencies
fm+(2y-1)fmains and zfm±(2y-1)fmains, where z=2, 3, 4, ...) appear in iacin spectrum [Figure 8(c)]. First order
subharmonic A1,1 and interharmonic A1,2 are the highest and they are most responsible for the input current
iacin distortion. Obviously the subharmonics and interharmonics can significantly increase THD of PFC input
current and reduce PF. Moreover since PQ standards are more concerned with low-frequency content of
SMPS input current, these low-frequency components can exceed maximally permissible values set by the
PQ standards and as a result PFC converter under test will fail the harmonics test (of course, if frequencies of
these undesirable low-frequency components are below power analyzer maximum analysis frequency fmax,
e.g 2kHz). Effect of SFM on conducted EMI reduction (in terms of reduction of the amplitudes of the high-
frequency components) in boost PFC converter has been addressed in [5]. In this paper we will study the
effect of SFM on the THD of iacin and fm subharmonics and interharmonics in details.
As it is depicted in Figure 8(a), iacin becomes highly distorted in time domain. Filtered versions of
iacin show distinct low-frequency ripples with modulation frequency fm (Figure 8(b)). Amplitudes of the
subharmonics and interharmonics are approximately linearly dependant on Δfsw, as shown in Figure 9(b). As
Δfsw increases, the THD of iacin also increases (Figure 9(a)). Higher values of |Δtd| lead to higher THD of iacin
and the amplitudes of the fm subharmonics and interharmonics (they increase approximately linearly with
|Δtd|) as it is shown in Figure 10. The amplitudes of the undesirable componnets depend also on fm: as fm
increases the amplitudes also increase as it can be deduced from Figure 11. The THD and PF of iacin for
different fm are shown in Table 1. Note the THD of iacin in this table is calculated using (3) when M=40 (as it
is required by the international standards). As shown in Table 1, when fm=10 kHz negative effect of SFM on
the low-frequency content and the THD is completely neutralized (they are the same as in unmodulated
case). This is because frequencies of fm subharmonics are higher than 40fmains (so they are out of the scope of
the PQ analyzer, because M=40). However, if we calculate the THD using (3) when M=210 (Table 2), then
THD for fm=10 kHz is even worse than for lower fm. Important conclusion appears here: if we want to
neutralize the negative effect of SFM on the low-frequency content from normative point of view, then we
should choose fm sligthtly higher than 40fmains.
0 0.1 0.2
x 10
50
100
0 0.1 0.20
2
4
6
8
150
Time (ms)
Time (ms)
v mod(t
) (V
)f s
w(t
) (k
Hz)
swf
swf
mf/1
0swf

IJPEDS ISSN: 2088-8694 888
IJPEDS Vol. 8, No. 2, June 2017 : 882 – 899
(a) (b)
(c)
Figure 7. Simulated iacin of CCM boost PFC converter: (a) in time domain without SFM; (b) in time domain
without SFM (filtered); (c) in frequency domain without SFM. (Parameters: fmains = 50 Hz, Vinrms = 240 V, L=
500 μH, Vout = 400 V, Rout = 485 Ω, Pout=330W; |Δtd|=600 ns. Note: filtered version of iacin [in Fig. 7(b)] is obtained using
2nd-order low-frequency filter with cutoff frequency of 2 kHz)
101
102
103
104
105
0
0.5
1
1.5
2
0.26 0.26 0.2601 0.2601 0.26020
0.05
0.1
0.15
0.2
0.262 0.264 0.266 0.268
1
1.5
2
1/fm
0.26 0.27 0.28 0.29 0.3 0.31
-2
-1
0
1
2
0.26 0.27 0.28 0.29 0.3-3
-2
-1
0
1
2
Time (s)Time (s)
i aci
n(t
) (A
)
i aci
n(t
) (A
)
fmains fundamental
harmonic
fmains harmonicsA
mp
litude (
A)
Frequency (Hz)
High-frequency side-
bands owing to SFM
fmains
Operates
in DCM
1 03
0 . 0 2
0 . 0 4
0 . 0 6
0 . 0 8
fm interharmonics
and subharmonics
owing to SFM
fm-fm
ain
s
fm+
fma
ins
fm
subharmonics fm interharmonics
A1,1 A1,2
(a) (b)
(c)
Figure 8. Simulated iacin of SFM boost PFC converter: (a) in time domain; (b) in time domain (filtered); (c) in
frequency domain. (Modulation parameters: m(t) is sine, fm = 1 kHz, Δfsw = 30 kHz, fsw0 = 100 kHz. Other parameters the same as in
Figure 7).
0.25 0.26 0.27 0.28 0.29
-2
-1
0
1
2
Time (ms)Time (s)
i aci
n(t
) (A
)
0.26 0.27 0.28 0.29-2
-1
0
1
2
i aci
n(t
) (A
)
101
102
103
104
105
0
0.5
1
1.5
2
fmains fundamental
harmonic
fmains harmonics
Am
plit
ude,
A
frequency, Hz
High-frequency
components
fmains

IJPEDS ISSN: 2088-8694 889
Effects of Switching Frequency Modulation on Input Power Quality of Boost PFC Converter (D. Stepins)
0
2
4
6
8
10
0 5 10 15 20 25 30
Δfsw (kHz)
TH
D (
%)
fm=1 kHz
fm=1.8 kHz
0
20
40
60
80
100
120
0 5 10 15 20 25 30
Δfsw (kHz)
A1,1 (
mA
)
fm=1 kHz
fm=1.8 kHz
(a) (b)
Figure 9. Simulated THD of the PFC input current iacin and A1,1 versus Δfsw for different fm. (Modulation
parameters: m(t) is sine; other parameters of the PFC converter the same as in Fig.7). Note THD of iacin is obtained using (3) when M=40
0
2
4
6
8
10
0 100 200 300 400 500 600
TH
D (
%)
|Δtd| (ns)
0
20
40
60
80
100
120
140
0 100 200 300 400 500 600
|Δtd| (ns)
A1
,1 (
mA
)
(a) (b)
Figure 10. Simulated THD of the PFC input current iacin and A1,1 versus |Δtd|. (Modulation parameters: m(t) is sine;
fm=1.8kHz; Δfsw=30kHz; other parameters of the PFC converter the same as in Fig.7). Note THD of iacin is obtained using (3) when M=40
101
102
103
104
105
0
0.5
1
1.5
2
101
102
103
104
105
0
0.5
1
1.5
2
103.2
103.3
0
0.05
0.1
104
0
0.05
0.1
0.15
Am
plit
ude
(A
)
Am
plit
ude
(A
)
Frequency (Hz) Frequency (Hz)
fmains fundamental
harmonic
fmains fundamental
harmonic
fmains harmonics
fmains harmonics
fmains fmains
High-frequency
side-bands
High-frequency
side-bands
fm interharmonics and
subharmonics owing to SFM
fm interharmonics and
subharmonics owing to SFM
(a) (b)
Figure 11. Simulated spectra of iacin for different modulation frequencies: (a) fm=1.8 kHz; (b) fm=10 kHz.
(Modulation parameters: m(t) is sine; Δfsw=30kHz; other parameters of the PFC converter the same as in Figure 7).
Table 1. Simulated THD and PF versus fm (Δfsw = 30 kHz, fsw0 = 100 kHz, m(t) is sine) fm (kHz) THD (%) PF
0.25 5.6 0.997 0.5 7 0.996
1
1.5 1.8
2
10
8.1
9.1 9.9
8.3
4.8
0.995
0.995 0.995
0.995
0.997
The THD of iacin and amplitudes of the fm subharmonics and interharmonics caused by SFM depend
also on modulation waveform m(t) [Figure 12(c), Table 3 and Table 4]. Sawtooth m(t) is more beneficial than
sine because it gives a lower THD and amplitudes of the undesirable low-frequency components.

IJPEDS ISSN: 2088-8694 890
IJPEDS Vol. 8, No. 2, June 2017 : 882 – 899
Table 2. Simulated THD and A1,1 versus Δfsw (fm = 10 kHz, fsw0 = 100 kHz, m(t) is sine) Δfsw (kHz) THD* (%) THD** (%) A1,1 (mA)
0
10
4.8
4.8
4.9
6.4
3.7
53
20 4.7 9.8 108 30 4.7 13.9 165
* THD of iacin is calculated using (3) when M=40; ** THD of iacin is calculated using (3) when M=210.
(a) (b)
(c)
Figure 12. Simulated iacin of SFM boost PFC converter: (a) in time domain; (b) in time domain (filtered); (c)
in frequency domain. (Modulation parameters: m(t) is sawtooth, fm = 1.8 kHz, Δfsw = 30 kHz, fsw0 = 100 kHz. Other parameters the
same as in Figure 7).
Table 3. Simulated THD and A1,1 for different m(t) (fm = 1 kHz, Δfsw=30kHz, fsw0 = 100 kHz) m(t) THD (%) A1,1 (mA)
sine triangular
8.1 6.8
76.2 62
sawtooth 6.6 46
Table 4. Simulated THD and A1,1 for different m(t) (fm = 1.8 kHz, Δfsw=30kHz, fsw0 = 100 kHz) Δfsw (kHz) THD (%) A1,1 (mA)
sine
triangular
10.2
8.3
112.6
90
sawtooth 7.1 70.3
Many questions arise here:
1) What are the causes of the undesirable fm subharmonics and interharmonics? 2) Why does higher Δfsw give higher THD and amplitudes of fm subharmonics and interharmonics?
3) Why does THD and amplitudes of fm subharmonics and interharmonics depend on fm and m(t)?
4) Why does difference between the switch turn-on and turn-off delays (|Δtd|) have major influence
on the THD and the undesirable low-frequency content?
In order to answer these questions we will resort to some analytical expressions. However we are
not going to derive closed-form expressions to calculate amplitudes of fm subharmonics and interharmonics.
A detailed look at SFM PFC converter input current waveform [Figure 8(a)] reveals some important facts: for
0.28 0.29 0.3 0.31 0.32
-3
-2
-1
0
1
2
Time (s)
i aci
n(t
) (A
)
Time (s)
0.27 0.28 0.29 0.3 0.31 0.32 0.33
-2
-1
0
1
2
i aci
n(t
) (A
)
101
102
103
104
105
0
0.5
1
1.5
2
fmains fundamental
harmonic
fmains harmonics
Am
plit
ude
(A
)
Frequency (Hz)
High-frequency side-
bands owing to SFM
fmains
fm interharmonics
and subharmonics
owing to SFM
103.2
103.5
103.8
0
0.02
0.04
0.06
0.08

IJPEDS ISSN: 2088-8694 891
Effects of Switching Frequency Modulation on Input Power Quality of Boost PFC Converter (D. Stepins)
short part of the AC mains period the PFC converter operates in DCM but for main part of the AC mains
period it operates in CCM.
In DCM boost dc/dc converter averaged input current <iacin> depends on the switching frequency
(fsw) as follows [35]:
swinout
outinacin
fVVL
VVDi
)(2
2
. (7)
For boost PFC converters input AC voltage vin(t)=Vinmsin(2πfmainst). Duty cycle D changes in time as follows:
out
in
V
tvtd
|)(|1)( , (8)
where Vout is DC component of output voltage. Since the switching frequency of the boost PFC converter is
modulated, it changes in time according to:
)()( 0 tmfftf swswsw , (9)
where m(t) is modulation signal with unitary amplitude. Now (7) can be rewritten as follows:
))())(((2
)())((
0
2
tmfftvVL
Vtvtdi
swswinout
outinacin . (10)
From (10) important conclusion could be drawn: PFC averaged input current changes in time not only
because input voltage changes, but also because fsw changes. Since d(t) changes with 2fmains, vin changes with
fmains, but fsw varies with fm, then undesirable low-frequency spectrum components wih frequencies zfm±(2y-
1)fmains appear in the PFC input current spectrum. Moreover, since
, then amplitudes of the spectrum components are approximately proportional to Δfsw.
Second cause of the undesirable spectrum components in PFC converter iacin spectrum is owing to
non-zero difference between the switching delays |Δtd| when the PFC converter operates in CCM. It can be
proved that if the switching frequency is modulated, then:
)(|)(|
1)( tmtfV
tvtd dsw
out
in . (11)
Since d(t) varies not only with 2fmains but also with fm, and <iacin> in CCM is proportional to d(t) and |vin(t)|,
then <iacin> also changes with 2fmains and fm. Moreover low-frequency ripples with fm become amplitude-
modulated. As a result spectrum components with frequencies zfm±fmains appear in <iacin> spectrum and
interact with the spectrum components (at the same frequencies) owing to DCM operation of the PFC
converter. As a result amplitudes of the fm interharmonics and subharmonics become approximately
proportional to Δfsw.
The THD and undesirable spectrum components owing to SFM (mainly A1,1 and A1,2) depend on m(t)
because different m(t) have different amplitudes of fm fundamental harmonic. Sawtooth m(t) has lower
fundamental harmonic amplitude (2/π) than sine and triangular m(t), but sine has the highest amplitude of the
fundamental harmonic. This explains why sawtooth m(t) gives the lowest THD, A1,1 and A1,2.
Amplitudes of the fm interharmonics and subharmonics depend on fm, because the undesirable
spectrum components are all attenuated |1+T(s)| times, where s=j2πf. As it is depicted in Figure 13, the lower
fm is, the better attenuation is, and therefore, the lower amplitudes of the undesirable fm interharmonics and
suharmonics are. However for frequencies higher than 10 kHz there is almost no attenuation of the
undesirable spectrum components.
4.3 Summary of the theoretical analysis
An analysis of the effects of SFM parameters on the input PQ of the PFC converter reveals many
interesting facts. Let us summarise the most important facts:

IJPEDS ISSN: 2088-8694 892
IJPEDS Vol. 8, No. 2, June 2017 : 882 – 899
i. From normative point of view, the effect of SFM on input PQ of the PFC converter can be either
harmful or almost harmless. This depends on the value of fm:
a) If fm-fmains>Mfmains (where M is the harmonic number up to which the fmains harmonics should be
measured), then the SFM is harmless from the normative point of view. (Table 1 and Table 2 show
that if fm=10kHz, then the THD is almost the same as for PFC converter without SFM.)
b) If fm + fmains < Mfmains, then the SFM is harmful from the PQ point of view because the THD and the
amplitudes of fm interharmonics and subharmonics increase (Table 1 and Figure 9). In this case,
THD and the amplitudes of fm interharmonics and subharmonics increase approximately linearly as
Δfsw and |Δtd| increase.
ii. Practical advices:
a) In order to get low THD and the amplitudes of fm interharmonics and subharmonics, the power
MOSFET turn-on and turn-off switching delays should be as close as possible. So careful
attention should be paid on designing power MOSFET control circuit.
b) If fm is chosen to be lower than Mfmains, then Δfsw should be chosen so that fm interharmonics and
subharmonics amplitudes do not exceed the maximally permissible levels according to the PQ
standard. In order to estimate the correct value of Δfsw, proposed SIMULINK model can be used.
iii. The choice of modulation waveform m(t) is also very important. A sawtooth m(t) gives a lower
THD, A1,1 and A1,2 but a sine m(t) gives a higher THD, A1,1 and A1,2 (Table 3 and Table 4). It is
interesting to note that a sawtooth also exhibits better EMI reduction than the sine and triangular
m(t) [28]. This is why the sawtooth m(t) is the best choice from both points of view.
iv. If fm is chosen to be lower than Mfmains, then there is a trade-off between the EMI attenuation and
input PQ of the PFC converter because a higher Δfsw gives a higher EMI attenuation, but the THD
also increases. However, when fm is chosen to be slightly higher than Mfmains, then other SFM
parameters should be chosen only from the EMI attenuation point of view, because in this case
SFM does not worsen the PQ from normative point of view.
Figure 13. The boost PFC converter model (Figure 3) transfer function 1/(1+T(s)) magnitude versus
frequency
5. EXPERIMENTS
5.1 Experimental setup
In the experiments a 360W boost PFC converter demo board from STMicroelectronics™ is used
[31]. The PFC converter produced by the STMicroelectronics is based on PWM controller L4981A and it
does not have SFM. To perform the SFM, the modulating signal from a signal generator is fed into pin 17 of
the controller via RC circuit as described in [5]. To measure Δfsw a spectrum analyzer (Agilent E4402B) with
frequency demodulator and zero span capabilities is used. A picture and block diagramm of the experimental
setup are shown in Figure 14. For input PQ (THD, PF, and input current low-frequency content)
measurements, a low-distortion AC power source (TTI AC1000A) and power analyser (TTI HA1600A) are
used. For input AC voltage and current measurements in the time domain, a digital storage oscilloscope
(Agilent DSO3202A) connected to the waveform monitor outputs of a power analyser (TTI HA1600A) is
used.
101
102
103
104
105
-150
-100
-50
0
50
Frequency (Hz)
|1/(
1+
T(s
))| (d
B)

IJPEDS ISSN: 2088-8694 893
Effects of Switching Frequency Modulation on Input Power Quality of Boost PFC Converter (D. Stepins)
The nominal output power of the PFC is 330 W, the output DC voltage is 400 V, and the nominal
switching frequency is 100 kHz. The open-loop gain crossover frequency of the current control loop is
approximately 10 kHz. In order to compare experimental results with the simulated ones |Δtd|=|tdon-tdoff| was
measured using the oscilloscope (when drain current amplitude was 0.6 A). It was 500 ns approximately. tdoff
was measured between time instant at which both input voltages of PWM are equal and time instant at which
drain-to-source voltage of the power MOSFET is equal to 10% of drain-to-source voltage amplitude. tdon was
measured between time instant at which both input voltages of PWM are equal and time instant at which
drain-to-source voltage of the power MOSFET is equal to 90% of drain-to-source voltage amplitude.
loa
d
Harmonics
and power
analyser
TTI HA
1600
Low-distortion AC
power source
TTI AC1000A
240V
50Hz
Digital
oscilloscope
Modulation
signal
generator
PFC
converter
under
test
Figure 14. A picture and block diagramm of the experimental setup
5.2 Experimental results
The experimental results are shown in Figure 15 – Figure 17. A comparison of the simulation results
with the experimental results is shown in Figure 18, Table 5 and Table 6. Note: in making the comparison it
is assumed that |Δtd|=500 ns. Figure 15 shows the input AC voltage and current waveforms obtained using the
oscilloscope connected to the power analyser. Figure 16 shows the THD and power analysis from the power
analyser screen for different cases. Figure 17 presents low-frequency harmonics analysis (up to the 40th
harmonic) according to the IEC 1000-3-2 standard. Please note that the experimental waveforms shown in
Figure 15 are obtained by connecting the oscilloscope to the waveform monitor outputs of the power
analyser, which ignores all frequencies above 2 kHz. In order for the experimental waveforms to be
comparable with the simulated ones, a simulated iacin should be postprocessed with a low-frequency 2nd
-order
filter with a cutoff frequency of 2 kHz.
5.3 Discussion
As can be seen, the experiments confirm the simulations:
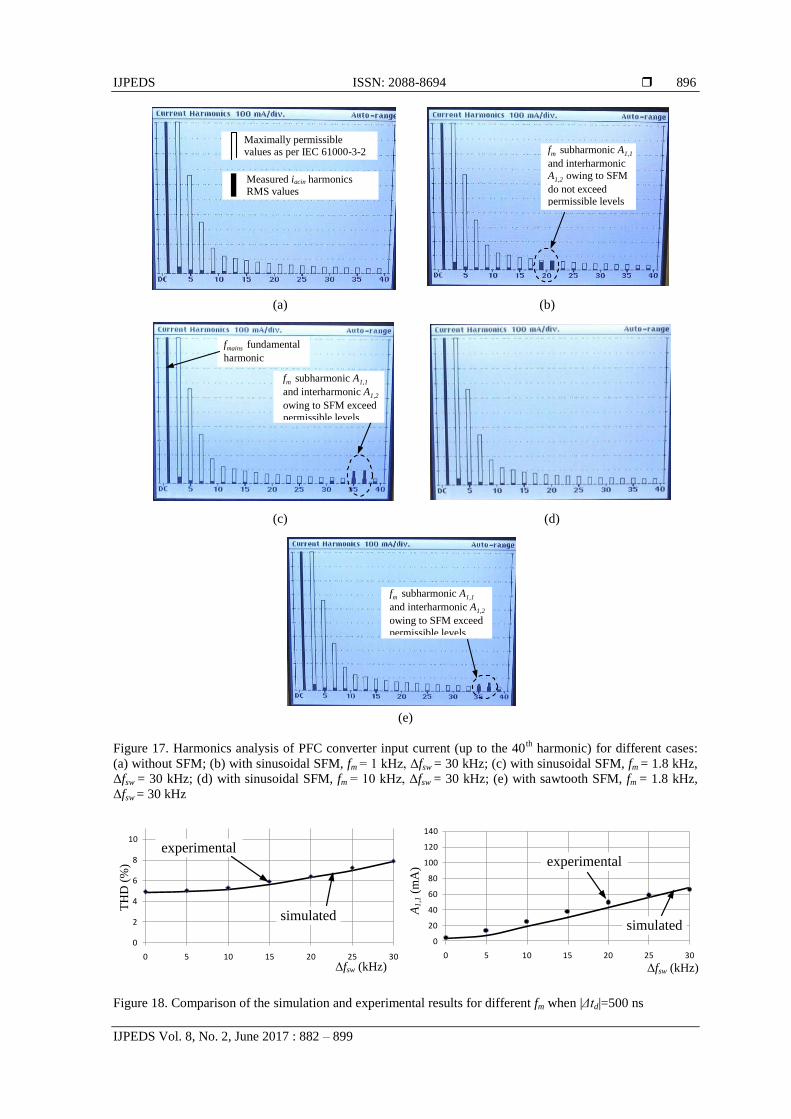
i. If fm + fmains < Mfmains (in our case, M =40), then SFM leads to a worsening PQ of the PFC converter
[Figure 16(b, c, e)]. As Δfsw increases, the THD, A1,1 and A1,2 also increase (Figure 18), but the PF
decreases. The cause of this problem is related to low-frequency components (fm interharmonics
and subharmonics) owing to SFM in the iacin spectrum. For higher Δfsw, harmonic levels exceed the
maximally permissible values set by the IEC standard. As a result, the PFC converter does not
meet IEC requirements, as shown in Figure 16(c, e) and Figure 17(c, e).

IJPEDS ISSN: 2088-8694 894
IJPEDS Vol. 8, No. 2, June 2017 : 882 – 899
ii. If fm - fmains > Mfmains, then PQ is not worsened: THD almost the same as for the unmodulated PFC
converter [Figure 16(a) and Figure 16(d)].
iii. When fm + fmains < Mfmains then lower fm gives a lower THD and amplitudes of the subharmonics and
interharmonics (Table 6) because open curren control loop gain is higher for lower frequencies
(Figure 4).
iv. A sawtooth m(t) gives a lower THD, A1,1 and A1,2 [Figure 16(e), Figure 17(e), Table 5].
v. The simulation results are in a fairly good agreement with the experimental results. The
differences between them are mainly a result of measurement errors and the fact that the
nonlinearities of the power inductor are not taken into account in the simulations. Moreover in the
SIMULINK model numerical values of the coefficients of the transfer functions are calculated
based on nominal (not actual) values of resistors and capacitors of the PFC converter under test. It
should also be noted that the Simulink model (Figure 3) uses fixed Δtd, but in reality it is variable.
(a) (b)
(c) (d)
(e)
Figure 15. Input AC voltage and current (filtered) waveforms of PFC converter under test for different cases:
(a) without SFM; (b) with sinusoidal SFM, fm = 1 kHz, Δfsw = 30 kHz; (c) with sinusoidal SFM, fm = 1.8 kHz,
Δfsw = 30 kHz; (d) with sinusoidal SFM, fm = 10 kHz, Δfsw = 30 kHz; (e) with sawtooth SFM, fm = 1.8 kHz,
Δfsw = 30 kHz. (Scale: time 5 ms/div; input voltage 310 V/div; current 1 A/div)
Input voltage vacin
Input current iacin
Input voltage vacin
Input current iacin
Input voltage vacin
Input current iacin
Input voltage vacin
Input current iacin
Input current iacin
Input voltage vacin

IJPEDS ISSN: 2088-8694 895
Effects of Switching Frequency Modulation on Input Power Quality of Boost PFC Converter (D. Stepins)
(a) (b)
(c) (d)
(e)
Figure 16. THD and power analysis of PFC converter under test for different cases: (a) without SFM; (b)
with sinusoidal SFM, fm = 1 kHz, Δfsw = 30 kHz; (c) with sinusoidal SFM, fm = 1.8 kHz, Δfsw = 30 kHz; (d)
with sinusoidal SFM, fm = 10 kHz, Δfsw = 30 kHz; (e) with sawtooth SFM, fm = 1.8 kHz, Δfsw = 30 kHz
Table 5. Experimental and simulated THD and PF for different m(t) m(t) Simulated THD
(%)
Simulated PF Experimental
THD (%)
Experimental PF
sine
triangular sawtooth
7.9
6.8 6.6
0.996
0.996 0.996
7.8
7 6.5
0.99
0.991 0.991
Table 6. Experimental and simulated THD and PF versus fm fm (kHz) Simulated THD
(%)
Simulated PF Experimental
THD (%)
Experimental PF
0.25
1
1.5 1.8
2
10
5.6
7.9
9.1 9.9
8.3
4.8
0.997
0.996
0.995 0.995
0.995
0.997
5
7.8
9.4 10.7
8.7
4.6
0.993
0.99
0.989 0.987
0.986
0.993
IJPEDS ISSN: 2088-8694 896
IJPEDS Vol. 8, No. 2, June 2017 : 882 – 899
(a) (b)
(c) (d)
(e)
Figure 17. Harmonics analysis of PFC converter input current (up to the 40th
harmonic) for different cases:
(a) without SFM; (b) with sinusoidal SFM, fm = 1 kHz, Δfsw = 30 kHz; (c) with sinusoidal SFM, fm = 1.8 kHz,
Δfsw = 30 kHz; (d) with sinusoidal SFM, fm = 10 kHz, Δfsw = 30 kHz; (e) with sawtooth SFM, fm = 1.8 kHz,
Δfsw = 30 kHz
0
20
40
60
80
100
120
140
0 5 10 15 20 25 30
0
2
4
6
8
10
0 5 10 15 20 25 30
TH
D (
%)
Δfsw (kHz)
A1
,1 (
mA
)
Δfsw (kHz)
simulated
experimental
simulated
experimental
Figure 18. Comparison of the simulation and experimental results for different fm when |Δtd|=500 ns
Maximally permissible values as per IEC 61000-3-2
Measured iacin harmonics RMS values
fm subharmonic A1,1
and interharmonic
A1,2 owing to SFM
do not exceed permissible levels
fmains fundamental
harmonic
fm subharmonic A1,1
and interharmonic A1,2
owing to SFM exceed
permissible levels
fm subharmonic A1,1
and interharmonic A1,2
owing to SFM exceed
permissible levels

IJPEDS ISSN: 2088-8694 897
Effects of Switching Frequency Modulation on Input Power Quality of Boost PFC Converter (D. Stepins)
6. COMPARISON OF THE ANALYSES PERFORMANCES
This section presents comparison of the performance of our analysis of the effect of SFM on the PQ
of boost PFC converter to the performance of the analysis presented in [22], [23].
As it was said in introduction, papers [22] and [23] show some experimental results demonstrating
that THD of boost PFC input current increases owing to the use of triangular SFM. However the analysis
presented in the above mentioned papers have many disadvantages:
i. The analysis is very short, is not comprehensive and is based only on some experimental results.
ii. The analysis does not give any clear answers on how the choice of SFM parameters affects the
THD, the power factor and the input current low-frequency content.
iii. The analysis has some ambiguities:
a) It is stated in [22] and [23] that the main cause of increase in the THD is appearance of fm
harmonics in the PFC input current spectrum. However as it is proved in our paper, SFM does
not generate fm harmonics, instead it generates fm subharmonics and interharmonics with
frequencies zfm±(2y-1)fmains. These subharmonics and interharmonics are responsible for the
increase in the THD.
b) It is stated in [22] and [23] that the main cause of fm harmonics in the PFC input current
spectrum is owing to some interactions between the PFC converter wide-bandwidth current
control loop and SFM. However as it is proved in our paper, the main causes of the fm
interharmonics and subharmmonics in the input current spectrum are DCM operation of the
PFC converter in the vicinity of the input current zero-crossings and unequal power MOSFET
switching delays. Moreover as it is shown in our paper wide-bandwidth current control loop
reduces the undesirable low-frequency components owing to SFM if fm is lower than the
current control open loop gain crossover frequency, because lower fm gives lower amplitudes
of the interharmonics and subharmonics (Table 6).
iv. The analysis is based on the measurements using a digital storage oscilloscope without taking into
account the IEC requirements for the THD and harmonics measurements.
v. Genuine causes of worsening the PQ of the PFC converter are not revealed.
vi. Some advice for choosing correct SFM parameters are not given in [22] and [23].
When making comparison of the performance of our analysis with the performance of the analysis
presented in [22] and [23] we can mention many advantages:
i. Our analysis of the effect of SFM on the boost PFC converter input power quality is detailed,
comprehensive and is based not only on experimental results but also on simulation results (for
this purpose boost PFC converter SIMULINK model is proposed in this paper). ii. The PQ measurements are done as required by the IEC using high-quality power and harmonics
analyser.
iii. Our analysis gives a clear answer what causes decrease in the power factor, inscerase in the THD
and appearance of the undesirable low-frequency content of the PFC converter owing to use of
SFM and gives some advice for the choice of the SFM parameters.
iv. Detailed explanation of the effect of SFM parameters on the PQ of the PFC converter is also
presented.
7. CONCLUSION
The analysis presented in the paper shows that SFM used for EMI suppression in PFC converters
can appreciably increase the THD of the input AC current of the PFC converter and consequently degrade the
input PQ. The main cause of the problem is that SFM causes noticeable modulation frequency subharmonics
and interharmonics in the PFC converter AC input current spectrum. Since power quality standards are very
concerned with the low-frequency content of input current, these modulation-frequency interharmonics and
subharmonics can exceed the maximally permissible values set by the PQ standard. As a result, a PFC
converter under test will fail the harmonics test. The low-frequency components are a result of two causes:
DCM operation of the PFC converter in the vicinity of the input current zero-crossings and unequal power
MOSFET switching delays. Higher Δfsw gives higher THD of the input AC current and higher amplitudes of
the subharmonics and interharmonics. The choice of modulation waveform also affects the THD. A sawtooth
modulation waveform results in lower distortion of the PFC converter input current.
Even though SFM results in input current distortion for all modulation frequencies (lower fm gives
lower THD), from normative point of view the negative effects of SFM on input PQ can be completely
neutralized when a modulation frequency is chosen to be slightly higher than Mfmains (where M is harmonic

IJPEDS ISSN: 2088-8694 898
IJPEDS Vol. 8, No. 2, June 2017 : 882 – 899
number up to which the harmonics should be analyzed) because power analysers measure harmonics up to a
certain frequency (e.g. 40·50=2 kHz).
In order to simplify the design of a SFM boost PFC converter operating in CCM, proposed
SIMULINK model as well as some advice for choosing correct SFM parameters, can be used.
Overall, we conclude that, from the power quality point of view, SFM can be either harmful or
harmless. The result depends on how properly the modulation parameters (especially the modulation
frequency) are chosen.
ACKNOWLEDGEMENTS
Support for this work was provided by the Riga Technical University through the Scientific
Research Project Competition for Young Researchers No. ZP-2016/19.
REFERENCES [1] K.K. Jha, et al., "Hardware Implementation of Single Phase Power Factor Correction System using Micro-
controller," International Journal of Power Electronics and Drive Systems, Vol.7, No.3, pp. 787-795, Sep 2016.
[2] K.V. Bindu, and B.J. Rabi, "A Novel Power Factor Correction Rectifier for Enhancing Power Quality,"
International Journal of Power Electronics and Drive Systems, Vol.6, No.4, pp.772-780, Dec 2015.
[3] R. Balasubramanian, and S. Palani, “Simulation and Performance Evaluation of Shunt Hybrid Power Filter for
Power Quality Improvement Using PQ Theory,” International Journal of Electrical and Computer Engineering
(IJECE), Vol. 6, No. 6, December 2016, pp. 2603 - 2609.
[4] Y.P. Su, C. Ni, C.Y. Chen, et al., “Boundary conduction mode controlled power factor corrector with line voltage
recovery and total harmonic distortion improvement techniques,” IEEE Trans. Ind. Electron., Vol. 61, No.7, pp.
3220–3231, July 2014.
[5] J. Jankovskis, D. Stepins, D. Pikulins, “Lowering of EMI Noise in Boost Type PFC by the use of Spread
Spectrum,” Electronics and Electrical Engineering, Vol.94, No.6, pp. 15–18, June 2009.
[6] A. Karaarslan, I. Iskender, “Average sliding control method applied on power factor correction converter for
decreasing input current total harmonic distortion using digital signal processor,” IET Power Electronics, Vol.5,
No.5, pp. 617–626, May 2012.
[7] T. A. Gonzalez, D. O. Mercuri, H. E. Tacca, and M. E. Pupareli, “Single-Switch Soft-Switched Boost Power Factor
Corrector for Modular Applications,” International Journal of Power Electronics and Drive Systems, Vol.7, No.2,
pp. 279 – 293, June 2016.
[8] S. Sathiyamoorthy, and M. Gopinath, "A Novel High Gain SEPIC Converter with the Tapped Inductor Model
Operating in Discontinuous Conduction Mode for Power Factor Correction," International Journal of Power
Electronics and Drive Systems, Vol.7, No.2, pp. 450 - 459, June 2016.
[9] R. Balamurugan, S. Hariprasath, and R. Nithya, “Power Factor Correction using Valley-Fill SEPIC Topology with
Fuzzy Logic Control,” TELKOMNIKA Indonesian Journal of Electrical Engineering, Vol.12, No.11, pp. 7622–
7630, November 2014.
[10] D. Saravanan, and M. Gopinath, "A Novel Power Factor Correction Modified Bridge Less-CUK Converter for
LED Lamp Applications," International Journal of Power Electronics and Drive Systems, Vol.7, No.3, pp. 874-
885, September 2016.
[11] M.M. Jha, K.B. Naik, and S.P. Das, "Impact of Parasitic Components on EMI Generated by SMPS," International
Journal of Power Electronics and Drive System, Vol.2, No.3, September 2012, pp. 305-312.
[12] M.Y. Hariyawan, R. Hidayat, and E. Firmansyah, “The Effects of Spread Spectrum Techniques in Mitigating
Conducted EMI to LED Luminance,” International Journal of Electrical and Computer Engineering (IJECE),
Vol.6, No.3, pp. 1332–1343, June 2016.
[13] M. R. Yazdani, N. A. Filabadi, J. Faiz, “Conducted electromagnetic interference evaluation of forward converter
with symmetric topology and passive filter,” IET Power Electronics, Vol. 7, No.5, pp. 1113–1120, May 2014.
[14] K. Mainali, R. Oruganti, “Conducted EMI Mitigation Techniques for Switch-Mode Power Converters: A Survey,”
IEEE Transactions on Power Electronics, vol. 25, no. 9, pp. 2344-2356, 2010.
[15] D. Hamza, Q. Mei, and P. K. Jain, “Application and stability analysis of a novel digital active EMI filter used in a
grid-tied PV microinverter module,” IEEE Trans. Power Electron., vol. 28, no. 6, pp. 2867–2874, June 2013.
[16] D. Stepins, "An improved control technique of switching frequency modulated power factor correctors for low
THD and high power factor," IEEE Transactions on Power Electronics, Vol.31, No.7, pp.5201-5214, July 2016.
[17] A. Elrayyah, K. Namburi, Y. Sozer and I. Husain, "An Effective Dithering Method for Electromagnetic
Interference (EMI) Reduction in Single-Phase DC/AC Inverters," IEEE Trans. Power Electron., vol. 29, no. 6,
pp.2798-2806, June 2014.
[18] J. Huang, and R. Xiong, “Study on Modulating Carrier Frequency Twice in SPWM Single-Phase Inverter,” IEEE
Transactions on Power Electronics, vol. 29, no. 7, pp. 3384 – 3392, July 2014.
[19] D. Stepins, J. Jankovskis, „Reduction of output voltage ripples in frequency modulated power converter,”
Electronics and Electrical Engineering, vol.119, no.3, pp. 45 – 48, Mar. 2012.
[20] K.K. Tse, H. Chung, S.Y.R. Hui, et al, “A comparative investigation on the use of random modulation schemes for
dc/dc converters,” IEEE Trans. Ind. Electron., Vol.47, No.2, pp. 245–252, April 2000.
[21] A. Peyghambari, A. Dastfan, A. Ahmadyfard, “Strategy for switching period selection in random pulse width
modulation to shape the noise spectrum,” IET Power Electronics, Vol. 8, No.4, pp. 517–523, June 2015.

IJPEDS ISSN: 2088-8694 899
Effects of Switching Frequency Modulation on Input Power Quality of Boost PFC Converter (D. Stepins)
[22] D. Gonzalez, J. Balcells, A. Santolaria, J. Bunetel, J. Gago, D. Magnon, S. Brehaut, “Conducted EMI Reduction in
Power Converters by Means of Periodic Switching Frequency Modulation,” IEEE Transactions on Power
Electronics, vol.22, no.6, pp. 2271-2281, Nov. 2007.
[23] J.C. Bunetel, D. Gonzalez, J. Balcells, “Impact of periodic switching frequency modulation control to reduce
conducted EMI in power factor correctors,” Proc. of 32nd Annual Conference of IEEE Industrial Electronics
Society (IECON2006), Paris, France, 2006, pp. 2541–2545.
[24] K. Tse, H. Chung, S. Hui, H. So, “Comparative Study of Carrier- Frequency Modulation Techniques for Conducted
EMI Suppression in PWM Converters,” IEEE Transactions on Industrial Electronics, vol. 49, no.3. pp. 618-627,
June 2002.
[25] D. Stepins, “Effect of Frequency Modulation on Input Current of Switch-Mode Power Converter,” Proc. of the 39th
Annual Conference of IEEE Industrial Electronics Society (IECON 2013), Austria, Vienna, Nov. 10-13, 2013,
pp.683-688.
[26] A. Santolaria, “Effects of Switching Frequency Modulation on the Power Converter’s Output Voltage,” IEEE
Transactions on Industrial Electronics, Vol.56, No.7, pp. 2729-2737, July 2009.
[27] D. Stepins, „Impact of Periodic Frequency Modulation on Power Quality of Switching Power Converter,” Journal
of Electrical and Electronics Engineering, 2014, Vol.7, No.2, pp.39-42.
[28] Barragan, L., Navarro, D., Acero, J., Urriza, I. and Burdío, J-M. “FPGA Implementation of a Switching Frequency
Modulation Circuit for EMI Reduction in Resonant Inverters for Induction Heating Appliances,” IEEE Trans. on
Industrial Electron., vol. 55, No.1, pp. 11 – 20, Jan. 2008.
[29] Fairchild Semiconductor Application Note 42047 „Power Factor Correction (PFC) Basics”.
[30] L. Rossetto, G. Spiazzi, and P. Tenti, “Control techniques for power factor correction converters” Proc. of
International Conf. Power Electronics and Motion Control (PEMC’94), Warsaw, Poland, 1994, pp. 1310–1318.
[31] Ugo Moriconi, "Designing a high power factor switching preregulator with the L4981 continuous mode," AN628,
ST Microelectronics, www.st.com (2004). [32] E. Ho, and P.K. Mok, “Design of PWM Ramp Signal in Voltage-Mode CCM Random Switching Frequency Buck
Converter for Conductive EMI Reduction,” IEEE Transactions on Circuits and Systems I: Regular Papers, vol.60,
no.2, pp. 505-515, Feb. 2013.
[33] D. Stepins, “Examination of influence of periodic switching frequency modulation in dc/dc converters on power
quality on a load,” Proc. of the 11th Biennial Baltic Electronics Conference, Tallinn, Estonia, Oct. 6-8, 2008,
pp.285-288.
[34] K.P. Louganski and J.S. Lai, "Current phase lead compensation in single-phase PFC boost converters with a
reduced switching frequency to line frequency ratio," IEEE Transactions on Power Electronics, Vol. 22, No.1, pp.
113-119, Jan. 2007.
[35] Tse. C.K. Complex Behavior of Switching Power Converters. – New York: CRC Press LCC, 2004. – 262 p.
BIOGRAPHY OF AUTHORS
Deniss STEPINS received the B.Sc., M.Sc. (with honors) and Dr.Sc.ing degrees in
electronics from Riga Technical University, Riga, Latvia, in 2004, 2006 and 2011
respectively. He is currently a senior researcher and assistant professor in the Department of
Electronics and Telecommunications, Riga Technical University. His research interests
include EMI reduction techniques applied to switching power converters, control of switch-
mode power supplies and power factor correction. He is currently IEEE, IEEE Industrial
Electronics and Power Electronics Society member.
Jin HUANG received the B.Sc. degree from Shanghai Jiaotong University, Shanghai, China,
in 1992, and the M.Sc. and Ph.D. degrees from the Huazhong University of Science and
Technology, Wuhan, China, in 2003 and 2009, respectively. In 2000, he joined Huazhong
University of Science and Technology as a Lecturer. He is currently an Associate Professor in
the School of Electrical and Electronic Engineering. His research interests include the control
technique, EMC and reliability of power electronics devices.