EFFECTS OF SUPERCONDUCTOR ELECTRON SCREENING ON FUSION ...
37
The Pennsylvania State University The Graduate School Department of Mechanical and Nuclear Engineering EFFECTS OF SUPERCONDUCTOR ELECTRON SCREENING ON FUSION REACTION RATES A Thesis in Nuclear Engineering by Kamron C. Fazel 2011 Kamron C. Fazel Submitted in Partial Fulfillment of the Requirements for the Degree of Master of Science May 2011
Transcript of EFFECTS OF SUPERCONDUCTOR ELECTRON SCREENING ON FUSION ...
The Pennsylvania State University
The Graduate School
Department of Mechanical and Nuclear Engineering
EFFECTS OF SUPERCONDUCTOR ELECTRON SCREENING ON FUSION REACTION RATES
A Thesis in
Nuclear Engineering
by
Kamron C. Fazel
2011 Kamron C. Fazel
Submitted in Partial Fulfillment
of the Requirements
for the Degree of
Master of Science
May 2011

ii
The thesis of Kamron Fazel was reviewed and approved* by the following:
Kostadin N. Ivanov
Distinguished Professor of Nuclear Engineering
Thesis Advisor
Qi Li
Professor of Physics
Thomas E. Mallouk
Professor of Chemistry
Professor of Physics
Arthur T. Motta
Professor of Nuclear Engineering and Materials Science and Engineering
Head of the Department of Mechanical and Nuclear Engineering
*Signatures are on file in the Graduate School

iii
Abstract
This research explores fusion cross section enhancements from electron screening within
superconductors and the feasibility of engineering a system to extract the energy from a
superconductor fusion system. There have been claims that superconductors will exhibit
"superscreening", which could largely increase fusion cross sections. However, there is
currently no widely accepted theory to explain superconductor electron screening. With the
possibility of significantly enhanced fusion cross sections in superconductors, this research
analyzed the possibility of a net energy gain system.
To determine the contribution of electron screening from superconductor electron pairs, the
first portion of this research proposes and analyzes an experiment. The proposed experiment
would utilize the bombardment of deuterons (20 keV) on a PdD target in two separate stages,
above and below the superconducting transition temperature (i.e., metallic and
superconducting PdD states, respectively). The protons from the resulting fusion reactions
would be detected to infer the electron screening differences between metallic and
superconducting states of PdD. The pre-experimental analysis shows that the experiment
would be able to determine the total screening from a superconductor with a 38% error of the
screening energy with 95% confidence.
The second portion of the research investigated the possibility of net energy gain from
fusion reactions within a superconductor. In order to do so, a simple direct energy conversion
model was developed. The model accounted for energy losses due to fusion product energy
deposition, energy conversion, and cooling requirements. With the model, a sample
calculation of energy gain was performed on superconducting PdD. Using the Carnot
efficiency of cooling and the PdD sample thickness equal to the coherence length (10⁻⁸ m),
the calculation indicated that with the widely accepted 11 K transition temperature there
would be no net energy gain. However, net energy gain may be possible if a superconductor
were developed with a superconductor transition temperature above 100 K. Even if net
energy gain was achievable, the reaction rates from lattice induced vibrations in
superconducting PdD would result in an extremely low power density, thus rendering the
device impractical.

Table of Contents
List of Figures . . . . . . . . . . . . . . . . . . . . . . . . . . . . . . . . . . . . . . . . . . . . . . . . . . . . . . . . . . . . . . . . . . . . .v
List of Tables . . . . . . . . . . . . . . . . . . . . . . . . . . . . . . . . . . . . . . . . . . . . . . . . . . . . . . . . . . . . . . . . . . . . vi
Acknowledgements . . . . . . . . . . . . . . . . . . . . . . . . . . . . . . . . . . . . . . . . . . . . . . . . . . . . . . . . . . . . . . vii
Chapter 1. Introduction . . . . . . . . . . . . . . . . . . . . . . . . . . . . . . . . . . . . . . . . . . . . . . . . . . . . . . . . . . .1
1.1 Fusion Cross Section . . . . . . . . . . . . . . . . . . . . . . . . . . . . . . . . . . . . . . . . . . . . . .1
1.2 Screening of Ions in Plasmas . . . . . . . . . . . . . . . . . . . . . . . . . . . . . . . . . . . . . . .2
1.3 Screening of Ions in Metals . . . . . . . . . . . . . . . . . . . . . . . . . . . . . . . . . . . . . . . .3
1.4 Screening of Ions in Superconductors . . . . . . . . . . . . . . . . . . . . . . . . . . . . . . .4
1.5 Screened Cross Sections . . . . . . . . . . . . . . . . . . . . . . . . . . . . . . . . . . . . . . . . . . .5
Chapter 2. Superconducting Materials . . . . . . . . . . . . . . . . . . . . . . . . . . . . . . . . . . . . . . . . . . . . . .8
2.1 Palladium Deuteride . . . . . . . . . . . . . . . . . . . . . . . . . . . . . . . . . . . . . . . . . . . . . .8
2.2 Magnesium Diboride . . . . . . . . . . . . . . . . . . . . . . . . . . . . . . . . . . . . . . . . . . . . 11
Chapter 3. Reaction Rates . . . . . . . . . . . . . . . . . . . . . . . . . . . . . . . . . . . . . . . . . . . . . . . . . . . . . . . 12
3.1 General Framework . . . . . . . . . . . . . . . . . . . . . . . . . . . . . . . . . . . . . . . . . . . . . 12
3.2 Parametric Study of PdD . . . . . . . . . . . . . . . . . . . . . . . . . . . . . . . . . . . . . . . . 12
Chapter 4. Scientific Experiment Concept . . . . . . . . . . . . . . . . . . . . . . . . . . . . . . . . . . . . . . . . . 15
4.1 Determining the Screening Energy in PdD and MgB2 . . . . . . . . . . . . . . . 15
Chapter 5. Possible Engineering System . . . . . . . . . . . . . . . . . . . . . . . . . . . . . . . . . . . . . . . . . . 21
5.1 Estimating Energy Gains . . . . . . . . . . . . . . . . . . . . . . . . . . . . . . . . . . . . . . . . 21
Chapter 6. Conclusion . . . . . . . . . . . . . . . . . . . . . . . . . . . . . . . . . . . . . . . . . . . . . . . . . . . . . . . . . . 28
References . . . . . . . . . . . . . . . . . . . . . . . . . . . . . . . . . . . . . . . . . . . . . . . . . . . . . . . . . . . . . . . . . . . . . . 29
iv

List of Figures
Figure 1. Screening Effect on D-D Fusion Cross Section . . . . . . . . . . . . . . . . . . . . . . . . 6
Figure 2. Screening Effect on D-D Cross Section Ratios . . . . . . . . . . . . . . . . . . . . . . . . 7
Figure 3. Relative Resistance of PdH Loading. Source: (Tripodi, P. et al. The effect of
hydrogen stoichiometry on palladium strain and resistivity. Physics Letters A 373,
4301–4306(2009).) . . . . . . . . . . . . . . . . . . . . . . . . . . . . . . . . . . . . . . . . . . . . . . . 8
Figure 4. Tc as a Function of Loading. Source: (Schirber, J. & Northrup, C.
Concentration dependence of the superconducting transition temperature in PdHx
and PdDx. Phys. Rev. B 10, 3818–3820(1974).) . . . . . . . . . . . . . . . . . . . . . . . . . 9
Figure 5. Tc as a Function of Dose. Source: (Heim, G. & Stritzker, B. Ion Implantation
A Powerful Technique for the Production of Metastable Superconducting Alloys.
Appl. Phys.7, 239 248(1975).) . . . . . . . . . . . . . . . . . . . . . . . . . . . . . . . . . . . . . . 9
Figure 6. Possible Energy Extraction System . . . . . . . . . . . . . . . . . . . . . . . . . . . . . . . 22
Figure 7. Exit Paths of Fusion Products . . . . . . . . . . . . . . . . . . . . . . . . . . . . . . . . . . . 24
Figure 8. Coefficient of Performance with Heat Ejection to 293K Sink . . . . . . . . . . . . . 25
Figure 9. Hypothetical Energy Gain Versus Critical Temperature of PdD . . . . . . . . . . . 27
v

List of Tables
Table 1. D-D and p-B Fusion Reaction Summary . . . . . . . . . . . . . . . . . . . . . . . . . . . . 2
Table 2. Screening Energies . . . . . . . . . . . . . . . . . . . . . . . . . . . . . . . . . . . . . . . . . . . . 5
Table 3. PdD Superconducting Characteristics based on Stoppini’s Derivation . . . . . . 10
Table 4. PdD Reaction Parameters . . . . . . . . . . . . . . . . . . . . . . . . . . . . . . . . . . . . . . 14
Table 5. Test Sequence . . . . . . . . . . . . . . . . . . . . . . . . . . . . . . . . . . . . . . . . . . . . . . . 16
Table 6. Precalculated Integrated Fusion Cross Section at 20 keV . . . . . . . . . . . . . . . . 17
Table 7. COPs of Commercial Cooling Devices . . . . . . . . . . . . . . . . . . . . . . . . . . . . . 25
vi
Acknowledgements
I thank my wife, Katherine, for keeping me focused and inspiring me to work hard. Thanks
to Chris Hurd and his students, Mike Blanchard, Shelby Stoker, Fritz Koennecke, and Max
Kellish for designing and building the test equipment that can be used for the proposed
experiment. Thanks to Luke Allen for assisting the students. Thanks to Ryan Kinney for
providing feedback to me as my thoughts developed. David J. Nagel edited and provided
guidance in focusing my research. I also thank anyone willing to take risks on potentially
significant ideas.
vii
Chapter 1
Introduction
Tokamak and Inertial Confinement Fusion devices are complex and costly. Performance of
these systems hinges on ensuring the plasma will be confined long enough at high enough
temperatures and densities. The goal of this thesis is to consider the possibility of creating a
fusion reactor that could function mostly in the solid state with direct energy conversion of the
charged fusion products. However, this is not currently possible, because fusion cross sections
are low, leading to lost energy in attempt to fuse nuclei. If there was a way to make fusion
reactions more probable with a way to extract the energy, then a fusion energy system could be
more practical. One possible method of increasing the probability of fusion events occurring
would be to reduce the Coulomb barrier by means of electron screening. The concepts and
determination of electron screening in materials are considered in this thesis. It is theororized
that a superconductor may offer exceptional Coulomb barrier reduction. An experiment is
outlined with sample calculations to determine the actual screening ability in a superconductor.
It is recognized that a superconducting medium for fusion energy extraction is not practical
now, because transition temperatures are still too low. A specific analysis will address energy
extraction abilities in a superconductor. To begin, the background of fusion cross sections will
be discussed.
1.1 Fusion Cross Section
When combining lower binding energy nuclei, the excess binding energy of the combined
nuclei is released as energy. This released energy far exceeds chemical energy release by about
six orders of magnitude. However, the difficulty in releasing the energy from fusion events
is that fusion requires that two positive charge nuclei combine against strong electrostatic
repulsion. The repulsive barrier to fusion is known as the Coulomb barrier.
Coulomb repulsion can be characterized by a the potential energy [1]
U (r) =Z1 · Z2 · e2
4πεor(1)
where Zn is the positive charge of particle n, e is the unit of charge (1.602 × 10⁻¹⁹ C),
εo = 8.85 · 10−12 Fm (or 1. 417 8 × 10⁻³⁰ C2
m eV ) being the permittivity of free space, and r is
the distance from the source charge.
Before the nuclei can overcome the Coulomb barrier, the nuclei (radii on the order of
femtometers [10−15 m]) must have a effective geometric probability of contacting each other
(geometric cross section). If one nucleus tunnels through the barrier then the attractive nuclear
forces help bring the nuclei together (Coulomb barrier transparency). Once the nuclei are
inside the barrier, the probability of fusion is determined by experiment (astrophysical factor).
The following equation summarizes the relevant physics.[2]
σf ≈S
E· T (2)
1

where σf is the fusion cross section (~probability of fusion), 1E is the equivalent geometric
cross section and E is center-of-mass energy, T is the Coulomb barrier transparency, and S is
the astrophysical factor determined by experiment. It represents the likelihood of fusion given
penetration of the coulomb barrier (S is dependent on energy).[2]
T = exp
(−√εGE
)(3)
where εG is the Gammow energy equal to 986.1 · (Z1Z2)2mr/mp, where mr =(m1m2) / (m1 +m2), and mp is the mass of the projectile. The fusion reactions that will be
discussed are deuterium-deuterium (D-D) and proton-boron (p-B) fusion. D-D fusion has two
fusion product groups with near equal probability of occurring. Table 1 summarizes these
reactions.[3]
Table 1. D-D and p-B Fusion Reaction Summary
Fusion Reaction Reactants Products (Energy [MeV])
D −D 21H +2
1 H11H[3.02]+ 3
1H[1.01]32He[0.82]+ 1
0n[2.45]
p−B 11H +11
5 B 3(42He
)[8.68]
1.2 Screening of Ions in Plasmas
Stars are able to utilize a plasma confinement mechanism that is not practical on Earth, namely
gravity. Human life would not exist without fusion energy. With solar radiation, plants are
able to synthesize food and generating oxygen, allowing life to flourish.
Astrophysicists study the stellar systems and the intricacies of formations and fusion reactions.
An area of astrophysics that is not fully understood is how to explain why the neutrino flux
from solar bodies is greater than the analytical predictions.[4] [5] These references offer an
explanation that the enhancement in the fusion reaction rates is due to electron screening,
which lowers the Coulomb barrier.
This screening effect is characterized by the Debye length (λD). Screening is only present
when the Fermi electron velocity is greater than the fusion reactant velocity.[6] λD (now
referred to λ for ease) is the distance between two charged particles before they can sense each
other. For a Maxwell-Boltzman (MB) electron distribution in a plasma [7]
λ =
√εokBT
e2ne(4)
where e is the electron elementary charge, kb is the Boltzmann constant, εo is the dielectric
constant, ne is the number density of the electrons, and T is the temperature. λ directly
affects the transparency, T , in Eq. 3. When the screening effect is considered, T
(transparency) becomes [2]
T ≈ exp
(−√
εGE + εs
)(5)
2
where εs is the screening energy defined as [2]
εs =Z1 · Z2 · e2
4π · εo· 1
λ(6)
If this screening effect is incorporated into Eq. 2 then [8]
σf =S (E + εs)
E + εsexp
(−√
εGE + εs
)(7)
Astrophysicists have been able to simulate electron screening in plasmas by utilizing metallic
environments. In fact, metals have been referred to as the poor man’s plasma.[8] [9]
1.3 Screening of Ions in Metals
Metals are more capable at electron screening than a substance with a M-B distribution
of electrons in a substance. Metals contain conduction electrons that are able to relocate
to regions with higher relative positive charge in order to effectively cancel out the higher
relative charge. In doing so, the relative change in the charge distribution creates an enhanced
Coulomb screening effect. Derivations [10] [11] of the screening ability start with Poisson’s
equation
∇2Φind(r) = 4πe[N(r)−N0] (8)
where Φind is the induced potential, N(r) is the induced electron density, and N0 is the charge
density prior to the addition of a conduction electron.
The electron energy changes according to the potential and the Fermi energy (εf ).
ε(r) = εf − eΦind(r) (9)
This equation is set equal to the Fermi energy in the following equation [12]
N =
∫ ∞0
ρ(E)f(E)dE (10)
where ρ(E) is the electron density of states
ρ(E) =8√
2πm3/2
h3(11)
and f(E)is the distribution function of the electron type, which is Fermi-Dirac for a conduction
electrons in a metal.
f(E) =1
e(E−εf )/kBT − 1(12)
Solving Eq. 10 for εf and inputting the solution into Eq. 9. Then the combined equation is
inserted into Eq.8 and the terms are rearranged to isolate Φind
∇2Φind(r) = − 1
λ2 Φind(r) (13)
The coefficient to Φind(r) becomes the negative inverse square of the screening length.
3

Putting the derivation in an easily applicable form [7]
λe =
√2
3
εokBTFe2ne
(14)
where ne, or conduction electron density, can be calculated by [12]
ne =8 ·√
2π(me · c2
)3/2h3c
(2
3ε3/2f
)(15)
and hc is ~ · c, where c is the speed of light, which results in hc = 1240 eV nm. The notable
parameters are Fermi temperature (TF ) and electron density. The potential energy changes
from Eq. 1 as follows [7]
U (r) =Z1 · Z2 · e2 exp
(−rλ
)4πεor
(16)
So one can infer that the U ∝ exp (−1/λ) and λ ∝ T1
2 . As TF ↑ then U ↓ which is logical.
The electrons will be traveling further away at any given time from the nucleus causing the
screening to be spread out over a larger distance, rather than close to the nucleus where
screening is more effective.
1.4 Screening of Ions in Superconductors
In metals the electrons flow with resistance due to scattering by other electrons and nuclei.
However in superconductors, some electrons are able to flow with less resistance, because
the electrons move in pairs called Cooper pairs.[13] Conduction electrons are able to pair,
moving from Fermi-Dirac statistics to Bose-Einstein statistics. This transition is enabled once
the superconductor drops below the critical temperature for superconductivity (Tc). Cooper
pairs are typically spaced out over 10’s to 100’s of lattice constants. This spacing is known as
the coherence length (ξo). Superconductors exhibit electric field expulsion which depends
on how well a superconductor cancels out external electric fields. This field expulsion is
characterized by the London penetration depth (λL). These parameters are experimentally
derived. They can be used in calculations for electron screening.
Compared to conduction electrons (degenerate Fermions) in metals, the Cooper pairs following
Bose-Einstein statistics have higher electron densities at the same energy level.[12] Based on
the ease of Cooper pair movement and their statistics, it is unclear how superconductor electron
screening would behave. Electric field screening in superconductors is not fully understood
or agreed upon.[14] There have been claims that superconductor screening will be much
greater than in metals, while others disagree.[15] [16] Stoppini and Shibata independently
established theories for Cooper pair screening, where the pair can widen the Fermi energy
band by two electron charges instead of one electron charge, as in ordinary metals.[7] [10]
[17] This would result in more screening than seen in metals according to their theories. The
Stoppini (PdD) and Shibata (metallic Hydrogen) derivation of λsc (superconductor Debye
length) use similar techniques as shown for the λe derivation above. This increased screening
has not been fully verified by experiment yet.[16] There has been an experiment performed to
4
measure the decay constants of O-19 in superconducting niobium.[18] The preliminary test
results indicate weak superconducting screening, but the results have not been fully analyzed.
There is a clear and understood method of determining the number density of Cooper pairs
(nc), which may be useful in determining the contribution of Cooper Pair screening.[10]
nc =εomec
2
λ2Le
2(17)
1.5 Screened Cross Sections
Typical λ and εs values are outlined in Table 2. The range of λ and εs for superconductors are
derived from Stoppini’s and Shibata’s work with the consideration that screening values may
in fact be no greater than ordinary metals. The screening in an insulator is comparable to the
radius of an atom.[19] The superconductor screening values are inferred from pessimistic and
optimistic predictions.[7] [15] [16] [17] [18]
Table 2. Screening Energies
Insulator Metal Superconductor
λ (m) 10−10 − 10−9 10−11 − 10−10 10−13 − 10−10
εs(eV ) 10s 100s 100s− 1, 000s
With screening energies defined, it is possible to show the effects of screening on fusion cross
sections. D-D fusion will be used as an example (εG = 986× 103 eV and S ≈ 2 · 5× 104 eV b
to account for the two main branches of D-D fusion).[2] [20] Given that the enhancement
levels are less than 1 keV, the S-factor would vary minimally for D-D fusion at that low energy
level.[20]
Using Eq. 6 and 7, where εo = 1. 417 8 × 10⁻³⁰ C2
m eV , Z1 and Z2 = 1, the fusion cross
section (σf ) is plotted in Fig. 1 with varying screening values (λ). Fig. 1 agrees with the
understanding that σf will only go as low as the σf for εs. εs ≈ 0.1keV for λ = 10−11 m and
εs ≈ 1keV for λ = 10−12 m.
Another useful comparison is to see how the ratio of σf to (σc (Coulomb scattering) + σf )
changes with screening. σc is defined for large angle Coulomb scattering as [21]
σDD =6.4× 10⁻²
E2D
[barns] (18)
where ED is the center of mass kinetic energy of the deuterons in eV. The ratio σf/ (σc + σf )represents the likelihood of a fusion given a collision with the simplifying assumption that
(σc + σf ) represents the total D-D cross section. σf/ (σc + σf ) is shown in Fig. 2. Note
that small angle Coulomb scattering is not covered in this graph or equation. Above ~2 keV
σf/ (σc + σf ) = 1.
5

Figure 1. Screening Effect on D-D Fusion Cross Section
6
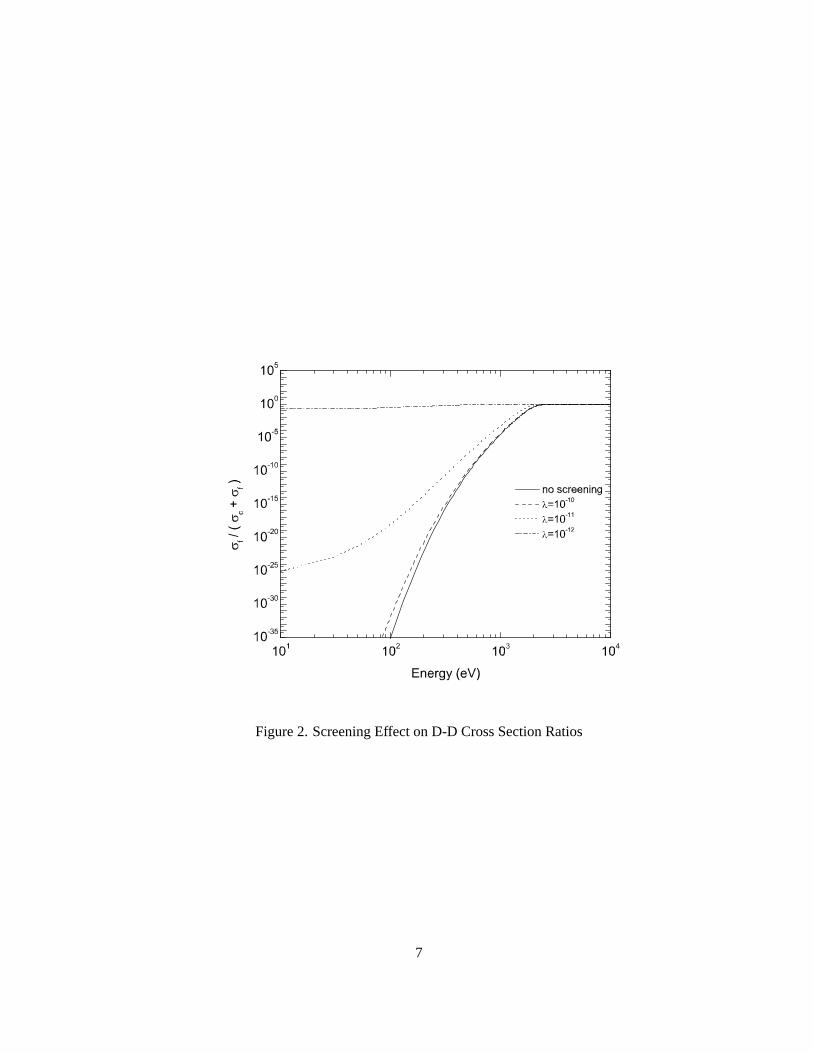
Figure 2. Screening Effect on D-D Cross Section Ratios
7
Chapter 2
Superconducting Materials
This chapter considers superconducting materials that could potentially be used to better
understand screening of fusion reactions. The two materials considered are Palladium
Deuteride (PdD) and Magnesium Diboride (MgB2).
2.1 Palladium Deuteride
2.1.1 Background
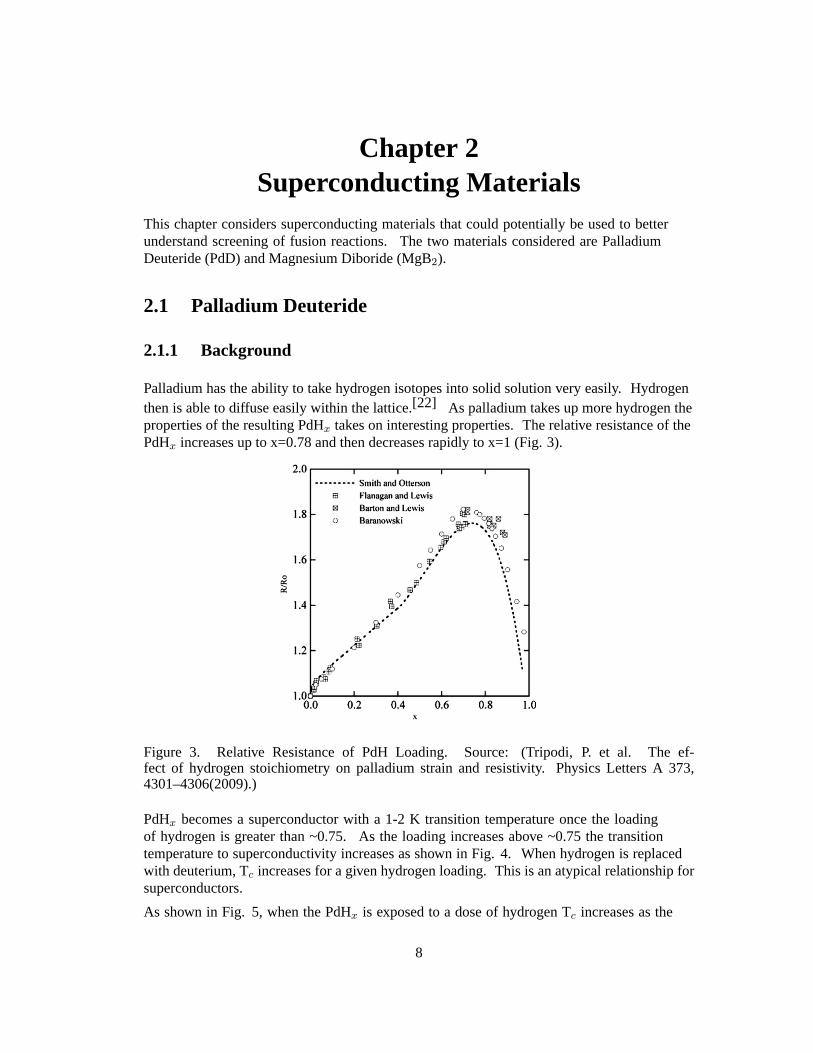
Palladium has the ability to take hydrogen isotopes into solid solution very easily. Hydrogen
then is able to diffuse easily within the lattice.[22] As palladium takes up more hydrogen the
properties of the resulting PdHx takes on interesting properties. The relative resistance of the
PdHx increases up to x=0.78 and then decreases rapidly to x=1 (Fig. 3).
Figure 3. Relative Resistance of PdH Loading. Source: (Tripodi, P. et al. The ef-fect of hydrogen stoichiometry on palladium strain and resistivity. Physics Letters A 373,4301–4306(2009).)
PdHx becomes a superconductor with a 1-2 K transition temperature once the loading
of hydrogen is greater than ~0.75. As the loading increases above ~0.75 the transition
temperature to superconductivity increases as shown in Fig. 4. When hydrogen is replaced
with deuterium, Tc increases for a given hydrogen loading. This is an atypical relationship for
superconductors.
As shown in Fig. 5, when the PdHx is exposed to a dose of hydrogen Tc increases as the
8
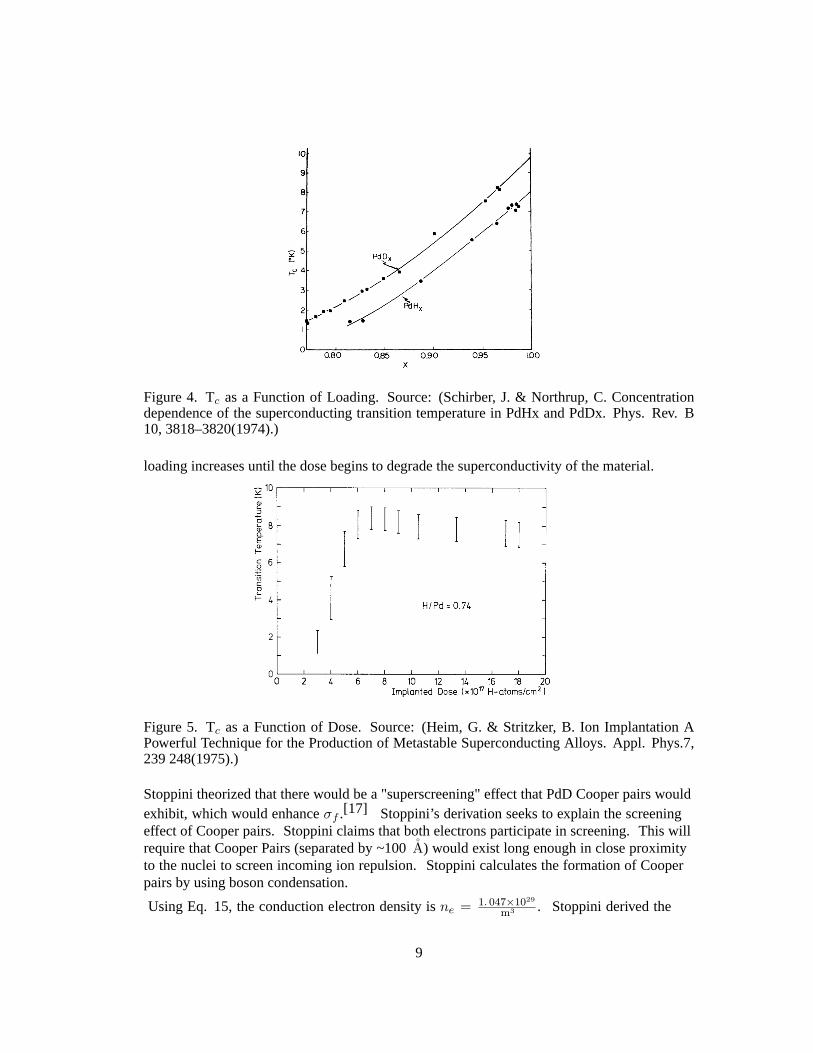
Figure 4. Tc as a Function of Loading. Source: (Schirber, J. & Northrup, C. Concentrationdependence of the superconducting transition temperature in PdHx and PdDx. Phys. Rev. B10, 3818–3820(1974).)
loading increases until the dose begins to degrade the superconductivity of the material.
Figure 5. Tc as a Function of Dose. Source: (Heim, G. & Stritzker, B. Ion Implantation APowerful Technique for the Production of Metastable Superconducting Alloys. Appl. Phys.7,239 248(1975).)
Stoppini theorized that there would be a "superscreening" effect that PdD Cooper pairs would
exhibit, which would enhance σf .[17] Stoppini’s derivation seeks to explain the screening
effect of Cooper pairs. Stoppini claims that both electrons participate in screening. This will
require that Cooper Pairs (separated by ~100 A) would exist long enough in close proximity
to the nuclei to screen incoming ion repulsion. Stoppini calculates the formation of Cooper
pairs by using boson condensation.
Using Eq. 15, the conduction electron density is ne = 1. 047×1029
m3 . Stoppini derived the
9

relationship between temperature and Cooper pairs.[17]
nc(T ) =ne2
(1−
(T
Tc
)4)
(19)
Then the Debye wavelength for the Cooper pairs was derived.
λc (T ) = 5.8× 10⁻¹¹
√T/Tc
1− (T/Tc)4 cm (20)
Combining the Debye wavelength for the Cooper pairs and conduction electrons, the effective
λ is
λ (T ) =
(g (T )
λc (T )+
1− g (T )
λe
)−1
(21)
where g (T ) = nc(T )ne
. In Table 3, sample calculated values of nc, g, and λ are presented.
Table 3. PdD Superconducting Characteristics based on Stoppini’s Derivation
nc(
m−3) g λ (m)3K 5. 2× 1028 0.50 6. 1× 10⁻¹³
5K 5. 0× 1028 0.48 8. 3× 10⁻¹³
10K 1. 7× 1028 0.15 5. 6× 10⁻¹²
>Tc 0 0 5. 3× 10⁻¹¹
These proposed values of λ would have a large effect on σf as shown in Fig. 1.
2.1.2 PdH: A High Temperature Superconductor?
Electrolytic loading of deuterium in palladium has shown signs of high temperature (near
room temperature) superconductivity when loading was greater than unity.[23] [24] While
there is evidence of superconducting signatures (e.g., magnetic susceptibility, critical currents,
and resistance drops when T goes below Tc ), criticisms have been made and rebutted.[25]
[26] For example, the relative resistance drops when T < Tc shown in these highly loaded
PdH experiments is not as large as other superconductors (i.e., MgB2). An Additional PdH
theory has been published on the existence of heavy bosons (deuterium) contributing to
superconductivity or non-equilibrium existence of superconducting states at high temperatures
(from high acoustic plasmon frequencies).[27]
However, according to Stritzker in 1975, with a maximum loading of x=1.3 the maximum
Tc for PdD only reached 10.7K leading one to question Tripodi’s studies. However, as the
dose/loading increases, the Tc dropped as shown by Heim and Stritzker.[28] Additionally,
the estimations of hydrogen loading do not appear to be rigorous across all experiments in
the field. The interpretation of how many deuterons are taken up by the material is difficult
with ion implantation and deuteron diffusion. It is possible, as Tripodi proposes, that
there are regions of superconductivity that are masked by non-superconducting regions.[23]
Despite several studies over many years, the superconductivity within PdD is still contentious.
10
Nonetheless, it is a good candidate for experiments to study the effects of D-D fusion rates
especially with the prospect of increased screening and Tc. An additional superconductor that
may be considered for Cooper pair screening for fusion reactions is magnesium diboride.
2.2 Magnesium Diboride
In 2001, magnesium diboride (MgB2) was discovered to have superconducting properties.[30]
MgB2 is especially appealing for current carrying applications, since it is the highest
known metallic superconductor. The Tc for MgB2 is 39 K.[30] MgB2 is the highest Tcsuperconductor identified that contains the fusion reactant of boron. Boron-11 would be the
isotope required in MgB2 in order to enable fusion reactions with hydrogen. There has yet to
be a derivation or explanation of the screening of the Coulomb barrier for MgB2. This may
offer another material to test to determine the effects of superconductivity on fusion reaction
rates, like p-B fusion. Now consider what the effects of screening could have on fusion
reaction rates.
11

Chapter 3
Reaction Rates
3.1 General Framework
There are two possible ways to consider reaction rates in a superconductor. Reaction rates
can be calculated either by the lattice vibration of nuclei or by external ions impinging the
superconductor. Where the reaction rate is well known for external ion induced fusion, lattice
vibration induced fusion reaction rates have been debated.
First, the reaction rate formulation for vibration induced fusion will be discussed. The formula
will need to include σf from Eq. 7 reduced by the possible vibration directions. Additionally,
the number of available reactants and the frequency of collisions must be included. The result
is
R0 =ωD2π·N ·Nn ·
σf4πa2
(22)
where ωD is the Debye frequency (lattice vibration frequency). Then ωD2π is the inverse of the
oscillation period. N is the number density of reactants (e.g., deuterons), Nn is the number of
nearest neighbors, and a is the lattice constant. 4πa2 is the spherical area of possible vibration
directions. Expanding this equation,
R1 =ωD2π· N ·Nn · SkBT + εs (T )
· 1
4πa2exp
(−√
εGkBT + εs (T )
)(23)
Second, the reaction rate formulation for external ion inducing fusion will be discussed. As
an ion enters the superconductor it slows down, which changes σf . The energy (and later
calculated σf ) decrease as a function of penetration depth, which can be inferred from the
code SRIM.[29] By using Eq. 7 (σf ) and the energy as a function of depth, σf (x) can be
integrated to obtain σi (units of distance cubed).[31] Therefore, the reaction rate is defined
as
RR = N · σi · I (24)
where I is the number of ions per second striking the target at the energy that σi is based upon.
An alternate means of calculating reaction rates are provided in the following reference.[32]
These two methods of inducing fusion are different, because external ions in Eq. 24 are only
considered able to fuse while their energy remains above the vibration energy of the material.
With vibration induced fusion, the nuclei in the lattice will continue to attempt to fuse at
vibration energies.
3.2 Parametric Study of PdD
This section considers what the expected PdD vibration induced fusion rates would be with
different screening lengths. The density of PdD is determined by the lattice spacing of the
12

Pd in the Face-Centered Cubic (FCC) structure, a = 4.0 A.[34] Because there are four D
atoms and four Pd atoms per site the number density D and Pd are nPd = nD = 4
(4.0 A)3 =
6.25× 1028 m−3
ωD = 6× 10¹² Hz,[22] which can alternately be defined by [13]
ωD =ΘDkbhb
(25)
where ΘD = 285 K for PdD [33]
For the specific case of PdD, reductions in the reaction rate must be accounted for due to
theoretical deuteron mobility and boson formation.[17] [34] Only the excited fraction in a
boson fluid can participate in a fusion process. The excited fraction reduces as temperature
drops below the boson condensation temperature of deuterons. This fraction of excited
deuterons is defined as[17]
f1 = 2 (T/Tλ)5.6(26)
where Tλ = 13.4 K, which is the condensation temperature of deuterons. If T > Tλ then f1 is
neglected, because no formation of deuteron bosons is possible.
For PdD in a non-superconducting state, only the fraction of the deuterons that diffuse are able
to interact with other deuterons.[34]
f2 = exp(−[∆Φ− 3/2hb
√Φ′′/mD
]/ (kbT )
)(27)
where mD = 1875.6 MeV/c2, and c ≈ 3 × 10⁸ m/ s. ∆Φ = 0.23 eV is the barrier height
between minima, and Φ′′ = 1.1 eV A−2
is the curvature of the local minima of the lattice (both
for PdD).[34] While Ichimaru’s [34] reaction rate formulation includes this reduction factor,
Stoppini does not. This factor accounts only for the non-superconducting state’s ability of
deuterium to tunnel to another occupied deuterium site in the lattice thus enabling attempted
fusion. This does not account for the ability of conduction electrons or Copper pairs to screen
the barrier height. The incompleteness of this equation must be considered when evaluating
the reaction rate results. Combining the factors for PdD, the reaction rate becomes
R2 = R1f1f2 (28)
Table 4 is obtained by using Stoppini’s derivation of λ and the Section 1.5 D-D parameters.
The last column includes a reaction rate (Rs) calculated in Stoppini’s article. Stoppini’s
calculation provides another means of finding the transparency (T ), which are not in agreement
with alternate references.[2] [20] If Tripodi’s experiments are fully validated, then the third
row (266 K) in Table 4 is obtained by taking the critical temperature of PdD (x1) to be room
temperature. For simplicity, the calculation for x1 in the third row uses the same lattice
spacing and density as the x=1 calculations. The fourth row shows the D-D reaction rate
at room temperature in non-superconductor PdD. While there appear to be experiments that
could have provided validation for superconductor reaction rates, the specific parameters and
results do not validate or invalidate the theorized superconductor screening ability discussed.
Tests were performed to observe the reaction rates from ion loading of Pd with D at low
temperatures (1.5 keV D+ from 40-330K). No charged particles were detected with loading
ratios that were no lower than x=0.56.[35] Therefore, it is possible that the material never
13
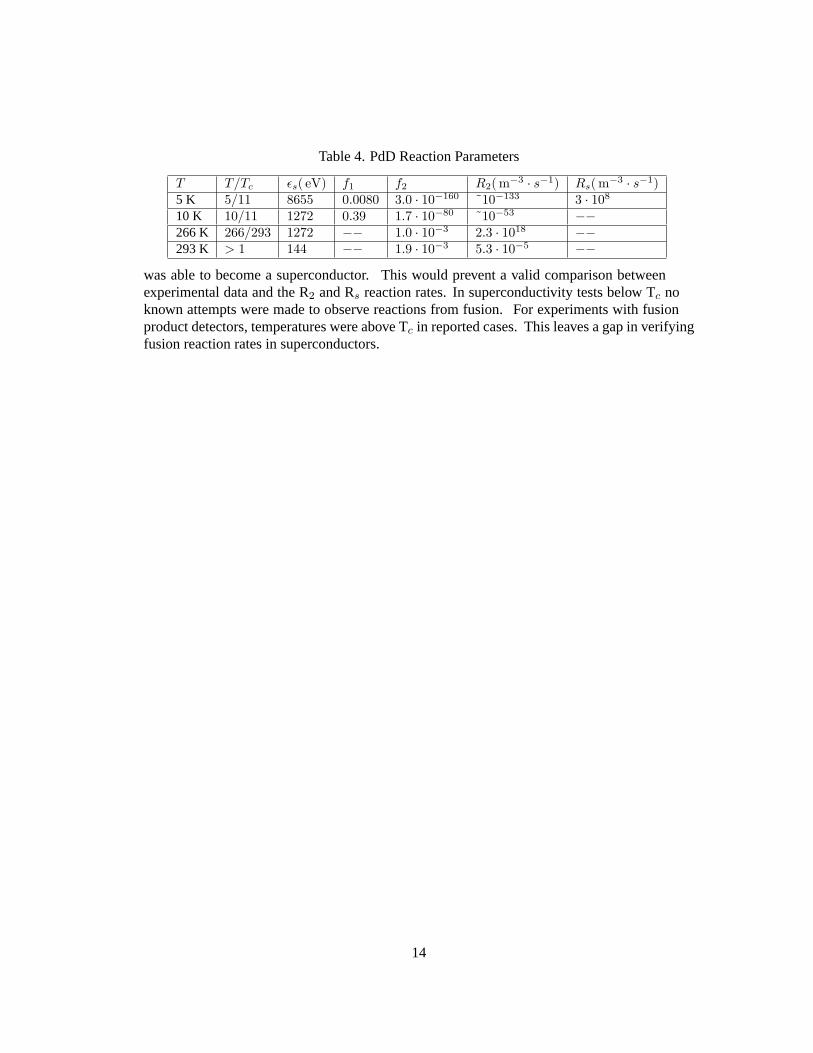
Table 4. PdD Reaction Parameters
T T/Tc εs( eV) f1 f2 R2( m−3 · s−1) Rs( m−3 · s−1)5 K 5/11 8655 0.0080 3.0 · 10−160 ˜10−133 3 · 108
10 K 10/11 1272 0.39 1.7 · 10−80 ˜10−53 −−266 K 266/293 1272 −− 1.0 · 10−3 2.3 · 1018 −−293 K > 1 144 −− 1.9 · 10−3 5.3 · 10−5 −−
was able to become a superconductor. This would prevent a valid comparison between
experimental data and the R2 and Rs reaction rates. In superconductivity tests below Tc no
known attempts were made to observe reactions from fusion. For experiments with fusion
product detectors, temperatures were above Tc in reported cases. This leaves a gap in verifying
fusion reaction rates in superconductors.
14
Chapter 4
Scientific Experiment Concept
Given the uncertainty of the screening length in superconductors, an experiment is warranted
to compare the theory of Stoppini and Shibata. Chapter 3 showed considerable vibration
induced reaction rate density using the predictions of Stoppini and Tripodi. This chapter
advances the concept of an experiment to determine screening lengths. It provides detailed
numerical estimates of possible experimental parameters.
4.1 Determining the Screening Energy in PdD and MgB2
To begin, the general experimental guidelines for determining εs are discussed followed by
quantitative details. For PdD, a thin Pd sample should be prepared for exposure to low energy
deuterons. Upon loading high enough to reach superconductivity, the reaction rate from Eq.
24 should be calculated to predict reaction rates for given εs’s. The experiment should also be
performed with a small enough sample such that the vibration induced reaction rate would be
negligible. The experiment must have enough ion induced fusion products detected above
the background to enable enough resolution to determine εs. To determine if actual fusion
reactions are taking place with 95% confidence, the detected counts have to be greater than the
error in background and detected counts [36]
cts−B = 4.653σB + 2.706 (29)
where cts are the total number of counts, B is the number of background counts, σB is the
standard deviation of the background counts (σB =√B). The standard deviation of values
can be reduced by performing multiple experiments, which lowers counting σ’s by square root
of the average counts over the number of independent counts
√ctsN .[36] N is the number of
experiments performed with the same experimental parameters.
Once the counts of fusion products are declared above background, the resolution of the
desired εs depends on the uncertainty of the number of counts obtained. The 95% confidence
interval (x ± 1.96σ or cts ± 1.96√cts)[36] of the detected counts will determine the
uncertainty of the screening energy (εs). The screening energy is determined by comparing
the observed fusion product counts at the detector to the precalculated reaction rates calculated
by Eq. 24.
Using the formulation which demonstrates combinations of screening energies, the Cooper
pair contribution to εs can be determined based on the total screening energy (equation
modified for this application) [37]
εs_sc =(ε2s − ε2s_metal
)1/2(30)
where εs_sc is the screening energy of Cooper pairs in the superconductor, εs_metal is the
contribution from λe from Eq. 14, and εs is the total screening energy. A sample sequence
of testing is outlined in Table 5. For a more accurate method of determining εs_metal than
15

Eq. 14, the test sequence includes testing above the critical temperature. This is important,
because testing two out of the three terms in Eq. 30 will establish an accurate means of finding
the superconducting contribution to the screening energy, εs_sc.
Table 5. Test Sequence
Temperature T1 T2 T3Temperature range > Tc < Tc << TcFusion product counts cts1 cts2 cts3Calculate reaction rate RR1 RR2 RR3Calculate εs_sc εs_sc1 εs_sc2 εs_sc3
With MgB2, a similar process should be used with the P-B fusion reaction shown in Table
1. Where implantation of deuterium with PdD increases the critical temperature of the
superconductor, the effects of hydrogen on MgB2 will have to be investigated prior to an
experiment. An MgB2 experiment would offer a unique perspective on Cooper pair screening
given the presence of inner orbital electrons, in contrast with deuterons in PdD.
4.1.1 Sample PdD Calculation
This section quantitatively outlines how the screening energy can be deduced from the
detection of fusion products.
An assumption in this calculation is that the number of implanted deuterons are negligible
compared to the starting number of deuterium in the PdD lattice. Reaction rates for two
different incoming D+ ions (20 keV and 150 keV) will be considered with varying degrees of
screening. The reaction rate for externally accelerated ions, as discussed in Chapter 3, requires
that σi be calculated. When accounting for the additional screening energy, σi becomes
σi =
∫ dm
di
σf (εs, x) dx (31)
where dm is the maximum depth of deuteron ions and di is the initial depth at which the ions
start. For 20 keV deuterons in this example, σi represents the integrated cross section of the
fusion reaction that results in 3.02 MeV protons (i.e., S-factor at average energy of ~10 keV in
PdD is 58.6± 0.6 keV-barns)[38] . The fusion protons will be the subject of detection in this
sample calculation. The numerical form of this equation is
σi =(5.89× 10⁴ ± 600
)· 10−38 m3
∫ 1060
0
exp(−20√
2465√
1εs−1000(0.018 5x−19. 66)
)εs − 1000 (0.018 5x− 19. 66)
dx
(32)
where εs is in eV and σi is in m3. Sample values of εs and λ with their subsequent σi and
σiND values are shown in Table 6 (20 keV deuterons), where ND = 6.25× 1028/m3. σiND
represents the probability of fusion with proton emission given the bombardment of one
deuteron at the prescribed energy.
For the sample calculation, an imposed limit on deuteron implantations is set to a 1% change
16
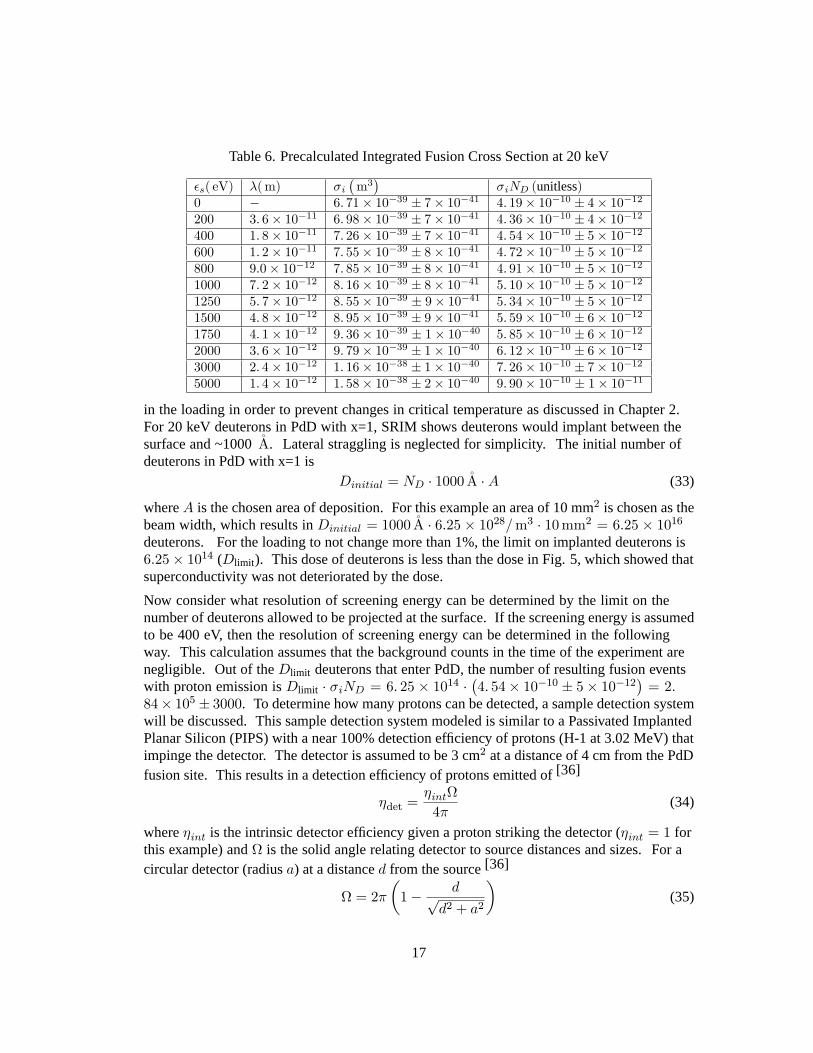
Table 6. Precalculated Integrated Fusion Cross Section at 20 keV
εs( eV) λ( m) σi(
m3)
σiND (unitless)0 − 6. 71× 10−39 ± 7× 10−41 4. 19× 10−10 ± 4× 10⁻¹²
200 3. 6× 10⁻¹¹ 6. 98× 10−39 ± 7× 10−41 4. 36× 10−10 ± 4× 10⁻¹²
400 1. 8× 10⁻¹¹ 7. 26× 10−39 ± 7× 10−41 4. 54× 10−10 ± 5× 10⁻¹²
600 1. 2× 10⁻¹¹ 7. 55× 10−39 ± 8× 10−41 4. 72× 10−10 ± 5× 10⁻¹²
800 9.0× 10⁻¹² 7. 85× 10−39 ± 8× 10−41 4. 91× 10−10 ± 5× 10⁻¹²
1000 7. 2× 10⁻¹² 8. 16× 10−39 ± 8× 10−41 5. 10× 10−10 ± 5× 10⁻¹²
1250 5. 7× 10⁻¹² 8. 55× 10−39 ± 9× 10−41 5. 34× 10−10 ± 5× 10⁻¹²
1500 4. 8× 10⁻¹² 8. 95× 10−39 ± 9× 10−41 5. 59× 10−10 ± 6× 10⁻¹²
1750 4. 1× 10⁻¹² 9. 36× 10−39 ± 1× 10−40 5. 85× 10−10 ± 6× 10⁻¹²
2000 3. 6× 10⁻¹² 9. 79× 10−39 ± 1× 10−40 6. 12× 10−10 ± 6× 10⁻¹²
3000 2. 4× 10⁻¹² 1. 16× 10−38 ± 1× 10−40 7. 26× 10−10 ± 7× 10⁻¹²
5000 1. 4× 10⁻¹² 1. 58× 10−38 ± 2× 10−40 9. 90× 10−10 ± 1× 10⁻¹¹
in the loading in order to prevent changes in critical temperature as discussed in Chapter 2.
For 20 keV deuterons in PdD with x=1, SRIM shows deuterons would implant between the
surface and ~1000 A. Lateral straggling is neglected for simplicity. The initial number of
deuterons in PdD with x=1 is
Dinitial = ND · 1000 A ·A (33)
where A is the chosen area of deposition. For this example an area of 10 mm2 is chosen as the
beam width, which results in Dinitial = 1000 A · 6.25 × 1028/m3 · 10 mm2 = 6.25 × 10¹⁶
deuterons. For the loading to not change more than 1%, the limit on implanted deuterons is
6.25× 10¹⁴ (Dlimit). This dose of deuterons is less than the dose in Fig. 5, which showed that
superconductivity was not deteriorated by the dose.
Now consider what resolution of screening energy can be determined by the limit on the
number of deuterons allowed to be projected at the surface. If the screening energy is assumed
to be 400 eV, then the resolution of screening energy can be determined in the following
way. This calculation assumes that the background counts in the time of the experiment are
negligible. Out of the Dlimit deuterons that enter PdD, the number of resulting fusion events
with proton emission is Dlimit · σiND = 6. 25 × 1014 ·(4. 54× 10−10 ± 5× 10⁻¹²
)= 2.
84× 105 ± 3000. To determine how many protons can be detected, a sample detection system
will be discussed. This sample detection system modeled is similar to a Passivated Implanted
Planar Silicon (PIPS) with a near 100% detection efficiency of protons (H-1 at 3.02 MeV) that
impinge the detector. The detector is assumed to be 3 cm2 at a distance of 4 cm from the PdD
fusion site. This results in a detection efficiency of protons emitted of [36]
ηdet =ηintΩ
4π(34)
where ηint is the intrinsic detector efficiency given a proton striking the detector (ηint = 1 for
this example) and Ω is the solid angle relating detector to source distances and sizes. For a
circular detector (radius a) at a distance d from the source [36]
Ω = 2π
(1− d√
d2 + a2
)(35)
17
where a =√
3 cm2/π = 0.977 cm, and this results in Ω = 0.18.
Therefore, ηdet = 0.014. So ηdet times the total proton emission events (2. 84 × 105) is
0.014 · 2. 84 × 105 = 3980, which is the total protons that will be counted. Because these
are physically counted events, the error is calculated separate from the theoretical error on
proton emissions mentioned previously (i.e., 3000). The standard deviation is equal to
σcts =√
3980 = 63.1. To determine what the error is associated with the actual 400 eV
screening energy, the reverse process of this calculation must be performed for the upper
and lower range of the possible counts. To determine the range of εsthe following steps are
performed to find:
(1) Proton counts
(2) Protons emitted from PdD from fusion
(3) Fraction of ions resulting in fusion (i.e., (σiND)exp, which is the calculated value of
σiND based on the experiment)
(4) Screening energy
If there are errors in the experimental execution (e.g., total deuterons impinged on target),
then the third step will have to include these additional uncertainties. Additionally, the error
contribution of the background counts will have to be propagated through. Progressing the
error from steps 1-3, the error on (σiND)exp is written as
σ_ (σiND)exp = σcts ·1
ηdet
· 1
Dlimit
(36)
which results in σ_ (σiND)exp = 7. 21 × 10−12. So the experimental (σiND)exp =
4.54× 10⁻¹⁰ ± 7× 10⁻¹². The 95% confidence (σiND)exp lower bound is 4.54× 10⁻¹⁰ −1.96 · 7 × 10−12 = 4.40 × 10⁻¹⁰ and upper bound is 4.54 × 10⁻¹⁰ + 1.96 · 7 × 10−12 =4.68× 10⁻¹⁰. The 95% confidence interval on the actual screening energy of 400 eV is ~200
eV to ~600 eV judging from Table 6. This is a seemingly unacceptable error. If 150 keV
deuterons were used with same Dlimit, the range of εs would be even greater due to the closer
proximity between σiND values. However, with 150 keV deuterons the Dlimit would be 2-3
times greater due to larger penetration depths. To decrease the size of the confidence interval
of the 20 keV experiment, a larger detection area or a higher Dlimit could be used. Expanding
Eq. 36 below
σ_ (σiND)exp =√ηdet ·Dlimit · σiN
(1
ηdet
· 1
Dlimit
)(37)
The improvement on the σ_ (σiND)exp can be shown as
σ_ (σiND)exp ∝√ηdetDlimit
ηdetDlimit
(38)
By increasing the loading limit from 1% to 5% and increasing the detection efficiency by 4
times (e.g., closer or more detectors) the σ_ (σiND)exp can be reduced by a factor of√
20/20.An increase from 1% to 5% loading is reasonable, because a 5% loading change around x=1
would only change Tc by a couple degrees Kelvin (see Fig. 4). The resulting σ_ (σiND)exp
becomes√
20/20 · 7. 21 × 10−12 = 1.61 × 10⁻¹². Interpolation from Table 6 to find the
18
screening energy is determined with
εs_int = εs_low +εs_high − εs_low
(σiND)high − (σiND)low
[(σiND)exp − (σiND)low
](39)
where εs_int is the interpolated value of εs, x_low and x_high represent the lower and upper
values of σiND and εs (corresponding to 200 eV and 400 eV or 400eV and 600 eV) in Table
6, and (σiND)exp = 4.54× 10⁻¹⁰ for this example. εs_int is exactly 400 eV in this example.
But the error that comes from the experiment will propagate through this formula, which
decreases the accuracy of the calculated screening energy. The errors in Eq. 39 are contained
in each (σiND)x value (x represents high, low, and exp). The quadrature addition method[36] can be used to find the error of (σiND)high − (σiND)low and (σiND)exp − (σiND)low .
Then the error of those two items can be combined by using error propagation for division [36]
and multiplication by a constant. Putting these errors together, the resulting error on εs_int is
σ_εs_int = (εs_high − εs_low) ·√√√√√√[σ_ (σiND)exp
]2+ [σ_ (σiND)hl]
2[(σiND)high − (σiND)low
]2 +
[(σiND)exp − (σiND)low
]22 (σ_ (σiND)hl)
2[(σiND)high − (σiND)low
]4
(40)
This formulation assumes that the errors of (σiND)high and (σiND)high take on the highest
value of the range of interpolation (represented by σ_ (σiND)hl in the equation). So between
200 eV and 400 eV or 400 eV and 600 eV the standard deviation on (σiND)high and
(σiND)low is taken to be σ_ (σiND)hl = 5 × 10⁻¹². Between 200 eV and 400 eV the 95%
confidence band is σ_εs_int · 1.96 = 192 eV. Between 400 eV and 600 eV the 95% confidence
band is σ_εs_int · 1.96 = 114 eV. The resulting 95% confidence interval for εs_int is 400+114−192
or 209 eV to 514 eV (average ±95% error is 152 eV or 38% of 400 eV). If there were no
error on the unscreened experimental S-factor (i.e., 58.6± 0.6 keV-barns)[38] , then the 95%
confidence interval would be about 360 eV to 440 eV.
Once the screening energy from the experiment is determined, then the superconducting
contribution to the screening energy can be extracted by using the metallic screening energy
from the proposed experiment above Tc and Eq. 30. To determine the error of εs_sc based on
the general form of error propagation [36]
σ2εs_sc
=
(δεs_sc
δεs
)2
σ2εs +
(δεs_sc
δεs_metal
)2
σ2εs_metal
(41)
where εs_sc =(ε2s − ε2s_metal
)1/2from Eq. 30,
δεs_sc
δεs= εs
(ε2s − ε2s_metal
)−1/2, and
δεs_sc
δεs_metal= −εs_metal
(ε2s − ε2s_metal
)−1/2. So the final σεs_sc for εs_sc becomes
σεs_sc =
((ε2s
ε2s − ε2s_metal
)σ2εs +
(ε2s_metal
ε2s − ε2s_metal
)σ2εs_metal
)1/2
(42)
19

4.1.2 Recommended Experimental Parameters
The sample calculations above demonstrate what realistic goals can be set to determine the
screening energy of superconducting PdD. Based on the sample calculations, the following
experimental parameters are recommended.
• 20 keV deuteron energy (to enable full use of these calculations)
• Establish x=~0.9 in PdD to ensure calculations match the physical conditions in the
material
• Allow for 5% increase in PdD loading to establish an average Tc of 9-11 K
• Carry out experiment in shortest times possible to minimize the background counts while
understanding cooling limitations and detector dead time
• Minimize temperature differential in PdD by having the sample not much larger than the
penetration depth of deuterons
• Ensure sample thickness is greater than the coherence length PdD (~100 A)[28] and
penetration depth (1000 A), which is more restrictive
• Prevent other charged fusion products from entering detector by adding shielding with
low intrinsic activity
20

Chapter 5
Possible Engineering System
How is it possible to take advantage of fusion cross section enhancement for a possible energy
extraction system? It is clear that without enhanced screening, the likelihood of fusion is so
low that solid state fusion would not result in net gain fusion. If the Chapter 4 enhancement
in superconductors is considerable it may be reasonable to consider engineering a system to
extract the fusion energy.
The key parts required for a superconducting fusion system are the following:
• A material that enables enhanced fusion reactions
• A means of inducing the fusion reactions (e.g., external ion acceleration or internal
vibration energy)
• A means of extracting the energy from the fusion products
Fig. 6 is an example system design to support the energy conversion of superconducting
fusion. A superconductor rod or plate is in the center with a cooling channel through the
center of it. Cooling would be required, because some fusion product energy would be
deposited in the superconductor. The key to extracting energy from a system below room
temperature is to use direct ion-to-electric conversion, a form of Direct Energy Conversion
(DEC). A means of DEC can be represented by two metal spheres concentric with each other.
The negative inner shell is ion permeable, and the positive outer shell is solid metal. As each
charged particle passes through the grid it is slowed down and captured in the positive shell.
This converts the kinetic energy into potential energy. However, fusion reaction energies can
differ leading to wasted energy. To minimize variable fusion product energy loss, a more
elaborate DEC system, like the "Venetian Blind" system from R. Moir could be used.[39]
5.1 Estimating Energy Gains
This section discusses a general analysis framework to estimate if a superconducting fusion
systems can result in net energy gain. The gain calculation begins with the energy input
required, Ei. This term includes cooling requirements and ion energy input. Next, fusion
reactions will result in an energy output. For the DEC system discussed above, the output
energy that can convert to electricity, Eo, can only be charged fusion products. Energy lost
by the ions exiting the superconductor must be considered. The fusion reaction probability
must also be defined by multiplying the integrated fusion cross section, σi, by the number
density, N , of the material. The amount of energy that can be converted in the DEC system is
limited by the conversion efficiency and the fraction of fusion ions that reach the DEC system.
With R. Moir’s work we can assume that the conversion efficiency is ~70%.[39] Assuming
only a fraction of the fusion products energy will exit the surface, the DEC efficiency of those
charged particles, or η, is 0.7. Combining these factors results in
G = N · σi ·EoEi· η (43)
21

Ion Gun Ion Gun
Superconductor
Coolant channel
Fusion Products
VGrid
+V
Figure 6. Possible Energy Extraction System
For a lattice vibration induced system, the gain equation is written without Nσi. This is
because no projected ions are used.
G =EoEi· η (44)
The energy loss sources will be discussed next.
5.1.1 Energy Losses
With the possible engineering system using ion implantation methods, energy losses (i.e., heat)
exist in the following forms:
• Ion implantation that does not result in fusion =⇒ Eion (1−Nσi)• Fusion product energy deposition in superconductor =⇒ FEdepEfusionNσi• Inefficiency in direct energy conversion =⇒ (1− η) (1− FEdep)EfusionNσi
where Eion is the incoming ion energy, FEdep is the average fraction of energy deposited in the
superconductor from charged fusion products, Efusion is the charge particle energy released
from fusion, and (1− η) is the fraction of energy that is unable to be converted to electricity at
the DEC location.
Putting these losses into equation form the following energy waste per implanted ion is
Ewaste = Eion (1−Nσi) + FEdepEfusionNσi + (1− η) (1− FEdep)EfusionNσi (45)
The cost of energy to remove the waste energy is
Ecost_1 =EwasteCOP
(46)
22
This is conservative in that it assumes that energy lost as heat at the DEC device will have to be
removed at the same COP, or Coefficient of Performance, as the superconductor temperature.
The COP of a cooling system indicates how many units of heat can be removed with one unit
of work. More accurately, Ecost is defined as
Ecost_2 =Eion (1−Nσi) + FEdepEfusionNσi
COP1+
(1− η) (1− FEdep)EfusionNσiCOP2
(47)
where COP1 and COP2 correspond to the COP of the superconductor’s temperature and the
DEC temperature respectively.
If a material is able to show that lattice vibrations are sufficient to cause fusion reactions with
adequate energy density without incoming ions, then Ewaste can be written as
Ecost_3 =FEdepEfusion
COP1+
(1− η) (1− FEdep)EfusionCOP2
(48)
An additional energy loss that does not contribute to heating the system is the energy loss
to electrons that subsequently emit x-rays. To be conservative, lost x-ray radiation will be
included in the heat removal requirement.
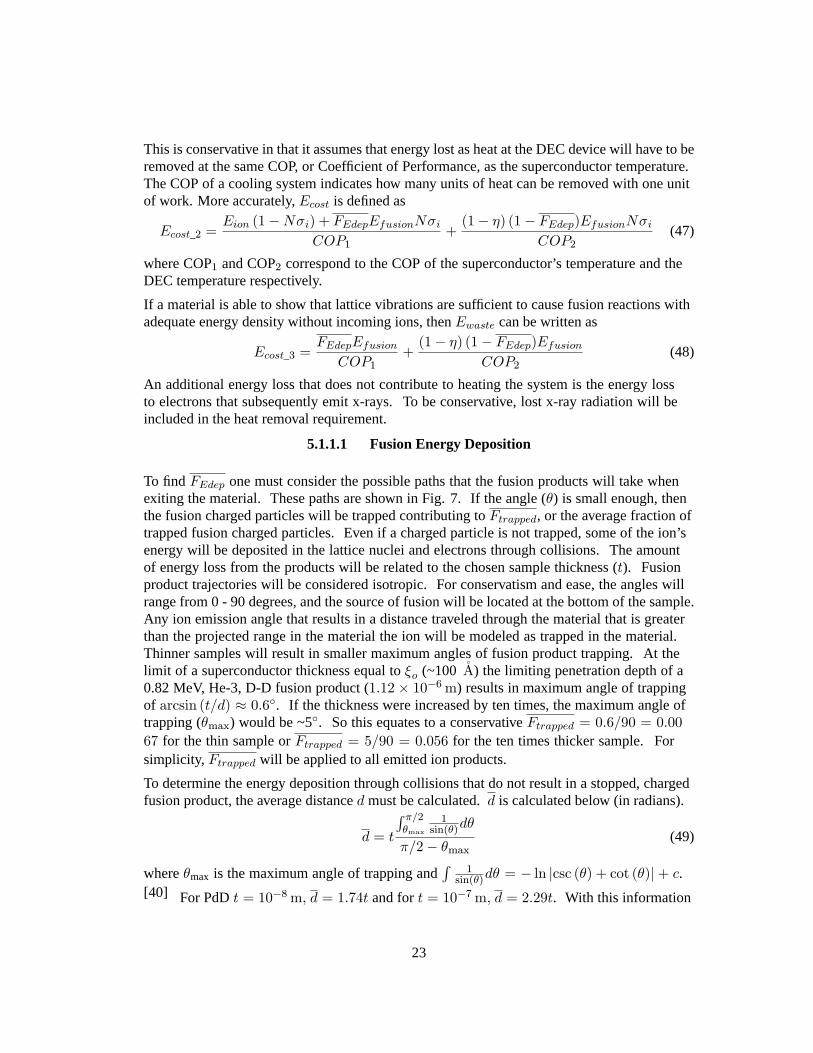
5.1.1.1 Fusion Energy Deposition
To find FEdep one must consider the possible paths that the fusion products will take when
exiting the material. These paths are shown in Fig. 7. If the angle (θ) is small enough, then
the fusion charged particles will be trapped contributing to Ftrapped, or the average fraction of
trapped fusion charged particles. Even if a charged particle is not trapped, some of the ion’s
energy will be deposited in the lattice nuclei and electrons through collisions. The amount
of energy loss from the products will be related to the chosen sample thickness (t). Fusion
product trajectories will be considered isotropic. For conservatism and ease, the angles will
range from 0 - 90 degrees, and the source of fusion will be located at the bottom of the sample.
Any ion emission angle that results in a distance traveled through the material that is greater
than the projected range in the material the ion will be modeled as trapped in the material.
Thinner samples will result in smaller maximum angles of fusion product trapping. At the
limit of a superconductor thickness equal to ξo (~100 A) the limiting penetration depth of a
0.82 MeV, He-3, D-D fusion product (1.12 × 10⁻⁶ m) results in maximum angle of trapping
of arcsin (t/d) ≈ 0.6. If the thickness were increased by ten times, the maximum angle of
trapping (θmax) would be ~5. So this equates to a conservative Ftrapped = 0.6/90 = 0.00
67 for the thin sample or Ftrapped = 5/90 = 0.056 for the ten times thicker sample. For
simplicity, Ftrapped will be applied to all emitted ion products.
To determine the energy deposition through collisions that do not result in a stopped, charged
fusion product, the average distance d must be calculated. d is calculated below (in radians).
d = t
∫ π/2θmax
1sin(θ)dθ
π/2− θmax(49)
where θmax is the maximum angle of trapping and∫
1sin(θ)dθ = − ln |csc (θ) + cot (θ)| + c.
[40] For PdD t = 10−8 m, d = 1.74t and for t = 10−7 m, d = 2.29t. With this information
23

Figure 7. Exit Paths of Fusion Products
and the stopping power of each charge fusion product the FEdep per D-D fusion event becomes
(neglecting neutron heating)
FEdep =
(∑H−1,H−3,He−3
dEdx ion
· d ·(1− Ftrapped
)+∑
H−1,H−3,He−3Eion · Ftrapped)
∑H−1,H−3,He−3Eion
(50)
where Eion is the initial energy of each fusion product and dEdx ion
is the average stopping
power of the fusion product from SRIM.∑
H−1,H−3,He−3Eion = 4.85 MeV. For D-D fusion
in a PdD sample with t = 10−7 m, the energy deposited is ~500 keV, and FEdep ≈ 0.1. For
t = 10−8 m, the energy deposited is ~50 keV, and FEdep ≈ 0.01.
With the established equations for energy losses, COPs will be discussed next.
5.1.1.2 Coefficient of Performances
Coefficient of Performances relate to how efficient heat can be removed from a possible fusion
energy extraction system (e.g., superconductor). First, the theoretical cooling at Carnot
efficiency will be considered. Second, an actual cooling device efficiency will be compared to
the Carnot efficiency for perspective.
The Carnot efficiency of a refrigerant cycle is defined by a COP of [41]
COP =ql
wnet,in=
1
TH/TL − 1(51)
where ql is the heat removed, wnet,in is the work energy required to remove that heat energy,
TH is the temperature of the area where the heat is rejected to, TL is the desired temperature
of the item to be cooled. If it is assumed that TH is room temperature (~293K) the COP as a
function of TL is shown in Fig. 8.
Comparing the theoretical cooling COPs to an commercial systems from Sumitomo
Cryogenics, the actual system cooling is less efficient as expected.
To improve the COPs, heat could be rejected to other locations besides typical room
temperature. Heat could be rejected to the ground if it were a cooler location (i.e., lower TH ).
24

Figure 8. Coefficient of Performance with Heat Ejection to 293K Sink
Table 7. COPs of Commercial Cooling Devices
Actual COP Ideal COP Eq. 51
4.2 K [42] 0.1 W/1.3 kW = 8× 10⁻⁵ 1293/4.2−1 = 0.015
77 K [43] 120 W/7.65 kW = 0.016 1293/77−1 = 0.36
5.1.2 Sample Superconducting PdD Calculation
For D-D fusion events taking place in PdD, a sample gain calculation will considered based
on Eq. 44 and Eq. 48. If superconducting PdD demonstrates high enough screening and,
hence, enough fusion reactions at temperatures below Tc, then further investigating energy
extraction is warranted. Of course, Tc may be greater than 11 K when loading is greater than
x=1 according to Tripodi.
Assumptions in this calculation are:
(1) PdD sample t = 10−8m
(2) For a reasonable Cooper pair density fraction as shown in Table 3, the superconductor
temperature will be kept at Tc/2
(3) Carnot COPs will be used for calculation ease, while understanding that available system
COPs at lower temperature are worse
(4) The DEC system will be arbitrarily kept at 5 K below room temperature
(5) Density of fusion events and radiation destruction of the superconducting state are not
25

considered
Rewriting Eq. 44 specifically for this sample calculation
G =
(∑H−1,H−3,He−3Eion
) (1− FEdep
)Ecost_3
· η (52)
where∑
H−1,H−3,He−3Eion = 4.85 MeV, FEdep ≈ 0.01, η = 0.7 and Ecost_3 from Eq. 48
with appropriate values filled in
Ecost_3 =0.01 · 4.85 MeV
(293K/ (Tc/2)− 1)−1 +(1− 0.7) (1− 0.01)4.85 MeV
(293K/ (287K)− 1)−1 (53)
and the gain becomes
G =3.36
0.485 (293/ (Tc/2)− 1) + 0.030(54)
This hypothetical energy gain versus critical temperature is shown in Fig. 9. This calculation
only utilizes Carnot efficiency and does not address the higher stopping power that would exist
with higher loaded PdD with x>1 that may enable higher transition temperatures discussed in
Section 2.1.2. This is the energy gain from one fusion event that can be emitted out of either
side of PdD plate toward a DEC. It is clear that the energy gain from a PdD sample, with the
widely accepted Tc = 11 K, is less than one. These calculations do not take into account the
thermal conductivity and heat capacity of the superconductor that could restrict heat transfer
for cooling.
26

Figure 9. Hypothetical Energy Gain Versus Critical Temperature of PdD
27

Chapter 6
Conclusion
The feasibility of a D-D fusion experiment in superconducting PdD has been demonstrated,
revealing an expected 38% error of the screening energy with 95% confidence. This would
help provide closure on the long debate on the effect of Cooper pair screening on charges.
If the superconductor screening effect is significantly greater than ion screening in metals,
then two additional experiments are warranted. First, determine the screening effect with
superconducting atoms that have inner orbital electrons (i.e., MgB2). Second, if deuterium is
not a base element in a high temperature superconductor, determine if D-D fusion reactions
exhibit superconductor screening. This second experiment may have implications when
considering a fusion energy system.
This research has also established that no net energy gain would result from superconducting
fusion with Tc below 100 K. Therefore, fusion in superconducting PdD at the accepted Tc of
11 K would not result in net energy gain. Even if PdDx, with x 1, were a high temperature
superconducting as Tripodi proposes, the fusion reaction rate from lattice vibrations appear to
be insufficient to support auxiliary systems (e.g., vacuum pump). The only way to overcome
the energy losses of cooling and auxiliary systems would be to drastically increase the fusion
reaction rate (e.g., increase the deuteron number density or nearest neighbor density, or
decrease the lattice spacing) in a high temperature superconductor. Of course, new net gain
calculations would have to be completed to validate how a specific material would perform.
28
References
[1] Krane, K. Modern Physics, Second Edition. (Wiley: 1996).
[2] Atzeni, S. & Meyer-Ter-Vehn, J. The physics of inertial fusion. (Oxford University Press:
2004).
[3] Dolan, T. Fusion Research. (2000).
[4] Liolios, T.E. The role of electron-screening deformations in solar nuclear fusion reactions and
the solar neutrino puzzle. Nuclear Physics A 683, 713-726(2001).
[5] Trautvetter, H. Charged-particle thermonuclear reactions. Journal of Physics G: Nuclear and
Particle 19, S95-S102(1993).
[6] Huke, A. et al. Enhancement of deuteron-fusion reactions in metals and experimental
implications. Physical Review C 78, 15803(2008).
[7] Shibata, K. & Kodama, R. Significant reduction of the internuclear potential in superconductive
solid metallic hydrogen. Journal of Physics: Condensed Matter 20, 075231(2008).
[8] Raiola, F. et al. Electron Screening: A Review. Frontiers in Nuclear Structure, Astrophysics,
and Reactions 831, 296–303(2006).
[9] Rolfs, C. Electron screening in metallic environments: a plasma of the poor man. Origin of
Matter and Evolution of Galaxies(AIP Conference Proceedings) 847, 245–248(2006).
[10] Kittel, C. Introduction to Solid State Physics. (Wiley: NY, 1996).
[11] Dressel, M. & Gruner, G. Electrodynamics of solids. (Cambridge University Press Cambridge:
UK, 2003).
[12] Nave, R. Hyperphysics. (Georgia State University: GA, 2010). <http://hyperphysics.phy-
astr.gsu.edu/hbase/hframe.html>
[13] Fujita, S. & Godoy, S. Quantum Statistical Theory Of Superconductivity (Springer: NY, 1996).
[14] Lipavsky, P. et al. Bernoulli Potential in Superconductors. (Springer: 2008).
[15] Koyama, T. Comment on “Charge expulsion and electric field in superconductors”. Phys. Rev.
B 70, 226503(2004).
[16] Hirsch, J. Reply to “Comment on ‘Charge expulsion and electric field in superconductors’ ”.
Phys. Rev. B 70, 226504(2004).
[17] Stoppini, G. Coulomb screening in superconducting PdH. Il Nuovo Cimento D 13,
1181–1188(1991).
[18] Oliveira Santos, F. Nuclear astrophysics with light nuclei at GANIL. Frontiers in Nuclear
Structure, Astrophysics, and Reactions(2010).
[19] Bonomo, C. Enhanced electron screening in d (d, p) t for deuterated metals. The European
Physical 719, C37-C42(2003).
[20] C. Angulo, et al., A Compilation of Charged-Particle Induced Thermonuclear Reaction Rates.
Nucl. Phys. A656(1999)3-187. <http://pntpm3.ulb.ac.be/Nacre/barre_database.htm>
[21] Steiner, D. Introduction to Fusion Devices and Systems. (RPI: NY, 2005).
[22] Fukai, Y. The Metal-Hydrogen System, Second Edition. (Springer: 2005).
[23] Tripodi, P., Di Gioacchino, D. & Vinko, J.D. Magnetic and transport properties of PdH:
29
intriguing superconductive observations. Brazilian Journal of Physics 34, 1-8(2004).
[24] Tripodi, P. High Tc Palladium Hydride Superconductor. US Patent 7,033,568(2006).
[25] Baranowski, B. & Debowska, L. Remarks on superconductivity in PdH. Journal of Alloys and
Compounds 437, L4-L5(2007).
[26] Tripodi, P., Di Gioacchino, D. & Vinko, J.D. Answer to the remarks on superconductivity in
PdH. Journal of Alloys and Compounds 470, L6-L8(2009).
[27] Vaidya, S. On the Possibility of Nonequilibrium High-Temperature Superconductivity in PdH
and PdD (*). Il Nuovo Cimento D 13, 1449-1451(1991).
[28] Heim, G. & Stritzker, B. Ion Implantation A Powerful Technique for the Production of
Metastable Superconducting Alloys. Appl. Phys.7, 239 248(1975).
[29] Ziegler, J. & Biersack, J. SRIM - Stopping and Range of Ions in Matter. 2008.04 Code, IBM
Company.
[30] Canfield, P. & Crabtree, G. Magnesium Diboride: Better Late than Never. Physics Today
(2003).
[31] Geuther, J. Radiation Generation with Pyroelectric Crystals. Doctoral Thesis. (RPI: NY, 2007).
[32] Fiorentini, G. et al. Fusion rate enhancement due to energy spread of colliding nuclei. Physical
Review C 67, 14603(2003).
[33] Hsu, D. & Leisure, R. Elastic constants of palladium and the β-phased palladium hydride
between 4 and 300 K. Phys. Rev. B 20, 4(1979).
[34] Ichimaru, S. Nuclear fusion in dense plasmas. Reviews of Modern Physics 65, 255(1993).
[35] Chambers, G., Eridon, J., & Grabowski, K. Upper limit on cold fusion in thin palladium films.
Phys. Rev. B 41, 8(1990).
[36] Knoll, G. Radiation Detection and Mesurement, Third Edition. (Wiley: 2000).
[37] Kasagi, J. Screening Potential for Nuclear Reactions in Condensed Matter. ICCF-14 1-7(2008).
[38] Greife, U., et al. Oppenheimer-Phillips effect and electron screening in d+ d fusion reactions.
Z. Phys. A 351, 107-112(1995).
[39] Moir, R. & Barr, W. "Venetian Blind" Direct Energy Conversion for Fusion Reactors. Nuclear
Fusion 13(1973).
[40] Larson, R., Hostetler, R., & Edwards, B. Calculus: Early Transcendental Functions, Third
Edition. (Houghton Mifflin: 2003).
[41] Cengel, Y. & Boles, M. Thermodynamics An Engineering Approach. (McGraw-Hill: 2005).
[42] Sumitomo Cryogenics Group. Model SRDK-101D-A11C. (2011).
[43] Sumitomo Cryogenics Group. Model CH-210. (2011).
30