
Jual Load Cell, Load Cell Murah, Jual Load Cell , Teori Load Cell, Load Cell Murah, Jual Load Cell

H O S T E D B Y
Progress in Natural Science
Materials International
Available online at www.sciencedirect.com
http://dx.doi.org1002-0071/& 20
nCorrespondinE-mail addrePeer review u
Progress in Natural Science: Materials International 25 (2015) 58–65
Original Researchwww.sciencedirect.com
www.elsevier.com/locate/pnsmi
Effects of subgrain size and static recrystallization on the mechanicalperformance of polycrystalline material: A microstructure-based
crystal plasticity finite element analysis
Fengbo Hana, Bin Tanga,n, Hongchao Koua, Jinshan Lia, Yong Fenga,b
aState Key Laboratory of Solidification Processing, Northwestern Polytechnical University, Xi'an 710072, ChinabWestern Superconducting Technologies Co., Ltd., Xi'an 710018, China
Received 28 July 2014; accepted 1 December 2014Available online 20 February 2015
Abstract
In this paper, the effects of subgrain size and static recrystallization on the mechanical performance of polycrystalline material wereinvestigated using a microstructure-based crystal plasticity finite element (CPFE) model. Firstly, polycrystalline microstructures with differentmean subgrain sizes were prepared using simple assumption based on experimental observations, and intermediate microstructures during staticrecrystallization (SRX) were simulated by a cellular automata model adopting curvature driven grain/subgrain growth mechanism. Then, CPFEmethod was applied to perform stress analysis of plane strain tension on these virtual microstructures. The results show that the subgrains insidepre-existing grains have an effect on the heterogeneity of the stress distributions. The average stress decreases with increasing the mean subgrainradius. As grain/subgrain grows during SRX, the average stress also decreases. It can be deduced that well-defined and finer subgrain structuremay strengthen the polycrystalline material, while grain/subgrain growth during SRX process will degrade the strength.& 2015 Chinese Materials Research Society. Production and hosting by Elsevier B.V. All rights reserved.
Keywords: Static recrystallization; Subgrain growth; Cellular automata; Crystal plasticity finite element; Stress analysis
1. Introduction
It is well known that the mechanical properties are veryimportant when choosing a material for structural use, andmicrostructure has great effect on the mechanical properties of amaterial. The microstructure characteristics of the materials, e.g.,the grain size, phase morphology, and grain orientation distribu-tions often govern their mechanical properties. In order to obtainideal microstructure with expected mechanical properties, variousmethods were usually used in material processing. Understandingof the microstructure evolution during material processing, such asannealing after deformation, is of great importance for optimizingthe performance of the materials. Annealing heat treatment is oftenused for cold deformed materials, during which static recovery and
/10.1016/j.pnsc.2015.01.00615 Chinese Materials Research Society. Production and hosting by
g author. Tel: þ86 29 88460568; fax: þ86 29 88460294.ss: [email protected] (B. Tang).nder responsibility of Chinese Materials Research Society.
recrystallization are the main restoration phenomena and affect themicrostructure evolution greatly. In order to optimize the annealingprocess, the microstructure evolution during annealing is usuallyinvestigated by experimental means such as optical microscope(OM) and scanning electron microscope (SEM), and mechanicaltests were carried out to evaluate the properties. However, theexperimental measurements require lots of well-prepared materialsamples and various kinds of equipment, and they are relativelytime-consuming.In the past two decades, great progresses in modeling and
simulating microstructure evolution of static recrystallization(SRX) during annealing have been made using various compu-tational approaches, among which the cellular automata (CA)method has been widely used due to its flexibility and ease ofuse. Hesselbarth and Göbel [1] are commonly considered thefirst simulated the SRX using two dimension CA method.Thereafter, Davies [2–4] studied simulation of SRX using CAsystematically and proposed a new kind of neighborhood. Goetz
Elsevier B.V. All rights reserved.

F. Han et al. / Progress in Natural Science: Materials International 25 (2015) 58–65 59
and Seetharaman [5] simulated homogeneous and heteroge-neous nucleation in two dimension and three dimension spacefor single-phase materials using a further developed CA method.Marx et al. [6] proposed a modified three dimension CA modeland simulated the primary recrystallization. Raabe et al. [7]developed a scalable three dimension CA model with aprobabilistic switching rule. In recent years, CA method hasbeen applied to model SRX in varies alloys, such as aluminum[8,9], copper [10] and steel [11–15]. All the aforementioned CAsimulations of SRX used a nucleation and growth model, inwhich the nucleation rate is usually calculated by a phenomen-ological equation depending on temperature, activation energyand stored energy. Besides, the nucleation site is often set as acell in the CA model. Recently, Han et al. [16,17] developed aCA model of SRX based on the curvature driven subgraingrowth mechanism, in which subgrains after cold deformationwere considered, and the effect of subgrains on the SRX wereinvestigated.
A number of computational studies have been done toquantificationally estimate the mechanics of polycrystallinematerials at the micro-scale, by analyzing the field variables ofmaterials undertaking loads using the finite element method(FEM). In this way, grain structures must be explicitlymodeled by EBSD experiments or other microstructure mod-eling method, such as MC, PF, vertex, CA and Voronoimethod, since micromechanical behavior can be stronglyinfluenced by the grain size, shape, orientation and theirdistributions. Choi et al. [18] constructed a 3D digital micro-structure that matched the EBSD measured grain size distribu-tion and mis-orientation distribution of a polycrystalline AZ31Mg alloy by using a MC method, and captured the hetero-geneity of the stress concentration during in-plane compressionby crystal plasticity finite element (CPFE) simulation. Liu et al.[19] simulated polycrystalline microstructures by the MCmethod and analyzed the stress response of polycrystallinematerial using FEM. Zhou et al. [20] studied the effects ofparticle size and volume fraction on the strength, elongation,and toughness of Al alloy by using FEM combined with straingradient plasticity theory, in which the grain structure isrepresent by hexagon. Zhang et al. [21,22] generated poly-crystalline structure by the Voronoi method and applied it tocrystal plasticity analysis. As can be seen, CPFE has been awidely used approach in studying the mechanical behavior ofpolycrystalline material, and more details about it can be foundin [23]. However, there seems to be no numerical study on themechanical behavior of polycrystalline materials containingsubgrains.
In this paper, firstly polycrystalline microstructures withdifferent mean subgrain sizes were prepared using simpleassumption based on experimental observations, and intermedi-ate microstructures during static recrystallization (SRX) weresimulated by a cellular automata model adopting curvaturedriven grain/subgrain growth mechanism. Then the simulatedinitial microstructures consisting of subgrains and the intermedi-ate microstructures during SRX were imported in FEM, andtension load was applied, where the crystal plasticity model wasused. Finally, the stress distribution of microstructures with
different mean subgrain radiuses and recrystallization statesunder certain tension load were calculated. And the effects ofsubgrain size and SRX on the mechanical properties werediscussed.
2. Model description and numerical methods
2.1. Cellular automata model
In this model, initial microstructures with large number ofsubgrains inside every pre-existing grain were generated basedon experimental observations [24]. Fig. 1 shows four initialmicrostructures with different mean subgrain radiuses ⟨R0⟩,where there are 12 pre-existing grains, and they are similar tothat in Ref. [17,25]. The big pre-existing grains were createdby a periodic Voronoi tessellation method and the smallsubgrains were created by simulating normal grain growthfrom an initial microstructure with very small grain size. Boththe Voronoi tessellation and CA normal grain growth simula-tion were conducted on the same lattice scale. Then the twowere synthesized to one by mapping one to another, just likeimage processing. The orientation of every grain/subgrain wasmarked by an integer number, naming orientation number,instead of Euler angles, for it is more convenient for CAsimulation. The CA simulation mesh is 2500� 2500 squarelattice and periodic boundary conditions are used.The curvature driven grain/subgrain growth mechanism was
used in the CA simulation model, in which the boundarymotion is proportional to the local mean curvature of theinterface,
v ¼ Mγκ ð1Þwhere v is the velocity of the grain/subgrain boundarysegment, M is the grain/subgrain boundary mobility, and κ isthe boundary curvature. The mobility M is dependent on theboundary misorientation angle θ, and assumed to be as [26]
M θð Þ ¼MHAG 1�exp �5θ
θm
� �4 ! !
ð2Þ
where MHAG is the mobility of high-angle boundary withmisorientation greater than θm and it is estimated by the followingequation:
MHAG ¼ δDb
kTexp � Qb
RT
� �ð3Þ
The boundary energy is also dependent on the misorienta-tion angle θ, and can be calculated by the following equation:
γ ¼ γmθ
θm
� �1� ln
θ
θm
� �� �ð4Þ
where γm is the high-angle boundary energy.An equivalent approach to calculate the boundary curvature
for square lattice known from solidification [27] was adopted
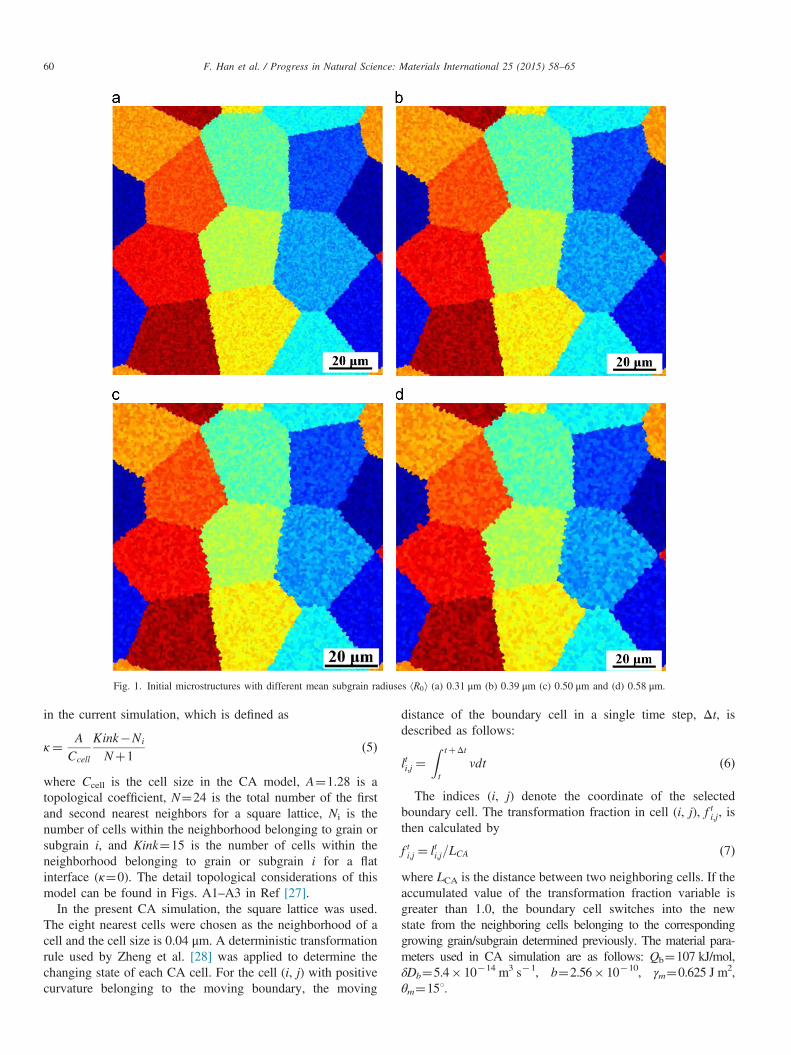
Fig. 1. Initial microstructures with different mean subgrain radiuses ⟨R0⟩ (a) 0.31 μm (b) 0.39 μm (c) 0.50 μm and (d) 0.58 μm.
F. Han et al. / Progress in Natural Science: Materials International 25 (2015) 58–6560
in the current simulation, which is defined as
κ¼ A
Ccell
Kink�Ni
Nþ1ð5Þ
where Ccell is the cell size in the CA model, A¼1.28 is atopological coefficient, N¼24 is the total number of the firstand second nearest neighbors for a square lattice, Ni is thenumber of cells within the neighborhood belonging to grain orsubgrain i, and Kink¼15 is the number of cells within theneighborhood belonging to grain or subgrain i for a flatinterface (κ¼0). The detail topological considerations of thismodel can be found in Figs. A1–A3 in Ref [27].
In the present CA simulation, the square lattice was used.The eight nearest cells were chosen as the neighborhood of acell and the cell size is 0.04 μm. A deterministic transformationrule used by Zheng et al. [28] was applied to determine thechanging state of each CA cell. For the cell (i, j) with positivecurvature belonging to the moving boundary, the moving
distance of the boundary cell in a single time step, Δt, isdescribed as follows:
lti;j ¼Z tþΔt
tvdt ð6Þ
The indices (i, j) denote the coordinate of the selectedboundary cell. The transformation fraction in cell (i, j), f ti;j, isthen calculated by
f ti;j ¼ lti;j=LCA ð7Þwhere LCA is the distance between two neighboring cells. If theaccumulated value of the transformation fraction variable isgreater than 1.0, the boundary cell switches into the newstate from the neighboring cells belonging to the correspondinggrowing grain/subgrain determined previously. The material para-meters used in CA simulation are as follows: Qb¼107 kJ/mol,δDb¼5.4� 10�14 m3 s�1, b¼2.56� 10�10, γm¼0.625 J m2,θm¼151.

F. Han et al. / Progress in Natural Science: Materials International 25 (2015) 58–65 61
2.2. Crystal plasticity finite element method
CPFE has been a fascinating approach to obtain compre-hensive mechanical behavior of polycrystalline material atmesoscopic level. In the current work, the CPFE frame andmethod based on the works of Asaro and Needleman [29] andPeirce et al. [30] was employed. The crystal orientation and theactivated slip systems were taken into account in the model.The velocity gradient L is decomposed as follows:
L¼DþΩ ð8Þwhere D and Ω are the symmetric and the skew parts of thevelocity gradient respectively. D and Ω can be additively decom-posed into elastic parts (De,Ωe) and plastic parts (Dp,Ωp)as:
D¼DeþDp ð9Þ
Ω¼ΩeþΩp ð10ÞThe elastic parts correspond to elastic deformations and
lattice rotations. The plastic parts represent the plastic shearslips of the lattice caused by dislocation slip, relating to theplastic shear strain rate on each slip system. Then the plasticpart of the velocity gradient Lp is written as follows:
Lp ¼DpþΩp ¼XNα ¼ 1
_γ αð Þsn αð Þ � nn αð Þ ð11Þ
where _γ αð Þ, sn αð Þ and nn αð Þare shear strain rate, slip directionvector and the normal vector to the slip plane of any given slip
Fig. 2. Pole figures of initial microstructure (a) containing 12 pre-existing grainssubgrain radius ⟨R0⟩¼0.31 μm.
system α, respectively. N is the number of the active slipsystems. The superscript n indicates that the vectors are takenin the deformed configuration following lattice stretching androtation. The increment of the shear stress τ in system α is thenprescribed through:
_τ αð Þ ¼ nn αð Þ C : De�De UσþσUDe½ �sn αð Þ ð12Þ
where C is the elastic stiffness tensor and σ is the Cauchystress tensor.The shear strain rate _γ αð Þ of the αth slip system is determined
by a simple rate-dependent power law relation proposed byHutchinson [31]:
_γ αð Þ ¼ _γ0αð Þ��� τ αð Þ
g αð Þ
���1=msgn τ αð Þ� � ð13Þ
where _γ0αð Þ is the reference strain rate, τ αð Þ is the resolved shear
stress, g αð Þ is the slip system strength or resistance to shear,and m is the strain sensitivity exponent. Due to the accumula-tion of dislocations, strain hardening will occur, and ischaracterized by the evolution of the strengths g αð Þ throughthe incremental relation:
_g αð Þ ¼Xβ
hαβ _γβð Þ ð14Þ
where hαβ are the slip hardening moduli. The hardening modelof Asaro and Needleman [29], and Pierce et al. [30] is used
without subgrains and (b) containing large number of subgrains with mean

F. Han et al. / Progress in Natural Science: Materials International 25 (2015) 58–6562
here, and the self-hardening moduli is expressed as follows:
hαα ¼ h γð Þ ¼ h0sech2��� h0γ
τs�τ0
��� ð15Þ
where h0 is the initial hardening modulus, τ0 is the initial valueof current strength g αð Þ, τs is the saturation value. “sech” is thehyperbolic secant function, and γ is the Taylor cumulativeshear strain on all slip systems:
γ ¼Xα
Z t
0
���_γ αð Þ���dt ð16Þ
The latent hardening moduli are given by
hαβ ¼ qh γð Þ αaβð Þ ð17Þwhere q is a constant, and it is chosen as 1 for isotropic hardening.The employed material parameters for copper are as follows: [32]elastic constant C11¼168,400 MPa, C12¼121,400 MPa, C44¼75,400 MPa; h0¼541.5 MPa, τs¼109.5 MPa, τ0¼60.8 MPa,_γ0¼0.001 s�1, m¼0.1. Several typical rectangular domainsselected from the CA simulated microstructures are used forCPFE simulation. All the CPFE simulations used the sameboundary conditions, the left side of the domain is assigned tobe symmetrical boundary, the top and bottom side are free, andthe right side is applied a total displacement of 1% in thetensile direction.
Fig. 3. Stress S11 distribution for selected domains (at the top right) of initial micr(c) 0.50 μm and (d) 0.58 μm.
3. Results and discussion
3.1. Effect of mean subgrain radius on the stress
The initial microstructures with different mean subgrainradius as shown in Fig. 1 were used to investigate the effectof mean subgrain radius on the stress. As aforementioned, theorientation of every grain/subgrain in CA simulation wasmarked by an integer number, naming orientation number.It is not enough to use the same method in CPFE calculation,and a more accurate orientation characterization method isneeded. In the current work, the Euler angle (φ1, ψ, φ2) wasused in CPFE to characterize the grain/subgrain orientation.The orientations of 12 pre-existing grains are randomgenerated, and we just should make sure that the misorienta-tions between neighboring grains are high angle. The polefigures of planes {001}, {110} and {111} for the 12 pre-existing grains are shown in Fig. 2(a). Subgrains inside eachpre-existing grains have low angle misorientation betweenneighboring subgrains. In order to meet this condition, arotation angle lower than 101 is randomly generated, and therotation is made based on the Euler angle of the pre-existinggrain, and then the orientation of subgrain was obtained.Fig. 2(b) shows the pole figures of planes {001}, {110} and{111} for all the subgrains. Clearly we can see that there are
ostructures with different mean subgrain radiuses ⟨R0⟩ (a) 0.31 μm (b) 0.39 μm
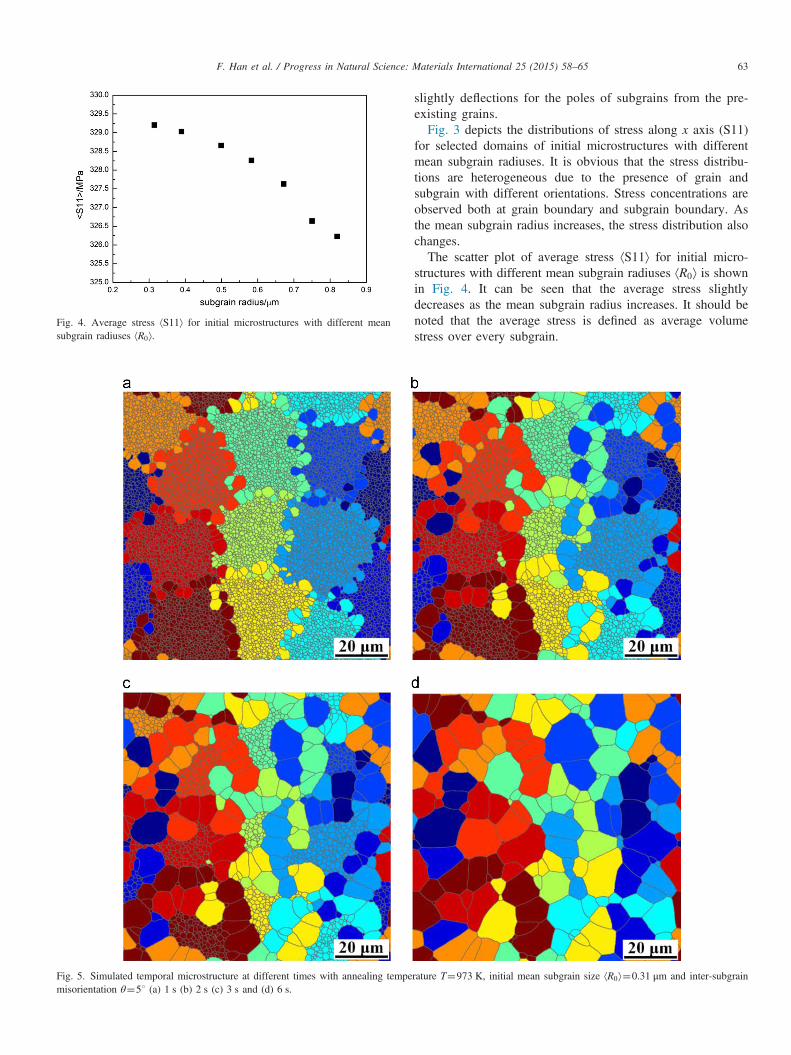
Fig. 5. Simulated temporal microstructure at different times with annealing tempemisorientation θ¼51 (a) 1 s (b) 2 s (c) 3 s and (d) 6 s.
Fig. 4. Average stress ⟨S11⟩ for initial microstructures with different meansubgrain radiuses ⟨R0⟩.
F. Han et al. / Progress in Natural Science: Materials International 25 (2015) 58–65 63
slightly deflections for the poles of subgrains from the pre-existing grains.Fig. 3 depicts the distributions of stress along x axis (S11)
for selected domains of initial microstructures with differentmean subgrain radiuses. It is obvious that the stress distribu-tions are heterogeneous due to the presence of grain andsubgrain with different orientations. Stress concentrations areobserved both at grain boundary and subgrain boundary. Asthe mean subgrain radius increases, the stress distribution alsochanges.The scatter plot of average stress ⟨S11⟩ for initial micro-
structures with different mean subgrain radiuses ⟨R0⟩ is shownin Fig. 4. It can be seen that the average stress slightlydecreases as the mean subgrain radius increases. It should benoted that the average stress is defined as average volumestress over every subgrain.
rature T¼973 K, initial mean subgrain size ⟨R0⟩¼0.31 μm and inter-subgrain
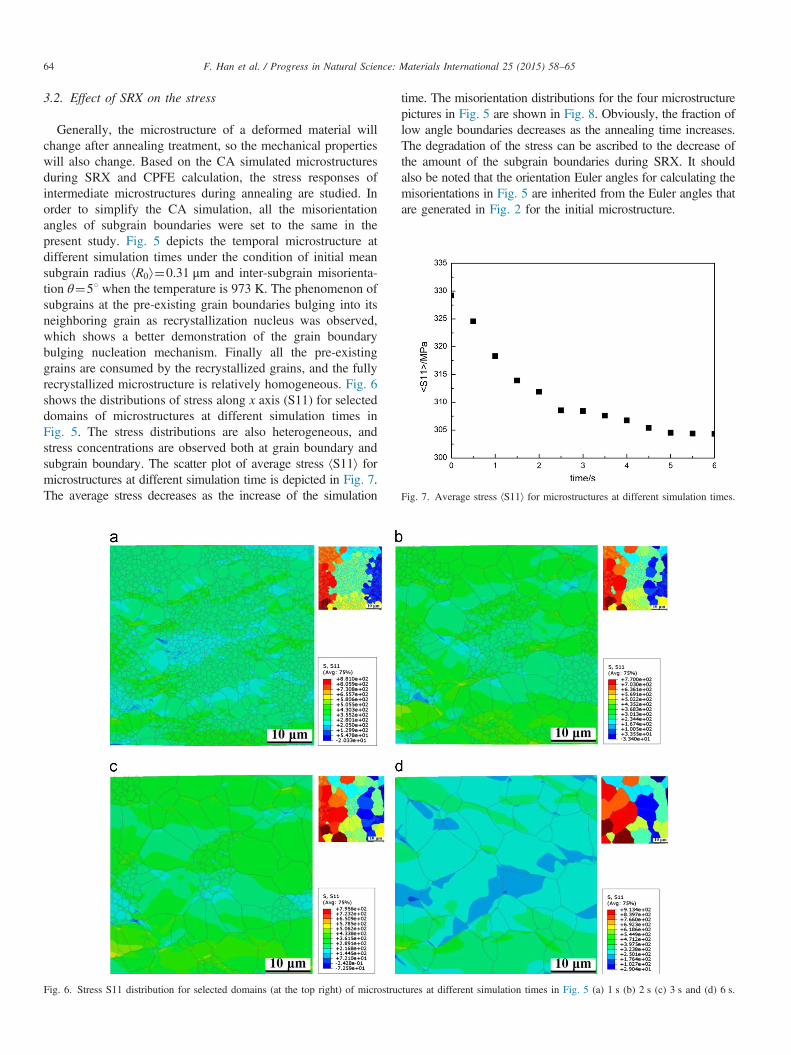
Fig. 7. Average stress ⟨S11⟩ for microstructures at different simulation times.
F. Han et al. / Progress in Natural Science: Materials International 25 (2015) 58–6564
3.2. Effect of SRX on the stress
Generally, the microstructure of a deformed material willchange after annealing treatment, so the mechanical propertieswill also change. Based on the CA simulated microstructuresduring SRX and CPFE calculation, the stress responses ofintermediate microstructures during annealing are studied. Inorder to simplify the CA simulation, all the misorientationangles of subgrain boundaries were set to the same in thepresent study. Fig. 5 depicts the temporal microstructure atdifferent simulation times under the condition of initial meansubgrain radius ⟨R0⟩¼0.31 μm and inter-subgrain misorienta-tion θ¼51 when the temperature is 973 K. The phenomenon ofsubgrains at the pre-existing grain boundaries bulging into itsneighboring grain as recrystallization nucleus was observed,which shows a better demonstration of the grain boundarybulging nucleation mechanism. Finally all the pre-existinggrains are consumed by the recrystallized grains, and the fullyrecrystallized microstructure is relatively homogeneous. Fig. 6shows the distributions of stress along x axis (S11) for selecteddomains of microstructures at different simulation times inFig. 5. The stress distributions are also heterogeneous, andstress concentrations are observed both at grain boundary andsubgrain boundary. The scatter plot of average stress ⟨S11⟩ formicrostructures at different simulation time is depicted in Fig. 7.The average stress decreases as the increase of the simulation
Fig. 6. Stress S11 distribution for selected domains (at the top right) of microstru
time. The misorientation distributions for the four microstructurepictures in Fig. 5 are shown in Fig. 8. Obviously, the fraction oflow angle boundaries decreases as the annealing time increases.The degradation of the stress can be ascribed to the decrease ofthe amount of the subgrain boundaries during SRX. It shouldalso be noted that the orientation Euler angles for calculating themisorientations in Fig. 5 are inherited from the Euler angles thatare generated in Fig. 2 for the initial microstructure.
ctures at different simulation times in Fig. 5 (a) 1 s (b) 2 s (c) 3 s and (d) 6 s.
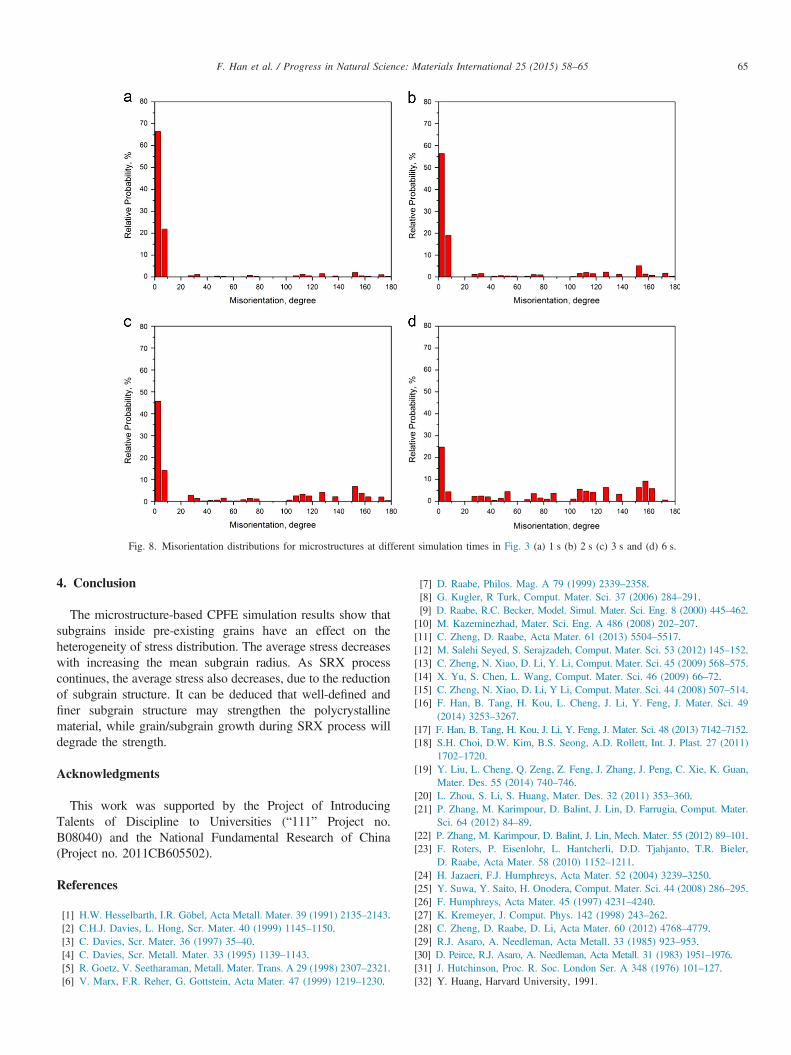
Fig. 8. Misorientation distributions for microstructures at different simulation times in Fig. 3 (a) 1 s (b) 2 s (c) 3 s and (d) 6 s.
F. Han et al. / Progress in Natural Science: Materials International 25 (2015) 58–65 65
4. Conclusion
The microstructure-based CPFE simulation results show thatsubgrains inside pre-existing grains have an effect on theheterogeneity of stress distribution. The average stress decreaseswith increasing the mean subgrain radius. As SRX processcontinues, the average stress also decreases, due to the reductionof subgrain structure. It can be deduced that well-defined andfiner subgrain structure may strengthen the polycrystallinematerial, while grain/subgrain growth during SRX process willdegrade the strength.
Acknowledgments
This work was supported by the Project of IntroducingTalents of Discipline to Universities (“111” Project no.B08040) and the National Fundamental Research of China(Project no. 2011CB605502).
References
[1] H.W. Hesselbarth, I.R. Göbel, Acta Metall. Mater. 39 (1991) 2135–2143.[2] C.H.J. Davies, L. Hong, Scr. Mater. 40 (1999) 1145–1150.[3] C. Davies, Scr. Mater. 36 (1997) 35–40.[4] C. Davies, Scr. Metall. Mater. 33 (1995) 1139–1143.[5] R. Goetz, V. Seetharaman, Metall. Mater. Trans. A 29 (1998) 2307–2321.[6] V. Marx, F.R. Reher, G. Gottstein, Acta Mater. 47 (1999) 1219–1230.
[7] D. Raabe, Philos. Mag. A 79 (1999) 2339–2358.[8] G. Kugler, R Turk, Comput. Mater. Sci. 37 (2006) 284–291.[9] D. Raabe, R.C. Becker, Model. Simul. Mater. Sci. Eng. 8 (2000) 445–462.[10] M. Kazeminezhad, Mater. Sci. Eng. A 486 (2008) 202–207.[11] C. Zheng, D. Raabe, Acta Mater. 61 (2013) 5504–5517.[12] M. Salehi Seyed, S. Serajzadeh, Comput. Mater. Sci. 53 (2012) 145–152.[13] C. Zheng, N. Xiao, D. Li, Y. Li, Comput. Mater. Sci. 45 (2009) 568–575.[14] X. Yu, S. Chen, L. Wang, Comput. Mater. Sci. 46 (2009) 66–72.[15] C. Zheng, N. Xiao, D. Li, Y Li, Comput. Mater. Sci. 44 (2008) 507–514.[16] F. Han, B. Tang, H. Kou, L. Cheng, J. Li, Y. Feng, J. Mater. Sci. 49
(2014) 3253–3267.[17] F. Han, B. Tang, H. Kou, J. Li, Y. Feng, J. Mater. Sci. 48 (2013) 7142–7152.[18] S.H. Choi, D.W. Kim, B.S. Seong, A.D. Rollett, Int. J. Plast. 27 (2011)
1702–1720.[19] Y. Liu, L. Cheng, Q. Zeng, Z. Feng, J. Zhang, J. Peng, C. Xie, K. Guan,
Mater. Des. 55 (2014) 740–746.[20] L. Zhou, S. Li, S. Huang, Mater. Des. 32 (2011) 353–360.[21] P. Zhang, M. Karimpour, D. Balint, J. Lin, D. Farrugia, Comput. Mater.
Sci. 64 (2012) 84–89.[22] P. Zhang, M. Karimpour, D. Balint, J. Lin, Mech. Mater. 55 (2012) 89–101.[23] F. Roters, P. Eisenlohr, L. Hantcherli, D.D. Tjahjanto, T.R. Bieler,
D. Raabe, Acta Mater. 58 (2010) 1152–1211.[24] H. Jazaeri, F.J. Humphreys, Acta Mater. 52 (2004) 3239–3250.[25] Y. Suwa, Y. Saito, H. Onodera, Comput. Mater. Sci. 44 (2008) 286–295.[26] F. Humphreys, Acta Mater. 45 (1997) 4231–4240.[27] K. Kremeyer, J. Comput. Phys. 142 (1998) 243–262.[28] C. Zheng, D. Raabe, D. Li, Acta Mater. 60 (2012) 4768–4779.[29] R.J. Asaro, A. Needleman, Acta Metall. 33 (1985) 923–953.[30] D. Peirce, R.J. Asaro, A. Needleman, Acta Metall. 31 (1983) 1951–1976.[31] J. Hutchinson, Proc. R. Soc. London Ser. A 348 (1976) 101–127.[32] Y. Huang, Harvard University, 1991.