
Effects of strut geometry and pore fraction on creep ...
12
Effects of strut geometry and pore fraction on creep properties of cellular materials Yuttanant Boonyongmaneerat a , David C. Dunand b, * a Metallurgy and Materials Science Research Institute, Chulalongkorn University, Bangkok 10330, Thailand b Department of Materials Science and Engineering, Northwestern University, Evanston, IL 60208, USA Received 6 October 2008; received in revised form 11 November 2008; accepted 11 November 2008 Available online 2 January 2009 Abstract A set of analytical models based on engineering beam analysis is developed to predict creep behavior of cellular materials over a broad range of relative density. Model predictions, which take into account the presence of mass at strut nodes and consider different possible deformation mechanisms and foam architectures, are compared to experimental creep results for a replicated nickel-base foam and a reticulated aluminum foam. As porosity decreases, the controlling creep mechanism in the foams changes from strut bending, to strut shearing, and ultimately to strut compression. Ó 2008 Acta Materialia Inc. Published by Elsevier Ltd. All rights reserved. Keywords: Creep; Foams; Porous materials; Sponges; Metallic foams 1. Introduction The creep deformation of cellular materials (or foams) is important for load-bearing applications at high homologous temperatures. For creep-resistant applications, metallic foams are particularly interesting, since they have higher creep resistance and oxidation resistance than polymer foams and higher toughness than ceramic foams. Most metallic foams studied to date are based on aluminum pro- duced by melt foaming [1–3]. Foam creep models have thus focused mostly on low-density reticulated foams with or without cell walls [4–6]. Unlike aluminum foams, high-melt- ing metal foams cannot easily be produced by gas injection or generation in the melt, due to their high liquidus temperature and reactivity. Rather, replication methods have been used for various high-melting alloys such as nickel-, iron-, and titanium-base foams [7–12] as well as for aluminum with higher relative densities than reticulated foams [13–15]: liquid metal is poured, or powders are densified, in the space present within a partially densified preform of space-holder powders (usually a salt or oxide) which are subsequently removed to create porosity. Replicated foams thus show open pores but they exhibit struts which are much less uni- form in cross-sectional area than those in reticulated foams: they are thick at their nodes and become progressively thin- ner toward their mid-points, reflecting the shape of the empty space between the contacting space-holder particles. Thus, replicated metal foams, with typically 30–85% open poros- ity, have an architecture intermediate between reticulated foams (with struts of uniform diameter connected by nodes, and with open porosities above 85%) and porous metals (consisting of distinct pores within a continuous matrix, with fully or partially closed porosities under 30%). To date, research on creep of metallic foams has focused on reticulated Al and Ni foams with porosity over 85% for which models have been developed considering the compressive or bending deformation of struts with uniform cross-sections. Extending these models to higher relative density for replicated foams may be inadequate, since the struts of these foams have non-uniform sections and low aspect ratios, which may lead to combined compression and bending deformation mechanisms or even new mecha- nisms such as shearing. 1359-6454/$34.00 Ó 2008 Acta Materialia Inc. Published by Elsevier Ltd. All rights reserved. doi:10.1016/j.actamat.2008.11.027 * Corresponding author. Tel.: +1 847 491 5370. E-mail address: [email protected] (D.C. Dunand). www.elsevier.com/locate/actamat Available online at www.sciencedirect.com Acta Materialia 57 (2009) 1373–1384
Transcript of Effects of strut geometry and pore fraction on creep ...

Available online at www.sciencedirect.com
www.elsevier.com/locate/actamat
Acta Materialia 57 (2009) 1373–1384
Effects of strut geometry and pore fraction on creep propertiesof cellular materials
Yuttanant Boonyongmaneerat a, David C. Dunand b,*
a Metallurgy and Materials Science Research Institute, Chulalongkorn University, Bangkok 10330, Thailandb Department of Materials Science and Engineering, Northwestern University, Evanston, IL 60208, USA
Received 6 October 2008; received in revised form 11 November 2008; accepted 11 November 2008Available online 2 January 2009
Abstract
A set of analytical models based on engineering beam analysis is developed to predict creep behavior of cellular materials over a broadrange of relative density. Model predictions, which take into account the presence of mass at strut nodes and consider different possibledeformation mechanisms and foam architectures, are compared to experimental creep results for a replicated nickel-base foam and areticulated aluminum foam. As porosity decreases, the controlling creep mechanism in the foams changes from strut bending, to strutshearing, and ultimately to strut compression.� 2008 Acta Materialia Inc. Published by Elsevier Ltd. All rights reserved.
Keywords: Creep; Foams; Porous materials; Sponges; Metallic foams
1. Introduction
The creep deformation of cellular materials (or foams) isimportant for load-bearing applications at high homologoustemperatures. For creep-resistant applications, metallicfoams are particularly interesting, since they have highercreep resistance and oxidation resistance than polymerfoams and higher toughness than ceramic foams. Mostmetallic foams studied to date are based on aluminum pro-duced by melt foaming [1–3]. Foam creep models have thusfocused mostly on low-density reticulated foams with orwithout cell walls [4–6]. Unlike aluminum foams, high-melt-ing metal foams cannot easily be produced by gas injection orgeneration in the melt, due to their high liquidus temperatureand reactivity. Rather, replication methods have been usedfor various high-melting alloys such as nickel-, iron-, andtitanium-base foams [7–12] as well as for aluminum withhigher relative densities than reticulated foams [13–15]:liquid metal is poured, or powders are densified, in the spacepresent within a partially densified preform of space-holder
1359-6454/$34.00 � 2008 Acta Materialia Inc. Published by Elsevier Ltd. All
doi:10.1016/j.actamat.2008.11.027
* Corresponding author. Tel.: +1 847 491 5370.E-mail address: [email protected] (D.C. Dunand).
powders (usually a salt or oxide) which are subsequentlyremoved to create porosity. Replicated foams thus showopen pores but they exhibit struts which are much less uni-form in cross-sectional area than those in reticulated foams:they are thick at their nodes and become progressively thin-ner toward their mid-points, reflecting the shape of the emptyspace between the contacting space-holder particles. Thus,replicated metal foams, with typically 30–85% open poros-ity, have an architecture intermediate between reticulatedfoams (with struts of uniform diameter connected by nodes,and with open porosities above �85%) and porous metals(consisting of distinct pores within a continuous matrix, withfully or partially closed porosities under �30%).
To date, research on creep of metallic foams has focusedon reticulated Al and Ni foams with porosity over �85%for which models have been developed considering thecompressive or bending deformation of struts with uniformcross-sections. Extending these models to higher relativedensity for replicated foams may be inadequate, since thestruts of these foams have non-uniform sections and lowaspect ratios, which may lead to combined compressionand bending deformation mechanisms or even new mecha-nisms such as shearing.
rights reserved.

1374 Y. Boonyongmaneerat, D.C. Dunand / Acta Materialia 57 (2009) 1373–1384
In the present work, we address this issue by developing aseries of analytical models to predict creep behavior of metal-lic foams over a broad range of porosity values and for var-ious strut geometries. This is achieved by modifying existingcreep models for high-porosity reticulated foams which arebased on bending [1,4] or compression [16] of uniform struts.Predictions of the modified models, which explicitly considerthe presence of mass at nodes as well as a range of deforma-tion mechanisms and foam architectures, are compared toexperimental foam creep results for a replicated nickel-basefoam reported here and an aluminum reticulated foamreported previously in the literature [4].
2. Creep models
2.1. Existing creep models
2.1.1. Beam analysis models
For a monolithic material, the secondary creep behaviormay be expressed by the power-law creep equation as
_es ¼ Arns exp
�QRT
� �¼ Krn
s ð1Þ
where _es is the uniaxial strain rate, A the creep constant, rs
the uniaxial stress, n the stress exponent, Q the creep acti-vation energy, R the gas constant, and T the temperature.The creep constant and the Arrhenius term in Eq. (1) areoften combined into a single parameter K = Aexp(�Q/
RT) for simplicity. For foams, the uniaxial stress andstrains are usually compressive.
Gibson and Ashby [1,4] developed a simple expressionfor uniaxial creep of an open-cell reticulated foam:
_e ¼ 0:6
nþ 2
1:7ð2nþ 1Þn
� �n
q�ð3nþ1Þ=2Krn ð2Þ
where _e and q are the foam strain rate and relative density,respectively. This expression is valid for open-cell foams
Fig. 1. Gibson–Ashby model (q = 0.04) shown (a) in three dimensions for unitparameters d and t.
whose repeat unit (which after mirroring produces a unitcell) consists of one node connecting three struts of uni-form cross-section (Fig. 1), and it assumes that deforma-tion of the structure is controlled solely by the creepbending of the strut perpendicular to the applied stress,with the two other struts parallel to the stress assumed tobe rigid. The expression is found to correspond generallywell with the creep behavior of reticulated Al foams ob-served experimentally [4]. We call this model (Eq. (2)) theGibson–Ashby bending (GA-b) model.
Hodge and Dunand [16] developed an alternativeexpression for the creep of foams, based on a different retic-ulated architecture. In their model, a node connects sixstruts (Fig. 2), so that struts perpendicular to the appliedstress are prevented from bending. Deformation is assumedto be solely due to the uniaxial compressive deformation ofstruts parallel to the applied stress and the foam strain rateis given by
_e ¼ q3
� ��nKrn ð3Þ
Eq. (3) generally predicts lower strain rate than Eq. (2) fora given relative density and stress exponent, especially atlow relative densities [16]. The relative density below whichthe foam strain rate in Eq. (3) is lower than that in Eq. (2)is �0.3 for n = 1, increasing for higher n values (�0.7 forn = 5). We call this model the Hodge–Dunand compression(HD-c) model.
Both GA-b and HD-c models were developed using theengineering beam analysis approach, which considers foamarchitectures coupled with some relevant deformationmechanisms. Their use is however limited to foams withlow relative densities (�0.2 and below), partly due to a ser-ies of simplifications made in deriving these equationswhich prevent the models to be justifiable at higher foamrelative density. In particular, in the GA-b model, it isassumed that the uniaxial force F, strain rate, and relative
cell (dark) and repeat unit (light) [21] and (b) in projection with geometric

Fig. 2. Hodge–Dunand model (q = 0.05) shown (a) in three dimensions for extended unit cell (dark) and unit cell (light) [21] and (b) in projection withgeometric parameters d and t.
Y. Boonyongmaneerat, D.C. Dunand / Acta Materialia 57 (2009) 1373–1384 1375
density are proportional to strut dimensions according toF / r � l2; _e / _d=l; and q / ðt=lÞ2, where _d is the rate ofdeflection of struts perpendicular to the uniaxial force,and t and l are, respectively, the thickness and length offoam struts. However, these approximations are accurateonly when struts are fairly slender at low relative densities.In the HD-b model, it is assumed that the mass at nodes issmall compared to that of the struts, so that the assump-tion that one third, rather than the totality, of the node vol-ume is load-bearing is acceptable. This approximationbecomes less and less valid as the relative density increases,because the node mass increases more rapidly than thestrut mass.
2.1.2. Composite analysis models
By utilizing the mean-field theory and simplifying thevariational estimates for non-linear composite deforma-tion, Mueller et al. developed an analytical expression forthe uniaxial steady state creep rate of metallic foams as[17]:
_e ¼ F �ð1þnÞ=2E q�ðn�1Þ=2Krn ð4Þ
where FE is the ratio of the Young’s modulus of foams andmonolithic materials, which may be expressed asF E ¼ AEqa, where AE is a fitting parameter typically closeto unity. For open-cell foams with low to intermediate rel-ative density (less than �0.5), the exponent is a � 2. Athigher relative densities, it was experimentally determinedas a � 1.2 [18]. For sintered powder-based materials withrelative density above �0.8, the value of a may be as lowas 0.3 [19]. The strain rate relationship obtained by Eq.(4) produces trends similar to those of the GA-b modelin the low-density range [17]. This mean-field (MF) modelwill be discussed in relation to other models based on beamanalysis in later sections.
2.2. Strut bending models based on the GA-type cell
In this section, we develop analytical expressions torefine the GA-b model (Eq. (2) and Fig. 1) by consideringexplicitly the presence of rigid nodes. We also considervariants of the model where shearing of horizontal strutsreplaces bending, and where compression of vertical strutscontributes to the overall deformation.
2.2.1. Modified bending mechanism
We follow here the same derivation presented in Ref. [4]with the same unit cell foam geometry of the original GA-bmodel but replace the strut total length l in the original der-ivation with the value d � t/2 (where d and t are, respec-tively, the strut half length and its thickness, as shown inFig. 1), thus taking explicitly into account the non-zerowidth of the nodes, given by the strut thickness t. Theresulting equation for _d, the rate of deflection for strutsperpendicular to the uniaxial load, is then
_d ¼ _es
nþ 2� ðd � t=2Þ2
t� 2nþ 1
n
� �n
� F ðd � t=2Þrs � t3
� �n
ð5Þ
Thus, it is assumed that nodes remain rigid while the fourhorizontal strut sections with length d � t/2 of the GA cellare deforming by creep bending, as illustrated in Fig. 3a.The foam remote strain rate and stress are related to the dis-placement rate and load through the dimensional arguments:
_e ¼ k1_d=ðd þ t=2Þ ð6Þ
F ¼ k2rðd þ t=2Þ2 ð7Þ
where k1 and k2 are dimensionless constants. These equa-tions are again similar to those used in Ref. [4], except thatthe strut length l is replaced with d� t/2. Furthermore, thethird assumption in the GA-b model concerning the rela-tive density (q / ðt=lÞ2) is replaced with a more complex

Fig. 3. Gibson–Ashby model shown in projection (a) for low relative density (q = 0.04); (b) for intermediate relative density (q = 0.30); (c) for highrelative density (q = 0.50). The possible deformation mechanism of this model is bending (GA-b0) or bending/compression (GA-bc) in (a), shearing (GA-s)or shearing/compression (GA-sc) in (b), and compression (GA-c) in (c), Volumes undergoing deformation are shaded dark grey for bending or shearing,and light grey for compression.
1376 Y. Boonyongmaneerat, D.C. Dunand / Acta Materialia 57 (2009) 1373–1384
equation (Eq. (A1) in Appendix A) relating relative densitywith the strut length 2d and width t. This equation can fur-ther be simplified into Eq. (A2), which defines the relativedensity of the foam as a function of a single parameter,the strut aspect ratio a = 2d/t. Introducing Eqs. (6), (7),and (A2) into Eq. (5), we obtain
_e¼ k1kn2
nþ2
ð2nþ1Þn
� �n
� a�1
2
� �2þn
� aþ1
2
� �2n�1" #
� _esrrs
� �n
ð8ÞThe values of the constants k1 and k2 (determined inAppendix B as k1 = 3.1 and k2 = 9.3 over a range of rela-tive density of 0–0.15) are introduced in Eq. (8) to give
_e¼ 3:1
nþ2
9:3 � ð2nþ1Þn
� �n
� a�1
2
� �2þn
� aþ1
2
� �2n�1" #
�Krn
ð9ÞThis equation is labeled ‘‘modified Gibson–Ashby bend-ing” (GA-b0) in the following, as it is a modified version
of Eq. (2) assuming bending of horizontal struts, but takinginto account explicitly the node size.
2.2.2. Shearing mechanism
In the GA-type models, as the strut aspect ratio decreaseswith increasing foam relative density, a possible alternativedeformation mechanism to bending for the horizontal strutis shearing. As illustrated in Fig. 3b, any pair of adjacentvertical rigid struts translating vertically towards each otheralong the direction of the applied stress can result in shear-ing of the horizontal strut connecting them, rather thanbending. To determine the strain rate for foams experienc-ing such deformation mechanism, we first consider the rela-tionship between shear strain rate _c and shear stress s:
_c ¼ K 0sn ¼ 3ðn�1Þ=2Ksn ð10Þwhere K0 is a constant and the pre-factor 3(n�1)/2 is derivedbased on Eq. (1) and the relationships between tensile andshear strain rates and stresses [20]. Based on foam geome-try, Eq. (10) may also be written as

Y. Boonyongmaneerat, D.C. Dunand / Acta Materialia 57 (2009) 1373–1384 1377
_dðd � t=2Þ ¼ 3ðn�1Þ=2K � F =2
t2
� �n
ð11Þ
Finally, we assume that _d and F relate, respectively, to_e and r through the relationships given in Eqs. (6) and(7). After introducing these equations in Eq. (11), the strainrate for the GA-s model deforming by strut shearing(Fig. 3b), rather than strut bending Fig. 3a), is given as
_e ¼ 1:8 � 8:1n a� 1
2
� �� aþ 1
2
� �2n�1" #
� Krn ð12Þ
This equation is labeled ‘‘Gibson–Ashby shear” (GA-s) inthe following.
2.2.3. Combined bending and compression mechanisms
In addition to bending of horizontal struts as discussedin Section 2.2.1, the assumption that vertical foam strutsare rigid can be relaxed. Then, the contribution of strutbending (Eq. (9)) and strut compression, which are inde-pendent of each other, can be added. First, we develop anexpression for the compressive strain rate of vertical struts,which is given by an equation similar to Eq. (3), modified totake into account more precisely the ratio of volume ofvertical struts and associated nodes deforming under com-pressive load (Vc) to the total volume of foam material (Vt),for the case of the unit cell of GA model (Fig. 1):
V c
V t¼
32dt2 þ 3
4t3
92dt2 þ t3
¼ 3aþ 3
9aþ 4ð13Þ
where Vc is calculated as the sum of the two vertical strutvolumes and half the volume of the two correspondingnodes in the repeat unit of Fig. 1. This ratio is assumed tobe 1/3 in the original HD-c model in Eq. (3). Since the areaunder compression is the total area of the unit cell divided byqVc/Vt, the stress exerted on the vertical foam struts (rv) is
rv ¼r
3aþ39aþ4
� �q
ð14Þ
Introducing this stress into Eq. (1), the resulting strain ratefor foam with a GA unit cell deforming solely by creepcompression of vertical struts is
_e ¼ 3aþ 3
9aþ 4� q
� ��n
Krn ð15Þ
Combining the above expression with the strain-rate con-tribution from the bending mechanism (Eq. (9)) gives
_e ¼ 3:1
nþ 2
9:3ð2nþ 1Þn
� �n
� a� 1
2
� �2þn
� aþ 1
2
� �2n�1" #"
þ 3aþ 3
9aþ 4� q
� ��n�� Krn ð16Þ
This equation is labeled ‘‘Gibson–Ashby bending/compres-sion” (GA-bc) in the following.
2.2.4. Combined shearing and compression mechanisms
Shearing of horizontal struts in GA-s model may becoupled with compression of vertical struts of foams. The
strain rate of such a system, experiencing independentlyshearing and compressive deformations, is found by com-bining Eqs. (12) and (15):
_e¼ 1:8 �8:1n a�1
2
� �� aþ1
2
� �2n�1" #
þ 3aþ3
9aþ4�q
� ��n" #
Krn
ð17ÞThis equation is labeled ‘‘Gibson–Ashby shearing/com-pression” (GA-sc) in the following.
2.3. Strut compression models based on the HD-type cell
In this section, we develop analytical expressions torefine the HD-c model (Eq. (3) and Fig. 2) by consideringmore accurately the contribution of creeping nodes andalso by examining the effect of mass concentration atnodes, both of which become more important when thefoam relative density increases.
2.3.1. Compression mechanism
The HD-c model (Eq. (3)) assumes that one third of thematerial in the foam deforms under compression. This cor-responds to one third of the struts (the vertical struts par-allel to the applied stress) and one third of the nodevolume. While the strut volume is exact, the node volumeis underestimated, because the whole node (rather thanonly one third of the node) is subjected to the compressivestress and creeping. Then, the foam strain rate in Eq. (3) isunderestimated, and the error increases with increasing rel-ative density. Similar to Section 2.2.3, we examine the ratioof the volume of vertical struts and node under compres-sive load (Vc) to the total volume of solid (Vt) in the HDunit cell (Fig. 2):
V c
V t¼ 2dt2 þ t3
6dt2 þ t3¼ aþ 1
3aþ 1ð18Þ
As before, the stress on the vertical struts and node is givenby rv = r/q(Vc/Vt), which is introduced into Eq. (1) togive the foam strain rate as
_e ¼ aþ 1
3aþ 1� q
� ��n
Krn ð19Þ
This equation converges to the original HD-c equation(Eq. (3)) as the strut aspect ratio a becomes large, i.e., whenthe node volume becomes negligible as compared to thestrut volume. This new equation is labeled ‘‘modifiedHodge–Dunand compression” (HD-c0) in the following.
2.3.2. Compression mechanism with concentrated mass atnodes
For foams such as those created by the replicationmethod, nodes exhibit larger cross-sections than struts,i.e., mass is concentrated at nodes. A highly simplifiedschematic for the new HD unit cell that exemplifies thisgeometry is shown in Fig. 4. Compared to the originalHD unit cell of the same volume fraction with a uniform

1378 Y. Boonyongmaneerat, D.C. Dunand / Acta Materialia 57 (2009) 1373–1384
size of strut and nodes, the cell with concentrated massat node exhibits a larger solid volume responsible forsustaining the vertical compressive load. For the ideal-ized geometry shown in Fig. 4, the ratio of the volumeof vertical struts and node under compressive load (Vc)to the total volume of solid (Vt) in the unit cell of thefoam structure is
V c
V t¼ 2eb2 þ c3
6eb2 þ c3¼ 2f 2 þ g
6f 2 þ gð20Þ
where b is the strut width, c the node width and e the strutlength (as shown in Fig. 4) and the parameters f and g aregiven as f = b/c and g = c/e; these parameters can also beexpressed as a function of the foam relative density andthe node volume fraction Vn, as given in Appendix A.Assuming that the ratio of areas under compression scaleswith the ratio of volumes under compression, the creep rateof this system is estimated as
_e ¼ Krnv ¼ Krn 2f 2 þ g
6f 2 þ g� q
� ��n
ð21Þ
This equation is labeled ‘‘Hodge–Dunand concentratedmass” (HD-cm) in the following. The above assumption– taking an average strut/node cross-sectional area –does not fully describe the creep of the cell shown inFig. 4 given the non-linear form of the creep law (Eq.(1)), but this geometry is in fact far from representativeof replicated foams. Thus, refining the model furtherwould necessitate specific information on the exact strutand node geometry, and would be more adequate for afinite-element model [21].
Fig. 4. Hodge–Dunand model (q = 0.05) with mass concentration atnodes (Vn = 0.75, f = b/c = 0.3, and g = c/e = 1.2) showing unit cell(white) and repeat unit (shaded) with geometric parameters b, c, and e.
2.4. Summary of analytical creep models
The various analytical relationships for creep behaviorsof metallic foams presented here are summarized in Table1. All creep equations in Table 1 predict that the foamstrain-rate sensitivities to stress (through the stress expo-nent n) and temperature (through the activation energyQ, included in K = Aexp(�Q/RT)) are equal to those ofthe monolithic material. However, the strain-rate sensitiv-ity to the foam relative density varies among models. It isthus possible to normalize the strain rate of the foam bythat of the monolithic material (Eq. (1)) to determine a fac-tor, dependent on strut geometry (strut aspect ratio a andnode parameters f and g) and relative density q, expressingthe increase in strain rate due to porosity at a given stressand temperature.
3. Experimental procedures
The nickel-base alloy J5 (Ni–22.5Mo–12.5Cr–1Ti–0.5Mn–0.1Al–0.1Y, in wt.%) was provided by the NationalEnergy Technology Laboratory (Albany, OR). This alloyhas a liquidus temperature of 1350 �C and was developedfor solid-oxide fuel cell interconnects [22,23]. A J5 ingotwas placed on top of a partially sintered preform of sodiumaluminate space-holder powders (sieved to 355–500 lm,purchased from Alfa Aesar) within a 20 mm-ID crucible,which was heated to 1450 �C under vacuum. Argon at0.08 MPa pressure was then introduced in the furnace,which forced the melt into the evacuated pores of the pre-form. The solidified composite ingot was then machinedinto 8 � 4 � 4 mm3 specimens from which the space-holderwas subsequently leached in an aqueous 10% HCl solution.The resulting foams were homogenized at 1100 �C for 4 hunder argon, and annealed at 850 �C in air for 4 h, withwater-quenching terminating each step. Monolithic J5specimens were also machined and heat-treated similarlyto the foams. Further processing details are given in Ref.[12].
Constant-load compression creep tests were performedin air at 850 �C in a creep frame with strain measured con-tinuously by a linear voltage displacement transducer to anaccuracy of ±2 lm. The secondary creep strain rate wasdetermined from the slope of strain–time plots and eachspecimen was subjected to a series of increasing stressesin the range of �10–100 MPa until accumulated strainsof 0.1 and 0.3 had been reached in the foam and monolithicspecimens, respectively.
4. Results
4.1. Analytical results
Considering first the GA unit cell, the foam strain rate,after normalization by the strain rate of the monolithicmaterial, is plotted in Fig. 5 for a typical creep exponent(n = 3) as a function of relative density for the various
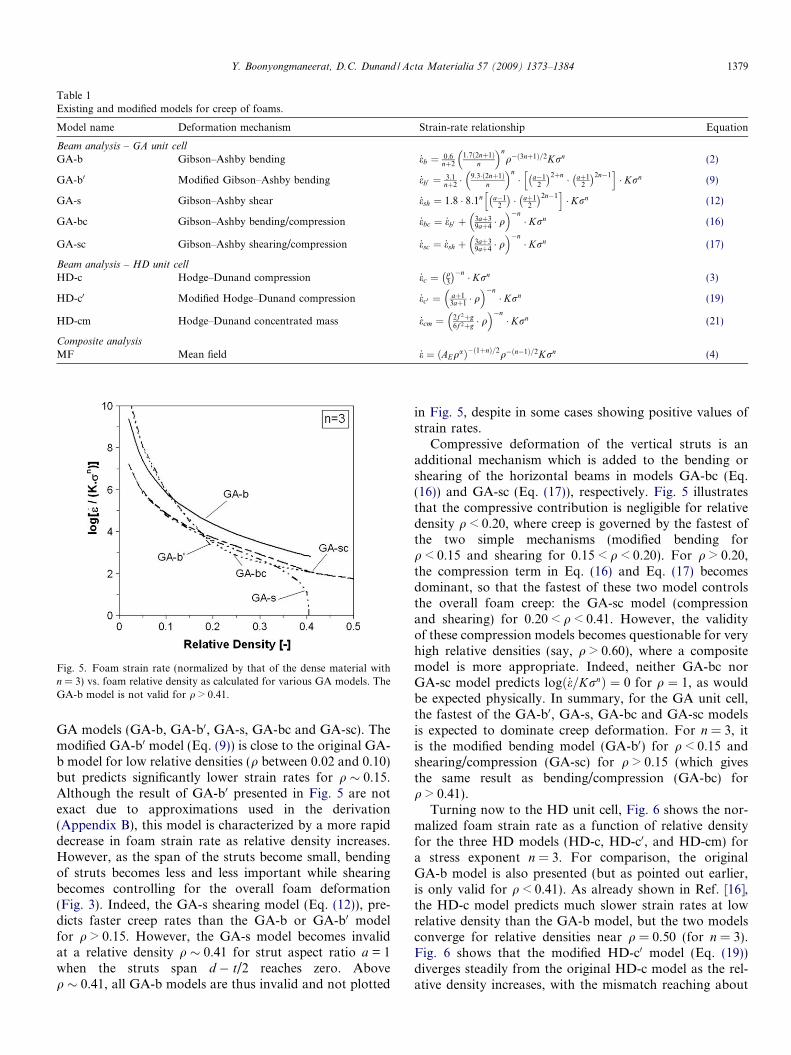
Table 1Existing and modified models for creep of foams.
Model name Deformation mechanism Strain-rate relationship Equation
Beam analysis – GA unit cell
GA-b Gibson–Ashby bending _eb ¼ 0:6nþ2
1:7ð2nþ1Þn
� �nq�ð3nþ1Þ=2Krn (2)
GA-b0 Modified Gibson–Ashby bending _eb0 ¼ 3:1nþ2 �
9:3�ð2nþ1Þn
� �n� a�1
2
� �2þn � aþ12
� �2n�1h i
� Krn (9)
GA-s Gibson–Ashby shear _esh ¼ 1:8 � 8:1n a�12
� �� aþ1
2
� �2n�1h i
� Krn (12)
GA-bc Gibson–Ashby bending/compression _ebc ¼ _eb0 þ 3aþ39aþ4 � q� ��n
� Krn (16)
GA-sc Gibson–Ashby shearing/compression _esc ¼ _esh þ 3aþ39aþ4 � q� ��n
� Krn (17)
Beam analysis – HD unit cell
HD-c Hodge–Dunand compression _ec ¼ q3
� ��n � Krn (3)
HD-c0 Modified Hodge–Dunand compression _ec0 ¼ aþ13aþ1 � q� ��n
� Krn (19)
HD-cm Hodge–Dunand concentrated mass _ecm ¼ 2f 2þg6f 2þg � q� ��n
� Krn (21)
Composite analysis
MF Mean field _e ¼ AEqað Þ�ð1þnÞ=2q�ðn�1Þ=2Krn (4)
Fig. 5. Foam strain rate (normalized by that of the dense material withn = 3) vs. foam relative density as calculated for various GA models. TheGA-b model is not valid for q > 0.41.
Y. Boonyongmaneerat, D.C. Dunand / Acta Materialia 57 (2009) 1373–1384 1379
GA models (GA-b, GA-b0, GA-s, GA-bc and GA-sc). Themodified GA-b0 model (Eq. (9)) is close to the original GA-b model for low relative densities (q between 0.02 and 0.10)but predicts significantly lower strain rates for q � 0.15.Although the result of GA-b0 presented in Fig. 5 are notexact due to approximations used in the derivation(Appendix B), this model is characterized by a more rapiddecrease in foam strain rate as relative density increases.However, as the span of the struts become small, bendingof struts becomes less and less important while shearingbecomes controlling for the overall foam deformation(Fig. 3). Indeed, the GA-s shearing model (Eq. (12)), pre-dicts faster creep rates than the GA-b or GA-b0 modelfor q > 0.15. However, the GA-s model becomes invalidat a relative density q � 0.41 for strut aspect ratio a = 1when the struts span d � t/2 reaches zero. Aboveq � 0.41, all GA-b models are thus invalid and not plotted
in Fig. 5, despite in some cases showing positive values ofstrain rates.
Compressive deformation of the vertical struts is anadditional mechanism which is added to the bending orshearing of the horizontal beams in models GA-bc (Eq.(16)) and GA-sc (Eq. (17)), respectively. Fig. 5 illustratesthat the compressive contribution is negligible for relativedensity q < 0.20, where creep is governed by the fastest ofthe two simple mechanisms (modified bending forq < 0.15 and shearing for 0.15 < q < 0.20). For q > 0.20,the compression term in Eq. (16) and Eq. (17) becomesdominant, so that the fastest of these two model controlsthe overall foam creep: the GA-sc model (compressionand shearing) for 0.20 < q < 0.41. However, the validityof these compression models becomes questionable for veryhigh relative densities (say, q > 0.60), where a compositemodel is more appropriate. Indeed, neither GA-bc norGA-sc model predicts logð_e=KrnÞ ¼ 0 for q ¼ 1, as wouldbe expected physically. In summary, for the GA unit cell,the fastest of the GA-b0, GA-s, GA-bc and GA-sc modelsis expected to dominate creep deformation. For n = 3, itis the modified bending model (GA-b0) for q < 0.15 andshearing/compression (GA-sc) for q > 0.15 (which givesthe same result as bending/compression (GA-bc) forq > 0.41).
Turning now to the HD unit cell, Fig. 6 shows the nor-malized foam strain rate as a function of relative densityfor the three HD models (HD-c, HD-c0, and HD-cm) fora stress exponent n = 3. For comparison, the originalGA-b model is also presented (but as pointed out earlier,is only valid for q < 0.41). As already shown in Ref. [16],the HD-c model predicts much slower strain rates at lowrelative density than the GA-b model, but the two modelsconverge for relative densities near q = 0.50 (for n = 3).Fig. 6 shows that the modified HD-c0 model (Eq. (19))diverges steadily from the original HD-c model as the rel-ative density increases, with the mismatch reaching about

Fig. 6. Foam strain rate (normalized by that of the dense material withn = 3) vs. foam relative density as calculated for various HD models. Alsoshown is the GA-b model, to help comparison with Fig. 5, which ishowever invalid for q > 0.41, where it is plotted as a dotted line.
1380 Y. Boonyongmaneerat, D.C. Dunand / Acta Materialia 57 (2009) 1373–1384
one order of magnitude at full density q = 1, where themodified HD-c0 model correctly predicts the creep responseof the monolithic material (i.e., logð_e=KrnÞ ¼ 0Þ. Whenconcentrated mass at the node is considered (HD-cmmodel, Eq. (21)), the foam creep rate is further decreasedas shown in Fig. 6. In this particular example, g = 18f2, giv-ing a node volume fraction of Vn = 0.75 (Eq. (A5)) and astrut volume fraction of 0.25, as well as a ratio Vc/Vt = 0.83 (from Eq. (20)).
4.2. Experimental results
The replicated J5 foam specimens exhibited a density of4.0 g cm�3, corresponding to an open porosity of 54%(q = 0.46). Fig. 7 shows the microstructure of the foam
Fig. 7. Metallographic cross-section of open-cell J5 foam processed bycasting replication of sodium aluminate performs. The foam exhibits adensity of 4.0 g cm�3 corresponding to an open porosity of 54%(q = 0.46).
which exhibits pore-free struts and nodes, unlike replicatedfoams produced by powder metallurgy [11]. There is thusno closed porosity. While it is difficult to ascertain from2D micrographs whether the structure of this replicatedfoam is closer to the GA or the HD cells, concentratedmass at nodes is clearly observed in the structure, distin-guishing the replicated foam structure from those of theidealized GA and HD cells with uniform struts.
Fig. 8 shows a rectangular J5 foam specimen employedin the creep experiment, along with examples of compres-sive strain–time plots obtained from the tests performedon foam specimens. Fig. 9 presents a double logarithmicplot of the strain rate vs. applied stress for J5 foams andmonolithic J5 at 850 �C. As anticipated, the solid J5 exhib-ited much lower strain rates than the J5 foams, at a givenstress. Two creep regimes exist, each with a similar stressexponent for each material. At low strain rates(_e < 5� 10�8 s�1), the stress exponent is low (n = 1.7 and1.2 for foam and monolith, respectively), while at highstrain rates (_e > 5� 10�8 s�1), it is high (n = 3.8 and 3.3,respectively). The average strain exponents of the materialsare thus estimated as 1.5 and 3.5.
5. Discussion
The various creep models developed in the present studyare based on the two GA and HD unit cells (Figs. 1 and 2).While all of these newly derived models predict monotoni-cally decreasing trend of creep rates with increasing foamrelative density, the magnitude of the creep rate predictedby individual models varies widely. Generally, the mecha-nism (or combined mechanisms) predicting, at a givenfoam relative density, the fastest foam creep rate can beassumed to be dominant. These mechanisms are comparedin the following discussion for three ranges of foam relativedensity (low, intermediate and high) and compared toexperimental foam creep data.
Fig. 8. Plot of strain vs. time for J5 foams subjected to compressivestresses of 20 and 36 MPa. Relative densities are 0.46 and 0.47,respectively. The inset presents an example of replicated J5 foamspecimens (8 � 4 � 4 mm3) used in creep testing.

Fig. 9. Foam strain rate vs. applied stress as predicted by various HDmodels for q = 0.46 and stress exponents n = 1 and 3 (at low and highstress), using the experimental creep data for monolithic J5 for the creepconstant K at 850 �C. Also shown are experimental creep data for thereplicated J5 foam with q = 0.46, which are bracketed by predictions fromthe HD-c0 and HD-cm models (same parameters as in Fig. 4).
Y. Boonyongmaneerat, D.C. Dunand / Acta Materialia 57 (2009) 1373–1384 1381
5.1. Low relative density (q < 0.20)
As shown in Fig. 10 for n = 4, the original GA-b model(Eq. (2)) and the composite MF model (Eq. (4)) have beenreported to be in general agreement with experimentalcreep rates of aluminum foams with low relative density(q = 0.06–0.14) [4,17]. This figure shows that, at low rela-tive density, for the range 0.05 < q < 0.15, the modifiedGA-b0 model predicts creep rates within a factor of 4 tothe original GA-b model. Fig. 10 also shows that theGA-b0 model predicts higher creep rate than the GA-smodel, for which strut bending is replaced by shearing,
Fig. 10. Foam strain rate (normalized by that of the dense material withn = 4) vs. foam relative density as calculated for the GA-b, GA-b0, GA-sand MF models. Experimental data for Al foams measured in compres-sion at 275 �C are also plotted [4].
indicating that the latter mechanism is not dominant forlow relative densities. Considering the additional contribu-tion provided by the compression of the vertical struts hasa negligible effect at these low relative densities, i.e., theGA-bc and GA-b0 models overlap, as do the GA-sc andGA-s models (Figs. 5 and 10). The experimental creep datafalls between the GA-s and the GA-b0 (or equivalently GA-b) models, which may indicate that the struts creep by amixture of bending and shear, or more likely that theydeform by one, the other or both mechanism in differentlocations of the foam, depending on their exact orientationwith respect to the applied stress. The MF model also givessatisfactory agreement with the data. As expected, the strutcompression models HD-c, HD-c0 and HD-cm models arenot operative, and they all predict much lower strain ratesthan observed experimentally, i.e., by about two orders ofmagnitude as compared to the GA-b0 model.
5.2. Intermediate relative density (0.20 < q < 0.40)
In this range of relative density, the GA-s model whichis governed by the shearing mechanism predicts higherstrain rates than GA-b0, and does not break down untilq � 0.41 (Fig. 5). When compression of vertical struts isconsidered to occur concurrently with shearing of the hor-izontal struts, resulting in the GA-sc model, the predictedcreep rate is increased slightly. Furthermore, comparingthe GA-s (or GA-sc) model with the GA-bc model withstrut bending and compression, the latter model predictsslightly lower creep rates (Fig. 5). From these observations,it may be concluded that, at intermediate foam relativedensities (0.20 < q < 0.40), shearing has replaced bendingas the controlling mechanism for creep of foams that exhi-bit GA-type structure. The range of densities where this istrue varies with the value of the stress exponent (n = 3 isused in Fig. 5).
Comparing Figs. 5 and 6, it is apparent that the twoHD-c and HD-c0 models with cells deforming exclusivelyby strut compression predicts creep rates within a factorof two of those calculated with the GA-s, GA-sc andGA-bc models in the intermediate relative density rangeand for n = 3, despite very different cell architectures. Onlywhen mass is concentrated at nodes are creep rates signifi-cantly slower (i.e., by a factor of seven when comparingmodels HD-cm and HD-c0 in Fig. 6 in the range0.20 < q < 0.40), as expected from the increase of load-bearing mass within the cells.
5.3. High relative density (q > 0.40)
At high relative density, foams with the GA-type geom-etry creep solely by compression of their vertical struts withlow aspect ratio. Specifically, as shown in Fig. 5, both theGA-bc and GA-sc model give near identical creepresponses for q > 0.40, while the GA-b0 and GA-s modelsbreak down in this density range. Despite the differencein foam architectures, the HD-c0 model also predicts almost

1382 Y. Boonyongmaneerat, D.C. Dunand / Acta Materialia 57 (2009) 1373–1384
exactly the same creep rate as the GA-bc and GA-sc mod-els (Figs. 5 and 11). This is because in both cases, only ver-tical struts are deforming and both models have similarvolume fraction of vertical struts.
In this regime of high relative densities, as for intermedi-ate foam relative densities, the HD-cm model (with massconcentrated at nodes as typically exhibited by replicatedfoams) predicts lower strain rate than the HD-c0 model.This, again, illustrates how the foam architecture can influ-ence the creep response despite the fact that the deforma-tion mode and relative density are unchanged. Thecomposite MF model (Eq. (4)) with a = 1.2 is also pre-sented in Fig. 11 and its predictions are close to those ofthe HD-cm model, despite very different approaches andassumptions.
Fig. 11 also compares the various creep model predic-tions with the experimental measurements for the J5 foamsat high strain-rate regime (n = 3.5). There is a reasonable fitwith the HD-cm model, and also with the composite MFmodels (Eq. (4)), with a between 1.2 and 2. The resultstherefore illustrate the significant influence of mass concen-tration at nodes in terms of improving foam creep resis-tance. Thus, despite the highly idealized nature of theabove model, they seem to capture the essence of the creepbehavior of replicated foams, which exhibit relatively highporosity with irregular node structures.
In closing, we note that while the analytical modelsdeveloped here are discussed in the context of metallicfoams, they are equally applicable to other creeping porousmaterials, including polymer and ceramic foams.
6. Conclusions
Analytical models for the creep of cellular materialsbased on engineering beam analysis have been derived forvarious possible deformation mechanisms and strut archi-
Fig. 11. Foam creep rate (normalized by that of the dense material withn = 3.5) vs. foam relative density as calculated for the GA-bc, HD-c, HD-c0, HD-cm, and MF models. Also shown is experimental data for J5 foam(for n � 3.5).
tectures, based on two cell architectures previously studiedby Gibson and Ashby and by Hodge and Dunand, respec-tively. Some important assumptions postulated by the ori-ginal models, including negligible mass at nodes, have beenrelaxed, so that the models developed here are more accu-rate and valid up to higher relative density values.
For a typical stress exponent n � 3, bending of struts isfound to control the creep response for foams with low rel-ative density (up to �0.20), while shearing is the dominantmechanism for relative densities between �0.20 and �0.40.The GA-b0 and GA-s models may be used to predict thecreep of foams in these two relative density regimes, respec-tively. When relative density exceeds �0.40, compressivecreep of strut is dominant, and the GA-sc, GA-bc, andHD-c0 models equivalently describe the creep behavior.For these high relative density foams, non-uniform strutcross-section and mass concentration at nodes may occur,and these can further decrease the foam creep rate, asdescribed in the HD-cm model which is in agreement withexperimental result on Ni-base replicated foams.
Acknowledgements
The authors acknowledge Dr. P.D. Jablonski (NETL)for supplying the J5 alloy, and Dr. R. Bhat (GE Global Re-search Center), Dr. J.D. DeFouw, and J.A. Scott (North-western University) for useful discussions. This researchwas supported by NASA through a subcontract from theGeneral Electric Company (award NNC06CB31C). Y.B.also acknowledges Chulalongkorn University for theGrant for Development of New Faculty Staff (1/2008).
Appendix A
A.1. Determining a(q) for the GA cell
The relative density q of the GA cell shown in Fig. 1 canbe calculated by considering the volume fractions of strutsand nodes as
q ¼92t2d þ t3
ð2d þ tÞ3ðA1Þ
where d is the strut half length and t is the strut (or node)thickness, as shown in Fig. 1. This equation can be rewrit-ten solely as a function of the strut aspect ratio a = 2d/t as
q ¼94aþ 1
a3 þ 3a2 þ 3aþ 1ðA2Þ
Solving the resulting cubic equation for the aspect ratio a
gives
a ¼ 1
2q� m1=3 þ 3
2m1=3� 1 ðA3Þ
where the parameter m is
m ¼ �5þffiffiffiffiffiffiffiffiffiffiffiffiffiffiffiffiffiffiffiffiffiffiffiffiffið25� 27=qÞ
p� �� q2 ðA4Þ

Fig. B1. Plot of relative strength rry
(calculated from Eq. (B2)) and the
factor a�12
� �� aþ1
2
� �2h i�1
(calculated from Eq. (A3)) for a set of equally
spaced relative density values between 0 and 0.15. A near linearrelationship exists, with an average proportionality factor of 0.054 leadingto Eq. (B3).
Y. Boonyongmaneerat, D.C. Dunand / Acta Materialia 57 (2009) 1373–1384 1383
A.2. Determining f(q,Vn) and g(f, Vn) for the HD model
The parameters f and g are defined as ratios f = b/c andg = c/e, where the dimensions b, c, and e are given in Fig. 4.A relationship between f and g is found by considering thevolume fraction of nodes, Vn:
V n ¼c3
c3 þ 6b2e¼ 1
1þ 6f 2
g
� � ðA5Þ
Then, the parameter g can be expressed as
g ¼ 6f 2
1V n� 1
� � ðA6Þ
The values of f and g are also related through the volumefraction of a HD-cm unit cell as
q ¼ 6eb2 þ c3
ðcþ 2eÞ3ðA7Þ
This equation can be rewritten as a function of the ratios f
and g as
q ¼ 6f 2g2 þ g3
8þ 12g þ 6g2 þ g3ðA8Þ
The parameters f and g, for a given foam relative density qand node volume fraction Vn, are determined by solvingthe cubic equation (A8) and using the relationship in Eq.(A6). This gives
f ¼ ðV n � 1Þððq2V 2nÞ
1=3 þ qV nððq2V 2nÞ�1=3 þ 1ÞÞ
3V nðqV n � 1Þ
!1=2
ðA9Þ
g ¼ 6V nððq2V 2nÞ
1=3 þ qV nððq2V 2nÞ�1=3 þ 1ÞÞ
ð1� qV nÞðA10Þ
Fig. B2. Plot of relative modulus EEs
(given by Eq. (B5)) and the factor
a�12
� �3 � aþ12
� �h i�1
(calculated from Eq. (A3)) for a set of equally spaced
relative density values between 0 and 0.15. The average proportionalityfactor is 0.035 leading to Eq. (B6).
Appendix B
To determine the values of the constants k1 and k2 in Eq.(8), we first consider the limit of n ?1 and use the yieldstress ry for rs. This gives
1 ¼ 2k2 �a� 1
2
� �� aþ 1
2
� �2
� rry
ðB1Þ
Next, we find a relationship between the term
a�12
� �� aþ1
2
� �2h i�1
and the relative strength rry
, based on the
semi-empirical strength–density relationship proposed byGibson and Ashby [1]:
rry� 0:3q3=2 ðB2Þ
Fig. B1 shows the monotonically increasing relationship ofthe a-containing term with respect to the relative strength,with the individual data points calculated from a set ofequally spaced relative density values between 0 and 0.15.To estimate the relation between the two parameter sets,
a slope of any two adjacent data points in Fig. B1 is calcu-lated and the average slope is determined. From this, weobtain
rry� 0:054
a�12
� �� aþ1
2
� �2ðB3Þ
From Eqs. (B1) and (B3), k2 is thus determined to be 9.3.Similarly, k1 is determined by considering Eq. (8) at the
other limit, n = 1, with r=_e being replaced by E, the foamYoung’s modulus, and rs=_es replaced by Es, the monolithicYoung’s modulus. The equation reduces to

1384 Y. Boonyongmaneerat, D.C. Dunand / Acta Materialia 57 (2009) 1373–1384
Es
E¼ k1k2
a� 1
2
� �3
� aþ 1
2
� �ðB4Þ
We then find a relationship between the term
a�12
� �3 � aþ12
� �h i�1
and EEs
, based on the semi-empirical modu-
lus–density relationship suggested by Gibson and Ashby [1]:
EEs� q2 ðB5Þ
Fig. B2 shows how the relative modulus relates to the a-containing term in Eq. (B4). A similar procedure as usedabove for relative strength is employed, and this resultsin a relation between the relative modulus and the seconda-containing term given by
EEs� 0:035
a�12
� �3 � aþ12
� � ðB6Þ
Introducing Eq. (B6) into Eq. (B4), it follows that k1 = 3.1.
References
[1] Gibson LJ, Ashby MF. Cellular solids. Cambridge, UK: CambridgeUniversity Press; 1997.
[2] Banhart J. Prog Mater Sci 2001;46:559.[3] Korner C, Singer RF. Adv Eng Mater 2000;2:159.
[4] Andrews EW, Gibson LJ, Ashby MF. Acta Mater 1999;47:2853.[5] Andrews EW, Huang JS, Gibson LJ. Acta Mater 1999;47:2927.[6] Andrews EW. Mater Lett 2006;60:618.[7] Quadbeck P, Kaschta J, Singer RF. Adv Eng Mater 2004;6:635.[8] Bram M, Stiller C, Buchkremer HP, Stover D, Baur H. Adv Eng
Mater 2000;2:196.[9] Esen Z, Bor S. Scr Mater 2007;56:341.
[10] Brothers AH, Scheunemann R, DeFouw JD, Dunand DC. Scr Mater2005;52:335.
[11] Bansiddhi A, Dunand DC. Intermetallics 2007;15:1612.[12] Boonyongmaneerat Y, Dunand DC. Adv Eng Mater 2008;10:379.[13] Despois JF, Marmottant A, Salvo L, Mortensen A. Mater Sci Eng A
2007;462:68.[14] Marchi CS, Mortensen A. Acta Mater 2001;49:3959.[15] Zhao YY, Sun DX. Scr Mater 2001;44:105.[16] Hodge AM, Dunand DC. Metall Mater Trans A 2003;34:2353.[17] Mueller R, Soubielle S, Goodall R, Diologent F, Mortensen A. Scr
Mater 2007;57:33.[18] Hakamada M, Asao Y, Kuromura T, Chen Y, Kusuda H, Mabuchi
M. Acta Mater 2007;55:2291.[19] German RM. Sintering theory and practice. New York (NY): John
Wiley & Sons, Inc.; 1996.[20] Frost HJ, Ashby MF. Deformation-mechanism maps: the plastic-
ity and creep of metals and ceramics. Oxford: Pergamon Press;1982.
[21] Oppenheimer SM, Dunand DC. Acta Mater 2007;55:3825.[22] Jablonski PD, Alman DE. Int J Hydrogen Energy 2007;32:
3705.[23] Geng SJ, Zhu JH, Lu ZG. Scr Mater 2006;55:239.