Effects of Soil Erosion on Soil Properties as Related to … of Soil Erosion on Soil Properties as...
23
Effects of Soil Erosion on Soil Properties as Related to Crop Productivity and Classification W. Em Larson University of Minnesota St. Paul, Minnesota T. E. Fenton Io wa State University Ames, Iowa Em La Skidmore Agricultural Research Service U. S. Department of Agriculture Man hattan, Kansas C. Ma Benbrook National Academy of Sciences Washington, DC Soil erosion is the detachment and movement by wind or water of soil particles from their place of origin. Soil productivity is the capacity of a soil, in its normal environment, to produce a particular plant or sequence of plants under a specified management system. Productivity is generally ex- pressed in terms of yields. Two recent committee reports (The National Soil Erosion-Soil Produc- tivity Research Planning Committee, 1981 ; Council for Agricultural Science and Technology, 1982) have discussed in detail the soil erosion and soil pro- ductivity problem. Their discussions will not be reported here. Whether it is called the topsoil, surface soil, A horizon, or epipedon, the part of the soil affected first by erosion is the surface few centimeters, which is generally highest in organic matter and plant nutrients. Published in R. F. Follett and B. A. Stewart, ed. 1985. Soil Erosion and Crop Productivity. O ASA-CSSA-SSSA, 677 South Segoe Road, Madison, WI 53711, USA. 189
Transcript of Effects of Soil Erosion on Soil Properties as Related to … of Soil Erosion on Soil Properties as...

Effects of Soil Erosion on Soil Properties as Related to Crop Productivity and Classification W. Em Larson University of Minnesota St. Paul, Minnesota
T. E. Fenton Io wa State University Ames, Iowa
Em La Skidmore Agricultural Research Service U. S. Department of Agriculture Man hattan, Kansas
C. Ma Benbrook National Academy of Sciences Washington, DC
Soil erosion is the detachment and movement by wind or water of soil particles from their place of origin. Soil productivity is the capacity of a soil, in its normal environment, to produce a particular plant or sequence of plants under a specified management system. Productivity is generally ex- pressed in terms of yields.
Two recent committee reports (The National Soil Erosion-Soil Produc- tivity Research Planning Committee, 1981 ; Council for Agricultural Science and Technology, 1982) have discussed in detail the soil erosion and soil pro- ductivity problem. Their discussions will not be reported here.
Whether it is called the topsoil, surface soil, A horizon, or epipedon, the part of the soil affected first by erosion is the surface few centimeters, which is generally highest in organic matter and plant nutrients.
Published in R. F. Follett and B. A. Stewart, ed. 1985. Soil Erosion and Crop Productivity. O ASA-CSSA-SSSA, 677 South Segoe Road, Madison, WI 5371 1, USA.
189
190 LARSON, FENTON, SKIDMORE, BENBROOK
This article reviews the effects of erosion on soil properties, how these changes in properties can cause problems in classification and mapping, the effects of erosion on hydraulic properties, and the relation of soil properties to productive potential.
12-1 DESCRIPTION OF SOILS
Twelve soil profiles representing eight soil series were selected from the Soil Conservation Service's current listing of benchmark soils of the USA for discussion here. They were selected to provide a range of soils used for row-crop production and subject to water erosion. The soils and some selected information are listed in Table 12-1.
12-1.1 Mollisols
A property common to all Mollisols is the presence of a relatively thick, dark-colored, humus-rich horizon or horizons in which bivalent cations are dominant on the exchange complex. In soils with sola that are 76 cm or greater thick, the mollic epipedon must be 25 cm or more thick to be classi- fied as a Mollisol. Many sloping Mollisols used for intensive row-crop production have dark-colored surface horizons which erosion has decreased in thickness. The Seymour and Marshall profiles discussed in this paper illustrate the problem associated with these soils (Table 12-2).
Table 12-1. Classification, erosion factors, and organic matter contnet of selected soil series.t
Soil series Classification
Erosion factors Organic
K T matter
To Mollisols
Seymour
Marshall
Tillman
Alfisols Fayette
Grenada
Ultisols Cecil
Tifton
Fullerton
Fine, montmorillonitic, mesic, Aquic Argiudoll(3 profiles)
Fine-silty, mixed, mesic, Typic Hapludoll(3 profiles)
Fine, mixed, thermic, Typic Paleustoll
Fine-silty, mixed mesic, Typic Hapludalf
Fine-silty, mixed, thermic, Glossic Fragiudalf
Clayey, kaolinitic, thermic, Typic Hapludult
Fine-loamy, siliceous, thermic Plenthic Paleudult
Clayey, kaolinitic, thermic Typic Paleudult
1- Data from Soil Interpretation Record of named series, Soil Conservation Service.
SOIL EROSION AND SOIL PROPERTIES 191
Table 12-2. Selected properties of slightly (s.e.) and moderately eroded (m.e.) Seymour and Marshall soils. t
Surface horizon Subsurface horizon
Color Depth to:
B/A/ Clay Clay O.C. D.B. pH clay
Soil moist dry 0.C.S Depth max. D.B.9 max. >0.58 r 1.5 56.0 ratio
value/chroma % cm % Mg/m3 cm
Seymour (93-6)s.e. 3/1 5/1 2.06 28.0 22.5 1.33 65.0 71.0 114.0 91.0 2.27 (93-5)m.e. 3/1 5/1 1.68 15.0 33.0 1.37 29.0 36.0 81.0 64.0 1.46 (93-4)m.e. 3/1 5.4/1 1.77 15.0 27.6 1.36 39.0 25.0 48.0 81.0 1.63
Marshall
% of max
C
9'0
7 Data from Soil Survey Investigation Report 3 1. USDA-SCS. $ Organic carbon. 9 Bulk density.
12-1.1.1 Seymour Series
The Seymour soils were sampled in a transect within a total distance of 46 m on 2 to 5070 slope gradients. Profile 93-6 was on an interfluve summit, 93-4 was on a sideslope, and 93-5 was on a less stable interfluve summit. Profile 93-6 classifies as an Aquic Argiudoll. The other profiles have a mollic epipedon that is 15 cm thick and qualify as Udollic Ochraqualfs rather than Mollisols (USDA, 1975). In soil-survey field operations, they are correlated as taxadjuncts of the Seymour series. Trends shown in Table 12-2 for the eroded Seymour profiles compared to the slightly eroded pro- file are decreasing thickness of mollic epipedon, decreasing organic carbon content in the surface horizon and profile, increasing clay content in the surface horizon, greater bulk density, shallower depth to the clay maxi- mum, shallower depth to less than 0.58% organic carbon, and bulk density equal to or greater than 1.5 Mg/m3. The maximum clay percentage in the profile also decreases. However, the thickness of the zone of 40% or more clay is quite similar-43 cm for 93-6 and 48 cm for 93-4 and 93-5. The argillic horizons in these soils are considered limiting to plant root growth.
12-1.1.2 Marshall Series
Marshall soils were also sampled in a transect approximately 100 m long. The data in Table 12-2 for these soils have trends similar to those for Seymour soils. The three Marshall profiles qualify as Mollisols, but profile 15-3 has the minimum thickness of mollic epipedon required, 25 cm. All have a cambic horizon. Marshall soils have more organic carbon, lower bulk densities in the subsurface horizons, and better natural drainage than Seymour soils.

192 LARSON, FENTON, SKIDMORE, BENBROOK
12-1.1.3 Tillman Series
This extensive series occurs in Texas and Oklahoma. These are deep, well-drained, slowly permeable soils formed in clayey alluvium derived from redbed clays and shales. Slopes range from 0 to 5%. The A horizon is silty clay loam or clay loam. The Bt horizon is clay or clay loam ranging from 35 to 55% clay. The subsoil extends to depths below 200 cm. Calcium carbonate in some form is usually present in the lower part of the B horizon.
12-1.2 Alfisols
12-1.2.1 Fayette Series
Fayette soils, formed under forest vegetation, have a thin (15 cm or less), dark-colored, surface horizon underlain by a lighter-colored E hori- zon. Before cultivation, a thin zone of partially decomposed organic ma- terial is commonly present on the surface. Cultivation mixes these materials with the surface and E horizon, resulting in an Ap horizon with composite properties. Table 12-3 documents some of these changes. Compared to the moderately eroded sites, the color of the surface horizons of the slightly eroded profiles is darker, an E horizon is present, depth to the argillic (Bt) horizon is greater, clay content in the upper 33 to 38 cm is less, and organic- carbon content is higher.
Table 12-3. Characteristics of eroded phases of Fayette soils, 5 to 9% slopes.
Color Thick- Organic
Location Erosion Horizon ness lOYR Clay carbon
Illinois t slight A1 El E2 Btl Bt2
slight A1 E Btl Bt2
moderate AP Btl Bt2 Bt3
moderate AP
severe AP
value/ chroma
t Data from Soil Survey Investigation Report 19. USDA-SCS. $ Data from Soil Survey Investigation Report 3 1. USDA-SCS.

SOIL EROSION AND SOIL PROPERTIES
12-1.2.2 Grenada Series
Grenada soils formed in loess and have a fragipan at a depth of about 60 cm. As indicated by the classification in Table 12-1, the texture of' these soils is similar to Fayette soils, but these soils differ by having a fragipan and a thermic temperature regime. Similar trends to those listed for Fayette soils are expected as the degree of erosion increases. However, rooting volume becomes more limiting as erosion decreases the depth to the fragi- pan.
Accelerated erosion does not affect the taxonomic classification of Fayette or Grenada soils since the A and E horizons are not diagnostic horizons for Alfisols.
12-1.3 Ultisols
As a group these soils have a horizon or horizons with an accumulation of translocated silicate clays but few bases. The release of bases by weather- ing is usually equal to or less than the removal by leaching. Most of the bases are held in the vegetation and the upper 20 to 30 cm of the soil. Base saturation normally decreases with depth and is less than 35% (by sum of cations) at specified depths, depending on the sequence of horizons present in a profile. Also, in an uneroded state, most Ultisols have an E horizon.
These soils are extensive in the southeastern USA. The major limiting factor for crop production is the low base status throughout the profile. The clayey Bt horizon is not considered a major limiting factor for root penetra- tion and water movement. The A and E horizons typically are sandy loam, fine sandy loam, or loam or their gravelly counterparts. Eroded phases are sandy clay loam or clay loam. Except for the severely eroded units, these soils respond well to good management. Depth to bedrock is 180 cm or more.
These extensive soils occur in Alabama, Florida, Georgia, and South Carolina. The siliceous mineralogy class indicates the presence of more than 90% by weight of silica minerals (quartz, chalcedony, or opal) and other ex- tremely durable minerals resistant to weathering. Ironstone nodules are present in most horizons. Clay content of the upper part of the Bt horizon averaged 20 to 35%. Plinthite makes up 5 to 15% of the lower part of the subsoil. Low organic matter and low fertility limit crop production. Areas used for several years for row-crop production may develop pressure pans at the bottom of the plow layer.
LARSON, FENTON, SKIDMORE, BENBROOK
12-1.3.3 Fullerton Series
This series occurs widely in Alabama, Georgia, and Tennessee. They are cherty soils formed in residuum weathered from dolomite. Chert con- tent (by volume) of each horizon ranges from 15 to 35%. Slopes range from 2 to 45%. The horizons, except where limed, are strongly or very strongly acid. Clay content in the argillic (Bt) horizon ranges from 40 to 75% and base saturation is low, generally less than 20%. Texture of the surface horizon is cherty silt loam, cherty loam, or cherty fine sandy loam except for severely eroded phases which may be cherty silty clay loam or finer in texture.
12-2 EFFECT OF SOIL EROSION ON SOIL CLASSIFICATION AND MAPPING
In soil mapping, the effect of erosion on the epipedon is described in terms of erosion classes. In the Iowa Cooperative Soil Survey program, erosion classes are defined quantitatively:
Erosion Class 1-None or slight erosion. Little or no mixing of the subsoil with the plow layer. The plow layer consists mainly of the A horizon or A + E horizons. Dark-colored material is greater than 18 cm thick.
Erosion Class 2-Moderate erosion. Only 7 to 18 cm of A or (A + E) horizon remaining. Some of the B or AB are mixed with the plow layer.
Erosion Class 3-Severe erosion. Less than 7 cm of A or (A + E) horizon remaining. Most of the plow layer is B (or AB) horizon.
In this system, soil properties can be used to estimate the degree of acceler- ated erosion and the amount of A horizon that has been removed.
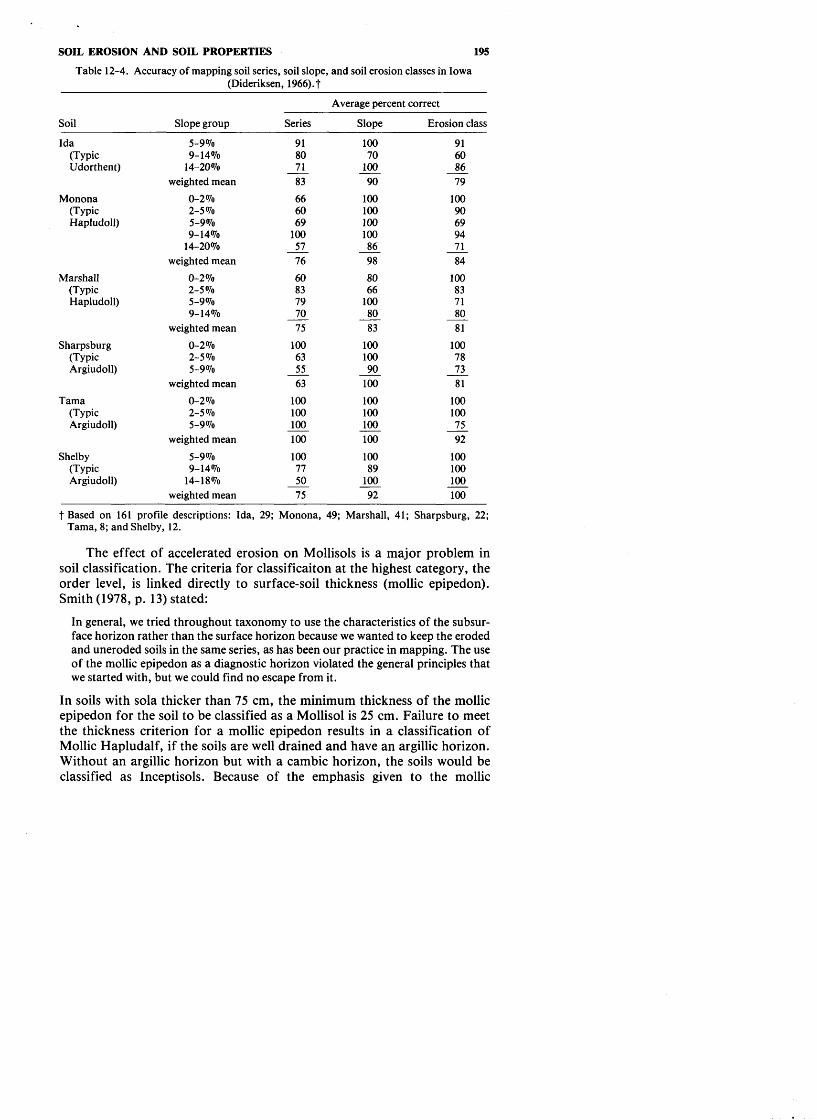
Erosion classes can be mapped accurately. Based on 240 randomly selected profiles of three soil series, Wilding et al. (1965) reported that the series was mapped accurately 42% of the time and erosion class 94% of the time. Dideriksen (1966) summarized data from the Conservation Needs Inventory Statistical Sample utilized in a corn yield study in Iowa. Study sites were drawn randomly from the 2% statistical sample used in the Con- servation Needs Study. At each sample site, a detailed description of the soil was made, the delineation of the area by soil-mapping unit was recorded, and the slope was measured at the point. These data were then compared with data previously mapped for that point. In general, the mapping unit delineations were most accurate in expressing slope group, erosion class, and soil series, in that order (Table 12-4). In this study the soil series over all slope groups was mapped accurately from 63 to 83% of the time, slope from 83 to 100070, and erosion class from 79 to 100%.
SOIL EROSION AND SOIL PROPERTIES 195
Table 12-4. Accuracy of mapping soil series, soil slope, and soil erosion classes in Iowa (Dideriksen, 1966). t
Average percent correct
Soil Slope group -
Slope Erosion class Series
Ida (Typic Udorthent)
5-9% 9-14%
1 4-20% weighted mean
Monona (Typic Hapludoll)
weighted mean
Marshall (Typic Hapludoll)
weighted mean
Sharpsburg (Typic Argiudoll)
weighted mean
Tama (Typic Argiudoll)
weighted mean
Shelby (Typic Argiudoll)
5-9% 9-14%
14-18% weighted mean
-
t Based on 161 profile descriptions: Ida, 29; Monona, 49; Marshall, 41; Sharpsburg, 22; Tama, 8; and Shelby, 12.
The effect of accelerated erosion on Mollisols is a major problem in soil classification. The criteria for classificaiton at the highest category, the order level, is linked directly to surface-soil thickness (mollic epipedon). Smith (1978, p. 13) stated:
In general, we tried throughout taxonomy to use the characteristics of the subsur- face horizon rather than the surface horizon because we wanted to keep the eroded and uneroded soils in the same series, as has been our practice in mapping. The use of the mollic epipedon as a diagnostic horizon violated the general principles that we started with, but we could find no escape from it.
In soils with sola thicker than 75 cm, the minimum thickness of the mollic epipedon for the soil to be classified as a Mollisol is 25 cm. Failure to meet the thickness criterion for a mollic epipedon results in a classification of Mollic Hapludalf, if the soils are well drained and have an argillic horizon. Without an argillic horizon but with a cambic horizon, the soils would be classified as Inceptisols. Because of the emphasis given to the mollic
1% LARSON, FENTON, SKIDMORE, BENBROOK
epipedon, a slight change in thickness can result in a change at the highest level in Soil Taxonomy (USDA, 1975). The Mollisols and associated mollic subgroups are the only groups of soils where accelerated erosion results in such a dramatic change in classificaiton.
The only other order that depends on a diagnostic epipedon is the Histosols. Because of the unique characteristics of Histosols, accelerated erosion is generally not a problem. Other orders are defined in terms of diagnostic subsurface horizons which are not commonly removed complete- ly by accelerated erosion. The major classification-related change resulting from accelerated erosion in these soils is at the phase level, where the tex- tural class may change, for example, from silt loam on the uneroded phase to silty clay loam on the eroded phases.
While acclerated erosion may have different effects on the formal classification of different soils, some changes appear to be universal among eroded soils. Erosion usually lowers soil fertility, but the permanent loss in productivity following erosion usually results from poorer tilth with associ- ated reduced infiltration rates, soil crusting, increased power requirements, poorer stands, and decreased water-holding capacities. In general, soils with less desirable subsoils (that is, with limiting rooting volumes) or less de- sirable substrata are more adversely affected by erosion than soils with optimal subsoil or substrata. The changes listed above are consistent with the changes in soil properties discussed for the Seymour, Marshall, and Fayette soils.
Langdale and Shrader (1982) discussed the problem of obtaining re- liable crop-yield data on eroded soils compared to noneroded soils. Tech- nology advances have masked soil-productivity decline due to erosion and have rendered of little value the extensive soil-erosion and soil-productivity research completed between 1935 and 1950. Technology has also affected the design of mapping units in soil surveys. Boundaries on soil maps are justified on the basis of differences in use, management, and behavior. Technology has reduced the significant statements that could be made to differentiate eroded and uneroded units. Initially, the problem was one of correlation, that is, eroded units shown on the field sheets were combined with uneroded units or vice versa and were not shown on the published soil maps. Mapping-unit descriptions were broadened to treat the unit combined as an inclusion. However, the eroded and uneroded units were identified on the field sheets. Soil scientists soon lose interest in making separations that are not published, so gradually, erosion differences in many cases were not identified on the field sheets. These trends are based on the authors' experience in the Midwest and in a report by Ditzler (1981, p. 15), a soil survey party leader from Tennessee, who stated ". . .the trend in many of the more recent surveys has been to map slope phases and not try to map out eroded phases. "
This period of evolving technology also coincides with the evolution and application of the soil classification system, published as Soil Taxono-

SOIL EROSION AND SOIL PROPERTIES 197
my (USDA, 1975). This system stresses the classification of soils based on a set of observed properties. A letter of transmittal attached to USDA-SCS National Soils Handbook Notice 63 dated 11 September 1980 stated:
Eroded phases are used only if accelerated erosion has not caused a change in the taxonomic class. If the taxonomic class has changed, the map unit name is based on the name of the new taxon and is not considered to be an eroded phase of that new taxon. Naming the new taxon as a taxadjunct of an eroded phase of the original soil is not appropriate because taxadjuncts imply similar use, manage- ment, and behavior.
Strict application of this procedure eliminates the identification of erosion classes for many soils, especially in the Mollisols order and Mollic great groups.
For example, Tama, Downs, and Fayette soils form a biosequence. Tama is classified as a Typic Argiudoll, Downs as a Mollic Hapludalf, and Fayette as a Typic Hapludalf. Classification criteria require that Tama soils have 25 cm or more of surface horizon that qualifies as a mollic epipedon. Downs soils have 18 to 25 cm of mollic material, and Fayette soils have 18 cm or less of mollic-like material at the surface. Strict application of this criteria results in moderately eroded Tama being classified as slightly eroded Downs, and severely eroded Tama as Fayette. Also accelerated erosion of Downs results in a classification as Fayette. In many survey areas, these rules have not been enforced, and erosion phases have been correlated as taxadjuncts of the series.
As pointed out by Ditzler (1981), the use of eroded phases in designing mapping units seems about to complete a full cycle. Because of the current interest in the National Resources Inventory and a renewed interest in the effects of soil erosion on productivity, there is a renewed effort to document the extent of soil erosion in published soil surveys.
The above discussion serves as a warning to those researchers who plan to conduct studies relating soil productivity to named soils and erosion phases. A qualified soil scientist should aid in an on-site evaluation of the research area. This evaluation will preclude complications arising from the soil classification and erosion problems discussed in this paper. In addition, a natural variability associated with soil map units may influence research results (Beckett and Webster, 1971).
12-3 EFFECTS OF SOIL EROSION ON HYDRAULIC PROPERTIES
Erosion often degrades soil hydrologic conditions and decreases plant- available water capacity. Runoff is increased and the amount of water avail- able for plant growth is decreased, thus lowering crop productivity. The fol- lowing discussion shows how crop production can be affected by erosion-in- duced change in soil hydraulic properties.

LARSON, FENTON, SKIDMORE, BENBROOK
12-3.1 Hydrologic Condition and Runoff
Runoff from daily rainfall is predicted by the equation (USDA-SCS, 1972):
where Q is daily runoff, P is rainfall, and S is a retention parameter. Wil- liams et al. (1983) showed that the retention parameter is related to soil water content by
S = S,, (UL - SM)/UL PI
where S,, is the maximum value of S, UL is the upper limit of soil water storage in the root zone (porosity minus water content at 1.5 MPa), and SM is the soil water content in the root zone minus water content at 1.5 MPa. The influences of the maximum value of the retention parameter and the upper limit of soil water storage on the retention parameter for SM equal to 0.1 m3/m3 are shown in Fig. 12-1. The maximum value of the retention parameter for different management conditions is shown in Table 12-5. To calculate S,,, we obtained runoff curve numbers for hydrologic soil-cover complexes from Table 9.1 in USDA-SCS (1972) for antecedent moisture
UPPER LIMIT O F SOIL WATER STORAGE, m3/m3 Fig. 12-1. Influence of upper limits of soil water storage on retention parameter at indicated
levels of maximum.

SOIL EROSION AND SOIL PROPERTIES 199
Table 12-5. Maximum values for retention parameter (S) for specified conditions on row-cropped land.
Practice
Hydrologic soil group Hydrologic condition A B C D
Contoured Poor 254 155 114 84 Contoured Good 310 201 132 99 Contoured and terraced Poor 297 208 150 132 Contoured and terraced Good 35 1 244 170 142
condition 11. We then used the relationship given by Smith and Williams (1980) to convert from curve numbers for antecedent moisture condition I1 to curve numbers for antecedent moisture condition I. Then
where CNI is the curve number for antecedent moisture condition I. Erosion degrades the hydrologic conditions and thus lowers the maxi-
mum retention parameters. Loss in organic matter and resulting poor soil structure could easily degrade hydrologic condition from good to poor, or even degrade from a higher to a lower hydrologic soil group. The USDA- SCS (1972) has classified Cecil, Fullerton, Tifton, Fayette, and Marshall soils into hydrologic soil group B; and Grenada, Tillman, and Seymour soils into hydrologic group C. Hydrologic groups B and C are soils having moderate and slow rates of water transmission, respectively. If the soils in hydrologic group B with contoured row crops degraded from good to poor hydrologic condition (Table 12-5), the maximum value of the retention parameter would change from 20.1 to 15.5 cm, and, if they further de- graded to hydrologic soil group C, the resulting retention parameter is 11.4 cm.
The lower retention parameter caused by degradation of hydrologic conditions increases runoff as shown in Eq. [I] and Eq. [2] and Fig. 12-2. This reduces the quantity of water available for crop production.
The influence of soil removal from the surface on the upper limit of soil water in the root zone (UL) and on available water capacity (AWC) was evaluated. The UL and AWC for each horizon of Cecil, Fayette, Marshall, and Seymour soils down to 100 cm was calculated, where UL is porisity minus water content at 1.5 MPa and AWC is water content at .033 MPa minus 1.5 MPa water content. The input data were taken from Soil Survey Laboratory work sheets for one pedon of each soil.
A depth-weighted factor (Wi) was computed for each depth increment using the Smith and Williams (1980) method:

200 LARSON, FENTON, SKIDMORE, BENBROOK
RAINFALL, mm Fig. 12-2. Fraction of rainfall becoming runoff as influenced by amount of rain and retention
parameter(s).
where Di is the depth to the bottom of storage depth and RD is the total rooting depth. Using the weighting factor, the mean weighted UL and AWC were calculated from
and n
AWC = C Wi*AWCi i = l
where n
c w i = l i = l
Calculations were repeated by separately disregarding the upper 2.5, 5.1, 7.6, 12.7, 20.3, and 30.5 cm, and including a corresponding depth at the lower end of the soil depth considered. Results are shown in Table 12-6.
The for the Cecil, Fayette, and Seymour soils gradually decreases from the present condition as soil is removed, whereas for the Marshall soil, -
UL gradually increases with depth of soil removal. The AWC for Marshall is essentially constant with soil removal, whereas for Seymour and Fayette it decreases with soil removal. For Cecil, AWC changes as soil is removed from the surface. The and AWC would decrease drastically with surface soil removal if the lower soil depth were more restricting.
SOIL EROSION AND SOIL PROPERTIES 201
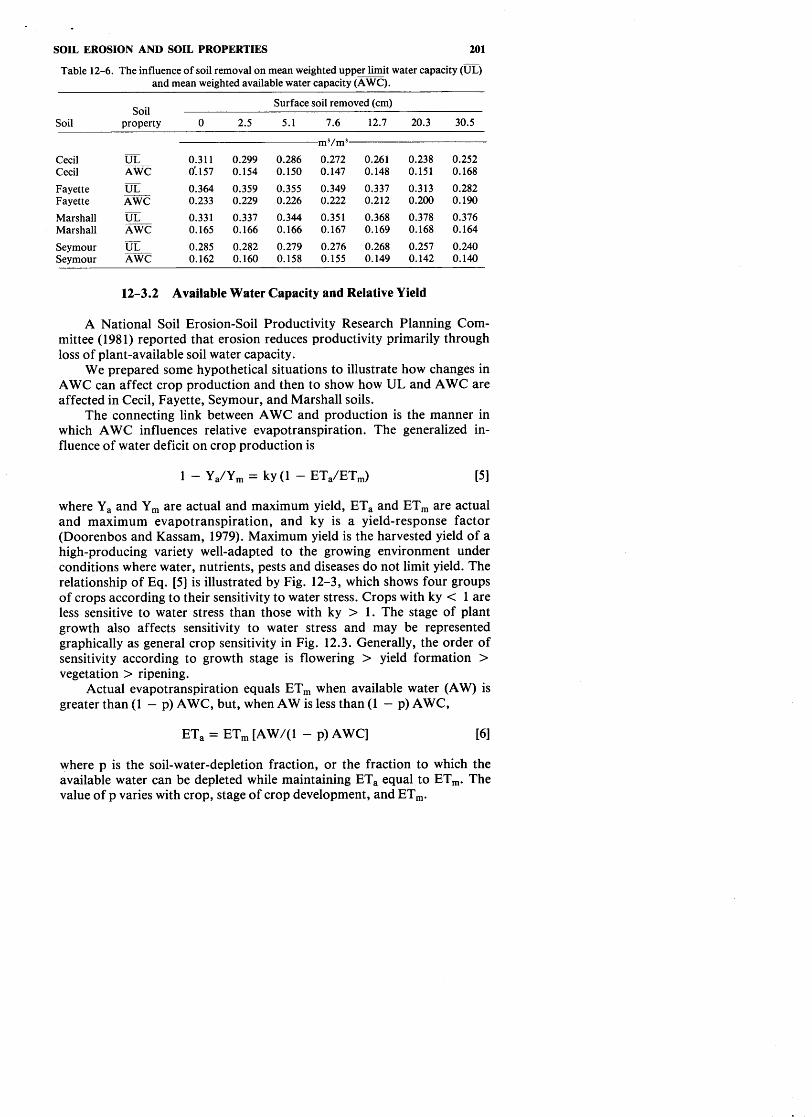
Table 12-6. The influence of soil removal on mean weighted upper limit water capacity (m) and mean weighted available water capacity (AWC).
Surface soil removed (cm) Soil
Soil property 0 2.5 5.1 7.6 12.7 20.3 30.5
Cecil UL 0.311 0.299 0.286 0.272 0.261 0.238 0.252 Cecil AWC 0'.157 0.154 0.150 0.147 0.148 0.151 0.168
-
UL Fayette 0.364 0.359 0.355 0.349 0.337 0.313 0.282 Fayette AWC 0.233 0.229 0.226 0.222 0.212 0.200 0.190
-
Marshall UL 0.331 0.337 0.344 0.351 0.368 0.378 0.376 Marshall AWC 0.165 0.166 0.166 0.167 0.169 0.168 0.164
- Seymour UL 0.285 0.282 0.279 0.276 0.268 0.257 0.240 Seymour AWC 0.162 0.160 0.158 0.155 0.149 0.142 0.140
12-3.2 Available Water Capacity and Relative Yield
A National Soil Erosion-Soil Productivity Research Planning Com- mittee (1981) reported that erosion reduces productivity primarily through loss of plant-available soil water capacity.
We prepared some hypothetical situations to illustrate how changes in AWC can affect crop production and then to show how UL and AWC are affected in Cecil, Fayette, Seymour, and Marshall soils.
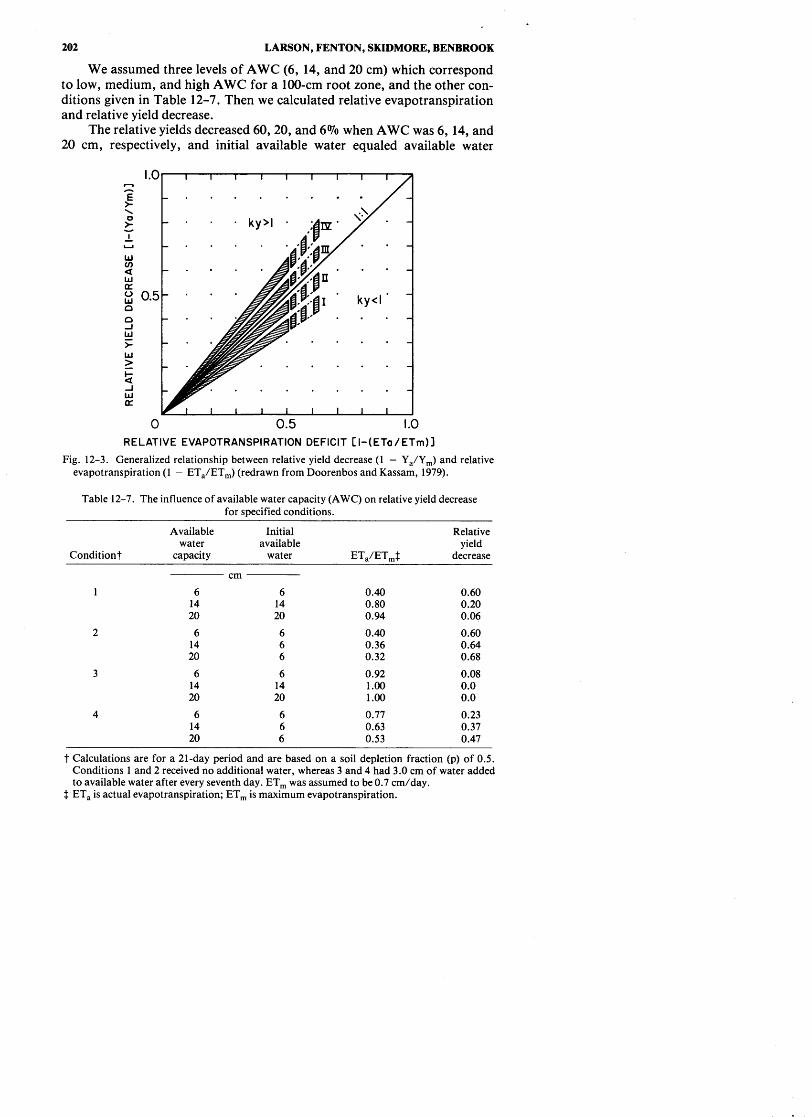
The connecting link between AWC and production is the manner in which AWC influences relative evapotranspiration. The generalized in- fluence of water deficit on crop production is
where Y, and Y, are actual and maximum yield, ET, and ET, are actual and maximum evapotranspiration, and ky is a yield-response factor (Doorenbos and Kassam, 1979). Maximum yield is the harvested yield of a high-producing variety well-adapted to the growing environment under conditions where water, nutrients, pests and diseases do not limit yield. The relationship of Eq. [5] is illustrated by Fig. 12-3, which shows four groups of crops according to their sensitivity to water stress. Crops with ky < 1 are less sensitive to water stress than those with ky > 1. The stage of plant growth also affects sensitivity to water stress and may be represented graphically as general crop sensitivity in Fig. 12.3. Generally, the order of sensitivity according to growth stage is flowering > yield formation > vegetation > ripening.
Actual evapotranspiration equals ET, when available water (AW) is greater than (1 - p) AWC, but, when AW is less than (1 - p) AWC,
ET, = ET, [AW/(l - p) AWC]
where p is the soil-water-depletion fraction, or the fraction to which the available water can be depleted while maintaining ET, equal to ET,. The value of p varies with crop, stage of crop development, and ET,.
202 LARSON, FENTON, SKIDMORE, BENBROOK
We assumed three levels of AWC (6, 14, and 20 cm) which correspond to low, medium, and high AWC for a 100-cm root zone, and the other con- ditions given in Table 12-7. Then we calculated relative evapotranspiration and relative yield decrease.
The relative yields decreased 60,20, and 6% when AWC was 6, 14, and 20 cm, respectively, and initial available water equaled available water
I . . . . . . /-I
0 0.5 1.0 RELATIVE EVAPOTRANSPIRATION DEFICIT C I-(ETa /ETm)l
Fig. 12-3. Generalized relationship between relative yield decrease (1 - Ya/Ym) and relative evapotranspiration (1 - ETa/ETm) (redrawn from Doorenbos and Kassam, 1979).
Table 12-7. The influence of available water capacity (AWC) on relative yield decrease for specified conditions.
Available Initial Relative water available yield
Condition? capacity water ETa/ET,$ decrease
t Calculations are for a 21-day period and are based on a soil depletion fraction (p) of 0.5. Conditions 1 and 2 received no additional water, whereas 3 and 4 had 3.0 cm of water added to available water after every seventh day. ET, was assumed to be 0.7 cm/day.
$ ET, is actual evapotranspiration; ET, is maximum evapotranspiration.
SOIL EROSION AND SOIL PROPERTIES 203
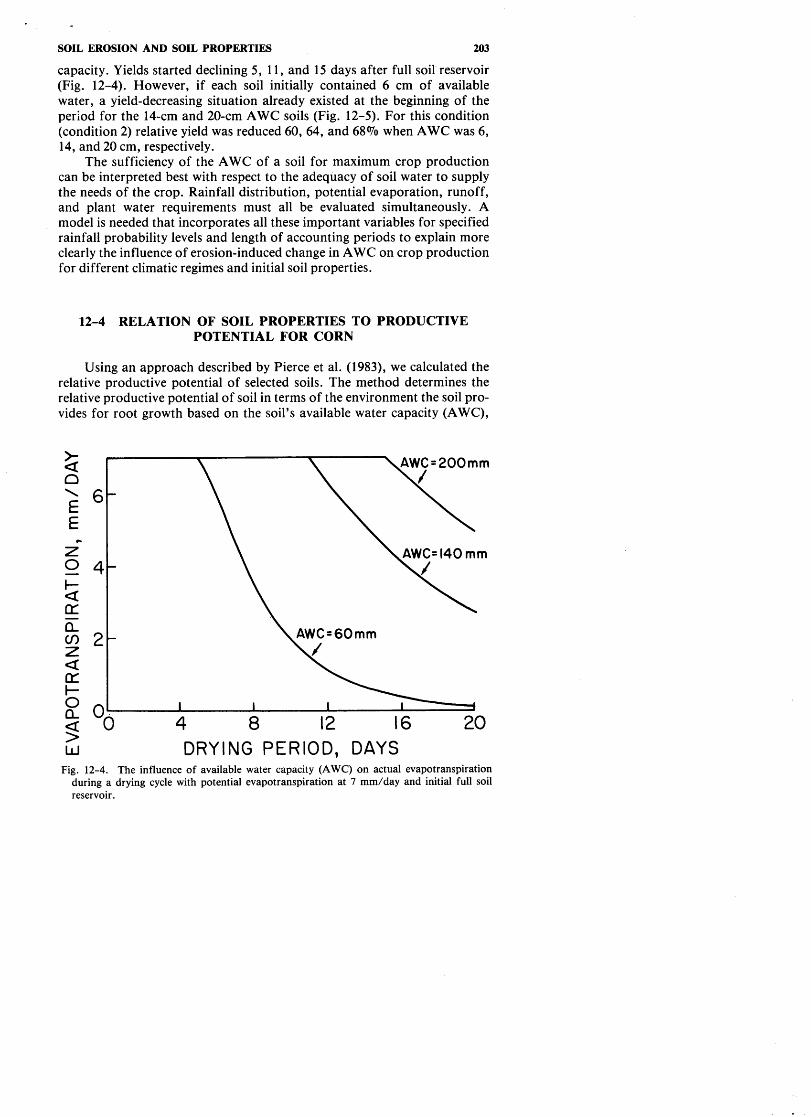
capacity. Yields started declining 5, 11, and 15 days after full soil reservoir (Fig. 12-4). However, if each soil initially contained 6 cm of available water, a yield-decreasing situation already existed at the beginning of the period for the 14-cm and 20-cm AWC soils (Fig. 12-5). For this condition (condition 2) relative yield was reduced 60, 64, and 68% when AWC was 6, 14, and 20 cm, respectively.
The sufficiency of the AWC of a soil for maximum crop production can be interpreted best with respect to the adequacy of soil water to supply the needs of the crop. Rainfall distribution, potential evaporation, runoff, and plant water requirements must all be evaluated simultaneously. A model is needed that incorporates all these important variables for specified rainfall probability levels and length of accounting periods to explain more clearly the influence of erosion-induced change in AWC on crop production for different climatic regimes and initial soil properties.
12-4 RELATION OF SOIL PROPERTIES TO PRODUCTIVE POTENTIAL FOR CORN
Using an approach described by Pierce et al. (1983), we calculated the relative productive potential of selected soils. The method determines the relative productive potential of soil in terms of the environment the soil pro- vides for root growth based on the soil's available water capacity (AWC),
DRYING PERIOD, DAYS Fig. 12-4. The influence of available water capacity (AWC) on actual evapotranspiration
during a drying cycle with potential evapotranspiration at 7 mm/day and initial full soil reservoir.

204 LARSON, FENTON, SKIDMORE, BENBROOK
W DRYING PERIOD, DAYS Fig. 12-5. The influence of available water capacity (AWC) on evapotranspiration during a
drying cycle with potential evapotranspiration at 7 mm/day and initial available water content of 60 mm for each soil.
resistance to root growth and development, and adequacy of pH to a depth of 100 cm. The equation used by Pierce et al. (1983) is
where A is the sufficiency of AWC, B is the sufficiency of bulk density (DB), C is the sufficiency of pH, WF is a weighting factor, and r is the number of 10-cm increments in the rooting. The productivity index (PI) in- creases directly with productive potential from 0 to 1.0, as does each suf- ficiency factor. The weighting factor (WF) epresses an ideal corn root dis- tribution to 100 cm depth. It is normalized so that the area under the WF- depth curve is equal to 1 .O.
The AWC, DB, and pH data by horizons used in the PI calculations for the Seymour and Marshall pedons were taken from Soil Survey Staff (1978). Data representative of the central concept of the other soils were taken from SOILS-5 (The SOILS-5 data base contains soil descriptions, physical and chemical properties, crop yields, and capabilities and limita- tions for every soil series, and their variants established in the USA. USDA- SCS 1983, SOILS-5 data base. USDA-SCS, Ames, IA). The PI indices for these selected soils are shown in Table 12-8.

SOIL EROSION AND SOIL PROPERTIES 205
Table 12-8. Productivity Index (PI) for eight benchmark soils.
Erosion
Soil Series Slight Moderate
Seymour (3 profiles) Marshall (3 profiles) Tillman Fayette Grenada Cecil Fullerton Tifton
The characteristics of the three Seymour soils from which PI was cal- culated are given in Fig. 12-6. For all three pedons, bulk density was suf- ficient while pH and AWC were somewhat limiting to productive potential. Available water capacity was related to the depth of maximum clay content in the profile, and pH increased to a more neutral level deeper in the profile. For the Seymour soil, the slightly eroded site (93-6) had a PI of 0.79, where- as the moderately eroded sites (93-5 and 93-4) had PIS of 0.64 and 0.59. Productive potential in this soil declines as erosion moves the zone of high clay closer to the surface.
The characteristics of the three Marshall pedons are given in Fig. 12-7. The PI for the two slightly eroded sites of the Marshall soil (15-1 and 15-2) was 0.89 and 0.73, and, for the moderately eroded site (15-3), the PI was 0.82. The somewhat lower PI for site 15-2 (slightly eroded) reflects a lower AWC, although no reason is apparent for it being less than the other two pedons. However, AWC, DB, and pH all reflect generally good root- growth conditions to depths of more than 1 m.
To simulate the effects of erosion on productive potential, PI was cal- culated after successive removals of 5 cm of soil from the surface. As soil was removed, the rooting depth was maintained at 1 m by moving the root- ing function an equal distance down the soil profile.
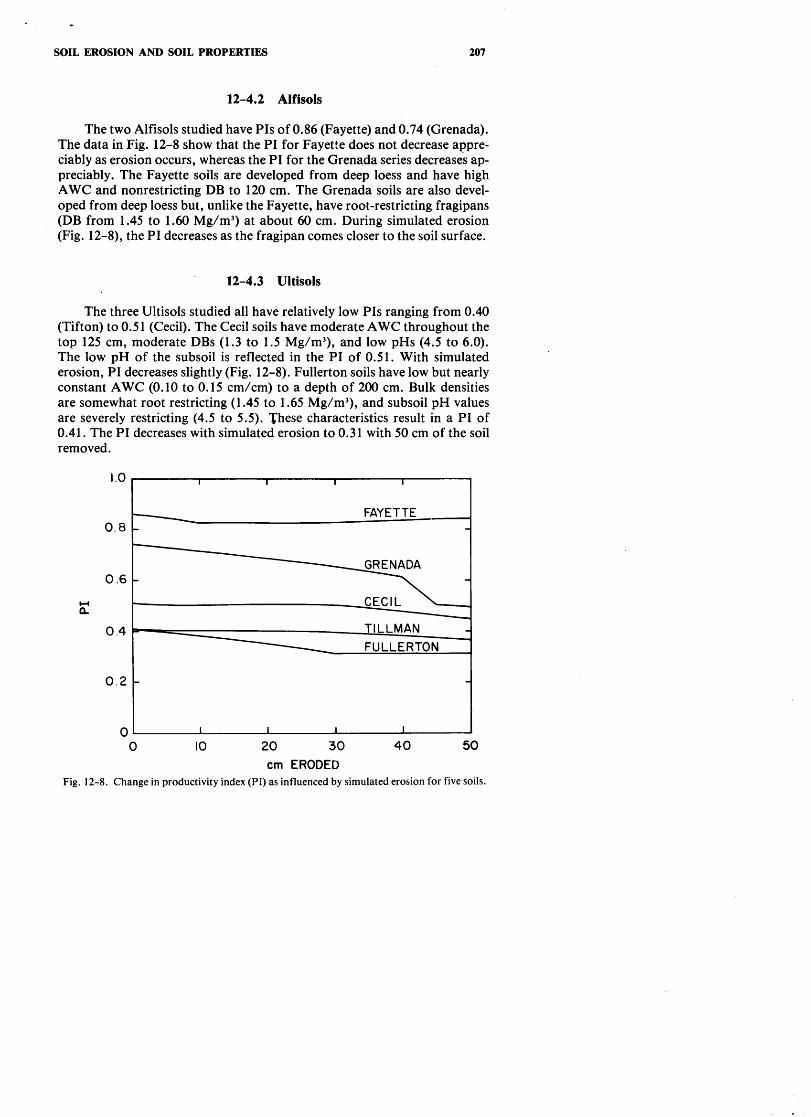
The Tillman series are deep, well-drained, slowly permeable soils formed in clayey alluvium and have a computed PI of 0.43. While the soils have a relatively high AWC (approximately 0.16 cm/cm in the surface and decreasing to 0.14 cm/cm below 1.2 m), they have root-restricting bulk densities (1.55 Mg/m3) at depths below 15 cm. Soil pH below 15 cm ap- proaches 8.0. The PI of 0.43 reflects the relatively high DB in horizons be- low 15 cm. Erosion as simulated herein slightly reduces the PI of the Till- man soils as restricting DB in subsurface horizons moves closer to the sur- face (Fig. 12-8).

LARSON, FENTON, SKIDMORE, BENBROOK
SEYMOUR - 93-6 SLIGHTLY ERODED ----- 93 -5 MODERATELY ERODED .....-. 93-4 MODERATELY ERODED
L- I - 0 51 .I0 .21 1.2 1.6 5.0 6.5 CLAY, '10 AWC, cm/cm DB, Mg/m3 PH
Fig. 12-6. Soil characteristics of three Seymour soil profiles as influenced by erosion. (AWC is available water capacity, and DB is bulk density).
MARSHALL -...... 15- 1 SLIGHTLY ERODED ----- 15-2 SLIGHTLY ERODED - 15-3 MODERATELY ERODED
- - 34 .I3 0- - .25 1.1 1.4 5.5 6.4
CLAY, O/O AWC, cm/cm DB, Mg/m3 PH Fig. 12-7. Soil characteristics of three Marshall soil profiles as influenced by erosion. (AWC
is available water capacity, and DB is bulk density).
SOIL EROSION AND SOIL PROPERTIES
12-4.2 Alfisols
The two Alfisols studied have PIS of 0.86 (Fayette) and 0.74 (Grenada). The data in Fig. 12-8 show that the PI for Fayette does not decrease appre- ciably as erosion occurs, whereas the PI for the Grenada series decreases ap- preciably. The Fayette soils are developed from deep loess and have high AWC and nonrestricting DB to 120 cm. The Grenada soils are also devel- oped from deep loess but, unlike the Fayette, have root-restricting fragipans (DB from 1.45 to 1.60 Mg/m3) at about 60 cm. During simulated erosion (Fig. 12-8), the PI decreases as the fragipan comes closer to the soil surface.
12-4.3 Ultisols
The three Ultisols studied all have relatively low PIS ranging from 0.40 (Tifton) to 0.51 (Cecil). The Cecil soils have moderate AWC throughout the top 125 cm, moderate DBs (1.3 to 1.5 Mg/m3), and low pHs (4.5 to 6.0). The low pH of the subsoil is reflected in the PI of 0.51. With simulated erosion, PI decreases slightly (Fig. 12-8). Fullerton soils have low but nearly constant AWC (0.10 to 0.15 cm/cm) to a depth of 200 cm. Bulk densities are somewhat root restricting (1.45 to 1.65 Mg/m3), and subsoil pH values are severely restricting (4.5 to 5.5). These characteristics result in a PI of 0.41. The PI decreases with simulated erosion to 0.31 with 50 cm of the soil removed.
I I 1 I 1 0 10 2 0 3 0 4 0 50
cm ERODED Fig. 12-8. Change in productivity index (PI) as influenced by simulated erosion for five soils.
0 . 4 m m
FULLERTON

208 LARSON, FENTON, SKIDMORE, BENBROOK
12-5 RELATIONSHIP BETWEEN PI AND CORN YIELD
Englestad and Shrader (1961) compared the effects of surface soil thickness on corn yields for Marshall soils using artificially exposed subsoil and normal soil. In two years, yields on subsoil control plots (zero nitrogen) averaged 3.07 Mg/ha lower than those from corresponding normal soil plots. However, corn yields were equal when adequate nitrogen fertilizer was supplied.
Ode11 (1950) reported that each 2.5 cm of surface soil added 0.072 to 0.075 Mg/ha to yield on a soil with a favorable rooting zone in the subsoil and substratum. On a soil with an unfavorable rooting zone in the subsoil and substratum, each 2.5 cm of surface soil added 1.4 to 2.0 Mg/ha to yield of corn. Seymour soils are in this category.
Fenton (1980) used data reported by Swanson and MacCallum (1969) to calculate changes in corn yields related to surface soil thickness. Values calculated ranged from a change of 0.033 Mg/ha per 1 cm of surface soil for soils with favorable rooting zones to 0.080 Mg/ha per 1 cm of surface soil for soils with unfavorable rooting zones.
The estimated row-crop yields expected for various erosion phases of the Marshall and Seymour soils are given in Table 12-9. Even with high- level management, the effect of topsoil loss is greater on Seymour than on Marshall soils.
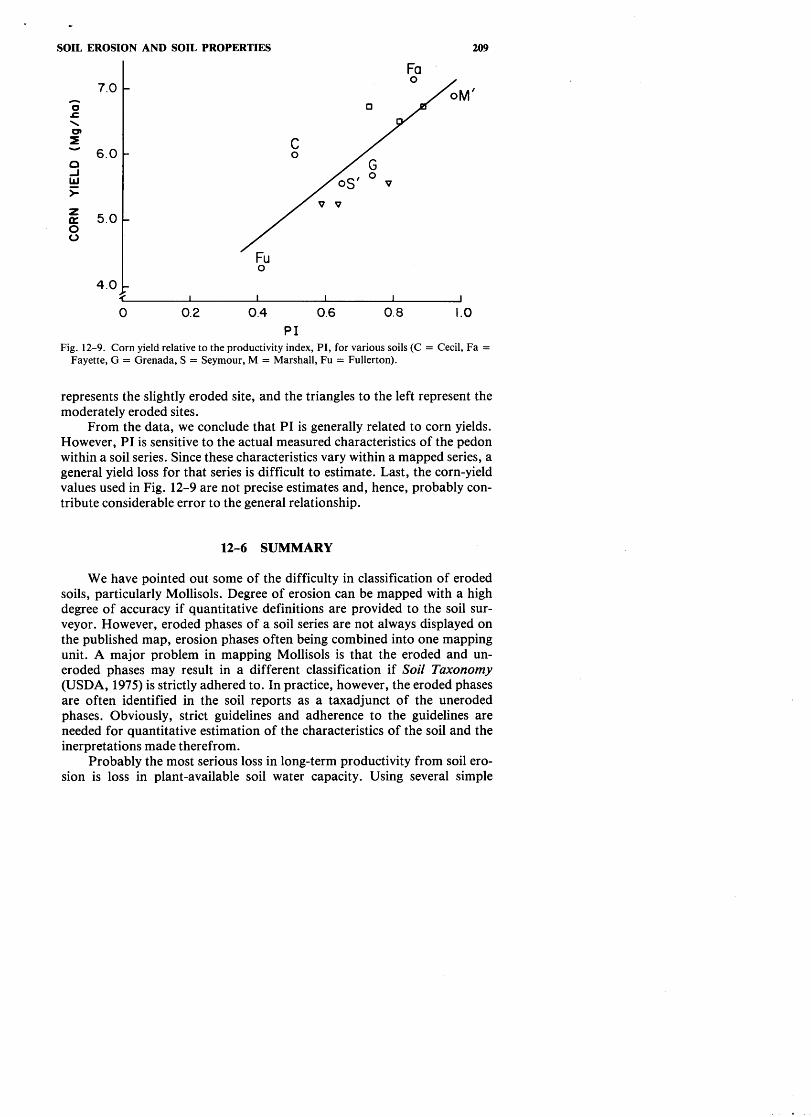
The relationship between corn yield and PI for the soils discussed here is given in Fig. 12-9. The symbols with a circle are the soils for which corn yields are given in SOILS-5. The soil data used as input in Eq. [7] were also taken from SOILS-5. Compare the point marked M ' (calculated from SOILS-5) in the upper right hand corner with the three squares. The points marked as squares are the three Marshall pedons discussed earlier. The data used to calculate the points marked as squares were taken from measured data in Soil Survey Staff (1978). Estimated corn yields were taken from Table 12-9. The squares near the line represent a slightly and moderately eroded Marshall pedon. The one removed from the line is a slightly eroded pedon. Likewise, compare the point marked S ' (Seymour) in the center of the diagram (calculated from SOILS-5) with the three triangles. The tri- angles represent PIS calculated from measured data reported by Soil Survey Staff (1978) and corn yields from Table 12-9. The triangle to the right
Table 12-9. Estimates of crop yields for selected phases of the Marshall and Seymour series.
Soil Erosion phase Corn Soybeans
Marshall Slight 6.69 2.73 (silty clay loam, 2-5% slopes) Moderate 6.50 2.67
Severe 6.13 2.47
Seymour (silt loam, 2-5% slope)
Slight 5.50 2.20 Moderate 5.19 2.13 Severe 4.56 1.87
SOIL EROSION AND SOIL PROPERTIES
4.0b .( 1 I I 1 I
0 0.2 0.4 0.6 0.8 1.0 PI
Fig. 12-9. Corn yield relative to the productivity index, PI, for various soils (C = Cecil, Fa = Fayette, G = Grenada, S = Seymour, M = Marshall, Fu = Fullerton).
represents the slightly eroded site, and the triangles to the left represent the moderately eroded sites.
From the data, we conclude that PI is generally related to corn yields. However, PI is sensitive to the actual measured characteristics of the pedon within a soil series. Since these characteristics vary within a mapped series, a general yield loss for that series is difficult to estimate. Last, the corn-yield values used in Fig. 12-9 are not precise estimates and, hence, probably con- tribute considerable error to the general relationship.
12-6 SUMMARY
We have pointed out some of the difficulty in classification of eroded soils, particularly Mollisols. Degree of erosion can be mapped with a high degree of accuracy if quantitative definitions are provided to the soil sur- veyor. However, eroded phases of a soil series are not always displayed on the published map, erosion phases often being combined into one mapping unit. A major problem in mapping Mollisols is that the eroded and un- eroded phases may result in a different classification if Soil Taxonomy (USDA, 1975) is strictly adhered to. In practice, however, the eroded phases are often identified in the soil reports as a taxadjunct of the uneroded phases. Obviously, strict guidelines and adherence to the guidelines are needed for quantitative estimation of the characteristics of the soil and the inerpretations made therefrom.
Probably the most serious loss in long-term productivity from soil ero- sion is loss in plant-available soil water capacity. Using several simple

210 LARSON, FENTON, SKIDMORE, BENBROOK
models, we have shown that root-zone water-storage capacity can be changed materially by erosion. Losses in available water capacity are most serious on soils with unfavorable subsoils. On soils with deep favorable sola, losses in available water capacity may not be significant. Losses in available water-storage capacity can result in significant reductions in crop yields.
The relative productive potential of selected soils was estimated using a model that calculates the environment the soil provides for root growth and available water capacity. Using this model, relative reductions in crop yield are estimated using simulated erosion. Erosion is shown to reduce the pro- ductive potential on soils with unfavorable subsoils.
We conclude that losses in crop production potential are related to the characteristics of the soils, and that improved mapping procedures are needed to retain mapping units that reflect erosion's effect on sola charac- teristics to the user of soil-survey information.
REFERENCES
Beckett, P. H. T., and R. Webster. 1971. Soil variability: A review. Soils Fert. 34: 1-15. Council for Agricultural Science and Technology. 1982. Soil erosion: Its agricultural, environ-
mental, and socio-economic implications. Report 92. Ames, IA. Dideriksen, R. I. 1966. An evaluation of soil mapping units by erosion groups in Iowa.
Mimeograph, Soil Conservation Service-Iowa Soil Survey. Ames, IA. Ditzler, C. 1981. Mapping eroded phases of soil. Soil Surv. Horiz. 22(3): 15-17. Doorenbos, J., and A. H. Kassam. 1979. Yield response to water. FA0 Irrigation and Drain-
age Paper 33. FAO, Rome. Englestad, 0. P., and W. D. Shrader. 1961. The effect of surface soil thickness on corn yields:
11. As determined by an experiment using normal surface soil and artificially exposed subsoil. Soil Sci. Am. Proc. 25:497-499.
Fenton, T. E. 1980. Soil erosion in the corn belt-problems and solutions. Proc. of Quaternary Geology and Geomorphology Symp.: Soil Erosion. Geol. Soc. Am., Atlanta, GA. 17-20 Nov. 1980.
Langdale, G. W., and W. D. Shrader. 1982. Soil erosion effects on soil productivity of culti- vated cropland. p. 41 -5 1. In Determinants of soil loss tolerance. Spec. Pub. 45. American Society of Agronomy, Madison, WI.
National Soil Erosion-Soil Productivity Research Planning Committee. 1981. Soil erosion effects on soil productivity: A research perspective. J. Soil and Water Conserv. 36:82-90.
Odell, R. T. 1950. Measurement of the productivity of soils under various environmental conditions. Agron. J. 42:282-292.
Pierce, F. J., W. E. Larson, and R. H. Dowdy. 1983. Productivity of Soils: Assessing long- term changes due to erosion. J. Soil Water Conserv. 38:39-44.
Smith, G. D. 1978. Conversations in Taxonomy. Soil Surv. Horiz. l9(2): 1 1-14. Smith, R. E., and J. R. Williams. 1980. Simulation of the surface water hydrology. p. 13-35.
In CREAMS, a field scale model for chemicals, runoff, and erosion from agricultural management systems. USDA, Conserv. Res. Rep. 26.
Soil Survey Staff. 1978. Soil survey laboratory data and descriptions for some soils of Iowa. soil Survey Investigation Report 31. USDA-SCS and Iowa Agriculture and Home Eco- nomics Experiment Station.
SOIL EROSION AND SOIL PROPERTIES 211
Swanson, E. R., and D. E. MacCallum. 1969. Income effects of rainfall on erosion control. J. Soil Water Conserv. 2456-59.
USDA. 1975. Soil taxonomy-a basic system of soil classification for making and interpreting soil surveys. USDA Agric. Handbk. 436.
USDA-SCS. 1972. National Engineering Handbook, Hydrology Section 4. USDA-SCS. Wilding, L. P., R. B. Jones, and G. M. Shafer. 1965. Variations of soil morphological proper-
ties within Miami, Celina, and Crosby mapping units in west-central Ohio. Soil Sci. Soc. Am. Proc. 29:711-717.
Williams, J. R., C. A. Jones, and P. T. Dyke. 1984. A modeling approach to determining the relationship between erosion and soil productivity. Trans ASAE 27: 129-144.