Effects of Septic Systems on Ground Water Quality - … of Septic Systems on Ground Water Quality -...
47
Printed with soy-based inks in recycled paper containing at least 10 percent fibers from paper recycled by consumers. Effects of Septic Systems on Ground Water Quality - Baxter, Minnesota May, 1999 Published by Minnesota Pollution Control Agency Ground Water and Toxics Monitoring Unit Environmental Monitoring and Analysis Section Environmental Outcomes Division 520 Lafayette Road North St. Paul, Minnesota 55155-4194 (651) 296-6300 or (800) 657-3864 Prepared by Ground Water Monitoring and Assessment Program (GWMAP) This material may be made available in other formats, Such as Braille, large type or audio, upon request. TDD users call (651) 282-5332
Transcript of Effects of Septic Systems on Ground Water Quality - … of Septic Systems on Ground Water Quality -...

Printed with soy-based inks in recycled paper containing at least 10 percent fibers from paper recycled by consumers.
Effects of Septic Systems on Ground Water Quality -Baxter, Minnesota
May, 1999
Published by
Minnesota Pollution Control AgencyGround Water and Toxics Monitoring Unit
Environmental Monitoring and Analysis SectionEnvironmental Outcomes Division
520 Lafayette Road NorthSt. Paul, Minnesota 55155-4194
(651) 296-6300 or (800) 657-3864
Prepared by
Ground Water Monitoring and Assessment Program (GWMAP)
This material may be made available in other formats,Such as Braille, large type or audio, upon request.
TDD users call (651) 282-5332


Effects of Septic Systems on Ground Water Quality - Baxter, Minnesota May, 1999
Ground Water and Assessment Program i
Table of Contents
Acknowledgments iiList of Tables iiiList of Figures ivExecutive Summary vi
Introduction 1
Methods and Materials 5Phase 1
Design and Data Collection 7Data Analysis 10
Phase 2 10Design and Data Collection 10Data Analysis 13
Results and Discussion 13Phase 1 14Phase 2 19
Inorganic Chemicals 19Bacteria 28Volatile Organic Compounds 31
Conclusions and Recommendations 33
References 35

Effects of Septic Systems on Ground Water Quality - Baxter, Minnesota May, 1999
Ground Water and Assessment Program ii
Acknowledgments
We would like to thank officials from the City of Baxter for making this project
possible. Mark Wespetal assisted with input prior to conducting the study and conducted
measurements at individual septic systems. Most of all, we would like to thank the
numerous property owners who allowed us to sample their wells and septic systems.

Effects of Septic Systems on Ground Water Quality - Baxter, Minnesota May, 1999
Ground Water and Assessment Program iii
List of Tables
1. Results of particle size analysis for geoprobe samples2. Analytic method and reporting limits for sampling parameters.3. Summary information for the plume sites.4. Median chemical concentration for geoprobe samples from sewered and unsewered
areas. An “*” indicates concentrations that differed between sewered and unseweredareas (at the 0.05 significance level).
5. Median chemical concentrations for different sampling depths. Different letters withina row indicate concentrations that differed at a significance level of 0.05.
6. Concentrations of chemicals in septic tank effluent. Concentrations are in ug/L.7. Comparison of chemical concentrations in septic tanks from different studies.
Concentrations are in ug/L.8. Comparison of median chemical concentrations in septic tanks, maximum
concentrations found in ground water, and background concentrations. Data from allseven sites were pooled for the analysis. Concentrations are in ug/L except pH,specific conductance (umhos/cm), temperature (oC), and oxidation-reduction potential(mV).
9. Maximum concentrations observed in plumes for each site.10. Down-gradient distance from the drainfield at which chemical concentrations
approached background concentrations.11. Nitrate to chloride ratios in septic plumes.12. Summary of information for total bacteria found in septic tank effluent and ground
water down-gradient of individual septic systems.13. Concentrations of E. Coli in septic tank effluent.14. Total concentrations of VOCs in septic tank effluent and number of compounds
detected.15. VOCs detected and concentration range in septic tank effluent.

Effects of Septic Systems on Ground Water Quality - Baxter, Minnesota May, 1999
Ground Water and Assessment Program iv
List of Figures
1. Location of Baxter study area
2. Map of the study area illustrating sewered and unsewered areas, ground water flowdirection, and sampling locations.
3. Location of individual septic systems selected for sampling.
4. Age of development and distribution of nitrate across the study area.
5. Nitrate concentrations as a function of well or geoprobe depth.
6. Nitrate concentration, in ug/L, in the septic plume at site five. Filled circles representsampling locations.
7. Total phosphorus concentration, in ug/L, in the septic plume at site five. Filled circles
represent sampling locations. 8. Concentrations of total coliform bacteria, in MPN/100-ml, in the plume at site five.

Effects of Septic Systems on Ground Water Quality - Baxter, Minnesota May, 1999
Ground Water and Assessment Program v

Effects of Septic Systems on Ground Water Quality - Baxter, Minnesota May, 1999
Ground Water and Assessment Program vi
Executive Summary
In 1998, the Minnesota Pollution Control Agency (MPCA) conducted a study to
determine the effects of septic systems on ground water quality in residential areas of
Baxter, Minnesota. The Baxter area is experiencing rapid expansion with unsewered
developments. A sensitive aquifer underlies the study area. Numerous lakes are in direct
connection with ground water and may be impacted by septic discharges to ground water.
The study was conducted in two phases. In Phase 1, 40 permanent domestic and
12 temporary wells were sampled at different depths in the shallow sand aquifer. Nitrate
was the primary chemical of concern. Median nitrate concentrations were significantly
higher in areas with Individual Sewage Treatment Systems (unsewered areas; 1980 ug/L
or parts per billion) than in areas served by municipal sewers (sewered areas; 778 ug/L).
All four exceedances of drinking water criteria (10000 ug/L) were in unsewered areas.
Nitrate concentrations were highest in the upper 15 to 20 feet of the aquifer, then
decreased rapidly with depth. Denitrification most likely accounts for the decrease in
nitrate with depth. Total and dissolved organic carbon were also greater in unsewered
areas.
The objective of Phase 2 was to examine concentrations of chemicals within
ground water plumes originating beneath individual septic systems. Plumes were observed
beneath each of the seven systems sampled. The average plume length was approximately
25 meters and ranged from 10 to over 100 meters. Chloride was used as an indicator of
the septic plume. At each site, nitrate concentrations exceeded the drinking water criteria
throughout most of the plume. Nitrate concentrations decreased slowly along the plume
lengths, as indicated by decreasing nitrate to chloride ratios. If the plumes studied are
typical of plumes throughout Baxter, one acre lots should result in about 7 percent of the
shallow portion of the aquifer having nitrate concentrations above the drinking standard.
Twenty-five percent of the geoprobe wells drilled during Phase 1 exceeded the HRL,
however. The higher than expected rate may be due to biases in sampling, inputs from
fertilizers, lot sizes smaller than one acre, or typical plumes being longer than those that
were sampled.

Effects of Septic Systems on Ground Water Quality - Baxter, Minnesota May, 1999
Ground Water and Assessment Program vii
Bacteria and Volatile Organic Compounds (VOCs) were found in septic effluent at
all seven sites. Most probable number concentrations of total coliform were as high as
200000/100-mL. These concentrations are similar to those observed in the literature.
Concentrations of coliform bacteria in ground water decreased by two orders of
magnitude within 15 meters of the drainfield. Total VOC concentrations in septic tanks
ranged from 138 to 800 ug/L. The most common VOCs were substituted benzenes,
which accounted for about 67 percent of the 41 total detections. There were thirteen
VOC detections in ground water, eleven of which were chloroform. There were no
exceedances of drinking water criteria for VOCs.
Phosphorus is an important chemical of concern in northern Minnesota because of
the recreational value of lakes. There were no significant differences in phosphorus
concentrations in ground water under sewered and unsewered areas. Phosphorus
concentrations in septic plumes approached background concentrations within 12 meters
of the drainfield. Phosphorus from septic systems does not represent a threat to surface
water based on results of this study. Further investigations may be required for more
sensitive environments, such as in areas with a large number of nonconforming systems, in
aquifers that have low pH and are poorly buffered, and in areas where drainfields are close
to lakes that lack riparian buffers.
The results for Baxter differ from St. Cloud, where concentrations in unsewered
areas approach the drinking water standard for nitrate. Residential areas in St. Cloud are
older than those found in Baxter. Lot sizes are also smaller in St. Cloud. Additional
Phase 1 sampling is recommended in other unsewered areas of Minnesota. Sampling
should focus on residential areas with differing lot sizes and ages of development, since
individual plumes may take several years to stabilize. This information can be used to
assess potential risk to drinking water receptors for new communities or communities
considering sewering.
The plume investigations in this study were not sufficiently rigorous to evaluate
three important aspects of sewage effects on ground water. First, none of the seven
sampled plumes appeared to discharge to a lake. Additional efforts to track septic plumes
into lakes should focus on probing parallel to shorelines so that plumes can be identified

Effects of Septic Systems on Ground Water Quality - Baxter, Minnesota May, 1999
Ground Water and Assessment Program viii
close to the ground water-surface water interface. Second, a one-time sampling for
bacteria does not address temporal variations in populations, although literature indicates
this is a very important factor. Virus behavior in septic systems was also not studied, and
viruses potentially have more serious health impacts than bacteria. Third, effects of
hydrology on water quality within plumes could not be addressed. Measurements of
recharge, response to precipitation, and measurement of physical parameters (using slug
tests) are necessary to determine how a plume behaves in response to hydrologic factors.
An important consideration in ground water monitoring of septic systems is the
change in water quality following sewering. This monitoring work is not recommended
for Baxter at this time. The median nitrate concentration of 1980 ug/L (parts per billion)
under unsewered areas, although higher than the concentration under sewered areas, is
well below the drinking water standard. The area will largely be sewered within the next
five years, which should prevent further degradation of ground water with nitrate. The
low concentrations prevent easy evaluation of water quality changes following sewering.

Effects of Septic Systems on Ground Water Quality - Baxter, Minnesota May, 1999
Ground Water and Assessment Program 1
Introduction
Septic systems are designed to treat human waste. Properly functioning systems
attenuate organic matter, microbes, and most cations, but not anions. Systems that have
are placed close to the zone of saturation are effective in attenuating nitrogen, but are
ineffective at attenuating pathogens, organic matter, and phosphorus (Noss and Billa,
1988; Kaplan, 1987).
There are nearly half a million septic systems servicing over a million people in
Minnesota. Septic system effluent discharged to the unsaturated zone reaches ground
water, where it impacts water quality. Chemical concentrations in drainfield effluent vary
with the type of use. For a typical household using the drainfield for discharge of
drinking, shower, toilet, and laundry water, concentrations of nitrogen, sodium,
potassium, bicarbonate, chloride, phosphorus, and carbon are greater in septic effluent
than in ground water.
Septic waste discharged to coarse-textured soils proceeds vertically through the
unsaturated zone and into ground water. Once in ground water, a septic plume develops
and moves with ground water flow. Approximate times for septic effluent to pass through
the unsaturated zone to ground water range from a few hours to fifty days, depending on
the volume of effluent and the distance to ground water (Robertson et al., 1991;
Robertson, 1994; Robertson and Cherry, 1995). A septic plume in ground water moves at
a rate similar to the ground water velocity.
Chloride is potentially a good indicator of a septic plume, while sodium, pH, and
specific conductance may occasionally be useful for delineating a plume. Vertical and
lateral (transverse) dispersion of the plume are small, being about 1 and 10 percent,
respectively, of the horizontal (longitudinal) dispersivity (Childs et al., 1974; Brown, 1980;
Anderson et al., 1987; Harman et al., 1996; Robertson et al., 1991).
Pathogens present in septic tank effluent are usually attenuated in the soil
treatment system. Attenuation occurs within a clogging mat, which occurs at the interface
between native soils and drainfield media. If the seasonal high water table is less than
three feet from the system bottom, or if there is preferential flow of sewage for systems
without a clogging mat, microbes can reach ground water. Several cases of bacterial and

Effects of Septic Systems on Ground Water Quality - Baxter, Minnesota May, 1999
Ground Water and Assessment Program 2
viral transport for long distances in ground water have been documented (Yates and
Yates, 1988; Brown, 1980; Hagedorn et al., 1978; Reneau, 1978; DeBorde et al., 1998).
Virus transport can be extremely rapid in ground water. Yates and Yates (1988) observed
virus transport of 400 feet within 100 days.
Wilhelm et al. (1994) and Brown (1980) report that most phosphorus goes into the
septic tank in organic forms, but that orthophosphate accounts for about 80% of the total
phosphorus in the tank effluent. Phosphate precipitates in the unsaturated zone or is
adsorbed in the aquifer close to the drainfield. In old systems, the attenuation capacity
within the unsaturated zone diminishes and phosphate can reach ground water and move
down-gradient in the septic plume. Robertson et al. (1998) observed phosphate migration
exceeding 10 meters in six of ten plumes investigated. In contrast, Harman et al. (1996)
observed phosphate concentrations of less than 1000 ug/L within ten meters of the
drainfield for a 44-year old system servicing an elementary school. Movement of
phosphate rarely exceeds 5 meters, even in very old systems (Wilhelm et al., 1994).
Phosphate may be a concern in poorly buffered systems if the pH within the plume drops
below 6.0.
Volatile Organic Compounds (VOCs) and most semi-volatile organic compounds
are not a component of human waste. Oil and optical brighteners, however, are
commonly found in laundry effluent (Fay et al., 1995; Alhajjar et al., 1990; Kaplan, 1987).
Some VOCs have been used for odor control (Robertson, 1994), while VOCs may also be
introduced into septic systems after household use (e.g., paints, varnishes, degreasers).
Some organic compounds may be present as breakdown products of human waste
(Muszkat et al., 1993). Many organic compounds will be conservative in ground water,
particularly halogenated VOCs.
There is little information on the fate of trace inorganics in septic plumes.
Concentrations of these chemicals, including heavy metals, are typically low in human
waste (Wilhelm et al., 1996; Robertson and Blowes, 1995). Concentrations of trace
inorganics may reach levels of concern in poorly buffered ground water systems where the
pH within the plume falls below 6.0 (Robertson and Blowes, 1995).
Effects of Septic Systems on Ground Water Quality - Baxter, Minnesota May, 1999
Ground Water and Assessment Program 3
Nitrate is the primary chemical of concern in most septic plumes. Nearly all
nitrogen passing through the drainfield converts to nitrate in the aerobic soil zone and
eventually leaches to ground water (Brown, 1980; Walker et al., 1973; Wilhelm et al.,
1996; Kaplan, 1987; Robertson and Cherry, 1995). Nitrates are conservative in shallow
ground water because oxygen is present and total organic carbon concentrations are too
low to sustain intensive microbial activity (Wilhelm et al., 1996), although Steinheimer et
al. (1998) suggest autotrophic denitrification (non-organic food source) may be an
important mechanism of denitrification. Nitrate plumes slowly attenuate as a result of
dilution from recharge water and dispersion within the aquifer. Nitrate concentrations can
exceed drinking water criteria at distances of 100 meters or more from the drainfield.
Predicting nitrate concentrations in an unsewered area consists of quantifying the
contribution of each system. It is difficult, however, to predict the nitrate concentration in
specific locations because plumes may mix and the fate of individual plumes is unknown.
In addition, seasonal changes in ground water flow may occur because of different inputs
from the septic system, effects of surface water bodies, and local pumping from wells.
Researchers have used different approaches to quantify or predict nitrate
distribution in unsewered areas. Hantzsche and Finnemore (1992) drilled several wells in
three different unsewered developments and reported mean nitrate concentrations of 9600
to 13900 ug/L. Concentrations in individual wells ranged from less than 3000 ug/L to
65000 ug/L. Quan et al. (1974) sampled several domestic wells in a deep sand and gravel
aquifer and found concentrations between 5000 and 11000 ug/L. Harmsen et al. (1996)
installed multilevel wells along two hydrologic transects in two separate unsewered
subdivisions with lot sizes ranging from 0.5 to 0.7 acres. Concentrations of nitrates
ranged from 5000 to 15000 ug/L, with average concentrations of 6000 to 8000 ug/L.
Tinker (1991) measured nitrate concentrations in residential wells in five unsewered
subdivisions with lot sizes ranging from 0.5 to 1.1 acre. Concentrations gradually
increased from 1000 to 13000 ug/L from the up-gradient to the down-gradient edge of the
subdivisions. Miller observed median nitrate concentrations of 2000 and 13000 ug/L in
ground water under half acre lot developments that were two and 15 years old,
respectively. Although water quality of individual septic systems are similar regardless of

Effects of Septic Systems on Ground Water Quality - Baxter, Minnesota May, 1999
Ground Water and Assessment Program 4
age, ground water quality within an aquifer will continue to change until plumes from
individual systems stabilize.
Several researchers have attempted to predict nitrate distribution using hydrologic
models (Hantzsche and Finnemore, 1992; Anderson et al., 1987; Baumann and Schafer,
1984). Lot sizes less than 1.0 acre in size in sandy soils result in nitrate concentrations
exceeding the drinking water criteria of 10000 ug/L over a significant portion of the
aquifer.
Despite the vast amount of information on ground water quality associated with
septic wastes, there are research gaps. Researchers have provided limited information
regarding the overall spatial distribution of nitrate in an unsewered subdivision. Because
of this, there is little information useful for quantifying the risk that a particular well will
exceed the drinking water criteria. Since most research has focused on behavior of
individual systems, predictive modeling has used plume information in conjunction with
hydrogeologic information to predict nitrate distributions. This approach lacks calibration
of modeling results with data from an entire unsewered subdivision. There is little
information describing effects of septic systems on surface water (Magner and Regan,
1994). Finally, there have been few long-term monitoring studies conducted in changing
land use settings, such as when an unsewered area is sewered.
We initiated a study in 1998 to assess the environmental impact of on-site sewage
disposal systems on ground water quality. The objectives of the study were to
1. determine the spatial distribution of nitrate in ground water across an unsewered
development; and
2. delineate individual septic plumes and determine the distribution for chemicals of
potential concern within the plumes.
Information from this study may be useful in assessing nutrient loading to lakes from
septic systems, determining overall patterns of risk to human and ecological receptors
resulting from septic system discharges, and developing predictive models.

Effects of Septic Systems on Ground Water Quality - Baxter, Minnesota May, 1999
Ground Water and Assessment Program 5
Methods and Materials
The study was conducted in the City of Baxter, located in east-central Minnesota
(Figure 1). The Branierd-Baxter area has a population of approximately 40000 and is
undergoing rapid expansion with unsewered developments. Many of these developments
consist of lakeshore or near lakeshore property. The study area is located in an area of
sandy soils underlain by a sensitive sand aquifer. Many unsewered developments will be
sewered within the next ten years. Figure 2 illustrates the location of unsewered areas
within the study area.
#
Baxter
#
Twin Cities
N
EW
S
1:500000.5 0 0.5 1 Miles
Minnesota Pollution Control AgencyGround Water Monitoring and Assessment Program
Clearwater
Hig
hway
371
Highway 210
Highland
Eve
rgre
en
Mem
oryw
ood
Mapleton
R ed
R ive
r
Mou
ntai
n A
sh
Oakwoo
d
Excelsior
Ingl
ewoo
d
White SandLake
Perch LakeRush Lake
Sand Lake
Lower Wipple Lake
Miss
issippi
Figure 1 : Location of Baxter study area.

Effects of Septic Systems on Ground Water Quality - Baxter, Minnesota May, 1999
Ground Water and Assessment Program 6
%U%U
%U%U %U
%U
%U%U
%U
%U%U
%U%U
%U%U
%U
%U
%U
#S
#S
#
#S
#S
#S
#
#S
#S
#S
#S
#S
#S
#S
#
#S
#S
#
#S
#S
#S
#
#
#
#S
#S
#S
#S
#S
#
#S
#S
#S
#
Clearwater
Hig
hway
371
Highway 210
Highland
Eve
rgre
en
Mem
oryw
ood
Mapleton
Red
Riv
er
Mou
ntai
n A
sh
Oakwoo
d
Excelsior
Ingl
ewoo
d
White SandLake
Perch LakeRush Lake
Sand Lake
Lower Wipple Lake
Miss
issipp
i
Extent of Sewered AreasMajor Roadways
Ground Flow Direction
# Domestic Well - Lab Data#S Domestic Well - Hach Kit Data
%U Geoprobe - Lab Data
Phase 1 Monitoring Network
0.5 0 0.5 1 Miles1:35000
Minnesota Pollution Control AgencyGround Water Monitoring and Assessment Program
Figure 2 : Map of the study area illustrating sewered and unsewered areas, ground waterflow direction, and sampling locations.
The surficial geology consists of outwash deposits of sand and gravelly sand
associated with the Wadena Lobe. Localized alluvium consisting of less than six feet of
silt loam and loamy sand occurs along the Crow Wing River. Isolated peat deposits and
sandy till lenses are found in the study area but comprise small areas. Peat deposits, where
they are mapped, are associated with organic deposits greater than three feet in thickness
and are found in marshes, often adjacent to lakes and drainageways. Till deposits
Effects of Septic Systems on Ground Water Quality - Baxter, Minnesota May, 1999
Ground Water and Assessment Program 7
associated with the Wadena Lobe are sandy loam, unsorted, and become very dense with
depth. Precambrian age deposits underlie the area, but these are more than 100 feet below
the land surface and are unimportant hydrologically.
Soils belong to the Menahga and Zimmerman series. Menahga (Typic
Udipsamment) consists of light colored, well drained, medium acid loamy soils 4 to 8
inches thick over fine sand. Sands are limy below 4 to 6 feet. Zimmerman (Alfic
Udipsamment) consists of light colored, excessively drained loamy fine sands or fine sands
over acid fine sand and medium sand. Peat occurs in depressions over approximately five
percent of the area. Poorly drained sandy tills, such as those from the Lino series, occur
as lenses within the well-drained sands. Native vegetation is predominantly jack pine.
Average annual precipitation in the study area is about 24.8 inches, 11 of which
falls between June and August. Average July and January temperatures are approximately
70 and 10 oF, respectively. The frost-free period extends from mid-May to late-
September. A National Weather Service station is located at the Branierd airport.
Ground water flows toward the Mississippi River and through the lakes in the
area, as illustrated in Figure 2. During late summer and through winter, ground water
generally flows out from the lakes. Annual recharge to the aquifer is approximately six
inches a year.
Phase 1
The objective of Phase 1 was to determine the distribution of chemicals,
particularly nitrate, across sewered and unsewered areas.
Design and Data Collection
We sampled 40 domestic wells, screened at depths of 0 to 60 feet below the water
table. Figure 2 illustrates sampling locations. The County Well Index (Wahl and Tipping,
1991) provided drilling and geologic information for several hundred wells. The sampling
locations include a range of well depths and assure an approximately even distribution of
wells across the study area.

Effects of Septic Systems on Ground Water Quality - Baxter, Minnesota May, 1999
Ground Water and Assessment Program 8
Field sampling methods are described in MPCA, 1998a. Sample collection for
domestic wells consisted of connecting one end of a hose to an outside spigot and the
other end to a YSI 600XL1 multiparameter probe. Once the spigot was turned on,
continuous measurements of oxidation-reduction potential (mV), temperature (oC), pH,
specific conductance (umhos/cm), and dissolved oxygen (mg/L) were taken. Samples
were collected once temperature, specific conductance, and pH had stabilized to 0.1oC,
10%, and 0.1 pH unit, respectively, for three successive readings. At 28 sites, nitrate was
analyzed in the field using a Hach DR/4000 Spectrophotometer. The remaining 12
samples were analyzed at the University of Minnesota Research Analytical Laboratory
using the cadmium reduction method and a reporting limit of 10 ug/L. Alkalinity,
chloride, and sulfate were measured in the field using commercially available field test kits.
We selected twelve additional locations for geoprobe sampling (Figure 2). Split
spoon samples were collected at four foot intervals and textural analysis was performed on
the split spoon samples (Table 1). The data indicate soils consist primarily of very fine
sands to depths of more than 15 feet. Soil remaining in the 0.1 mm sieve consisted of
uniform, very fine sands. Five-foot screens (0.010 slot, threaded PVC) were installed
across the water table. Samples were pumped using a peristaltic pump until sample
turbidity became uniform and field parameters stabilized. At five sites, an additional
sample was collected 5 to 10 feet below the water table. Dissolved oxygen, oxidation-
reduction potential, pH, temperature, and specific conductance were measured during
pumping. Alkalinity, nitrate-nitrogen, chloride, and sulfate were measured in the field
using commercially available field test kits. Laboratory analysis included major cations
and anions, dissolved and total organic carbon, ammonia-nitrogen, and total Kjeldahl
nitrogen. Reporting limits and analytic methods are summarized in Table 2.
% by WeightSample
IDDepth (ft) > 1 mm
(V. Coarse)1 - 0.5 mm(Coarse)
0.5 - 0.25 mm(Medium)
0.25 - 0.1mm(Fine)
< 0.1 mm(V. Fine)
1 0-4 0.0 0.7 1.9 27.0 70.44-8 0.0 2.6 8.5 41.3 47.7
% by WeightSample Depth (ft) > 1 mm 1 - 0.5 mm 0.5 - 0.25 mm 0.25 - 0.1mm < 0.1 mm
1 Mention of a particular product does not represent endorsement of or preference for that product.

Effects of Septic Systems on Ground Water Quality - Baxter, Minnesota May, 1999
Ground Water and Assessment Program 9
ID (V. Coarse) (Coarse) (Medium) (Fine) (V. Fine)2 0-4 0.0 1.0 8.6 59.6 30.8
4-8 0.0 0.2 1.6 56.3 41.98-12 0.0 1.0 7.6 59.6 31.812-16 0.0 0.4 4.6 60.8 34.216-20 0.0 0.3 2.6 46.4 50.820-24 0.0 0.8 6.2 55.2 37.8
3 0-4 0.0 0.4 3.7 56.2 39.64-8 0.0 0.2 2.5 70.0 27.38-12 0.0 0.4 2.3 44.6 52.812-16 0.0 0.1 0.3 33.2 66.316-20 0.0 0.3 3.0 48.8 47.920-24 0.0 0.3 1.9 65.2 32.5
4 0-4 0.0 0.7 2.5 60.0 36.84-8 0.0 0.1 0.7 40.4 58.88-12 0.5 1.5 5.3 49.7 43.112-16 0.0 0.4 2.4 30.3 66.916-20 0.0 0.6 2.1 31.3 66.0
5 0-4 0.0 0.4 3.1 47.3 49.14-8 0.0 0.3 4.3 48.2 47.18-12 0.0 0.8 8.8 65.0 25.312-16 0.0 0.4 2.6 42.2 54.7
6 0-4 0.0 1.6 5.1 41.4 52.04-8 0.0 2.8 8.4 56.5 32.28-12 0.0 1.6 4.8 53.7 39.912-16 0.0 1.3 2.8 44.1 51.8
7 0-4 0.0 0.7 26.3 63.3 9.64-8 0.0 0.9 19.1 63.6 16.4
8 0-4 0.0 0.9 4.2 55.0 39.94-8 0.0 0.3 1.6 51.5 46.78-12 0.0 1.8 8.3 62.3 27.512-16 0.3 1.1 15.7 62.0 21.0
9 0-4 0.2 1.8 7.8 53.9 36.44-8 0.1 1.0 7.9 50.1 40.98-12 0.0 1.1 6.6 68.8 23.5
10 0-4 0.5 2.3 3.8 33.4 59.94-8 0.0 0.0 0.7 25.1 74.28-12 0.0 0.6 3.7 31.5 64.3
11 0-4 0.2 0.4 6.0 53.6 39.84-8 0.0 0.1 2.3 59.6 38.08-12 0.0 0.2 0.7 36.1 63.0
12 0-4 0.0 0.1 3.5 60.5 35.84-8 0.0 0.9 12.1 58.4 28.68-12 0.8 1.5 6.6 53.1 38.112-16 0.0 0.7 2.7 25.8 70.8
Table 1 : Results of particle size analysis for geoprobe samples.
Parameter Method Reporting Limits (ug/l)

Effects of Septic Systems on Ground Water Quality - Baxter, Minnesota May, 1999
Ground Water and Assessment Program 10
NO3-N Cadmium reduction 500Total phosphorus, Ca, Mg,
Na, K, Fe, Mn, Zn, B ICP14, 5, 20, 60, 100, 3.1,
0.9, 1.7, 6.5Cl, F, SO4, Br Ion chromatography 100, 200, 100, 200
Dissolved Oxygen Field meter 300Alkalinity Titration 1000
Oxidation-reduction potential Field meter 1 mVTotal organic carbon Dohrman carbon analyzer 100
Ammonia Colorimetric 20Kjeldahl-nitrogen Block digestor method 200
Table 2 : Analytic method and detection limit for sampling parameters.
Data Analysis
Statistical methods (MPCA, 1998b) included the Mann-Whitney test for
comparison of nitrate concentrations in sewered and unsewered areas, the Spearmann rank
method for correlation analysis, and the Kruskal-Walis test for comparison of chemical
concentrations between different depth classes. Depth classes included geoprobe samples
screened at the water table, geoprobe samples screened below the water table, domestic
wells less than 30 feet deep, and domestic wells greater than 30 feet deep.
Phase 2
The objective of Phase 2 was to determine the distribution of chemicals in
individual septic plumes.
Design and Data Collection
Temporary wells, installed with a geoprobe, were used to track plumes from seven
conventional septic systems with year-round usage for families of 2 to 5 people. Site
locations are illustrated in Figure 3. General site information is illustrated in Table 3.
Conforming systems are those with three or more feet of soil above the top of the
drainfield and no evidence of soil mottling between the bottom of the drainfield and the
top of the water table (Wespetal, personal communication). Mottling is used as an
indicator of the seasonal high water table, since mottling is considered to occur rapidly

Effects of Septic Systems on Ground Water Quality - Baxter, Minnesota May, 1999
Ground Water and Assessment Program 11
under anaerobic conditions. It is unclear, however, how long the water table must be
close to the bottom of the drainfield to affect the hydraulic performance of the system.
We drilled 20 to 30 temporary wells at each site, but only retained samples
considered to be from the septic plume. These were samples in which field-measured
chloride concentrations were more than twice the measured background concentration.
Figure 3 : Location of individual septic systems selected for sampling.
Conforming Number of Last

Effects of Septic Systems on Ground Water Quality - Baxter, Minnesota May, 1999
Ground Water and Assessment Program 12
Site Description system samples collected pumped1 Approx. 25 people; > 15 years old1 no 16 Sept., 19982 2 people; 5 years old - 9 July, 19953 5 people; 15 years old - 14 -5 2 people; > 20 years old no2 11 -6 2 people; 15-20 years old yes 16 Oct., 19977 5 people; 13 years old no2 17 July, 19978 2 people; > 20 years old - 12 July, 1998
1 System ages are approximate2 Less than three feet of unsaturated soil below the soil treatment system to the seasonally saturated layer
Table 3 : Summary information for the plume sites.
Initially, we located the septic tank and installed three temporary wells at each site.
We used a regional ground water flow map for Baxter (see Figure 2) and site observations
of topography and location of lakes to site wells. One well was installed at the assumed
down-gradient edge of the septic system, a second farther down-gradient of the septic
system, and a third up-gradient of the system. Well casing tops were surveyed to 0.1 foot
and referenced to a fixed benchmark at the site. Depth to water was measured and static
water elevations calculated. We conducted similar measurements for each successive
temporary well. All well locations were determined with a Global Positioning System.
At each of the first three wells, a five foot screen was installed across the water
table. A peristaltic pump was used to purge the well of water. Tubing from the pump was
attached to a YSI 600XL multiparameter probe. The wells were pumped until the water
was not turbid and pH, specific conductance, and temperature stabilized to 0.1 pH unit,
10%, and 0.1 oC, respectively, for three consecutive readings. After the well stabilized,
samples for laboratory analysis were collected for nitrogen species, major cations and
anions, total and dissolved organic carbon, coliform bacteria, and volatile organic
compounds (VOCs). Alkalinity, sulfate, and chloride were measured in the field using
commercially available test kits.
We drilled additional wells to define the horizontal and vertical extent of the
plume. Wells were completed in a manner similar to the first three wells. Field-measured
specific conductance and chloride concentrations were used to identify ground water
impacted by the septic system. Samples for laboratory analysis included major cations and

Effects of Septic Systems on Ground Water Quality - Baxter, Minnesota May, 1999
Ground Water and Assessment Program 13
anions, total and dissolved organic carbon, nitrogen species, VOCs, total coliform
bacteria, and Escherichia coli (E. Coli) bacteria.
A sample from the septic tank was taken at each site using a hand bailer.
Laboratory analysis of septic tank samples included major cations and anions, coliform
bacteria, E. Coli bacteria, VOCs, nitrogen species, and total and dissolved organic carbon.
Cation and dissolved organic carbon samples were filtered with a 0.45 micron in-line filter
(well samples) or a bottle top vacuum filter (tank samples).
We collected two aquifer sediment samples at each site. One of these was in the
septic drainfield and another down-gradient of the drainfield. Cation exchange capacity,
organic carbon content, and carbonate content were determined for each sediment sample.
Following sampling at each site, the drainfield was examined to determine if it met the
appropriate criteria for vertical separation between the bottom of the drainfield and the top
of the seasonal high water table and between the land surface and and the top of the
drainfield (see Table 3).
Data Analysis
Statistical methods included the Mann-Whitney test for comparisons of septic tank
effluent and background ground water concentrations, and for comparisons of septic tank
effluent and maximum concentrations observed in ground water at each site. Chemicals in
which concentrations differed between background and the septic tank were considered to
represent chemicals of potential concern associated with discharge from septic systems.
We estimated the horizontal migration distance for each chemical and plume by plotting
data in Surfer and determining the point where concentrations reached background.
Correlation analysis included the Spearmann rank method.
Results and Discussion
Results are discussed separately for Phase 1 and Phase 2.
Phase 1

Effects of Septic Systems on Ground Water Quality - Baxter, Minnesota May, 1999
Ground Water and Assessment Program 14
Table 4 summarizes concentrations of chemicals in geoprobe samples. pH and
concentrations of nitrate, dissolved organic carbon, and total organic carbon were greater
in unsewered areas than in sewered areas. All three exceedances of the Health Risk Limit
(HRL) of 10000 ug/L for nitrate were in unsewered areas. This represents 25 percent of
the geoprobe samples collected from unsewered areas. There was one exceedance of the
HRL from a domestic well. The elevated concentrations of dissolved and total organic
carbon provide evidence of septic impacts since carbon is associated with septic discharge.
Chloride and sodium, often considered to be tracers of septic plumes, did not differ
in concentration between sewered and unsewered areas. Human wastes are enriched in
sodium and chloride, but road salts are also an important input in sewered areas.
Phosphorus concentrations did not differ between sewered and unsewered areas. This is
not surprising since phosphorus from septic systems is attenuated near the drainfield.
Specific conductance also did not differ between sewered and unsewered areas, even
though specific conductance was a good indicator of septic plumes (see Results for Phase
2). Finally, concentrations of ammonia and Kjeldahl nitrogen did not differ between
sewered and unsewered areas. Like phosphorus, reduced forms of nitrogen are attenuated
close to the drainfield.
Age of development appears to be an important factor affecting the distribution of
nitrate in ground water (Figure 4). The highest concentrations of nitrate in shallow
ground water were observed northwest of Perch Lake. This is an area that was developed
prior to 1990. Development west of this occurred in the 1990’s, and nitrate
concentrations are lower despite similar lot sizes. Developments dated in the 1960’s and
1970’s are scattered throughout the study area. We collected an insufficient number of
samples to assess nitrate distribution in these older areas. Inputs from individual systems
should be similar regardless of age. Consequently, age of development should not be a
factor affecting nitrate concentrations under unsewered areas unless plumes have not
stabilized. We conclude, therefore, that plumes have not yet stabilized in areas developed
since about 1980.
Parameter Unsewered SeweredAlkalinity (ug/L) 148000 96000Ammonia (ug/L) 75 73

Effects of Septic Systems on Ground Water Quality - Baxter, Minnesota May, 1999
Ground Water and Assessment Program 15
Boron (ug/L) 15 13Calcium (ug/L) 60306 35301Chloride (ug/L) 12450 13970
Dissolved organic carbon (ug/L) 3100* 2125Dissolved Oxygen (ug/L) 4330 3330
Eh (mV) 259 270Iron (ug/L) 72 62
Magnesium (ug/L) 12033 7746Manganese (ug/L) 205 131
Nitrate (ug/L) 1980* 778pH 7.37* 6.99
Phosphorus (ug/L) 34 35Potassium (ug/L) 1493 839Sodium (ug/L) 7341 6105
Specific conductance (umhos/cm) 444 286Sulfate (ug/L) 2725 2365
Temperature (oC) 11.2 13.3Total Kjeldahl nitrogen (ug/L) 440 323Total organic carbon (ug/L) 3550* 2400
Zinc (ug/L) 6.6 3.8Table 4 : Median chemical concentration from geoprobe samples in sewered and
unsewered areas. An “*” indicates concentrations that differed between sewered andunsewered areas (at the 0.05 significance level).
Figure 4: Age of development and distribution of nitrate across the study area.

Effects of Septic Systems on Ground Water Quality - Baxter, Minnesota May, 1999
Ground Water and Assessment Program 16
The median nitrate concentration of 1980 ug/L is lower than concentrations found
in other unsewered areas (Anderson et al., 1987; Baumann and Schafer, 1984; Hantzsche
and Finnemore, 1992; Miller; MPCA 1998c; Quan et al., 1974; Tinker, 1991). There may
be several reasons for this. First, ground water flow paths through unsewered
subdivisions are relatively short. Tinker (1991) observed nitrate concentrations of
approximately 1000 ug/L at the upgradient edge of an unsewered subdivision, compared
to concentrations greater than 10000 ug/L at the down-gradient edge. The subdivisions in
the Baxter area cluster around lakes and do not cover large geographical areas. Second,
Miller observed increasing nitrate concentrations with increasing age of the subdivision. In
Baxter, expansion of unsewered subdivisions has not occurred uniformly. Much of the
development in the area has occurred since 1990 and most since 1980 (Figure 4). Third,
there is lake water seepage to the aquifer from late summer through winter. This may
dilute ground water nitrate concentrations on down-gradient sides of the lakes. Fourth,
systems with the saturated zone near the bottom of the treatment system will not
contribute significant amounts of nitrate to ground water because they remain anaerobic.
Information from Phase 2, however, suggests that systems are contributing quantities of
nitrate similar to concentrations found in the literature. Fifth, geochemical conditions
within the aquifer may not support high nitrate concentrations. This is not supported by
the data, however, which show a median Eh of 265 mV and a median dissolved oxygen
content of 4300 mg/L at the water table. Nitrate will be stable under these geochemical
conditions. Finally, nitrogen inputs may be less in Baxter than in other unsewered areas
because of reduced inputs from individual systems or increased lot size compared to other
unsewered areas. Concentrations of nitrate in individual plumes, however, are similar to
concentrations found in other studies. We conclude that nitrate concentrations are
relatively low compared to other unsewered areas primarily because the area is small in
geopgraphic extent. Dilution from lake outflow and the young age of development also
contribute to the low nitrate concentrations.
Nitrate concentrations in geoprobe samples were not correlated with
concentrations of any other chemical. Consequently, nitrate concentrations in the upper

Effects of Septic Systems on Ground Water Quality - Baxter, Minnesota May, 1999
Ground Water and Assessment Program 17
few feet of the aquifer are directly related to nitrogen inputs. Organic carbon, which was
higher in unsewered areas, was correlated with concentrations of ammonia (R2 = 0.492)
and Kjeldahl nitrogen (R2 = 0.804). Septic systems are a potential source of reduced
nitrogen and organic carbon when the seasonal high water table is close to the bottom of
treatment system.
Median values for specific conductance, pH, Eh, and for concentrations of
chloride, nitrate, dissolved oxygen, and iron for different sampling depths are illustrated in
Table 5. Mann-Whitney tests indicate no significant differences in any sampled parameter
between shallow and deep geoprobe samples. Median values for pH, Eh, and for
concentrations of chloride, nitrate, dissolved oxygen, and iron differed between the
shallow temporary wells and deeper domestic wells, however. There are significant
changes in geochemistry at depths of 20 feet or more within the aquifer. Oxygen and
nitrate concentrations decrease, Eh decreases, and iron and manganese concentrations
increase with depth. Figure 5 illustrates the presence of an oxygenated zone to a depth of
about 20 feet in the aquifer. The general pattern of decreasing oxygen and nitrate with
depth is similar to results for St. Cloud (MPCA, 1998c), although the thickness of the
oxygenated zone was less than 10 feet in St. Cloud. Chloride distribution and tritium
sampling from the St. Cloud study indicate post-1953 water extends deeply (up to 80 feet)
into surficial aquifers. Since nitrate is mobile but not found below 20 feet, denitrification
most likely accounts for the loss of nitrate with depth. The change in geochemical
conditions at some depth was abrupt for both the St. Cloud and Baxter studies.
Parameter Geoprobe <5 feet belowwater table
Geoprobe > 5feet belowwater table
Wells < 30feet deep
Wells >30 feetdeep
Chloride (ug/L) 12500 b 19700 ab 28000 a 17000 abDissolved oxygen (ug/L) 3330 ab 6050 a 1870 b 390 c
Eh (mV) 249 a 270 a 316 a 77 bIron (ug/L) 77 b 47 b 200 b 3700 a
Nitrate (ug/L) 950 a 780 ab 700 ab < 100 bpH 7.22 b 7080 b 7.90 a 7.50 a
Specific Conductance(umhos/cm) 418 286 223 281

Effects of Septic Systems on Ground Water Quality - Baxter, Minnesota May, 1999
Ground Water and Assessment Program 18
Table 5 : Median chemical concentrations for different sampling depths. Different letterswithin a row indicate concentrations that differed at a significance level of 0.05.
0
5000
10000
15000
20000
25000
0 20 40 60 80 100
Well or geoprobe depth (ft)
Nitr
ate
(ug/
L)
Figure 5 : Nitrate concentrations as a function of well or geoprobe depth.Considering samples from domestic wells, nitrate was negatively correlated with
well depth (R2 = -0.449) and positively correlated with oxidation-reduction potential (R2 =
0.385). These are not particularly strong correlations, but they reflect the decrease in
nitrate concentrations with depth in the aquifer. The lack of correlations for nitrate in
geoprobe samples indicates concentrations of nitrate in the upper portion of the aquifer are
controlled by inputs at the top of the aquifer. Unless suitable conditions for denitrification
exist within the aquifer, as occur below about 20 feet in the aquifer underlying the study
area, nitrate is conservative in ground water.
Phase 2
The discussion of results for Phase 2 is divided into sections on inorganic
chemicals, bacteria, and Volatile Organic Compounds (VOCs).
Inorganic Chemicals

Effects of Septic Systems on Ground Water Quality - Baxter, Minnesota May, 1999
Ground Water and Assessment Program 19
Septic tank effluent is reducing, with high concentrations of iron, ammonia,
Kjeldahl nitrogen, and low concentrations of nitrate (Table 6). Calcium and magnesium
concentrations were low at Site 8 compared to other sites, while sodium, nickel, copper,
zinc, iron, aluminum, and lead concentrations were high. Concentrations of zinc,
aluminum, and lead at site 8 are at levels of potential concern if effluent reaches ground
water. Site 4 also had high concentrations of most chemicals. Concentrations of
magnesium, bicarbonate, calcium, ammonia, sulfate, and total phosphorus were similar
among the seven sites. Concentrations of total organic carbon, chloride, aluminum, boron,
fluoride, iron, nitrate, sodium, total Kjeldahl nitrogen, and zinc differed between sites.
Median effluent concentrations for all chemicals are within the range found in the
literature (Table 7). Orthophosphate and ammonia in septic tanks accounted for about 80
and 40% of the total phosphorus and nitrogen, respectively. Wilhelm et al. (1994) and
Brown (1980) report that most phosphorus and nitrogen go into tanks in organic forms,
but that orthophosphate and ammonia account for about 80 and 50% of the total
phosphorus and nitrogen in the tank effluent, respectively.
Chemical Site 1 Site 2 Site 3 Site 5 Site 6 Site 7 Site 8Alkalinity - 432000 260000 461000 315000 - 443000Aluminum < 50 < 50 55 559 < 50 160 7936Ammonia 59850 41880 22280 51590 65780 31600 73790
Boron 944 68 13248 76 470 55 763Bromide < 200 < 200 < 200 < 200 < 200 - < 200Cadmium < 1.5 < 1.5 < 1.5 < 1.5 < 1.5 < 1.5 2.4Calcium 34746 60669 60323 82272 50983 101470 69277Chloride 45720 365200 31840 46730 54540 1140910 701140
Chromium 3.1 9.9 3.0 3.8 4.2 < 3.1 9.2Copper < 5.5 < 5.5 18 < 5.5 12 20 80Fluoride < 200 < 200 1020 < 200 < 200 100 1200
Iron 282 94 140 2064 725 257 17153Lead < 25 < 25 < 25 < 25 < 25 < 25 51
Magnesium 7125 45657 13936 17637 11558 20318 15603Manganese 103 74 101 760 282 942 414
Nickel < 6.0 < 6.0 < 6.0 < 6.0 < 6.0 < 6.0 13Nitrate 30 10 20 50 50 1060 20
Orthophosphate 7150 90 4120 8100 10640 - 12030Potassium 13450 981 11636 17958 19231 10649 23743Sodium 103810 19119 42693 88613 49784 645480 466450
Sulfate-S 1300 350 200 3160 1220 510 570Total Kjeldahl nitrogen 67440 630 32280 72170 113080 41100 119310

Effects of Septic Systems on Ground Water Quality - Baxter, Minnesota May, 1999
Ground Water and Assessment Program 20
Total organic carbon 92600 299600 2900 - 162900 54700 271500Total Phosphorus 7149 6309 6202 10465 10984 6546 19104
Zinc 12 7.7 63 389 48 256 1597Table 6 : Concentrations of chemicals in septic tank effluent. Concentrations are in ug/L.
There were a large number of correlations between concentrations of different
chemicals in septic tanks. Metal concentrations were often correlated, including lead with
cadmium (R2 = 1.000), cadmium with nickel (R2 = 1.000), and aluminum with zinc (R2 =
0.845). This is primarily due to a large number of non-detections for these metals,
however. Most of the remaining significant correlations were between chemicals typically
found at elevated concentrations in septic tank effluent. Examples include ammonia with
potassium (R2 = 0.941) and sodium (R2 = 0.824).
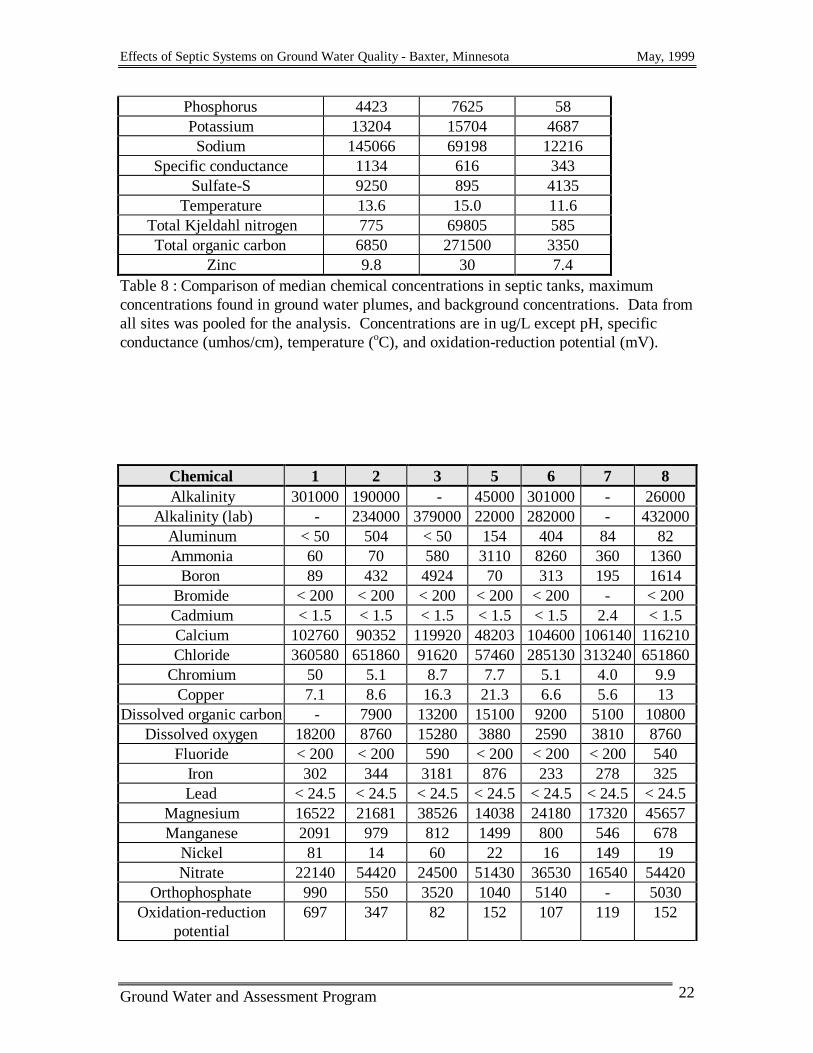
Median concentrations of bicarbonate, boron, ammonia, chloride, iron, sodium,
orthophosphate, and total organic carbon were higher in septic effluent compared to
background concentrations in the aquifer (Table 8). Concentrations of nitrate and sulfate
ChemicalRobertson et
al., 1991Harmon et
al., 1996Robertson et
al., 1991 This study
Alkalinity 365000 802000 316000 432000Ammonia 30000 128000 59000 55720Calcium 40000 137000 14000 60496Chloride 45000 207000 55000 50635
Dissolved organic carbon 37000 19200 50000 10800Magnesium 14000 25000 3000 14769
Nitrate 1000 < 100 100 25Phosphate 8000 9000 13000 7625Potassium 12000 43000 21000 15704Sodium 98000 107000 90000 69198
Sulfate-S 27000 59000 42000 895Total Kjeldahl nitrogen - 152000 - 69805
Table 7 : Comparison of chemical concentrations in septic tanks from different studies.Concentrations are in ug/L.
were lower in the tank effluent compared to background concentrations in the aquifer.
Approximately 80 percent of ammonia nitrogen was converted to nitrate in the
unsaturated zone beneath the drainfield. Within individual systems, the percentage of

Effects of Septic Systems on Ground Water Quality - Baxter, Minnesota May, 1999
Ground Water and Assessment Program 21
ammonia converted to nitrate ranged from 37 to 100 percent. This compares with values
of 70 to 100 percent reported in the literature (Brown, 1980; Gold et al., 1992).
Bicarbonate, nitrogen, boron, iron, sodium, phosphate, and organic carbon are
potential contaminants of ground water because concentrations in septic tank effluent are
higher than background concentrations in the aquifer. Median concentrations of boron,
ammonia, chloride, sodium, phosphorus, and nitrate were higher directly below the
drainfield compared to background concentrations (Table 9). These are chemicals that
may increase in concentration in ground water under unsewered areas compared to
background concentrations. Consequently, these represent potential chemicals of concern
in unsewered residential areas of Baxter.
Chemical Maximum inplume
Tank Background
Alkalinity 22000 432000 130000Aluminum < 49.9 < 49.9 < 49.9
Ammonia-nitrogen 60 55720 55Boron 267 616 33
Bromide < 200 < 200 < 200Cadmium < 1.5 < 1.5 < 1.5Calcium 45749 60496 46722Chloride 107485 50635 20130
Chromium < 3.1 6.7 4.1Copper 5.5 < 5.1 5.8
Dissolved organic carbon 6400 10800 2100Dissolved oxygen 1815 - 2600
Fluoride - < 200 -Iron 228 1395 75Lead - < 24.5 -
Magnesium 11584 14769 9910Manganese 65 348 103
Nickel 13 < 6.0 5.7Nitrate 43435 25 2065
Orthophosphate 2275 7625 30Oxidation-reduction potential 104 52 67
pH 6.37 6.94 6.89
Effects of Septic Systems on Ground Water Quality - Baxter, Minnesota May, 1999
Ground Water and Assessment Program 22
Phosphorus 4423 7625 58Potassium 13204 15704 4687Sodium 145066 69198 12216
Specific conductance 1134 616 343Sulfate-S 9250 895 4135
Temperature 13.6 15.0 11.6Total Kjeldahl nitrogen 775 69805 585Total organic carbon 6850 271500 3350
Zinc 9.8 30 7.4Table 8 : Comparison of median chemical concentrations in septic tanks, maximumconcentrations found in ground water plumes, and background concentrations. Data fromall sites was pooled for the analysis. Concentrations are in ug/L except pH, specificconductance (umhos/cm), temperature (oC), and oxidation-reduction potential (mV).
Chemical 1 2 3 5 6 7 8Alkalinity 301000 190000 - 45000 301000 - 26000
Alkalinity (lab) - 234000 379000 22000 282000 - 432000Aluminum < 50 504 < 50 154 404 84 82Ammonia 60 70 580 3110 8260 360 1360
Boron 89 432 4924 70 313 195 1614Bromide < 200 < 200 < 200 < 200 < 200 - < 200Cadmium < 1.5 < 1.5 < 1.5 < 1.5 < 1.5 2.4 < 1.5Calcium 102760 90352 119920 48203 104600 106140 116210Chloride 360580 651860 91620 57460 285130 313240 651860
Chromium 50 5.1 8.7 7.7 5.1 4.0 9.9Copper 7.1 8.6 16.3 21.3 6.6 5.6 13
Dissolved organic carbon - 7900 13200 15100 9200 5100 10800Dissolved oxygen 18200 8760 15280 3880 2590 3810 8760
Fluoride < 200 < 200 590 < 200 < 200 < 200 540Iron 302 344 3181 876 233 278 325Lead < 24.5 < 24.5 < 24.5 < 24.5 < 24.5 < 24.5 < 24.5
Magnesium 16522 21681 38526 14038 24180 17320 45657Manganese 2091 979 812 1499 800 546 678
Nickel 81 14 60 22 16 149 19Nitrate 22140 54420 24500 51430 36530 16540 54420
Orthophosphate 990 550 3520 1040 5140 - 5030Oxidation-reduction
potential697 347 82 152 107 119 152

Effects of Septic Systems on Ground Water Quality - Baxter, Minnesota May, 1999
Ground Water and Assessment Program 23
pH 8.25 7.83 7.38 7.00 8.08 7.71 7.90Phosphorus 872 5110 4234 1103 5153 72 5110Potassium 5053 23743 13252 16449 16290 21861 20674Sodium 296210 412980 81252 70143 129210 78134 412980
Specific conductance 2260 2576 1069 761 1242 10840 2576Sulfate-S 17560 7910 9910 11230 15140 17400 7460
Temperature 11.9 14.9 19.0 13.9 12.4 11.6 14.0Total Kjeldahl nitrogen 1010 930 7170 4070 970 1410 2330Total organic carbon 14000 12600 126500 18800 13000 12500 13100
Total phosphorus 870 300 40 - 60 - 10Zinc 35 18 24 55 31 18 25
Table 9 : Maximum concentrations observed in plumes for each site.
Ammonia-nitrogen within each plume down-gradient of the drainfields did not
exceed background concentrations. Ammonia-nitrogen can thus be eliminated as a
chemical of potential concern in unsewered areas of Baxter. The maximum concentrations
of nitrate down-gradient of the septic drainfields exceeded the drinking water criteria
(Health Risk Limit or HRL) of 10000 ug/L at all sites (Table 9). Maximum
concentrations ranged from 22140 to 54420 ug/L. These concentrations are similar to
values found in the literature (Robertson et al., 1991; Harmson et al., 1996; Wilhelm et al.,
1994; and Walker et al., 1973). The health-based criterion of 1000 ug/L for manganese
differs from the current HRL of 100 ug/L (Minnesota Department of Health, 1997). The
value of 1000 ug/L was exceeded at two sites. Secondary Maximum Contaminant Levels
were exceeded for aluminum, chloride, and iron at four, four, and five sites, respectively.
Septic systems increase the risk of exceeding drinking criteria for nitrate and chloride.
Elevated concentrations of aluminum, iron, and manganese cannot be attributed to septic
systems because there was no difference in concentrations between septic systems and
background for these chemicals.
Boron was the only chemical for which concentrations in the septic tank were
correlated with the concentration beneath the drainfield. Concentrations of nitrate beneath
the drainfield did not correlate with ammonia concentrations in the septic tank. These
results are surprising, since higher concentrations in the tank should result in higher
concentrations in ground water for conservative chemicals such as chloride and nitrate.
The data indicate rates of nitrification vary beneath different septic systems.

Effects of Septic Systems on Ground Water Quality - Baxter, Minnesota May, 1999
Ground Water and Assessment Program 24
A plume is the portion of ground water impacted by a septic system. Chloride
concentrations two or more times greater than background concentrations represented a
sample collected from a septic plume. Plume travel distances are illustrated in Table 10
for boron, nitrate, chloride, phosphorus, and sodium. Plume lengths, as indicated by
elevated chloride concentrations, were less than 15 meters at Sites 3, 6, and 8 and more
than 140 meters at Site 5. Using static water elevations from field measurements, the head
gradient in the aquifer was about 0.002 m/m. Assuming a conductivity of 1.5 meters per
day and a porosity of 0.25 cm3/cm3, the estimated time for chloride to move 140 meters is
about 32 years. The septic system at Site 5 is more than 20 years old but less than 30
years old, so it is possible this plume has not yet stabilized. Sodium attenuated slowly
within the aquifer, while boron was attenuated only at Site 5. Lee and Bennett (1998)
demonstrate that boron is a good indicator of septic tank inputs to ground water, since
concentrations of boron in effluent are higher than background concentrations in ground
water and because boron is fairly conservative in ground water. Phosphorus moved less
than 12 meters at all sites.
Data from other studies indicate plume lengths of 30 to 130 meters (Robertson et
al., 1991; Harman et al., 1996; Wilhelm et al., 1994; and Walker et al., 1973). Nitrate is
conservative in most studies. Elevated phosphorus concentrations rarely exceed 15 meters
in length within the plume, and are generally less than 5 meters in length (Wilhelm et al.,
1994; Reneau and Pettry, 1976; Rea and Upchurch, 1980).
Site Chloride Boron Nitrate Sodium Phosphorusmeters
1 > 50 30 45 40 122 40 40 40 40 < 53 9 9 9 9 55 140 75 110 80 106 15 15 15 11 127 35 15 30 25 < 58 13 13 13 11 5
Table 10 : Down-gradient distance from the drainfield at which chemical concentrationsapproached background concentrations.

Effects of Septic Systems on Ground Water Quality - Baxter, Minnesota May, 1999
Ground Water and Assessment Program 25
Phosphorus is an important chemical of concern in northern Minnesota. Lakes in
this part of the state have recreational value that can be easily diminished with excessive
inputs of phosphorus. There were no differences in phosphorus concentrations in ground
water under sewered and unsewered areas (Table 4) despite very high phosphorus
concentrations in septic tank effluent (Table 6). Phosphorus in ground water traveled less
than 12 meters from the drainfield at all seven sites, and traveled five or fewer meters at
sites 2, 3, 7, and 8. Phosphorus in the septic plumes sampled in this study has not traveled
far enough to reach lakes. Additional investigations should include studies of plume
stability, phosphorus movement in areas with a large number of nonconforming systems,
and phosphorus movement in low pH and low buffering capacity environments.
Nitrate remained above background concentrations for the entire length of each
plume, except at Sites 5 and 7 (Table 10). The ratio of nitrate to chloride is an indicator
of nitrate attenuation, since chloride is conservative and should decrease in concentration
only by dilution. Nitrate to chloride ratios in the plume decreased at all sites. Maximum
and minimum ratios for each site are illustrated in Table 11. The average background
ratio in the aquifer was 0.07 for all sites combined. The data in Tables 10 and 11 indicate
nitrate is being attenuated within the plume. If dilution were the only mechanism of
dilution, the ratio would decrease slowly. The rapid decrease in the ratio indicates nitrate
is being consumed by microbes through denitrification, is taken up by plants, or is
attenuated through anion adsorption. The mechanism of nitrate loss is unclear. Aravena
and Robertson (1998) observed that about 30% of nitrate loss was attributable to
oxidation of reduced sulfur, with the remaining 70% due to oxidation of organic carbon.
Steinheimer et al. (1998) attributed nitrate loss to autotrophic denitrification in a loess soil,
with ferrous iron being the electron donor.
Site Maximum NO3:Cl ratio Minimum NO3:Cl ratio3 0.58 < 0.035 1.04 0.016 1.23 0.067 0.33 0.048 1.23 0.05
Table 11 : Nitrate to chloride ratios in septic plumes.

Effects of Septic Systems on Ground Water Quality - Baxter, Minnesota May, 1999
Ground Water and Assessment Program 26
Results indicate nitrate is the primary inorganic chemical of concern associated
with septic systems. Management of ground water quality in unsewered areas must
therefore focus on nitrate. If nitrate is being attenuated within septic plumes, data in Table
9 provides an estimate of approximate nitrate plume lengths in Baxter. For a nitrate plume
that is 100 meters in length from a septic system located on a one acre lot, and assuming a
horizontal dispersivity of 0.1, 7.3 percent of the upper portion of the aquifer under that lot
would have nitrate concentrations in excess of the drinking water criteria. With a lot size
of 2.5 acres, this percentage decreases to 2.9 percent. The percentage of exceedances
observed in this study is 25, considerably higher than the calculated rates. There are
several factors that may contribute to the high rate of exceedance. First, sampling may
have been biased toward intercepting septic plumes since samples were collected where
access could be easily obtained. These are areas where septic systems will be located.
Second, the average lot size in Baxter may be less than one acre. Even with a lot size of
one-half acre, however, the exceedance rate would be only 14.6 percent. Third, there may
be other nitrogen inputs, such as lawn fertilizers. These were not measured. Finally, the
plumes sampled during this study may not be representative of plumes in the remaining
unsewered areas of Baxter. Two factors may account for this. First, dilution of the
plumes occurs from lake discharge during certain times of the year. Second,
denitrification occurs in riparian zones along the lakeshore. Five of the sampled plumes
were located along Perch Lake, which has an extensive riparian buffer and discharges to
ground water during late summer.
Figure 6 illustrates concentrations of nitrate along the plume at site 5. The plume
length was estimated by measuring the distance over which chloride concentrations
remained more than two times greater than the background concentration. Curves for
boron and chloride were similar, as would be expected since these are anions that are
generally attenuated only through dilution with recharge water. The nitrate plume extends
vertically to about 10 meters below the soil treatment system. The plume then appears to
move primarily in a lateral direction, although the information collected is insufficient to
verify this. A similar plume shape is evident for total phosphorus (Figure 7). The

Effects of Septic Systems on Ground Water Quality - Baxter, Minnesota May, 1999
Ground Water and Assessment Program 27
phosphorus plume does not extend as deeply into the aquifer and is attenuated within
about 12 meters of the soil treatment system. The shape of these plumes is similar to
those observed in other studies (Robertson, 1995; Robertson and Blowes, 1995;
Robertson et al., 1991).
0 10 20
Meters
-1
0
1
Met
ers
30000
3000020000 10000
Figure 6 : Nitrate concentration, in ug/L, in the septic plume at site 5. Filled circlesrepresent sampling locations.
0 10 20
Meters
-1
0
1
Meters
4000 2000
Drainfield = 10000 ug/L
Figure 7 : Total phosphorus concentration, in ug/L, in the septic plume at site 5. Filledcircles represent sampling locations.
Bacteria
Most probable number (MPN) concentrations of total coliform bacteria in septic
effluent exceeded 200 per 100-mL at all seven sites, with concentrations greater than
240000 per 100-mL at site 2. Reneau (1978) and DeBorde et al. (1998) observed
concentrations for total coliform bacteria of about 500000 per 100-mL. Concentrations of
Drainfield

Effects of Septic Systems on Ground Water Quality - Baxter, Minnesota May, 1999
Ground Water and Assessment Program 28
total coliform bacteria in effluent, the number of detections and non-detections, and
concentration ranges in ground water are summarized in Table 12. Concentrations in
ground water decrease rapidly from about 200 per 100-mL to less than 1 per 100-mL
within 10 meters of the drainfield (Figure 8). Hagedorn et al. (1978) observed a decrease
in total bacteria of more than two orders of magnitude within 15 meters of the drainfield.
They also observed, however, that the greatest movement of bacteria from the drainfield
down-gradient in the septic plume followed precipitation events. Bacteria always reached
3 meters and sometimes 5 meters within 24 hours of a rain event. Brown (1980) observed
a flushing of bacteria through the biomat and underlying soil following rainfall, but
bacteria survival in groundwater was less than 100 days. The current study provides a
best-case scenario with respect to bacteria in ground water, since the period of sampling
was relatively dry. Although bacteria concentrations in ground water are low, the
presence of bacteria indicates additional sampling may be warranted to determine if there
are temporal variations in population. To accomplish this objective, a monitoring network
would need to be established around one or more septic systems and the network sampled
periodically to determine temporal variability in bacteria populations.
Septic tank Ground Water
Siteeffluent
concentrations(MPN/100-mL)
No. of non-detections
No. ofdetections
Range inconcentration
(MPN/100-mL)1 > 2000 3 4 1 to 2002 > 200 1 10 1 to 1403 > 2400 3 6 1 to 115 > 200 5 6 1 to 1206 > 200 3 5 1 to >20007 > 240000 2 6 1 to 2008 > 200 11 4 1 to 12
Table 12 : Summary information for total bacteria found in septic effluent and groundwater down-gradient of individual septic systems.

Effects of Septic Systems on Ground Water Quality - Baxter, Minnesota May, 1999
Ground Water and Assessment Program 29
0 10 20
Meters
-1
0
1
Met
ers
Drainfield = 100000
10010
1
Figure 8 : Concentrations of total coliform bacteria, in MPN/100-ml, in the plume at site5.
There were no detections of E. Coli in ground water at any site, except for a single
detection of 2 per 100-mL at site 7. MPN concentrations in septic effluent were greater
than 200 per 100-mL at all six sites, and appear to be greater than 2000 per 100-mL
(Table 13). Reneau (1978) observed MPN concentrations of greater than 50000 per 100-
mL.
Site E. coli(MPN/100-mL)
1 > 2002 25003 > 2005 > 2006 > 2007 > 24008 > 2000
Table 13: Concentrations of E. Coli in septic tank effluent.
Although bacterial populations are low in the study, some research indicates
viruses may be more persistent and travel farther than bacteria (Brown, 1980; DeBorde et
al., 1998). Viruses generally represent a greater health risk to humans than bacteria.
DeBorde et al. (1998) discuss some of the difficulties in sampling for viruses, including
determining which viruses to sample for, high costs of sampling, and poor correlations

Effects of Septic Systems on Ground Water Quality - Baxter, Minnesota May, 1999
Ground Water and Assessment Program 30
between bacteria and virus populations. Considering results of this study, it would be
useful to sample for viruses in septic effluent and in the sample closest to the drainfield.
Volatile Organic Compounds (VOCs)
Septic effluent contained VOCs at each site. Table 14 summarizes total VOC
concentrations and the number of VOC detections in septic effluent. There was
considerable variability in the number of detections, with three or fewer detections at sites
2, 3, 5, 6, and 8, but 11 and 7 detections at sites 1 and 7, respectively. Total
concentrations of VOCs did not correlate with the number of detections. The highest total
VOC concentrations were at sites 5 and 6, even though just one and two VOCs were
detected in effluent at these sites.
Site Total VOCs (ug/L) No. VOCs detected1 168 112 245 23 305 35 800 16 610 27 138 78 297 2
Table 14 : Total concentration of VOCs in septic tank effluent and number of compoundsdetected.
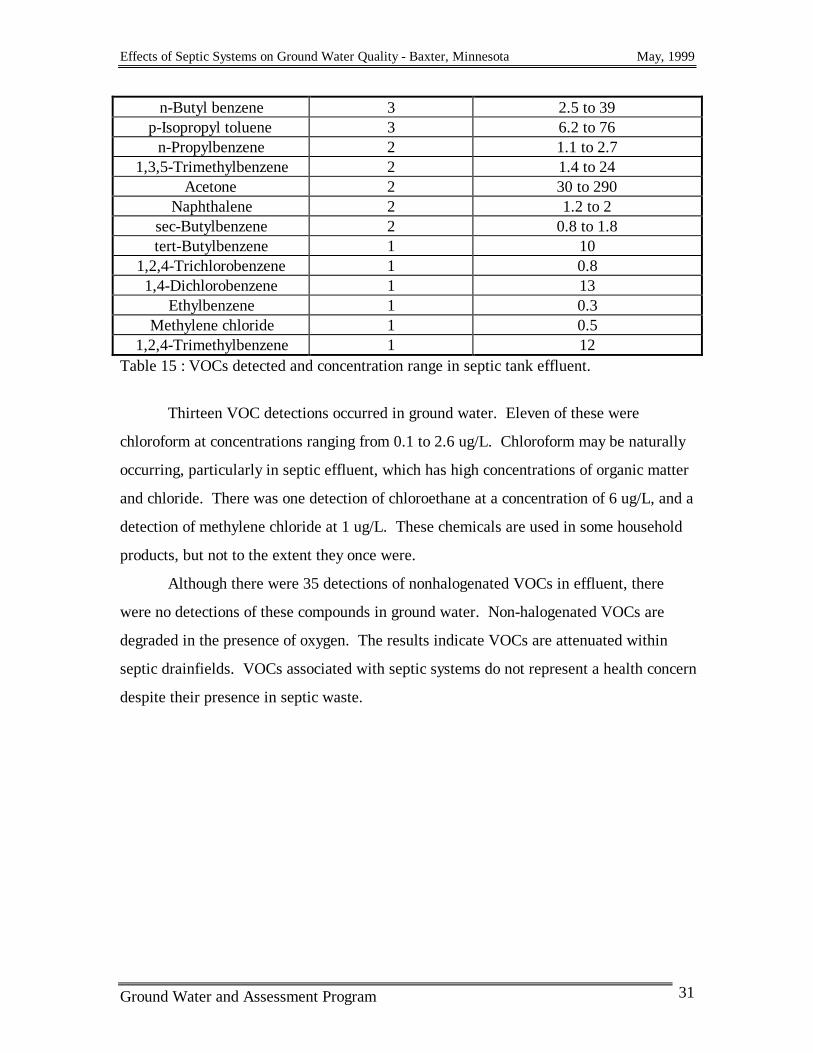
Toluene was the most commonly detected VOC in septic tank effluent, being
found in 7 samples at concentrations ranging from 7 to 800 ug/L (Table 15). Substituted
benzenes accounted for two-thirds of the total detections in effluent. These are commonly
found in fuel oils, gasoline, paints, paint thinners, varnishes, and other solvents commonly
used in households. No VOC in ground water exceeded a drinking water standard.
Chemical No. of detections Concentration range (ug/L)Toluene 7 7 to 800Xylene 4 0.2 to 0.8
Methyl isobutyl ketone 4 7.3 to 220Chemical No. of detections Concentration range (ug/L)
Chloroform 4 0.1 to 0.5
Effects of Septic Systems on Ground Water Quality - Baxter, Minnesota May, 1999
Ground Water and Assessment Program 31
n-Butyl benzene 3 2.5 to 39p-Isopropyl toluene 3 6.2 to 76
n-Propylbenzene 2 1.1 to 2.71,3,5-Trimethylbenzene 2 1.4 to 24
Acetone 2 30 to 290Naphthalene 2 1.2 to 2
sec-Butylbenzene 2 0.8 to 1.8tert-Butylbenzene 1 10
1,2,4-Trichlorobenzene 1 0.81,4-Dichlorobenzene 1 13
Ethylbenzene 1 0.3Methylene chloride 1 0.5
1,2,4-Trimethylbenzene 1 12Table 15 : VOCs detected and concentration range in septic tank effluent.
Thirteen VOC detections occurred in ground water. Eleven of these were
chloroform at concentrations ranging from 0.1 to 2.6 ug/L. Chloroform may be naturally
occurring, particularly in septic effluent, which has high concentrations of organic matter
and chloride. There was one detection of chloroethane at a concentration of 6 ug/L, and a
detection of methylene chloride at 1 ug/L. These chemicals are used in some household
products, but not to the extent they once were.
Although there were 35 detections of nonhalogenated VOCs in effluent, there
were no detections of these compounds in ground water. Non-halogenated VOCs are
degraded in the presence of oxygen. The results indicate VOCs are attenuated within
septic drainfields. VOCs associated with septic systems do not represent a health concern
despite their presence in septic waste.

Effects of Septic Systems on Ground Water Quality - Baxter, Minnesota May, 1999
Ground Water and Assessment Program 32
Conclusions and Recommendations
Results from Phase 1 of the Baxter study indicates higher pH and concentrations
of nitrate, total organic carbon, and dissolved organic carbon in unsewered areas
compared to sewered areas. Since nitrate concentration in the upper 10 feet of the aquifer
was not correlated with any parameter, differences in nitrate concentrations between
sewered and unsewered areas are due to greater nitrogen inputs in unsewered areas.
Concentrations of nitrate under unsewered areas in Baxter are less than concentrations
under unsewered areas described in the literature. Concentrations of most chemicals in
septic tanks and plumes were similar to concentrations found in the literature. Therefore,
the most likely reason for the lower concentrations of nitrate is that unsewered
developments are small in geographic extent compared to other studies in the literature.
Although nitrate concentrations in this study were low compared to other studies, 25
percent of sampled geoprobes exceeded the drinking water criteria for nitrate.
Concentrations of nitrate decrease when ground water conditions become
favorable for denitrification. Considering all well and geoprobe samples, nitrate
concentration decreased with increasing well depth and with decreasing Eh (oxidation-
reduction potential). Nitrate was detected in samples collected from the upper 20 feet of
the aquifer, but not in any sample below that depth. There appears to be a zone between
10 and 20 feet where denitrification rapidly occurs. This denitrification zone is somewhat
deeper than observed in the St. Cloud land use study. Denitrification also appears to
occur in riparian zones along the lakes where sampling occurred.
The following general recommendations are based on the results of this study.
1. Additional Phase 1 investigations should be conducted in other areas. Age of
development and lot size are two variables that need to be evaluated with respect to
impacts of septic systems on ground water quality. Age of development may be an
important factor if it takes several years for plumes to stabilize.
2. Additional plume investigations should focus on three areas of investigation. First is
gaining an understanding of the relationship between plumes and lake water quality.
Plumes which discharge to lakes must be identified. Rather than track plumes from

Effects of Septic Systems on Ground Water Quality - Baxter, Minnesota May, 1999
Ground Water and Assessment Program 33
the septic tank to a lake shore, plumes should be identified near the shore-lake
interface. This may be accomplished by probing parallel to this interface until a plume
is encountered. Second, greater effort needs to be made to determine the behavior of
microbes originating in the septic tank. Sampling should be expanded to include
viruses. A permanent monitoring network should be established in a plume where
bacteria have been identified in ground water. Temporal factors are likely to be
important for understanding the behavior and fate of microbes in ground water.
Sampling should therefore occur following significant precipitation events. Third,
hydrologic relationships need to be assessed within individual plumes. A permanent
network should be established within a plume. Recharge measurements should be
made using continuous water level measurements. Slug tests would be performed in
each well. Chemical concentrations would be measured quarterly and after significant
precipitation effects. The objective of this study would be to evaluate temporal
variability in ground water quality within a plume.
The following recommendations are made for the Baxter area.
1. A phase 3 study should not be conducted in Baxter. Phase 3 is a long-term study of
ground water quality following a change in land use, such as unsewered to sewered.
Even though the Baxter area will be sewered over the next few years, nitrate
concentrations are too low to easily evaluate changes in water quality.
2. If portions of Baxter remain unsewered, or if unsewered development continues in the
city, management plans should be developed to minimize risk to drinking water
receptors and lakes. Management strategies would include minimum lot sizes, setback
distances from lakes, minimum depths for domestic wells, and pumping restrictions
from the aquifer underlying unsewered areas. Engineering strategies also limit impacts
from septic systems by providing better treatment of wastes. Engineering strategies
include separating grey and black water, maintaining appropriate separation distances
in the unsaturated zone, and advanced treatment of waste.
Effects of Septic Systems on Ground Water Quality - Baxter, Minnesota May, 1999
Ground Water and Assessment Program 34
References
Alhajjar, B.J., G. Chesters, and J.M. Harkin. 1990. Indicators of Chemical Pollutionfrom Septic Systems. Ground Water. 28:559-568.
Anderson, D.L., J.M. Rice, M.L. Voorhees, R.A. Kirkner, and K.M. Sherman. 1987.Ground Water Modeling with Uncertainty Analysis to assess the ContaminationPotential from Onsite sewage Disposal Systems (OSDS) in Florida. Proceedingsfrom the National Symposium on Individual and Small Community Sewage Systems,December 14-15. Chicago, IL. 411 pp.
Aravena, R., and W.D. Robertson. 1998. Use of Multiple Isotope Tracers to EvaluateDenitrification in Ground Water: Study of Nitrate from a Large-flux Septic SystemPlume. Ground Water.
Bauman, B.J. and W.M. Schafer. 1984. Estimating Ground-water Quality Impacts fromOn-site Sewage Treatment Systems. Proceedings of the Fourth National HomeSewage Treatment Symposium. ASAE pp. 285-294.
Brown, K.W. 1980. An Assessment of Impacts of Septic Leachfields, Home LawnFertilization, and Agricultural activities on Ground water Quality. 104 p.
Childs, K.E., S.B. Upchurch, and B. Ellis. 1974. Sampling of Variable, Waste-MigrationPatterns in Ground Water. Groundwater. 12:369-377.
DeBorde, D.C., W.W. Woessner, B. Lauerman, and P.N. Ball. 1998. Virus Occurrenceand Transport in a School Septic System and Unconfined Aquifer. Ground Water
Fay, S.R., R.C. Spong, S.C. Alexander, and E.C. Alexander Jr. 1995. OpticalBrighteners: Sorption Behavior, Detection, Septic System Tracer Applications.Published in: Proceedings of the International Association of Hydrogeologists XXVIInternational Congress, Edmonton, Alberta, Canada.
Fetter, C.W. Jr., W.E. Sloey, and F.L. Spangler. 1976. Potential Replacement of SepticTank Drain Fields by Artificial Marsh Wastewater Treatment Systems. Groundwater396-401.
Gold, A.J., B.E. Lamb, G.W. Loomis, J.R. Boyd, V.J. Cabelli, and C.G. McKiel. 1992.Wastewater Renovation in Buried and Recirculating Sand Filters. Jour. Environ.Qual. 21:720-725.
Hagedorn, C., D.T. Hansen, and G.H. Simonson. 1978. Survival and Movement of FecalIndicator bacteria in Soil under Conditions of Saturated Flow. Jour. Environ. Qual.7:55-59.

Effects of Septic Systems on Ground Water Quality - Baxter, Minnesota May, 1999
Ground Water and Assessment Program 35
Hantzsche, N.N., and E.J. Finnemore. 1992. Predicting Ground-Water Nitrate-NitrogenImpacts. Groundwater. 30:490-499.
Harman, J., W.D. Robertson, J.A. Cherry, and L. Zanini. 1996. Impacts on a sandaquifer from an old septic system: nitrate and phosphate. Ground Water 34:1105-1114.
Harmsen, E.W., J.C. Converse, B.H. Shaw, E.J. Tyler, and J.O. Peterson. 1996. Spatialand Temporal Distribution of Groundwater Nitrate-N beneath Two UnseweredSubdivisions in the Central Wisconsin Sand Plain.
Kaplan, B.O. 1987. Septic Systems Handbook. Lewis Publishers. Chelsea, Michigan.290 p.
Lee, R.W., and P.C. Bennett. 1998. Reductive Dissolution and Reactive SoluteTransport in a Sewage-Contaminated Glacial Outwash Aquifer. Ground Water36:483-595.
Magner, J.A., and C.P. Regan. 1994. Tools and Techniques for the Assessment ofGround Water/Surface Water Interactions in Glacial Hydrogeologic Settings. In:Ground Water Management Series. National Ground Water Association. Dublin,OH 18:685-698.
Miller, J.C. Nitrate Contamination of the Water-Table Aquifer by Septic Tank Systems inthe Coastal Plain of Delaware.
Minnesota Department of Health. 1997. Health Based Value for Manganese. OfficeMemorandum by Larry Gust, Supervisor, Health Risk Assessment Unit. St. Paul,MN. 1 p.
Minnesota Pollution Control Agency. 1998a. GWMAP Field Guidance Manual. St. Paul,MN 42p.
Minnesota Pollution Control Agency. 1998b. Data Analysis Protocol for the GroundWater Monitoring and Assessment Program (GWMAP). Draft in review.
Minnesota Pollution Control Agency. 1998c. Effects of Land Use on Ground WaterQuality. St. Cloud Area, Minnesota. 1997 Results. St. Paul, MN 59 p.
Muszkat, Lea, Daniel Raucher, Mordeckai Magaritz, Daniel Ronen, and Abraham J.Amiel. 1993. Unsaturated zone and ground-water contamination by organicpollutants in a sewage-effluent-irrigated site. Ground Water. 31:556-565.
Noss, R.R., and M. Billa. 1988. Septic System Maintenance Management. Journal ofUrban Planning and Development. 114:73-90.

Effects of Septic Systems on Ground Water Quality - Baxter, Minnesota May, 1999
Ground Water and Assessment Program 36
Quan, E.L., H.R. Sweet, and J.R. Illian. 1974. Subsurface Sewage Disposal andContamination of Ground Water in East Portland, Oregon. Groundwater 12:356-366.
Rea, R.A., and S.B. Upchurch. 1980. Influence of Regolith Properties on Migration ofSeptic Tank Effluent. Groundwater 118-125.
Reneau, R.B. Jr. 1978. Influence of Artificial Drainage on Penetration of ColiformBacteria from Septic Tank Effluents into Wet Tile Drained Soils. Jour. Environ.Qual. 723-30.
Reneau, R.B., and D.E. Pettry. 1976. Phosphorus Distribution from Septic TankEffluent in Coastal Plain Soils. Jour. Environ. Qual. 5:34-39.
Robertson, W.D. 1995. Development of Steady-state Phosphate Concentrations inSeptic System Plumes. Journal of Contaminant Hydrology. 19:289-305.
Robertson, W.D., and D.W. Blowes. 1995. Major Ion and Trace Metal Geochemistry ofan Acidic Septic-System Plume in Silt. Groundwater. 33:275-283.
Robertson, W.D. 1994. Chemical Fate and Transport in a Domestic Septic System: SiteDescription and Attenuation of Dichlorobenzene. Environ. Toxicol. and Chem.13:183-191.
Robertson, W.D., and J.A. Cherry. 1995. In Situ Denitrification of Septic-System Nitrateusing Reactive Porous Media Barriers: Field Trials. Groundwater. 33:99-111.
Robertson, W.D, J.A. Cherry, and E.A. Sudicky. 1991. Ground-water contaminationfrom two small septic systems on sand aquifers. Ground Water. 29:82-92.
Steinheimer, T.R., K.D. Scoggin, and L.A. Kramer. 1998. Agricultural ChemicalMovement through a Field-Size Watershed in Iowa: Subsurface Hydrology andDistribution of Nitrate in Groundwater. Environ. Sci. Tech. 32:1039-1047.
Tinker, J.R. Jr. An Analaysis of Nitrate-nitrogen in Ground Water beneath UnseweredSubdivisions. Ground Water Monitoring Review. 11:141-150.
Wahl, T. E., and R. G. Tipping. 1991. Ground-water Data Management - The CountyWell Index. Minnesota Geological Survey. Minneapolis, MN. 38 p.
Walker, W.G., J. Bouma, D.R. Keeney, and P.G. Olcott. 1973. NitrogenTransformations during Subsurface Disposal of Septic Tank Effluent in Sands: II.Ground Water Quality. Jour. Environ. Qual. 4:521-525.

Effects of Septic Systems on Ground Water Quality - Baxter, Minnesota May, 1999
Ground Water and Assessment Program 37
Wilhelm, S.R., S.L. Schiff, and W.D. Robertson. 1994. Chemical Fate and Transport ina Domestic Septic System: Unsaturated and Saturated Zone Geochemistry. Environ.Toxic. Chem. 13:193-203.
Wilhelm, S.R., S.L. Schiff, and W.D. Robertson. 1996. Biogeochemical Evolution ofDomestic waste Water in Septic Systems: 2. Application of Conceptual Model inSandy Aquifers. Groundwater 34:853-864.
Yates, M.V. and S.R. Yates. 1988. Septic Tank Setback Distances : A Way to Minimize
Virus Contamination of Drinking Water. Ground Water 202-208.