Going From Centralized Wastewater Treatment to Decentralized Wastewater Treatment

41-JPH B113
Effects of Sea Level Rise on Water Treatment & Wastewater
Treatment Facilities
An Interactive Qualifying Project
Submitted to the faculty of
WORCESTER POLYTECHNIC INSITUTE
In partial fulfilment of the requirements for the
degree of Bachelor Science
Sponsoring Agency: Massachusetts Department of Environmental Protection
Submitted by:
Adam Blumenau
Cody Brooks
Eric Finn
Alicia Turner
Date: October 14, 2011
Report Submitted to:
MassDEP Sponsors Douglas Fine, Ann Lowery, Lee Dillard Adams, and Brian Brodeur
Professors James Hanlan and Holly Ault
Worcester Polytechnic Institute
This report represents work of WPI undergraduate students submitted to the faculty as
evidence of a degree requirement. WPI routinely publishes these reports on its website
without editorial or peer review. For more information about the projects program at
WPI see
http://www.wpi.edu/Academics/Projects

i
Abstract
Sea level rise and its associated effects threaten coastal water utilities in
Massachusetts. The Massachusetts Department of Environmental Protection does not
know which facilities are at greatest risk of flooding and cannot easily evaluate the
impacts of a flood event on particular facilities. Our goal was to identify past research in
this field, create a tool to evaluate hazard to coastal water facilities and measure the
impact of flooding on these facilities. We have also provided the structure to expand
upon these tools and make recommendations to the Massachusetts Department of
Environmental Protection for what they can do in the future to focus their mitigation
efforts.
ii
Executive Summary
Scientific research has shown that sea levels are rising at a significant rate of
around 3 millimeters per year (Intergovernmental Panel on Climate Change, 2007).
Massachusetts’ coastlines have become subject to high risk of flooding due to this rise
and little has been done to ameliorate this threat. In 2010, the Massachusetts Department
of Environmental Protection (MassDEP) conducted a study along with a group of
students from WPI and identified multiple risks related to climate change which threaten
Massachusetts’ coastal infrastructure. One of the problems identified by this team was the
risk of flooding of wastewater and drinking water treatment systems.
With the onset of rising sea levels, many water utilities have become threatened
by flooding which can have multiple negative consequences. Flooded drinking water
systems face a threat of contamination due to flood waters and saltwater intrusion. A
drinking water system can also suffer structural damage; both occurrences could force the
facility to deny clean water to thousands of citizens. Flooded wastewater facilities have
the potential to release untreated waste into the ecosystem, thus causing significant
damage to the environment and people alike. If the wastewater facility suffered structural
damage it may have to release untreated waste for an extended period of time until the
plant can be fixed. Flood damage would be costly to drinking water and wastewater
municipalities both in terms of financial loss and in terms of threats to public health.
Careful advance planning to prepare for the consequences of sea level rise and flooding is
essential.
The primary goal of our project was to develop and apply a risk assessment tool
as well as an impact assessment tool. These tools allowed us to identify the most at-risk

iii
coastal facilities and assess the impact a flood would have on the facility itself as well as
towns served by the facility. We worked with the Massachusetts Department of
Environmental Protection to develop criteria by which they could measure the level of
risk faced by water treatment facilities in the event of rising sea levels and storms
resulting from climate change as well as the impact this event would have on the
surrounding community. These criteria were further narrowed through research of risk
factors, and interviews with experts in the fields of hazard assessment and water
treatment. The factors included in our assessment for wastewater facilities were: history
of past flooding, presence of combined sewer system, location relative to Federal
Emergency Management Agency (FEMA) flood zones, location relative to Army Corps
of Engineers (ACE) hurricane inundation zones, and location relative to predicted Army
Corps of Engineers hurricane inundation zones. Similarly the factors used to assess
drinking water facilities were: location relative to Federal Emergency Management
Agency (FEMA) flood zone, location relative to Army Corps of Engineers hurricane
inundation zone, and location relative to predicted Army Corps of Engineers hurricane
inundation zone.
Our assessment was applied to 18 coastal wastewater facilities and 17 coastal
drinking water systems. Of these 35 facilities, we were able to visit and perform five
onsite analyses. While there the team also interviewed site managers to get a better
understanding of problems related to potential flood damage at each of the specific sites.
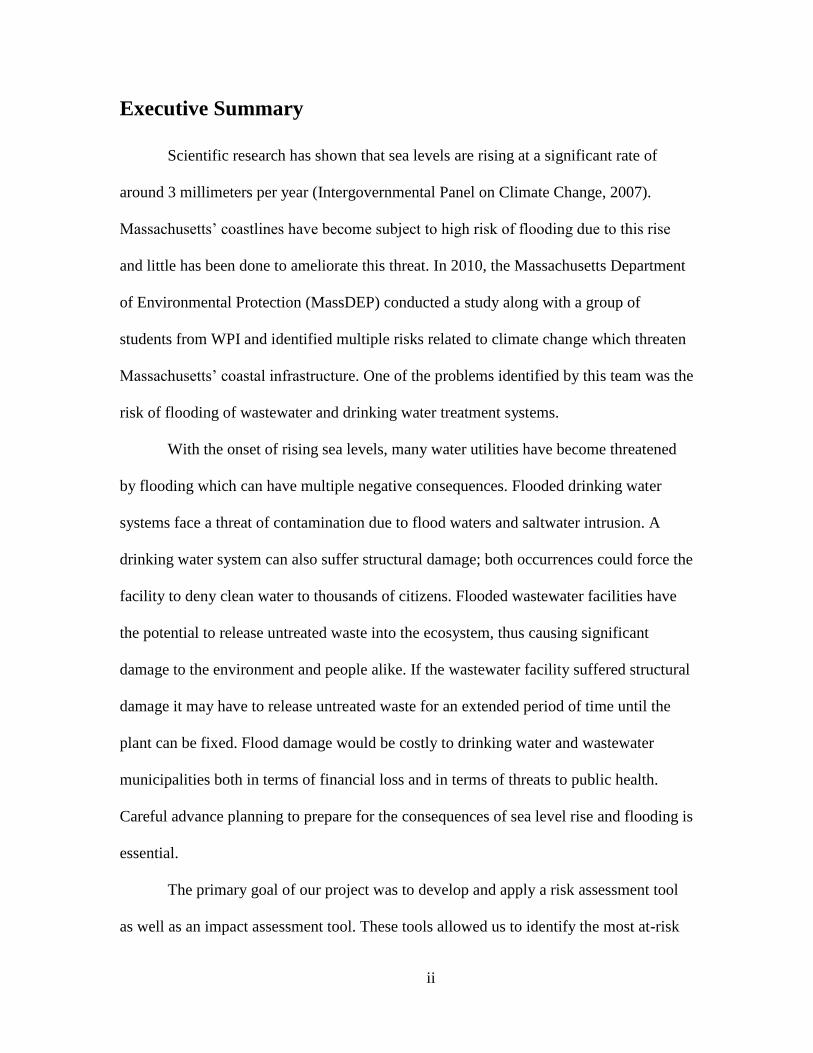
Figure ES.1 below shows the risk rankings of the 18 costal wastewater treatment facilities
with those in red receiving a high risk rating, orange a medium rating, and green a low
risk rating.
iv
Figure ES. 1: Wastewater Facility Risk Rankings
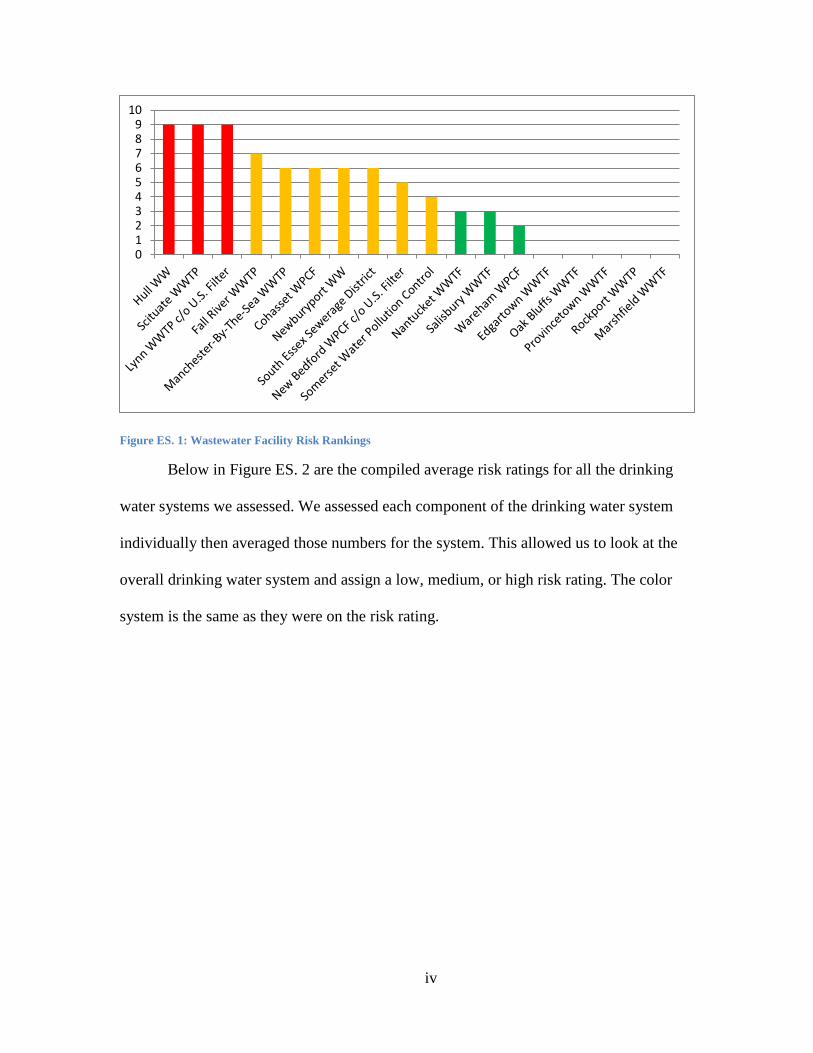
Below in Figure ES. 2 are the compiled average risk ratings for all the drinking
water systems we assessed. We assessed each component of the drinking water system
individually then averaged those numbers for the system. This allowed us to look at the
overall drinking water system and assign a low, medium, or high risk rating. The color
system is the same as they were on the risk rating.
0123456789
10
v
Figure ES. 2 Average Risk Rating
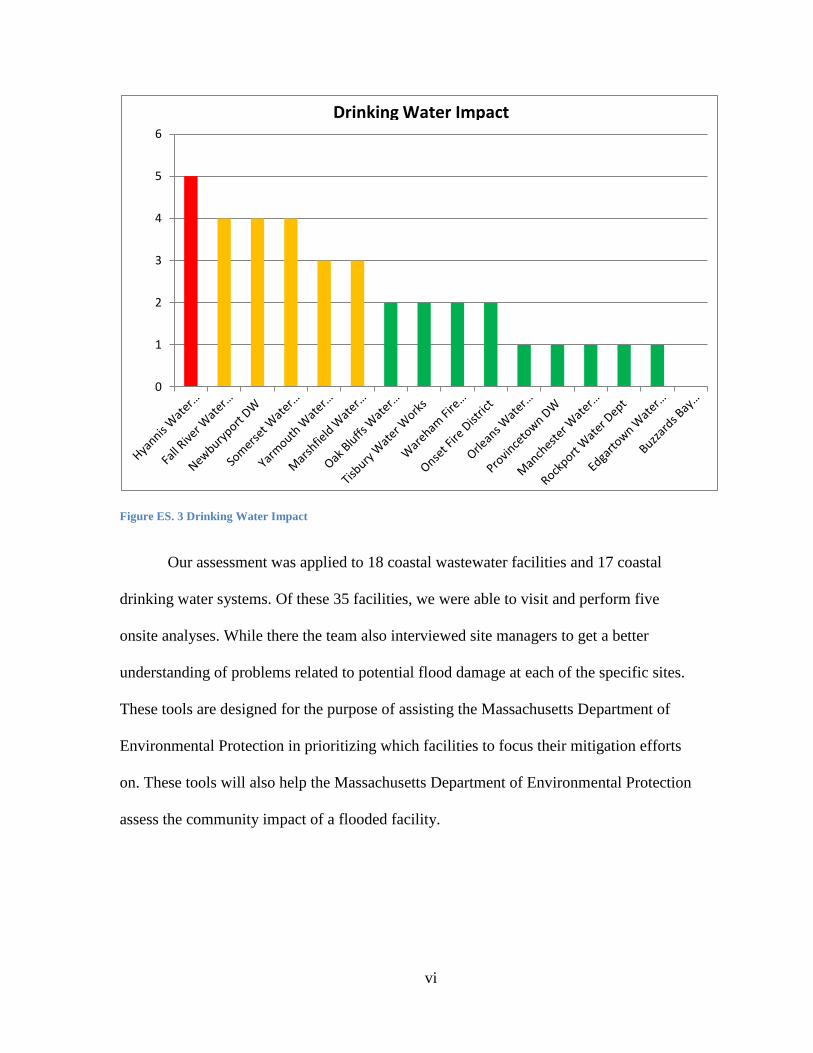
To consider the effects of a facility flooding on the surrounding community, we
created an impact assessment tool. Suitable tools were developed for both drinking water
and wastewater facilities. The factors we considered for drinking water include: number
of days’ worth of stored finish water, populations served, and location of the supply
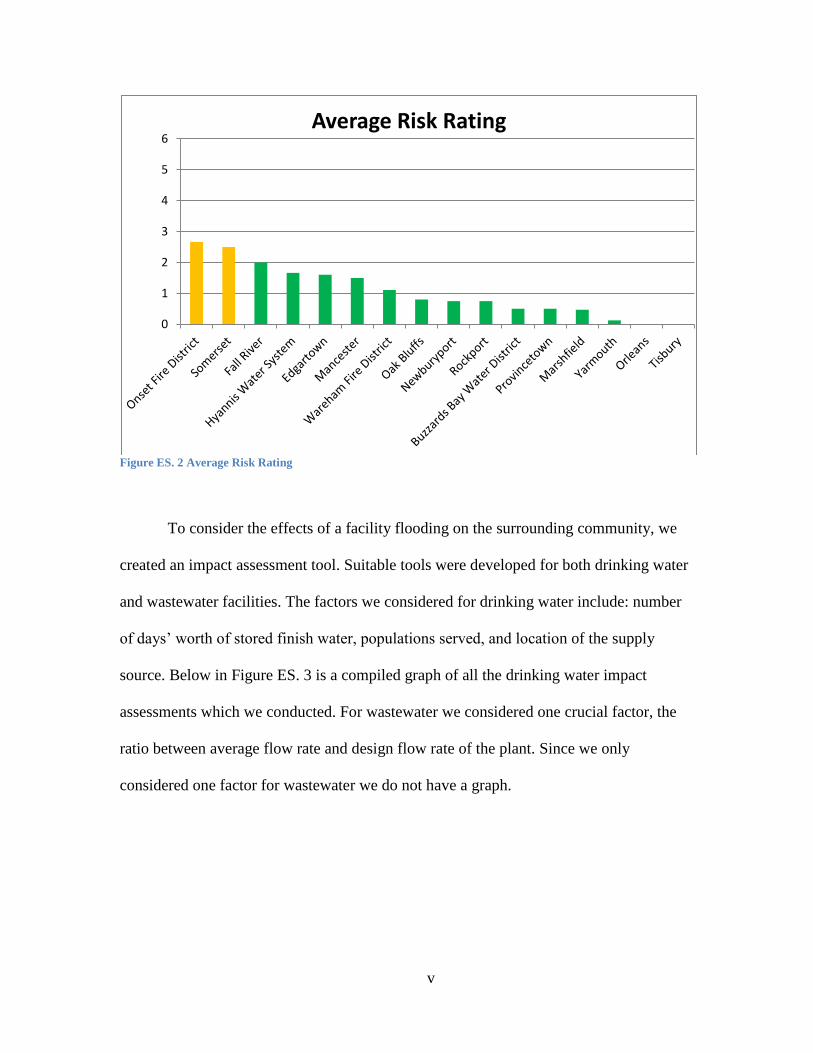
source. Below in Figure ES. 3 is a compiled graph of all the drinking water impact
assessments which we conducted. For wastewater we considered one crucial factor, the
ratio between average flow rate and design flow rate of the plant. Since we only
considered one factor for wastewater we do not have a graph.
0
1
2
3
4
5
6Average Risk Rating
vi
Figure ES. 3 Drinking Water Impact
Our assessment was applied to 18 coastal wastewater facilities and 17 coastal
drinking water systems. Of these 35 facilities, we were able to visit and perform five
onsite analyses. While there the team also interviewed site managers to get a better
understanding of problems related to potential flood damage at each of the specific sites.
These tools are designed for the purpose of assisting the Massachusetts Department of
Environmental Protection in prioritizing which facilities to focus their mitigation efforts
on. These tools will also help the Massachusetts Department of Environmental Protection
assess the community impact of a flooded facility.
0
1
2
3
4
5
6
Drinking Water Impact

vii
Authorship Table Section Author Proofread Executive Summary Alicia Turner Adam Blumenau Introduction Adam Blumenau Alicia Turner Background Cody Brooks & Eric Finn Cody Brooks & Eric Finn 2.1 Eric Finn Alicia Turner
2.2 Cody Brooks & Alicia Turner Adam Blumenau and Eric Eric Finn
2.3 Adam Blumenau Cody Brooks 3.1 Cody Brooks & Alicia Turner Eric Finn 3.2 Adam Blumenau Cody Brooks
Sponsor description Eric Finn Cody Brooks Interview protocol Alicia Turner Adam Blumenau Methods Cody Brooks Eric Finn Introduction paragraph Eric Finn Adam Blumenau Chapter 4 Risk Factors Adam Blumenau Cody Brooks Chapter 5 Risk Assessment Tool Cody Brooks Alicia Turner Chapter 6 Impact Factors Adam Blumenau Alicia Turner Chapter 7 Impact Assessment Tools Eric Finn Adam Blumenau Conclusion Cody Brooks Alicia Turner

viii
Acknowledgements
The team would like to thank our sponsors: Douglas Fine, Ann Lowery, Lee
Dillard Adams, and Brian Brodeur for all the help they have given us as well as their
constant kindness and understanding. We would like to thank Robert Bradbury, Paul
Colby, Carl Hillstrom, Edward Petrilak, Chris Rowe, and Barry Yaceshyn for their
insight into water utility operation and flood preparation. We would like to thank our
contacts in the MassDEP and its regional offices, David Burns, Brian Dudley, David
Ferris, Jeffrey Gould, Damon Guterman, Paul Niman, Sandra Rabb, and Eric Worrall for
all their help. We would like to thank our out of state contacts, Bill Quirk, Matthew
Heberger, Heather Cooley, Eli Moore, Dr. Peter Glieck, Krista Romero, Kevin O’Brien,
Joel Johnson, Matt Kuharic, Harry Reinert, Carter Strickland, Daniel Nvule, Stephen
Estes-Smargiassi and Joe Martens for all their help in collecting data. A final thanks goes
to our advisors Professor Holly Ault and Professor James Hanlan for their aid to us
throughout these past fourteen weeks working on the IQP.
ix
TABLE OF CONTENTS
ABSTRACT .............................................................................................................................. I
EXECUTIVE SUMMARY .......................................................................................................... II
AUTHORSHIP TABLE ............................................................................................................ VII
TABLE OF TABLES ................................................................................................................ XII
1 INTRODUCTION ...................................................................................................................1
2 BACKGROUND .....................................................................................................................3 2.1 CLIMATE CHANGE ...................................................................................................................... 3
2.1.1 Rising Sea Levels ............................................................................................................ 3 2.2 WATER UTILITIES ..................................................................................................................... 4
2.2.1 Drinking Water Treatment ............................................................................................. 4 2.2.2 Wastewater Treatment ................................................................................................ 7 2.2.3 Effects of Flooding on Water Utilities ........................................................................ 10
2.3 PREVIOUS SOLUTIONS TO PROTECT WATER UTILITIES .................................................................... 13 2.4 CONCLUDING THOUGHTS .......................................................................................................... 14
3 METHODS ......................................................................................................................... 15 3.1 DEVELOPING A HAZARD ASSESSMENT TOOL ................................................................................. 15
3.1.1 Identifying Coastal Water Utilities ............................................................................... 15 3.1.2 On & Off-site Data Collection & Analysis ..................................................................... 16 3.1.3 Interviewing Risk Analysis Experts & Plant Operators ................................................. 17 3.1.4 Developing a Hazard Assessment Tool ........................................................................ 18
4 RISK FACTORS ............................................................................................................. 19 4.1 PAST FLOODING ...................................................................................................................... 19 4.2 FEMA FLOOD ZONES ............................................................................................................... 19 4.3 ARMY CORPS OF ENGINEERS HURRICANE INUNDATION AREAS ........................................................ 20 4.4 PREDICTED FUTURE HURRICANE INUNDATION AREAS .................................................................... 20 4.5 ELEVATIONS OF INDIVIDUAL FACILITY COMPONENTS ...................................................................... 22 4.6 PROTECTIVE STRUCTURES .......................................................................................................... 22 4.7 COMBINED SEWER AND STORM DRAIN SYSTEM ............................................................................ 22
5 RISK ASSESSMENT TOOL ........................................................................................... 24 5.1 DEVELOPMENT ........................................................................................................................ 24
5.1.1 History of Past Flooding ............................................................................................... 25 5.1.2 FEMA Flood Zones ........................................................................................................ 25 5.1.3 ACE Hurricane Inundation Area ................................................................................... 25 5.1.4 Predicted ACE Hurricane Inundation Area ................................................................... 26 5.1.5 Combined Sewer System .............................................................................................. 26 5.1.6 Risk Assessment Scale .................................................................................................. 26 5.1.7 Future Risk Assessment Factors ................................................................................... 27
5.2 APPLICATIONS ......................................................................................................................... 27 5.2.1 Wastewater ................................................................................................................. 27 5.2.2 Drinking Water............................................................................................................. 32
6 IMPACT FACTORS .............................................................................................................. 38 6.1 SOURCE TYPE .......................................................................................................................... 38

x
6.2 POPULATION SERVED ............................................................................................................... 38 6.3 AVERAGE OUTFLOW RATE AND STORAGE CAPACITY ...................................................................... 39 6.4 AVERAGE INFLOW RATE AND DESIGN FLOW RATE ......................................................................... 39 6.5 BYPASS CAPABILITIES ................................................................................................................ 39 6.6 NON-RESIDENTIAL WASTEWATER PRODUCERS .............................................................................. 40 6.7 REPLACEMENT PARTS ............................................................................................................... 40 6.8 MUTUAL AID AGREEMENTS ....................................................................................................... 41 6.9 INTERCONNECTIONS ................................................................................................................. 41 6.10 ENVIRONMENTAL IMPACTS ...................................................................................................... 42
7 IMPACT ASSESSMENT TOOL ............................................................................................... 43 7.1 DEVELOPMENT .................................................................................................................... 43
7.1.1 Drinking Water ............................................................................................................ 43 7.1.2 Wastewater .................................................................................................................. 46
7.2 APPLICATION ....................................................................................................................... 47 7.2.1 Drinking Water ............................................................................................................ 47 7.2.2 Wastewater .................................................................................................................. 48
8 CONCLUSION..................................................................................................................... 51 8.1 RECOMMENDATIONS ................................................................................................................ 51 8.1.1 FUTURE ADDITIONS TO ASSESSMENT TOOLS .............................................................................. 52
8.1.1.1 Future Risk Factors .................................................................................................... 52 8.1.1.2 Future Impact Factors ............................................................................................... 53 8.1.2 Recommendations to MassDEP ................................................................................... 54
GLOSSARY ........................................................................................................................... 56
REFERENCES ........................................................................................................................ 57
APPENDIX A – SPONSOR DESCRIPTION ................................................................................. 61
APPENDIX B – INTERVIEW QUESTIONS.................................................................................. 63
APPENDIX C – INTERVIEWS WITH RESOURCE PERSONS ......................................................... 69
APPENDIX D – RISK ASSESSMENT TOOL ................................................................................ 75
APPENDIX E – IMPACT ASSESSMENT TOOL............................................................................ 78
APPENDIX F – WASTEWATER FACILITY TRIP REVIEWS ............................................................ 79
APPENDIX G – DRINKING WATER FACILITY TRIP REVIEWS ..................................................... 82
APPENDIX H – WASTEWATER FACILITY INFORMATION .......................................................... 86
APPENDIX I – DRINKING WATER SYSTEM INFORMATION AND COMPONENT BREAKDOWN .... 88
APPENDIX J – RISK ASSESSMENTS ......................................................................................... 97
APPENDIX K – IMPACT ASSESSMENT .................................................................................. 103
APPENDIX L – WASTEWATER FACILITY HAZARD ASSESSMENTS ............................................ 104
APPENDIX M – DRINKING WATER SYSTEM HAZARD ASSESSMENTS ..................................... 135
APPENDIX N – RESOURCE TABLE ......................................................................................... 169
APPENDIX O – CONTACT LIST .............................................................................................. 172
xi
Table of Figures
Figure ES. 1: Wastewater Facility Risk Rankings ............................................................. iv Figure ES. 2 Average Risk Rating ...................................................................................... v Figure ES. 3 Drinking Water Impact ................................................................................. vi
Figure 2. 1: Typical Water Treatment Process ................................................................... 6 Figure 2. 2: Typical Activated Sludge Wastewater Treatment Process .............................. 9 Figure 2. 3: Saltwater Intrusion ........................................................................................ 12
Figure 5. 1: Hull WWTP Risk Assessment ...................................................................... 29
Figure 5. 2: ACE Hurricane Inundation Area map for the Hull Wastewater Treatment
Plant .................................................................................................................................. 29
Figure 5. 3 FEMA Flood Zone map for the Provincetown Wastewater Treatment Plant 31 Figure 5. 4: ACE Hurricane Inundation Area map for the Provincetown Wastewater
Treatment Plant ................................................................................................................. 31 Figure 5. 5: Wastewater Risk Rankings ............................................................................ 32 Figure 5. 6: FEMA Flood Zone map for the Wareham Fire District Drinking Water ...... 34 Figure 5. 7: ACE Hurricane Inundation Area map for the Wareham Fire District Drinking
Water system. .................................................................................................................... 34
Figure 5. 8: FEMA Flood Zone map for the Onset Fire District Drinking Water System 36 Figure 5. 9: ACE Hurricane Inundation Area map for the Onset Fire District Drinking
Water System .................................................................................................................... 36 Figure 5. 10: Average Risk Ranking for Drinking Water Systems ................................. 37
Figure 6. 1: Portable Pump Motor .................................................................................... 41
Figure 7.1: ASA, CZM Hull Wastewater Treatment Plant Flooding Map ....................... 50
xii
Table of Tables
Table 5. 1: Hull Wastewater Risk Assessment ................................................................. 28 Table 5. 2: Provincetown WWTP Risk Assessment ......................................................... 30
Table 5. 3: Wareham Fire District Drinking Water Risk Assessment .............................. 33 Table 5. 4 Risk Assessment Onset Fire District Drinking Water System ........................ 35
Table 7.1: Hyannis Water System Assessment................................................................. 48 Table 7.2: Manchester Water Department Assessment .................................................... 48
1
1 Introduction As the effects of climate change become more prevalent, countries all over the
world are faced with issues of rising sea levels, increasing ambient temperature, and the
effects of greenhouse gases. Of these effects, rising sea levels have become a most
pressing issue. Coastal states are at higher risk of their land, used for utilities, public use,
and habitation, becoming flooded and unusable. Rising sea levels also lead to an increase
in the height of storm surges. These higher storm surges have the capability of
overpowering current structures put in place to protect coastal areas from such events.
Numerous structures located on the Massachusetts shoreline are at risk of rising
sea levels and the resultant storm surges. While residential and public spaces aren’t
severely dependent on location, utilities such as drinking water treatment and wastewater
processing facilities require access to bodies of water to operate. These wastewater and
drinking water facilities may become vulnerable to flooding and inundation that can
damage the facilities themselves. The flooding and inundation can also cause dangerous
malfunctions with the potential to contaminate drinking water and release untreated waste
into otherwise usable bodies of water.
The initial problem faced by our sponsors at Massachusetts Department of
Environmental Protection is that the severity of the potential risk associated with sea
level rise is unrecognized or unheeded by officials and planners. We conveyed our
findings about the risk of sea level rise to Massachusetts Department of Environmental
Protection personnel. By bringing to light the hazards of sea level rise, we were able to
spread awareness of this problem and present methods to reduce and possibly eliminate
the risk to coastal water utilities.
2
Currently, specific effects of rising sea levels on wastewater and drinking water
treatment facilities in Massachusetts have not been quantified by facility staff and other
involved stakeholders such as town managers, selectmen, and city/town mayors. Previous
effort has gone into identifying problems caused by global climate change, but has not
specified the amount or possible damage that could be caused by rising sea levels and
higher storm surges. High risk locations have not been identified and there is minimal
knowledge of when floodwaters or rising sea levels will cause serious damage to coastal
facilities. Numerous proven successful solutions, as described by Hans F. Burcharth and
Steven A. Hughes in their coastal engineering manual, range from sea dikes to beach
drains (USACE 2002). Unfortunately, these solutions have not been widely implemented.
Also the knowledge of these solutions has not been delivered to key stakeholders with the
ability to adopt said solutions.
The goal of this project was to identify the risks of rising sea levels, such as storm
surges, on wastewater and drinking water treatment facilities. We located hazardous areas
through study of the Massachusetts coastline and its history of sea level rise. With this
information we were able to make accurate predictions about future areas of flooding.
Furthermore, we studied the consequences of flooding and inundation caused by rising
sea levels on wastewater and drinking water treatment facilities. This helped us to predict
what would happen should these facilities not enact preventative measures. Finally we
made recommendations to the Massachusetts Department of Environmental Protection
Agency of where to focus their mitigation efforts.

3
2 Background This chapter provides relevant background information concerning the effects of
sea level rise on drinking water and wastewater treatment facilities. We provide
information on rising sea levels as well as their effects, and on the basic common
treatment processes used by drinking water and wastewater utilities. We also include a
discussion of the various methods currently used by coastal water utilities to protect
against rising sea levels and flooding.
2.1 Climate Change
Global climate change is a problem facing countries around the world. An effect
of this global climate change is that average temperatures are increasing. The increase in
global temperature leads to one of the most widely known effects, a rise in sea levels.
Another significant effect is the expected change in precipitation patterns. The increase in
global average temperatures affects climate and weather patterns in complex ways, even
having opposite effects in different areas. In places such as Mexico and California, for
example, the Intergovernmental Panel on Climate Change, IPCC, (2007) predicts that a
decrease in precipitation is likely. However, in New England, the IPCC predicts that an
increase in precipitation is very likely.
2.1.1 Rising Sea Levels The rise of sea levels affects every nation in the world that has a coastline.
According to the IPCC (2007), sea levels have been rising globally at a rate of 3mm/year
since 1993. Three millimeters per year may not seem like much, however even such a
minimal sea level rise over the next 50 to 100 years will be devastating to low-elevation
coastal cities and islands. When compared to cities such as New Orleans and Venice,
Boston has more time to prepare itself for rising sea levels, as it is currently above sea
4
level. However this does not mean the problem of rising sea levels can wait to be
addressed. In the near future, floods are predicted to occur more frequently and will likely
be worse than before. While flooding of residential and commercial areas are of huge
concern and probably one of the first things to come to mind when discussing sea level
rise, effects on drinking water and wastewater utilities are also of great concern.
2.2 Water Utilities
Water utilities are a critical type of infrastructure within our society. “Water
utilities” for our purposes refers to the public drinking water and wastewater treatment
services that are often operated by the government. Davis (2009) defines public systems
as, “… those systems serving at least 25 persons per day for greater than 60 days out of
the year” (p. 406). Water utilities are an important part of our society’s public
infrastructure, and preserving their operational integrity is, and always will be, of high
importance.
2.2.1 Drinking Water Treatment About 95 percent of the population in Massachusetts receives its drinking water
from a public drinking water supply system; about 82 percent of this water is treated
before being distributed to the public (CCA, 2011, p. 61). This section will discuss the
common goal of such facilities and a general description of processes used at drinking
water treatment facilities.
The general purpose of any water treatment facility is to effectively filter,
disinfect, and otherwise purify the water so that it is potable and palatable for the
consumer (Davis, 2009, p. 407). Water treatment facilities take their water from both
surface water sources as well as ground water sources and thus need to treat the water
5
differently to end up with potable and palatable water for the consumer. In 1974, the Safe
Drinking Water Act (SDWA) was enacted by the U.S. Congress, requiring the U.S. EPA
to set uniform drinking water standards (p.410). The U.S. EPA, in response, created
maximum contaminant levels (MCLs), which limit the maximum amount of each
substance that can be present in treated water. Due to the differences in the quality of the
source waters, the specific water treatment processes are usually determined on a case-
by-case basis, taking into account the contaminants that are present and the levels of all
contaminants present. For example, some water sources may have high levels of arsenic,
while others may have low levels of arsenic but high levels of sulfur.
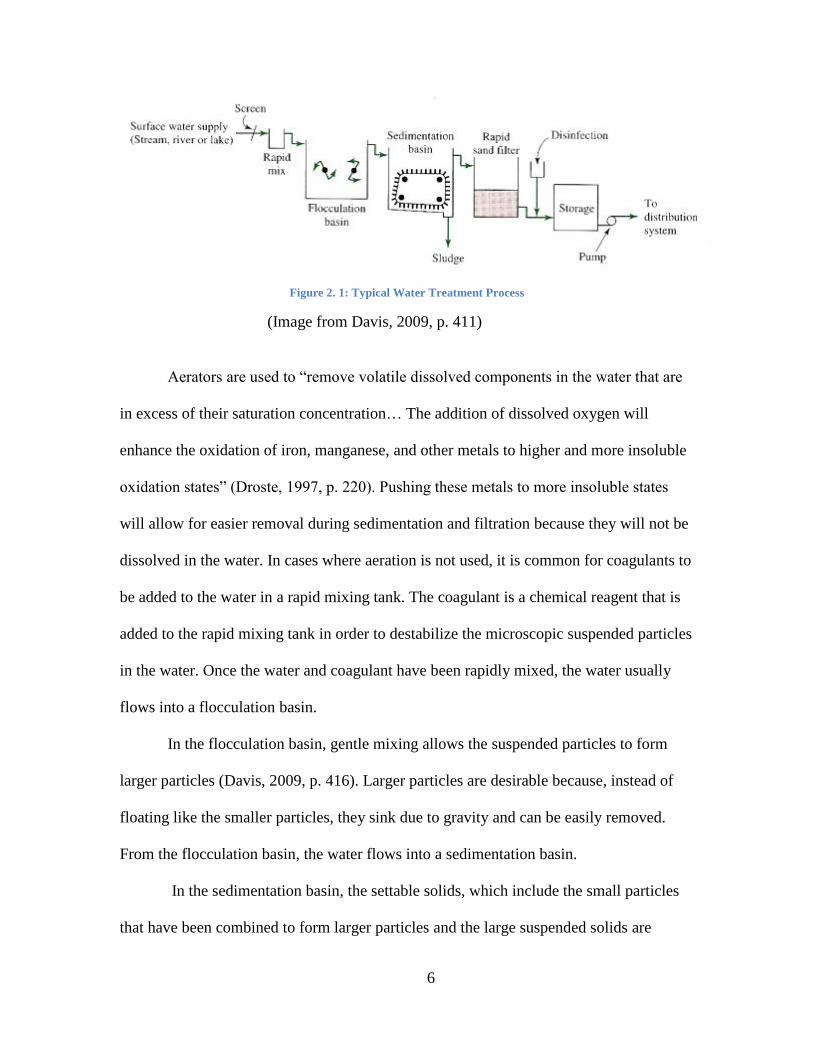
As can be seen in Figure 1, numerous purification procedures are involved in the
delivery of drinking water from source to consumer. When water flows into a treatment
plant from its water source, it will normally pass through a set of bar racks or a coarse
screen filter (Droste, 1997, p. 230). The purpose of these systems is to filter out any large
items that could be in the water, such as tree branches or shopping carts. If these large
items were not removed, they could potentially block or clog subsequent processes or do
damage to treatment equipment, costing both money and time to repair. After passing
through the bar rack, the water will generally enter an aeration basin, or have certain
chemicals such as coagulants or chlorine added to it.
6
Figure 2. 1: Typical Water Treatment Process
(Image from Davis, 2009, p. 411)
Aerators are used to “remove volatile dissolved components in the water that are
in excess of their saturation concentration… The addition of dissolved oxygen will
enhance the oxidation of iron, manganese, and other metals to higher and more insoluble
oxidation states” (Droste, 1997, p. 220). Pushing these metals to more insoluble states
will allow for easier removal during sedimentation and filtration because they will not be
dissolved in the water. In cases where aeration is not used, it is common for coagulants to
be added to the water in a rapid mixing tank. The coagulant is a chemical reagent that is
added to the rapid mixing tank in order to destabilize the microscopic suspended particles
in the water. Once the water and coagulant have been rapidly mixed, the water usually
flows into a flocculation basin.
In the flocculation basin, gentle mixing allows the suspended particles to form
larger particles (Davis, 2009, p. 416). Larger particles are desirable because, instead of
floating like the smaller particles, they sink due to gravity and can be easily removed.
From the flocculation basin, the water flows into a sedimentation basin.
In the sedimentation basin, the settable solids, which include the small particles
that have been combined to form larger particles and the large suspended solids are
7
settled out by gravity as the water slowly flows through the basin (Droste, 1997, p. 222).
All of the suspended solids and particles settle to the bottom, creating what is called
sludge. From the sedimentation basin, water will usually flow through a filtration unit.
After most of the bigger solids and settable solids have been removed from the water, it is
time to remove the smaller suspended particles in the water; this is where filtration comes
in.
The filtration process consists of the water moving through tanks that contain
sand or plastic, which act as the filtration material as the water passes through. Fine
solids that did not settle out in a sedimentation basin will be trapped in the filter. There
also will be significant removal of bacteria in a filter but not enough to provide safe
water. Normally larger microorganisms such as protozoa are completely removed during
the process as well (Droste, 1997, p. 221). Two types of common filters are rapid filters
and slow sand filters. Slow sand filters contain only sand as a filtration medium, while
rapid filters commonly contain anthracite, sand, and sometimes other granular media.
The next step in the process is disinfection.
According to Davis (2009), disinfection involves “the addition of chemicals
(usually chlorine, chloramines, or ozone) or the application of UV radiation to reduce the
number of pathogenic organisms to levels that will not cause disease. Storage [for
purified water] is provided to meet peak demands and to allow the plant to operate on a
uniform schedule” (p. 412). From this final stage, the water will travel to the consumers
or be held in a storage tank, as stated above, until there is a need for its use.
2.2.2 Wastewater Treatment As abundant as it may be or seem, water is still a limited resource that must be
used efficiently and conservatively while maintaining quality as well. Wastewater
8
treatment seeks to treat all domestic and industrial wastewater as well as storm water in
order to maintain the quality of rivers, lakes, and other such bodies of water. Society’s
uses for these waters are numerous, ranging from recreation such as swimming and
fishing to use as drinking water if at a safe distance away from the wastewater treatment
outfall. The Merrimack River is an example of such use, essentially starting in New
Hampshire then winding and flowing out into the Atlantic. Many drinking water
treatment facilities intake water from rivers, with some wastewater treatment facilities
discharging upstream on the same river. The city of Lowell, for example, is one
downstream population center that draws its drinking water from the Merrimack.
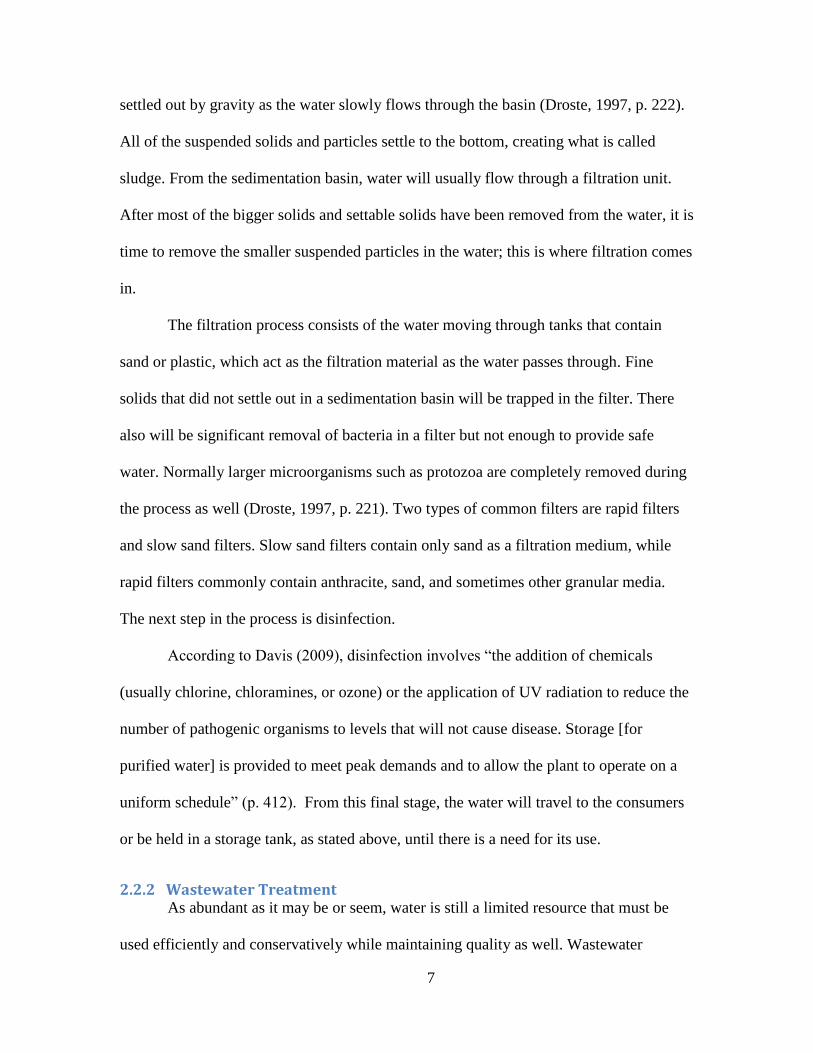
Figure 2 shows the common processes used in an activated sludge wastewater
treatment facility from the raw sewage intake to the treated water discharge into a river,
the ocean or other body of water. The processes used in wastewater treatment are similar
to those used in drinking water treatment and can be separated into three categories:
pretreatment, primary treatment and secondary treatment (Davis, 2009, p. 474). Pre-
treatment involves the use of bar racks, as in water treatment, grit chambers, and
commonly an equalization basin. Grit chambers are installed to remove dense material
like sand, broken glass, and pebbles. If not removed, these materials would be harmful to
pumps and other mechanical devices in the treatment process. A grit chamber is much
like a sedimentation basin where the water slowly flows through the basin, allowing
much of the grit to settle out by gravity.
9
Figure 2. 2: Typical Activated Sludge Wastewater Treatment Process
(Image from Davis, 2009, p. 483)
Equalization basins commonly follow grit chambers in the treatment process.
Equalization basins are used to create a uniform flow throughout the day, since there are
peak flows and low flows at certain times of the day. Equalization basins essentially
collect the flow that has passed through the bar racks and grit chambers, like a storage
tank, and then uniformly releases the water at a constant flow rate.
Next in the process is primary treatment, which includes the use of a
sedimentation tank. In the sedimentation tank, many of the suspended solids are settled
out by gravity as the water flows through the tank. The sedimentation tank will normally
remove about 60% of the suspended solids in raw sewage and reduce the biochemical
oxygen demand (Davis, 2009, p. 473). This biochemical oxygen demand (BOD) is a
measure of the oxygen used by the microorganisms in the water as they consume the
organic material for food; a high BOD indicates a high amount of organic material in the
water. The treatment processes are trying to remove this organic material, thus lowering
BOD.
10
From primary treatment, the water begins to go through secondary treatment,
commonly consisting of aeration, a secondary settling tank, and disinfection. In an
aeration tank, the water is roughly mixed, thus supplying oxygen to the microorganisms
present in the water. By doing this, the microorganisms flocculate and form what is called
“activated sludge”. By agitating and aerating, the microorganisms in the water become
“activated” and will consume the organic matter as food. From the aeration tank, the
water flows into the secondary clarifier where the activated sludge is settled out and, as
depicted in Figure 2, recycled back into the aeration tank many times in order to keep a
high population of the microorganisms cleaning the water. This sludge, consisting of all
the microorganisms breaking down the waste, is sometimes called the biomass. From the
secondary clarifier, the water flows into a tank where chemicals are added, commonly
chlorine, in order to disinfect the water and kill off any harmful pathogens present.
In some cases there is need for more advanced wastewater treatment in order to
remove all pollutants such as phosphorus and heavy metals (Davis, 2009, p. 500). This is
done by a variety of methods commonly consisting of methods such as filtration,
phosphorus removal or carbon adsorption. At this point the wastewater has been
sufficiently treated and cleaned and can be pumped into the receiving waters, commonly
a river or, if close enough, pumped out into the ocean.
2.2.3 Effects of Flooding on Water Utilities Both the gradual and sudden effects of rising sea levels can cause major problems
for wastewater and drinking water utilities. Flooding, as a sudden effect, caused by a
combination of rising sea levels and storms can become a problem for water treatment
facilities. As a gradual effect, the sea level rise may lead to saltwater intrusion, which is a
concern for drinking water facilities.

11
A wastewater facility that is being flooded, or has been flooded, can suffer
structural damage from the weight of floodwaters (Flood Damage, 2010). A prime
example of this happened during the June, 2010, flood at the City of Norfolk, NE
Wastewater Treatment Plant. Due to the weight of the floodwater, a critical 36 inch
diameter pipe, responsible for carrying water into the wastewater plant collapsed. A
collapsed pipe can cause wastewater, sometimes untreated, to be diverted into nearby
fields or bodies of water. Along with structural damage, the electrical system of the plant
responsible for powering the pumps would be in danger. When interviewed, Worcester
Polytechnic Institute Professor John Bergendahl pointed out that without electricity all
processes requiring pumps would be shut down including aeration and sludge pumping.
(see Appendix C for interview transcript).
Health also becomes a problem during the flooding of water utilities. In a flooding
situation, wastewater facilities may be overwhelmed by excess water. This causes sewer
lines to be overwhelmed and as a result the sewage my back up into homes or low lying
areas (Kane County, Illinois, 2005). This back up in the sewer lines may become a
breeding ground for bacteria such as E. coli. In some cases when a wastewater facility is
inundated facility operators are sometimes forced to bypass the treatment process and
release untreated water into nearby rivers or streams, which may used as a source of
drinking water downstream. This can cause a boil water warning to be issued. This means
that citizens of the community are advised to bring any tap water to a roaring boil before
it is consumed to assure the water is free of any harmful bacteria and/or pathogens.
Drinking water that has not been properly treated, or that is contaminated, is hazardous to

12
human health. Ingesting parasites, bacteria and viruses found in untreated water causes
illnesses such as diarrhea (Utah Department of Health, 2011).
A drinking water facility faced with the gradual effects of rising of sea levels has
to deal with the threat of saltwater intrusion. Saltwater intrusion is the migration of
marine saltwater into freshwater aquifers (U.S. Geological Survey, 2000). As depicted in
Figure 3 below, the seawater invades the groundwater supply. This is a particular concern
for Cape Cod, MA, where all of the peninsula’s drinking water is retrieved from Cape
Cod’s Sole Source Aquifer. Saltwater intrusion causes a rise in the water’s chloride
concentration, which, if ingested, can cause high blood pressure. The higher chloride
concentration of the water being treated can cause the pipes of the drinking water facility
to corrode. Also, as Worcester Polytechnic Institute Professor John Bergendahl noted, a
flood of saltwater would “probably kill the bacteria used in biological treatment” (see
Appendix C for interview transcript). These bacteria are used in both wastewater and
drinking water treatment.
Figure 2. 3: Saltwater Intrusion
(Image from Union of Concerned Scientists, 2002)
13
2.3 Previous Solutions to Protect Water Utilities
Water utilities are extremely important to people living in the areas they serve,
and they are often at high risk of the effects of flooding and storms. In many coastal areas
these issues have already been addressed.
Responding to the threat of flooding is no easy task. Many different components
of water treatment plants are at risk of performing inadequately or failing in the event of
flooding. Protecting these facilities from damage is of utmost importance, either through
internal fail safes or external protection. Many solutions exist to protect facilities from
flooding and have uses in other fields, making them more efficient to implement and
produce.
The most obvious solution to protect water treatment plants from flooding is to
physically raise them. According to the Massachusetts Executive Office of Energy and
Environmental Affairs (2011), the Deer Island water treatment facility was elevated in
1989 “about 1.9 feet higher to accommodate potential sea level change for at least the
first fifty or sixty years of the facility’s service”. This solution is elegant, but cannot be
applied to all facilities. There was a relative ease in the implementation of this solution on
Deer Island that is not widely applicable or available to other such facilities in
Massachusetts.
A more widely implemented solution is the construction of dams, sea walls,
dykes, and other such impediments to flood waters. Depending on the type of structure,
these solutions can be relatively inexpensive to build and can require little maintenance.
Dams are the most costly and high maintenance of this type of solution. In
addition to their high upkeep, they cannot be placed anywhere on the coast, but instead
14
must be located in front of running water, such as across a river. The advantage to the use
of dams is that they can generate clean energy and provide some payback to the rather
large initial costs. However, with government budget cutbacks and shortage of staff,
smaller, more manageable structures are more often built.
Sea walls and dykes are prolific throughout the Massachusetts coast as they are
inexpensive to build and will function effectively with little to no human maintenance.
Often constructed of concrete, these structures simply wall off incoming floodwaters and
ocean storm surges. There are a wide array of types designed and implemented that vary
in effectiveness based on their location and specific requirements. T. Sawaragi (1995)
describes a plethora of different structures types along with graphical information on their
optimal use. The structures he describes have been implemented all over the world with
varying success. With a variety of available designs, they can be applied on a case by
case basis.
2.4 Concluding Thoughts Sea level rise is an emerging problem both on a local and global scale. While
there are small scale solutions in place, they use outdated technology and are designed for
less drastic situations than are predicted to occur. We are only beginning to feel the
effects of climate change and must respond accordingly. Based on our understanding of
the processes involved in wastewater and drinking water treatment, if we wait for the
next major disaster it may already be too late.
15
3 Methods The goal of our project was to identify coastal wastewater and drinking water
treatment facilities with a high risk of flooding due to sea level rise for the Massachusetts
Department of Environmental Protection (MassDEP) in order that, they may better
allocate their mitigation efforts and resources. To do this, we worked towards two
primary objectives: developing a risk & impact assessment tool, and then applying this
assessment tool to coastal wastewater and drinking water treatment facilities. This
chapter describes the methodology we used to accomplish these objectives.
3.1 Developing a Hazard Assessment Tool
An important part of our project was developing a hazard assessment tool that
could be applied to coastal wastewater and drinking water facilities, which may be at risk
to flooding due to sea level rise. To identify factors for a “high risk” facility, we
conducted interviews, visited facilities, researched previous studies relating to flood risk
factors. Finally these collected data were formed into a risk & impact assessment. We
then used this risk & impact assessment to determine the flood risk at coastal wastewater
treatment facilities and drinking water systems. We used this assessment tool to identify
which coastal water utilities were at high hazard.
3.1.1 Identifying Coastal Water Utilities
Our first step in this process was to locate the coastal water utilities that we
would be analyzing. We defined coastal water utilities as utilities that were within one
mile of the coast or tidally influenced river. Through the Massachusetts Water Pollution
Control Association (MWPCA) website we were able to find a list of the wastewater
treatment facilities in Massachusetts. Using satellite imagery we were able to identify the
16
treatment facilities that were within one mile of the coast, to which we would later apply
our assessments to (see Appendix H). Using coastal towns we identified while creating
our list of wastewater treatment facilities along with the Environmental Protection
Agency (EPA) Permit Compliance system, we were able to identify coastal drinking
water systems for analysis. Through this method we identified eighteen wastewater
facilities and seventeen drinking water systems for analysis.
3.1.2 On & Off-site Data Collection & Analysis
Before doing any on-site analysis we began by collecting data from Geographic
Information Systems (GIS), MassDEP Document Repository Tracking System (DRTS), a
recent EPA study, and through documents and information held at the MassDEP regional
offices. Through GIS we located the facilities, measured their elevations and proximities
to coast, determined their discharge types, and mapped the Federal Emergency
Management Agency (FEMA) flood zones and the Army Corps of Engineers (ACE)
hurricane inundation zones on each facility’s location. From the MassDEP regional
offices we acquired information on the wastewater facilities such as average effluent flow
rate, storage capacity of untreated wastewater, and whether the towns sewage collection
system was a combined sewer system or not. Similarly, we acquired the average flow
rates, storage capacities of treated water and the populations served in both the summer
and winter for each drinking water system through DRTS. Finally, from the recent EPA
study we were able to find information on past flooding at each of the wastewater
treatment facilities.
During our off-site data collection, we identified three wastewater facilities and
two drinking water systems for on-site tours and analysis. We chose facilities located on
17
different parts of the Massachusetts coast, including Cape Cod, in order to have as much
of the coast represented in our analysis as possible. We chose Newburyport’s Water
Works (drinking water treatment facility) and Wastewater Treatment Facility on
Massachusetts’s north shore, Hull’s Wastewater Treatment facility in Massachusetts Bay,
and Provincetown’s drinking water system and Wastewater Treatment Facility located on
Cape Cod for on-site analysis. When touring the five sites we took note of characteristics
we could not collect off-site such as factors that may protect against or contribute to flood
hazards at the facility. We also collected other site-specific details of relevant factors to
be used in our risk & impact assessment such as facility size and whether or not the
facility had a flood response strategy available.
3.1.3 Interviewing Risk Analysis Experts & Plant Operators
In addition to our on- and off-site data collection, we consulted with experts in the
field of risk assessment and interviewed superintendents or chief plant operators at our
selected sites. First we consulted risk analysis experts to acquire a general definition as to
what factors are used to determine if a facility or location has a high flood risk. We
defined risk analysis experts as those who have had extensive experience in risk analysis
such as professors who have done extensive research on risk assessment and those who
work in the risk assessment field. These consultations revolved around what factors are
taken into account when determining if a facility has a high risk of flooding as well as
general risk assessment guidelines.
Next, through MassDEP, in order to gain a professional first hand perspective at
the possible high-risk sites, we interviewed five wastewater and drinking water
superintendents or chief operators, a design engineer, and an environmental engineer.

18
These interviews addressed the observed effects of rising sea levels by facility operators,
what processes facility operators believe to be the most vulnerable or likely to be affected
by flooding, existing adaptations and protective measures against rising sea level related
or flooding used at the facility, and any future plans the facility operators had for
adapting to rising sea levels. Interview protocols were formulated during preliminary off-
site analysis and can be found in Appendix B while interview transcripts can be found in
Appendix C.
3.1.4 Developing a Hazard Assessment Tool
First we researched previous studies that had been done elsewhere in the country
and world on the effect of sea level rise on water utilities as well as adaptation strategies
implemented at other utilities. The next step when creating our flood hazard assessment
was compiling all the information we collected from our research, interviews and site
visits. Through this research to identify relevant factors and discussion among our
project group and MassDEP liaisons, we were able to create a risk assessment as outlined
in Appendix D and discussed in Chapter 5. The risk factors were each given a set of
possible numeric values which could then be used to give the facility an overall risk rank.
A similar process was done to give each assessed facility an impact rating, discussed in
Chapter 7. We then applied the assessment tool to the eighteen identified coastal
wastewater facilities and seventeen drinking water systems, yielding a risk and impact
rating for each facility.

19
4 Risk Factors
These are the factors we have identified as contributing to the risk of flooding at
waste and drinking water treatment facilities and system components. These factors
include whether components have been damaged by flooding in the past, which Federal
Emergency Management Agency (FEMA) flood zones the components are located in,
which Army Corps of Engineers (ACE) hurricane inundation areas the components are
located in, and which ACE hurricane inundation areas we predict the components will be
located in after 100 years of sea level rise. For wastewater treatment facilities, we also
consider whether the collection system is a combined sewer/storm system.
4.1 Past Flooding
Past inundation and damage to a water utility is an important indicator of risk to
treatment facilities, as a plant that has suffered from such an event in the past is at risk of
flooding in the future. This factor is important because, as we found through interviews
with various plant personnel, people respond more easily to past data than predictions.
However, it should be noted that, with the changing climate, past data are becoming
increasingly unreliable.
4.2 FEMA Flood Zones
FEMA flood zones (FEMA 2011b) show the predicted flooding that would occur
due to storm surge and other storm events, taking into account elevation and geography.
The FEMA flood zones used were updated in 2000 and 2005 depending on the area we
were assessing. We separated the flood zones into two categories: 100 year flood zones
and Zone X, which is one of FEMA’s flood zone classifications. The 100 year flood
zones are areas that have a 1% chance to flood annually with flood depth greater than one
20
foot. Zone X includes the 500 year flood zones, which have a 0.2% chance to flood
annually, and the areas that have a 1% chance to be flooded with less than one foot of
flood depth annually. We refer to Zone X as the 500 year flood zone. A facility within the
500 year flood zone would be at less risk than one within a 100 year flood zone. A facility
outside of these flood zones would be at the least risk.
4.3 Army Corps of Engineers Hurricane Inundation Areas
The Army Corps of Engineers (ACE) hurricane inundation areas predict flooding
that will occur due to various category hurricanes taking into account elevation and
surrounding geography. There are four categories of hurricane inundation areas, one for
each category of hurricane from category 1 to category 4. Category 5 hurricanes are not
included in these zones as category 5 hurricanes have no upper bound on wind velocity,
which is used to calculate the inundation zone. Each zone shows areas where the ACE
models predict inundation in worst-case flooding in the corresponding hurricane
category. As a category 1 hurricane is the weakest category of hurricane, a facility located
in a category 1 inundation area will be most at risk of flooding. A facility located within a
category 4 inundation area will be at less risk than facilities located in lower category
inundation areas, as the ACE predict it will require at least a category 4 hurricane to
inundate the area, and lower category hurricanes will not inundate it. Facilities not in any
hurricane inundation area are at less risk than facilities located within hurricane
inundation areas, as the ACE predict that not even the worst-case in a category 4
hurricane will inundate the area.
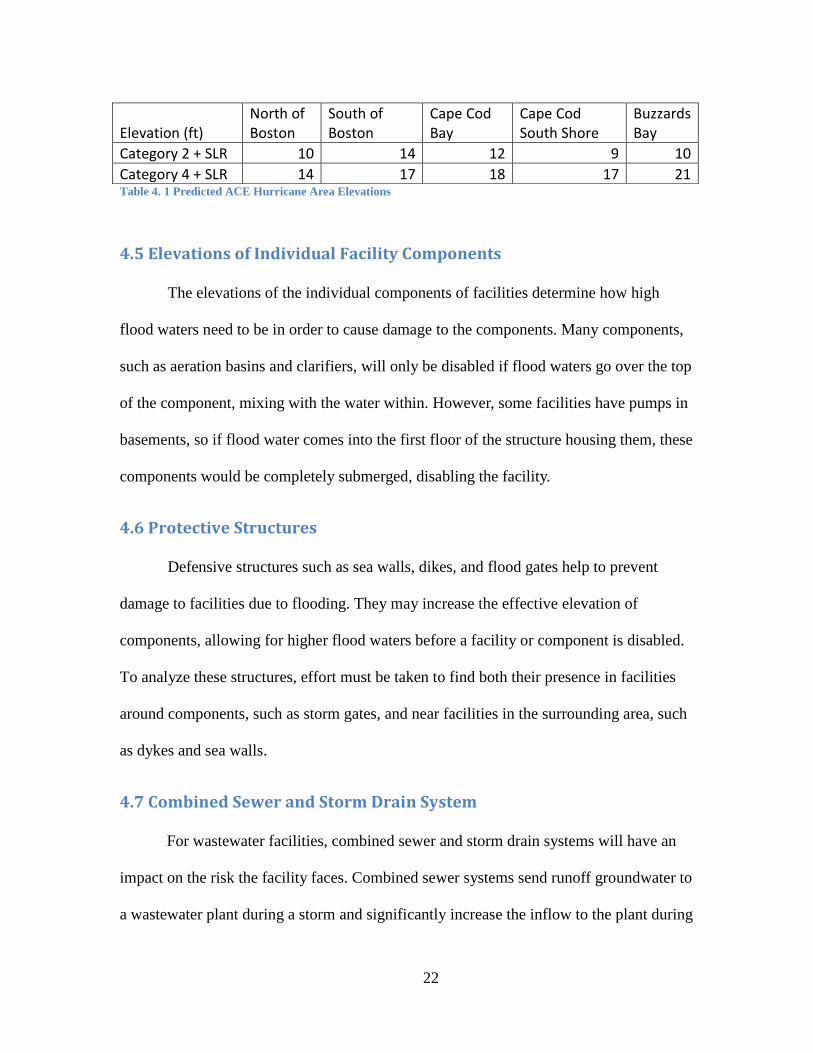
4.4 Predicted Future Hurricane Inundation Areas
To estimate the risk drinking water and wastewater facilities face in the future we
21
also estimated the levels the ACE hurricane inundation areas would reach after sea level
rise, found in Table 4.1, based on median Rahmstorf sea level rise predictions for 2100 of
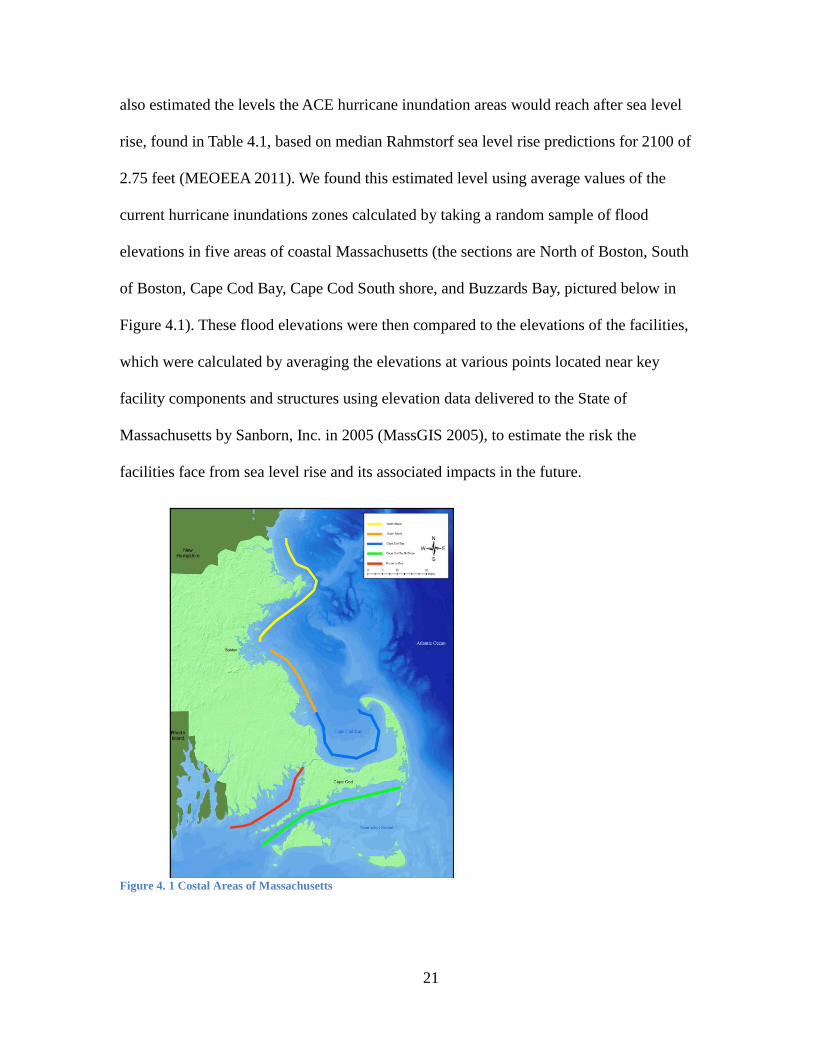
2.75 feet (MEOEEA 2011). We found this estimated level using average values of the
current hurricane inundations zones calculated by taking a random sample of flood
elevations in five areas of coastal Massachusetts (the sections are North of Boston, South
of Boston, Cape Cod Bay, Cape Cod South shore, and Buzzards Bay, pictured below in
Figure 4.1). These flood elevations were then compared to the elevations of the facilities,
which were calculated by averaging the elevations at various points located near key
facility components and structures using elevation data delivered to the State of
Massachusetts by Sanborn, Inc. in 2005 (MassGIS 2005), to estimate the risk the
facilities face from sea level rise and its associated impacts in the future.
Figure 4. 1 Costal Areas of Massachusetts
22
Table 4. 1 Predicted ACE Hurricane Area Elevations
4.5 Elevations of Individual Facility Components
The elevations of the individual components of facilities determine how high
flood waters need to be in order to cause damage to the components. Many components,
such as aeration basins and clarifiers, will only be disabled if flood waters go over the top
of the component, mixing with the water within. However, some facilities have pumps in
basements, so if flood water comes into the first floor of the structure housing them, these
components would be completely submerged, disabling the facility.
4.6 Protective Structures
Defensive structures such as sea walls, dikes, and flood gates help to prevent
damage to facilities due to flooding. They may increase the effective elevation of
components, allowing for higher flood waters before a facility or component is disabled.
To analyze these structures, effort must be taken to find both their presence in facilities
around components, such as storm gates, and near facilities in the surrounding area, such
as dykes and sea walls.
4.7 Combined Sewer and Storm Drain System
For wastewater facilities, combined sewer and storm drain systems will have an
impact on the risk the facility faces. Combined sewer systems send runoff groundwater to
a wastewater plant during a storm and significantly increase the inflow to the plant during
Elevation (ft) North of Boston
South of Boston
Cape Cod Bay
Cape Cod South Shore
Buzzards Bay
Category 2 + SLR 10 14 12 9 10
Category 4 + SLR 14 17 18 17 21
23
these events. Therefore plants without a combined sewer system are at less risk than
plants with combined sewer systems, as they will not have this increased inflow during a
storm. It should also be considered that these systems will have overflow valves to
prevent overwhelming flow to wastewater facilities and at the expense of releasing
untreated sewage into the environment.
24
5 Risk Assessment Tool Our hazard assessment procedure consists of two sections. The first is our risk
assessment, which is a qualitative measure of the risk a particular plant faces from
flooding and how this risk will change due to sea level rise. There are five factors we take
into account when measuring the level of risk a wastewater facility and three factors for a
drinking water facility. These factors are based on the risk factors detailed in Chapter 4.
For a wastewater facility, we include FEMA flood zones, Army Corps of Engineers
(ACE) hurricane inundation zones, past inundation, predicted ACE hurricane inundation
zones, and combined sewer systems. For a drinking water facility, the three factors we
used in our assessment are FEMA flood zones, ACE hurricane inundation zones, and
predicted ACE hurricane inundation zones.
5.1 Development
To develop our risk assessment we first created assessment questions for each of
the factors we had identified, which we could answer using data we had collected about
each of the 18 wastewater plants and 17 drinking water systems we wanted to assess. We
then assigned number values to each of the possible answers from the assessment
questions in order to come up with a rating system for the overall facility. This risk
assessment was used for both wastewater and drinking water and can be found in
Appendix D. We did not include history of past flooding, and the combined sewer system
factor when assessing drinking water systems. It is also important to note that for
drinking water systems, the individual pump stations were analyzed due to the fact that
many drinking water systems do not have a centralized treatment facility.
25
5.1.1 History of Past Flooding
For the first risk factor our question addressed if the facility had ever experienced
past flooding which caused inundation or damage. This question was answered yes or no,
and was assigned a numeric rating of zero for no and three for yes. The numeric rating of
three for a yes was chosen because it is believed that past flooding which caused
inundation or damage is an important indicator of a facility’s risk of flooding, since if
flood-related inundation or damage has happened before at a facility it will certainly be at
more risk of flooding due to sea level rise and increased storm intensity than a facility
which has not been inundated or damaged by flooding.
5.1.2 FEMA Flood Zones
For the second risk factor our assessment question is based on the facility’s
location within FEMA flood zones. If any part of the facility is located in a 100-year
flood zone, it was assigned a rating of 2. Facilities located in a 500-year flood zone were
assigned a rating of 1, and facilities located outside the flood zones were assigned a rating
of zero. The 100-year flood zone was given the highest rating since if the facility is
located in a 100-year flood zone it is also located in a 500-year flood zone.
5.1.3 ACE Hurricane Inundation Area
For our third risk factor our assessment question is based on which ACE
hurricane inundation area the facility was located in. Facilities partially located in a
category 1 or 2 area were given a rating of 2, facilities located in category 3 or 4 zones
were assigned a rating of 1, and facilities located in no hurricane inundation areas were
assigned a rating of zero. These number ratings were chosen because again, if a facility is
26
located in a category 1 or 2 zone it will also be located in a 3 and 4 zone and so will be
more at risk to flooding from a hurricane storm event.
5.1.4 Predicted ACE Hurricane Inundation Area
For our fourth risk factor, predicted ACE hurricane inundation area, we used the
same assessment question and numerical ratings as we did for the current ACE hurricane
inundation area, using the predicted levels as described in Chapter 4. We used this factor
in order to get a sense of the future risks a facility may face due to sea level rise.
5.1.5 Combined Sewer System
For the final risk factor, combined sewer system, we simply asked if the sewer
system that fed sewage to the facility was a combined sewer and storm drain system. If
the answer was no it was given a rating of zero and if the answer was yes it was given a
rating of one. This rating was chosen because we believe that while the presence of a
combined sewer system increases the risk of flooding at the facility it was not as
indicative of a facility’s flood risk as past flooding, being located in any of the FEMA
flood zones or ACE hurricane inundation areas.
5.1.6 Risk Assessment Scale
As explained above, a numeric value was assigned to each possible answer to the
risk assessment questions. For mathematical simplicity we chose the lowest whole
numbers. For a given facility the resulting numerical rating to each question would be
added together for a total between 0-11 for wastewater facilities and 0-6 for drinking
water facilities. These scales were broken up into three ranges that correspond to an
overall facility risk rating of low, medium or high. For drinking water the scale was
27
divided as: zero to two for a low rating, three to four for a medium rating, and five to six
for a high risk rating. As for the division of the wastewater scale, zero to three
represented a low risk rating, four to seven represented a medium rating, and finally,
eight to eleven represented a high risk rating.
5.1.7 Future Risk Assessment Factors
Due to time constraints and difficulty in acquiring data, the following factors were
not included in our risk assessment but should be considered in future development of the
hazard assessment tool. The factors to be considered and integrated into the risk
assessment for the future are protective structures and individual elevations of all the
components, such as the primary clarifiers, aeration basins, flocculation basins, settling
tanks, and pumps.
5.2 Applications
We applied our Risk assessment methodology to 18 wastewater and 17 drinking
water facilities. The risk assessment tool is used to determine the level of risk the facility
faces against rising sea levels and storm surge due to climate change. The tool is meant to
be easily applied to both drinking and wastewater.
5.2.1 Wastewater
Below is an example of how the risk assessment tool is applied to a wastewater
treatment facility. Hull Wastewater Treatment Plant is a good example because it
received one of the highest ratings of all the assessments we completed.
28
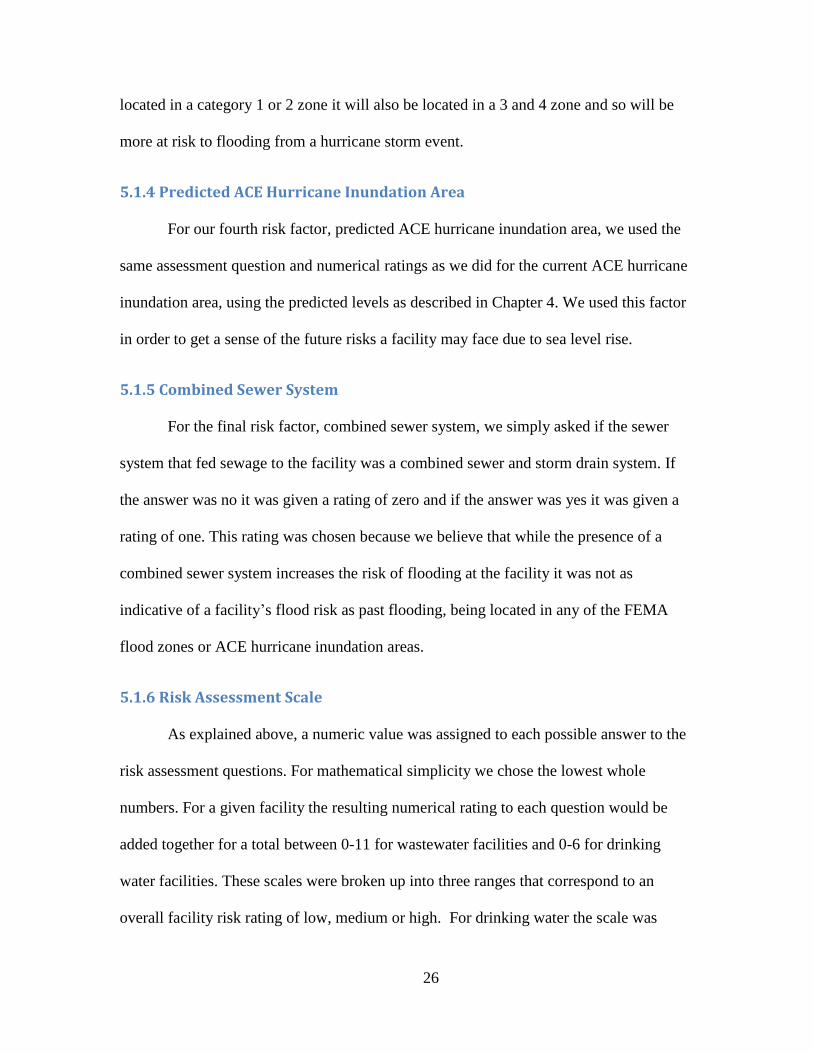
Hull Wastewater Treatment Plant
Question A B C D E
Answer yes 100 yr. Cat. 2 no Cat. 1 or 2
Ans. # value 3 2 2 0 2 Total = 9
Table 5. 1: Hull Wastewater Risk Assessment
Risk Assessment
Table 5.1 shows the ranking the Hull Wastewater Treatment Plant received from
our assessment. Hull Wastewater Treatment Plant has had past flooding which means that
flooding is likely to occur again; however, the plant designers anticipated this and added
storm gates to all openings to the building. The facility elevation is 9 feet above sea level
and will remain above sea level if the predicted Rahmstorf 2100 sea level rise of 2.75 feet
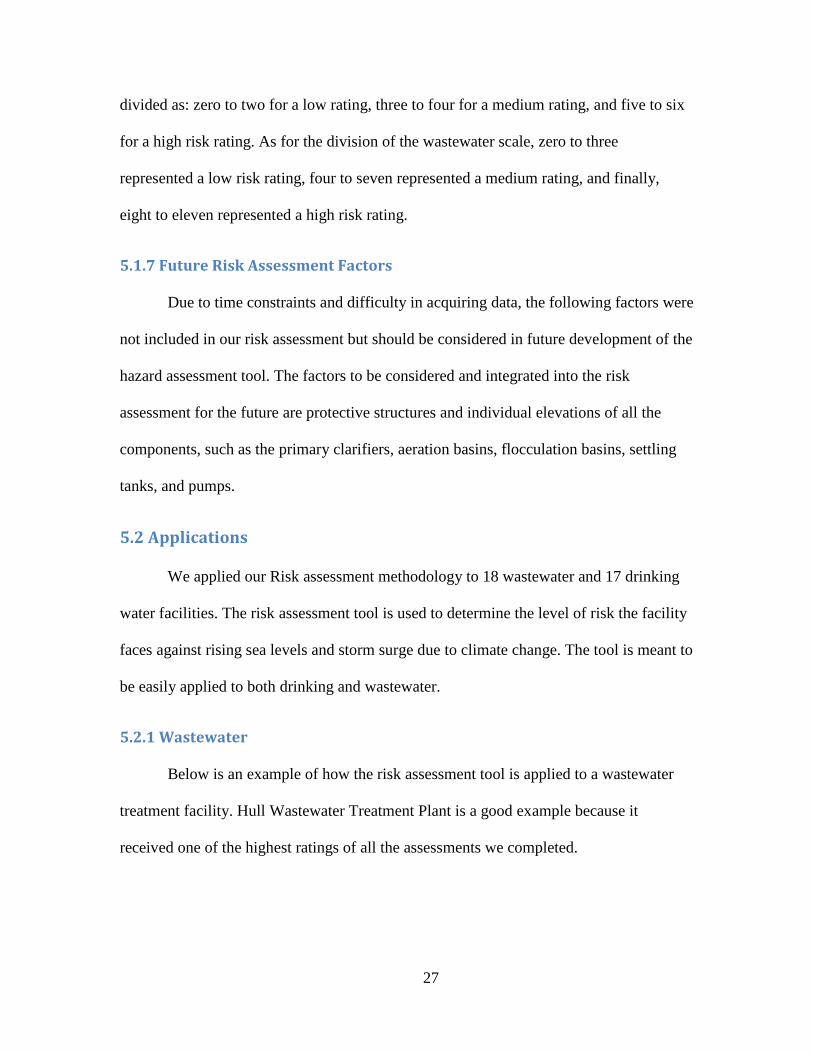
were to actually occur. Being within the FEMA 100 year flood zone currently without
the application of sea level rise means that there is at least a 1% chance that the plant will
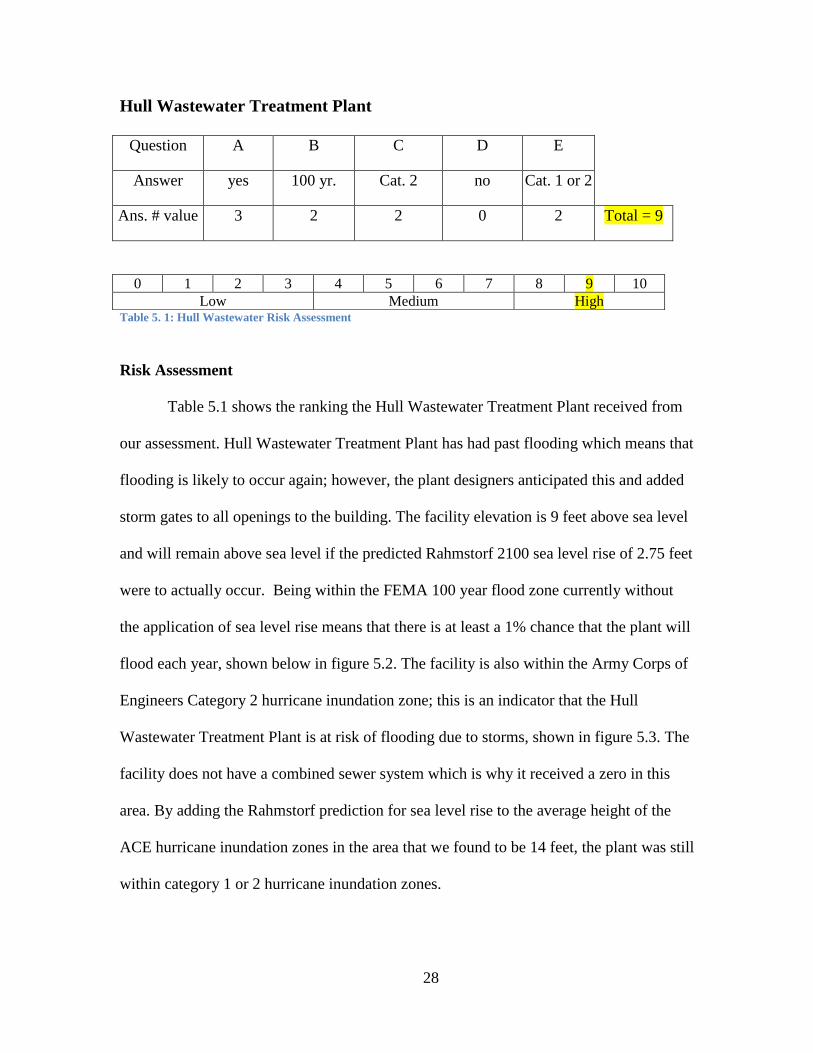
flood each year, shown below in figure 5.2. The facility is also within the Army Corps of
Engineers Category 2 hurricane inundation zone; this is an indicator that the Hull
Wastewater Treatment Plant is at risk of flooding due to storms, shown in figure 5.3. The
facility does not have a combined sewer system which is why it received a zero in this
area. By adding the Rahmstorf prediction for sea level rise to the average height of the
ACE hurricane inundation zones in the area that we found to be 14 feet, the plant was still
within category 1 or 2 hurricane inundation zones.
0 1 2 3 4 5 6 7 8 9 10
Low Medium High
29
Figure 5. 1: Hull WWTP Risk Assessment
Figure 5.1: FEMA Flood Zone map for the Hull Wastewater Treatment Plant. The red line indicates the boundary of
the facility. (500 year flood – 100 year <1 ft is the combination of the 500 year flood zone and 100 year flood zone
under one foot)
*Note: This map and all of the following were created using GIS software.
Figure 5. 2: ACE Hurricane Inundation Area map for the Hull Wastewater Treatment Plant
30
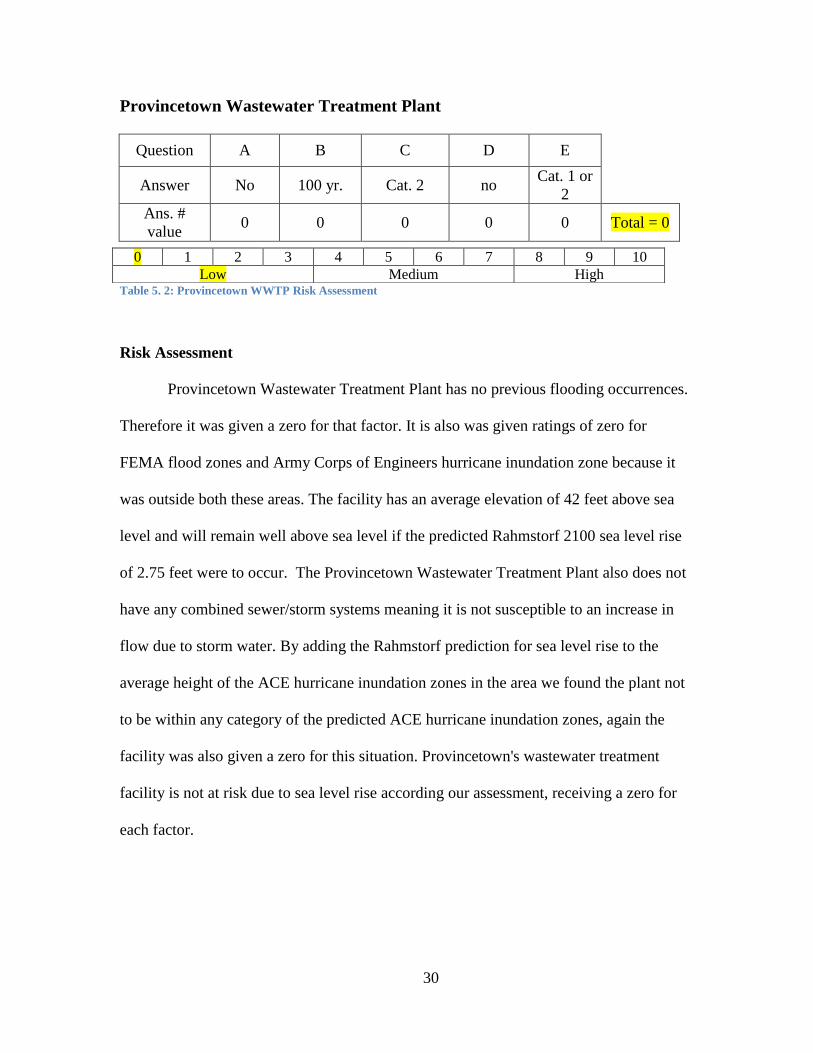
Provincetown Wastewater Treatment Plant
Question A B C D E
Answer No 100 yr. Cat. 2 no Cat. 1 or
2
Ans. #
value 0 0 0 0 0 Total = 0
Table 5. 2: Provincetown WWTP Risk Assessment
Risk Assessment
Provincetown Wastewater Treatment Plant has no previous flooding occurrences.
Therefore it was given a zero for that factor. It is also was given ratings of zero for
FEMA flood zones and Army Corps of Engineers hurricane inundation zone because it
was outside both these areas. The facility has an average elevation of 42 feet above sea
level and will remain well above sea level if the predicted Rahmstorf 2100 sea level rise
of 2.75 feet were to occur. The Provincetown Wastewater Treatment Plant also does not
have any combined sewer/storm systems meaning it is not susceptible to an increase in
flow due to storm water. By adding the Rahmstorf prediction for sea level rise to the
average height of the ACE hurricane inundation zones in the area we found the plant not
to be within any category of the predicted ACE hurricane inundation zones, again the
facility was also given a zero for this situation. Provincetown's wastewater treatment
facility is not at risk due to sea level rise according our assessment, receiving a zero for
each factor.
0 1 2 3 4 5 6 7 8 9 10
Low Medium High
31
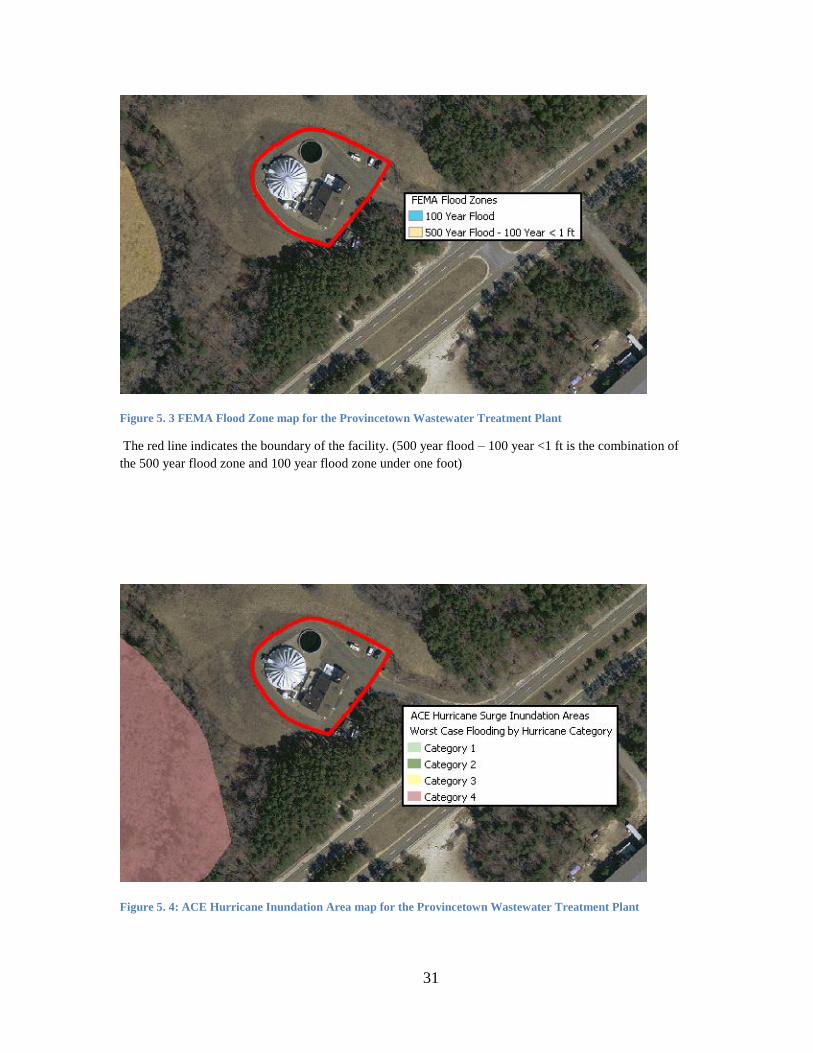
Figure 5. 3 FEMA Flood Zone map for the Provincetown Wastewater Treatment Plant
The red line indicates the boundary of the facility. (500 year flood – 100 year <1 ft is the combination of
the 500 year flood zone and 100 year flood zone under one foot)
Figure 5. 4: ACE Hurricane Inundation Area map for the Provincetown Wastewater Treatment Plant

32
Figure 5.5 below shows the risk rankings of the 18 costal wastewater treatment
facilities with those in red receiving a high risk rating, orange a medium rating, and green
a low risk rating.
Figure 5. 5: Wastewater Risk Rankings
5.2.2 Drinking Water
Below is an example of the application of the assessment tool to a drinking water
system. We used the Wareham Fire District Drinking system because, while all the
pumps in the system are all in the low category, it shows how our assessment takes into
consideration the location of individual pump stations and analyzes each pump station
individually as well.
0123456789
10
33
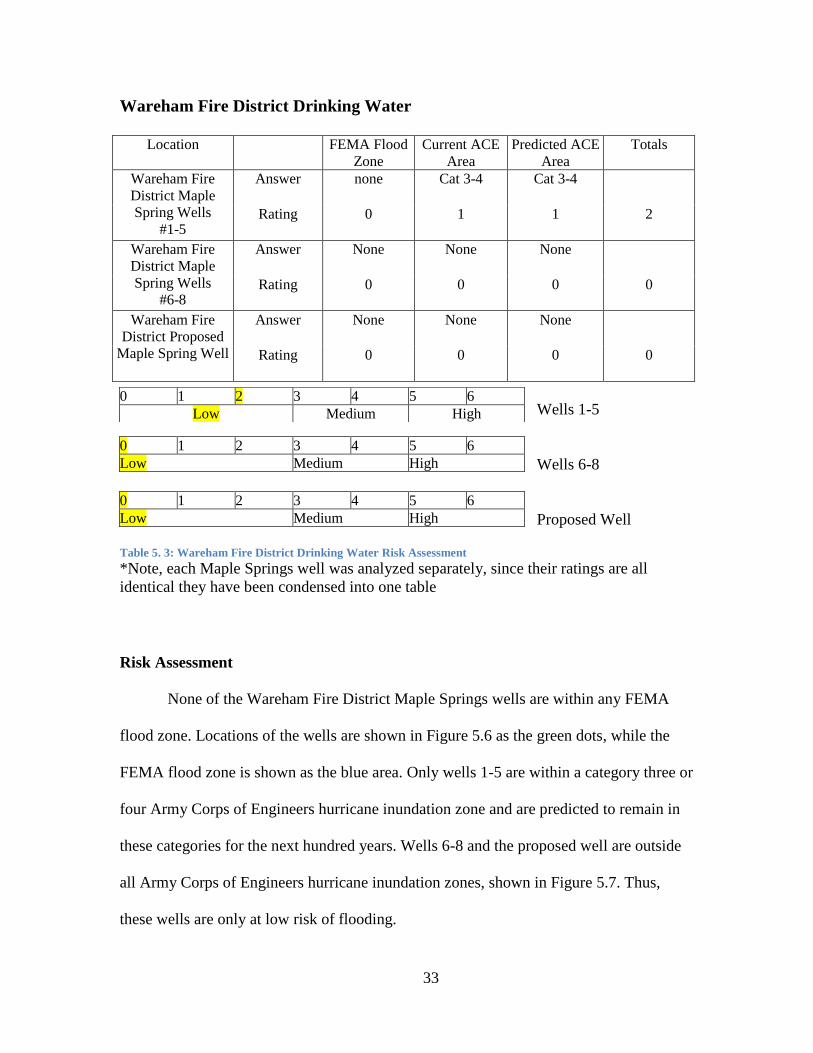
Wareham Fire District Drinking Water
Location FEMA Flood
Zone
Current ACE
Area
Predicted ACE
Area
Totals
Wareham Fire
District Maple
Spring Wells
#1-5
Answer none Cat 3-4 Cat 3-4
Rating 0 1 1 2
Wareham Fire
District Maple
Spring Wells
#6-8
Answer None None None
Rating 0 0 0 0
Wareham Fire
District Proposed
Maple Spring Well
Answer None None None
Rating 0 0 0 0
Wells 1-5
Wells 6-8
Proposed Well Table 5. 3: Wareham Fire District Drinking Water Risk Assessment
*Note, each Maple Springs well was analyzed separately, since their ratings are all
identical they have been condensed into one table
Risk Assessment
None of the Wareham Fire District Maple Springs wells are within any FEMA
flood zone. Locations of the wells are shown in Figure 5.6 as the green dots, while the
FEMA flood zone is shown as the blue area. Only wells 1-5 are within a category three or
four Army Corps of Engineers hurricane inundation zone and are predicted to remain in
these categories for the next hundred years. Wells 6-8 and the proposed well are outside
all Army Corps of Engineers hurricane inundation zones, shown in Figure 5.7. Thus,
these wells are only at low risk of flooding.
0 1 2 3 4 5 6
Low Medium High
0 1 2 3 4 5 6
Low Medium High
0 1 2 3 4 5 6
Low Medium High
34
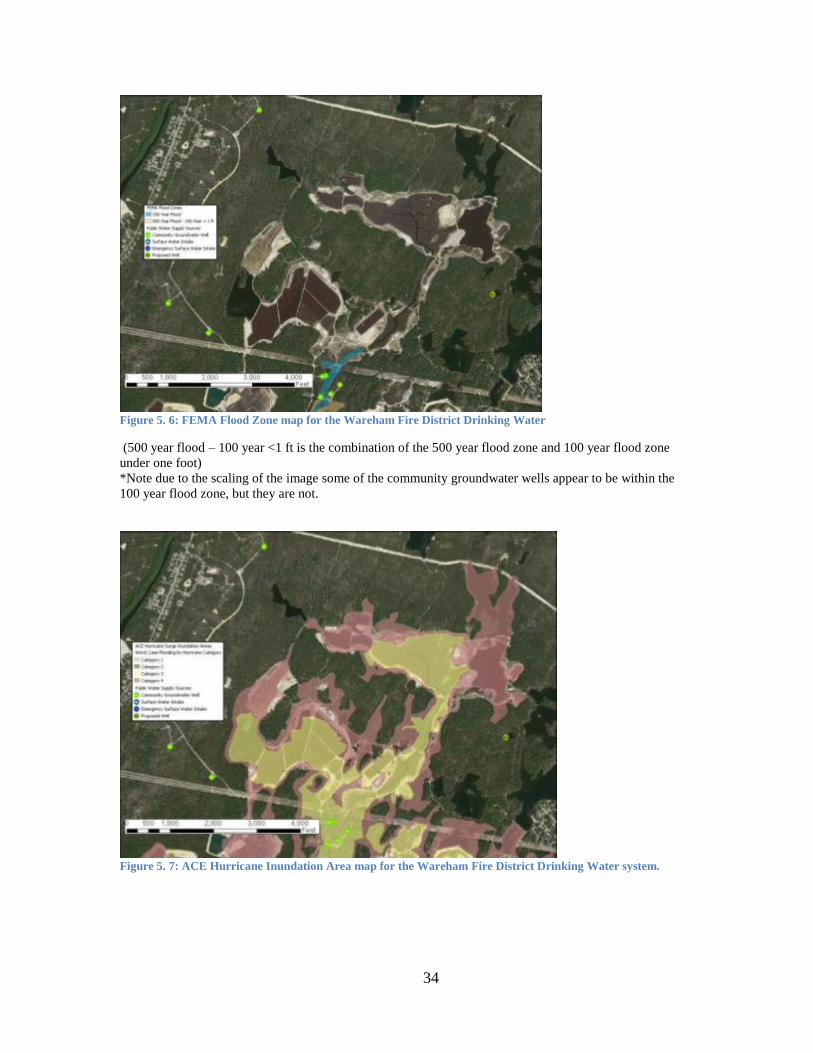
Figure 5. 6: FEMA Flood Zone map for the Wareham Fire District Drinking Water
(500 year flood – 100 year <1 ft is the combination of the 500 year flood zone and 100 year flood zone
under one foot)
*Note due to the scaling of the image some of the community groundwater wells appear to be within the
100 year flood zone, but they are not.
Figure 5. 7: ACE Hurricane Inundation Area map for the Wareham Fire District Drinking Water system.
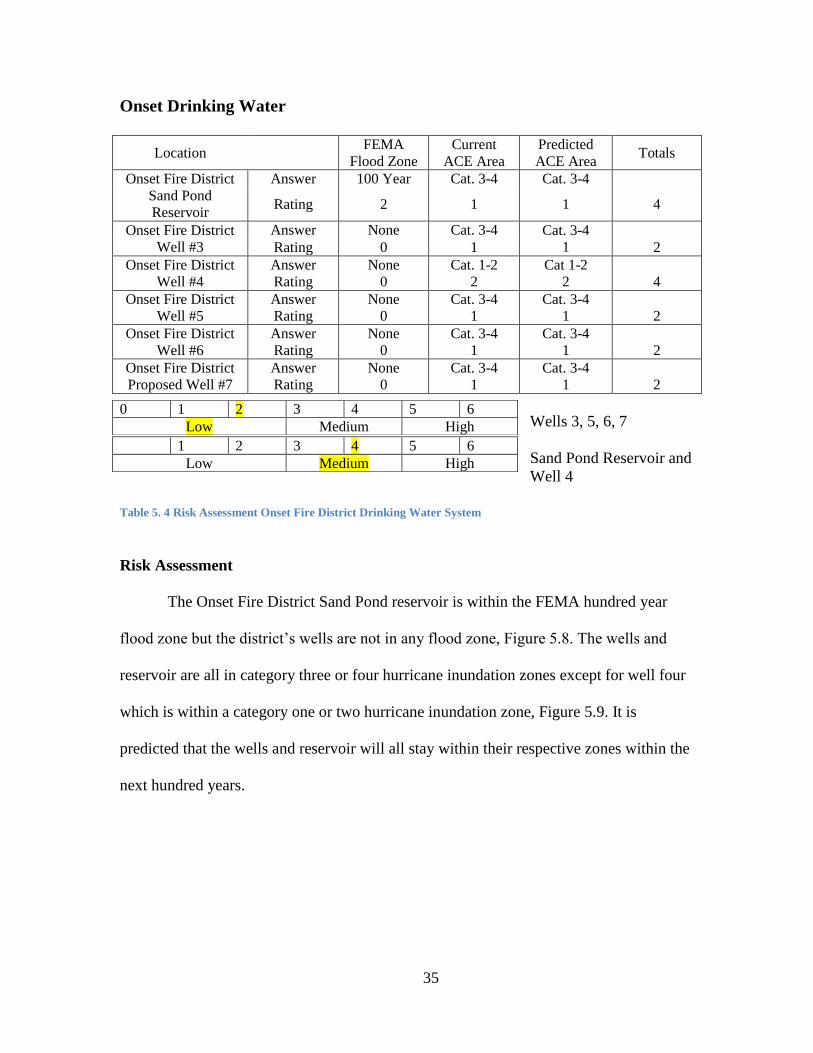
35
Onset Drinking Water
Location FEMA
Flood Zone
Current
ACE Area
Predicted
ACE Area Totals
Onset Fire District
Sand Pond
Reservoir
Answer 100 Year Cat. 3-4 Cat. 3-4
Rating 2 1 1 4
Onset Fire District
Well #3
Answer None Cat. 3-4 Cat. 3-4
1
Rating 0 1 2
Onset Fire District
Well #4
Answer
Rating
None
0
Cat. 1-2
2
Cat 1-2
2 4
Onset Fire District
Well #5
Answer
Rating
None
0
Cat. 3-4
1
Cat. 3-4
1 2
Onset Fire District
Well #6
Answer
Rating
None
0
Cat. 3-4
1
Cat. 3-4
1 2
Onset Fire District
Proposed Well #7
Answer
Rating
None
0
Cat. 3-4
1
Cat. 3-4
1 2
Wells 3, 5, 6, 7
Sand Pond Reservoir and
Well 4
Table 5. 4 Risk Assessment Onset Fire District Drinking Water System
Risk Assessment
The Onset Fire District Sand Pond reservoir is within the FEMA hundred year
flood zone but the district’s wells are not in any flood zone, Figure 5.8. The wells and
reservoir are all in category three or four hurricane inundation zones except for well four
which is within a category one or two hurricane inundation zone, Figure 5.9. It is
predicted that the wells and reservoir will all stay within their respective zones within the
next hundred years.
0 1 2 3 4 5 6
Low Medium High
1 2 3 4 5 6
Low Medium High

36
Figure 5. 8: FEMA Flood Zone map for the Onset Fire District Drinking Water System
(500 year flood – 100 year <1 ft is the combination of the 500 year flood zone and 100 year flood zone
under one foot)
Figure 5. 9: ACE Hurricane Inundation Area map for the Onset Fire District Drinking Water System
37
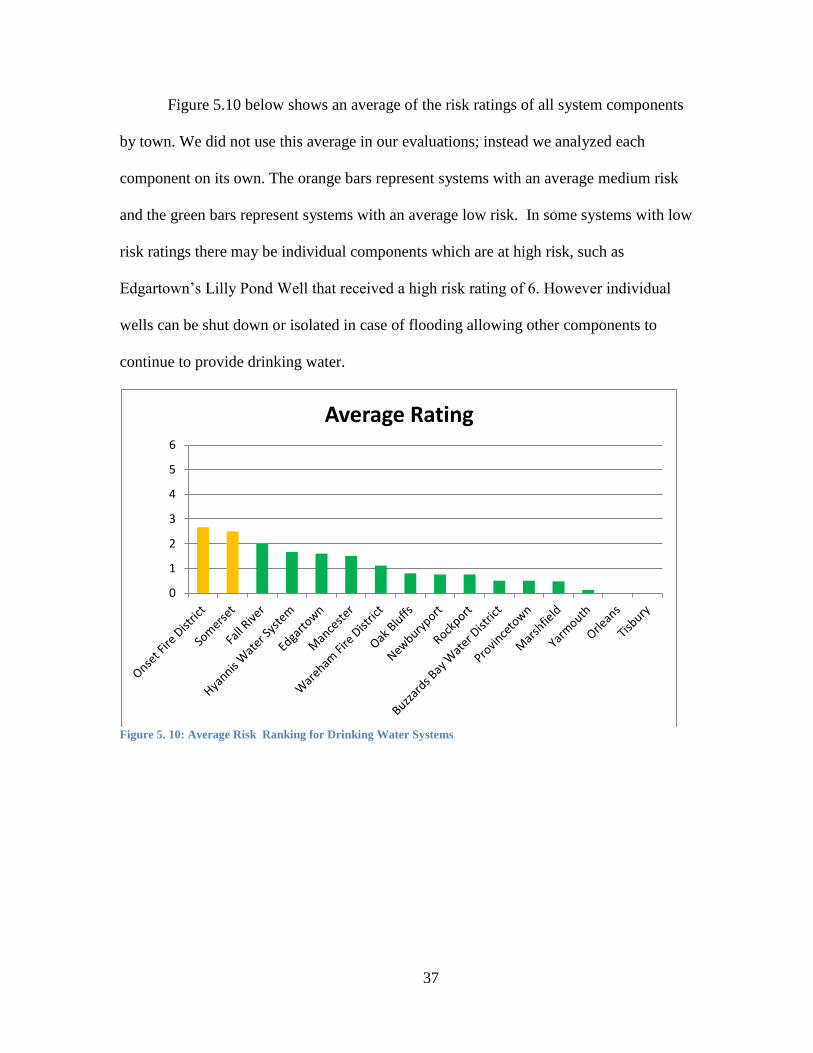
Figure 5.10 below shows an average of the risk ratings of all system components
by town. We did not use this average in our evaluations; instead we analyzed each
component on its own. The orange bars represent systems with an average medium risk
and the green bars represent systems with an average low risk. In some systems with low
risk ratings there may be individual components which are at high risk, such as
Edgartown’s Lilly Pond Well that received a high risk rating of 6. However individual
wells can be shut down or isolated in case of flooding allowing other components to
continue to provide drinking water.
Figure 5. 10: Average Risk Ranking for Drinking Water Systems
0
1
2
3
4
5
6
Average Rating
38
6 Impact Factors
In order to evaluate the impact of flooding on a facility and surrounding area, we
identified the following factors, which measure the effects that will occur when a facility
is inundated. We found these factors through interviews with plant personnel, experts at
the MassDEP, and other research of reports related to climate change and the effects of
flooding. They cover a wide variety of situations and were chosen to identify which
wastewater and drinking water facilities should be the focus of MassDEP’s efforts after
risk is taken into account.
6.1 Source Type The distinction between the different types of water sources is of importance to
note. Surface water sources such as ponds and reservoirs are open to flood waters and
thus can be contaminated in the event of flooding and storm surge. Ground water sources
have a natural filter that reduces the chance of them being contaminated by floodwaters.
It should also be noted that because surface water sources are open to floodwaters they
are regularly treated while groundwater sources are not.
6.2 Population Served
The population served by a drinking water plant is important to note. Should the
plant cease to function due to flooding, the population serves as a measure of the number
of people who will be without drinking water. It should be noted that many coastal
populations, especially around Cape Cod, have large fluctuations between the summer
and winter months due to tourism. In these cases we have measured population based on
the summer months as this will account for the worst case scenario should a system be
flooded.
39
6.3 Average Outflow Rate and Storage Capacity
The rate at which water flows from drinking water systems is also important to
consider. Systems with greater average flow rates will expend their stored water much
faster should flooding render them unable to treat additional water. It is important to
know the amount of drinking water that can be stored as this will affect the amount of
time the facility can supply clean drinking water while recovering from a flood when
compared to the average outflow rate. It is important to realize the various factors that
affect water usage rates such as the distinction between residential water use and
industrial water use. It should also be noted that, for some coastal towns, population
fluctuates significantly in the summer and winter due to tourism. In these cases it would
be helpful to find the days of storage for both winter and summer months.
6.4 Average Inflow Rate and Design Flow Rate
For wastewater facilities, it is important to measure the permitted inflow relative
to the facility’s design flow. The risk of flooding is increased the closer a plant is to
operating at capacity as a smaller increase in floodwater and subsequently flow is
required to exceed the plants’ capacity. The difference between these rates reveals the
stress the system is under, thus plants with higher average flow rates compared to their
design flow rates should be more prepared for flooding as they have less margin for
failure should the plant flood.
6.5 Bypass capabilities
The bypass methods available to a wastewater treatment plant will influence the
impacts a flooded plant will have on the surrounding people and environment. The ability
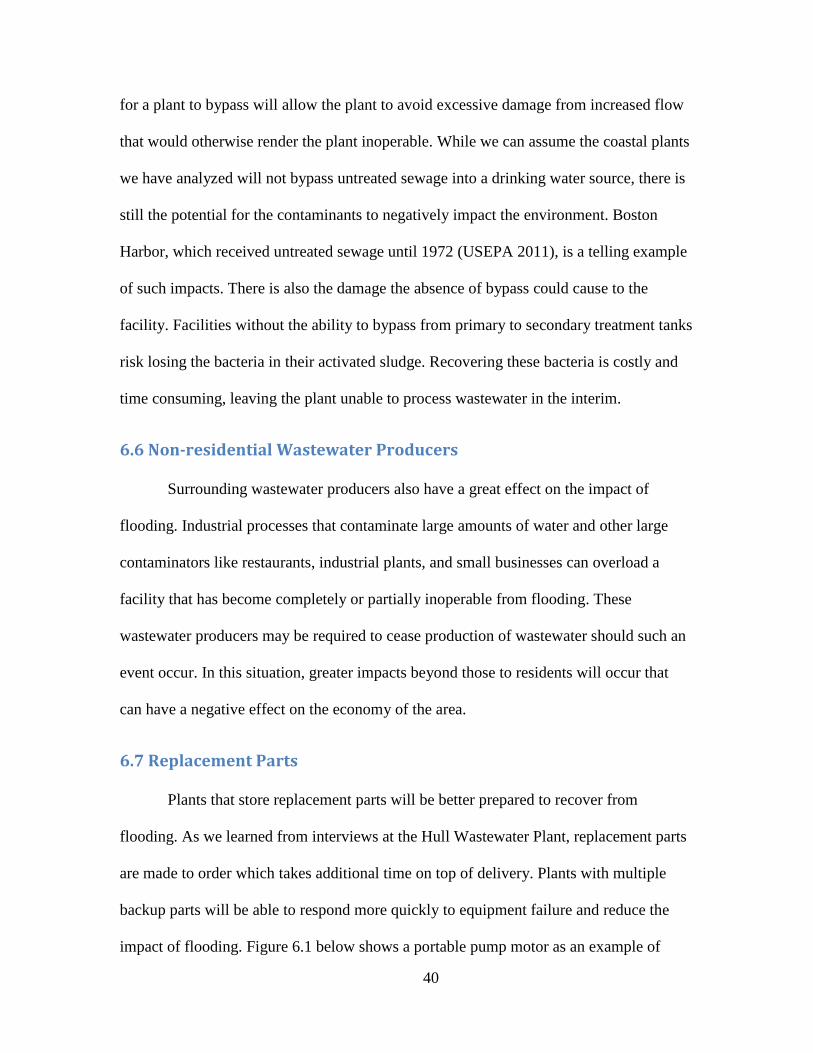
40
for a plant to bypass will allow the plant to avoid excessive damage from increased flow
that would otherwise render the plant inoperable. While we can assume the coastal plants
we have analyzed will not bypass untreated sewage into a drinking water source, there is
still the potential for the contaminants to negatively impact the environment. Boston
Harbor, which received untreated sewage until 1972 (USEPA 2011), is a telling example
of such impacts. There is also the damage the absence of bypass could cause to the
facility. Facilities without the ability to bypass from primary to secondary treatment tanks
risk losing the bacteria in their activated sludge. Recovering these bacteria is costly and
time consuming, leaving the plant unable to process wastewater in the interim.
6.6 Non-residential Wastewater Producers
Surrounding wastewater producers also have a great effect on the impact of
flooding. Industrial processes that contaminate large amounts of water and other large
contaminators like restaurants, industrial plants, and small businesses can overload a
facility that has become completely or partially inoperable from flooding. These
wastewater producers may be required to cease production of wastewater should such an
event occur. In this situation, greater impacts beyond those to residents will occur that
can have a negative effect on the economy of the area.
6.7 Replacement Parts
Plants that store replacement parts will be better prepared to recover from
flooding. As we learned from interviews at the Hull Wastewater Plant, replacement parts
are made to order which takes additional time on top of delivery. Plants with multiple
backup parts will be able to respond more quickly to equipment failure and reduce the
impact of flooding. Figure 6.1 below shows a portable pump motor as an example of
41
backup equipment that is key to keeping the Hull wastewater treatment plant functioning
in the event of damage due to flooding.
Figure 6. 1: Portable Pump Motor
6.8 Mutual Aid Agreements
Mutual aid agreements can significantly improve impact response to flooding. As
we found both at the Hull wastewater treatment plant and Provincetown wastewater
treatment facility, communication and cooperation with other local organizations will
give a water utility access to more workers and faster response times in an emergency.
The creation of a network between plants will also allow for greater ease in the sharing of
data allowing plants to develop, test, and evaluate response strategies and defense
measures more quickly and effectively.
6.9 Interconnections Interconnections are pipelines that allow the connected facilities to send finished
drinking water to one another in the event of one system becoming unable to deliver
finished water by itself. These interconnections help reduce the negative impact of
42
flooding on a drinking water system as it allows the system to have a backup source
should it be unable to process water.
6.10 Environmental Impacts The various risks caused by combined sewer systems have already been
discussed; however, there are associated impacts resulting from CSOs as well. While we
can reasonably assume that coastal facilities and their sewer systems will discharge into
or close to the ocean such that we need not worry about untreated sewage reaching
drinking water systems, we need to look at the potential impact this could have on the
environment. Environmental areas like marshlands downstream from wastewater
facilities and their combined sewer systems can be surveyed for and studied to find the
impact untreated sewage will have. The average inflow to wastewater facilities can also
be used to estimate the amount of sewage that can potentially be released and thus cause
greater environmental impacts.
43
7 Impact Assessment Tool
In order to gauge the negative impact a flood of drinking water or wastewater
infrastructure would have on the community or communities the infrastructure serves, we
used the factors described in Chapter 6 to create a tool to assign values to drinking water
and wastewater systems, such that higher values corresponded to worse impacts.
7.1 Development
The development of the impact assessment tools required balancing multiple
factors. The tools needed to be detailed enough to be used to compare facilities and gauge
the severity of the impacts of flooding or storms on the community. However, these tools
also needed to be simple enough to allow them to be applied easily and quickly to a large
number of facilities. Additionally, they needed to only use data that were easily
obtainable so that we would be able to apply the tool to the facilities we assessed. Below
are descriptions of the drinking and waste water impact assessment tools and descriptions
of the factors that were not used in these assessments.
7.1.1 Drinking Water
The factors related to impacts of flooding of drinking water systems that we
identified and used in our assessments were the type of source raw (untreated) water is
taken from, the number of people served by the drinking water system and how long the
finished (treated) water storage would last in the event that the system would be unable to
produce more finished water, either due to contamination of water sources or disabling of
pump stations and wells. The population served by the system is an indicator of the
number of people who would be impacted by risks to drinking water systems. The
amount of time the system’s stored finished water would last assuming that the stores
44
were not being replenished indicates how much time the population would have to react
to the impacts on their drinking water system.
The type of source the water is taken from by a drinking water system is
important to consider because surface water sources are more prone to contamination due
to runoff during a flood than groundwater sources are. A system that uses surface water
as a water source, even if the system also had groundwater sources, was given a rating of
1, while systems that used only groundwater sources were given a rating of 0. The type of
each source in a drinking water system is reported in the annual reports sent to MassDEP
by drinking water system administrators.
The population served by a drinking water system is important to consider
because a larger population means that more people will be impacted by a lack of
drinking water should a system fail. In order to rank the systems based on population, we
compared the populations served by all the systems we were assessing, and split them
into three categories such that there were an approximately equal number of systems in
each category. Systems which served a population of less than 15,000 were given a score
of zero for this factor, while systems which served a population greater than 15,000 and
less than 30,000 were given a score of one, and systems which served a population of
more than 30,000 people were given a score of two. The population served by a drinking
water system is reported by the system administrator in the yearly report sent to
MassDEP. This scoring system is based entirely upon the population figures of the
facilities we assessed, and may not be valid to use for assessing other systems.
The amount of time a system’s stored finished water would last was calculated by
dividing the finished water storage capacity of the system by the average daily amount of
45
water the system distributes. This factor is important because the longer the system can
distribute finished water to its population, the more likely the system will be operational
before running out of stored water, and the longer the population will have to react to
losing their source of drinking water. We assigned systems which have under one day of
storage a score of three, systems which have at least one day of storage and less than two
days of storage a score of two, systems which have at least two days and less than three
days of storage a score of one, and systems which have more than three days of storage a
score of zero. It is possible that this measure may be inaccurate, due to the possibility that
a system may not have their storage tanks filled to capacity with finished water. The data
on average flow rate and storage capacity are reported in the annual reports sent to
MassDEP by the administrators of drinking water systems. Additionally, we did not take
into account differences in water usage based on time of year. More accurate data on
finished water storage and how water usage changes throughout the year in each water
system could be used by MassDEP to create a more detailed assessment.
Factors that we identified but did not include in our assessment are:
interconnections the system has with other nearby systems, disinfection methods,
available emergency water sources, and water usage by different users. We did not have
direct access to information pertaining to the systems’ interconnections with other water
systems, and we were unable to collect these data in time to include this factor in our
assessments. The methods of disinfection used by drinking water treatment facilities were
available to us in the data stored in MassDEP’s Document Repository Tracking System
(DRTS), but we did not know enough about the effects these different methods would
have on the ability of a drinking water system to respond to a flood to be able to rank
46
facilities based on this factor. The emergency water sources available to a drinking water
system in the event of a flood are generally not registered with MassDEP, so acquiring
these data would require asking the administrators of drinking water systems for the
information. MassDEP could use figures for drinking water usage by residential,
industrial, and commercial users available in DRTS to determine the human and
economic impacts of a drinking water system being disabled.
7.1.2 Wastewater
The factor we used to assess the impact of a flood or other sea level rise related
event is the ratio of the average flow rate at a wastewater treatment facility to the design
flow capacity of that facility. This ratio measures how close to maximum capacity a
wastewater treatment facility operates. A facility which operates close to maximum
capacity will be less able to handle an increase in inflow which may be caused by a storm
or flood than that another facility which does not operate close to maximum capacity.
Since this is the only factor we used to rate the facilities, we did not assign values to these
ranges. Facilities which have an average flow rate of up to 50% of their design capacities
were rated as low impact, facilities with an average flow rate above 50% and up to 70%
of their design capacities were rated as medium impact, and facilities with an average
flow rate above 70% of their design capacities were rated as high impact.
MassDEP does not currently store information regarding the ability of wastewater
treatment facilities to bypass treatment or bypass only secondary treatment in a central
location, although staff in the MassDEP regional offices have this information for the
facilities they are assigned to. Similarly, there are no databases with spare parts
inventories, nor is there any information as to whether the administrators of the
47
wastewater systems have any mutual agreements with neighboring systems to provide aid
in the event of an emergency. These factors may be considered in future investigations,
but the information must be gathered from each individual system as it is unavailable in
MassDEP’s current databases.
7.2 Application
Below are examples of the impact assessment being applied to drinking water
systems and wastewater facilities. We applied this assessment to a total of 26 facilities
and systems.
7.2.1 Drinking Water
Below are two examples of the impact assessment being applied to drinking water
systems. The drinking water impact assessments for all 16 facilities can be found in
Appendix M, we omitted one system which purchases its water.
Hyannis Water System
The Hyannis Water System received a high impact rating on our assessment, as
shown in Table 7.1, because the department serves a large population and has less than
one day’s worth of storage. The Hyannis Water System serves a maximum population of
35,000 with an average rate of 2.39 million gallons per day. The department’s storage
capacity is 1.37 million gallons. The Hyannis Water System has the ability to store 0.57
days’ worth of water at the average flow rate.
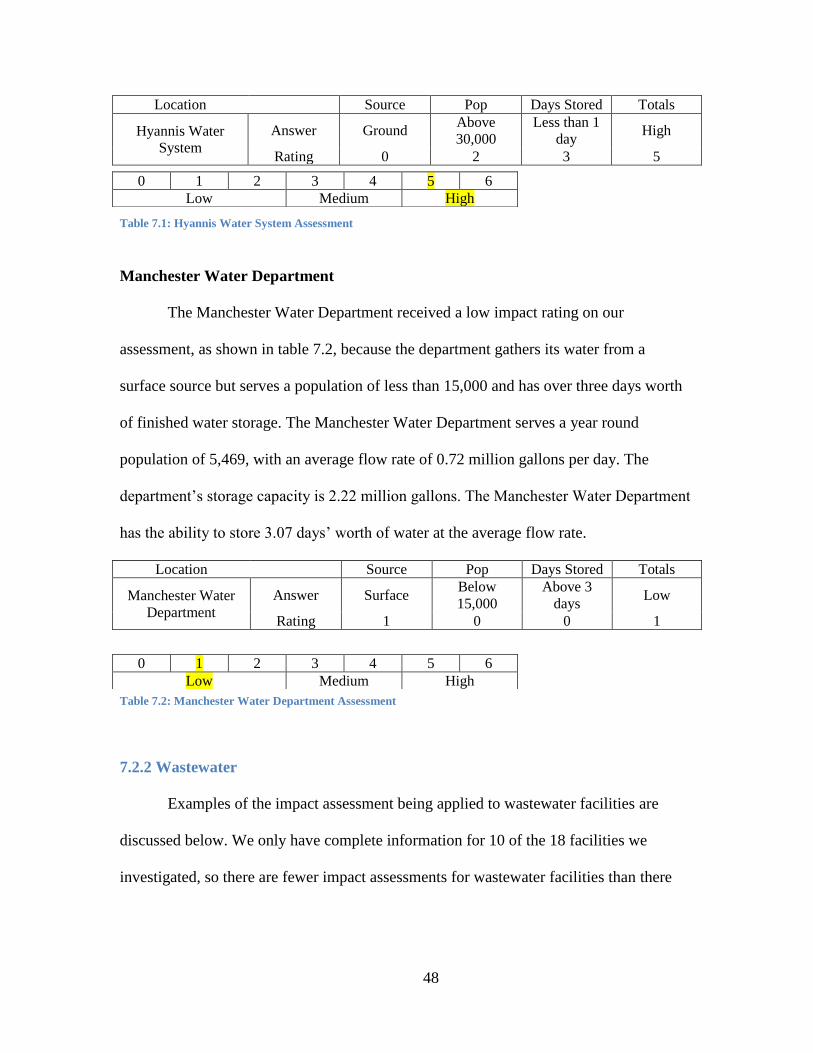
48
Location Source Pop Days Stored Totals
Hyannis Water
System
Answer Ground Above
30,000
Less than 1
day High
Rating 0 2 3 5
Table 7.1: Hyannis Water System Assessment
Manchester Water Department
The Manchester Water Department received a low impact rating on our
assessment, as shown in table 7.2, because the department gathers its water from a
surface source but serves a population of less than 15,000 and has over three days worth
of finished water storage. The Manchester Water Department serves a year round
population of 5,469, with an average flow rate of 0.72 million gallons per day. The
department’s storage capacity is 2.22 million gallons. The Manchester Water Department
has the ability to store 3.07 days’ worth of water at the average flow rate.
Location Source Pop Days Stored Totals
Manchester Water
Department
Answer Surface Below
15,000
Above 3
days Low
Rating 1 0 0 1
Table 7.2: Manchester Water Department Assessment
7.2.2 Wastewater
Examples of the impact assessment being applied to wastewater facilities are
discussed below. We only have complete information for 10 of the 18 facilities we
investigated, so there are fewer impact assessments for wastewater facilities than there
0 1 2 3 4 5 6
Low Medium High
0 1 2 3 4 5 6
Low Medium High

49
are risk assessments. The impact assessments for these 10 facilities are located in
Appendix L.
Scituate Wastewater Treatment Facility
If the Scituate Wastewater Treatment Plant becomes unable to process incoming
wastewater, up to 1.24 million gallons of wastewater every day may flood the plant and
the surrounding area. The plant has a design flow capacity of 1.6 million gallons. The
facility received a large impact rating because the ratio of average flow to design flow
yielded a value of 78%.
Hull Wastewater Treatment Facility
Hull Wastewater Treatment Facility’s average flow rate is 42% of its design flow
rate. We gave it a small impact rating, as the facility would need to more than double its
average inflow rate to exceed capacity. If the Hull Wastewater Treatment Plant becomes
unable to process incoming wastewater, up to 1.3 million gallons of wastewater every
day may flood the plant and the surrounding area. Hull Wastewater Treatment plant has a
design capacity of 3.07 million gallons per day; however, its average inflow is only 1.3
million gallons per day. The plant operators and town planners at the Hull Wastewater
Treatment plant have realized the danger the facility is in and as such have begun
planning. Below in figure 7.1 is an image given to us by the Chief Facilities Manager of
Hull Wastewater Treatment Plant, Edward Petrilak. It depicts what would happen to the
facility during a 100 year storm if the sea levels rose an additional 1.6 feet.

50
Figure 7.1: ASA, CZM Hull Wastewater Treatment Plant Flooding Map
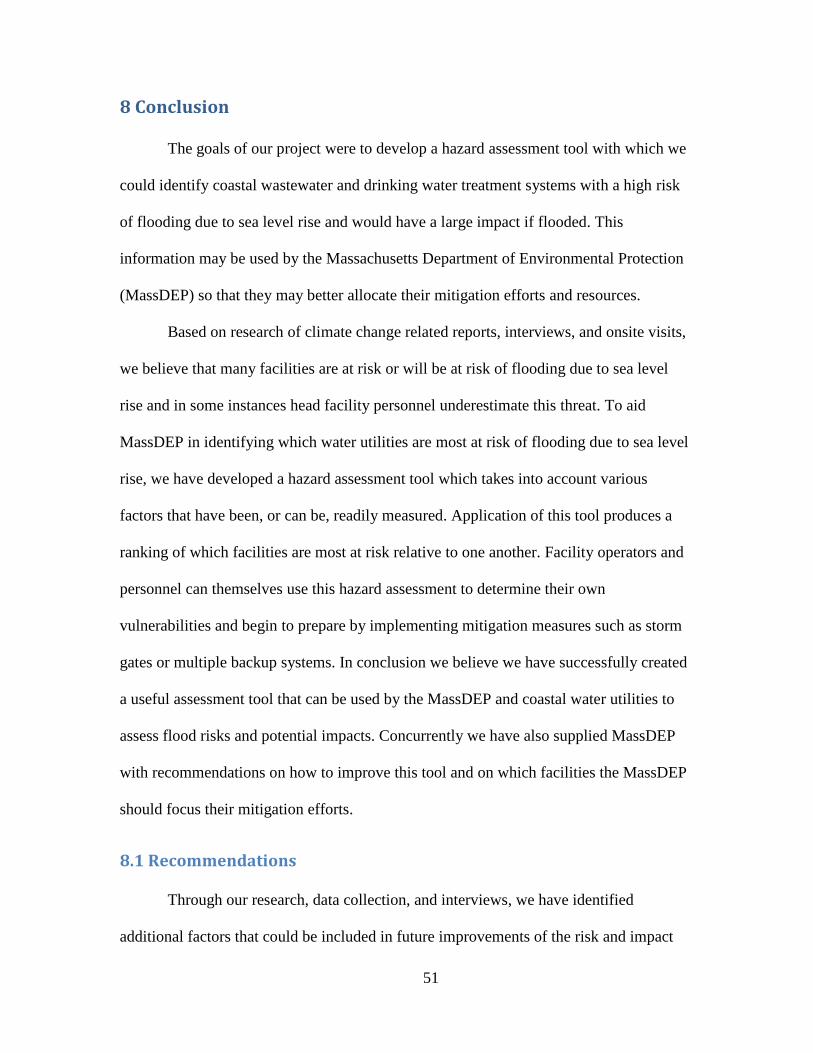
51
8 Conclusion
The goals of our project were to develop a hazard assessment tool with which we
could identify coastal wastewater and drinking water treatment systems with a high risk
of flooding due to sea level rise and would have a large impact if flooded. This
information may be used by the Massachusetts Department of Environmental Protection
(MassDEP) so that they may better allocate their mitigation efforts and resources.
Based on research of climate change related reports, interviews, and onsite visits,
we believe that many facilities are at risk or will be at risk of flooding due to sea level
rise and in some instances head facility personnel underestimate this threat. To aid
MassDEP in identifying which water utilities are most at risk of flooding due to sea level
rise, we have developed a hazard assessment tool which takes into account various
factors that have been, or can be, readily measured. Application of this tool produces a
ranking of which facilities are most at risk relative to one another. Facility operators and
personnel can themselves use this hazard assessment to determine their own
vulnerabilities and begin to prepare by implementing mitigation measures such as storm
gates or multiple backup systems. In conclusion we believe we have successfully created
a useful assessment tool that can be used by the MassDEP and coastal water utilities to
assess flood risks and potential impacts. Concurrently we have also supplied MassDEP
with recommendations on how to improve this tool and on which facilities the MassDEP
should focus their mitigation efforts.
8.1 Recommendations
Through our research, data collection, and interviews, we have identified
additional factors that could be included in future improvements of the risk and impact

52
assessment tool. Additionally, aside from our main recommendations on the
improvements to the assessment tool, we identified possible measures and technologies
being used to prepare facilities for flooding due to sea level rise. This section addresses
these identified future assessment tool factors, additional measures and the
recommendations that go along with them.
8.1.1 Future Additions to Assessment Tools
The following is a description of the future factors we believe should be
considered when making any additional changes to the assessment tools. We include
future considerations for both the risk assessment and impact assessment.
8.1.1.1 Future Risk Factors Due to time constraints and difficulty in acquiring data, the following factors were
not included in our hazard assessment but should be considered in future developments.
The first factor to be considered for the future is the elevation of individual
components at a wastewater treatment facility. The elevations of the individual
components of facilities determine how high flood waters need to be in order to cause
damage to the components. Many components, such as aeration basins and clarifiers, will
only be disabled if flood waters go over the top of the component, mixing with the water
within. However, some facilities have pumps in basements, so if flood water comes into
the first floor of the structure housing them, these components would be completely
submerged, disabling the facility.
The second factor to be considered is the presence of defensive structures at a
treatment facility or in the drinking water distribution system. There are many defense
measures that are already in use in some Massachusetts water utilities that can reduce the
53
risk as well as mitigate the effects of flooding. Defensive structures such as raised
structures, sea walls, dykes, and storm gates help to prevent damage to facilities due to
flooding. They may increase the effective elevation of components, allowing for higher
flood waters before a facility or component is disabled. To analyze these structures, effort
must be taken to find both their presence in facilities around components and near
facilities in the surrounding area.
8.1.1.2 Future Impact Factors Future impact factors to be considered for wastewater facilities include existence
of a bypass system, spare part inventories, backup systems, and mutual aid agreements.
MassDEP does not currently have information regarding the ability of wastewater
treatment facilities to bypass treatment or bypass only secondary treatment. Similarly,
there are no databases with spare parts inventories, nor is there any information as to
whether the administrators of the wastewater systems have any mutual agreements with
neighboring systems to provide aid in the event of an emergency. For example, through
interviews in Provincetown and Hull we found that facilities that communicate with other
local utilities were able to receive aid more quickly in response to emergencies. Aid
might include use of another facility’s equipment, or in some cases sharing of manpower
between these local utilities. Creating stronger bonds between local organizations, along
with a good working relationship with nearby facilities, will allow greater cooperation
between Massachusetts facilities and greater communication with the MassDEP. In Hull
it is common for the backup systems to be tested by using them under full load to run the
plant instead of only inspecting the backup system making sure each individual
component works. Replacement parts are also kept available at all times because ordering
needed parts can be time-consuming to obtain and install. These factors may be
54
considered in future investigations, but the information must be gathered from each
individual system, as it is unavailable in MassDEP’s current databases.
Future impact factors to be considered for drinking water systems include
interconnections the system has with other nearby systems, disinfection methods,
available emergency water sources, and water usage by different users. We did not have
direct access to information pertaining to the systems’ interconnections with other water
systems, and we were unable to collect these data in time to include this factor in our
assessments. The methods of disinfection used by drinking water treatment facilities were
available to us, but we did not know enough about the effects these different methods
would have on the ability of a drinking water system to respond to a flood to be able to
rank facilities based on this factor. The emergency water sources available to a drinking
water system in the event of a flood are generally not registered with MassDEP, so
acquiring these data would require asking the administrators of drinking water systems
for the information. MassDEP could use figures for drinking water usage by residential,
industrial, and commercial users to determine the human and economic impacts of a
drinking water system being disabled.
8.1.2 Recommendations to MassDEP We suggest greater transparency, meaning more open communication, between
the MassDEP, EPA, Massachusetts Water Works Association, New England Water
Works Association, New England Interstate Water Pollution Control Commission, and
other such state agencies across the country and a more comprehensive networking
system. Much of the data we found was stored in individually isolated locations or
otherwise difficult to obtain without contacting the individual in charge of each database.
This takes considerable time. The database network within MassDEP is similarly

55
fragmented in that it is composed of several databases with no central organized system.
As such, it is difficult to access information without specific knowledge of its location.
Making these data more accessible will not only serve to increase efficiency but will
allow the various organizations within MassDEP to better understand what is already
known and what isn’t.
Similarly, MassDEP and water utilities lack a central database with readily
accessible data regarding structural, historical, and technical information about
Massachusetts’s drinking water and wastewater facilities, for example the structural
barriers in place at a treatment facility. Additionally, there are advantages to be gained
from an increase in cooperation between MassDEP, water treatment facilities, and other
local organizations, mainly in times of emergencies such as flood related events.
56
Glossary
Environmental Protection Agency (EPA)
Geographical Information Systems (GIS)
Intergovernmental Panel on Climate Change (IPCC)
Massachusetts Department of Environmental Protection (MassDEP)
Maximum contaminant levels (MCLs)
Safe Drinking Water Act (SDWA)
Federal Emergency Management Agency (FEMA)
Army Corps of Engineers (ACE)
United State Geographical Service (USGS)
Wastewater Treatment Plant (WWTP)
Wastewater Treatment Facility (WWTF)
Water Pollution Control Facility (WPCF)
MassDEP Document Repository Tracking System (DRTS)

57
References
Adaptation Subcommittee to the Governor’s Steering Committee on Climate
Change. (2010). The Impacts of Climate Change on Connecticut Agriculture,
Infrastructure, Natural Resources, and Public Health. Hartford, Connecticut:
Conn. State Gov.
American Water Works Association. (2004). Recommended Practice for Backflow
Prevention and Cross-Connection Control - Manual of Water Supply Practices,
M14. AWWA. Retrieved from
http://www.knovel.com/web/portal/browse/display?_EXT_KNOVEL_DISPLAY
_bookid=3592&VerticalID=0
Barlow, P. M. (2003). Ground water in freshwater-saltwater environments of the
Atlantic coast. Reston, Virginia: U.S. Geological Survey.
Copeland, C. (2005). Hurricane-damaged drinking water and wastewater facilities:
Impacts, needs, and response. (CRS report for congress) Washington, D.C.:
Congressional Research Service, Library of Congress.
Crittenden, J. C., Trussell, R. R., Hand, D. W., Howe, K. J., & Tchobanoglous, G.
(2005). Water treatment - Principles and Design (2nd edition). Hoboken, New
Jersey: John Wiley & Sons.
Davis, M. L., & Masten, S. J. (2009). Principles of environmental engineering and
science (2nd ed.). New York, New York: McGraw-Hill.
Deyle, R., Bailey, K., & Matheny, A. (2007). Adaptive response planning to sea level
rise in Florida and implications for comprehensive and public-facilities planning.
Tallahase, FL: Florida Planning and Development Lab Department of Urban
and Regional Planning.
Droste, R. L. (1997). Theory and practice of water and wastewater treatment.
Hoboken, New Jersey: John Wiley & Sons, Inc.
FEMA. (2011a). Defining flood risks. Flooding &flood risks. Retrieved April 13,
2011 from
http://www.floodsmart.gov/floodsmart/pages/flooding_flood_risks/defining_floo
d_risks.jsp
FEMA. (2011b). Definitions of FEMA Flood Zone Designations. Retrieved
September 21, 2011 from
http://www.msc.fema.gov/webapp/wcs/stores/servlet/info?content=floodZones&t
itle=FEMA%20Flood%20Zone%20Designations
58
FEMA (2008) Flood Insurance Study Plymouth Massachusetts (All Jurisdictions).
Retrieved September 30, 2011 from http://www.hingham-
ma.gov/conservation/documents/DFIRM_Study_Prelim.pdf
Flood damage at wastewater treatment plant. (2010). Norfolk Insider. Retrieved
April 11, 2011 from
http://www.ci.norfolk.ne.us/Documents/Norfolk_Insider/Norfolk_Insider_20101
213.pdf
Gagnon, K., Keough, R., McGoff, M., Thompson, R. (2007) An investigation
into Worcester County’s “troubled waters”. Retrieved April 18, 2011 form
http://gordonlibrary.wpi.edu/vwebv/search?searchArg=MA+DEP&searchCode=
GKEY%5E*&limitTo=LOCA%3DPROJECTS+%28ALL+LOCATIONS%29&
recCount=50&searchType=1&page.search.search.button=Search
Hallegatte, S., Ranger, N., Mestre, O., Dumas, P., Corfee-Morlot, J., Herweijer, C.,
& Wood, R. M. (2008). Assessing climate change impacts, sea level rise and
storm surge risk in port cities: A case study on Copenhagen. Climatic Change
104 (1):113-137.
Heberger, M., Cooley, H., Herrera, P., Gleick, P. H., & Moore, E. (May 2009). The
impacts of sea-level rise on the California coast. California Climate Change Center.
Hester, R.E. & Harrison, R.M. (2002). Global Environmental Change. London,
England: Royal Society of Chemistry.
Hoffman, J. S., Keyes, D., & Titus, J. G. (1983). Projecting future sea level rise
(2nd ed.). Washington, D.C.: Strategic Studies Staff, Office of Policy Analysis,
Office of Policy and Resource Management, U.S. Environmental Protection
Agency.
Intergovernmental Panel on Climate Change. (2007). Intergovernmental panel on
climate change fourth assessment report. Working group 1 report: the physical
science basis. Retrieved April 2, 2011, from http://www.ipcc.ch/ipccreports/ar4-
wg1.htm
Kane County, Illinois. (2005). Stormwater management. Flood Information.
Retrieved April 11, 2011 from http://www.co.kane.il.us/kcstorm/flood/health.htm
Kirshen, P., Watson, C., Douglas, E., Gontz, A., Lee, J., & Tian, Y. (2008). Coastal
flooding in the northeastern United States due to climate change. Mitigation and
Adaptation Strategies for Global Change, 13(5), 437-571. doi:10.1007/s11027-007-
9130-5
Klein, J., & Staudt, M. (2006). Evaluatuion of future sea level rise impacts in
Pärnu/Estonia.Geological Survey of Finland, Special Paper 41, 71-81, 3 Figures
and 3 Tables.

59
Massachusetts Department of Environmental Protection (MassDEP). (2011a). About
MassDEP. Retrieved April 2, 2011, from
http://www.mass.gov/dep/about/index.htm
Massachusetts Department of Environmental Protection (MassDEP). (2011b)
MassDEP contacts: water, wastewater, and wetlands. Retrieved April 22, 2011
from http://www.mass.gov/dep/about/organization/watcon.htm
Massachusetts Department of Environmental Protection (MassDEP). (2011c).
MassDEP organization. Retrieved April 2, 2011, from
http://www.mass.gov/dep/about/organization/deporg.htm
Massachusetts Executive Office of Energy and Environmental Affairs. (2010). Fiscal
year 2010 budget summary. Retrieved April 2, 2011, from
http://www.mass.gov/bb/gaa/fy2010/app_10/sect_10/h200.htm
Massachusetts Executive Office of Energy and Environmental Affairs. (2011).
Climate change adaptation strategies for Massachusetts.
Massachusetts Office of Geographical Information (MassGIS). (2005). Elevation
(Topographic) Data (2005). Retrieved October 12, 2011, from
http://www.mass.gov/mgis/elev_2005.htm.
Ontario Ministry of the Environment. (2009). Adapting to climate change in
Ontario. Retrieved April 2, 2011, from
http://www.ene.gov.on.ca/environment/en/resources/STD01_076568.html
Ravindranath, N. H., & Sathaye, J. A. (2002). Climate change and developing
countries. Dordrecht, Netherlands: Kluwer Academic Publisher.
Rosenzweig, C., Major, D. C., Demong, K., Stanton, C., Horton, R., & Stults, M.
(2007). Managing climate change risks in New York City’s water system:
Assessment and adaptation planning. Mitigation and Adaptation Strategies for
Global Change, 12(8), 1391-1409.
Sawaragi, T. (1995). Coastal engineering - waves, beaches, wave-structure
interactions. Amsterdam: Elsevier. Retrieved from:
http://www.knovel.com/web/portal/browse/display?_EXT_KNOVEL_DISPLAY
_bookid=1907&VerticalID=0
Shimokawa, S., & Takeuchi, Y. (2006). Uncertainty in flood risks and public
understanding of probable rainfall. A Better Integrated Management of Disaster
Risks: Toward Resilient Society to Emerging Disaster Risks in Mega-Cities, 109-
119.

60
United States Environmental Protection Agency. (2011). Summary of the Clean
Water Act
http://www.epa.gov/lawsregs/laws/cwa.html
Union of Concerned Scientists. (2002). Gulf coast ecological heritage water cycle.
How the Cycle Works. Retrieved April 18, 2011 from
http://www.ucsusa.org/gulf/wincycle/gcwincyc_intrusion.html
U.S. Army Corps of Engineers. 2002. Coastal engineering manual. Engineer Manual
1110-2-1100, U.S. Army Corps of Engineers, Washington, D.C. Retrieved from:
http://www.knovel.com/web/portal/browse/display?_EXT_KNOVEL_DISPLAY
_bookid=1326
U.S. Geological Survey. (2000). Is seawater intrusion affecting ground water on Lopez
Island, Washington? Retrieved April 18, 2011 from
http://pubs.usgs.gov/fs/2000/fs-057-00/pdf/fs05700.pdf
Utah Department of Health. (2011). Recreational and drinking waterborne disease
prevention. Retrieved April 11, 2011 from:
http://health.utah.gov/epi/fact_sheets/recreationaldrinkingwater.pdf
Wu, S., Najjar, R., & Siewert, J. (2009). Potential impacts of sea-level rise on the
mid- and upper-atlantic region of the United States. Climatic Change, 95(1), 121-
138. doi:10.1007/s10584-008-9522-x
Yalcin, G., & Akyurek, Z. (2004). Analysing flood vulnerable areas with
multicriteria evaluation. Paper presented at the Geo-Imagery bridging continents,
XXth ISPRS Congress, 12-23.
61
Appendix A – Sponsor Description
Massachusetts Department of Environmental Protection
The Massachusetts Department of Environmental Protection’s (2011a) stated mission
is “The Department of Environmental Protection is the state agency responsible for
ensuring clean air and water, the safe management of toxics and hazards, the recycling of
solid and hazardous wastes, the timely cleanup of hazardous waste sites and spills, and
the preservation of wetlands and coastal resources” (para. 1). It is a State department that
is funded by the Massachusetts government. Its budget for the 2010 fiscal year was
$53.699 million (Massachusetts Executive Office of Energy and Environmental Affairs,
2010).
The Massachusetts Department of Environmental Protection (MassDEP) (2011c) has
a hierarchal structure, with the Commissioner at the top. The Deputy Commissioners of
the Operations, Policy and Planning, Administrative Services, General Counsel,
Legislative and Budgetary Affairs, and Public Affairs offices report directly to the
Commissioner, who is appointed by the Secretary of Energy & Environmental Affairs.
Under the Operations, Policy and Planning office are the Bureau of Policy and Planning
(of which Douglas Fine, our primary liaison, is the Assistant Commissioner), the Bureau
of Resource Protection (of which Ann Lowery, another liaison, is the Acting Assistant
Commissioner), the Bureau of Waste Prevention, the Bureau of Waste Site Cleanup, and
the Office of Research and Standards. We expect to be working very closely with the
Bureau of Policy and Planning, as our primary liaison is its Assistant Commissioner. We
also expect to work closely with the Bureau of Resource Protection, especially since their
Division of Watershed Management has a Wastewater Management program that deals
62
with storm water management and wastewater treatment plants and a Drinking Water
Program that deals with water supply infrastructure.
MassDEP has many resources that they may be able to leverage to help us in our
project. They are currently conducting research on climate change adaptation and the
effects of climate change on the water infrastructure, the results of which should be
extremely helpful to us. They also have many experienced individuals (MassDEP 2011b)
who are familiar with the issues we are investigating, whose knowledge and expertise
could be leveraged to great effect.
MassDEP is the only organization working on the specific problem presented by the
project, but other states’ Departments of Environmental Protection are working on similar
problems in their own states. MassDEP does not claim to cooperate with other states’
DEPs, and it does not appear that they share significant amounts of research, if they share
any at all.
63
Appendix B – Interview Questions
Questions for Professor Seth Tuler
Tell us a little about your background.
Can you give us a synopsis of your area of interest?
How big a role do you think government officials and local planners have in
improving water utilities defense against rising sea levels compared to the role of
the public and other lay men.
What are some effective methods to help us successfully communicate the risks
we find and urge response to them?
Questions for Professor John Bergendahl
Can you describe for us how seawater or fresh water flooding might affect the
biomass in wastewater treatment?
Are there any processes that would be affected more negatively by floodwaters
than others processes present at the treatment facility?
What if the treatment facility is flooded?
o Where does the excess water go?
o How much time can it take for a facility to recover from a flood and begin
operating?
Are there procedures used by water utilities to prepare/protect them from severe
storms?
Do you know of any prevention plans to protect against flooding? If yes, common
examples?
64
If we were presenting information about the importance of preparing water
treatment facilities to deal with sea level rising, what would be the most effective
method?
What topics/issues would you say are key for this information to cover, if any?
What would you say your opinion is on the risk of rising sea levels effects on water
utilities?
Questions for Design Engineers:
We are an undergraduate student from Worcester Polytechnic Institute doing a two-
month, full-time project with the Massachusetts Department of Environmental Protection
(MassDEP). Our project has two goals are:
1) Identify effects of climate-change related sea level rise and floodwaters on
Massachusetts coastal wastewater and drinking water facilities
2) Communicate these risks to facility managers and other stakeholders
1. We understand that you are a ____________ at _____________, could you please
describe your responsibilities here and your area of expertise?
2. Can you give us an overview of your general research and design process when it
comes to water utilities?
3. Do you consider climate change and sea level rise in your design, how big of a
factor are they?
a. If so, how do you address it, i.e. do the permit requirements satisfactorily
address sea level rise or must you go above and beyond to address the
issue.
4. What is the greatest degree of flooding you design your plants to withstand
against? (10 year, 100 year, etc.)
5. What, if any, new designs have been proposed or considered with the recent
hurricane events (Irene and Katrina) and if not is there a desire to create any?

65
6. Do you mind if we contact you in the future for feedback concerning any material
or information that we may come up with in the future?
Questions for Wastewater:
We are an undergraduate student from Worcester Polytechnic Institute doing a two-
month, full-time project with the Massachusetts Department of Environmental Protection
(MassDEP). Our project has two goals are:
1) Identify effects of climate-change related sea level rise and floodwaters on
Massachusetts coastal wastewater and drinking water facilities
2) Communicate these risks to facility managers and other stakeholders
1. We understand that you are a ____________ at _____________, could you please
describe your responsibilities here and your area of expertise?
2. What is the number of past flooding occurrences this plant has suffered?
a. What were the associated impacts on your facility and its operation?
b. Do you know the year that these floods occurred?
3. During these occurrences has flooding caused the facility to have to by-pass
incoming wastewater?
a. Where does the by-pass go?
4. What worries you the most about a facility flooding?
a. What equipment and/or treatment processes do you believe are most at
risk of flooding?
5. Do you believe that the current flood strategy at this facility is an efficient
strategy? Could you please rate it on a scale of 1-10?
6. Do you have any concerns about the impacts of sea level rise to your wastewater
facility?
a. If so, what are they/ which is your biggest?
66
b. If so, do you have any plans to make changes within the utility to
withstand these effects?
7. What do you, as a utility, see as a major road block for readying for floods/sea
level rise?
8. What information would be most helpful in explaining the risks? Should we give
specific examples of how the changes will affect the system, how much change
sea level rise has caused in Massachusetts and/or specific other communities that
have already started planning to mitigate risk?
9. What medium would be most accessible to stakeholders? (I.e. short pamphlet,
PowerPoint/slides, or some form of online resources?)
10. If we proposed possible adaptation that could be implemented at your facility
what would be the principal considerations for you i.e. cost, time, higher priorities
for capital investments?
11. Do you have any local maps or other documents such as plant layout drawings?
12. Do you mind if we contact you in the future for feedback concerning any material
or information that we may come up with in the future?

67
Questions for Drinking Water:
We are an undergraduate student from Worcester Polytechnic Institute doing a two-
month, full-time project with the Massachusetts Department of Environmental Protection
(MassDEP). Our project has two goals are:
1) Identify effects of climate-change related sea level rise and floodwaters on
Massachusetts coastal wastewater and drinking water facilities
2) Communicate these risks to facility managers and other stakeholders
1. We understand that you are a ____________ at _____________, could you please
describe your responsibilities here and your area of expertise?
2. Have you experienced an emergency related to sea level rise and/or flooding
during your career here?
a. Do you believe the flooding was or wasn’t related to climate change?
3. What is the number of past flooding occurrences this plant has suffered?
a. What were the associated impacts on your facility and its operation?
b. Do you know the year that these floods occurred?
4. Do you believe that the current flood strategy at this facility is an efficient
strategy? Could you rate it on a scale of 1-10?
5. Do you have any concerns about the impacts of sea level rise to your drinking
water utility?
a. If so, what are they/ which is your biggest?
b. If so do you have any plans to make changes within the utility to withstand
these effects?
68
6. What do you, as a utility, see as a major road block for readying for floods/sea
level rise?
7. What information would be most helpful in explaining the risks? Should we give
specific examples of how the changes will affect the system, how much change
sea level rise has caused in Massachusetts and/or specific other communities that
have already started planning to mitigate risk?
8. What medium would be most accessible to stakeholders? (I.e. short pamphlet,
PowerPoint/slides or some form of online resources?)
9. If we proposed possible adaptation that could be implemented at your facility
what would be the principal considerations for you i.e. cost, time, higher priorities
for capital investments?
10. Do you have any local maps or other documents such as plant layout drawings?
11. Do you mind if we contact you in the future for feedback concerning any material
or information that we may come up with?
69
Appendix C – Interviews with Resource Persons
Tuler Interview Location: SL 334
MADEP
Thursday, April 07, 2011
Attendees: Adam Bluenau (Chair), Alicia Turner(Secretary), Professor Seth Tuler
I. Area of research
a. Structured discussion climate change adaptation with planning officials in South
Carolina
II. Advice
a. Key people we should talk to?
i. Town officers because they are the Planners.
ii. Also need the town people’s support
b. Suggest small changes that are needed now and that will be helpful in the future.
i. Small changes will get planners involved
c. Media
ii. Gear media to simple immediate changes not just stuff that will need to
change in 30 or 50 years
iii. Also include where residents can get assistance
iv. Include examples/case studies
v. Might want to create some geared at towns people
III. Helpful sites/people
a. Review Professor Tuler’s website and projects
b. Look into the Sea Grant Program
c. Check out ICLEI website and research
i. Try to contact Missy Stults
d. Other possibly helpful people
i. Joan Carmin (MIT)
ii. Ellen Douglas (EEOS)
iii. Lee Tryhorn (Cornell)
1. Did a presentation in Seattle in Jan. at a conference held by the
AMS on NY Wastewater Facilities
IV. Action Items
a. Group
i. Review Prof. Tuler’s presentation (Sunday, 4/10, 11 am)
ii. Look at ICLEI website and into the Sea Grant Program
V. At Next Meeting
a. Email persons listed above about possible interviews
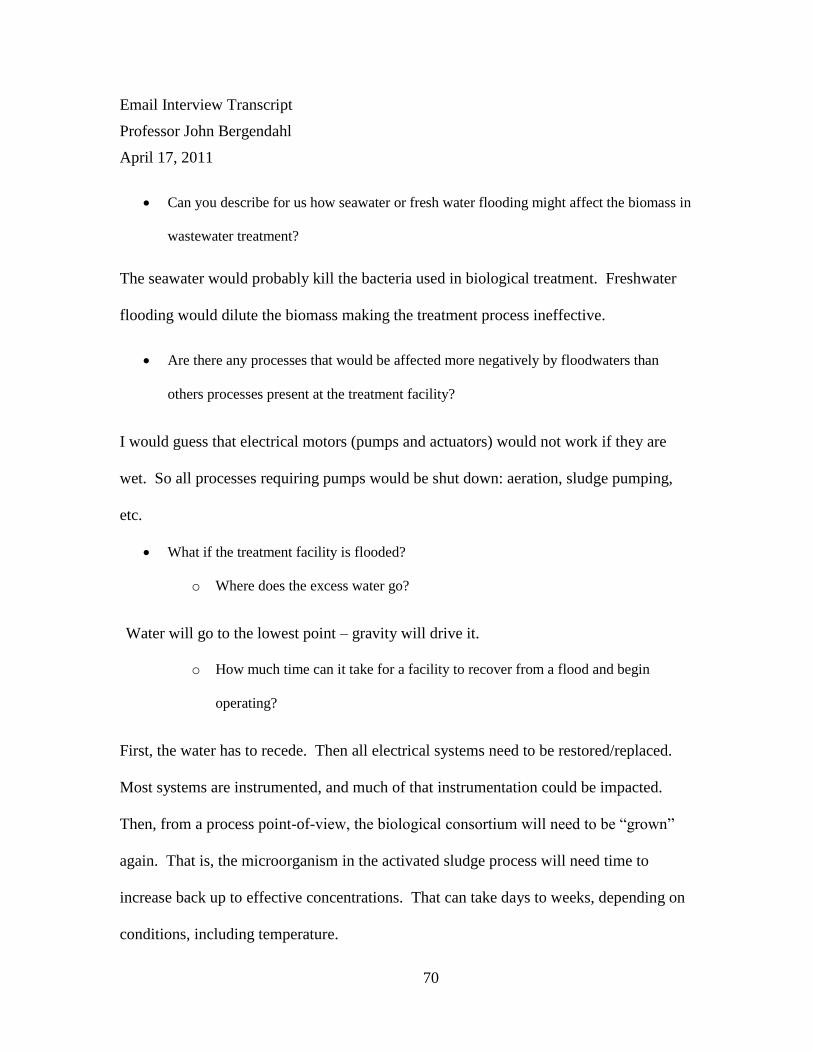
70
Email Interview Transcript
Professor John Bergendahl
April 17, 2011
Can you describe for us how seawater or fresh water flooding might affect the biomass in
wastewater treatment?
The seawater would probably kill the bacteria used in biological treatment. Freshwater
flooding would dilute the biomass making the treatment process ineffective.
Are there any processes that would be affected more negatively by floodwaters than
others processes present at the treatment facility?
I would guess that electrical motors (pumps and actuators) would not work if they are
wet. So all processes requiring pumps would be shut down: aeration, sludge pumping,
etc.
What if the treatment facility is flooded?
o Where does the excess water go?
Water will go to the lowest point – gravity will drive it.
o How much time can it take for a facility to recover from a flood and begin
operating?
First, the water has to recede. Then all electrical systems need to be restored/replaced.
Most systems are instrumented, and much of that instrumentation could be impacted.
Then, from a process point-of-view, the biological consortium will need to be “grown”
again. That is, the microorganism in the activated sludge process will need time to
increase back up to effective concentrations. That can take days to weeks, depending on
conditions, including temperature.
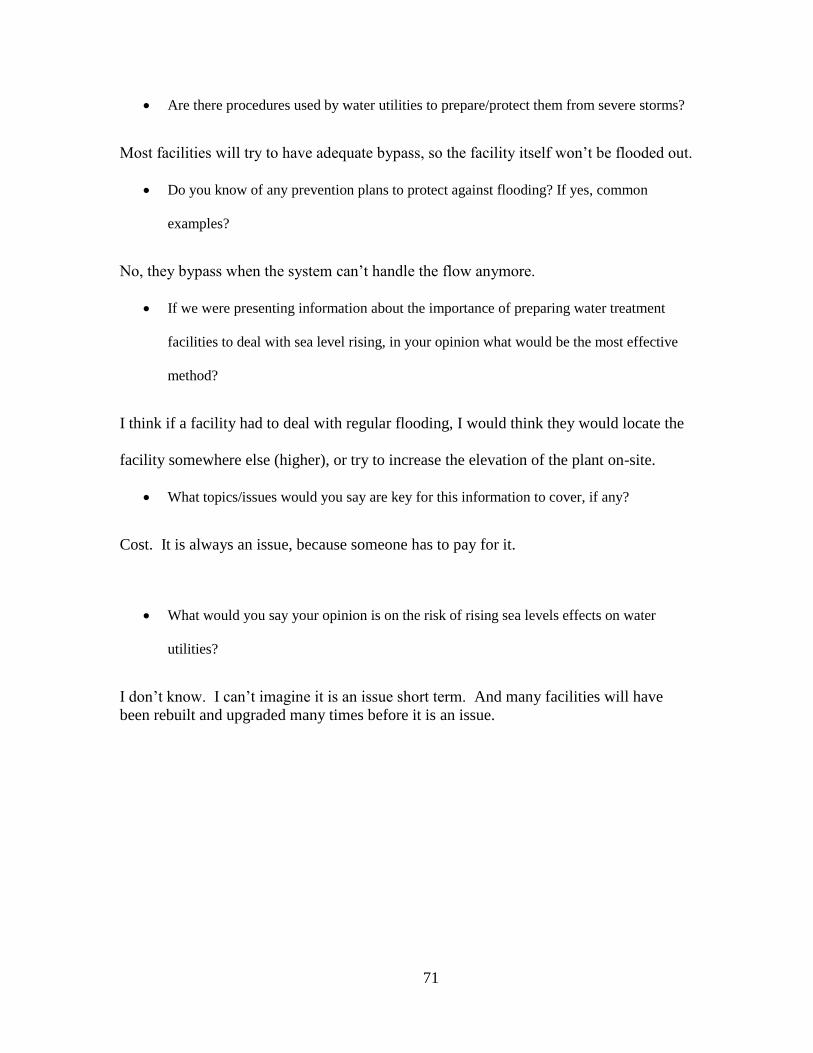
71
Are there procedures used by water utilities to prepare/protect them from severe storms?
Most facilities will try to have adequate bypass, so the facility itself won’t be flooded out.
Do you know of any prevention plans to protect against flooding? If yes, common
examples?
No, they bypass when the system can’t handle the flow anymore.
If we were presenting information about the importance of preparing water treatment
facilities to deal with sea level rising, in your opinion what would be the most effective
method?
I think if a facility had to deal with regular flooding, I would think they would locate the
facility somewhere else (higher), or try to increase the elevation of the plant on-site.
What topics/issues would you say are key for this information to cover, if any?
Cost. It is always an issue, because someone has to pay for it.
What would you say your opinion is on the risk of rising sea levels effects on water
utilities?
I don’t know. I can’t imagine it is an issue short term. And many facilities will have
been rebuilt and upgraded many times before it is an issue.
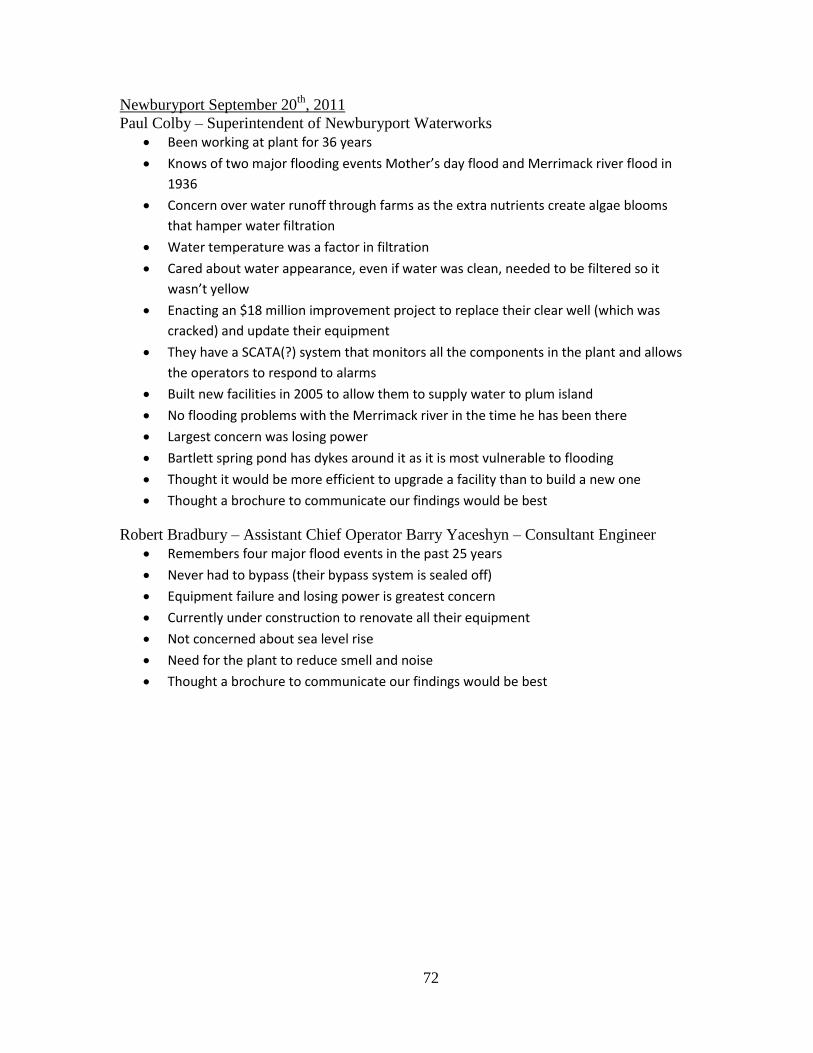
72
Newburyport September 20th
, 2011
Paul Colby – Superintendent of Newburyport Waterworks
Been working at plant for 36 years
Knows of two major flooding events Mother’s day flood and Merrimack river flood in
1936
Concern over water runoff through farms as the extra nutrients create algae blooms
that hamper water filtration
Water temperature was a factor in filtration
Cared about water appearance, even if water was clean, needed to be filtered so it
wasn’t yellow
Enacting an $18 million improvement project to replace their clear well (which was
cracked) and update their equipment
They have a SCATA(?) system that monitors all the components in the plant and allows
the operators to respond to alarms
Built new facilities in 2005 to allow them to supply water to plum island
No flooding problems with the Merrimack river in the time he has been there
Largest concern was losing power
Bartlett spring pond has dykes around it as it is most vulnerable to flooding
Thought it would be more efficient to upgrade a facility than to build a new one
Thought a brochure to communicate our findings would be best
Robert Bradbury – Assistant Chief Operator Barry Yaceshyn – Consultant Engineer
Remembers four major flood events in the past 25 years
Never had to bypass (their bypass system is sealed off)
Equipment failure and losing power is greatest concern
Currently under construction to renovate all their equipment
Not concerned about sea level rise
Need for the plant to reduce smell and noise
Thought a brochure to communicate our findings would be best

73
Provincetown September 22nd
, 2011
Chris Rowe – Plant Operator
Plant uses an air vacuum system to collect waste and bring it to station
1-3 houses have a small vacuum system that collects wastewater and pumps it to a
central pump station when it fill
Pump station collects all the waste and send it to the plant to be processed
The plant has an emergency response plan with a section specifically set against
flooding
Has a good relationship with the community
Has the ability to call up surrounding stations and borrow employees
Primary concern is happiness of the client/community, then cost
Preferred an online resource to communicate our results
Carl Hillstrom– Drinking water
Could think of no major flooding events, was not concerned about flooding
Their drinking water pumps take from a lens (underground freshwater source on top of
a saltwater source)
Most concerned about population and water use (too much will reduce the lens)
Preferred an online resource to communicate our results

74
Hull September 27th
, 2011
Edward Petrilak – Chief Facility Manager
The facility suffered a major flood in 1978 before the plant was run by the city. Took 2
years to fix.
The plant has exceeded its 3.07 MGD with costal storms and, I and I (inflow-when grey
water gets in the system and infiltration- water seeps in to the system through things
like old clay pipes).
Over capacity had no physical effect on the plant but washed all the bugs and bacteria
into the ocean. Now to prevent the bugs being washed away a section of the population
is sequestered and used to later rebuild the population so treatment could begin right
away, otherwise it could take many days to rebuild the bacterial population.
If any alarm is activated at the facility the plant must be manned. During storms there
are 2-3 people on duty at all times with only 6 staff members.
Extra running hours on the equipment during a storm.
Spare pump motors are stocked for every major pump. Spares of everything are kept in
the facility because in the case of a disaster the plant might be inaccessible.
During a flood what is worried about the most?: Losing pump stations, equipment and
staff.
Comfortable in their well defined flood strategy. With unlimited resources replacing
pipes and rebuilding pump stations just a general update all equipment. Realistically
don’t know where to improve more because it’s always been considered since the
building was built.
No plans to make changes to the facility.
Biggest roadblock is regulation, permits and procedures.
What would be useful for outreach would be to find a way to overlay rising sea levels
with how it would affect surges and currents. Get people to look beyond just sea level
rise and to think about storm surges and currents as well.
Always give a hard copy of outreach to be filed to ensure that the data can still be read
even when the medium used to store it on can no longer be used.
Addition to the chlorine tank walls happened in the early 2000s. Storm walls were 1978-
1980.
Other tanks were originally built to factor in flooding. And have not been added to.
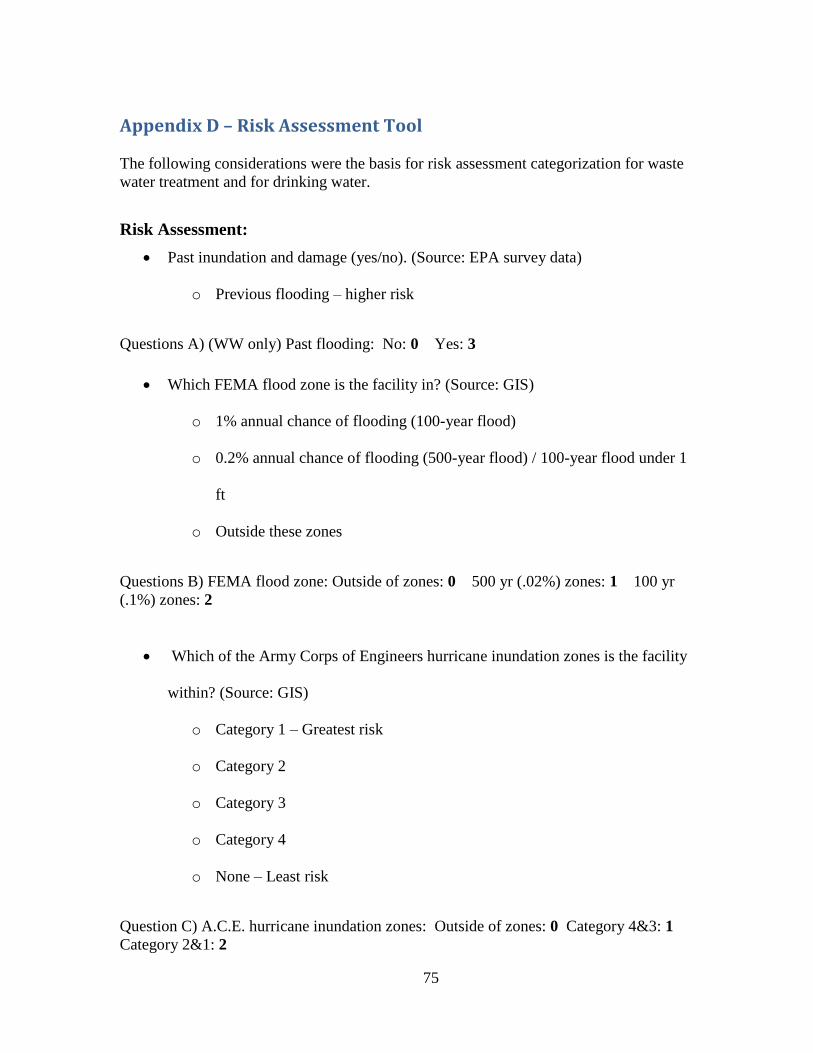
75
Appendix D – Risk Assessment Tool
The following considerations were the basis for risk assessment categorization for waste
water treatment and for drinking water.
Risk Assessment:
Past inundation and damage (yes/no). (Source: EPA survey data)
o Previous flooding – higher risk
Questions A) (WW only) Past flooding: No: 0 Yes: 3
Which FEMA flood zone is the facility in? (Source: GIS)
o 1% annual chance of flooding (100-year flood)
o 0.2% annual chance of flooding (500-year flood) / 100-year flood under 1
ft
o Outside these zones
Questions B) FEMA flood zone: Outside of zones: 0 500 yr (.02%) zones: 1 100 yr
(.1%) zones: 2
Which of the Army Corps of Engineers hurricane inundation zones is the facility
within? (Source: GIS)
o Category 1 – Greatest risk
o Category 2
o Category 3
o Category 4
o None – Least risk
Question C) A.C.E. hurricane inundation zones: Outside of zones: 0 Category 4&3: 1
Category 2&1: 2
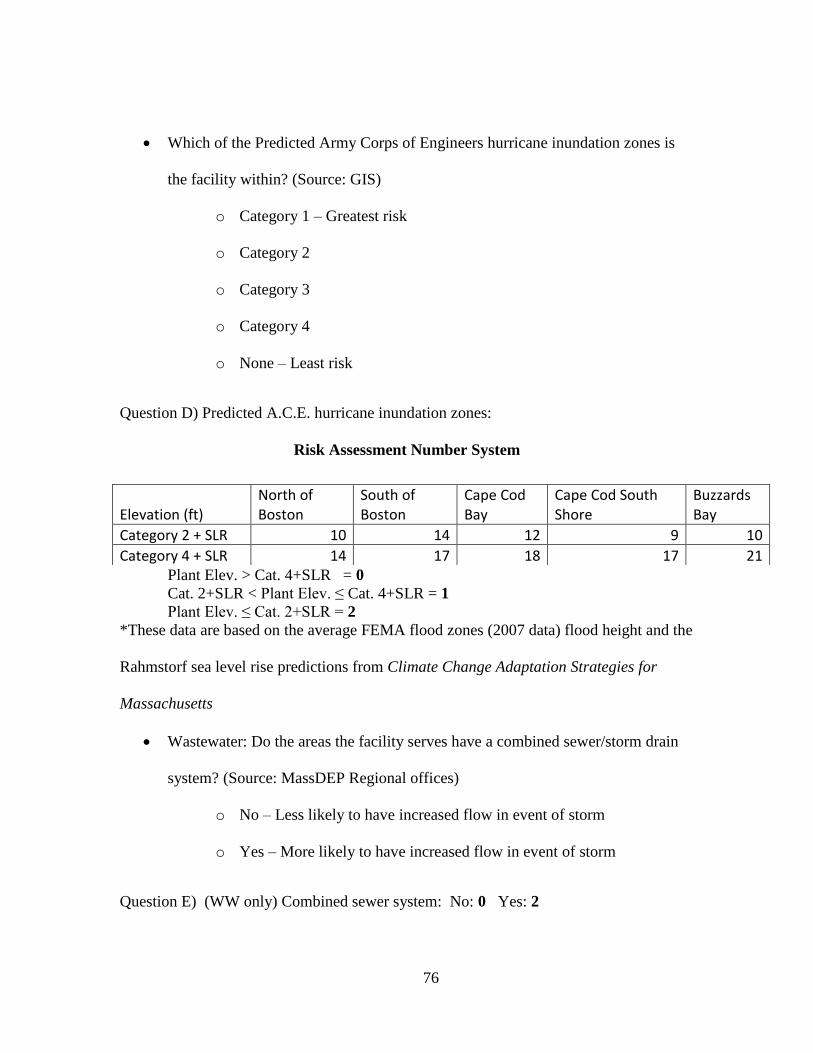
76
Which of the Predicted Army Corps of Engineers hurricane inundation zones is
the facility within? (Source: GIS)
o Category 1 – Greatest risk
o Category 2
o Category 3
o Category 4
o None – Least risk
Question D) Predicted A.C.E. hurricane inundation zones:
Risk Assessment Number System
Plant Elev. > Cat. 4+SLR = 0
Cat. 2+SLR < Plant Elev. ≤ Cat. 4+SLR = 1
Plant Elev. ≤ Cat. 2+SLR = 2
*These data are based on the average FEMA flood zones (2007 data) flood height and the
Rahmstorf sea level rise predictions from Climate Change Adaptation Strategies for
Massachusetts
Wastewater: Do the areas the facility serves have a combined sewer/storm drain
system? (Source: MassDEP Regional offices)
o No – Less likely to have increased flow in event of storm
o Yes – More likely to have increased flow in event of storm
Question E) (WW only) Combined sewer system: No: 0 Yes: 2
Elevation (ft) North of Boston
South of Boston
Cape Cod Bay
Cape Cod South Shore
Buzzards Bay
Category 2 + SLR 10 14 12 9 10
Category 4 + SLR 14 17 18 17 21

77
Wastewater scale
Drinking Water scale
Example of use: Newburyport WWTP
Question A B C D E
Answer No 100yr. Cat. 2 No No
Ans. # value 0 2 2 0 2 Total = 6
Using data we have collected we can answer question a-e above which will give a
number value for each answer. Then adding up those numbers gives a total which can be
looked up on the scale and gives a preliminary rating for the facility as Low, Medium, or
High.
0 1 2 3 4 5 6 7 8 9 10 11
Low Medium High
0 1 2 3 4 5 6
Low Medium High
0 1 2 3 4 5 6 7 8 9 10 11
Low Medium High
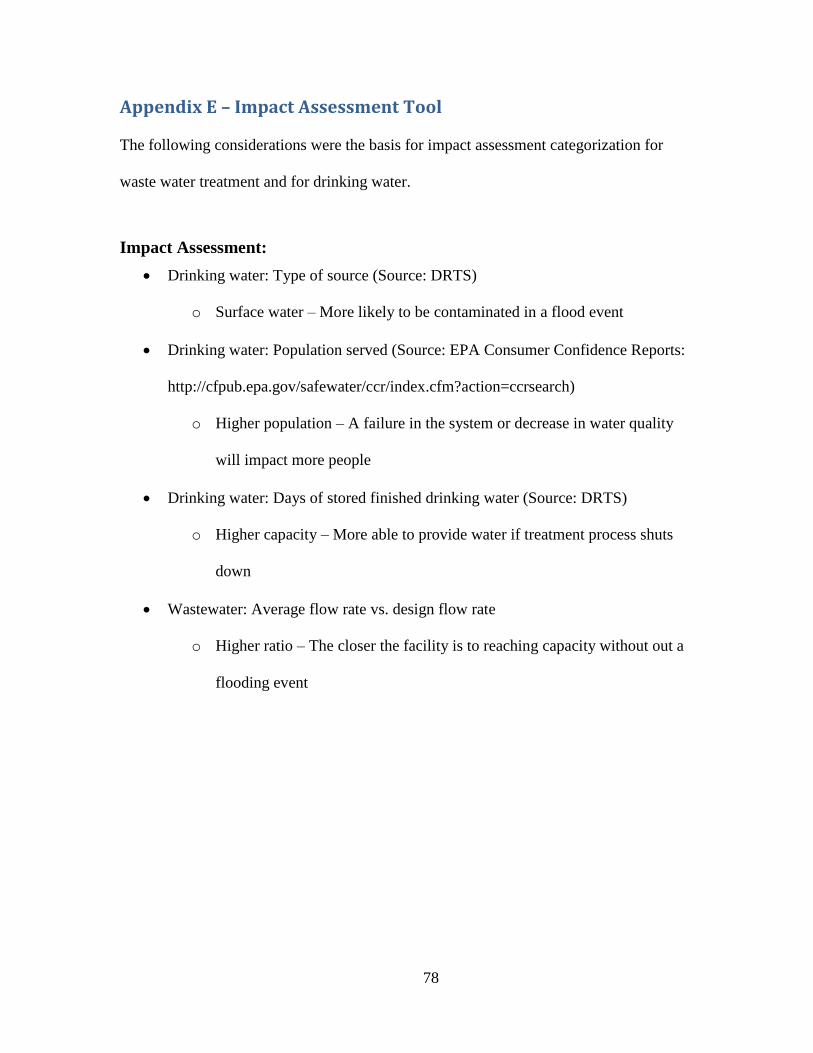
78
Appendix E – Impact Assessment Tool
The following considerations were the basis for impact assessment categorization for
waste water treatment and for drinking water.
Impact Assessment:
Drinking water: Type of source (Source: DRTS)
o Surface water – More likely to be contaminated in a flood event
Drinking water: Population served (Source: EPA Consumer Confidence Reports:
http://cfpub.epa.gov/safewater/ccr/index.cfm?action=ccrsearch)
o Higher population – A failure in the system or decrease in water quality
will impact more people
Drinking water: Days of stored finished drinking water (Source: DRTS)
o Higher capacity – More able to provide water if treatment process shuts
down
Wastewater: Average flow rate vs. design flow rate
o Higher ratio – The closer the facility is to reaching capacity without out a
flooding event
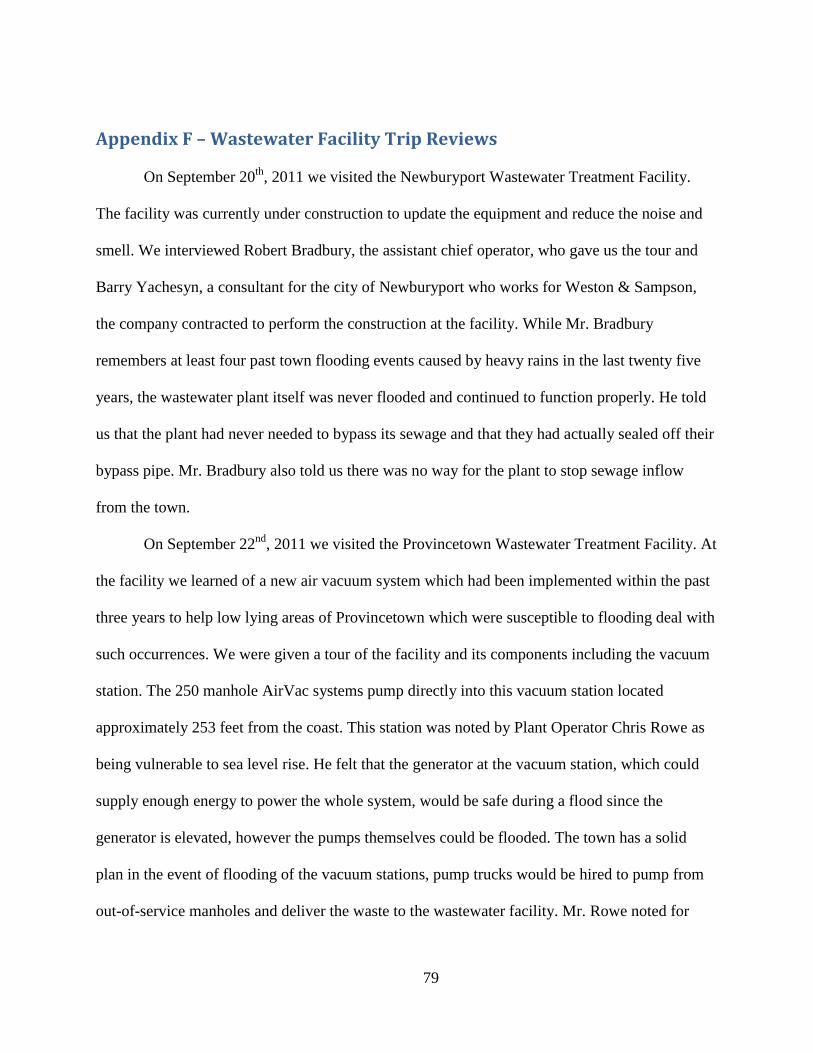
79
Appendix F – Wastewater Facility Trip Reviews
On September 20th
, 2011 we visited the Newburyport Wastewater Treatment Facility.
The facility was currently under construction to update the equipment and reduce the noise and
smell. We interviewed Robert Bradbury, the assistant chief operator, who gave us the tour and
Barry Yachesyn, a consultant for the city of Newburyport who works for Weston & Sampson,
the company contracted to perform the construction at the facility. While Mr. Bradbury
remembers at least four past town flooding events caused by heavy rains in the last twenty five
years, the wastewater plant itself was never flooded and continued to function properly. He told
us that the plant had never needed to bypass its sewage and that they had actually sealed off their
bypass pipe. Mr. Bradbury also told us there was no way for the plant to stop sewage inflow
from the town.
On September 22nd
, 2011 we visited the Provincetown Wastewater Treatment Facility. At
the facility we learned of a new air vacuum system which had been implemented within the past
three years to help low lying areas of Provincetown which were susceptible to flooding deal with
such occurrences. We were given a tour of the facility and its components including the vacuum
station. The 250 manhole AirVac systems pump directly into this vacuum station located
approximately 253 feet from the coast. This station was noted by Plant Operator Chris Rowe as
being vulnerable to sea level rise. He felt that the generator at the vacuum station, which could
supply enough energy to power the whole system, would be safe during a flood since the
generator is elevated, however the pumps themselves could be flooded. The town has a solid
plan in the event of flooding of the vacuum stations, pump trucks would be hired to pump from
out-of-service manholes and deliver the waste to the wastewater facility. Mr. Rowe noted for
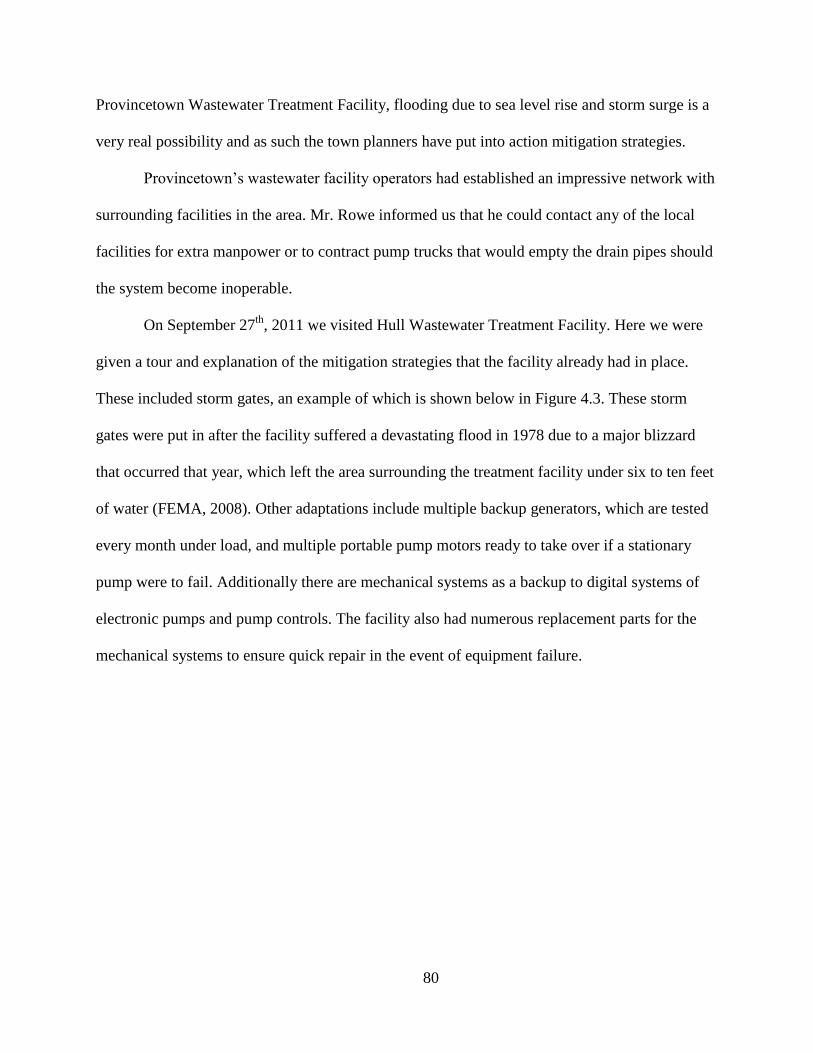
80
Provincetown Wastewater Treatment Facility, flooding due to sea level rise and storm surge is a
very real possibility and as such the town planners have put into action mitigation strategies.
Provincetown’s wastewater facility operators had established an impressive network with
surrounding facilities in the area. Mr. Rowe informed us that he could contact any of the local
facilities for extra manpower or to contract pump trucks that would empty the drain pipes should
the system become inoperable.
On September 27th
, 2011 we visited Hull Wastewater Treatment Facility. Here we were
given a tour and explanation of the mitigation strategies that the facility already had in place.
These included storm gates, an example of which is shown below in Figure 4.3. These storm
gates were put in after the facility suffered a devastating flood in 1978 due to a major blizzard
that occurred that year, which left the area surrounding the treatment facility under six to ten feet
of water (FEMA, 2008). Other adaptations include multiple backup generators, which are tested
every month under load, and multiple portable pump motors ready to take over if a stationary
pump were to fail. Additionally there are mechanical systems as a backup to digital systems of
electronic pumps and pump controls. The facility also had numerous replacement parts for the
mechanical systems to ensure quick repair in the event of equipment failure.

81
Figure F.1: Storm gate used at Hull Wastewater Treatment Facility
Chief Facilities Manager Edward Petrilak stated that since Hull Wastewater Treatment
Facility has been in danger of flooding since it was rebuilt in 1978, it remains a constant concern
to the town officials and citizens. Mr. Petrilak stressed the importance of being proactive instead
of reactive since it is more costly in terms of money, environmental impact, and community
impact for the town and facility to recover from a catastrophic failure than spend the time and
money in advance to prevent a catastrophic failure. Public support is the greatest advantage of
the facility. According Mr. Petrilak, the residents of Hull are well aware of the possibility and
risks of flooding and want their utilities to be prepared for this eventuality.
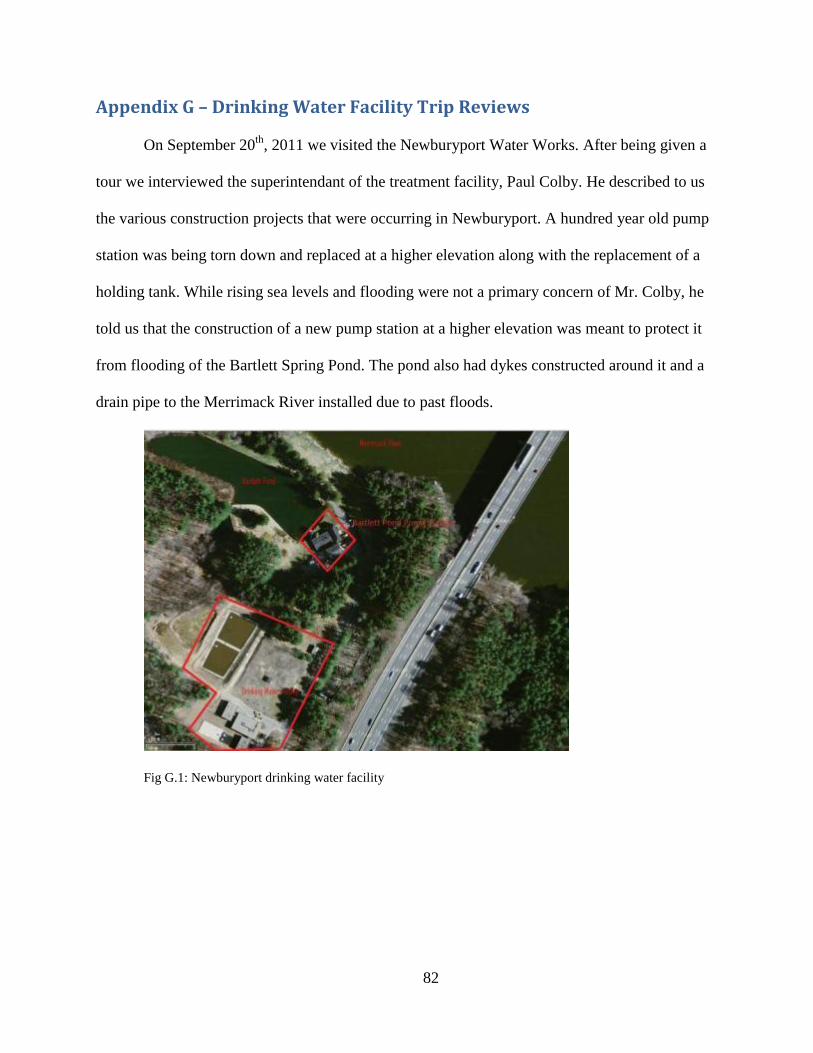
82
Appendix G – Drinking Water Facility Trip Reviews
On September 20th
, 2011 we visited the Newburyport Water Works. After being given a
tour we interviewed the superintendant of the treatment facility, Paul Colby. He described to us
the various construction projects that were occurring in Newburyport. A hundred year old pump
station was being torn down and replaced at a higher elevation along with the replacement of a
holding tank. While rising sea levels and flooding were not a primary concern of Mr. Colby, he
told us that the construction of a new pump station at a higher elevation was meant to protect it
from flooding of the Bartlett Spring Pond. The pond also had dykes constructed around it and a
drain pipe to the Merrimack River installed due to past floods.
Fig G.1: Newburyport drinking water facility
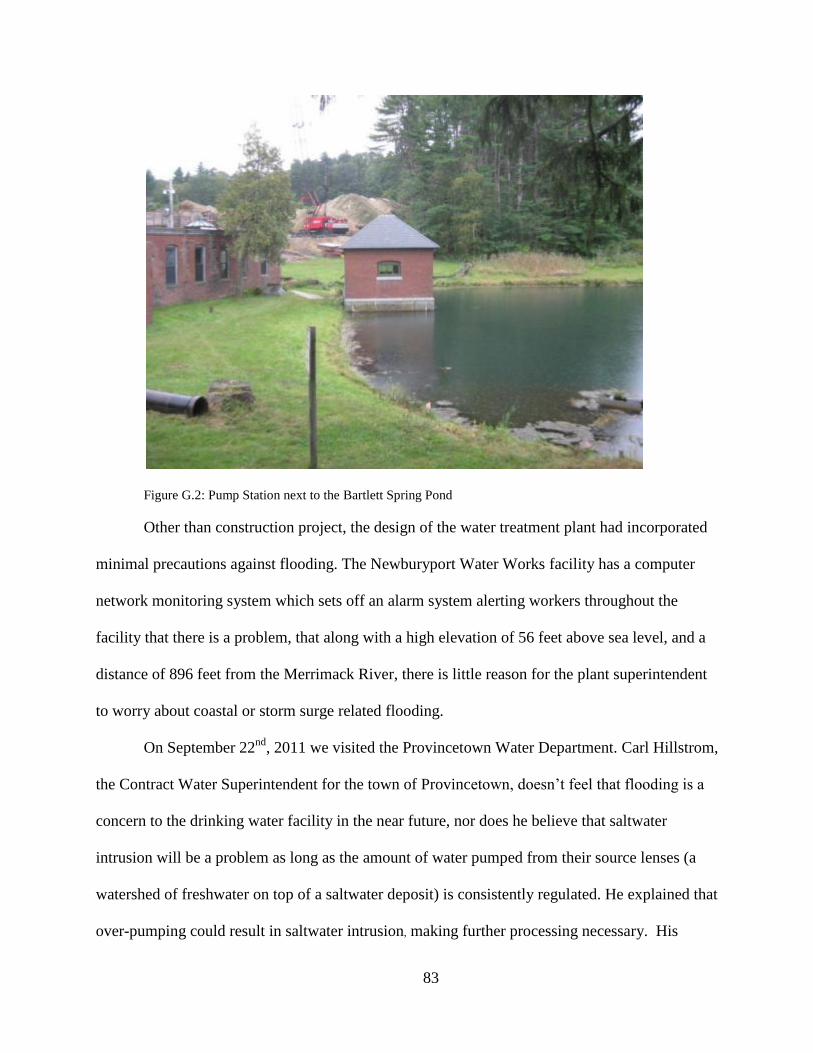
83
Figure G.2: Pump Station next to the Bartlett Spring Pond
Other than construction project, the design of the water treatment plant had incorporated
minimal precautions against flooding. The Newburyport Water Works facility has a computer
network monitoring system which sets off an alarm system alerting workers throughout the
facility that there is a problem, that along with a high elevation of 56 feet above sea level, and a
distance of 896 feet from the Merrimack River, there is little reason for the plant superintendent
to worry about coastal or storm surge related flooding.
On September 22nd
, 2011 we visited the Provincetown Water Department. Carl Hillstrom,
the Contract Water Superintendent for the town of Provincetown, doesn’t feel that flooding is a
concern to the drinking water facility in the near future, nor does he believe that saltwater
intrusion will be a problem as long as the amount of water pumped from their source lenses (a
watershed of freshwater on top of a saltwater deposit) is consistently regulated. He explained that
over-pumping could result in saltwater intrusion, making further processing necessary. His

84
primary concern was population growth and water use, stating that maintaining the water lenses
was of more concern than flooding.
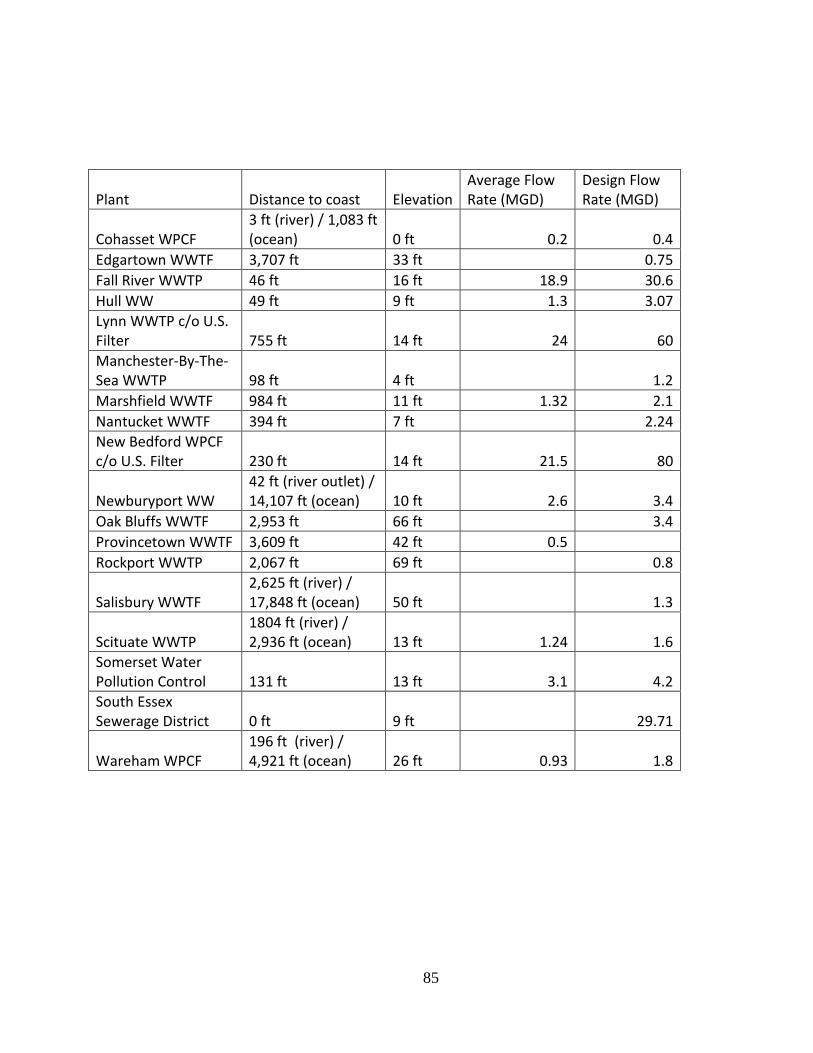
85
Plant Distance to coast Elevation Average Flow Rate (MGD)
Design Flow Rate (MGD)
Cohasset WPCF 3 ft (river) / 1,083 ft (ocean) 0 ft 0.2 0.4
Edgartown WWTF 3,707 ft 33 ft
0.75
Fall River WWTP 46 ft 16 ft 18.9 30.6
Hull WW 49 ft 9 ft 1.3 3.07
Lynn WWTP c/o U.S. Filter 755 ft 14 ft 24 60
Manchester-By-The-Sea WWTP 98 ft 4 ft
1.2
Marshfield WWTF 984 ft 11 ft 1.32 2.1
Nantucket WWTF 394 ft 7 ft
2.24
New Bedford WPCF c/o U.S. Filter 230 ft 14 ft 21.5 80
Newburyport WW 42 ft (river outlet) / 14,107 ft (ocean) 10 ft 2.6 3.4
Oak Bluffs WWTF 2,953 ft 66 ft
3.4
Provincetown WWTF 3,609 ft 42 ft 0.5 Rockport WWTP 2,067 ft 69 ft
0.8
Salisbury WWTF 2,625 ft (river) / 17,848 ft (ocean) 50 ft
1.3
Scituate WWTP 1804 ft (river) / 2,936 ft (ocean) 13 ft 1.24 1.6
Somerset Water Pollution Control 131 ft 13 ft 3.1 4.2
South Essex Sewerage District 0 ft 9 ft
29.71
Wareham WPCF 196 ft (river) / 4,921 ft (ocean) 26 ft 0.93 1.8

86
Appendix H – Wastewater Facility Information
Plant Average flow
rate / Design rate
Discharge Storage
Capacity
(untreated
waste)
FEMA flood
zone
Cohasset WPCF 0.5 surface 100-year
Edgartown WWTF 0 None
Fall River WWTP 0.617647059 surface 100-year
Hull WW 0.423452769 surface 100-year
Lynn WWTP c/o U.S. Filter 0.4 surface 500-year
Manchester-By-The-Sea
WWTP
0 surface 100-year
Marshfield WWTF 0.628571429 surface 100-year
Nantucket WWTF 0 500-year
New Bedford WPCF c/o
U.S. Filter
0.26875 surface 100-year
Newburyport WW 0.764705882 surface 100-year
Oak Bluffs WWTF 0 None
Provincetown WWTF ground None
Rockport WWTP 0 None
Salisbury WWTF 0 None
Scituate WWTP 0.775 100-year
Somerset Water Pollution
Control
0.738095238 surface 100-year
South Essex Sewerage
District
0 surface 100-year
Wareham WPCF 0.516666667 None
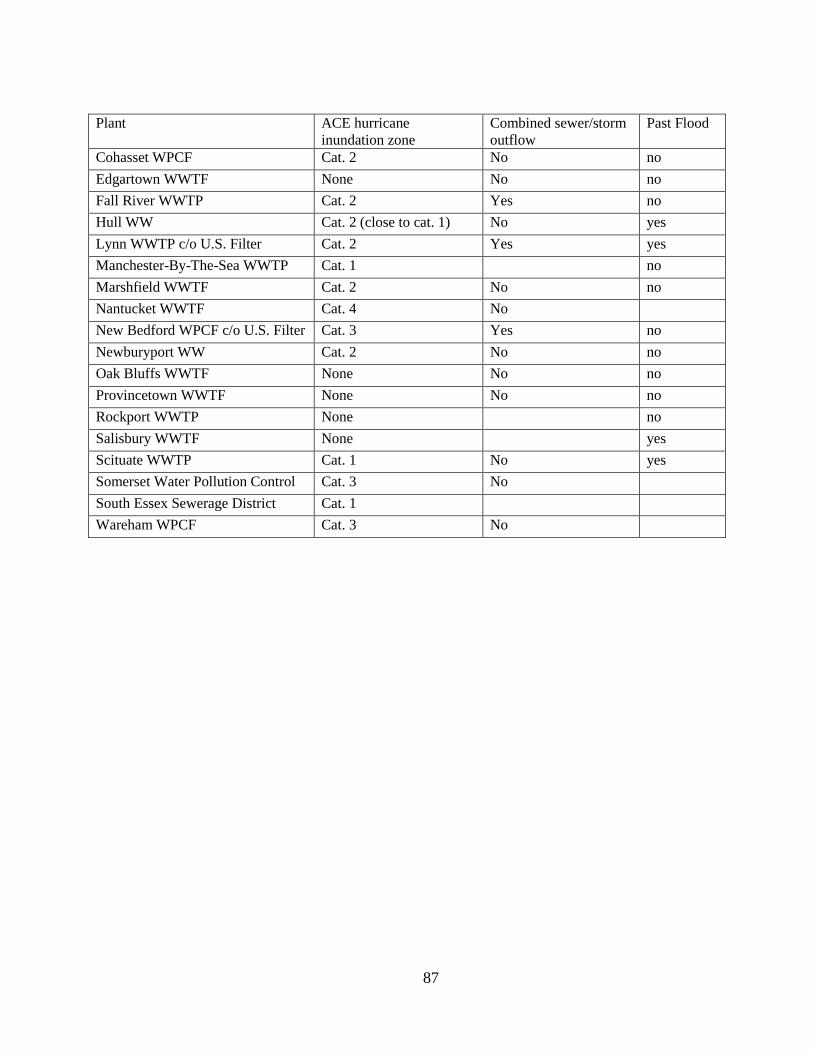
87
Plant ACE hurricane
inundation zone
Combined sewer/storm
outflow
Past Flood
Cohasset WPCF Cat. 2 No no
Edgartown WWTF None No no
Fall River WWTP Cat. 2 Yes no
Hull WW Cat. 2 (close to cat. 1) No yes
Lynn WWTP c/o U.S. Filter Cat. 2 Yes yes
Manchester-By-The-Sea WWTP Cat. 1 no
Marshfield WWTF Cat. 2 No no
Nantucket WWTF Cat. 4 No
New Bedford WPCF c/o U.S. Filter Cat. 3 Yes no
Newburyport WW Cat. 2 No no
Oak Bluffs WWTF None No no
Provincetown WWTF None No no
Rockport WWTP None no
Salisbury WWTF None yes
Scituate WWTP Cat. 1 No yes
Somerset Water Pollution Control Cat. 3 No
South Essex Sewerage District Cat. 1
Wareham WPCF Cat. 3 No

88
Appendix I – Drinking Water System Information and Component Breakdown
Plant Program
ID
Pop. Served
(Summer)
Pop.
Served
(Winter)
Average Residential
Flow Rate (MGD)
Average
Flow Rate
(MGD)
Hyannis Water System 4020004 35000 18000 1.086575342000 2.394
Newburyport DW 3206000 20335 20335 1.14548011 2.043942
Somerset Water Department 4273000 19638 19638 1.181216438 2.895907
Marshfield Water Department 4171000 34000 25300 1.736131507 2.543836
Onset Fire District 4310003 13975 13975 0.375342466 0.6
Oak Bluffs Water District 4221000 23751 4227 0.67939726 0.994329
Wareham Fire District 4310000 19958 19958 1.125525436 1.364695
Tisbury Water Works 4296000 23728 3851 0.442750685 0.55206
Edgartown Water Department 4089000 14000 2500 0.64596986 0.905762
Fall River Water Department 4095000 94000 94000 6.50000000 10.25913
Yarmouth Water Department 4351000 50000 21277 2.876358904 3.663014
Manchester Water Department 3166000 5469 5469 0.57460274 0.724134
Orleans Water Department 4224000 18948 6316 0.723709696 0.98189
Buzzards Bay Water District 4036001 7700 5830 0.33904110 0.482177
Provincetown DW 4242000 27500 3434 0.316712329 0.776712
Rockport Water Dept 3252000 9890 7480 0.40699726 0.488715

89
Plant Program
ID
Water
source
Storage
Capacity
(MG)
Store /
Avg Res
(Days)
Store /
Avg
Flow
(Days)
FEMA
flood
zone
ACE hurricane
inundation zone
Hyannis Water System 4020004 ground 1.37 1.26 0.57
Newburyport DW 3206000 surface 2.75 2.40 1.35 None None
Somerset Water Department 4273000 surface /
ground
5.023 4.25 1.73 100-year Cat 4
Marshfield Water Department 4171000 ground 5.07 2.92 1.99
Onset Fire District 4310003 ground /
surface
1.2 3.20 2
Oak Bluffs Water District 4221000 ground 2 2.94 2.01
Wareham Fire District 4310000 ground 2.9073 2.58 2.13
Tisbury Water Works 4296000 ground 1.2 2.71 2.17
Edgartown Water Department 4089000 ground 2.2 3.41 2.43
Fall River Water Department 4095000 surface 25.5 3.92 2.49 100-year None
Yarmouth Water Department 4351000 ground 9.25 3.22 2.53
Manchester Water Department 3166000 surface,
some
ground
2.22 3.86 3.07 None None
Orleans Water Department 4224000 ground 3.192 4.41 3.25
Buzzards Bay Water District 4036001 ground 2 5.90 4.15
Provincetown DW 4242000 ground 6.5 20.52 8.37 None None
Rockport Water Dept 3252000 4.2 10.31 8.59
Salem Water Department 3258000 purchased
surface
15.8
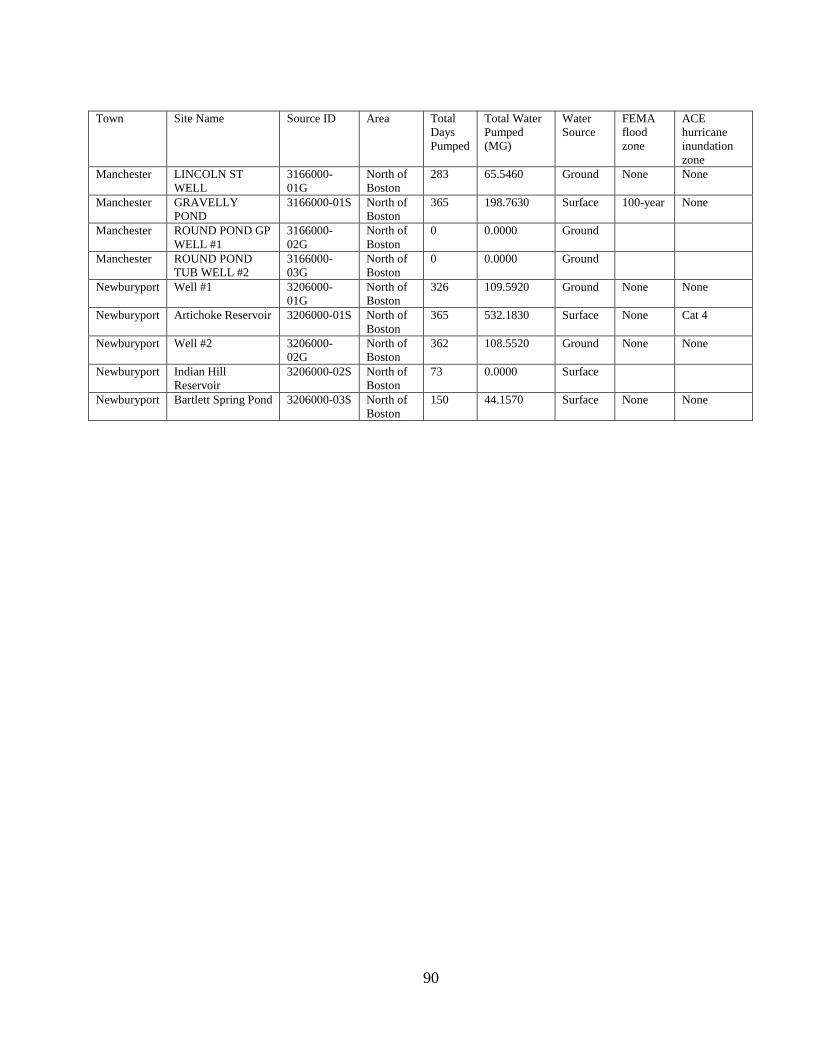
90
Town Site Name Source ID Area Total
Days
Pumped
Total Water
Pumped
(MG)
Water
Source
FEMA
flood
zone
ACE
hurricane
inundation
zone
Manchester LINCOLN ST
WELL
3166000-
01G
North of
Boston
283 65.5460 Ground None None
Manchester GRAVELLY
POND
3166000-01S North of
Boston
365 198.7630 Surface 100-year None
Manchester ROUND POND GP
WELL #1
3166000-
02G
North of
Boston
0 0.0000 Ground
Manchester ROUND POND
TUB WELL #2
3166000-
03G
North of
Boston
0 0.0000 Ground
Newburyport Well #1 3206000-
01G
North of
Boston
326 109.5920 Ground None None
Newburyport Artichoke Reservoir 3206000-01S North of
Boston
365 532.1830 Surface None Cat 4
Newburyport Well #2 3206000-
02G
North of
Boston
362 108.5520 Ground None None
Newburyport Indian Hill
Reservoir
3206000-02S North of
Boston
73 0.0000 Surface
Newburyport Bartlett Spring Pond 3206000-03S North of
Boston
150 44.1570 Surface None None
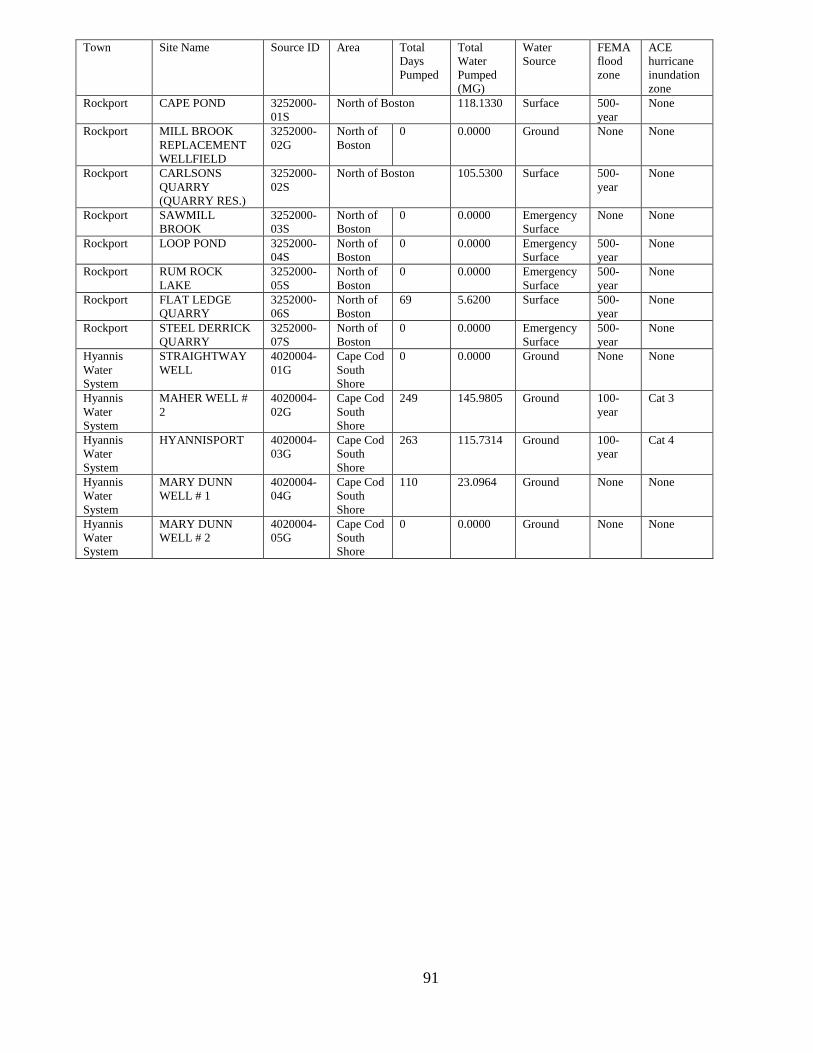
91
Town Site Name Source ID Area Total
Days
Pumped
Total
Water
Pumped
(MG)
Water
Source
FEMA
flood
zone
ACE
hurricane
inundation
zone
Rockport CAPE POND 3252000-
01S
North of Boston 118.1330 Surface 500-
year
None
Rockport MILL BROOK
REPLACEMENT
WELLFIELD
3252000-
02G
North of
Boston
0 0.0000 Ground None None
Rockport CARLSONS
QUARRY
(QUARRY RES.)
3252000-
02S
North of Boston 105.5300 Surface 500-
year
None
Rockport SAWMILL
BROOK
3252000-
03S
North of
Boston
0 0.0000 Emergency
Surface
None None
Rockport LOOP POND 3252000-
04S
North of
Boston
0 0.0000 Emergency
Surface
500-
year
None
Rockport RUM ROCK
LAKE
3252000-
05S
North of
Boston
0 0.0000 Emergency
Surface
500-
year
None
Rockport FLAT LEDGE
QUARRY
3252000-
06S
North of
Boston
69 5.6200 Surface 500-
year
None
Rockport STEEL DERRICK
QUARRY
3252000-
07S
North of
Boston
0 0.0000 Emergency
Surface
500-
year
None
Hyannis
Water
System
STRAIGHTWAY
WELL
4020004-
01G
Cape Cod
South
Shore
0 0.0000 Ground None None
Hyannis
Water
System
MAHER WELL #
2
4020004-
02G
Cape Cod
South
Shore
249 145.9805 Ground 100-
year
Cat 3
Hyannis
Water
System
HYANNISPORT 4020004-
03G
Cape Cod
South
Shore
263 115.7314 Ground 100-
year
Cat 4
Hyannis
Water
System
MARY DUNN
WELL # 1
4020004-
04G
Cape Cod
South
Shore
110 23.0964 Ground None None
Hyannis
Water
System
MARY DUNN
WELL # 2
4020004-
05G
Cape Cod
South
Shore
0 0.0000 Ground None None

92
Town Site Name Source ID Area Total
Days
Pumped
Total Water
Pumped
(MG)
Water
Source
FEMA
flood zone
ACE hurricane
inundation
zone
Hyannis
Water
System
HYANNISPORT 4020004-
03G
Cape Cod
South
Shore
263 115.7314 Ground 100-year Cat 4
Hyannis
Water
System
MARY DUNN
WELL # 1
4020004-
04G
Cape Cod
South
Shore
110 23.0964 Ground None None
Hyannis
Water
System
MARY DUNN
WELL # 2
4020004-
05G
Cape Cod
South
Shore
0 0.0000 Ground None None
Hyannis
Water
System
SIMMONS
POND
4020004-
06G
Cape Cod
South
Shore
307 134.9876 Ground 100-year Cat 3
Hyannis
Water
System
MAHER WELL
# 1
4020004-
07G
Cape Cod
South
Shore
263 174.3810 Ground 500-year Cat 4
Hyannis
Water
System
MARY DUNN
WELL # 3
4020004-
08G
Cape Cod
South
Shore
240 42.0259 Ground None None
Hyannis
Water
System
MARY DUNN
WELL # 4
4020004-
09G
Cape Cod
South
Shore
0 0.0000 Ground 500-year None
Hyannis
Water
System
AIRPORT # 1 4020004-
10G
Cape Cod
South
Shore
120 22.5704 Ground None None
Hyannis
Water
System
MAHER WELL
# 3
4020004-
11G
Cape Cod
South
Shore
136 73.9699 Ground 100-year Cat 3
Hyannis
Water
System
STRAIGHTWAY
WELL #2
4020004-
12G
Cape Cod
South
Shore
285 138.0360 Ground None None
Buzzards
Bay
Water
District
PUMP STATION
# 1
4036001-
01G
Buzzards
Bay
257 31.4607 Ground None None
Buzzards
Bay
Water
District
PUMP STATION
# 2
4036001-
02G
Buzzards
Bay
249 36.9583 Ground None Cat 3
Buzzards
Bay
Water
District
PUMP STATION
# 3
4036001-
03G
Buzzards
Bay
254 58.8468 Ground None None
Buzzards
Bay
Water
District
PUMP STATION
# 4
4036001-
04G
Buzzards
Bay
247 48.7288 Ground None None
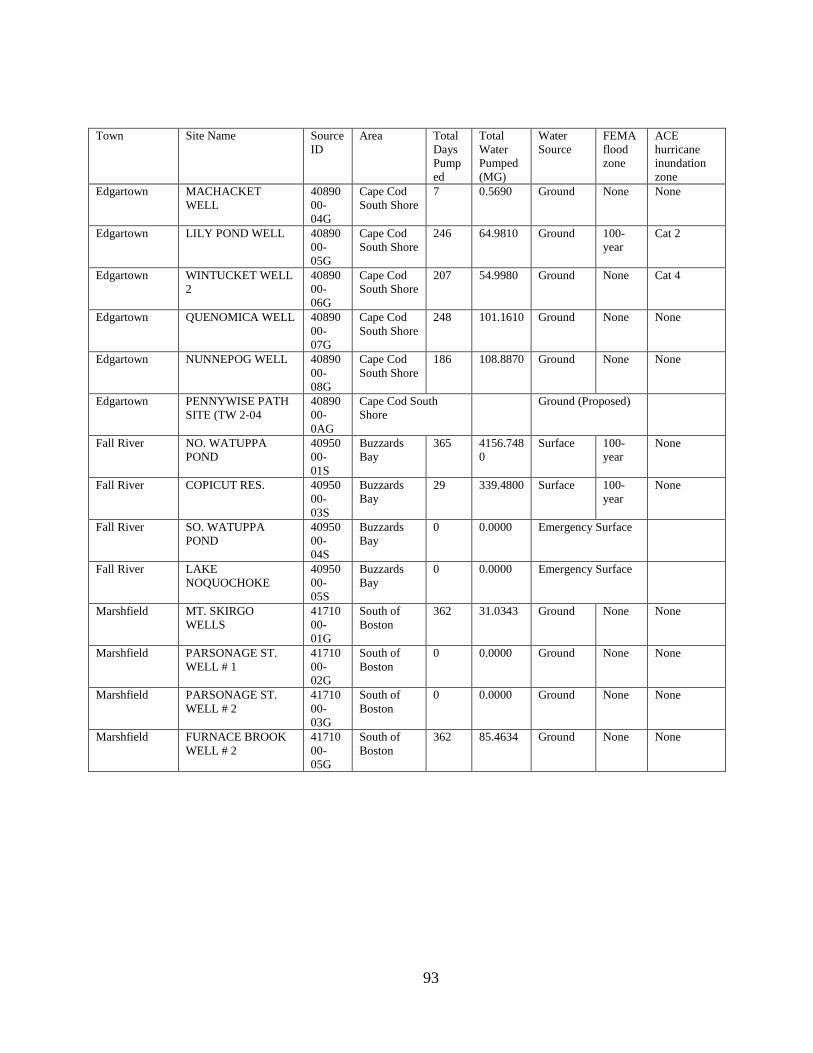
93
Town Site Name Source
ID
Area Total
Days
Pump
ed
Total
Water
Pumped
(MG)
Water
Source
FEMA
flood
zone
ACE
hurricane
inundation
zone
Edgartown MACHACKET
WELL
40890
00-
04G
Cape Cod
South Shore
7 0.5690 Ground None None
Edgartown LILY POND WELL 40890
00-
05G
Cape Cod
South Shore
246 64.9810 Ground 100-
year
Cat 2
Edgartown WINTUCKET WELL
2
40890
00-
06G
Cape Cod
South Shore
207 54.9980 Ground None Cat 4
Edgartown QUENOMICA WELL 40890
00-
07G
Cape Cod
South Shore
248 101.1610 Ground None None
Edgartown NUNNEPOG WELL 40890
00-
08G
Cape Cod
South Shore
186 108.8870 Ground None None
Edgartown PENNYWISE PATH
SITE (TW 2-04
40890
00-
0AG
Cape Cod South
Shore
Ground (Proposed)
Fall River NO. WATUPPA
POND
40950
00-
01S
Buzzards
Bay
365 4156.748
0
Surface 100-
year
None
Fall River COPICUT RES. 40950
00-
03S
Buzzards
Bay
29 339.4800 Surface 100-
year
None
Fall River SO. WATUPPA
POND
40950
00-
04S
Buzzards
Bay
0 0.0000 Emergency Surface
Fall River LAKE
NOQUOCHOKE
40950
00-
05S
Buzzards
Bay
0 0.0000 Emergency Surface
Marshfield MT. SKIRGO
WELLS
41710
00-
01G
South of
Boston
362 31.0343 Ground None None
Marshfield PARSONAGE ST.
WELL # 1
41710
00-
02G
South of
Boston
0 0.0000 Ground None None
Marshfield PARSONAGE ST.
WELL # 2
41710
00-
03G
South of
Boston
0 0.0000 Ground None None
Marshfield FURNACE BROOK
WELL # 2
41710
00-
05G
South of
Boston
362 85.4634 Ground None None
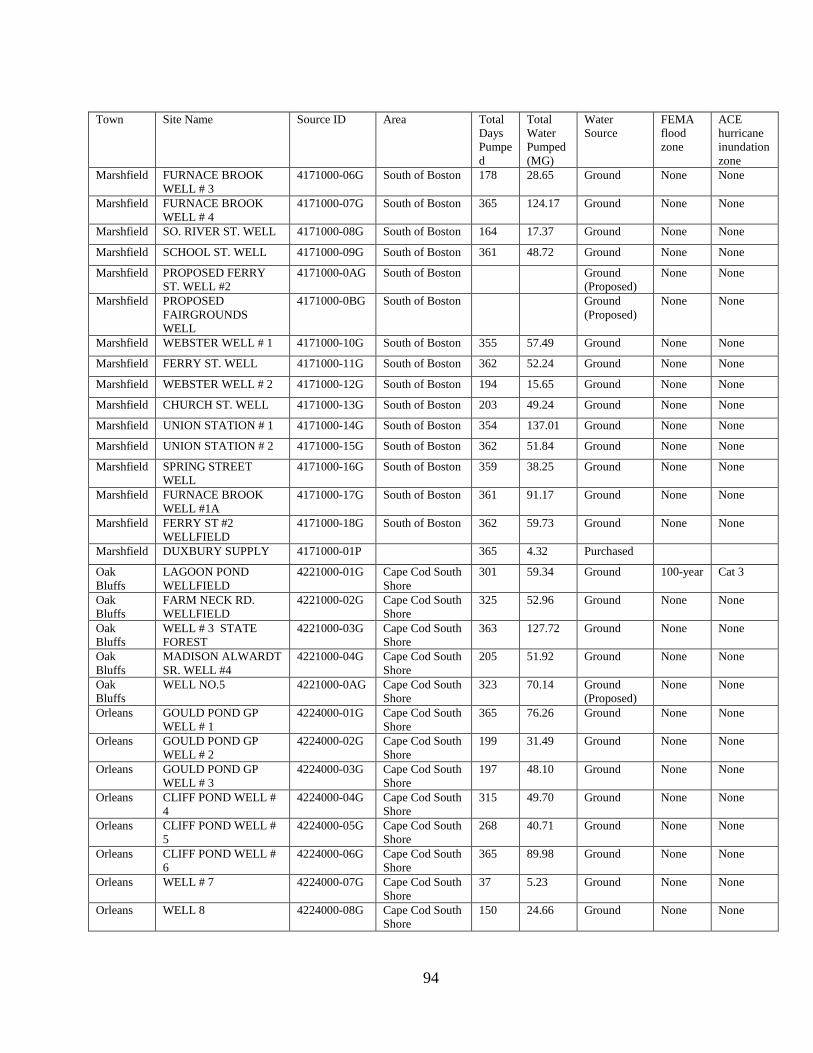
94
Town Site Name Source ID Area Total
Days
Pumpe
d
Total
Water
Pumped
(MG)
Water
Source
FEMA
flood
zone
ACE
hurricane
inundation
zone
Marshfield FURNACE BROOK
WELL # 3
4171000-06G South of Boston 178 28.65 Ground None None
Marshfield FURNACE BROOK
WELL # 4
4171000-07G South of Boston 365 124.17 Ground None None
Marshfield SO. RIVER ST. WELL 4171000-08G South of Boston 164 17.37 Ground None None
Marshfield SCHOOL ST. WELL 4171000-09G South of Boston 361 48.72 Ground None None
Marshfield PROPOSED FERRY
ST. WELL #2
4171000-0AG South of Boston Ground
(Proposed)
None None
Marshfield PROPOSED
FAIRGROUNDS
WELL
4171000-0BG South of Boston Ground
(Proposed)
None None
Marshfield WEBSTER WELL # 1 4171000-10G South of Boston 355 57.49 Ground None None
Marshfield FERRY ST. WELL 4171000-11G South of Boston 362 52.24 Ground None None
Marshfield WEBSTER WELL # 2 4171000-12G South of Boston 194 15.65 Ground None None
Marshfield CHURCH ST. WELL 4171000-13G South of Boston 203 49.24 Ground None None
Marshfield UNION STATION # 1 4171000-14G South of Boston 354 137.01 Ground None None
Marshfield UNION STATION # 2 4171000-15G South of Boston 362 51.84 Ground None None
Marshfield SPRING STREET
WELL
4171000-16G South of Boston 359 38.25 Ground None None
Marshfield FURNACE BROOK
WELL #1A
4171000-17G South of Boston 361 91.17 Ground None None
Marshfield FERRY ST #2
WELLFIELD
4171000-18G South of Boston 362 59.73 Ground None None
Marshfield DUXBURY SUPPLY 4171000-01P 365 4.32 Purchased
Oak
Bluffs
LAGOON POND
WELLFIELD
4221000-01G Cape Cod South
Shore
301 59.34 Ground 100-year Cat 3
Oak
Bluffs
FARM NECK RD.
WELLFIELD
4221000-02G Cape Cod South
Shore
325 52.96 Ground None None
Oak
Bluffs
WELL # 3 STATE
FOREST
4221000-03G Cape Cod South
Shore
363 127.72 Ground None None
Oak
Bluffs
MADISON ALWARDT
SR. WELL #4
4221000-04G Cape Cod South
Shore
205 51.92 Ground None None
Oak
Bluffs
WELL NO.5 4221000-0AG Cape Cod South
Shore
323 70.14 Ground
(Proposed)
None None
Orleans GOULD POND GP
WELL # 1
4224000-01G Cape Cod South
Shore
365 76.26 Ground None None
Orleans GOULD POND GP
WELL # 2
4224000-02G Cape Cod South
Shore
199 31.49 Ground None None
Orleans GOULD POND GP
WELL # 3
4224000-03G Cape Cod South
Shore
197 48.10 Ground None None
Orleans CLIFF POND WELL #
4
4224000-04G Cape Cod South
Shore
315 49.70 Ground None None
Orleans CLIFF POND WELL #
5
4224000-05G Cape Cod South
Shore
268 40.71 Ground None None
Orleans CLIFF POND WELL #
6
4224000-06G Cape Cod South
Shore
365 89.98 Ground None None
Orleans WELL # 7 4224000-07G Cape Cod South
Shore
37 5.23 Ground None None
Orleans WELL 8 4224000-08G Cape Cod South
Shore
150 24.66 Ground None None

95
Town Site Name Source ID Area Total
Days
Pumped
Total
Water
Pumped
(MG)
Water
Source
FEMA
flood
zone
ACE
hurricane
inundation
zone
Provincetown KNOWLES
CROSSING WELL
4242000-02G Cape Cod
Bay
325 49.83 Ground None None
Provincetown PAUL D. DALEY
WELLFIELD
4242000-03G Cape Cod
Bay
325 201.35 Ground None None
Provincetown NO.TRURO USAF
BASE WELL (04G)
4242000-04G Cape Cod
Bay
135 16.70 Ground None None
Provincetown NO. TRURO USAF
BASE WELL (05G)
4242000-05G Cape Cod
Bay
125 15.66 Ground None None
Somerset SOMERSET RES. 4273000-01S Buzzards
Bay
365 959.14 Surface 100-year Cat 4
Somerset FJM #2 WELL 4273000-05G Buzzards
Bay
365 97.87 Ground 500-year None
Tisbury SANBORN WELL #1 4296000-01G Cape Cod
South Shore
309 78.05 Ground None None
Tisbury TASHMOO WELL #2 4296000-02G Cape Cod
South Shore
305 60.04 Ground None None
Tisbury MANTER WELL 4296000-04G Cape Cod
South Shore
346 94.00 Ground None None
Wareham Fire
District
MAPLE SPRINGS
WELL #1
4310000-01G Buzzards
Bay
87 42.56 Ground None Cat 3
Wareham Fire
District
MAPLE SPRINGS
WELL #2
4310000-02G Buzzards
Bay
157 113.86 Ground None Cat 3
Wareham Fire
District
MAPLE SPRINGS
WELL #3
4310000-03G Buzzards
Bay
144 94.34 Ground None Cat 3
Wareham Fire
District
MAPLE SPRINGS
WELL #4
4310000-04G Buzzards
Bay
111 71.51 Ground None Cat 3
Wareham Fire
District
MAPLE SPRINGS
WELL #5
4310000-05G Buzzards
Bay
0 0.00 Ground None Cat 3
Wareham Fire
District
SEAWOOD SPRINGS
WELL #6
4310000-06G Buzzards
Bay
232 104.36 Ground None None
Wareham Fire
District
SEAWOOD SPRINGS
WELL #7
4310000-07G Buzzards
Bay
211 170.79 Ground None None
Wareham Fire
District
SOUTH LINE WELL
#8
4310000-08G Buzzards
Bay
98 56.86 Ground None None
Wareham Fire
District
PROPOSED MAPLE
PARK WELL
4310000-0AG Buzzards
Bay
Ground
(Proposed)
None None
Onset Fire
District
WELL #4 4310003-01G Buzzards
Bay
337 45.00 Ground None Cat 3
Onset Fire
District
SAND POND RES. 4310003-01S Buzzards
Bay
0 0.00 Surface 100-year Cat 4
Onset Fire
District
WELL #3 4310003-02G Buzzards
Bay
345 59.40 Ground None Cat 2
Onset Fire
District
WELL #5 4310003-03G Buzzards
Bay
365 39.91 Ground None Cat 4
Onset Fire
District
WELL #6 4310003-04G Buzzards
Bay
350 74.72 Ground None Cat 4
Onset Fire
District
PROPOSED WELL #7 4310003-0AG Buzzards
Bay
Ground
(Proposed)
None Cat 4
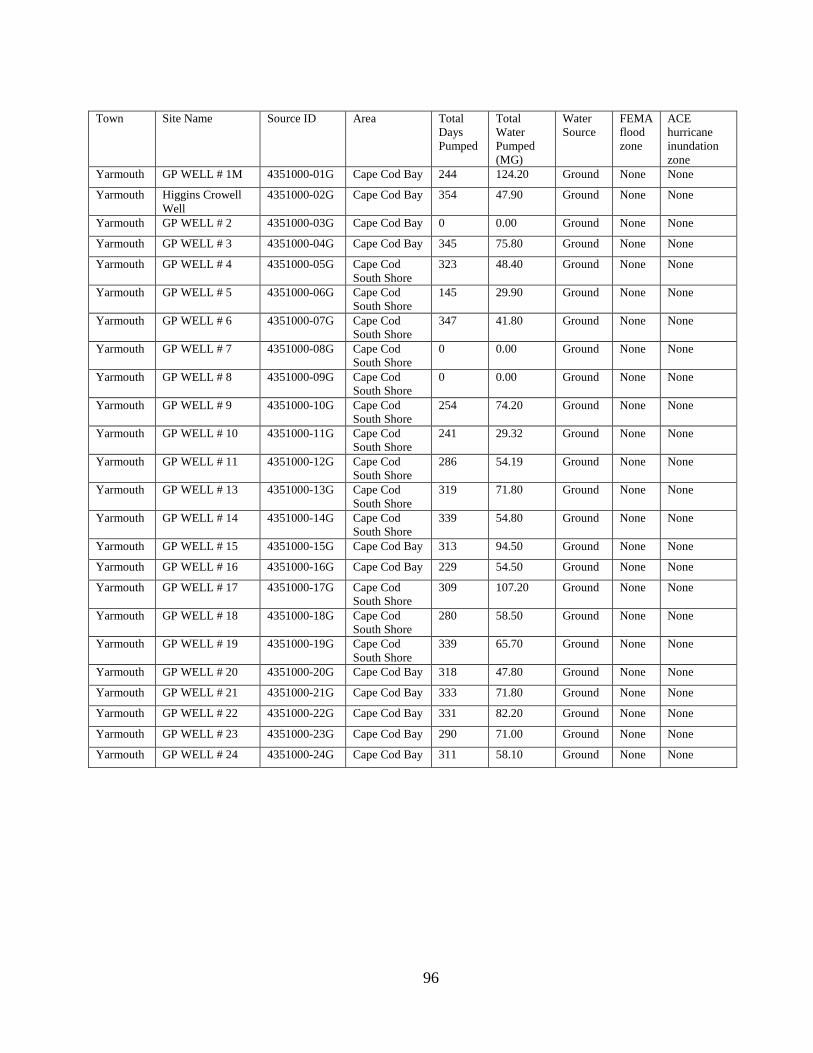
96
Town Site Name Source ID Area Total
Days
Pumped
Total
Water
Pumped
(MG)
Water
Source
FEMA
flood
zone
ACE
hurricane
inundation
zone
Yarmouth GP WELL # 1M 4351000-01G Cape Cod Bay 244 124.20 Ground None None
Yarmouth Higgins Crowell
Well
4351000-02G Cape Cod Bay 354 47.90 Ground None None
Yarmouth GP WELL # 2 4351000-03G Cape Cod Bay 0 0.00 Ground None None
Yarmouth GP WELL # 3 4351000-04G Cape Cod Bay 345 75.80 Ground None None
Yarmouth GP WELL # 4 4351000-05G Cape Cod
South Shore
323 48.40 Ground None None
Yarmouth GP WELL # 5 4351000-06G Cape Cod
South Shore
145 29.90 Ground None None
Yarmouth GP WELL # 6 4351000-07G Cape Cod
South Shore
347 41.80 Ground None None
Yarmouth GP WELL # 7 4351000-08G Cape Cod
South Shore
0 0.00 Ground None None
Yarmouth GP WELL # 8 4351000-09G Cape Cod
South Shore
0 0.00 Ground None None
Yarmouth GP WELL # 9 4351000-10G Cape Cod
South Shore
254 74.20 Ground None None
Yarmouth GP WELL # 10 4351000-11G Cape Cod
South Shore
241 29.32 Ground None None
Yarmouth GP WELL # 11 4351000-12G Cape Cod
South Shore
286 54.19 Ground None None
Yarmouth GP WELL # 13 4351000-13G Cape Cod
South Shore
319 71.80 Ground None None
Yarmouth GP WELL # 14 4351000-14G Cape Cod
South Shore
339 54.80 Ground None None
Yarmouth GP WELL # 15 4351000-15G Cape Cod Bay 313 94.50 Ground None None
Yarmouth GP WELL # 16 4351000-16G Cape Cod Bay 229 54.50 Ground None None
Yarmouth GP WELL # 17 4351000-17G Cape Cod
South Shore
309 107.20 Ground None None
Yarmouth GP WELL # 18 4351000-18G Cape Cod
South Shore
280 58.50 Ground None None
Yarmouth GP WELL # 19 4351000-19G Cape Cod
South Shore
339 65.70 Ground None None
Yarmouth GP WELL # 20 4351000-20G Cape Cod Bay 318 47.80 Ground None None
Yarmouth GP WELL # 21 4351000-21G Cape Cod Bay 333 71.80 Ground None None
Yarmouth GP WELL # 22 4351000-22G Cape Cod Bay 331 82.20 Ground None None
Yarmouth GP WELL # 23 4351000-23G Cape Cod Bay 290 71.00 Ground None None
Yarmouth GP WELL # 24 4351000-24G Cape Cod Bay 311 58.10 Ground None None
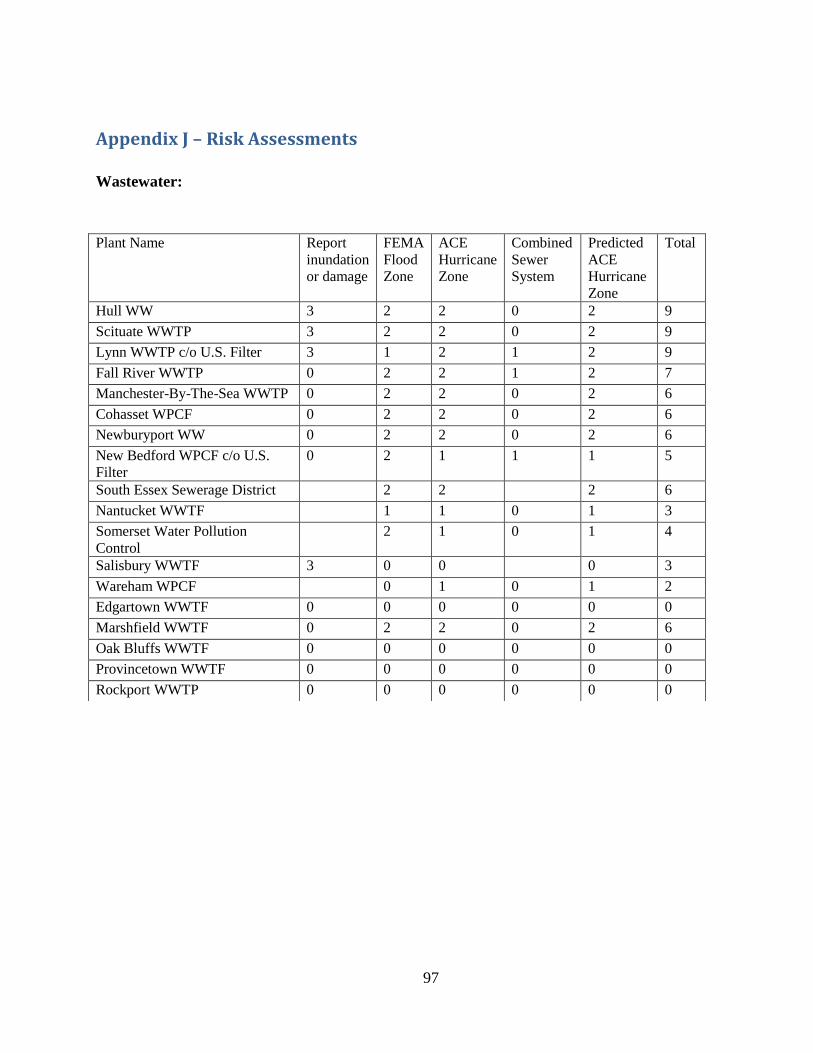
97
Appendix J – Risk Assessments Wastewater:
Plant Name Report
inundation
or damage
FEMA
Flood
Zone
ACE
Hurricane
Zone
Combined
Sewer
System
Predicted
ACE
Hurricane
Zone
Total
Hull WW 3 2 2 0 2 9
Scituate WWTP 3 2 2 0 2 9
Lynn WWTP c/o U.S. Filter 3 1 2 1 2 9
Fall River WWTP 0 2 2 1 2 7
Manchester-By-The-Sea WWTP 0 2 2 0 2 6
Cohasset WPCF 0 2 2 0 2 6
Newburyport WW 0 2 2 0 2 6
New Bedford WPCF c/o U.S.
Filter
0 2 1 1 1 5
South Essex Sewerage District 2 2 2 6
Nantucket WWTF 1 1 0 1 3
Somerset Water Pollution
Control
2 1 0 1 4
Salisbury WWTF 3 0 0 0 3
Wareham WPCF 0 1 0 1 2
Edgartown WWTF 0 0 0 0 0 0
Marshfield WWTF 0 2 2 0 2 6
Oak Bluffs WWTF 0 0 0 0 0 0
Provincetown WWTF 0 0 0 0 0 0
Rockport WWTP 0 0 0 0 0 0
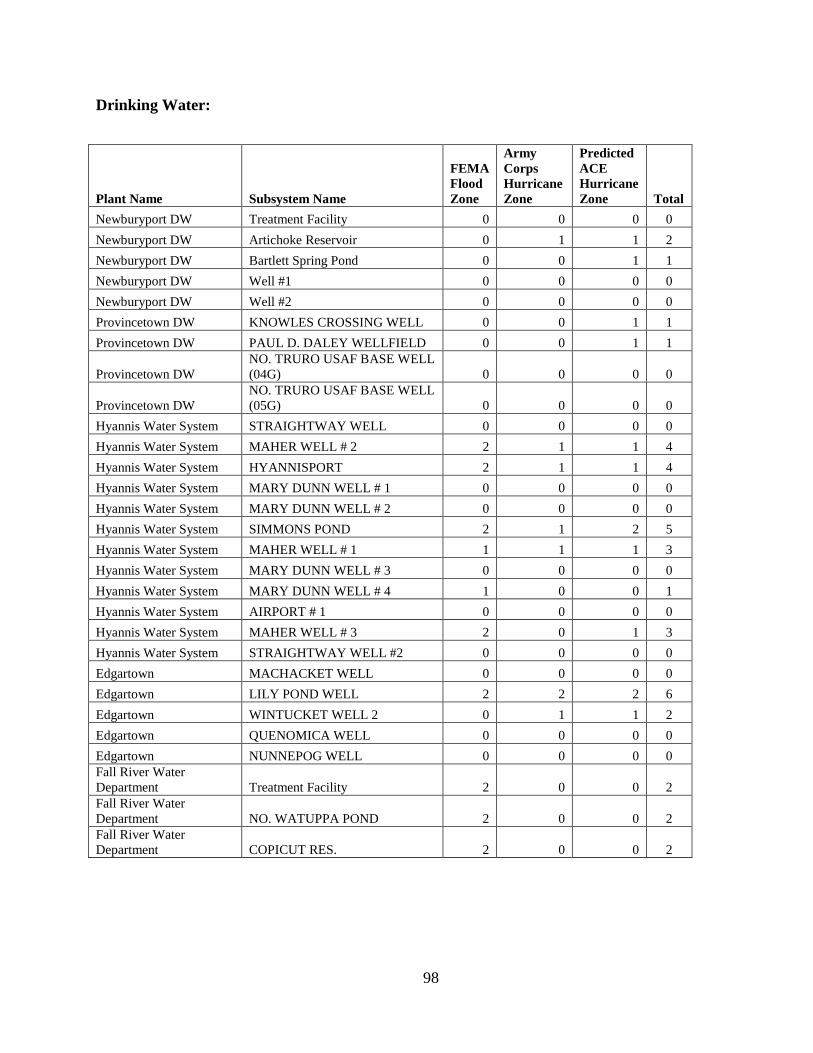
98
Drinking Water:
Plant Name Subsystem Name
FEMA
Flood
Zone
Army
Corps
Hurricane
Zone
Predicted
ACE
Hurricane
Zone Total
Newburyport DW Treatment Facility 0 0 0 0
Newburyport DW Artichoke Reservoir 0 1 1 2
Newburyport DW Bartlett Spring Pond 0 0 1 1
Newburyport DW Well #1 0 0 0 0
Newburyport DW Well #2 0 0 0 0
Provincetown DW KNOWLES CROSSING WELL 0 0 1 1
Provincetown DW PAUL D. DALEY WELLFIELD 0 0 1 1
Provincetown DW
NO. TRURO USAF BASE WELL
(04G) 0 0 0 0
Provincetown DW
NO. TRURO USAF BASE WELL
(05G) 0 0 0 0
Hyannis Water System STRAIGHTWAY WELL 0 0 0 0
Hyannis Water System MAHER WELL # 2 2 1 1 4
Hyannis Water System HYANNISPORT 2 1 1 4
Hyannis Water System MARY DUNN WELL # 1 0 0 0 0
Hyannis Water System MARY DUNN WELL # 2 0 0 0 0
Hyannis Water System SIMMONS POND 2 1 2 5
Hyannis Water System MAHER WELL # 1 1 1 1 3
Hyannis Water System MARY DUNN WELL # 3 0 0 0 0
Hyannis Water System MARY DUNN WELL # 4 1 0 0 1
Hyannis Water System AIRPORT # 1 0 0 0 0
Hyannis Water System MAHER WELL # 3 2 0 1 3
Hyannis Water System STRAIGHTWAY WELL #2 0 0 0 0
Edgartown MACHACKET WELL 0 0 0 0
Edgartown LILY POND WELL 2 2 2 6
Edgartown WINTUCKET WELL 2 0 1 1 2
Edgartown QUENOMICA WELL 0 0 0 0
Edgartown NUNNEPOG WELL 0 0 0 0
Fall River Water
Department Treatment Facility 2 0 0 2
Fall River Water
Department NO. WATUPPA POND 2 0 0 2
Fall River Water
Department COPICUT RES. 2 0 0 2
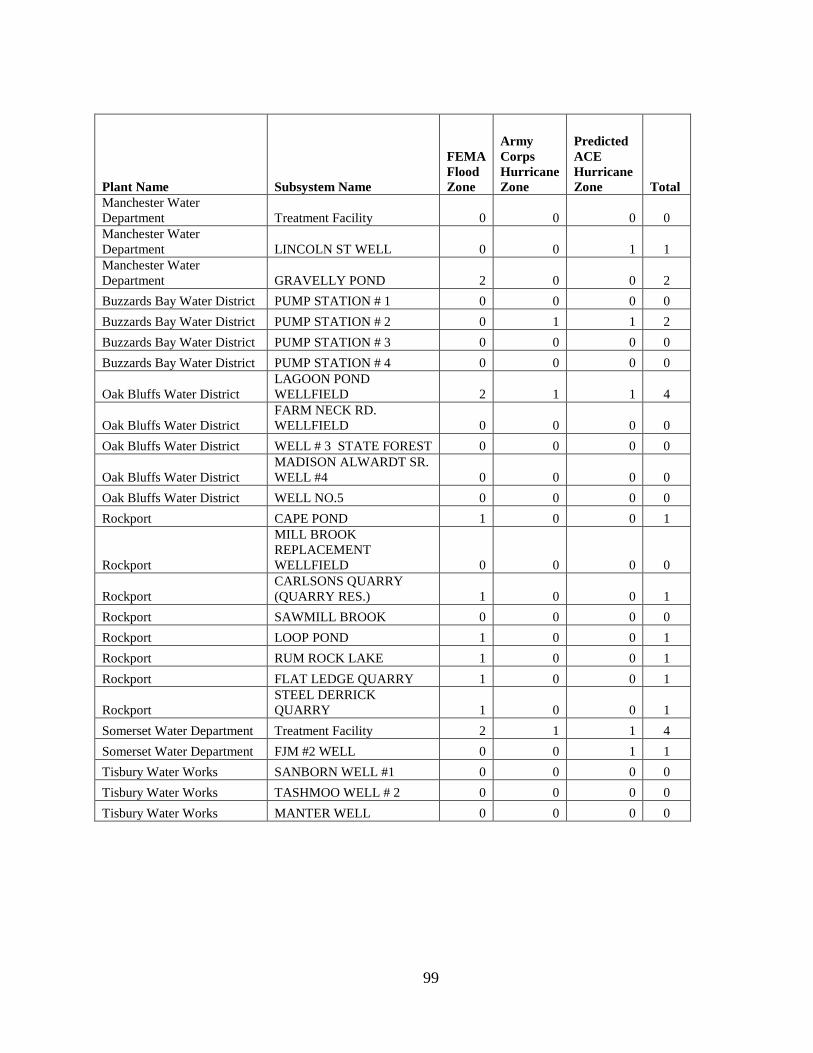
99
Plant Name Subsystem Name
FEMA
Flood
Zone
Army
Corps
Hurricane
Zone
Predicted
ACE
Hurricane
Zone Total
Manchester Water
Department Treatment Facility 0 0 0 0
Manchester Water
Department LINCOLN ST WELL 0 0 1 1
Manchester Water
Department GRAVELLY POND 2 0 0 2
Buzzards Bay Water District PUMP STATION # 1 0 0 0 0
Buzzards Bay Water District PUMP STATION # 2 0 1 1 2
Buzzards Bay Water District PUMP STATION # 3 0 0 0 0
Buzzards Bay Water District PUMP STATION # 4 0 0 0 0
Oak Bluffs Water District
LAGOON POND
WELLFIELD 2 1 1 4
Oak Bluffs Water District
FARM NECK RD.
WELLFIELD 0 0 0 0
Oak Bluffs Water District WELL # 3 STATE FOREST 0 0 0 0
Oak Bluffs Water District
MADISON ALWARDT SR.
WELL #4 0 0 0 0
Oak Bluffs Water District WELL NO.5 0 0 0 0
Rockport CAPE POND 1 0 0 1
Rockport
MILL BROOK
REPLACEMENT
WELLFIELD 0 0 0 0
Rockport
CARLSONS QUARRY
(QUARRY RES.) 1 0 0 1
Rockport SAWMILL BROOK 0 0 0 0
Rockport LOOP POND 1 0 0 1
Rockport RUM ROCK LAKE 1 0 0 1
Rockport FLAT LEDGE QUARRY 1 0 0 1
Rockport
STEEL DERRICK
QUARRY 1 0 0 1
Somerset Water Department Treatment Facility 2 1 1 4
Somerset Water Department FJM #2 WELL 0 0 1 1
Tisbury Water Works SANBORN WELL #1 0 0 0 0
Tisbury Water Works TASHMOO WELL # 2 0 0 0 0
Tisbury Water Works MANTER WELL 0 0 0 0
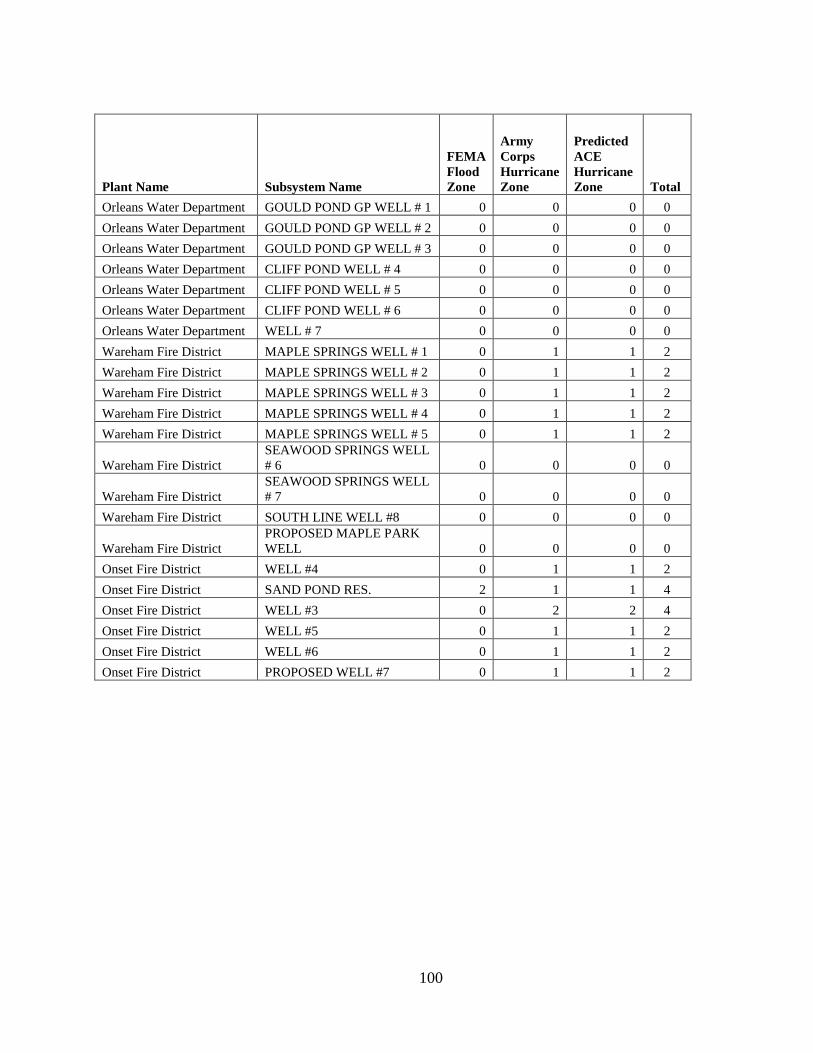
100
Plant Name Subsystem Name
FEMA
Flood
Zone
Army
Corps
Hurricane
Zone
Predicted
ACE
Hurricane
Zone Total
Orleans Water Department GOULD POND GP WELL # 1 0 0 0 0
Orleans Water Department GOULD POND GP WELL # 2 0 0 0 0
Orleans Water Department GOULD POND GP WELL # 3 0 0 0 0
Orleans Water Department CLIFF POND WELL # 4 0 0 0 0
Orleans Water Department CLIFF POND WELL # 5 0 0 0 0
Orleans Water Department CLIFF POND WELL # 6 0 0 0 0
Orleans Water Department WELL # 7 0 0 0 0
Wareham Fire District MAPLE SPRINGS WELL # 1 0 1 1 2
Wareham Fire District MAPLE SPRINGS WELL # 2 0 1 1 2
Wareham Fire District MAPLE SPRINGS WELL # 3 0 1 1 2
Wareham Fire District MAPLE SPRINGS WELL # 4 0 1 1 2
Wareham Fire District MAPLE SPRINGS WELL # 5 0 1 1 2
Wareham Fire District
SEAWOOD SPRINGS WELL
# 6 0 0 0 0
Wareham Fire District
SEAWOOD SPRINGS WELL
# 7 0 0 0 0
Wareham Fire District SOUTH LINE WELL #8 0 0 0 0
Wareham Fire District
PROPOSED MAPLE PARK
WELL 0 0 0 0
Onset Fire District WELL #4 0 1 1 2
Onset Fire District SAND POND RES. 2 1 1 4
Onset Fire District WELL #3 0 2 2 4
Onset Fire District WELL #5 0 1 1 2
Onset Fire District WELL #6 0 1 1 2
Onset Fire District PROPOSED WELL #7 0 1 1 2

101
Plant Name Subsystem Name
FEMA
Flood
Zone
Army
Corps
Hurricane
Zone
Predicted
ACE
Hurricane
Zone Total
Marshfield Water
Department MT. SKIRGO WELLS 0 0 0 0
Marshfield Water
Department PARSONAGE ST. WELL # 1 0 0 2 2
Marshfield Water
Department PARSONAGE ST. WELL # 2 0 0 2 2
Marshfield Water
Department FURNACE BROOK WELL # 2 0 0 0 0
Marshfield Water
Department FURNACE BROOK WELL # 3 0 0 0 0
Marshfield Water
Department FURNACE BROOK WELL # 4 0 0 0 0
Marshfield Water
Department SO. RIVER ST. WELL 0 0 0 0
Marshfield Water
Department SCHOOL ST. WELL 0 0 0 0
Marshfield Water
Department WEBSTER WELL # 1 0 0 0 0
Marshfield Water
Department FERRY ST. WELL 0 0 0 0
Marshfield Water
Department WEBSTER WELL # 2 0 0 2 2
Marshfield Water
Department CHURCH ST. WELL 0 0 0 0
Marshfield Water
Department UNION STATION # 1 0 0 0 0
Marshfield Water
Department UNION STATION # 2 0 0 0 0
Marshfield Water
Department SPRING STREET WELL 0 0 2 2
Marshfield Water
Department
FURNACE BROOK WELL
#1A 0 0 0 0
Marshfield Water
Department FERRY ST #2 WELLFIELD 0 0 0 0
Marshfield Water
Department
PROPOSED FERRY ST. WELL
#2 0 0 0 0
Marshfield Water
Department
PROPOSED FAIRGROUNDS
WELL 0 0 1 1
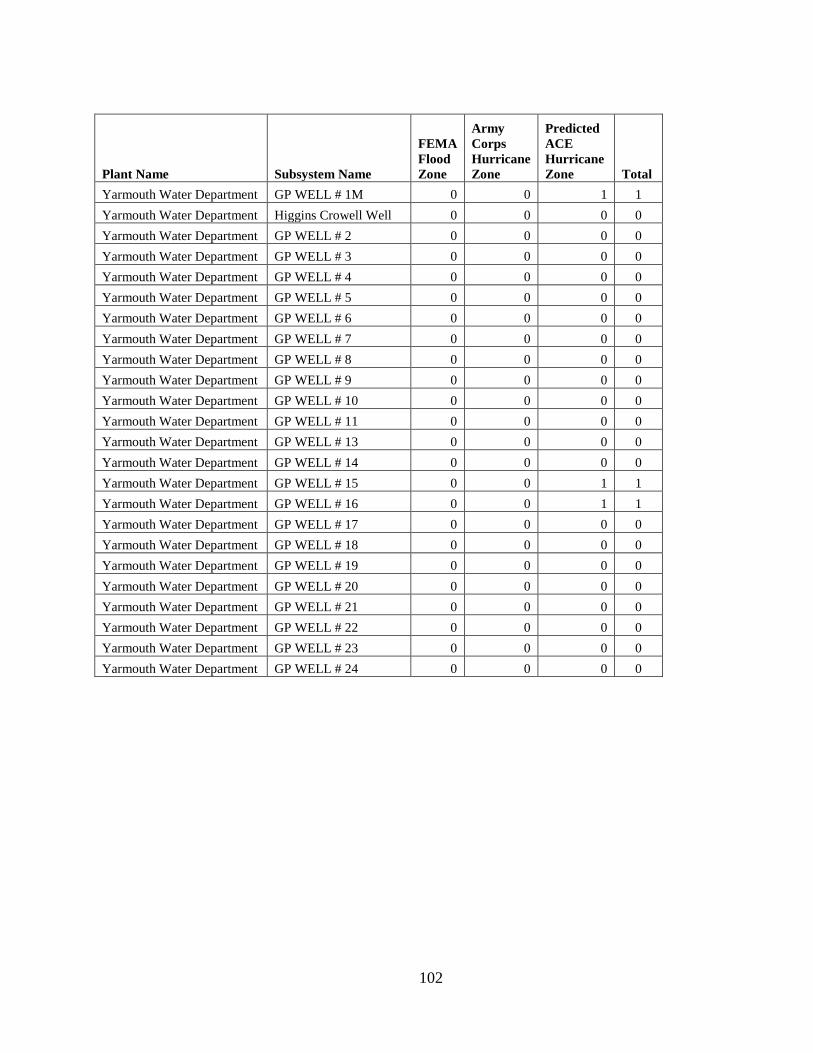
102
Plant Name Subsystem Name
FEMA
Flood
Zone
Army
Corps
Hurricane
Zone
Predicted
ACE
Hurricane
Zone Total
Yarmouth Water Department GP WELL # 1M 0 0 1 1
Yarmouth Water Department Higgins Crowell Well 0 0 0 0
Yarmouth Water Department GP WELL # 2 0 0 0 0
Yarmouth Water Department GP WELL # 3 0 0 0 0
Yarmouth Water Department GP WELL # 4 0 0 0 0
Yarmouth Water Department GP WELL # 5 0 0 0 0
Yarmouth Water Department GP WELL # 6 0 0 0 0
Yarmouth Water Department GP WELL # 7 0 0 0 0
Yarmouth Water Department GP WELL # 8 0 0 0 0
Yarmouth Water Department GP WELL # 9 0 0 0 0
Yarmouth Water Department GP WELL # 10 0 0 0 0
Yarmouth Water Department GP WELL # 11 0 0 0 0
Yarmouth Water Department GP WELL # 13 0 0 0 0
Yarmouth Water Department GP WELL # 14 0 0 0 0
Yarmouth Water Department GP WELL # 15 0 0 1 1
Yarmouth Water Department GP WELL # 16 0 0 1 1
Yarmouth Water Department GP WELL # 17 0 0 0 0
Yarmouth Water Department GP WELL # 18 0 0 0 0
Yarmouth Water Department GP WELL # 19 0 0 0 0
Yarmouth Water Department GP WELL # 20 0 0 0 0
Yarmouth Water Department GP WELL # 21 0 0 0 0
Yarmouth Water Department GP WELL # 22 0 0 0 0
Yarmouth Water Department GP WELL # 23 0 0 0 0
Yarmouth Water Department GP WELL # 24 0 0 0 0
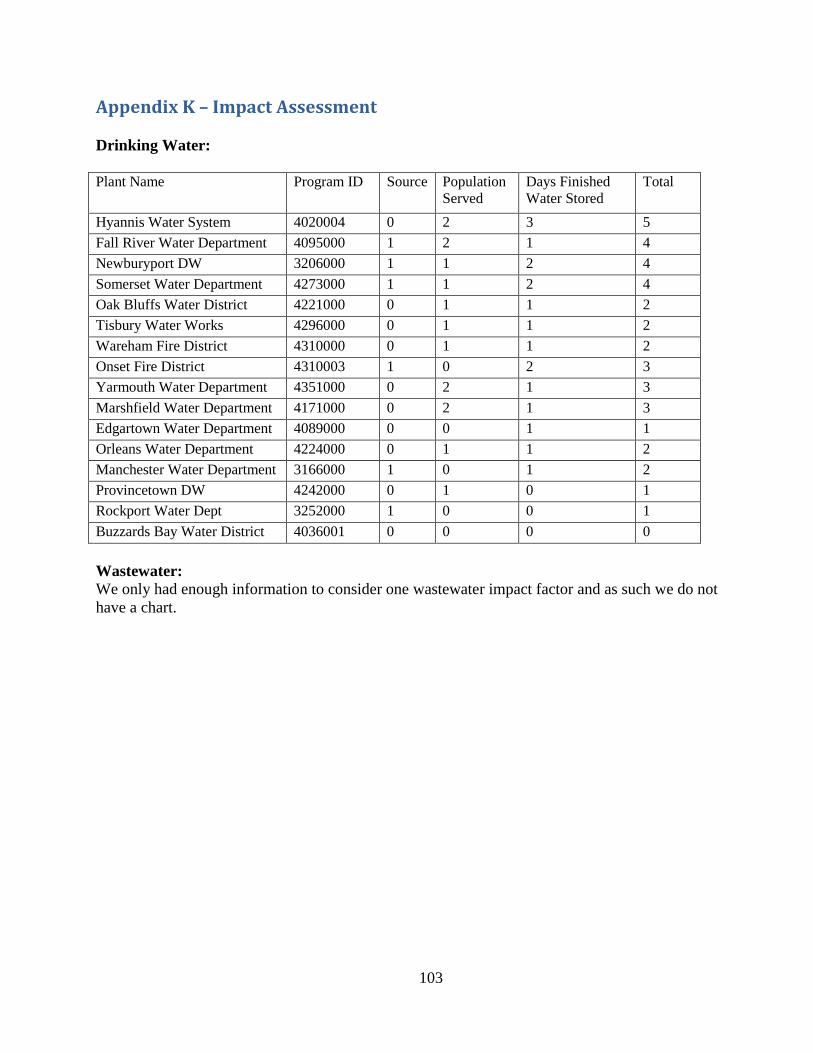
103
Appendix K – Impact Assessment
Drinking Water:
Plant Name Program ID Source Population
Served
Days Finished
Water Stored
Total
Hyannis Water System 4020004 0 2 3 5
Fall River Water Department 4095000 1 2 1 4
Newburyport DW 3206000 1 1 2 4
Somerset Water Department 4273000 1 1 2 4
Oak Bluffs Water District 4221000 0 1 1 2
Tisbury Water Works 4296000 0 1 1 2
Wareham Fire District 4310000 0 1 1 2
Onset Fire District 4310003 1 0 2 3
Yarmouth Water Department 4351000 0 2 1 3
Marshfield Water Department 4171000 0 2 1 3
Edgartown Water Department 4089000 0 0 1 1
Orleans Water Department 4224000 0 1 1 2
Manchester Water Department 3166000 1 0 1 2
Provincetown DW 4242000 0 1 0 1
Rockport Water Dept 3252000 1 0 0 1
Buzzards Bay Water District 4036001 0 0 0 0
Wastewater:
We only had enough information to consider one wastewater impact factor and as such we do not
have a chart.
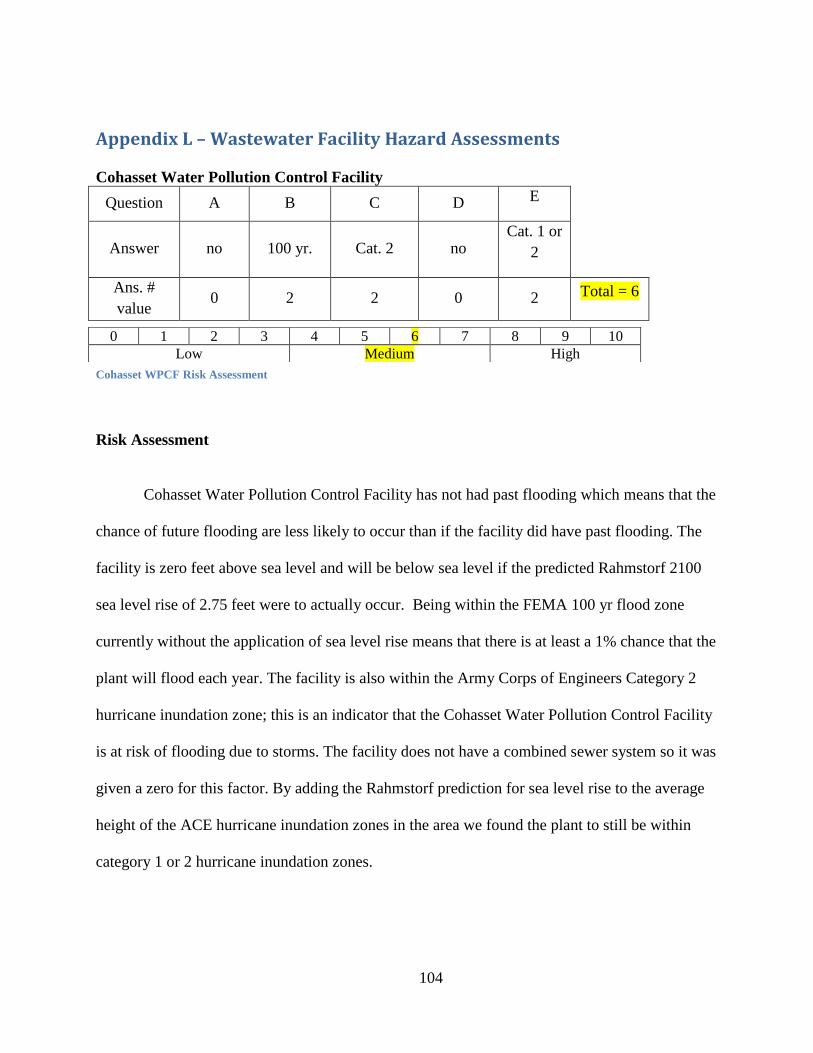
104
Appendix L – Wastewater Facility Hazard Assessments
Cohasset Water Pollution Control Facility
Question A B C D E
Answer no 100 yr. Cat. 2 no Cat. 1 or
2
Ans. #
value 0 2 2 0 2 Total = 6
Cohasset WPCF Risk Assessment
Risk Assessment
Cohasset Water Pollution Control Facility has not had past flooding which means that the
chance of future flooding are less likely to occur than if the facility did have past flooding. The
facility is zero feet above sea level and will be below sea level if the predicted Rahmstorf 2100
sea level rise of 2.75 feet were to actually occur. Being within the FEMA 100 yr flood zone
currently without the application of sea level rise means that there is at least a 1% chance that the
plant will flood each year. The facility is also within the Army Corps of Engineers Category 2
hurricane inundation zone; this is an indicator that the Cohasset Water Pollution Control Facility
is at risk of flooding due to storms. The facility does not have a combined sewer system so it was
given a zero for this factor. By adding the Rahmstorf prediction for sea level rise to the average
height of the ACE hurricane inundation zones in the area we found the plant to still be within
category 1 or 2 hurricane inundation zones.
0 1 2 3 4 5 6 7 8 9 10
Low Medium High
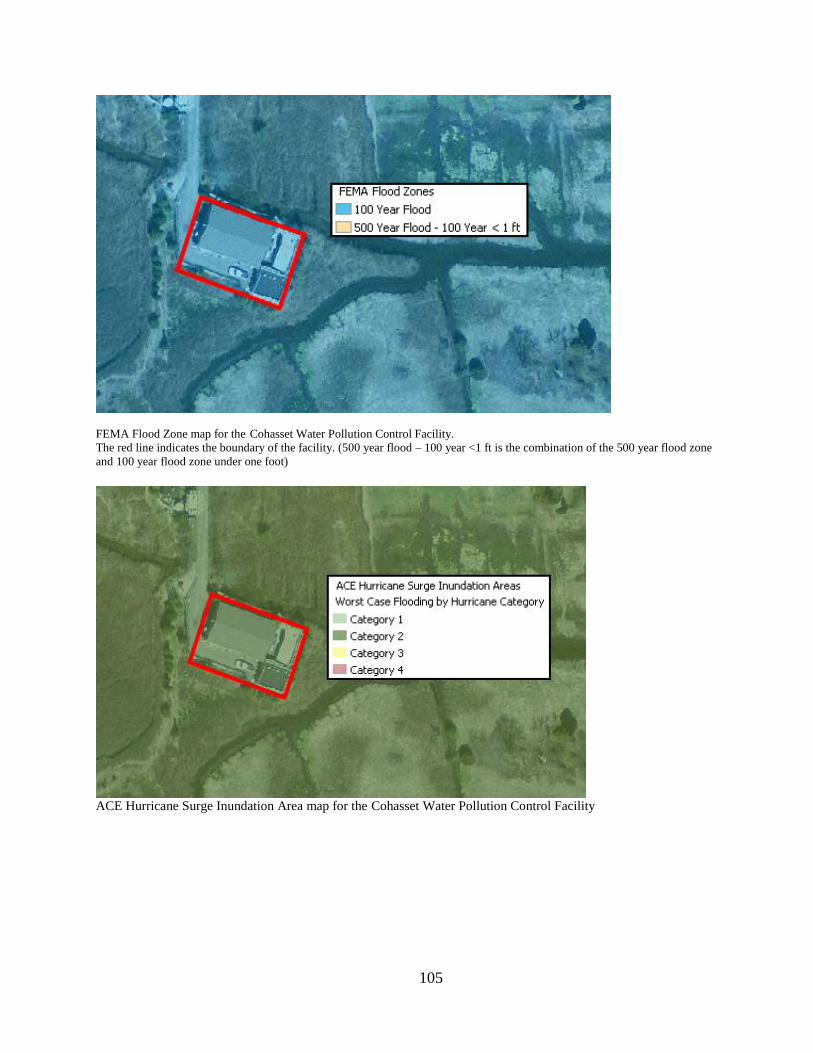
105
FEMA Flood Zone map for the Cohasset Water Pollution Control Facility.
The red line indicates the boundary of the facility. (500 year flood – 100 year <1 ft is the combination of the 500 year flood zone
and 100 year flood zone under one foot)
ACE Hurricane Surge Inundation Area map for the Cohasset Water Pollution Control Facility
106
Impact Assessment
If the Cohasset Water Pollution Control Facility becomes unable to process incoming
wastewater, up to 0.2 million gallons of wastewater every day may flood the plant and the
surrounding area. The plant has a design flow rate of 0.4 million gallons. The facility received a
small impact rating because the ratio of average flow to design flow yielded a value of 50%.
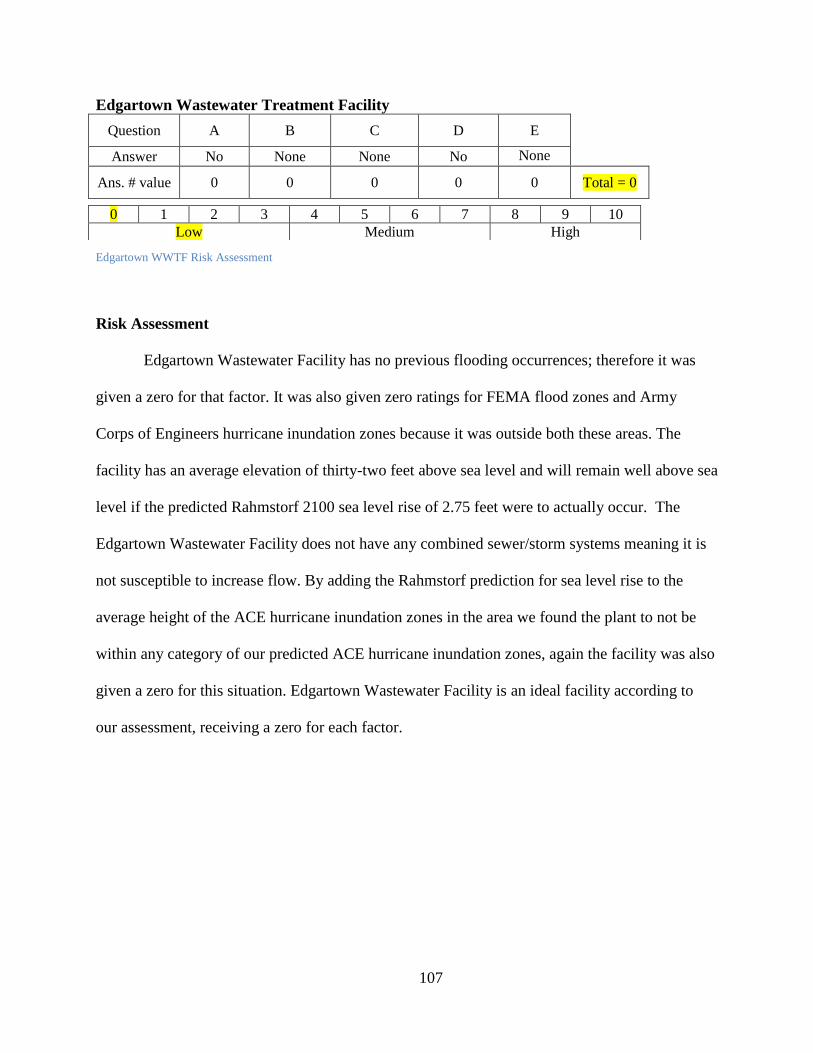
107
Edgartown Wastewater Treatment Facility
Question A B C D E
Answer No None None No None
Ans. # value 0 0 0 0 0 Total = 0
Edgartown WWTF Risk Assessment
Risk Assessment
Edgartown Wastewater Facility has no previous flooding occurrences; therefore it was
given a zero for that factor. It was also given zero ratings for FEMA flood zones and Army
Corps of Engineers hurricane inundation zones because it was outside both these areas. The
facility has an average elevation of thirty-two feet above sea level and will remain well above sea
level if the predicted Rahmstorf 2100 sea level rise of 2.75 feet were to actually occur. The
Edgartown Wastewater Facility does not have any combined sewer/storm systems meaning it is
not susceptible to increase flow. By adding the Rahmstorf prediction for sea level rise to the
average height of the ACE hurricane inundation zones in the area we found the plant to not be
within any category of our predicted ACE hurricane inundation zones, again the facility was also
given a zero for this situation. Edgartown Wastewater Facility is an ideal facility according to
our assessment, receiving a zero for each factor.
0 1 2 3 4 5 6 7 8 9 10
Low Medium High
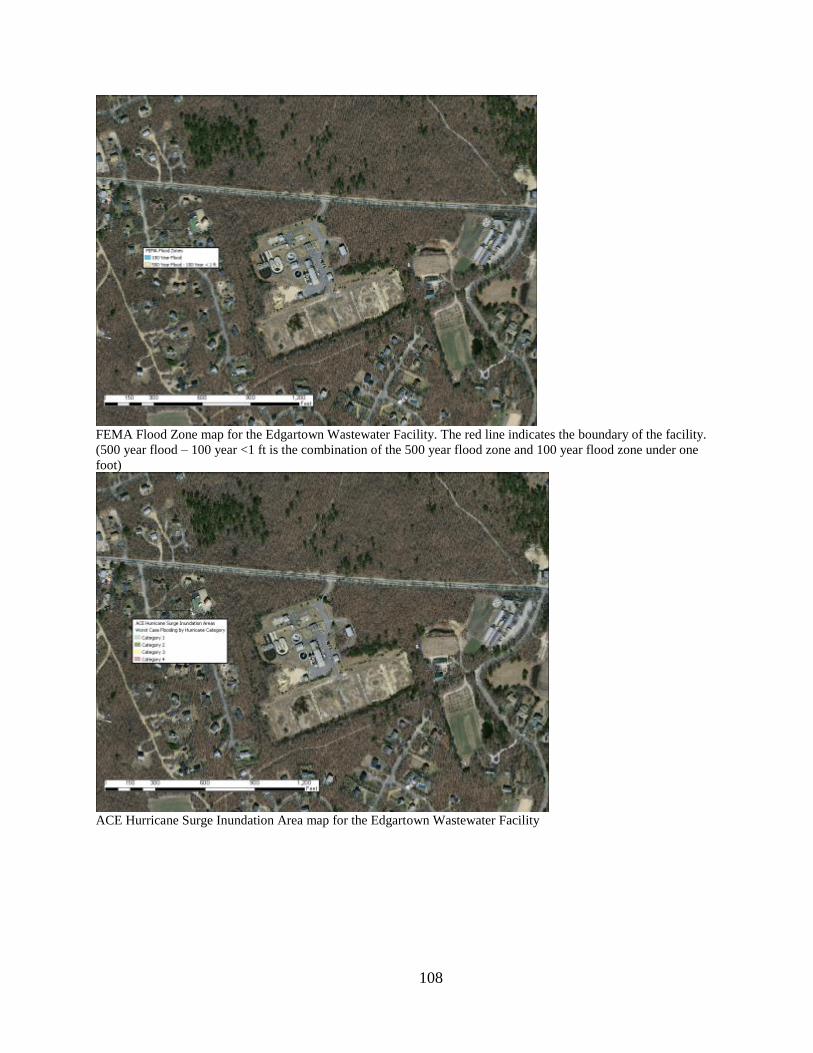
108
FEMA Flood Zone map for the Edgartown Wastewater Facility. The red line indicates the boundary of the facility.
(500 year flood – 100 year <1 ft is the combination of the 500 year flood zone and 100 year flood zone under one
foot)
ACE Hurricane Surge Inundation Area map for the Edgartown Wastewater Facility
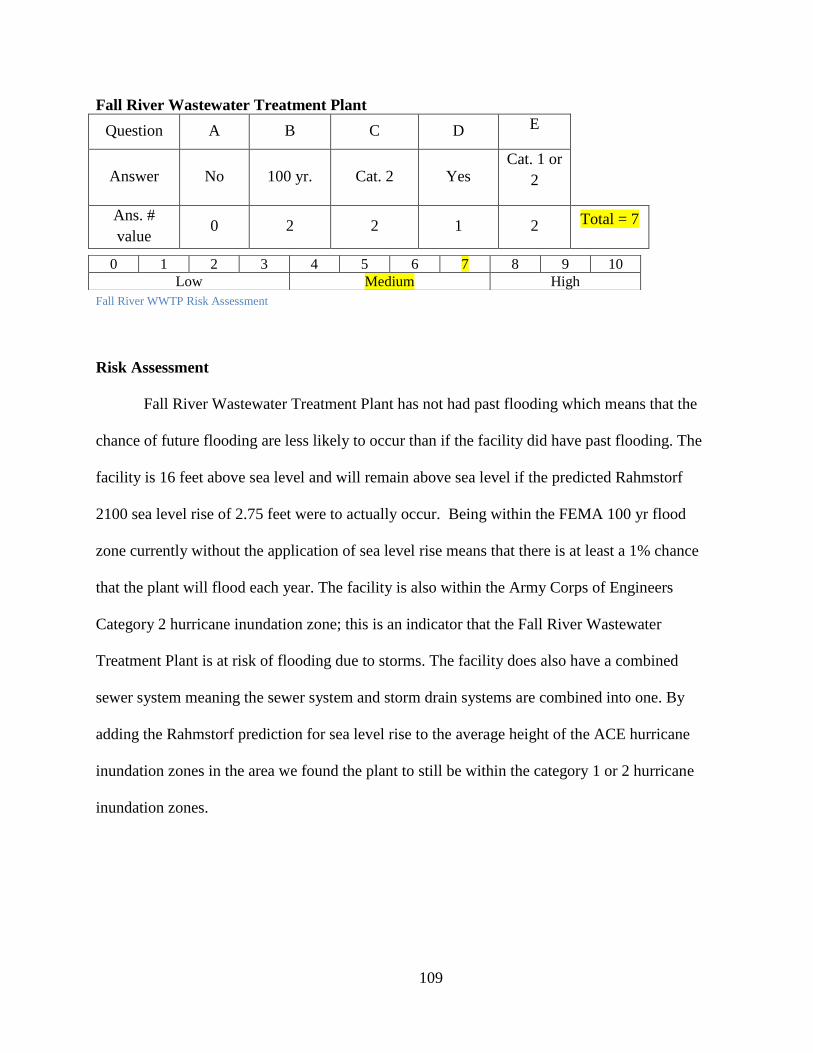
109
Fall River Wastewater Treatment Plant
Question A B C D E
Answer No 100 yr. Cat. 2 Yes Cat. 1 or
2
Ans. #
value 0 2 2 1 2 Total = 7
Fall River WWTP Risk Assessment
Risk Assessment
Fall River Wastewater Treatment Plant has not had past flooding which means that the
chance of future flooding are less likely to occur than if the facility did have past flooding. The
facility is 16 feet above sea level and will remain above sea level if the predicted Rahmstorf
2100 sea level rise of 2.75 feet were to actually occur. Being within the FEMA 100 yr flood
zone currently without the application of sea level rise means that there is at least a 1% chance
that the plant will flood each year. The facility is also within the Army Corps of Engineers
Category 2 hurricane inundation zone; this is an indicator that the Fall River Wastewater
Treatment Plant is at risk of flooding due to storms. The facility does also have a combined
sewer system meaning the sewer system and storm drain systems are combined into one. By
adding the Rahmstorf prediction for sea level rise to the average height of the ACE hurricane
inundation zones in the area we found the plant to still be within the category 1 or 2 hurricane
inundation zones.
0 1 2 3 4 5 6 7 8 9 10
Low Medium High
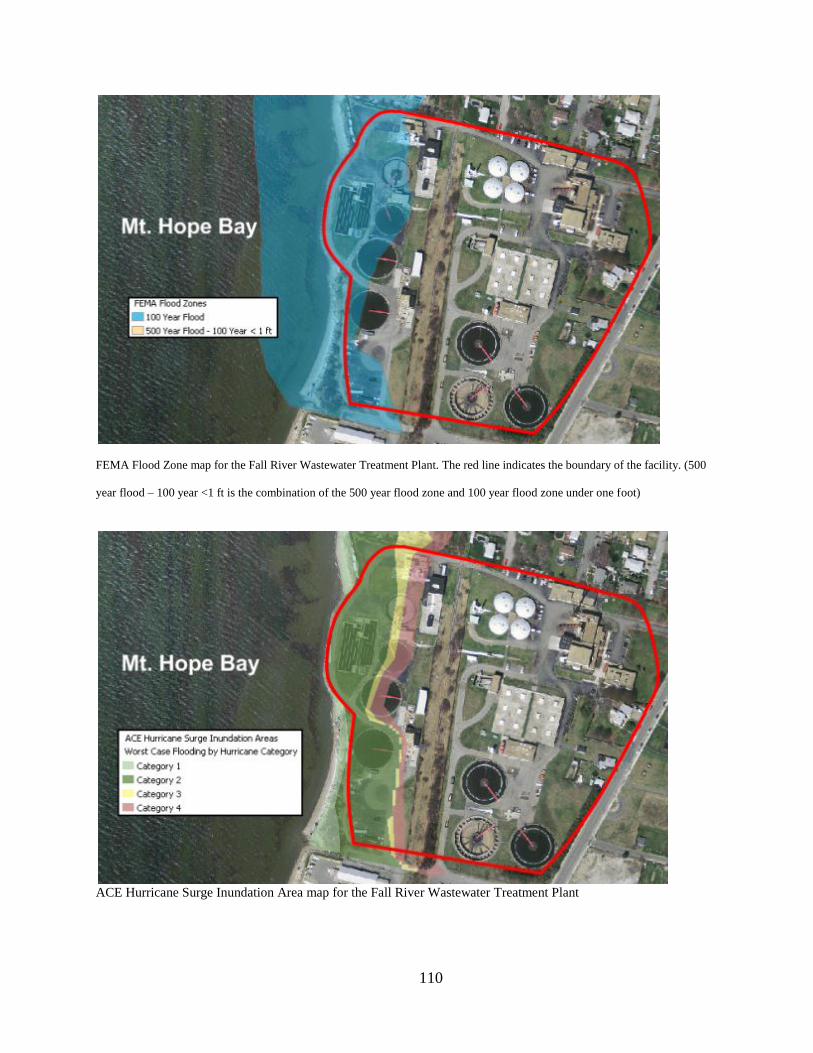
110
FEMA Flood Zone map for the Fall River Wastewater Treatment Plant. The red line indicates the boundary of the facility. (500
year flood – 100 year <1 ft is the combination of the 500 year flood zone and 100 year flood zone under one foot)
ACE Hurricane Surge Inundation Area map for the Fall River Wastewater Treatment Plant
111
Impact Assessment
If the Fall River Wastewater Treatment Plant becomes unable to process incoming
wastewater, up to 18.9 million gallons of wastewater every day may flood the plant and the
surrounding area. The plant has a design flow rate of 30.6 million gallons. The facility received a
medium impact rating because the ratio of average flow to design flow yielded a value of 62%.
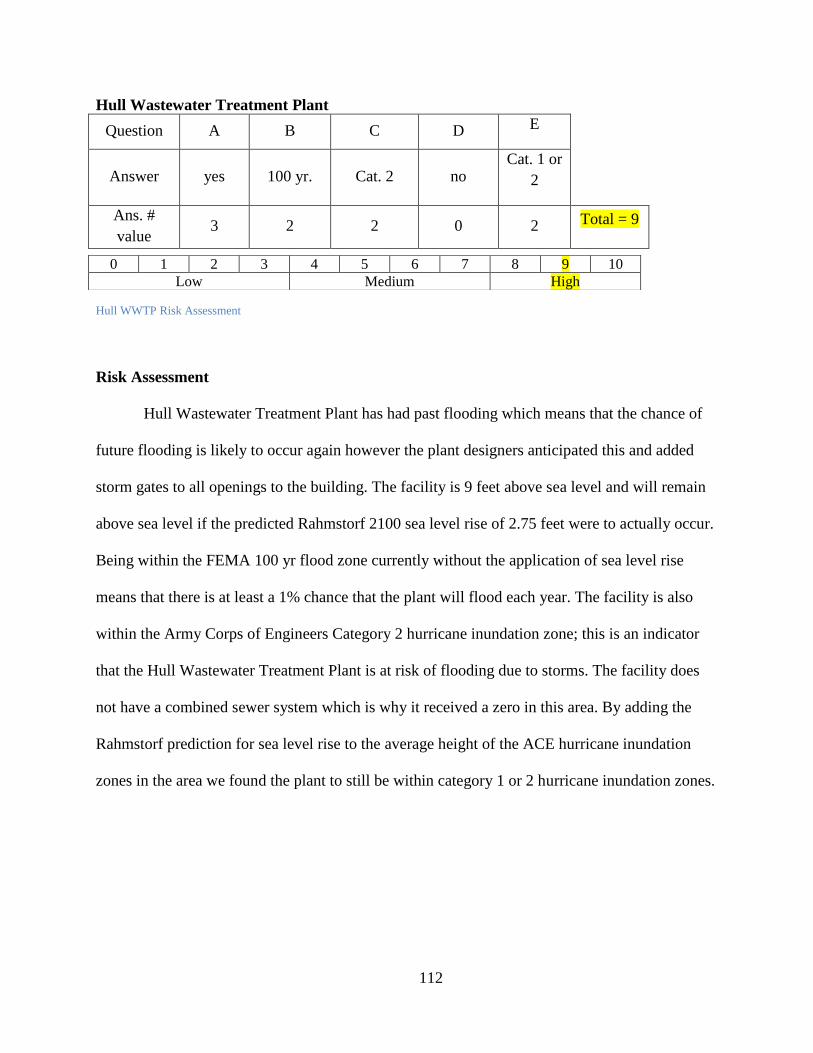
112
Hull Wastewater Treatment Plant
Question A B C D E
Answer yes 100 yr. Cat. 2 no Cat. 1 or
2
Ans. #
value 3 2 2 0 2 Total = 9
Hull WWTP Risk Assessment
Risk Assessment
Hull Wastewater Treatment Plant has had past flooding which means that the chance of
future flooding is likely to occur again however the plant designers anticipated this and added
storm gates to all openings to the building. The facility is 9 feet above sea level and will remain
above sea level if the predicted Rahmstorf 2100 sea level rise of 2.75 feet were to actually occur.
Being within the FEMA 100 yr flood zone currently without the application of sea level rise
means that there is at least a 1% chance that the plant will flood each year. The facility is also
within the Army Corps of Engineers Category 2 hurricane inundation zone; this is an indicator
that the Hull Wastewater Treatment Plant is at risk of flooding due to storms. The facility does
not have a combined sewer system which is why it received a zero in this area. By adding the
Rahmstorf prediction for sea level rise to the average height of the ACE hurricane inundation
zones in the area we found the plant to still be within category 1 or 2 hurricane inundation zones.
0 1 2 3 4 5 6 7 8 9 10
Low Medium High
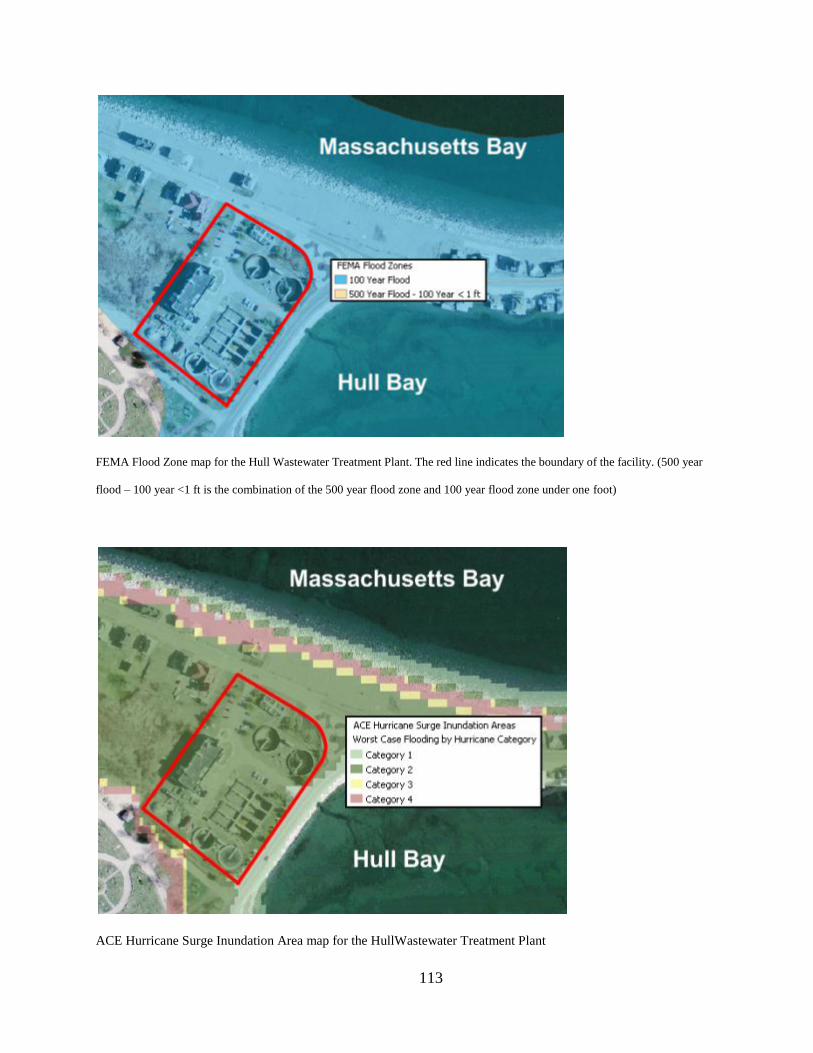
113
FEMA Flood Zone map for the Hull Wastewater Treatment Plant. The red line indicates the boundary of the facility. (500 year
flood – 100 year <1 ft is the combination of the 500 year flood zone and 100 year flood zone under one foot)
ACE Hurricane Surge Inundation Area map for the HullWastewater Treatment Plant
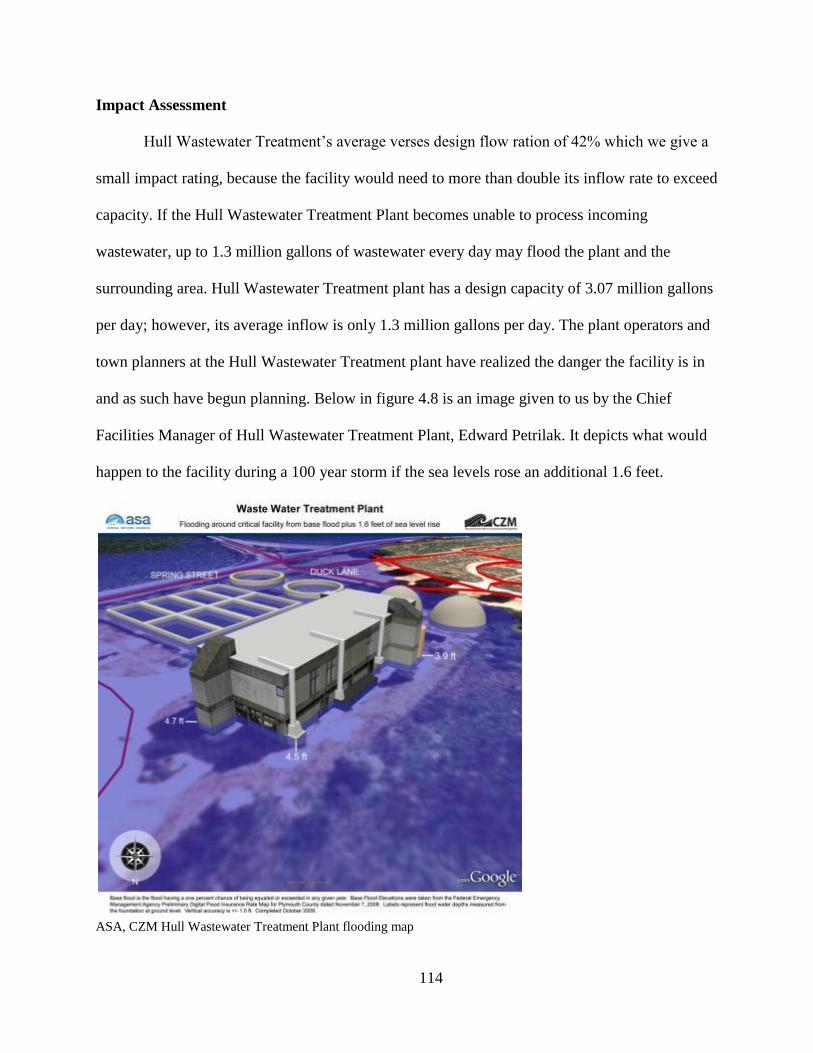
114
Impact Assessment
Hull Wastewater Treatment’s average verses design flow ration of 42% which we give a
small impact rating, because the facility would need to more than double its inflow rate to exceed
capacity. If the Hull Wastewater Treatment Plant becomes unable to process incoming
wastewater, up to 1.3 million gallons of wastewater every day may flood the plant and the
surrounding area. Hull Wastewater Treatment plant has a design capacity of 3.07 million gallons
per day; however, its average inflow is only 1.3 million gallons per day. The plant operators and
town planners at the Hull Wastewater Treatment plant have realized the danger the facility is in
and as such have begun planning. Below in figure 4.8 is an image given to us by the Chief
Facilities Manager of Hull Wastewater Treatment Plant, Edward Petrilak. It depicts what would
happen to the facility during a 100 year storm if the sea levels rose an additional 1.6 feet.
ASA, CZM Hull Wastewater Treatment Plant flooding map
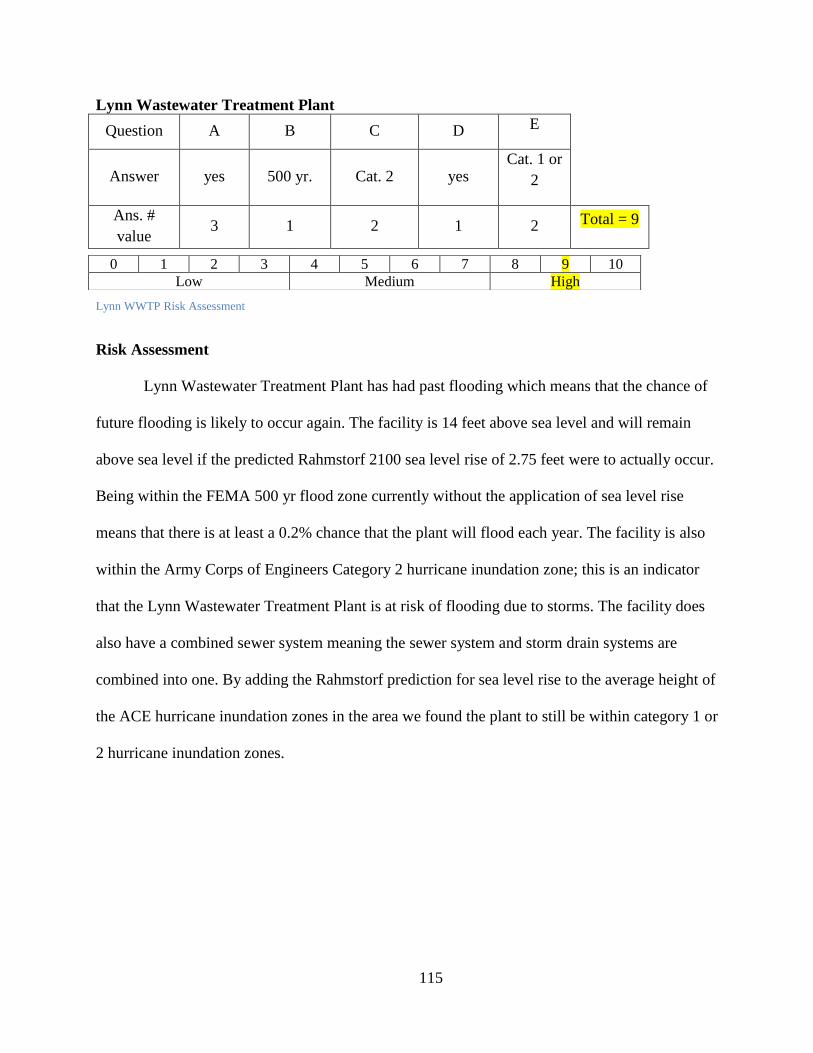
115
Lynn Wastewater Treatment Plant
Question A B C D E
Answer yes 500 yr. Cat. 2 yes Cat. 1 or
2
Ans. #
value 3 1 2 1 2 Total = 9
Lynn WWTP Risk Assessment
Risk Assessment
Lynn Wastewater Treatment Plant has had past flooding which means that the chance of
future flooding is likely to occur again. The facility is 14 feet above sea level and will remain
above sea level if the predicted Rahmstorf 2100 sea level rise of 2.75 feet were to actually occur.
Being within the FEMA 500 yr flood zone currently without the application of sea level rise
means that there is at least a 0.2% chance that the plant will flood each year. The facility is also
within the Army Corps of Engineers Category 2 hurricane inundation zone; this is an indicator
that the Lynn Wastewater Treatment Plant is at risk of flooding due to storms. The facility does
also have a combined sewer system meaning the sewer system and storm drain systems are
combined into one. By adding the Rahmstorf prediction for sea level rise to the average height of
the ACE hurricane inundation zones in the area we found the plant to still be within category 1 or
2 hurricane inundation zones.
0 1 2 3 4 5 6 7 8 9 10
Low Medium High
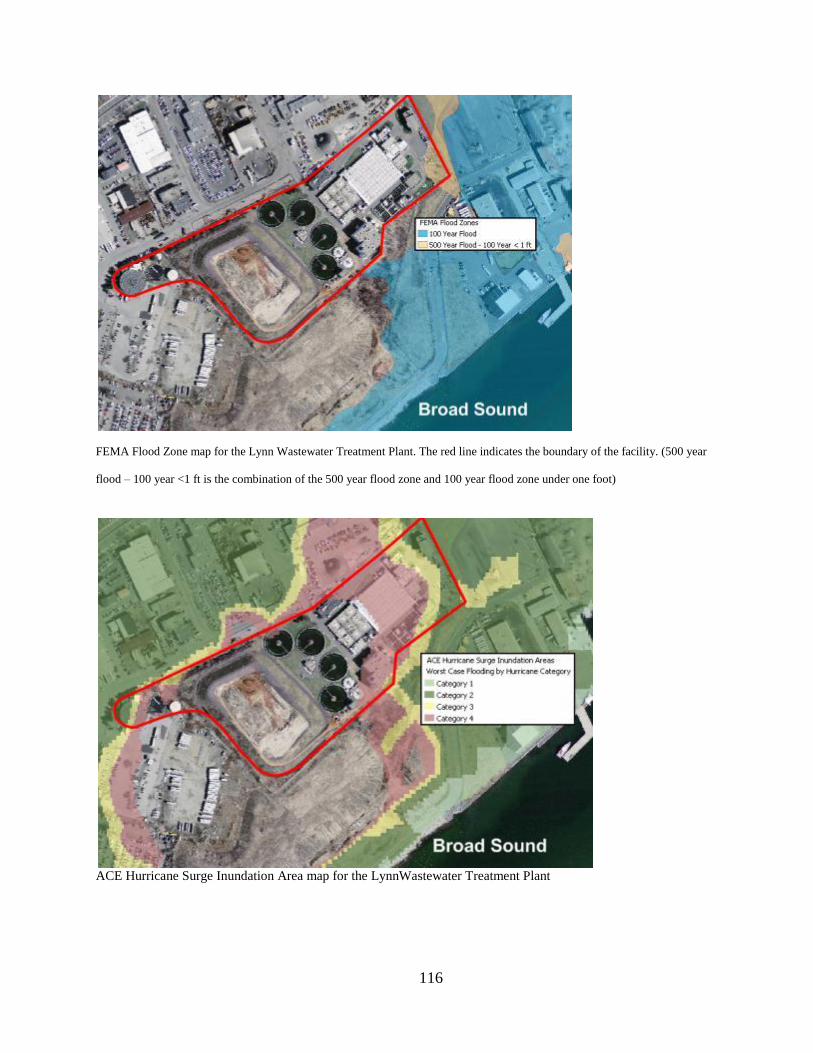
116
FEMA Flood Zone map for the Lynn Wastewater Treatment Plant. The red line indicates the boundary of the facility. (500 year
flood – 100 year <1 ft is the combination of the 500 year flood zone and 100 year flood zone under one foot)
ACE Hurricane Surge Inundation Area map for the LynnWastewater Treatment Plant

117
Impact Assessment
If the Lynn Wastewater Treatment Plant becomes unable to process incoming
wastewater, up to 24 million gallons of wastewater every day may flood the plant and the
surrounding area. The plant has a design flow rate of 60 million gallons. The facility received a
small impact rating because the ratio of average flow to design flow yielded a value of 40%.
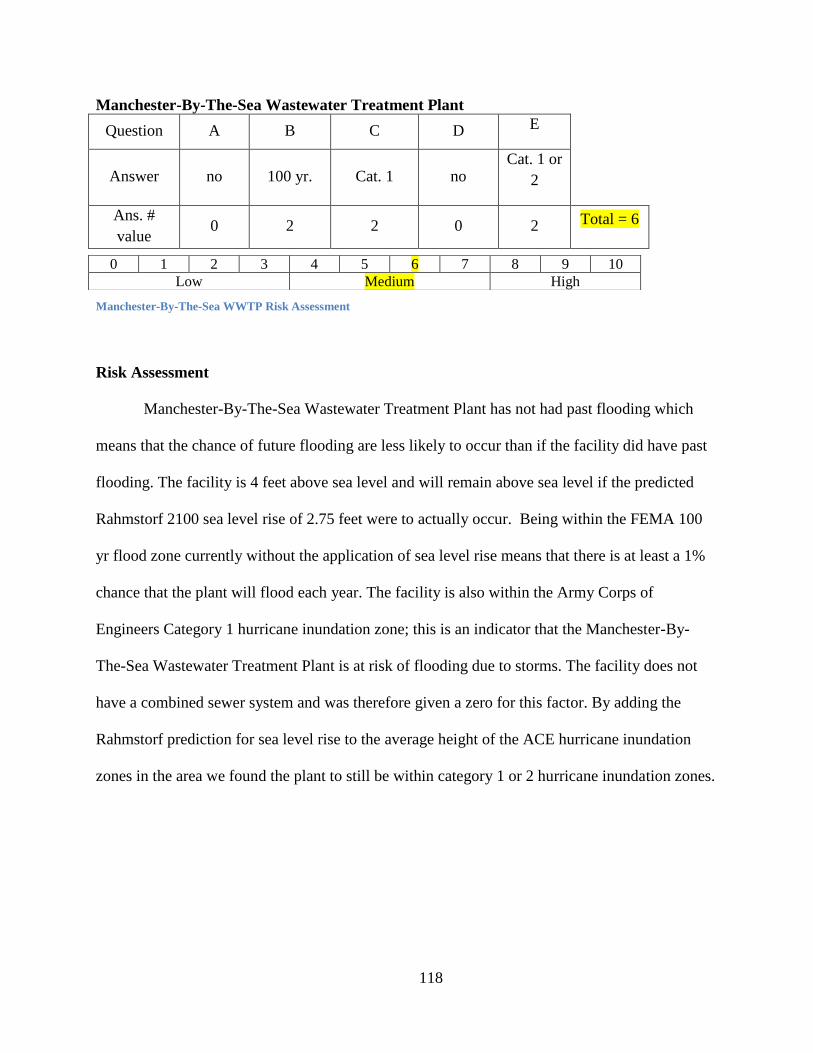
118
Manchester-By-The-Sea Wastewater Treatment Plant
Question A B C D E
Answer no 100 yr. Cat. 1 no Cat. 1 or
2
Ans. #
value 0 2 2 0 2 Total = 6
Manchester-By-The-Sea WWTP Risk Assessment
Risk Assessment
Manchester-By-The-Sea Wastewater Treatment Plant has not had past flooding which
means that the chance of future flooding are less likely to occur than if the facility did have past
flooding. The facility is 4 feet above sea level and will remain above sea level if the predicted
Rahmstorf 2100 sea level rise of 2.75 feet were to actually occur. Being within the FEMA 100
yr flood zone currently without the application of sea level rise means that there is at least a 1%
chance that the plant will flood each year. The facility is also within the Army Corps of
Engineers Category 1 hurricane inundation zone; this is an indicator that the Manchester-By-
The-Sea Wastewater Treatment Plant is at risk of flooding due to storms. The facility does not
have a combined sewer system and was therefore given a zero for this factor. By adding the
Rahmstorf prediction for sea level rise to the average height of the ACE hurricane inundation
zones in the area we found the plant to still be within category 1 or 2 hurricane inundation zones.
0 1 2 3 4 5 6 7 8 9 10
Low Medium High
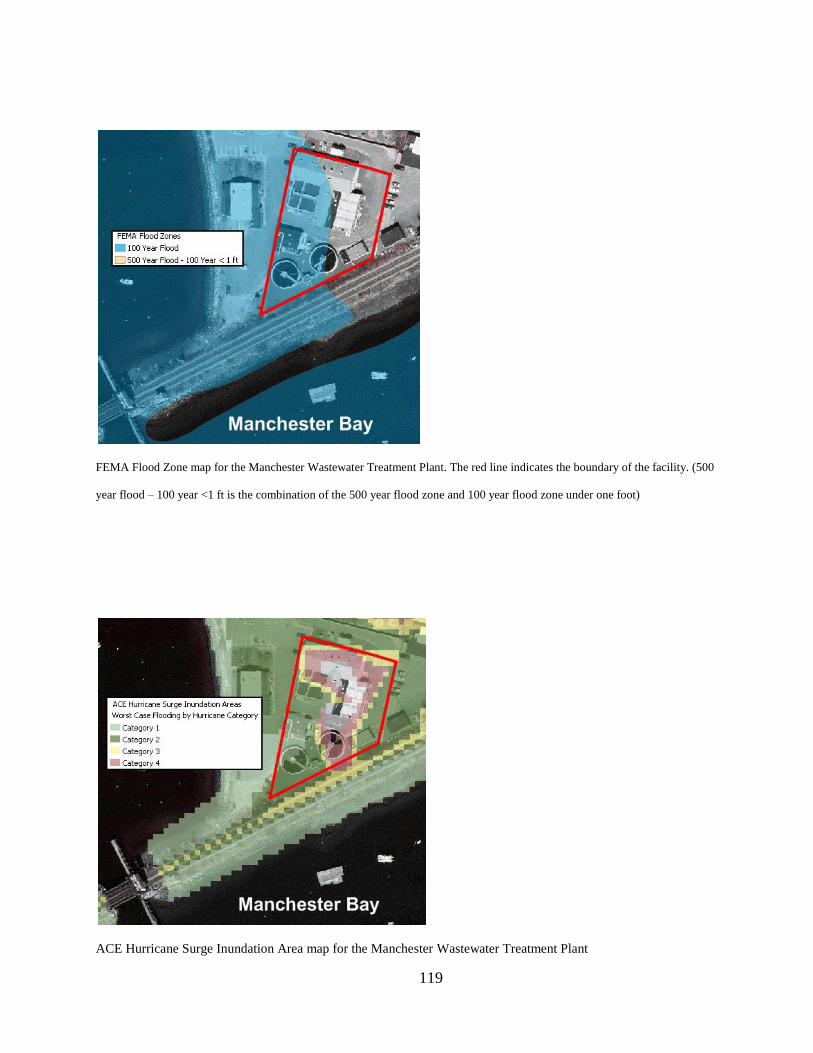
119
FEMA Flood Zone map for the Manchester Wastewater Treatment Plant. The red line indicates the boundary of the facility. (500
year flood – 100 year <1 ft is the combination of the 500 year flood zone and 100 year flood zone under one foot)
ACE Hurricane Surge Inundation Area map for the Manchester Wastewater Treatment Plant
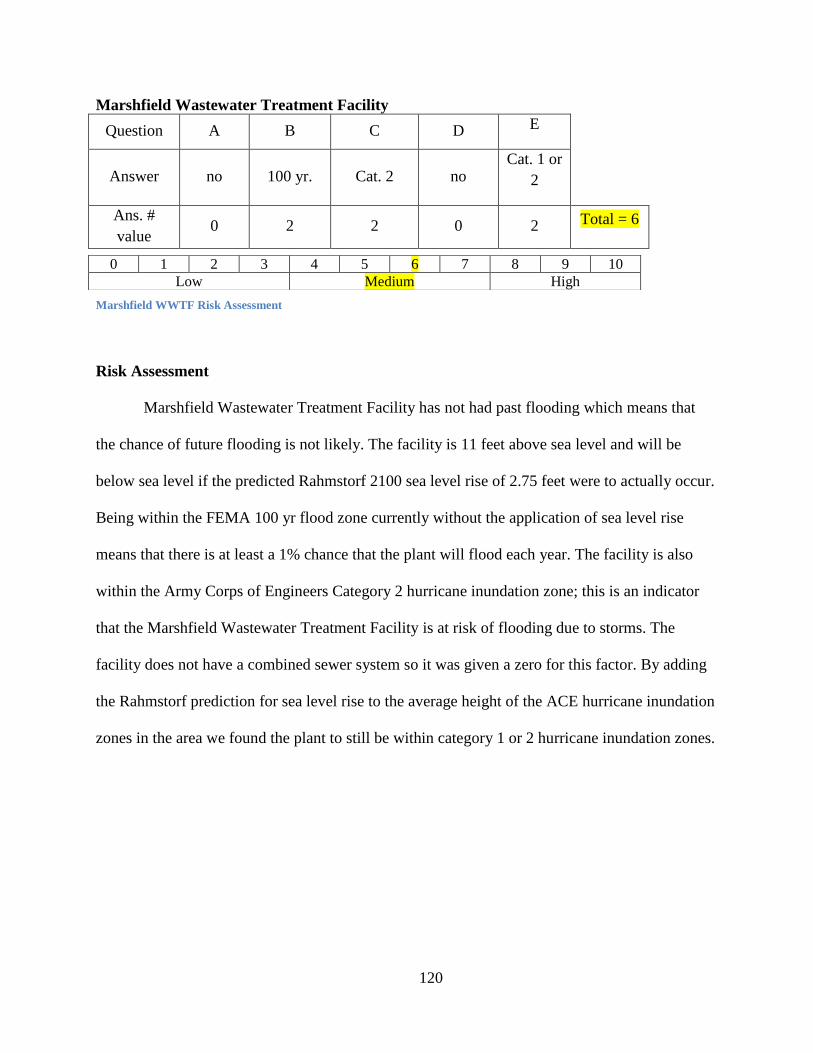
120
Marshfield Wastewater Treatment Facility
Question A B C D E
Answer no 100 yr. Cat. 2 no Cat. 1 or
2
Ans. #
value 0 2 2 0 2 Total = 6
Marshfield WWTF Risk Assessment
Risk Assessment
Marshfield Wastewater Treatment Facility has not had past flooding which means that
the chance of future flooding is not likely. The facility is 11 feet above sea level and will be
below sea level if the predicted Rahmstorf 2100 sea level rise of 2.75 feet were to actually occur.
Being within the FEMA 100 yr flood zone currently without the application of sea level rise
means that there is at least a 1% chance that the plant will flood each year. The facility is also
within the Army Corps of Engineers Category 2 hurricane inundation zone; this is an indicator
that the Marshfield Wastewater Treatment Facility is at risk of flooding due to storms. The
facility does not have a combined sewer system so it was given a zero for this factor. By adding
the Rahmstorf prediction for sea level rise to the average height of the ACE hurricane inundation
zones in the area we found the plant to still be within category 1 or 2 hurricane inundation zones.
0 1 2 3 4 5 6 7 8 9 10
Low Medium High
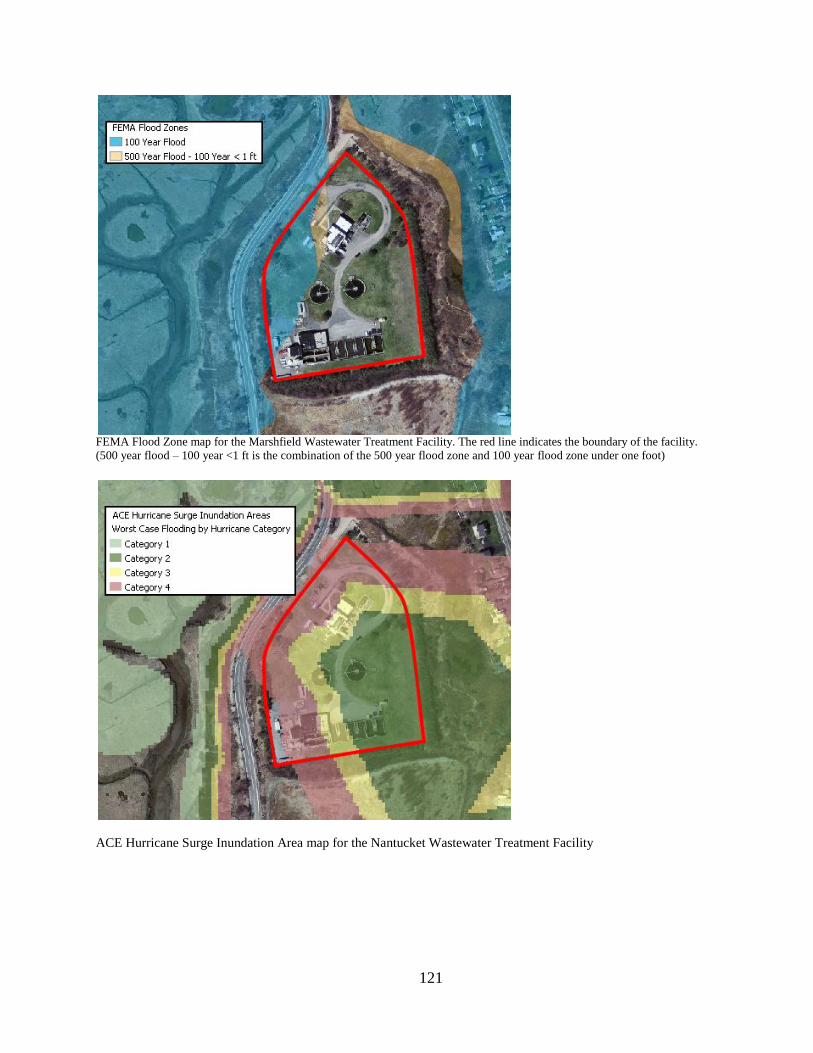
121
FEMA Flood Zone map for the Marshfield Wastewater Treatment Facility. The red line indicates the boundary of the facility.
(500 year flood – 100 year <1 ft is the combination of the 500 year flood zone and 100 year flood zone under one foot)
ACE Hurricane Surge Inundation Area map for the Nantucket Wastewater Treatment Facility

122
Impact Assessment
If the Marshfield Wastewater Treatment Facility becomes unable to process incoming
wastewater, up to 1.32 million gallons of wastewater every day may flood the plant and the
surrounding area. The plant has a design flow rate of 2.1 million gallons. The facility received a
medium impact rating because the ratio of average flow to design flow yielded a value of 63%.
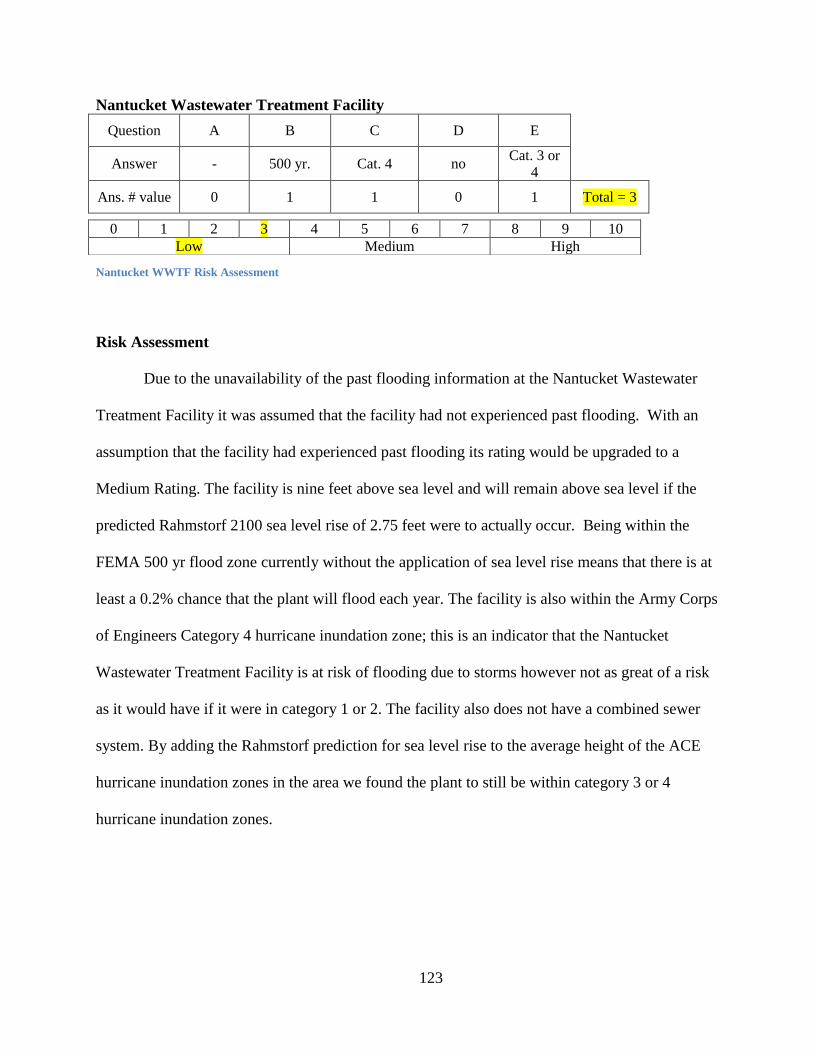
123
Nantucket Wastewater Treatment Facility
Question A B C D E
Answer - 500 yr. Cat. 4 no Cat. 3 or
4
Ans. # value 0 1 1 0 1 Total = 3
Nantucket WWTF Risk Assessment
Risk Assessment
Due to the unavailability of the past flooding information at the Nantucket Wastewater
Treatment Facility it was assumed that the facility had not experienced past flooding. With an
assumption that the facility had experienced past flooding its rating would be upgraded to a
Medium Rating. The facility is nine feet above sea level and will remain above sea level if the
predicted Rahmstorf 2100 sea level rise of 2.75 feet were to actually occur. Being within the
FEMA 500 yr flood zone currently without the application of sea level rise means that there is at
least a 0.2% chance that the plant will flood each year. The facility is also within the Army Corps
of Engineers Category 4 hurricane inundation zone; this is an indicator that the Nantucket
Wastewater Treatment Facility is at risk of flooding due to storms however not as great of a risk
as it would have if it were in category 1 or 2. The facility also does not have a combined sewer
system. By adding the Rahmstorf prediction for sea level rise to the average height of the ACE
hurricane inundation zones in the area we found the plant to still be within category 3 or 4
hurricane inundation zones.
0 1 2 3 4 5 6 7 8 9 10
Low Medium High
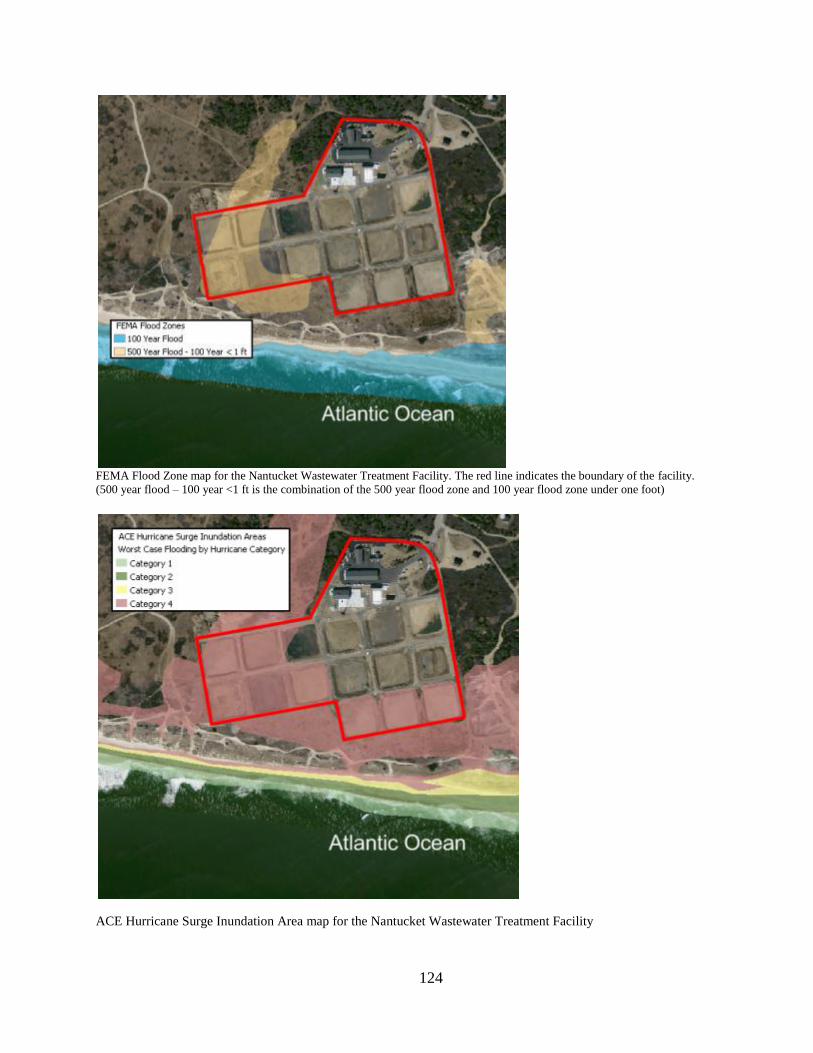
124
FEMA Flood Zone map for the Nantucket Wastewater Treatment Facility. The red line indicates the boundary of the facility.
(500 year flood – 100 year <1 ft is the combination of the 500 year flood zone and 100 year flood zone under one foot)
ACE Hurricane Surge Inundation Area map for the Nantucket Wastewater Treatment Facility
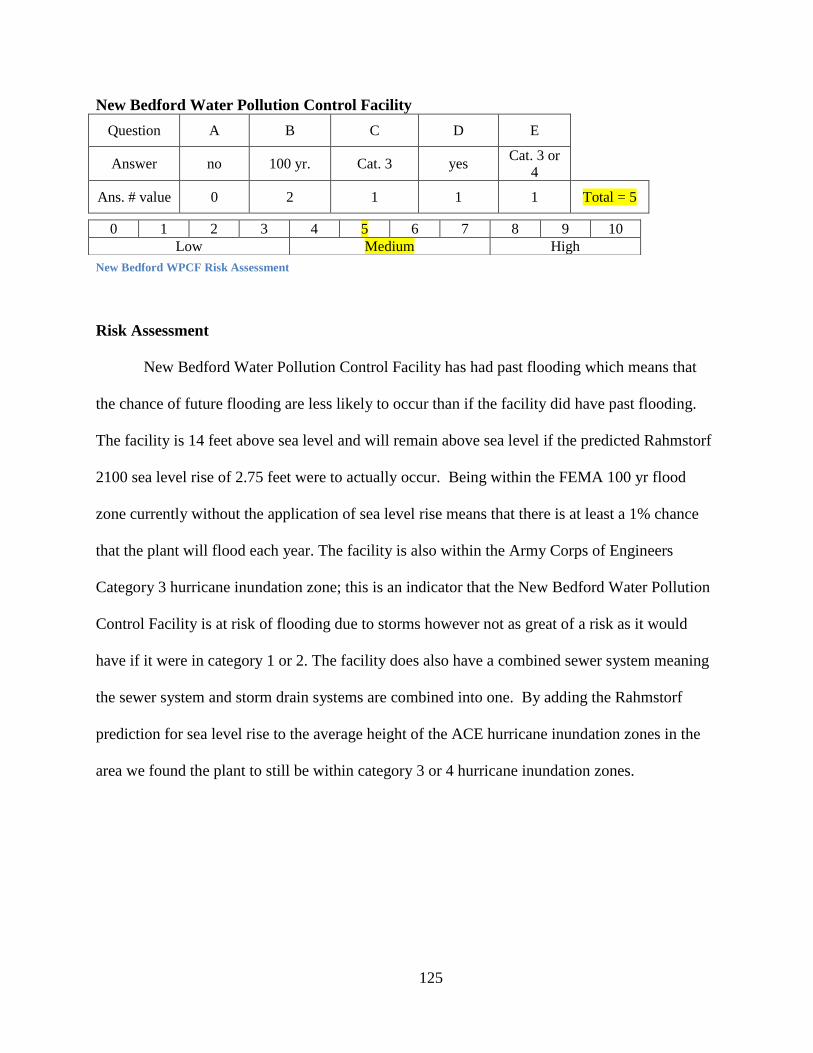
125
New Bedford Water Pollution Control Facility
Question A B C D E
Answer no 100 yr. Cat. 3 yes Cat. 3 or
4
Ans. # value 0 2 1 1 1 Total = 5
New Bedford WPCF Risk Assessment
Risk Assessment
New Bedford Water Pollution Control Facility has had past flooding which means that
the chance of future flooding are less likely to occur than if the facility did have past flooding.
The facility is 14 feet above sea level and will remain above sea level if the predicted Rahmstorf
2100 sea level rise of 2.75 feet were to actually occur. Being within the FEMA 100 yr flood
zone currently without the application of sea level rise means that there is at least a 1% chance
that the plant will flood each year. The facility is also within the Army Corps of Engineers
Category 3 hurricane inundation zone; this is an indicator that the New Bedford Water Pollution
Control Facility is at risk of flooding due to storms however not as great of a risk as it would
have if it were in category 1 or 2. The facility does also have a combined sewer system meaning
the sewer system and storm drain systems are combined into one. By adding the Rahmstorf
prediction for sea level rise to the average height of the ACE hurricane inundation zones in the
area we found the plant to still be within category 3 or 4 hurricane inundation zones.
0 1 2 3 4 5 6 7 8 9 10
Low Medium High
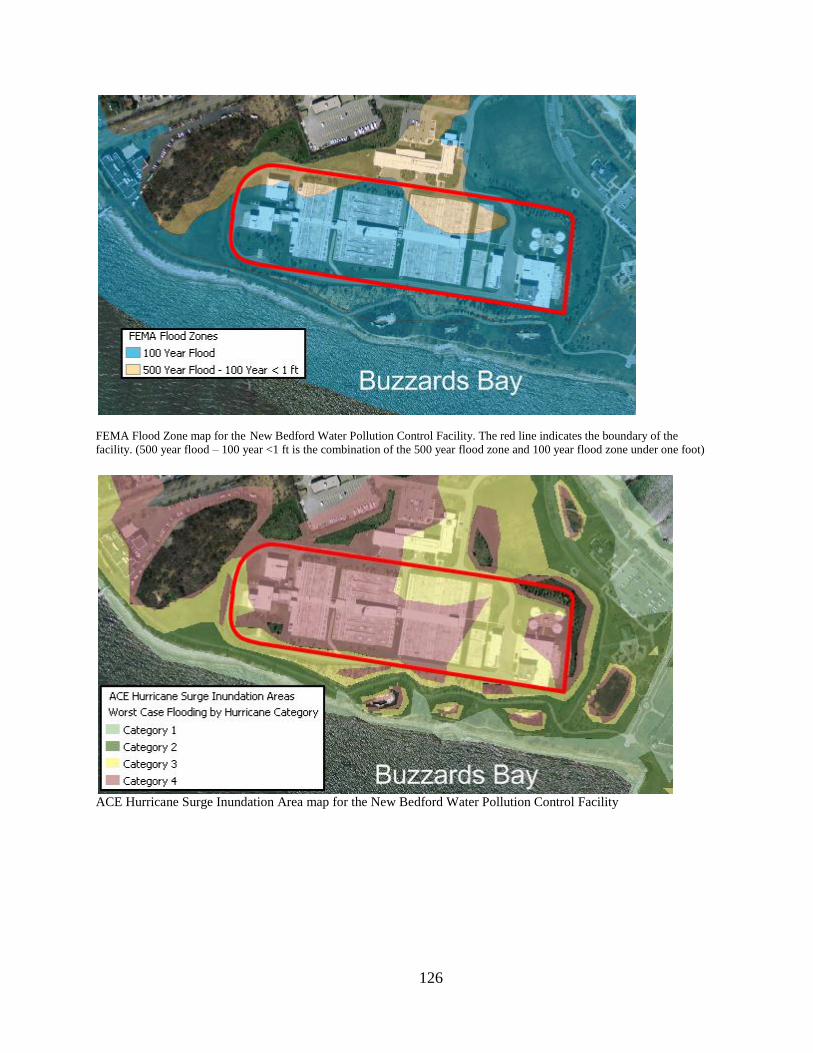
126
FEMA Flood Zone map for the New Bedford Water Pollution Control Facility. The red line indicates the boundary of the
facility. (500 year flood – 100 year <1 ft is the combination of the 500 year flood zone and 100 year flood zone under one foot)
ACE Hurricane Surge Inundation Area map for the New Bedford Water Pollution Control Facility
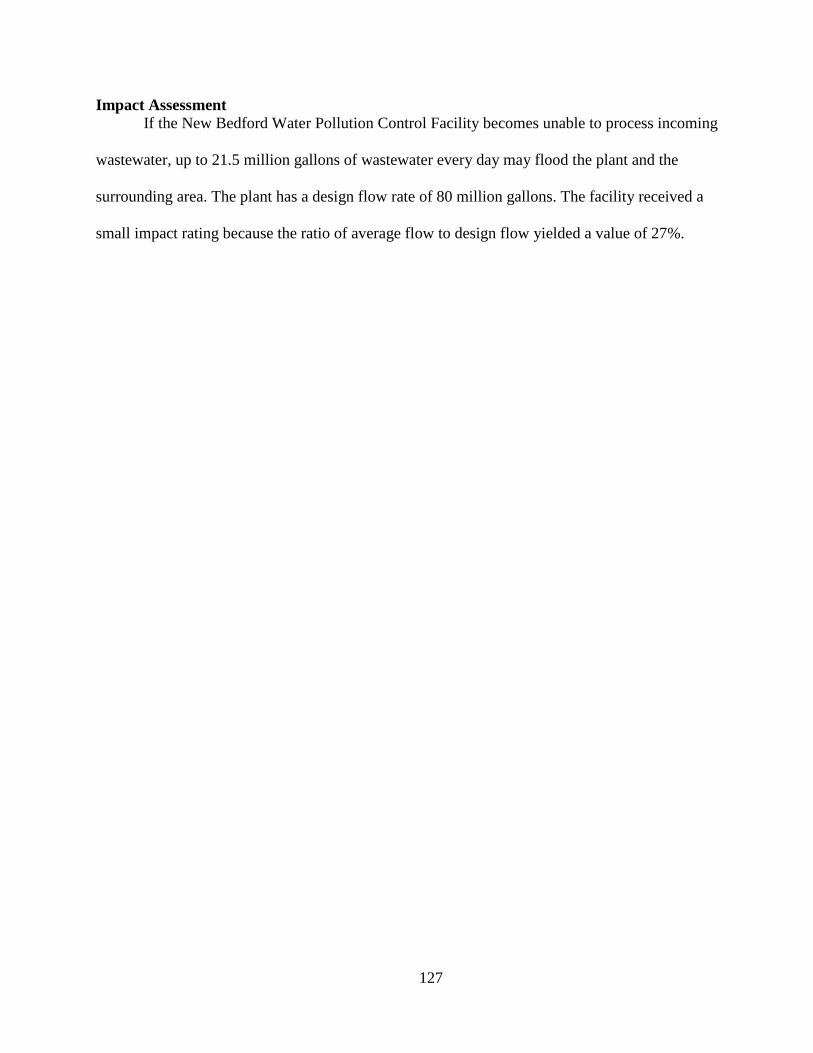
127
Impact Assessment
If the New Bedford Water Pollution Control Facility becomes unable to process incoming
wastewater, up to 21.5 million gallons of wastewater every day may flood the plant and the
surrounding area. The plant has a design flow rate of 80 million gallons. The facility received a
small impact rating because the ratio of average flow to design flow yielded a value of 27%.

128
Newburyport Wastewater Treatment Plant
Question A B C D E
Answer no 100 yr. Cat. 2 no Cat. 1 or
2
Ans. #
value 0 2 2 0 2 Total = 6
Newburyport WWTP Risk Assessment
Risk Assessment
Newburyport Wastewater Treatment Plant has had no past flooding which means that the
chance of future flooding is less likely to occur than if the plant had past flooding. The facility is
10 feet above sea level and will remain above sea level if the predicted Rahmstorf 2100 sea level
rise of 2.75 feet were to actually occur. Being within the FEMA 100 yr flood zone currently
without the application of sea level rise means that there is at least a 1% chance that the plant
will flood each year. The facility is also within the Army Corps of Engineers Category 2
hurricane inundation zone; this is an indicator that the Newburyport Wastewater Treatment Plant
is at risk of flooding due to storms. The facility does not have a combined sewer system which is
why it received a zero in this area. By adding the Rahmstorf prediction for sea level rise to the
average height of the ACE hurricane inundation zones in the area we found the plant to still be
within category 1 or 2 hurricane inundation zones.
0 1 2 3 4 5 6 7 8 9 10
Low Medium High
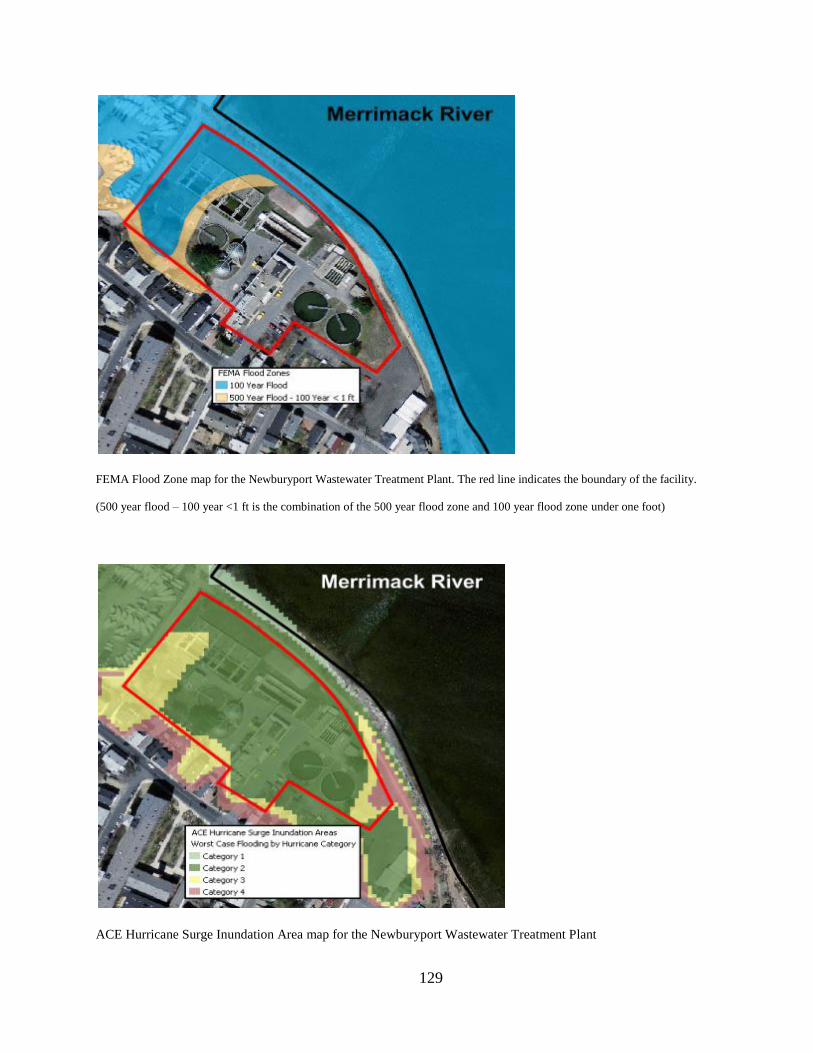
129
FEMA Flood Zone map for the Newburyport Wastewater Treatment Plant. The red line indicates the boundary of the facility.
(500 year flood – 100 year <1 ft is the combination of the 500 year flood zone and 100 year flood zone under one foot)
ACE Hurricane Surge Inundation Area map for the Newburyport Wastewater Treatment Plant
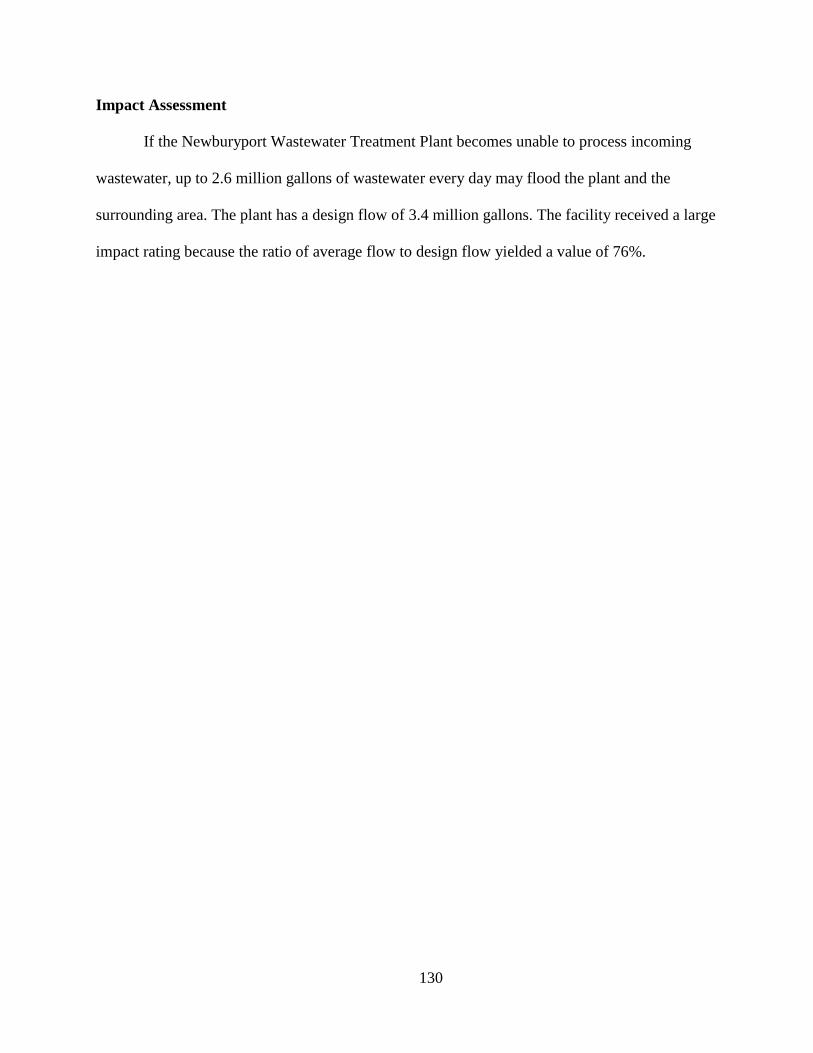
130
Impact Assessment
If the Newburyport Wastewater Treatment Plant becomes unable to process incoming
wastewater, up to 2.6 million gallons of wastewater every day may flood the plant and the
surrounding area. The plant has a design flow of 3.4 million gallons. The facility received a large
impact rating because the ratio of average flow to design flow yielded a value of 76%.

131
Provincetown Wastewater Treatment Plant
Question A B C D E
Answer No None None No None
Ans. # value 0 0 0 0 0 Total = 0
Provincetown WWTP Risk Assessment
Risk Assessment
Provincetown Wastewater Treatment Plant has no previous flooding occurrences.
Therefore it was given a zero for that factor. It is also was given zero ratings for FEMA flood
zones and Army Corps of Engineers hurricane inundation zone because it was outside both these
areas. The facility has an average elevation of 42 feet above sea level and will remain well above
sea level if the predicted Rahmstorf 2100 sea level rise of 2.75 feet were to actually occur. The
Provincetown Wastewater Treatment Plant also does not have any combined sewer/storm
systems meaning it is not susceptible to increase flow. By adding the Rahmstorf prediction for
sea level rise to the average height of the ACE hurricane inundation zones in the area we found
the plant to not be within any category of our predicted ACE hurricane inundation zones, again
the facility was also given a zero for this situation. Provincetown is an ideal facility according
our assessment, receiving a zero for each factor.
0 1 2 3 4 5 6 7 8 9 10
Low Medium High
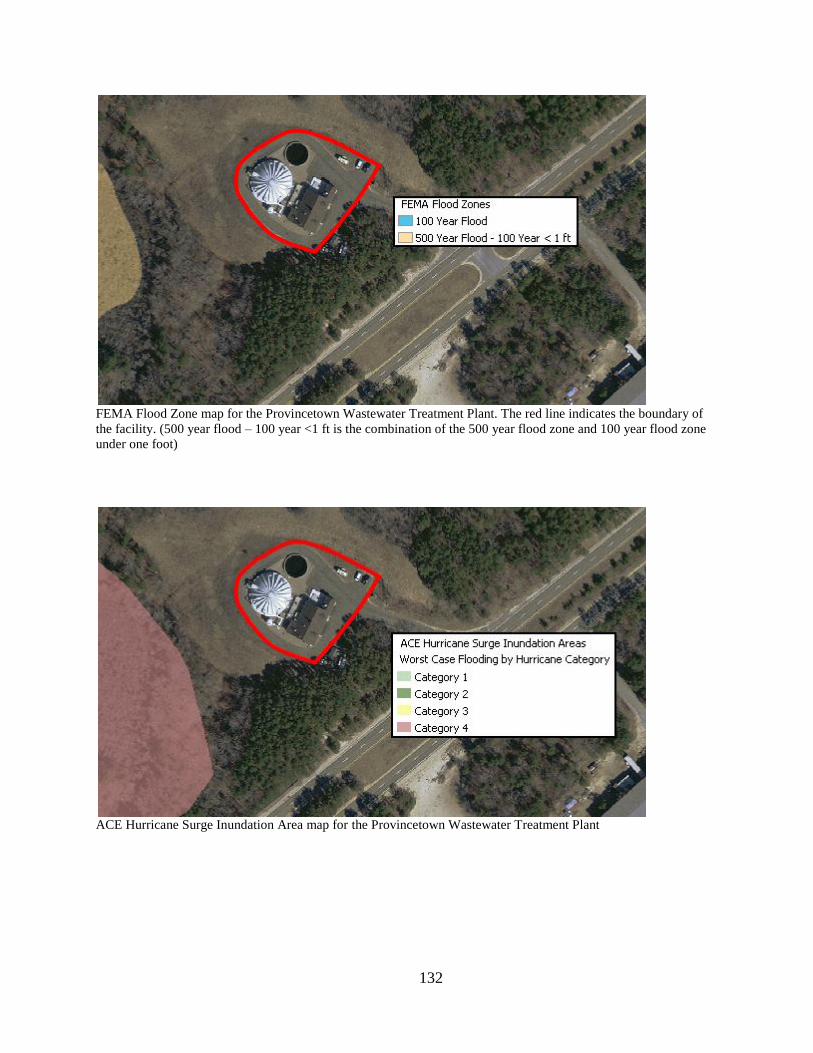
132
FEMA Flood Zone map for the Provincetown Wastewater Treatment Plant. The red line indicates the boundary of
the facility. (500 year flood – 100 year <1 ft is the combination of the 500 year flood zone and 100 year flood zone
under one foot)
ACE Hurricane Surge Inundation Area map for the Provincetown Wastewater Treatment Plant
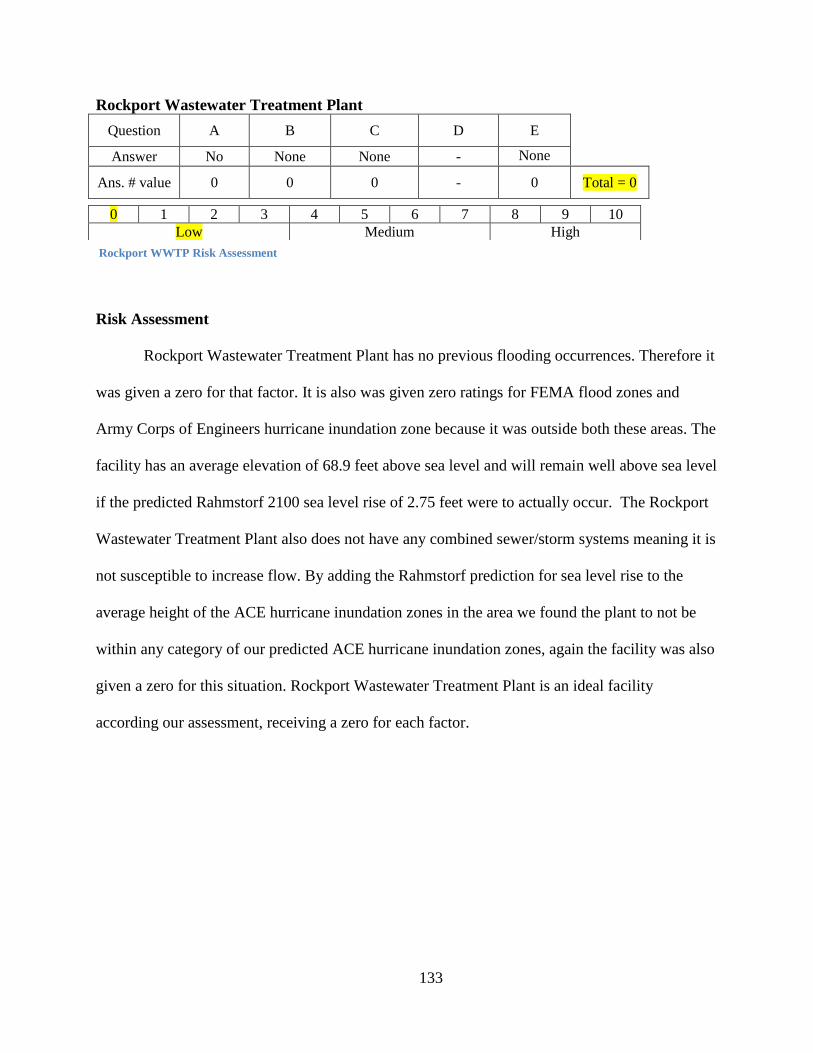
133
Rockport Wastewater Treatment Plant
Question A B C D E
Answer No None None - None
Ans. # value 0 0 0 - 0 Total = 0
Rockport WWTP Risk Assessment
Risk Assessment
Rockport Wastewater Treatment Plant has no previous flooding occurrences. Therefore it
was given a zero for that factor. It is also was given zero ratings for FEMA flood zones and
Army Corps of Engineers hurricane inundation zone because it was outside both these areas. The
facility has an average elevation of 68.9 feet above sea level and will remain well above sea level
if the predicted Rahmstorf 2100 sea level rise of 2.75 feet were to actually occur. The Rockport
Wastewater Treatment Plant also does not have any combined sewer/storm systems meaning it is
not susceptible to increase flow. By adding the Rahmstorf prediction for sea level rise to the
average height of the ACE hurricane inundation zones in the area we found the plant to not be
within any category of our predicted ACE hurricane inundation zones, again the facility was also
given a zero for this situation. Rockport Wastewater Treatment Plant is an ideal facility
according our assessment, receiving a zero for each factor.
0 1 2 3 4 5 6 7 8 9 10
Low Medium High

134
FEMA Flood Zone map for the Rockport Wastewater Treatment Plant. The red line indicates the boundary of the
facility. (500 year flood – 100 year <1 ft is the combination of the 500 year flood zone and 100 year flood zone
under one foot)
ACE Hurricane Surge Inundation Area map for the Rockport Wastewater Treatment Plant
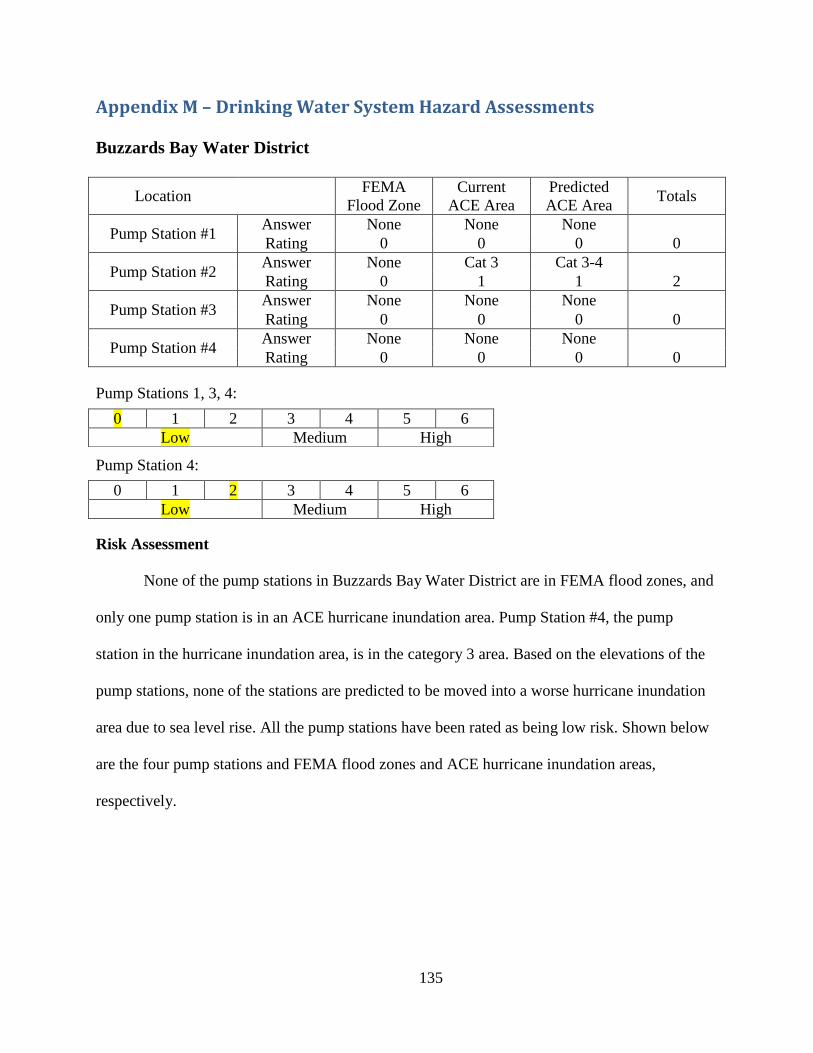
135
Appendix M – Drinking Water System Hazard Assessments
Buzzards Bay Water District
Location FEMA
Flood Zone
Current
ACE Area
Predicted
ACE Area Totals
Pump Station #1 Answer None None None
Rating 0 0 0 0
Pump Station #2 Answer None Cat 3 Cat 3-4
Rating 0 1 1 2
Pump Station #3 Answer None None None
Rating 0 0 0 0
Pump Station #4 Answer None None None
Rating 0 0 0 0
Pump Stations 1, 3, 4:
Pump Station 4:
Risk Assessment
None of the pump stations in Buzzards Bay Water District are in FEMA flood zones, and
only one pump station is in an ACE hurricane inundation area. Pump Station #4, the pump
station in the hurricane inundation area, is in the category 3 area. Based on the elevations of the
pump stations, none of the stations are predicted to be moved into a worse hurricane inundation
area due to sea level rise. All the pump stations have been rated as being low risk. Shown below
are the four pump stations and FEMA flood zones and ACE hurricane inundation areas,
respectively.
0 1 2 3 4 5 6
Low Medium High
0 1 2 3 4 5 6
Low Medium High
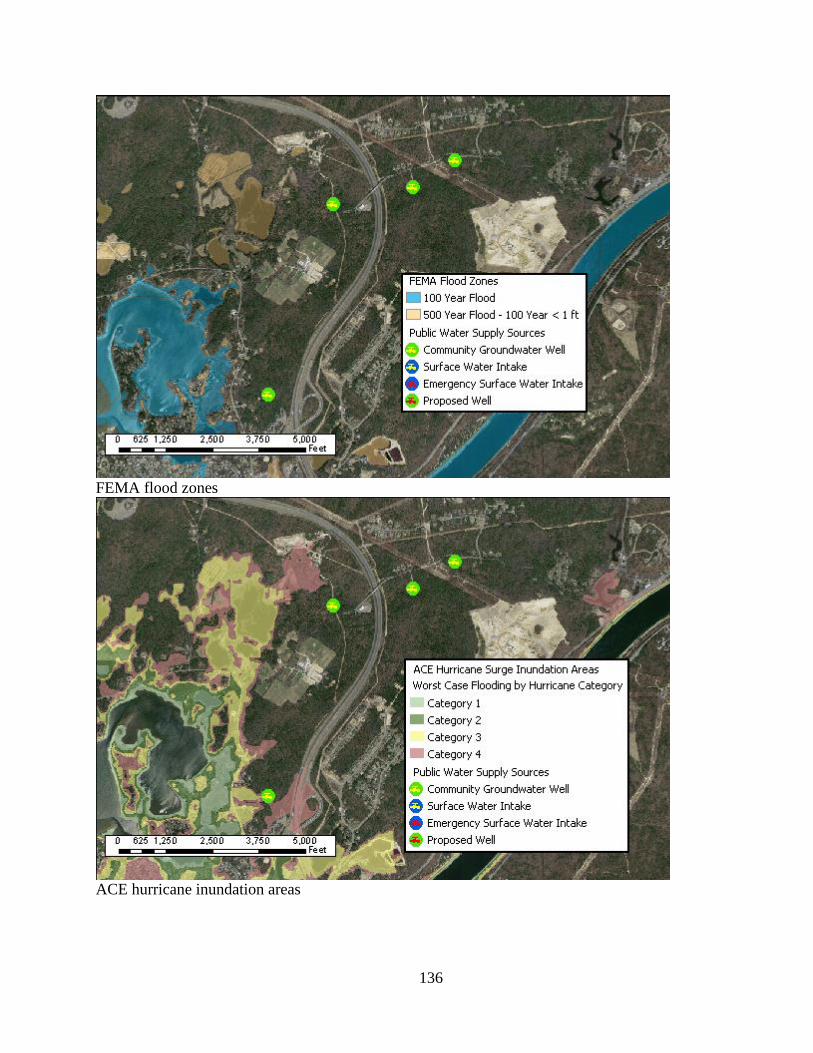
136
FEMA flood zones
ACE hurricane inundation areas

137
Buzzard Bay Water District
Location Source Pop Days Stored Totals
Buzzard Bay Water
District
Answer Ground Below
15,000
Above 3
days
Rating 0 0 0 0
Impact Assessment
The Buzzard Bay Water District received a low impact rating on our assessment because
the department gathers its water from a ground source, serves a population of less than 15,000
and has over three days worth of storage. The Buzzard Bay Water District serves a population of
7,700 in the summer and 5,830 in the winter, with an average flow rate of 0.49 million gallons
per day. The department’s storage capacity is 2 million gallons. The Buzzard Bay Water District
has the ability to store 4.1 day’s worth of water at the above average flow rate.
0 1 2 3 4 5 6
Low Medium High
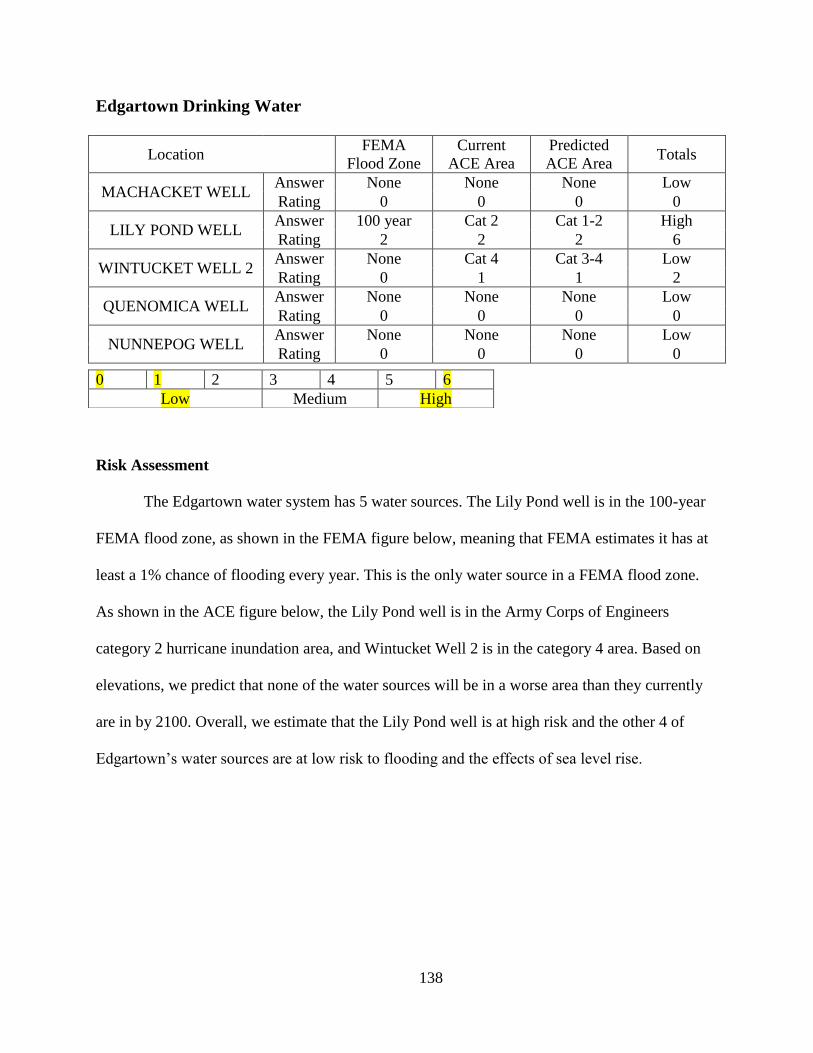
138
Edgartown Drinking Water
Location FEMA
Flood Zone
Current
ACE Area
Predicted
ACE Area Totals
MACHACKET WELL Answer None None None Low
Rating 0 0 0 0
LILY POND WELL Answer 100 year Cat 2 Cat 1-2 High
Rating 2 2 2 6
WINTUCKET WELL 2 Answer None Cat 4 Cat 3-4 Low
Rating 0 1 1 2
QUENOMICA WELL Answer None None None Low
Rating 0 0 0 0
NUNNEPOG WELL Answer None None None Low
Rating 0 0 0 0
Risk Assessment
The Edgartown water system has 5 water sources. The Lily Pond well is in the 100-year
FEMA flood zone, as shown in the FEMA figure below, meaning that FEMA estimates it has at
least a 1% chance of flooding every year. This is the only water source in a FEMA flood zone.
As shown in the ACE figure below, the Lily Pond well is in the Army Corps of Engineers
category 2 hurricane inundation area, and Wintucket Well 2 is in the category 4 area. Based on
elevations, we predict that none of the water sources will be in a worse area than they currently
are in by 2100. Overall, we estimate that the Lily Pond well is at high risk and the other 4 of
Edgartown’s water sources are at low risk to flooding and the effects of sea level rise.
0 1 2 3 4 5 6
Low Medium High
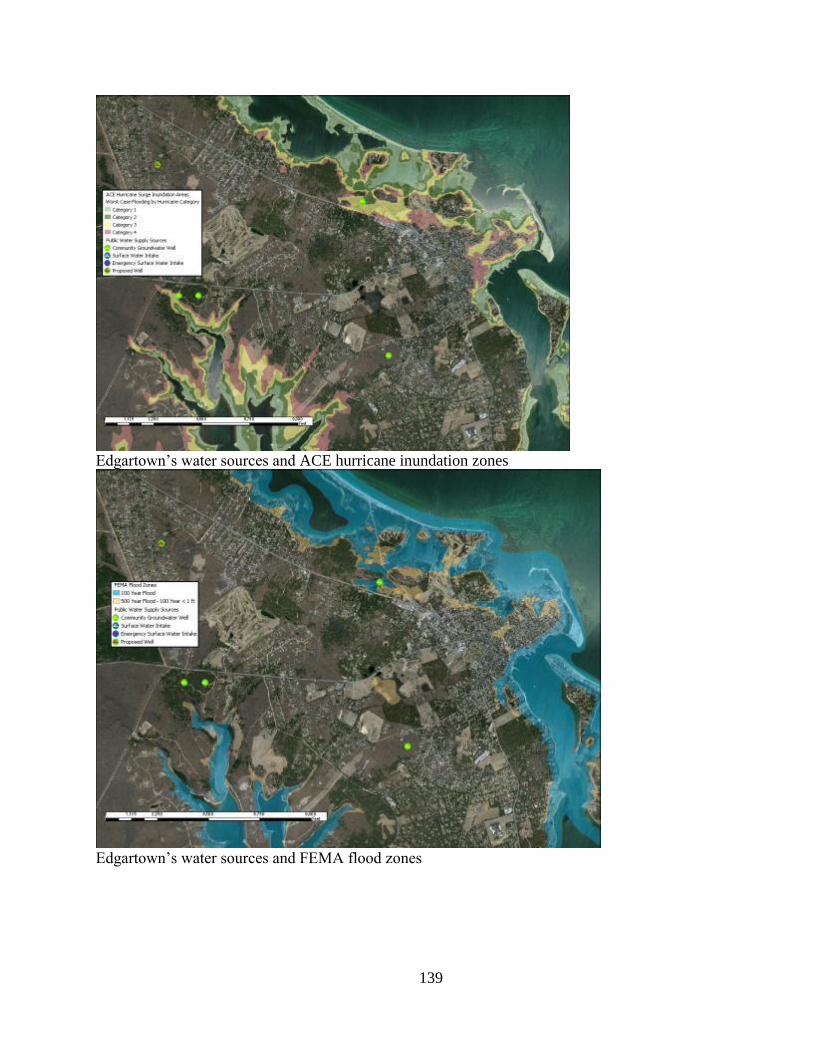
139
Edgartown’s water sources and ACE hurricane inundation zones
Edgartown’s water sources and FEMA flood zones
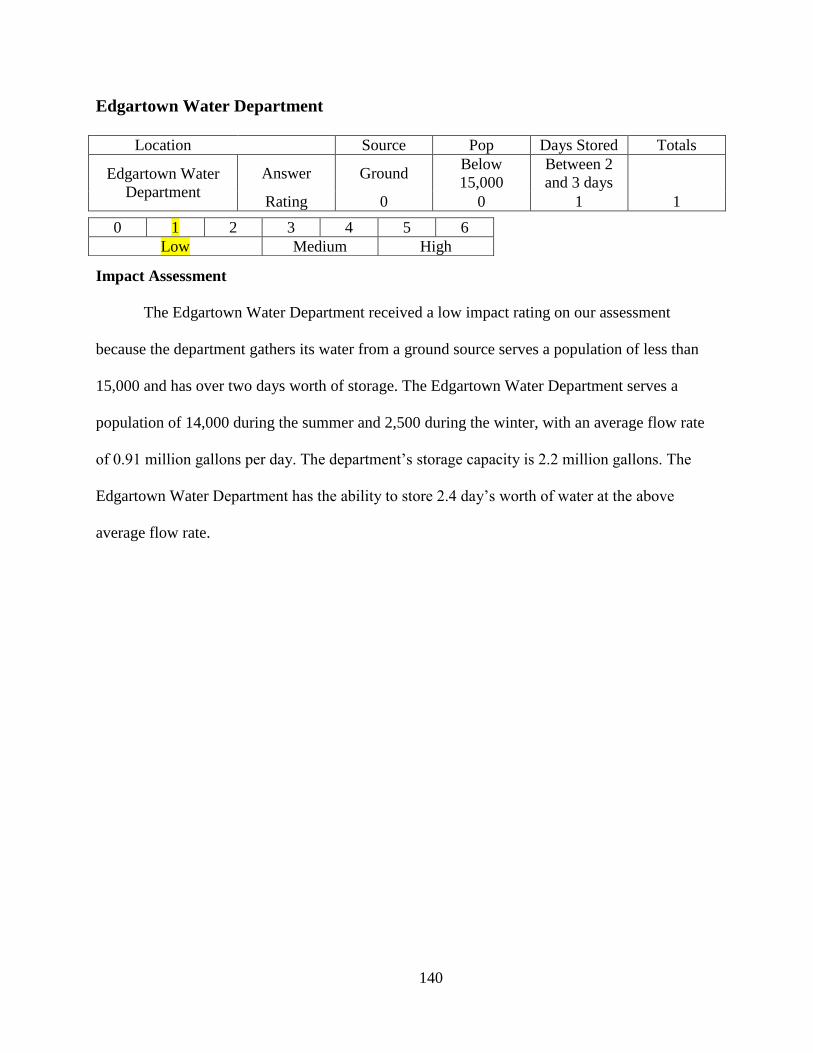
140
Edgartown Water Department
Location Source Pop Days Stored Totals
Edgartown Water
Department
Answer Ground Below
15,000
Between 2
and 3 days
Rating 0 0 1 1
Impact Assessment
The Edgartown Water Department received a low impact rating on our assessment
because the department gathers its water from a ground source serves a population of less than
15,000 and has over two days worth of storage. The Edgartown Water Department serves a
population of 14,000 during the summer and 2,500 during the winter, with an average flow rate
of 0.91 million gallons per day. The department’s storage capacity is 2.2 million gallons. The
Edgartown Water Department has the ability to store 2.4 day’s worth of water at the above
average flow rate.
0 1 2 3 4 5 6
Low Medium High
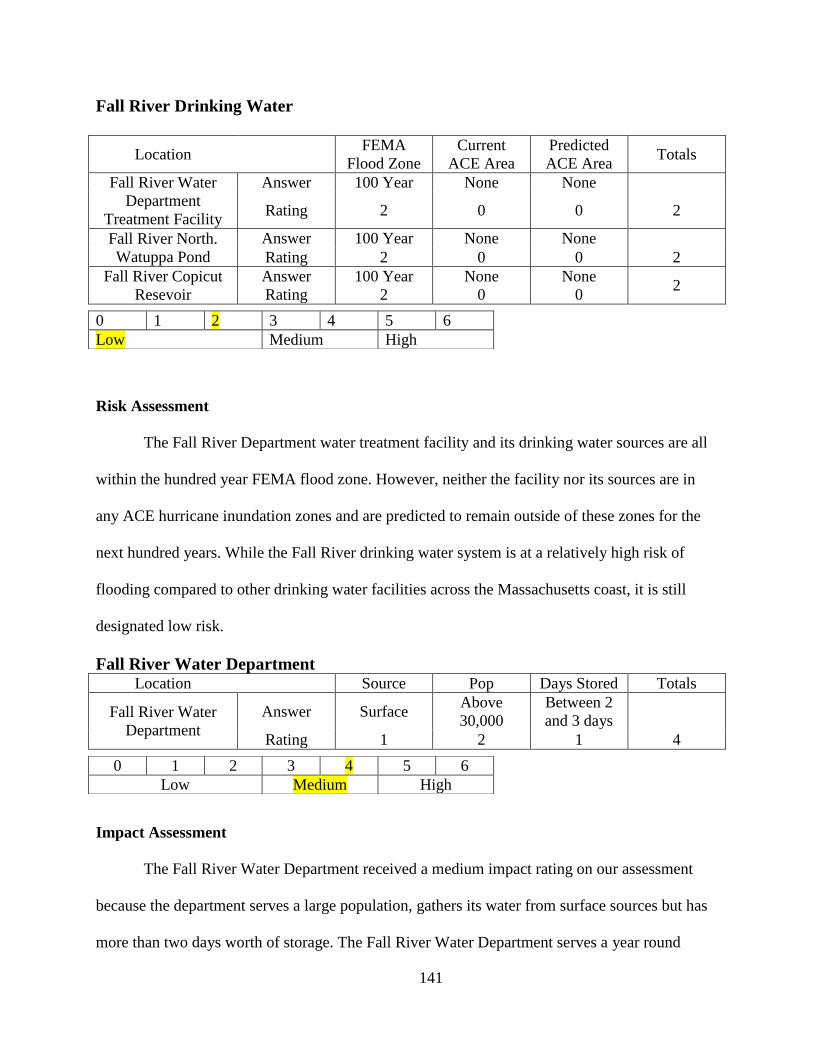
141
Fall River Drinking Water
Location FEMA
Flood Zone
Current
ACE Area
Predicted
ACE Area Totals
Fall River Water
Department
Treatment Facility
Answer 100 Year None None
Rating 2 0 0 2
Fall River North.
Watuppa Pond
Answer 100 Year None None
Rating 2 0 0 2
Fall River Copicut
Resevoir
Answer
Rating
100 Year
2
None
0
None
0 2
Risk Assessment
The Fall River Department water treatment facility and its drinking water sources are all
within the hundred year FEMA flood zone. However, neither the facility nor its sources are in
any ACE hurricane inundation zones and are predicted to remain outside of these zones for the
next hundred years. While the Fall River drinking water system is at a relatively high risk of
flooding compared to other drinking water facilities across the Massachusetts coast, it is still
designated low risk.
Fall River Water Department Location Source Pop Days Stored Totals
Fall River Water
Department
Answer Surface Above
30,000
Between 2
and 3 days
Rating 1 2 1 4
Impact Assessment
The Fall River Water Department received a medium impact rating on our assessment
because the department serves a large population, gathers its water from surface sources but has
more than two days worth of storage. The Fall River Water Department serves a year round
0 1 2 3 4 5 6
Low Medium High
0 1 2 3 4 5 6
Low Medium High

142
population of 94,000 with an average rate of 10.26 million gallons per day. The department’s
storage capacity is 25.5 million gallons. The Fall River Water Department has the ability to store
2.5 day’s worth of water at the above average flow rate.
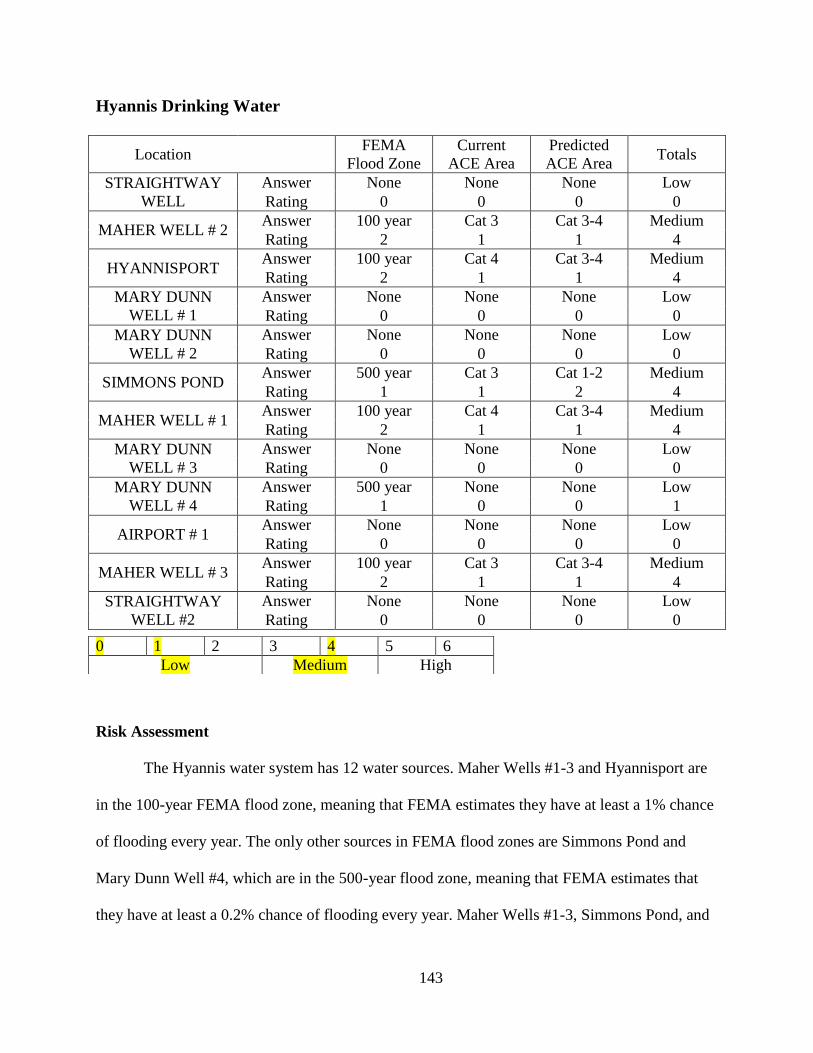
143
Hyannis Drinking Water
Location FEMA
Flood Zone
Current
ACE Area
Predicted
ACE Area Totals
STRAIGHTWAY
WELL
Answer None None None Low
Rating 0 0 0 0
MAHER WELL # 2 Answer 100 year Cat 3 Cat 3-4 Medium
Rating 2 1 1 4
HYANNISPORT Answer 100 year Cat 4 Cat 3-4 Medium
Rating 2 1 1 4
MARY DUNN
WELL # 1
Answer None None None Low
Rating 0 0 0 0
MARY DUNN
WELL # 2
Answer None None None Low
Rating 0 0 0 0
SIMMONS POND Answer 500 year Cat 3 Cat 1-2 Medium
Rating 1 1 2 4
MAHER WELL # 1 Answer 100 year Cat 4 Cat 3-4 Medium
Rating 2 1 1 4
MARY DUNN
WELL # 3
Answer None None None Low
Rating 0 0 0 0
MARY DUNN
WELL # 4
Answer 500 year None None Low
Rating 1 0 0 1
AIRPORT # 1 Answer None None None Low
Rating 0 0 0 0
MAHER WELL # 3 Answer 100 year Cat 3 Cat 3-4 Medium
Rating 2 1 1 4
STRAIGHTWAY
WELL #2
Answer None None None Low
Rating 0 0 0 0
Risk Assessment
The Hyannis water system has 12 water sources. Maher Wells #1-3 and Hyannisport are
in the 100-year FEMA flood zone, meaning that FEMA estimates they have at least a 1% chance
of flooding every year. The only other sources in FEMA flood zones are Simmons Pond and
Mary Dunn Well #4, which are in the 500-year flood zone, meaning that FEMA estimates that
they have at least a 0.2% chance of flooding every year. Maher Wells #1-3, Simmons Pond, and
0 1 2 3 4 5 6
Low Medium High
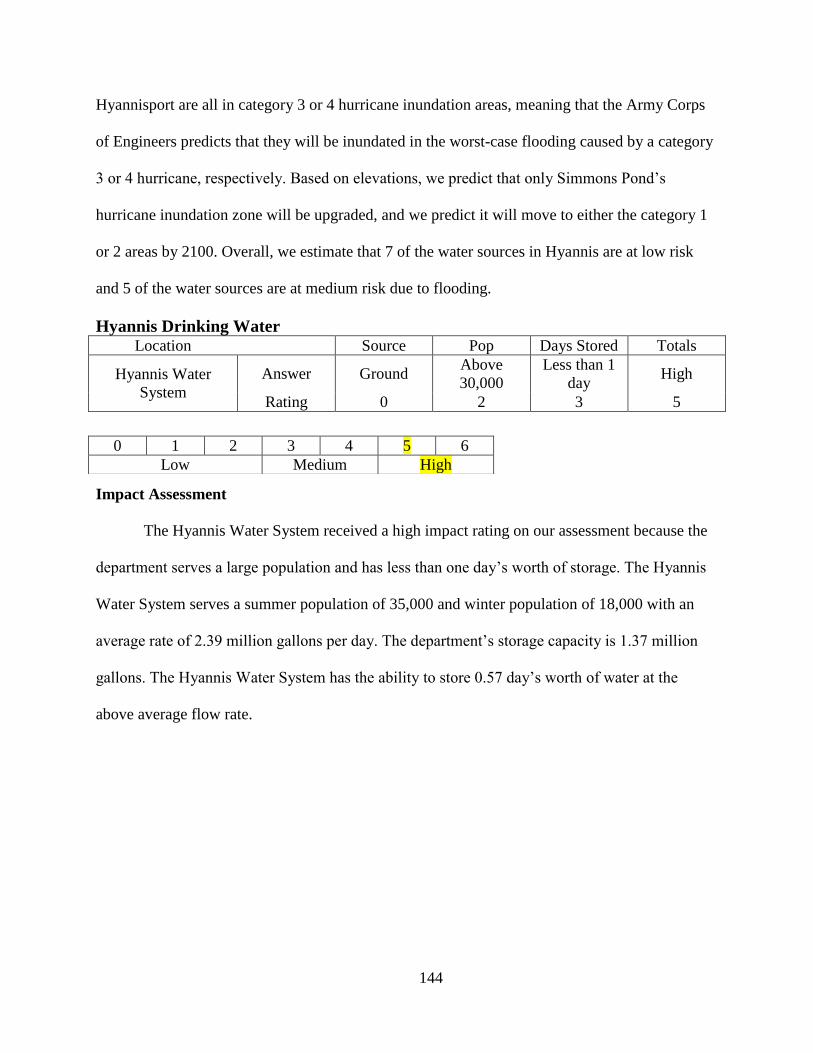
144
Hyannisport are all in category 3 or 4 hurricane inundation areas, meaning that the Army Corps
of Engineers predicts that they will be inundated in the worst-case flooding caused by a category
3 or 4 hurricane, respectively. Based on elevations, we predict that only Simmons Pond’s
hurricane inundation zone will be upgraded, and we predict it will move to either the category 1
or 2 areas by 2100. Overall, we estimate that 7 of the water sources in Hyannis are at low risk
and 5 of the water sources are at medium risk due to flooding.
Hyannis Drinking Water
Location Source Pop Days Stored Totals
Hyannis Water
System
Answer Ground Above
30,000
Less than 1
day High
Rating 0 2 3 5
Impact Assessment
The Hyannis Water System received a high impact rating on our assessment because the
department serves a large population and has less than one day’s worth of storage. The Hyannis
Water System serves a summer population of 35,000 and winter population of 18,000 with an
average rate of 2.39 million gallons per day. The department’s storage capacity is 1.37 million
gallons. The Hyannis Water System has the ability to store 0.57 day’s worth of water at the
above average flow rate.
0 1 2 3 4 5 6
Low Medium High
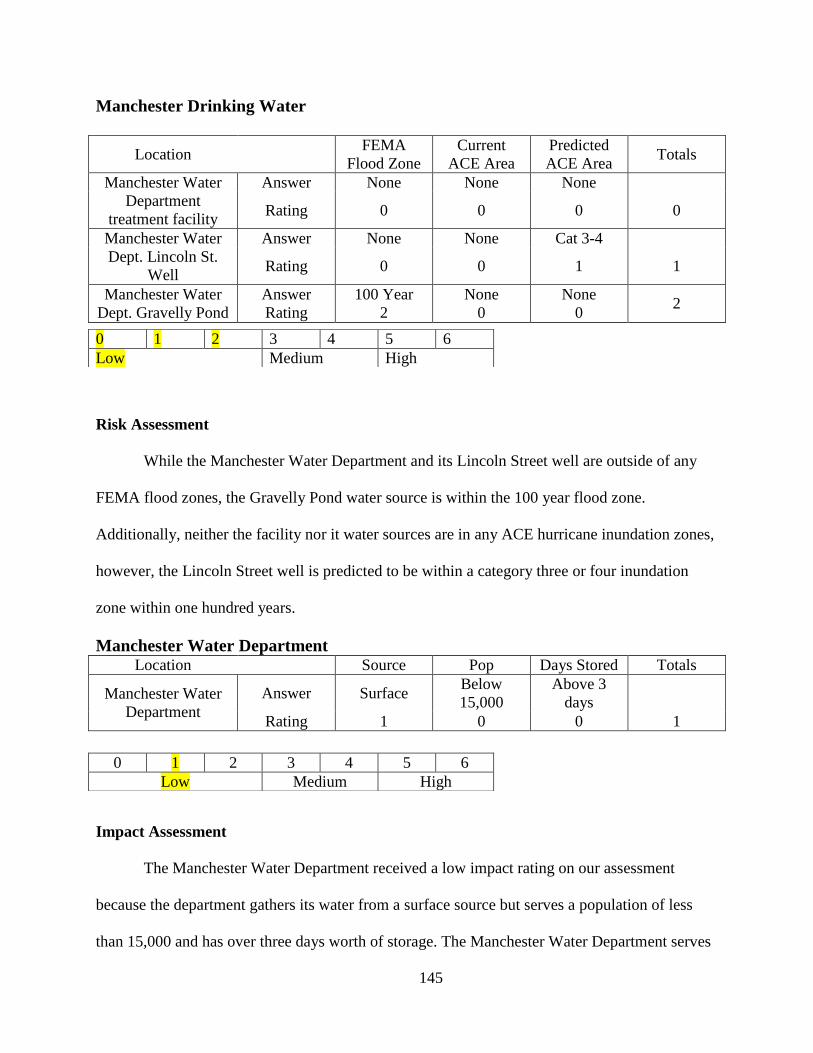
145
Manchester Drinking Water
Location FEMA
Flood Zone
Current
ACE Area
Predicted
ACE Area Totals
Manchester Water
Department
treatment facility
Answer None None None
Rating 0 0 0 0
Manchester Water
Dept. Lincoln St.
Well
Answer None None Cat 3-4
Rating 0 0 1 1
Manchester Water
Dept. Gravelly Pond
Answer
Rating
100 Year
2
None
0
None
0 2
Risk Assessment
While the Manchester Water Department and its Lincoln Street well are outside of any
FEMA flood zones, the Gravelly Pond water source is within the 100 year flood zone.
Additionally, neither the facility nor it water sources are in any ACE hurricane inundation zones,
however, the Lincoln Street well is predicted to be within a category three or four inundation
zone within one hundred years.
Manchester Water Department Location Source Pop Days Stored Totals
Manchester Water
Department
Answer Surface Below
15,000
Above 3
days
Rating 1 0 0 1
Impact Assessment
The Manchester Water Department received a low impact rating on our assessment
because the department gathers its water from a surface source but serves a population of less
than 15,000 and has over three days worth of storage. The Manchester Water Department serves
0 1 2 3 4 5 6
Low Medium High
0 1 2 3 4 5 6
Low Medium High

146
a year round population of 5,469, with an average flow rate of 0.72 million gallons per day. The
department’s storage capacity is 2.22 million gallons. The Manchester Water Department has the
ability to store 3.1 day’s worth of water at the above average flow rate.
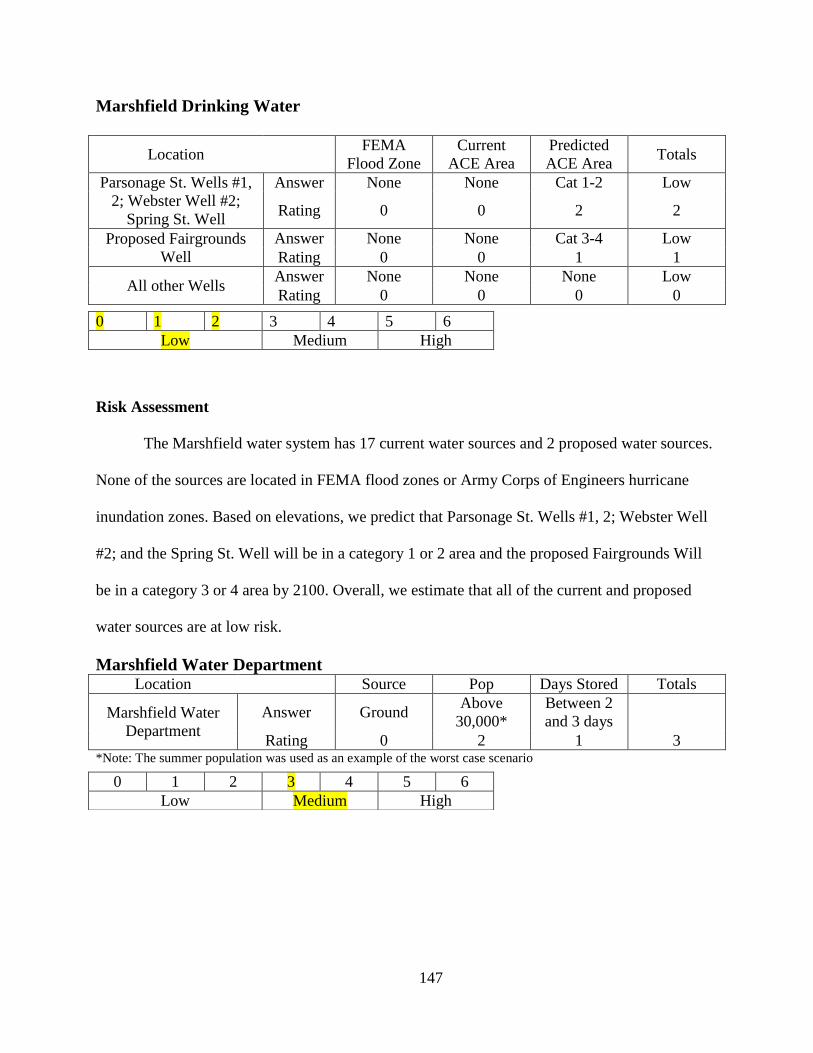
147
Marshfield Drinking Water
Location FEMA
Flood Zone
Current
ACE Area
Predicted
ACE Area Totals
Parsonage St. Wells #1,
2; Webster Well #2;
Spring St. Well
Answer None None Cat 1-2 Low
Rating 0 0 2 2
Proposed Fairgrounds
Well
Answer None None Cat 3-4 Low
Rating 0 0 1 1
All other Wells Answer None None None Low
Rating 0 0 0 0
Risk Assessment
The Marshfield water system has 17 current water sources and 2 proposed water sources.
None of the sources are located in FEMA flood zones or Army Corps of Engineers hurricane
inundation zones. Based on elevations, we predict that Parsonage St. Wells #1, 2; Webster Well
#2; and the Spring St. Well will be in a category 1 or 2 area and the proposed Fairgrounds Will
be in a category 3 or 4 area by 2100. Overall, we estimate that all of the current and proposed
water sources are at low risk.
Marshfield Water Department Location Source Pop Days Stored Totals
Marshfield Water
Department
Answer Ground Above
30,000*
Between 2
and 3 days
Rating 0 2 1 3 *Note: The summer population was used as an example of the worst case scenario
0 1 2 3 4 5 6
Low Medium High
0 1 2 3 4 5 6
Low Medium High

148
Impact Assessment
The Marshfield Water Department received a medium impact rating on our assessment
because the department gathers its water from ground sources but serves a population over
30,000 and has over two days worth of storage. The Marshfield Water Department serves a
population of 34,000 during the summer and 25,300 during the winter, with an average flow rate
of 2.54 million gallons per day. The department’s storage capacity is 5.07 million gallons. The
Marshfield Water Department has the ability to store 1.99 day’s worth of water at the above
average flow rate, which we rounded to 2 days worth for our rating purposes.
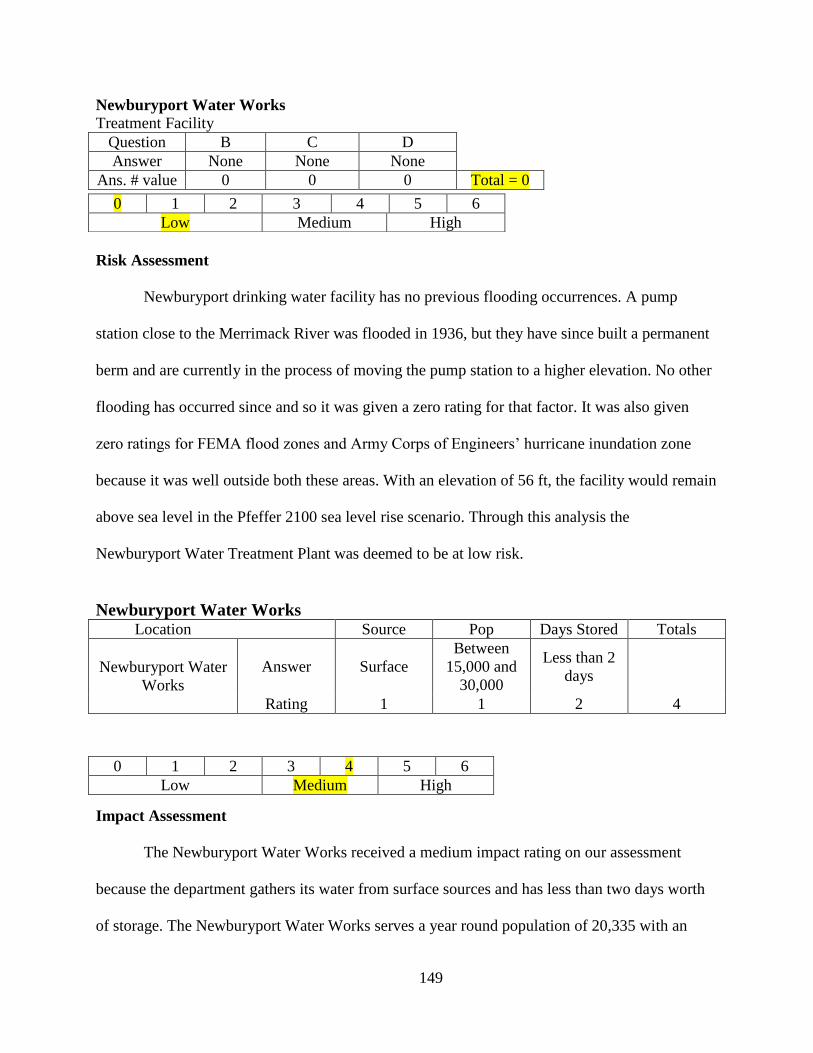
149
Newburyport Water Works
Treatment Facility
Question B C D
Answer None None None
Ans. # value 0 0 0 Total = 0
Risk Assessment
Newburyport drinking water facility has no previous flooding occurrences. A pump
station close to the Merrimack River was flooded in 1936, but they have since built a permanent
berm and are currently in the process of moving the pump station to a higher elevation. No other
flooding has occurred since and so it was given a zero rating for that factor. It was also given
zero ratings for FEMA flood zones and Army Corps of Engineers’ hurricane inundation zone
because it was well outside both these areas. With an elevation of 56 ft, the facility would remain
above sea level in the Pfeffer 2100 sea level rise scenario. Through this analysis the
Newburyport Water Treatment Plant was deemed to be at low risk.
Newburyport Water Works Location Source Pop Days Stored Totals
Newburyport Water
Works
Answer Surface
Between
15,000 and
30,000
Less than 2
days
Rating 1 1 2 4
Impact Assessment
The Newburyport Water Works received a medium impact rating on our assessment
because the department gathers its water from surface sources and has less than two days worth
of storage. The Newburyport Water Works serves a year round population of 20,335 with an
0 1 2 3 4 5 6
Low Medium High
0 1 2 3 4 5 6
Low Medium High

150
average rate of 2.04 million gallons per day. The department’s storage capacity is 2.75 million
gallons. The Newburyport Water Works has the ability to store 1.3 day’s worth of water at the
above average flow rate.

151
Oak Bluffs
Location FEMA Flood
Zone
Current ACE
Area
Predicted
ACE Area Totals
Lagoon Pond
Wellfield
Answer 100-year Cat 3-4 Cat 3-4
Rating 2 1 1 4
Farm Neck Rd.
Wellfield
Answer None None None
Rating 0 0 0 0
Well #3 State
Field
Answer None None None
Rating 0 0 0 0
Madison Alwardt
Sr. Well #4
Answer None None None
Rating 0 0 0 0
Well #5 Answer None None None
Rating 0 0 0 0
Risk Assessment
The only well that appears to be in any danger is the Lagoon Pond Wellfield. It is located
in a 100-year flood zone and a category 3 hurricane inundation zone. The hurricane zone the well
is located in is not expected to get worse based on its elevation.
Oak Bluffs Water District Location Source Pop Days Stored Totals
Oak Bluffs Water
District
Answer Ground
Between
15,000 and
30,000*
Between 2
and 3 days
Rating 0 1 1 2 *Note: The summer population was used in this rating system for a worst case scenario.
Impact Assessment
The Oak Bluffs Water District received a low impact rating on our assessment because
the department gathers its water from ground sources and at least two days worth of storage. The
0 1 2 3 4 5 6
Low Medium High
0 1 2 3 4 5 6
Low Medium High

152
Oak Bluffs Water District serves a population of 23,751 in the summer and 4,227 in the winter
with an average flow rate of 0.99 million gallons per day. The department’s storage capacity is 2
million gallons. The Oak Bluffs Water District has the ability to store 2.0 day’s worth of water at
the above average flow rate.
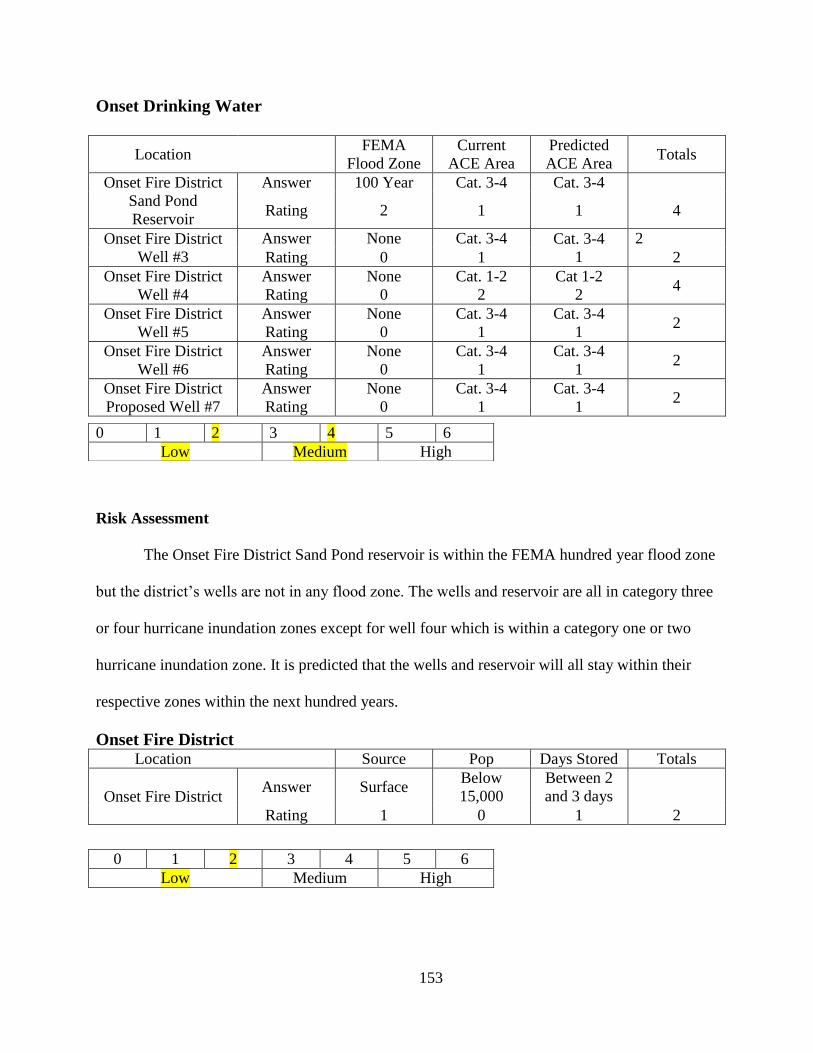
153
Onset Drinking Water
Location FEMA
Flood Zone
Current
ACE Area
Predicted
ACE Area Totals
Onset Fire District
Sand Pond
Reservoir
Answer 100 Year Cat. 3-4 Cat. 3-4
Rating 2 1 1 4
Onset Fire District
Well #3
Answer None Cat. 3-4 Cat. 3-4
1
2
Rating 0 1 2
Onset Fire District
Well #4
Answer
Rating
None
0
Cat. 1-2
2
Cat 1-2
2 4
Onset Fire District
Well #5
Answer
Rating
None
0
Cat. 3-4
1
Cat. 3-4
1 2
Onset Fire District
Well #6
Answer
Rating
None
0
Cat. 3-4
1
Cat. 3-4
1 2
Onset Fire District
Proposed Well #7
Answer
Rating
None
0
Cat. 3-4
1
Cat. 3-4
1 2
Risk Assessment
The Onset Fire District Sand Pond reservoir is within the FEMA hundred year flood zone
but the district’s wells are not in any flood zone. The wells and reservoir are all in category three
or four hurricane inundation zones except for well four which is within a category one or two
hurricane inundation zone. It is predicted that the wells and reservoir will all stay within their
respective zones within the next hundred years.
Onset Fire District Location Source Pop Days Stored Totals
Onset Fire District Answer Surface
Below
15,000
Between 2
and 3 days
Rating 1 0 1 2
0 1 2 3 4 5 6
Low Medium High
0 1 2 3 4 5 6
Low Medium High
154
Impact Assessment
The Onset Fire District received a low impact rating on our assessment because the
department gathers its water from surface sources but has at least two days worth of storage, and
a population under 15,000. The Onset Fire District serves a population of 13,975 year round with
an average flow rate of 0.6 million gallons per day. The department’s storage capacity is 1.2
million gallons. The Onset Fire District has the ability to store 2 day’s worth of water at the
above average flow rate.
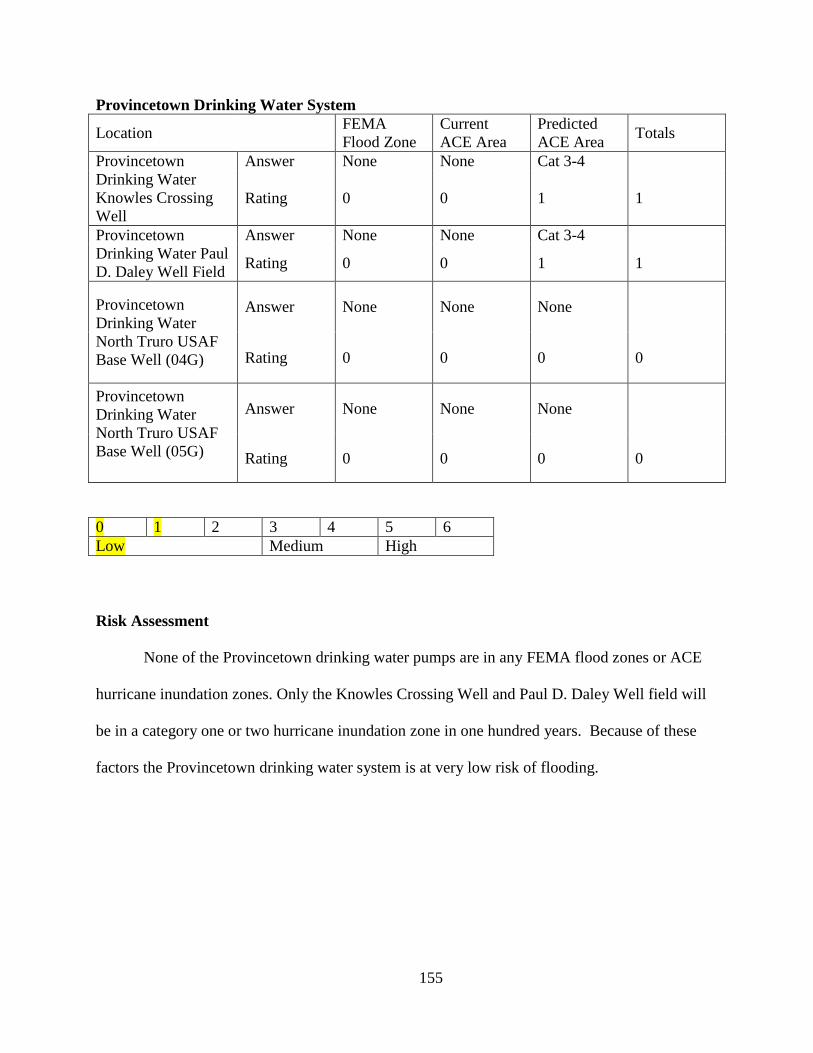
155
Provincetown Drinking Water System
Location FEMA
Flood Zone
Current
ACE Area
Predicted
ACE Area Totals
Provincetown
Drinking Water
Knowles Crossing
Well
Answer None None Cat 3-4
Rating 0 0 1 1
Provincetown
Drinking Water Paul
D. Daley Well Field
Answer None None Cat 3-4
Rating 0 0 1 1
Provincetown
Drinking Water
North Truro USAF
Base Well (04G)
Answer None None None
Rating 0 0 0 0
Provincetown
Drinking Water
North Truro USAF
Base Well (05G)
Answer None None None
Rating 0 0 0 0
Risk Assessment
None of the Provincetown drinking water pumps are in any FEMA flood zones or ACE
hurricane inundation zones. Only the Knowles Crossing Well and Paul D. Daley Well field will
be in a category one or two hurricane inundation zone in one hundred years. Because of these
factors the Provincetown drinking water system is at very low risk of flooding.
0 1 2 3 4 5 6
Low Medium High
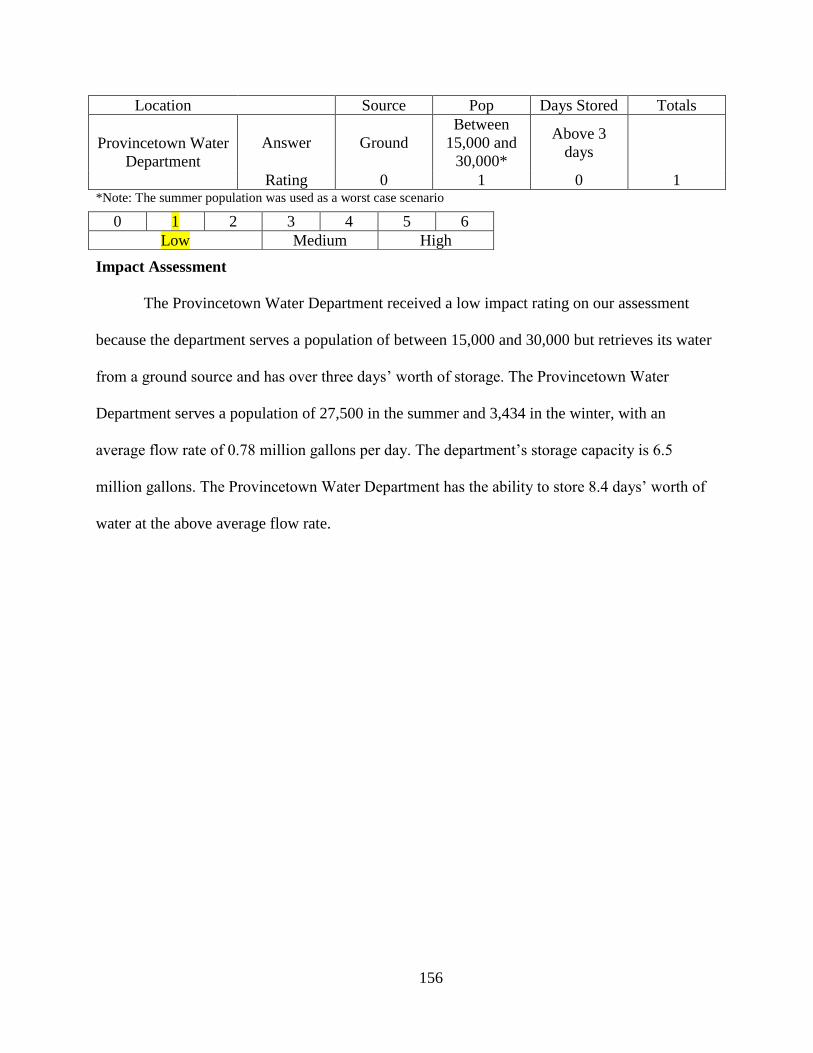
156
Location Source Pop Days Stored Totals
Provincetown Water
Department
Answer Ground
Between
15,000 and
30,000*
Above 3
days
Rating 0 1 0 1 *Note: The summer population was used as a worst case scenario
Impact Assessment
The Provincetown Water Department received a low impact rating on our assessment
because the department serves a population of between 15,000 and 30,000 but retrieves its water
from a ground source and has over three days’ worth of storage. The Provincetown Water
Department serves a population of 27,500 in the summer and 3,434 in the winter, with an
average flow rate of 0.78 million gallons per day. The department’s storage capacity is 6.5
million gallons. The Provincetown Water Department has the ability to store 8.4 days’ worth of
water at the above average flow rate.
0 1 2 3 4 5 6
Low Medium High

157
Rockport Drinking Water
Location FEMA
Flood Zone
Current
ACE Area
Predicted
ACE Area Totals
CAPE POND Answer 500 year None None
Rating 1 0 0 1
MILL BROOK
REPLACEMENT
WELLFIELD
Answer None None None
Rating 0 0 0 0
CARLSONS QUARRY
(QUARRY RES.)
Answer 500 year None None
Rating 1 0 0 1
FLAT LEDGE
QUARRY
Answer 500 year None None
Rating 1 0 0 1
Risk Assessment
The Rockport water system has 4 water sources, ignoring emergency water sources. Cape
Pond, Carlsons Quarry Reservoir, and Flat Ledge Quarry are in the 100-year FEMA flood zone,
meaning that FEMA estimates they have at least a 1% chance of flooding every year. None of
Rockport’s water sources are in any Army Corps of Engineers hurricane inundation areas. Based
on elevations, we predict that none of the water sources will be in these areas by 2100. Overall,
we estimate that all 4 of Rockport’s water sources are at low risk to flooding and the effects of
sea level rise.
0 1 2 3 4 5 6
Low Medium High
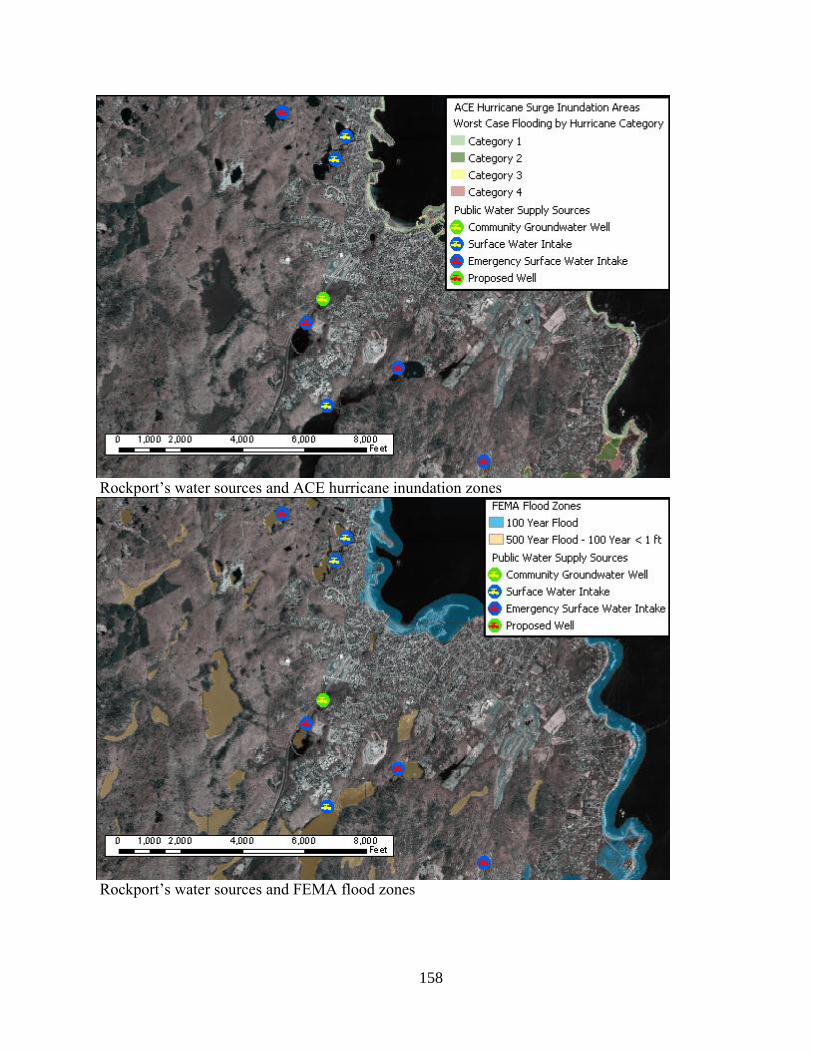
158
Rockport’s water sources and ACE hurricane inundation zones
Rockport’s water sources and FEMA flood zones
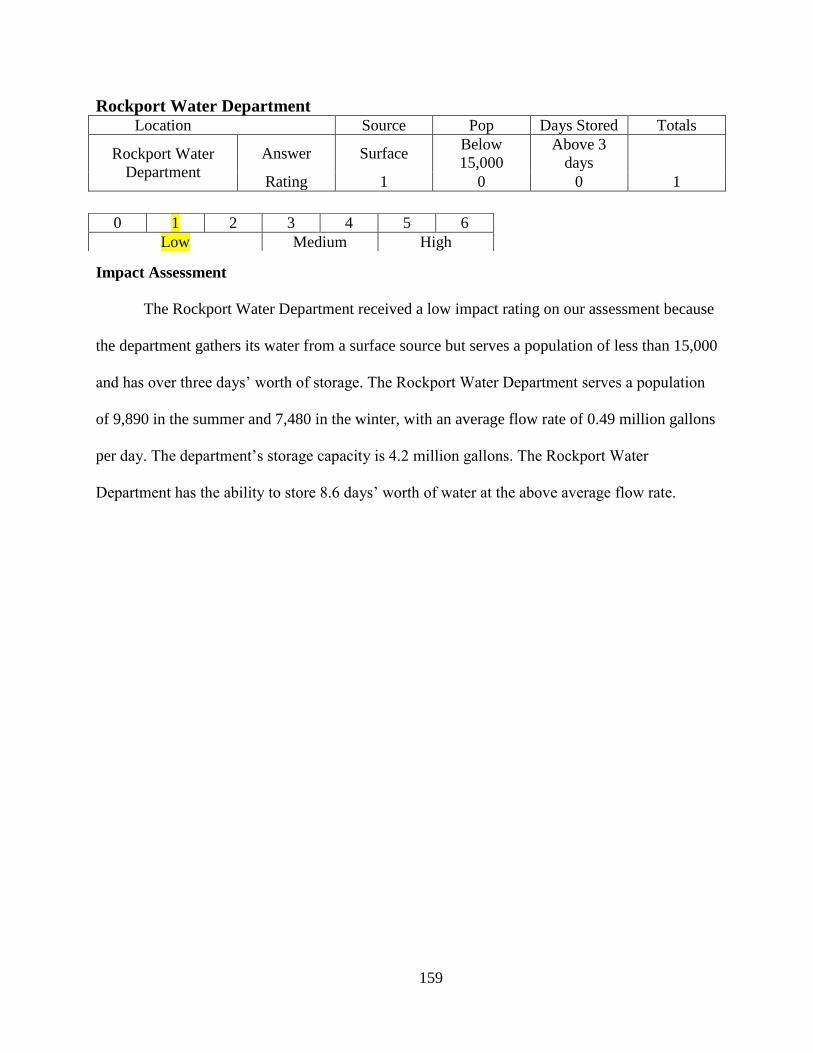
159
Rockport Water Department Location Source Pop Days Stored Totals
Rockport Water
Department
Answer Surface Below
15,000
Above 3
days
Rating 1 0 0 1
Impact Assessment
The Rockport Water Department received a low impact rating on our assessment because
the department gathers its water from a surface source but serves a population of less than 15,000
and has over three days’ worth of storage. The Rockport Water Department serves a population
of 9,890 in the summer and 7,480 in the winter, with an average flow rate of 0.49 million gallons
per day. The department’s storage capacity is 4.2 million gallons. The Rockport Water
Department has the ability to store 8.6 days’ worth of water at the above average flow rate.
0 1 2 3 4 5 6
Low Medium High

160
Somerset Drinking Water
Location FEMA
Flood Zone
Current
ACE Area
Predicted
ACE Area Totals
Somerset water
treatment facility
(Somerset
Reservoir)
Answer 100 Year Cat. 3-4 Cat 3-4
Rating 2 1 1 4
Somerset Water
Department FJM #2
well
Answer None Cat. 3-4 Cat 3-4
Rating 0 0 1 1
Risk Assessment
The Somerset Water Department treatment facility is within the FEMA hundred year
flood zone and the ACE hurricane inundation zones category three or four. The facility’s well is
not in any FEMA flood zone or ACE hurricane inundation zone but is predicted to be within a
category three or four hurricane inundation zone within the next hundred years. While the water
department’s well is at low risk, the facility that treats Somerset’s drinking water is at medium
risk.
Location Source Pop Days Stored Totals
Somerset Water
Department
Answer Surface
Between
15,000 and
30,000
Less than 2
days
Rating 1 1 2 4
Impact Assessment
The Somerset Water Department received a medium impact rating on our assessment
because the department gathers its water from surface sources and has less than two days’ worth
of storage. The Somerset Water Department serves a year round population of 19,638 with an
0 1 2 3 4 5 6
Low Medium High
0 1 2 3 4 5 6
Low Medium High
161
average flow rate of 2.9 million gallons per day. The department’s storage capacity is 5.02
million gallons. The Somerset Water Department has the ability to store 1.7 days’ worth of water
at the above average flow rate.
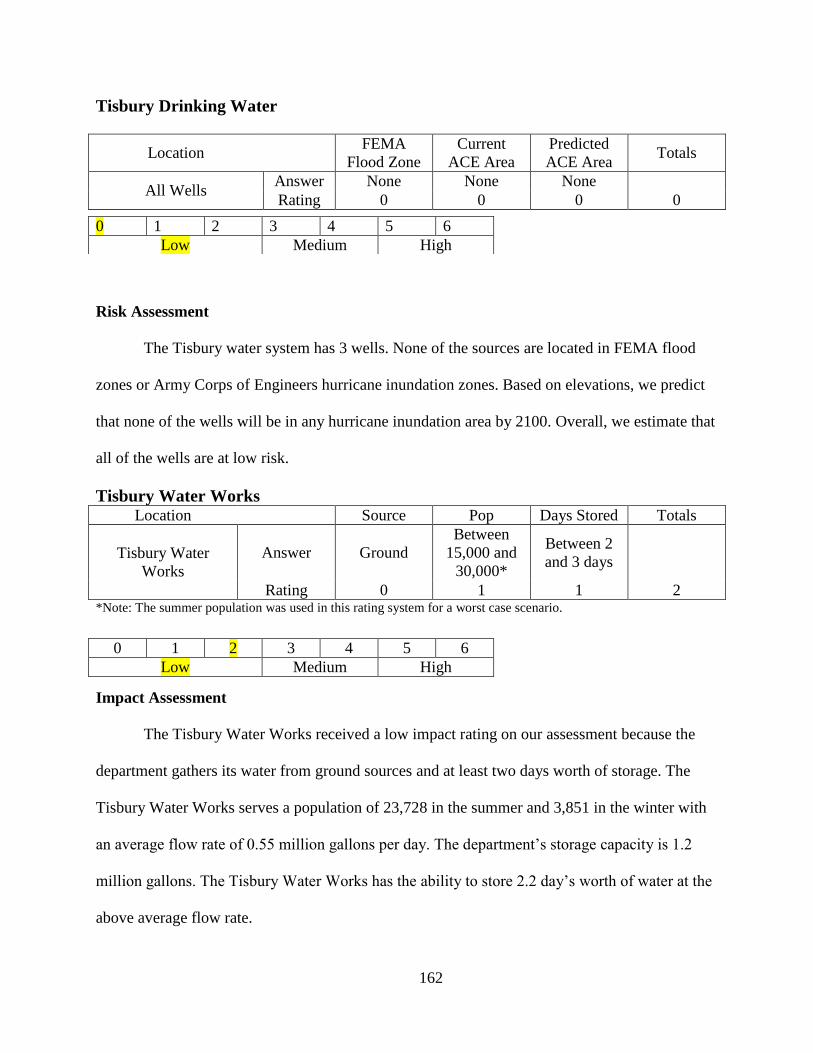
162
Tisbury Drinking Water
Location FEMA
Flood Zone
Current
ACE Area
Predicted
ACE Area Totals
All Wells Answer None None None
Rating 0 0 0 0
Risk Assessment
The Tisbury water system has 3 wells. None of the sources are located in FEMA flood
zones or Army Corps of Engineers hurricane inundation zones. Based on elevations, we predict
that none of the wells will be in any hurricane inundation area by 2100. Overall, we estimate that
all of the wells are at low risk.
Tisbury Water Works Location Source Pop Days Stored Totals
Tisbury Water
Works
Answer Ground
Between
15,000 and
30,000*
Between 2
and 3 days
Rating 0 1 1 2 *Note: The summer population was used in this rating system for a worst case scenario.
Impact Assessment
The Tisbury Water Works received a low impact rating on our assessment because the
department gathers its water from ground sources and at least two days worth of storage. The
Tisbury Water Works serves a population of 23,728 in the summer and 3,851 in the winter with
an average flow rate of 0.55 million gallons per day. The department’s storage capacity is 1.2
million gallons. The Tisbury Water Works has the ability to store 2.2 day’s worth of water at the
above average flow rate.
0 1 2 3 4 5 6
Low Medium High
0 1 2 3 4 5 6
Low Medium High
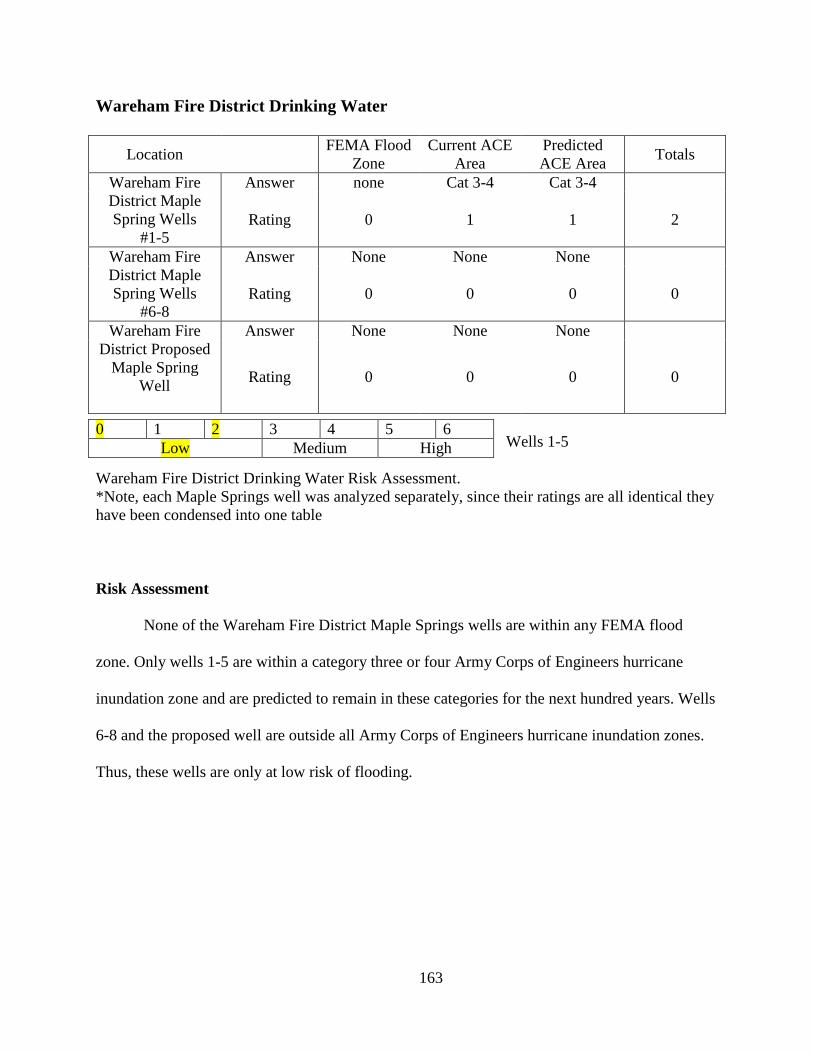
163
Wareham Fire District Drinking Water
Location FEMA Flood
Zone
Current ACE
Area
Predicted
ACE Area Totals
Wareham Fire
District Maple
Spring Wells
#1-5
Answer none Cat 3-4 Cat 3-4
Rating 0 1 1 2
Wareham Fire
District Maple
Spring Wells
#6-8
Answer None None None
Rating 0 0 0 0
Wareham Fire
District Proposed
Maple Spring
Well
Answer None None None
Rating 0 0 0 0
Wells 1-5
Wareham Fire District Drinking Water Risk Assessment.
*Note, each Maple Springs well was analyzed separately, since their ratings are all identical they
have been condensed into one table
Risk Assessment
None of the Wareham Fire District Maple Springs wells are within any FEMA flood
zone. Only wells 1-5 are within a category three or four Army Corps of Engineers hurricane
inundation zone and are predicted to remain in these categories for the next hundred years. Wells
6-8 and the proposed well are outside all Army Corps of Engineers hurricane inundation zones.
Thus, these wells are only at low risk of flooding.
0 1 2 3 4 5 6
Low Medium High
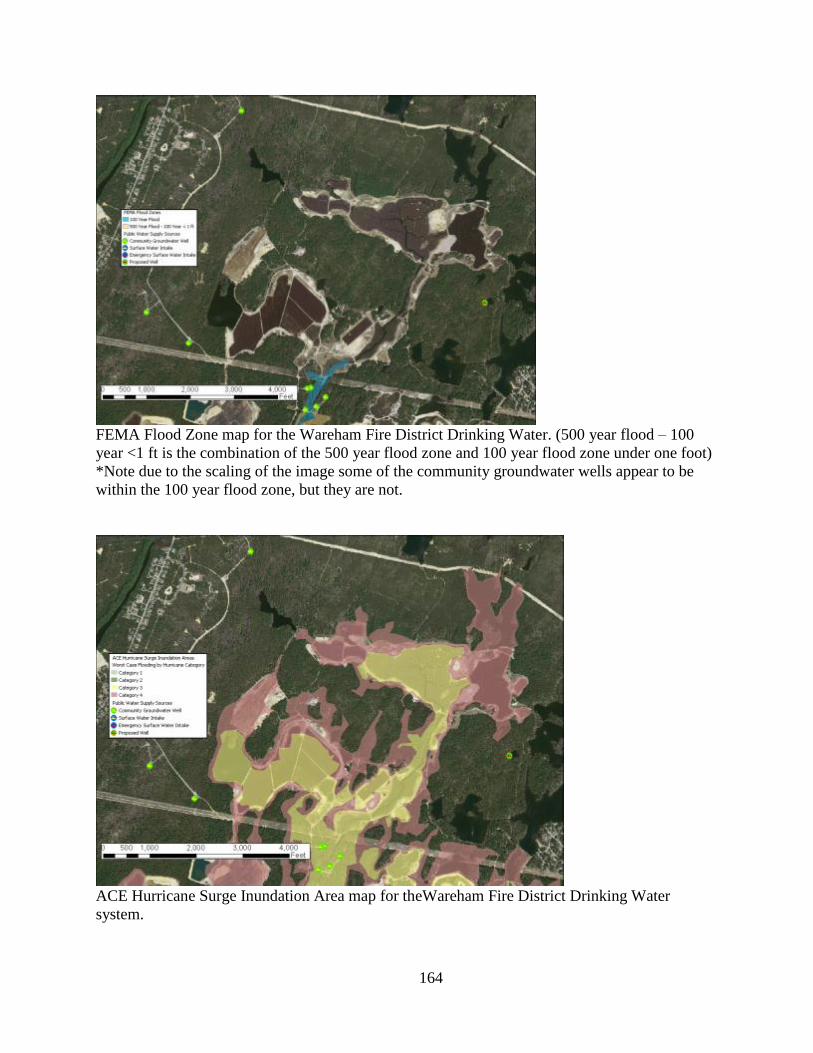
164
FEMA Flood Zone map for the Wareham Fire District Drinking Water. (500 year flood – 100
year <1 ft is the combination of the 500 year flood zone and 100 year flood zone under one foot)
*Note due to the scaling of the image some of the community groundwater wells appear to be
within the 100 year flood zone, but they are not.
ACE Hurricane Surge Inundation Area map for theWareham Fire District Drinking Water
system.
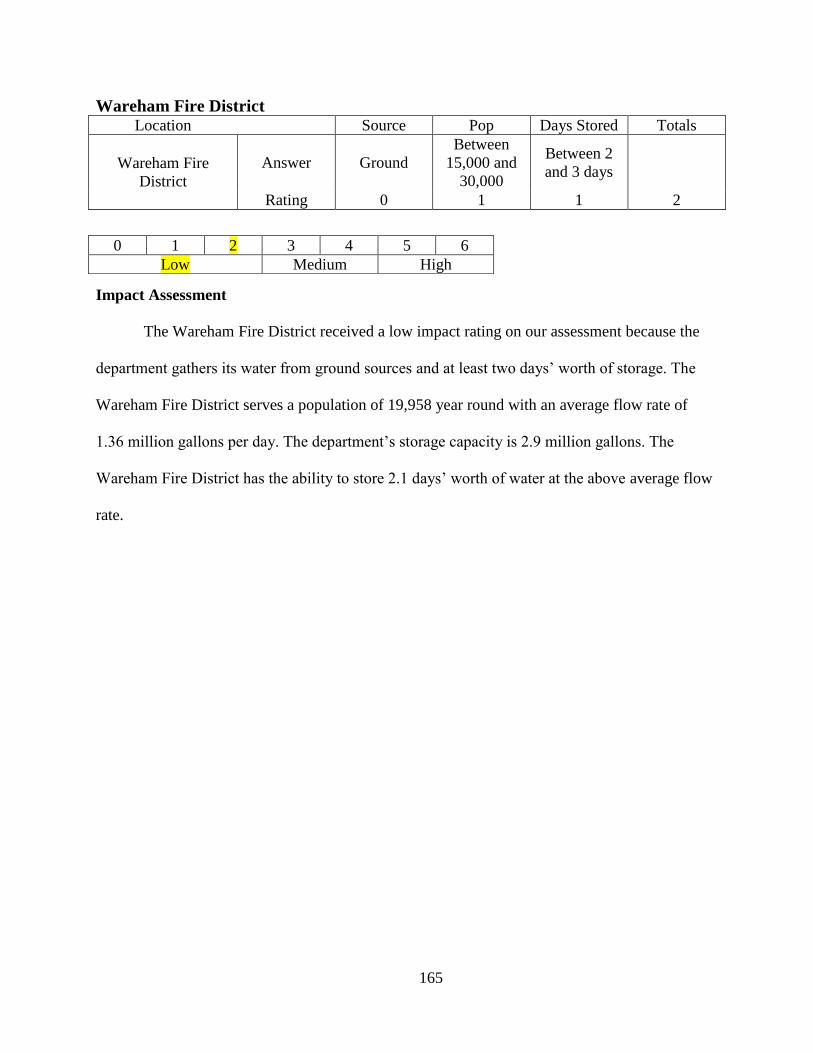
165
Wareham Fire District Location Source Pop Days Stored Totals
Wareham Fire
District
Answer Ground
Between
15,000 and
30,000
Between 2
and 3 days
Rating 0 1 1 2
Impact Assessment
The Wareham Fire District received a low impact rating on our assessment because the
department gathers its water from ground sources and at least two days’ worth of storage. The
Wareham Fire District serves a population of 19,958 year round with an average flow rate of
1.36 million gallons per day. The department’s storage capacity is 2.9 million gallons. The
Wareham Fire District has the ability to store 2.1 days’ worth of water at the above average flow
rate.
0 1 2 3 4 5 6
Low Medium High
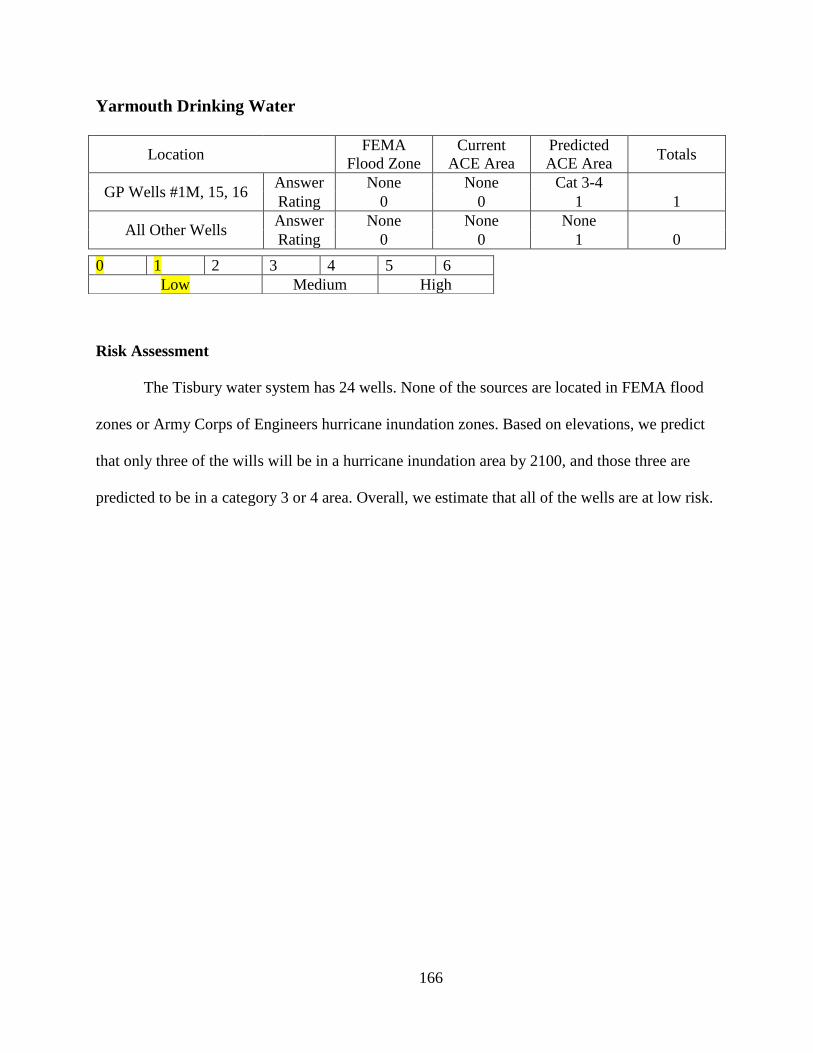
166
Yarmouth Drinking Water
Location FEMA
Flood Zone
Current
ACE Area
Predicted
ACE Area Totals
GP Wells #1M, 15, 16 Answer None None Cat 3-4
Rating 0 0 1 1
All Other Wells Answer None None None
Rating 0 0 1 0
Risk Assessment
The Tisbury water system has 24 wells. None of the sources are located in FEMA flood
zones or Army Corps of Engineers hurricane inundation zones. Based on elevations, we predict
that only three of the wills will be in a hurricane inundation area by 2100, and those three are
predicted to be in a category 3 or 4 area. Overall, we estimate that all of the wells are at low risk.
0 1 2 3 4 5 6
Low Medium High
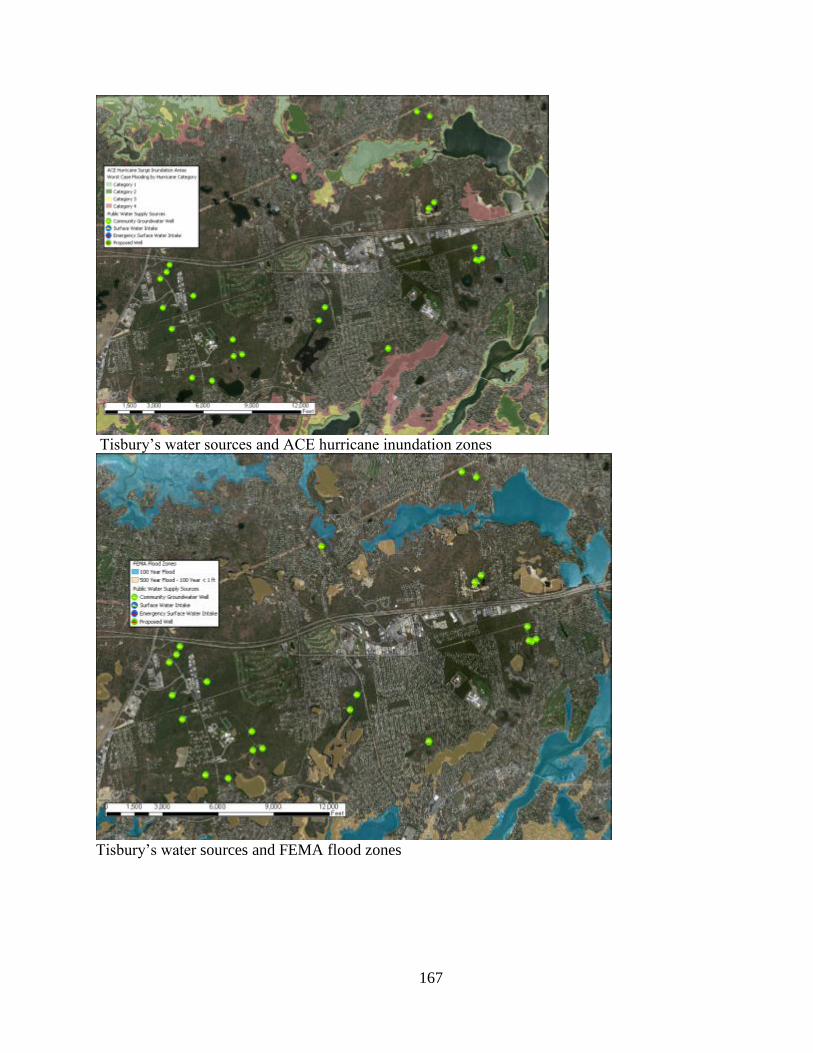
167
Tisbury’s water sources and ACE hurricane inundation zones
Tisbury’s water sources and FEMA flood zones
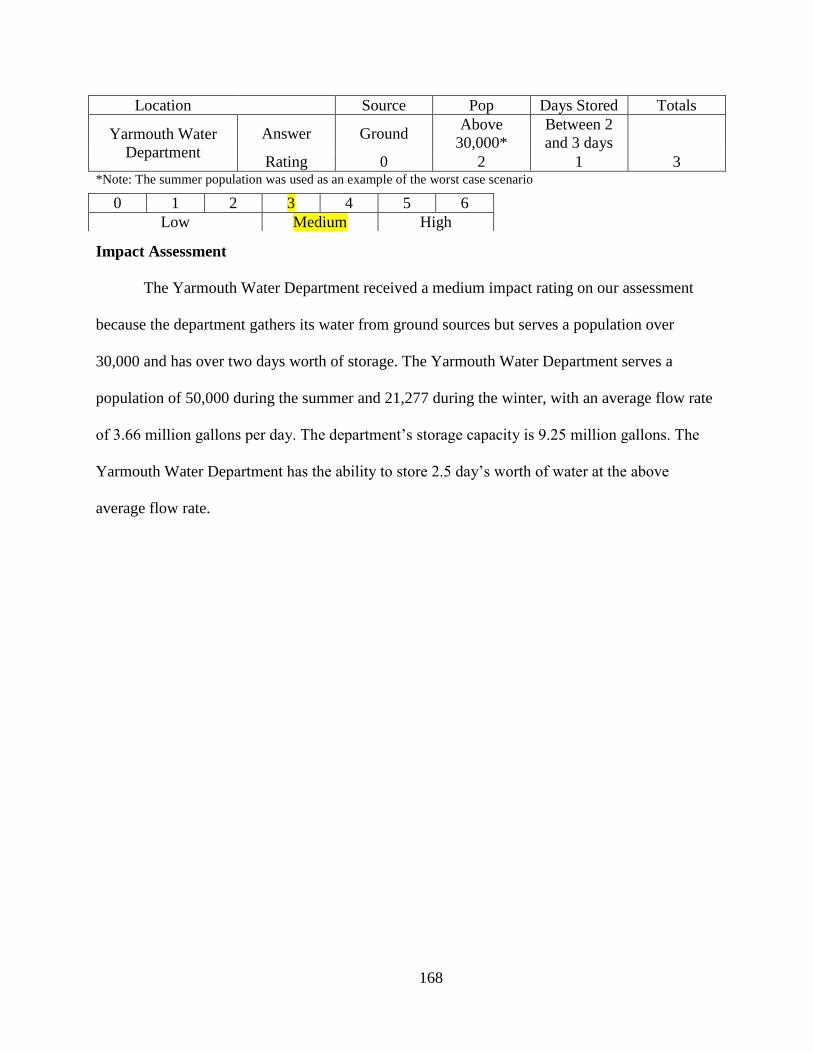
168
Location Source Pop Days Stored Totals
Yarmouth Water
Department
Answer Ground Above
30,000*
Between 2
and 3 days
Rating 0 2 1 3 *Note: The summer population was used as an example of the worst case scenario
Impact Assessment
The Yarmouth Water Department received a medium impact rating on our assessment
because the department gathers its water from ground sources but serves a population over
30,000 and has over two days worth of storage. The Yarmouth Water Department serves a
population of 50,000 during the summer and 21,277 during the winter, with an average flow rate
of 3.66 million gallons per day. The department’s storage capacity is 9.25 million gallons. The
Yarmouth Water Department has the ability to store 2.5 day’s worth of water at the above
average flow rate.
0 1 2 3 4 5 6
Low Medium High
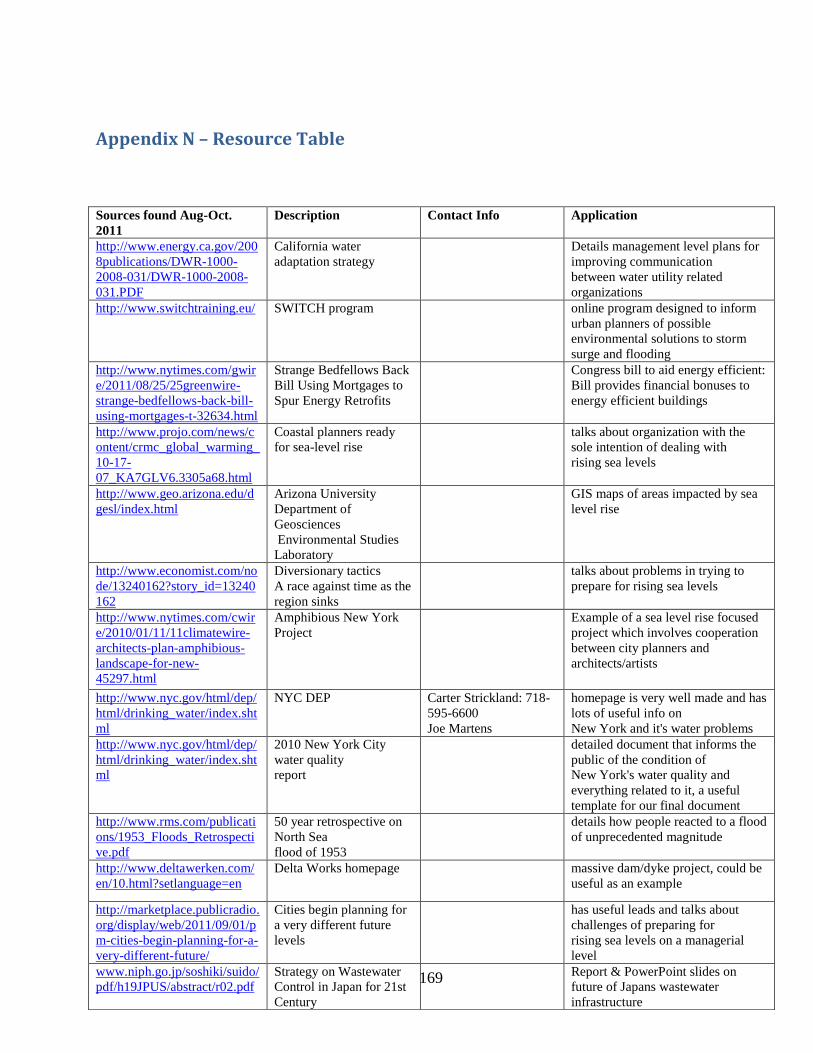
169
Appendix N – Resource Table
Sources found Aug-Oct.
2011
Description Contact Info Application
http://www.energy.ca.gov/200
8publications/DWR-1000-
2008-031/DWR-1000-2008-
031.PDF
California water
adaptation strategy Details management level plans for
improving communication
between water utility related
organizations
http://www.switchtraining.eu/ SWITCH program online program designed to inform
urban planners of possible
environmental solutions to storm
surge and flooding
http://www.nytimes.com/gwir
e/2011/08/25/25greenwire-
strange-bedfellows-back-bill-
using-mortgages-t-32634.html
Strange Bedfellows Back
Bill Using Mortgages to
Spur Energy Retrofits
Congress bill to aid energy efficient:
Bill provides financial bonuses to
energy efficient buildings
http://www.projo.com/news/c
ontent/crmc_global_warming_
10-17-
07_KA7GLV6.3305a68.html
Coastal planners ready
for sea-level rise
talks about organization with the
sole intention of dealing with
rising sea levels
http://www.geo.arizona.edu/d
gesl/index.html
Arizona University
Department of
Geosciences
Environmental Studies
Laboratory
GIS maps of areas impacted by sea
level rise
http://www.economist.com/no
de/13240162?story_id=13240
162
Diversionary tactics
A race against time as the
region sinks
talks about problems in trying to
prepare for rising sea levels
http://www.nytimes.com/cwir
e/2010/01/11/11climatewire-
architects-plan-amphibious-
landscape-for-new-
45297.html
Amphibious New York
Project
Example of a sea level rise focused
project which involves cooperation
between city planners and
architects/artists
http://www.nyc.gov/html/dep/
html/drinking_water/index.sht
ml
NYC DEP Carter Strickland: 718-
595-6600
Joe Martens
homepage is very well made and has
lots of useful info on
New York and it's water problems
http://www.nyc.gov/html/dep/
html/drinking_water/index.sht
ml
2010 New York City
water quality
report
detailed document that informs the
public of the condition of
New York's water quality and
everything related to it, a useful
template for our final document
http://www.rms.com/publicati
ons/1953_Floods_Retrospecti
ve.pdf
50 year retrospective on
North Sea
flood of 1953
details how people reacted to a flood
of unprecedented magnitude
http://www.deltawerken.com/
en/10.html?setlanguage=en
Delta Works homepage massive dam/dyke project, could be
useful as an example
http://marketplace.publicradio.
org/display/web/2011/09/01/p
m-cities-begin-planning-for-a-
very-different-future/
Cities begin planning for
a very different future
levels
has useful leads and talks about
challenges of preparing for
rising sea levels on a managerial
level
www.niph.go.jp/soshiki/suido/
pdf/h19JPUS/abstract/r02.pdf
Strategy on Wastewater
Control in Japan for 21st
Century
Report & PowerPoint slides on
future of Japans wastewater
infrastructure
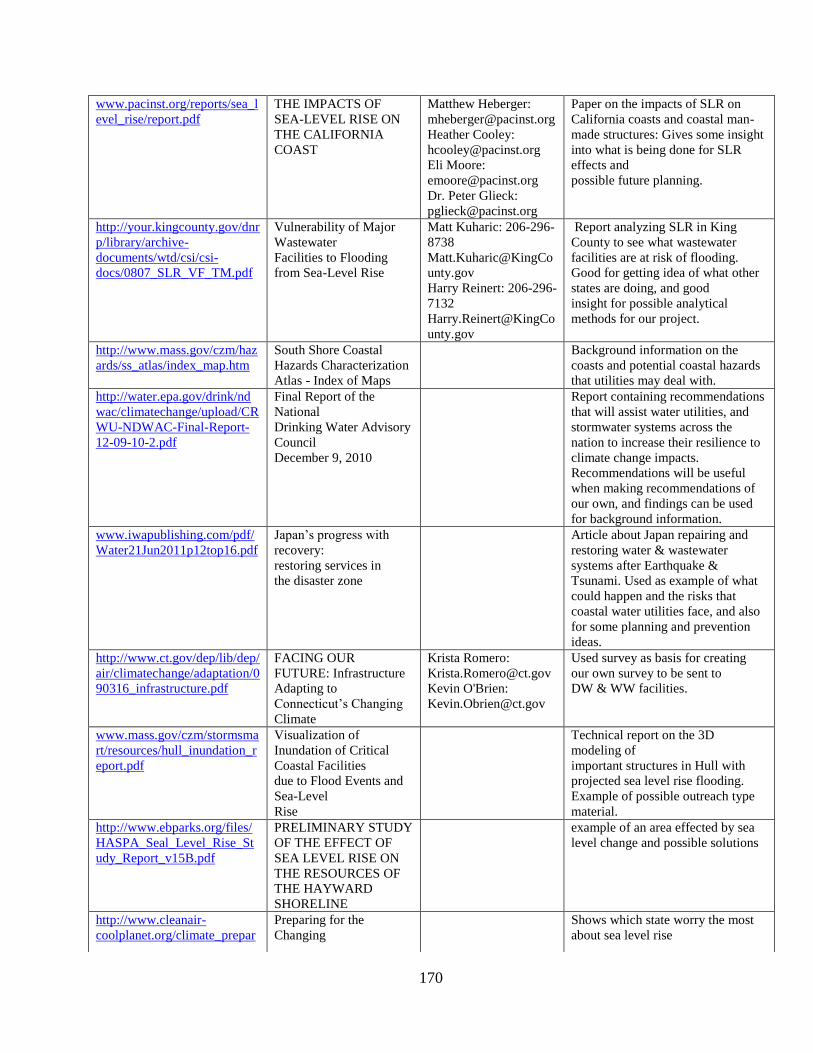
170
www.pacinst.org/reports/sea_l
evel_rise/report.pdf
THE IMPACTS OF
SEA-LEVEL RISE ON
THE CALIFORNIA
COAST
Matthew Heberger:
Heather Cooley:
Eli Moore:
Dr. Peter Glieck:
Paper on the impacts of SLR on
California coasts and coastal man-
made structures: Gives some insight
into what is being done for SLR
effects and
possible future planning.
http://your.kingcounty.gov/dnr
p/library/archive-
documents/wtd/csi/csi-
docs/0807_SLR_VF_TM.pdf
Vulnerability of Major
Wastewater
Facilities to Flooding
from Sea-Level Rise
Matt Kuharic: 206-296-
8738
Matt.Kuharic@KingCo
unty.gov
Harry Reinert: 206-296-
7132
Harry.Reinert@KingCo
unty.gov
Report analyzing SLR in King
County to see what wastewater
facilities are at risk of flooding.
Good for getting idea of what other
states are doing, and good
insight for possible analytical
methods for our project.
http://www.mass.gov/czm/haz
ards/ss_atlas/index_map.htm
South Shore Coastal
Hazards Characterization
Atlas - Index of Maps
Background information on the
coasts and potential coastal hazards
that utilities may deal with.
http://water.epa.gov/drink/nd
wac/climatechange/upload/CR
WU-NDWAC-Final-Report-
12-09-10-2.pdf
Final Report of the
National
Drinking Water Advisory
Council
December 9, 2010
Report containing recommendations
that will assist water utilities, and
stormwater systems across the
nation to increase their resilience to
climate change impacts.
Recommendations will be useful
when making recommendations of
our own, and findings can be used
for background information.
www.iwapublishing.com/pdf/
Water21Jun2011p12top16.pdf
Japan’s progress with
recovery:
restoring services in
the disaster zone
Article about Japan repairing and
restoring water & wastewater
systems after Earthquake &
Tsunami. Used as example of what
could happen and the risks that
coastal water utilities face, and also
for some planning and prevention
ideas.
http://www.ct.gov/dep/lib/dep/
air/climatechange/adaptation/0
90316_infrastructure.pdf
FACING OUR
FUTURE: Infrastructure
Adapting to
Connecticut’s Changing
Climate
Krista Romero:
Kevin O'Brien:
Used survey as basis for creating
our own survey to be sent to
DW & WW facilities.
www.mass.gov/czm/stormsma
rt/resources/hull_inundation_r
eport.pdf
Visualization of
Inundation of Critical
Coastal Facilities
due to Flood Events and
Sea-Level
Rise
Technical report on the 3D
modeling of
important structures in Hull with
projected sea level rise flooding.
Example of possible outreach type
material.
http://www.ebparks.org/files/
HASPA_Seal_Level_Rise_St
udy_Report_v15B.pdf
PRELIMINARY STUDY
OF THE EFFECT OF
SEA LEVEL RISE ON
THE RESOURCES OF
THE HAYWARD
SHORELINE
example of an area effected by sea
level change and possible solutions
http://www.cleanair-
coolplanet.org/climate_prepar
Preparing for the
Changing
Shows which state worry the most
about sea level rise

171
edness/NortheastAssessment2
011.pdf
Climate: A Northeast-
Focused Needs
Assessment
http://www.amwa.net/galleries
/climate-
change/AMWA_Climate_Cha
nge_Paper_12.13.07.pdf
Implications of Climate
Change for Urban Water
Utilities
Discusses effects climate change
related change such as saltwater
intrusion
http://morristowngreen.com/2
011/08/29/close-call-at-
morris-township-sewage-
treatment-plant-during-irene-
storm/
Close call at Morris
Township sewage
treatment plant during
Irene storm
Example of what happens when a
facility is flooded and forced to by-
pass
http://www.newstimes.com/ne
ws/article/Irene-s-rains-could-
overwhelm-treatment-plants-
2144405.php
Irene’s rain could
overwhelm treatment
plants
Example of what happens when a
facility is flooded and forced to by-
pass
http://www.gazette.net/article/
20110828/NEWS/799999773/
1029/1029/sewage-overflows-
stopped-at-prince-george-
8217-s-water-
treatment&template=gazette
Sewage overflows
stopped at Prince
George’s water-treatment
plants
Example of what happens when a
facility is flooded and forced to by-
pass
http://millburn.patch.com/artic
les/dont-drink-the-water-2
Don't Drink the Water Example of what might happen to a
community when a facility is
flooded, and the water cannot be
fully treated
http://nashvillecitypaper.com/
content/city-news/metro-still-
calculating-cost-flood-
damage-infrastructure
Metro still calculating
cost of flood damage to
infrastructure
Shows an example of how much a
flooded facility can cost to fix, by
using Nashville as an example
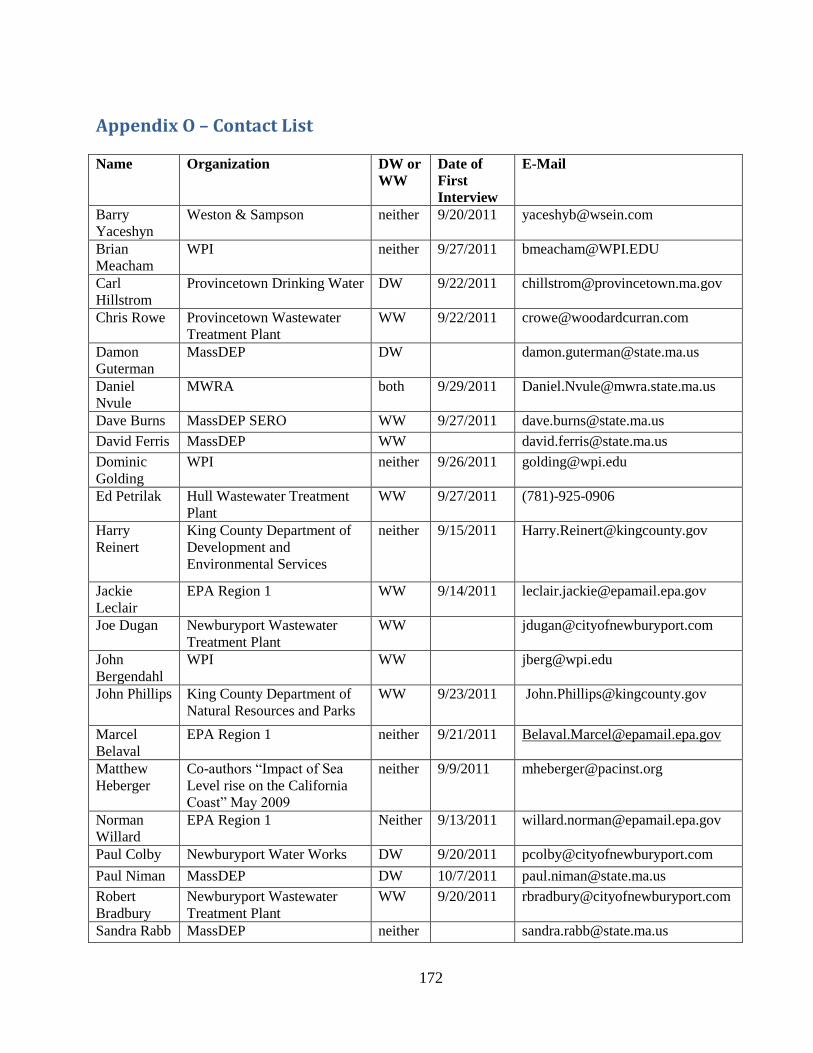
172
Appendix O – Contact List
Name Organization DW or
WW
Date of
First
Interview
Barry
Yaceshyn
Weston & Sampson neither 9/20/2011 [email protected]
Brian
Meacham
WPI neither 9/27/2011 [email protected]
Carl
Hillstrom
Provincetown Drinking Water DW 9/22/2011 [email protected]
Chris Rowe Provincetown Wastewater
Treatment Plant
WW 9/22/2011 [email protected]
Damon
Guterman
MassDEP DW [email protected]
Daniel
Nvule
MWRA both 9/29/2011 [email protected]
Dave Burns MassDEP SERO WW 9/27/2011 [email protected]
David Ferris MassDEP WW [email protected]
Dominic
Golding
WPI neither 9/26/2011 [email protected]
Ed Petrilak Hull Wastewater Treatment
Plant
WW 9/27/2011 (781)-925-0906
Harry
Reinert
King County Department of
Development and
Environmental Services
neither 9/15/2011 [email protected]
Jackie
Leclair
EPA Region 1 WW 9/14/2011 [email protected]
Joe Dugan Newburyport Wastewater
Treatment Plant
John
Bergendahl
WPI WW [email protected]
John Phillips King County Department of
Natural Resources and Parks
WW 9/23/2011 [email protected]
Marcel
Belaval
EPA Region 1 neither 9/21/2011 [email protected]
Matthew
Heberger
Co-authors “Impact of Sea
Level rise on the California
Coast” May 2009
neither 9/9/2011 [email protected]
Norman
Willard
EPA Region 1 Neither 9/13/2011 [email protected]
Paul Colby Newburyport Water Works DW 9/20/2011 [email protected]
Paul Niman MassDEP DW 10/7/2011 [email protected]
Robert
Bradbury
Newburyport Wastewater
Treatment Plant
WW 9/20/2011 [email protected]
Sandra Rabb MassDEP neither [email protected]

173
Seth Tuler WPI neither [email protected]
Steve Estes-
smargassi
MWRA both 9/29/2011 Stephen.Estes-
**Those with no date were contacted multiple times though the duration of our project