Effects of Sampling in IMRT Optimization by Ronald L. Rardin Professor of Industrial Engineering...
24
Effects of Sampling in IMRT Optimization by Ronald L. Rardin Professor of Industrial Engineering Purdue University West Lafayette, Indiana, USA Caesarea Rothschild Institute, University of Haifa, June 2004
-
Upload
frank-lewis -
Category
Documents
-
view
259 -
download
0
Transcript of Effects of Sampling in IMRT Optimization by Ronald L. Rardin Professor of Industrial Engineering...
Effects of Sampling in IMRT Optimization
by Ronald L. RardinProfessor of Industrial Engineering
Purdue UniversityWest Lafayette, Indiana, USA
Caesarea Rothschild Institute, University of Haifa, June 2004

Acknowledgments• Our work at Purdue involves an inter-
disciplinary team (of 10-15) spanning– Indiana University School of Medicine– Purdue University College of Engineering– Advanced Process Combinatorics (an optimization
software firm)
• Dr. Mark Langer = our inspiration & medical mentor
• Students Felisa Preciado-Walters & Sushma Sukumaran did the computation reported here
• Sponsored in part by National Science Foundation 0120145, National Cancer Institute 1R41CA91688-01, and Indiana 21st Century Fund 830010403

External Beam Radiation Therapy
• Delivered by an accelerator that can rotate 360 degrees around the patient to treat a target at the isocenter from multiple angles
• Implemented with a Multi-Leaf Collimator varying opening during delivery time

Choices for Beamlet Intensities
Accel
erat
or
Acc
eler
ato
r
Intensity Map
(Profile)
Segments(Apertures)
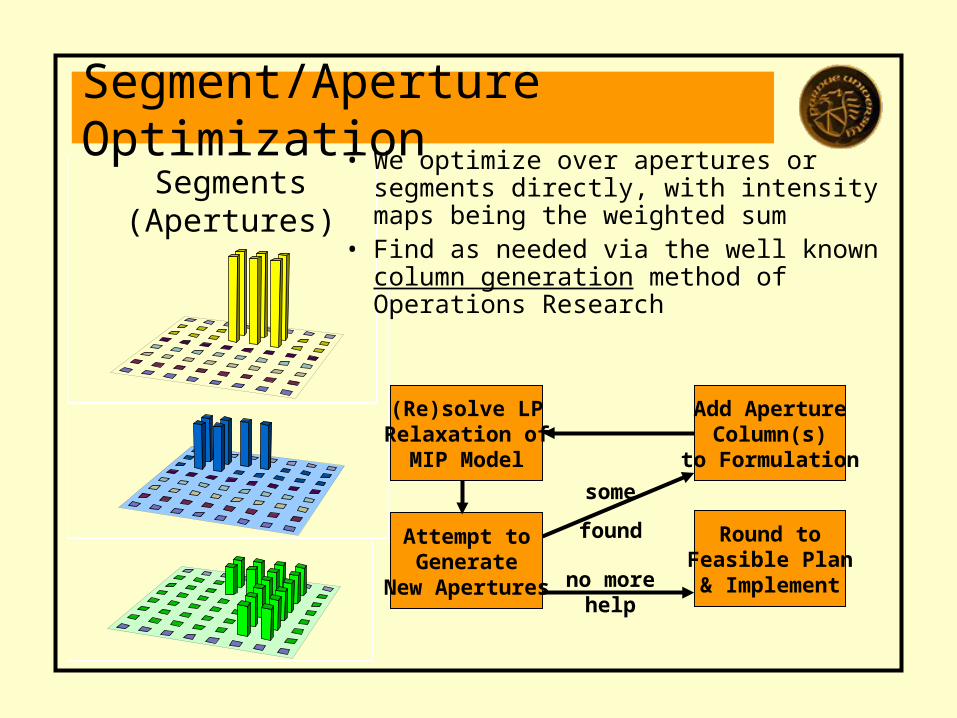
Segment/Aperture Optimization• We optimize over apertures or
segments directly, with intensity maps being the weighted sum
• Find as needed via the well known column generation method of Operations Research
(Re)solve LPRelaxation of
MIP Model
Attempt toGenerate
New Apertures no more help
Round toFeasible Plan& Implement
Add ApertureColumn(s)
to Formulation
some
found
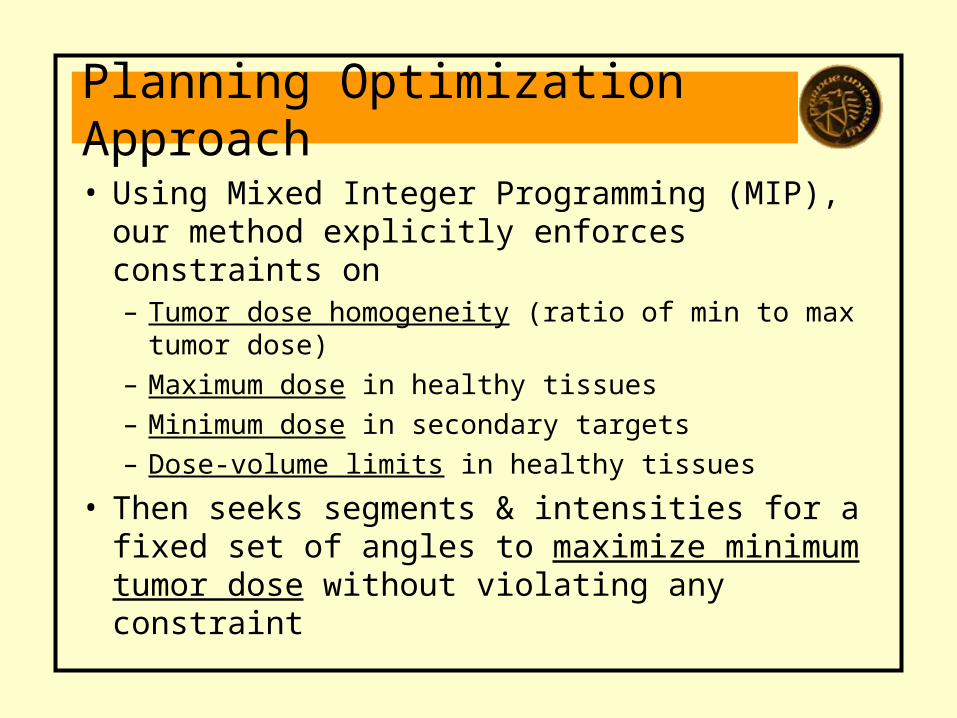
Planning Optimization Approach• Using Mixed Integer Programming (MIP),
our method explicitly enforces constraints on– Tumor dose homogeneity (ratio of min to max
tumor dose)– Maximum dose in healthy tissues– Minimum dose in secondary targets– Dose-volume limits in healthy tissues
• Then seeks segments & intensities for a fixed set of angles to maximize minimum tumor dose without violating any constraint
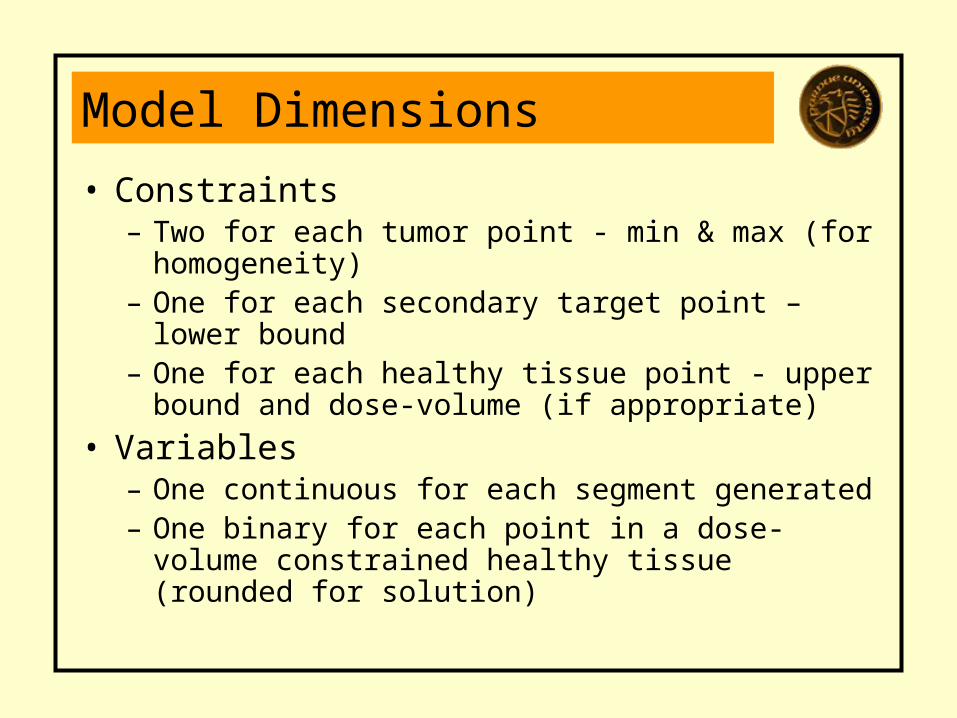
Model Dimensions
• Constraints – Two for each tumor point - min & max (for
homogeneity)– One for each secondary target point – lower
bound– One for each healthy tissue point - upper
bound and dose-volume (if appropriate)
• Variables– One continuous for each segment generated– One binary for each point in a dose-volume
constrained healthy tissue (rounded for solution)
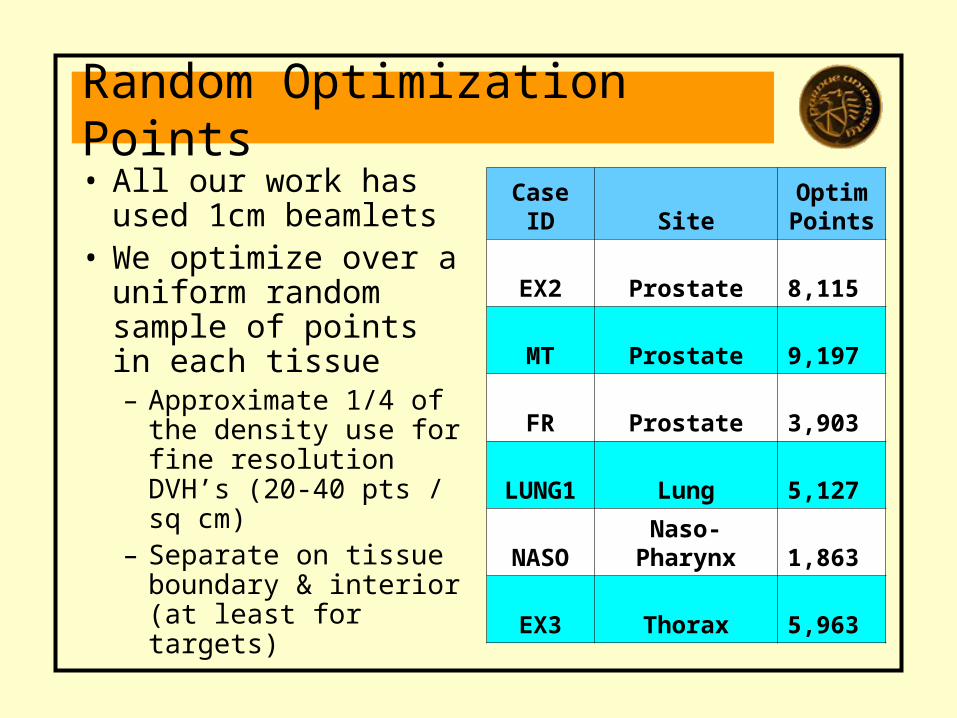
Random Optimization Points• All our work has
used 1cm beamlets• We optimize over a
uniform random sample of points in each tissue– Approximate 1/4 of
the density use for fine resolution DVH’s (20-40 pts / sq cm)
– Separate on tissue boundary & interior (at least for targets)
Case ID SiteOptimPoints
EX2 Prostate 8,115
MT Prostate 9,197
FR Prostate 3,903
LUNG1 Lung 5,127
NASO Naso-Pharynx 1,863
EX3 Thorax 5,963
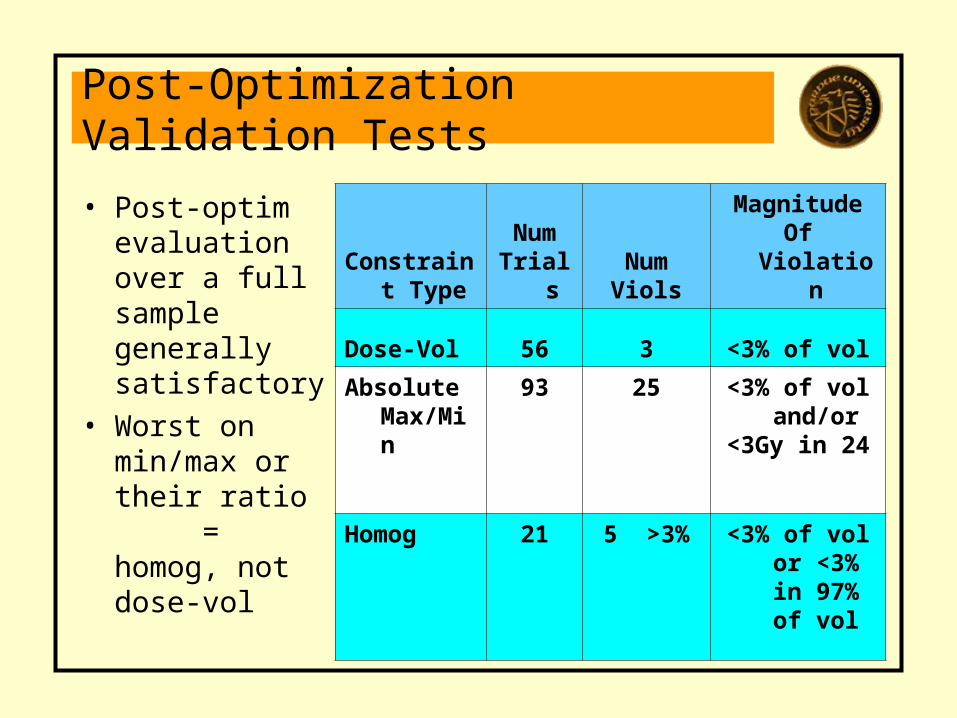
Post-Optimization Validation Tests
• Post-optim evaluation over a full sample generally satisfactory
• Worst on min/max or their ratio = homog, not dose-vol
Constraint Type
NumTrials
NumViols
MagnitudeOf Violation
Dose-Vol 56 3 <3% of vol
Absolute Max/Min
93 25 <3% of vol and/or
<3Gy in 24
Homog 21 5 >3% <3% of vol or <3% in
97% of vol

Speed vs. Accuracy Tradeoff
Figure D3 . Solution Time and Quality Effects of Point Density
( prostate case)
0
50
100
150
Half Base Double
MTD
(Gy)
010203040
CP
U (m
in) Computed
MTD
Actual MTD
CPU Time
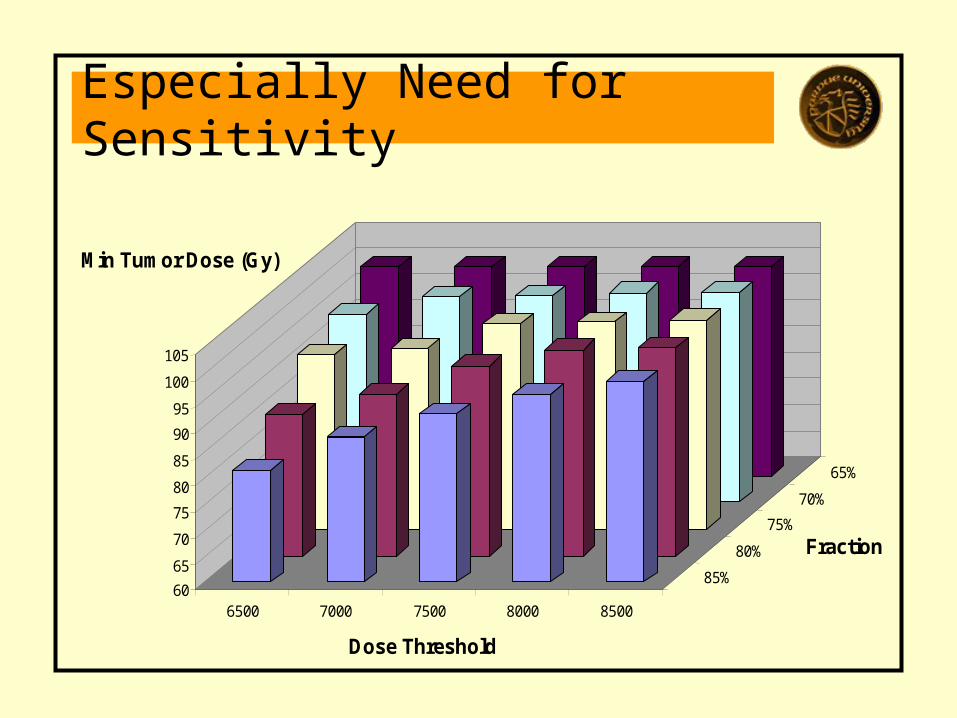
Especially Need for Sensitivity
60
65
70
75
80
85
90
95
100
105
Min Tumor Dose (Gy)
6500 7000 7500 8000 8500
85%
80%
75%
70%
65%
Dose Threshold
Fraction
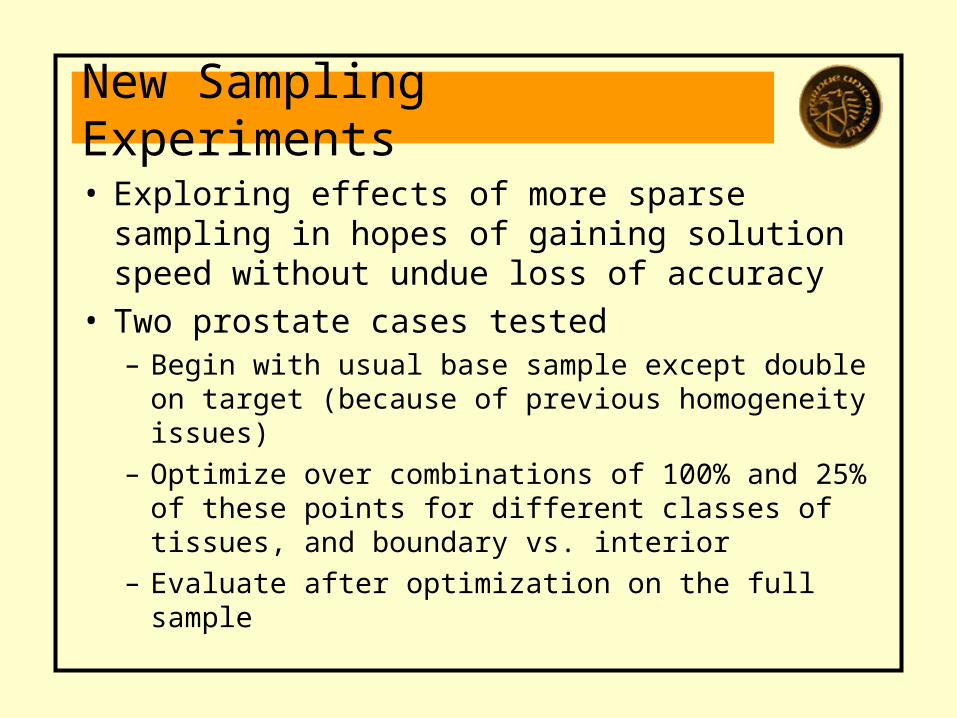
New Sampling Experiments
• Exploring effects of more sparse sampling in hopes of gaining solution speed without undue loss of accuracy
• Two prostate cases tested– Begin with usual base sample except double
on target (because of previous homogeneity issues)
– Optimize over combinations of 100% and 25% of these points for different classes of tissues, and boundary vs. interior
– Evaluate after optimization on the full sample
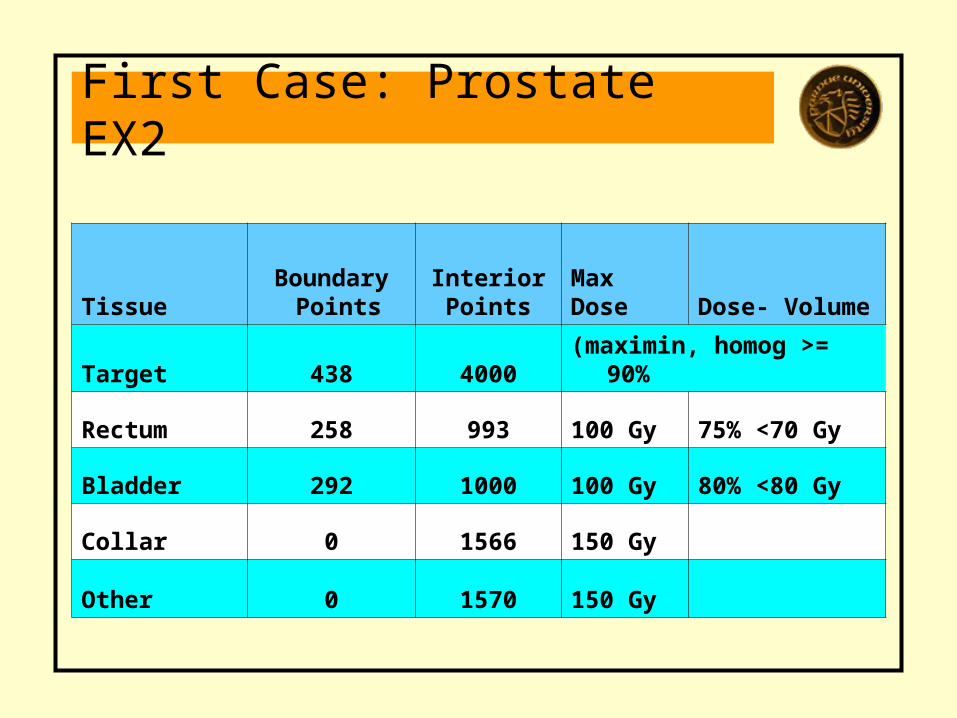
First Case: Prostate EX2
TissueBoundary
PointsInterior Points
MaxDose Dose- Volume
Target 438 4000 (maximin, homog >= 90%
Rectum 258 993 100 Gy 75% <70 Gy
Bladder 292 1000 100 Gy 80% <80 Gy
Collar 0 1566 150 Gy
Other 0 1570 150 Gy
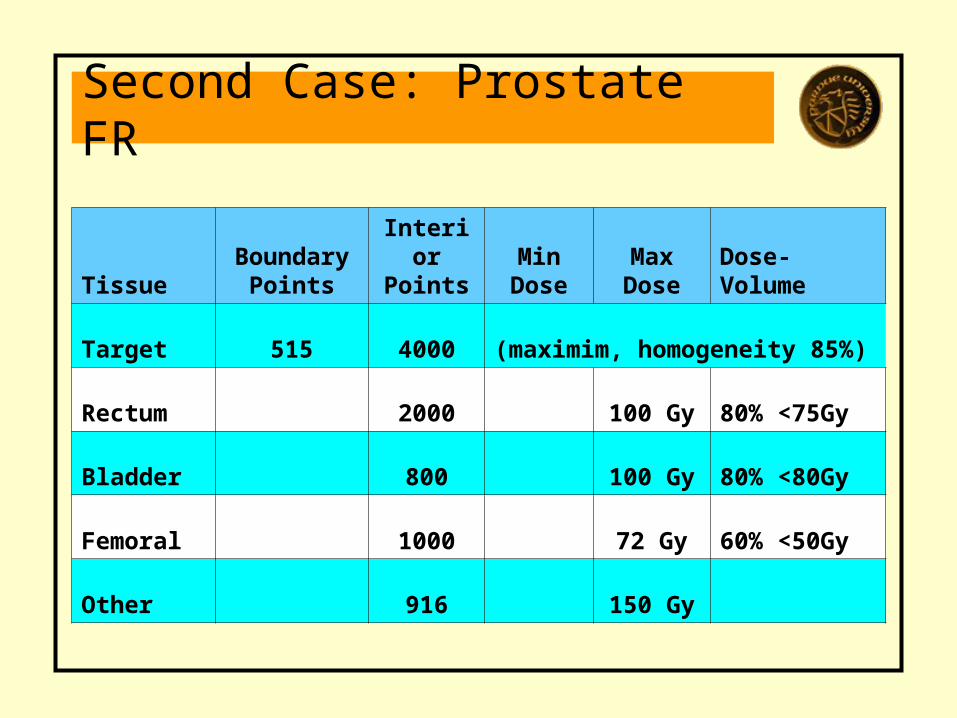
Second Case: Prostate FR
TissueBoundary
PointsInterior Points
Min Dose
Max Dose
Dose- Volume
Target 515 4000 (maximim, homogeneity 85%)
Rectum 2000 100 Gy 80% <75Gy
Bladder 800 100 Gy 80% <80Gy
Femoral 1000 72 Gy 60% <50Gy
Other 916 150 Gy
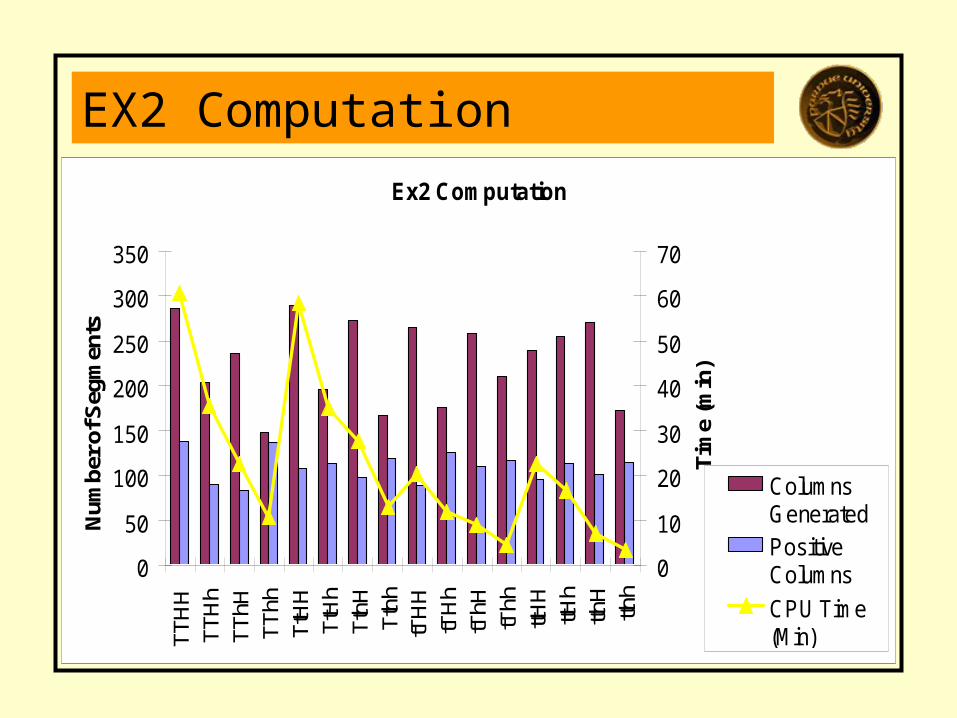
EX2 ComputationEx2 Computation
0
50
100
150
200
250
300
350
TTH
HTT
Hh
TThH
TThh
TtH
HTt
Hh
TthH
Tthh
tTH
HtT
Hh
tThH
tThh
ttHH
ttHh
tthH
tthh
Num
ber o
f Seg
men
ts
0
10
20
30
40
50
60
70
Tim
e (m
in)
ColumnsGeneratedPositiveColumns
CPU Time(Min)
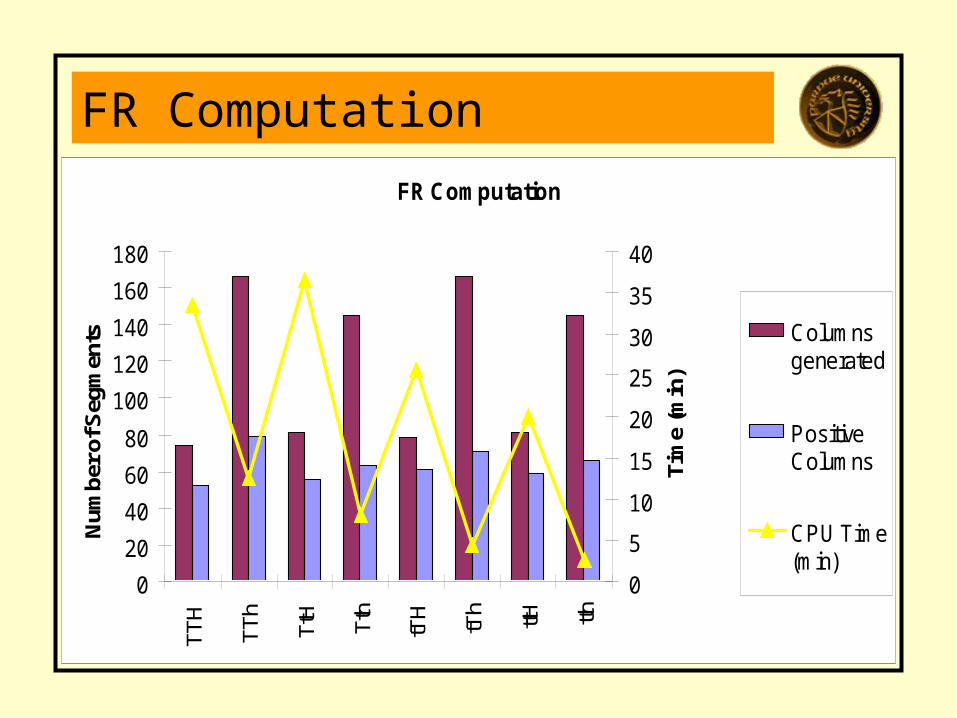
FR ComputationFR Computation
0
20
40
60
80
100
120
140
160
180
TTH
TTh
TtH
Tth
tTH
tTh
ttH tth
Num
ber o
f Seg
men
ts
0
5
10
15
20
25
30
35
40
Tim
e (m
in)
Columnsgenerated
PositiveColumns
CPU Time(min)
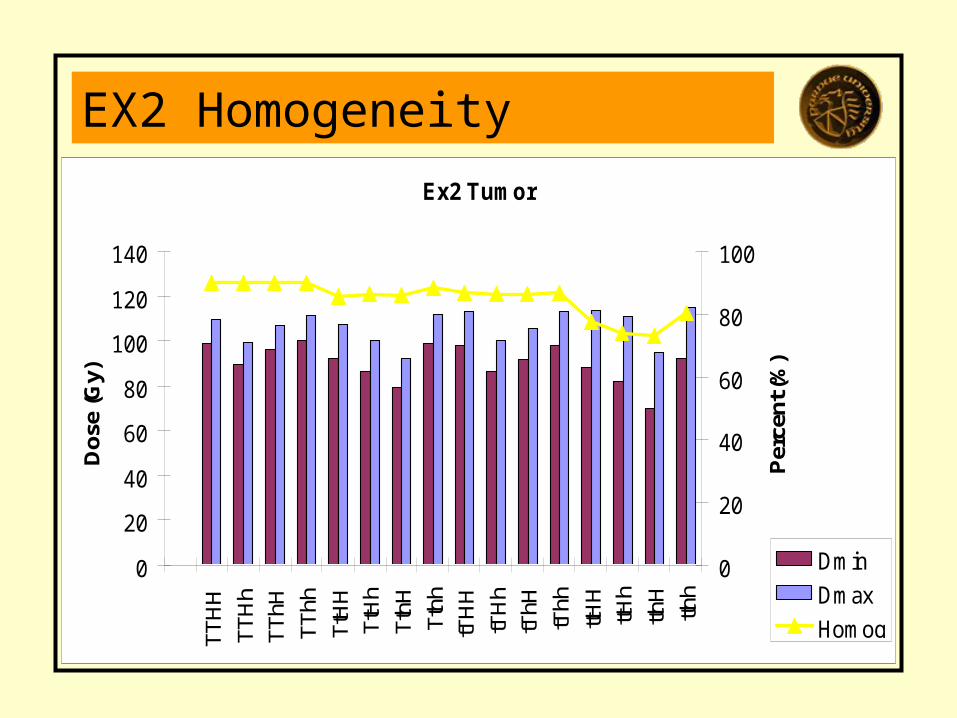
EX2 HomogeneityEx2 Tumor
0
20
40
60
80
100
120
140
TTH
HTT
Hh
TThH
TThh
TtH
HTt
Hh
TthH
Tthh
tTH
HtT
Hh
tThH
tThh
ttHH
ttHh
tthH
tthh
Dos
e (G
y)
0
20
40
60
80
100
Per
cent
(%)
Dmin
Dmax
Homog
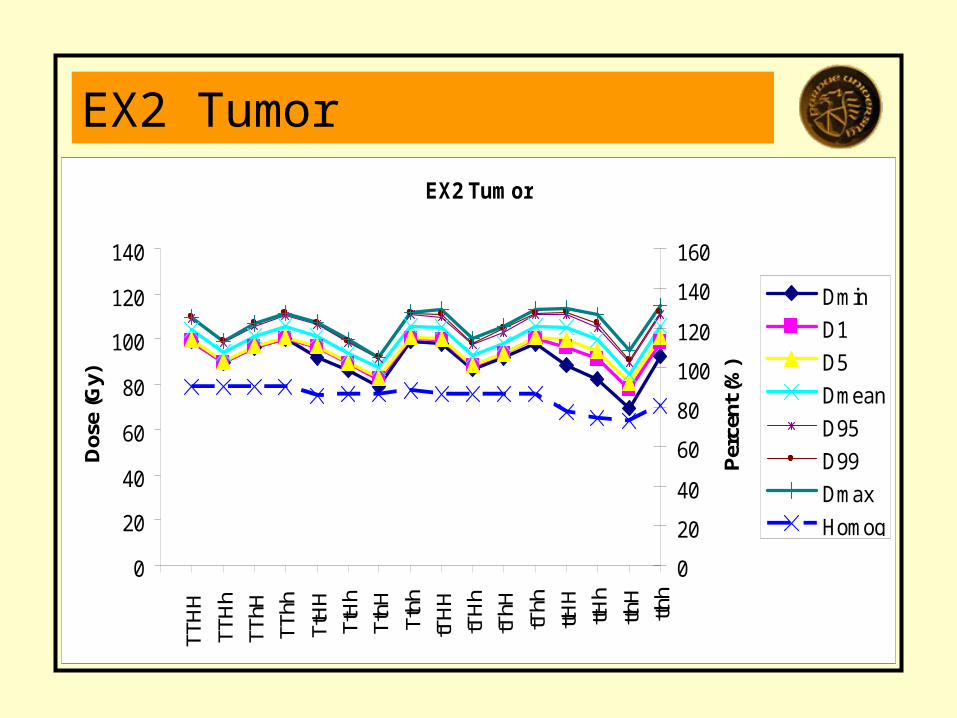
EX2 TumorEX2 Tumor
0
20
40
60
80
100
120
140
TTH
H
TTH
hTT
hHTT
hh
TtH
HTt
Hh
TthH
Tthh
tTH
HtT
Hh
tThH
tThh
ttHH
ttHh
tthH
tthh
Dos
e (G
y)
0
20
40
60
80
100
120
140
160
Per
cent
(%)
Dmin
D1
D5
Dmean
D95
D99
Dmax
Homog
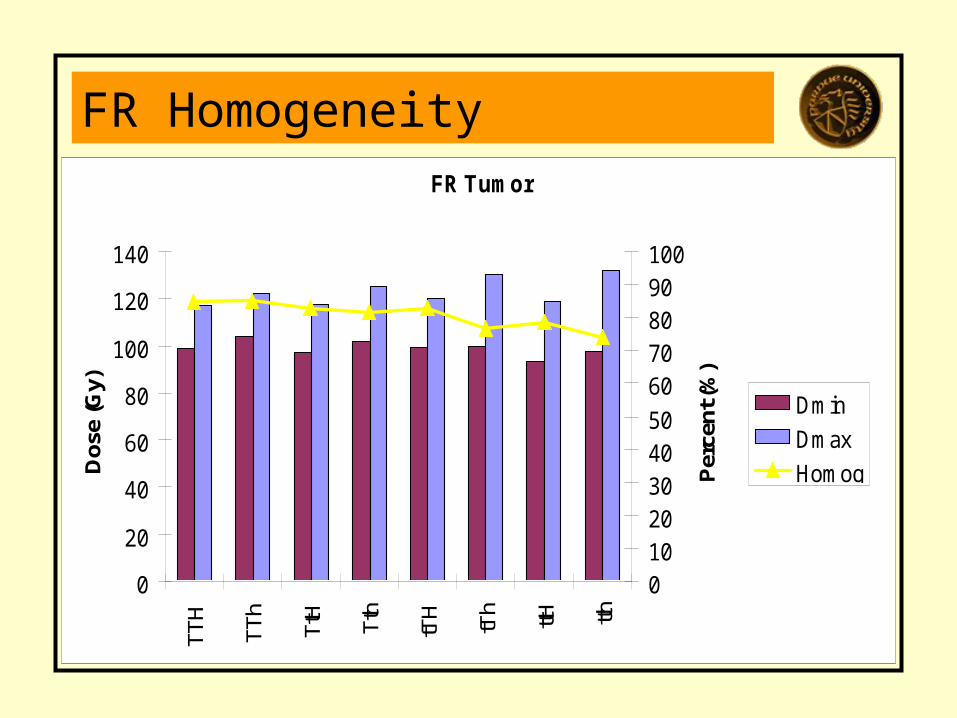
FR HomogeneityFR Tumor
0
20
40
60
80
100
120
140
TTH
TTh
TtH
Tth
tTH
tTh
ttH tth
Dos
e (G
y)
01020304050
60708090100
Per
cent
(%)
Dmin
Dmax
Homog
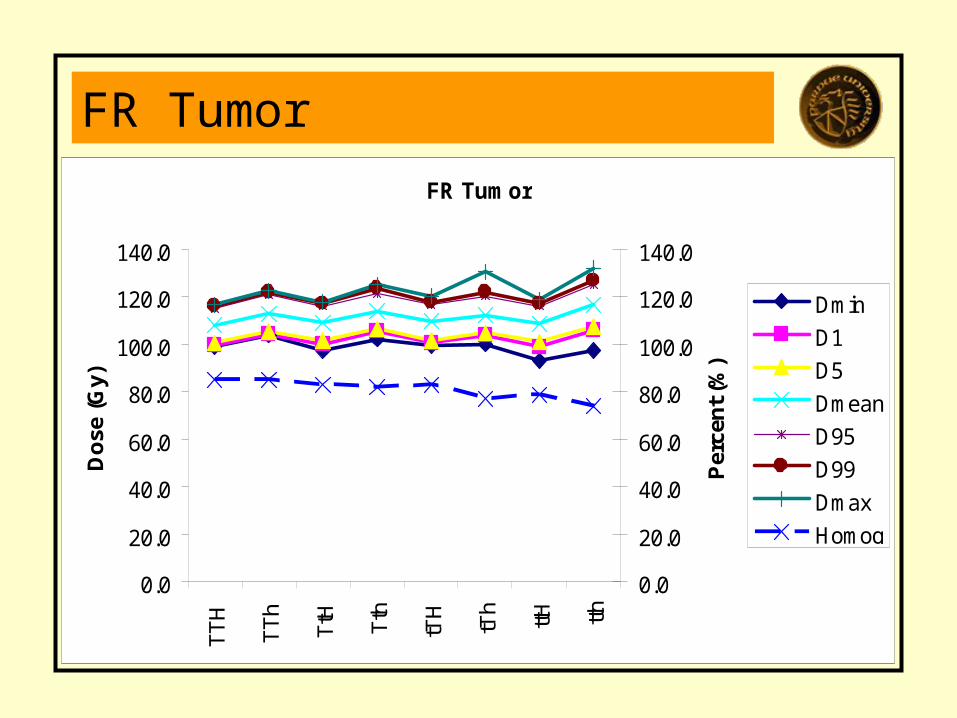
FR TumorFR Tumor
0.0
20.0
40.0
60.0
80.0
100.0
120.0
140.0
TT
H
TT
h
TtH Tth
tTH
tTh
ttH tth
Do
se (
Gy)
0.0
20.0
40.0
60.0
80.0
100.0
120.0
140.0
Per
cen
t (%
)
Dmin
D1
D5
Dmean
D95
D99
Dmax
Homog
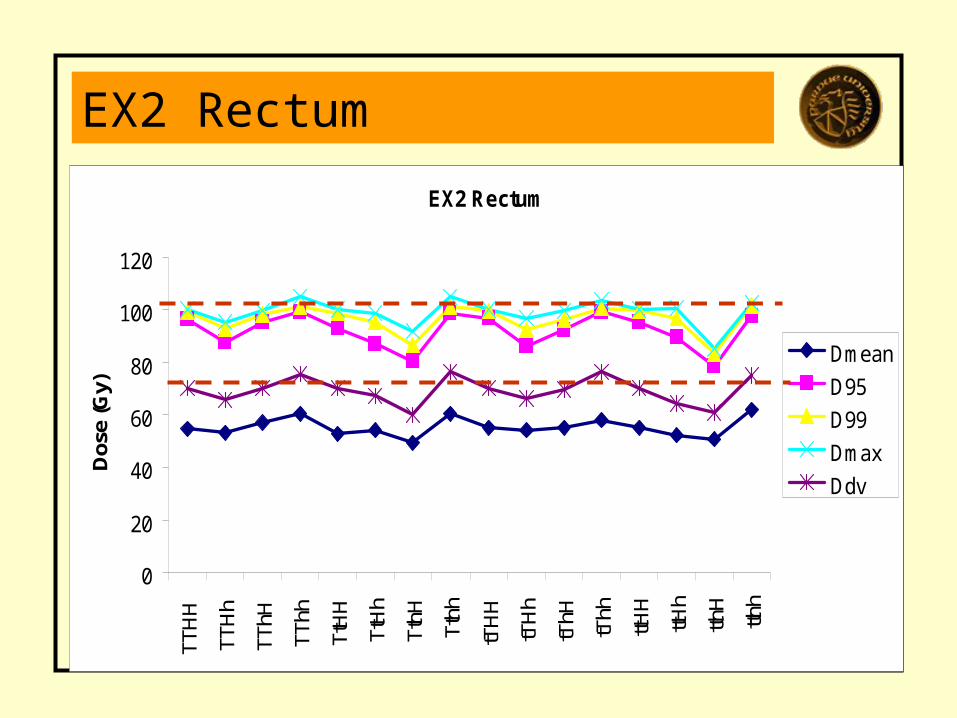
EX2 Rectum
EX2 Rectum
0
20
40
60
80
100
120
TTH
H
TTH
h
TThH
TThh
TtH
H
TtH
h
TthH
Tthh
tTH
H
tTH
h
tThH
tThh
ttHH
ttHh
tthH
tthh
Dos
e (G
y)
Dmean
D95
D99
Dmax
Ddv
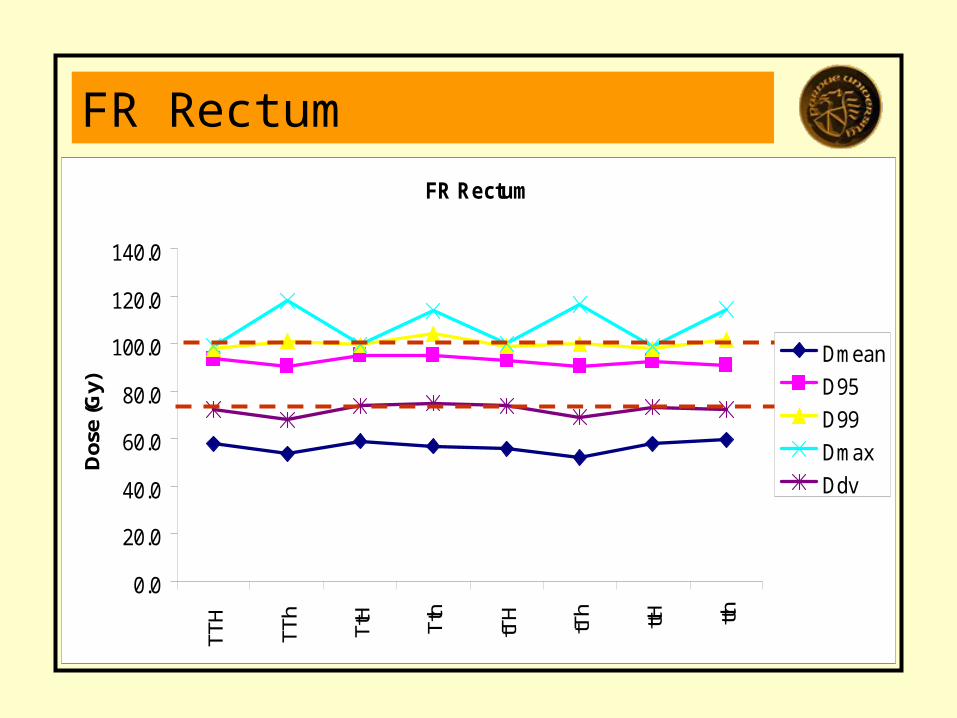
FR RectumFR Rectum
0.0
20.0
40.0
60.0
80.0
100.0
120.0
140.0
TTH
TTh
TtH
Tth
tTH
tTh ttH tth
Dos
e (G
y)
Dmean
D95
D99
Dmax
Ddv
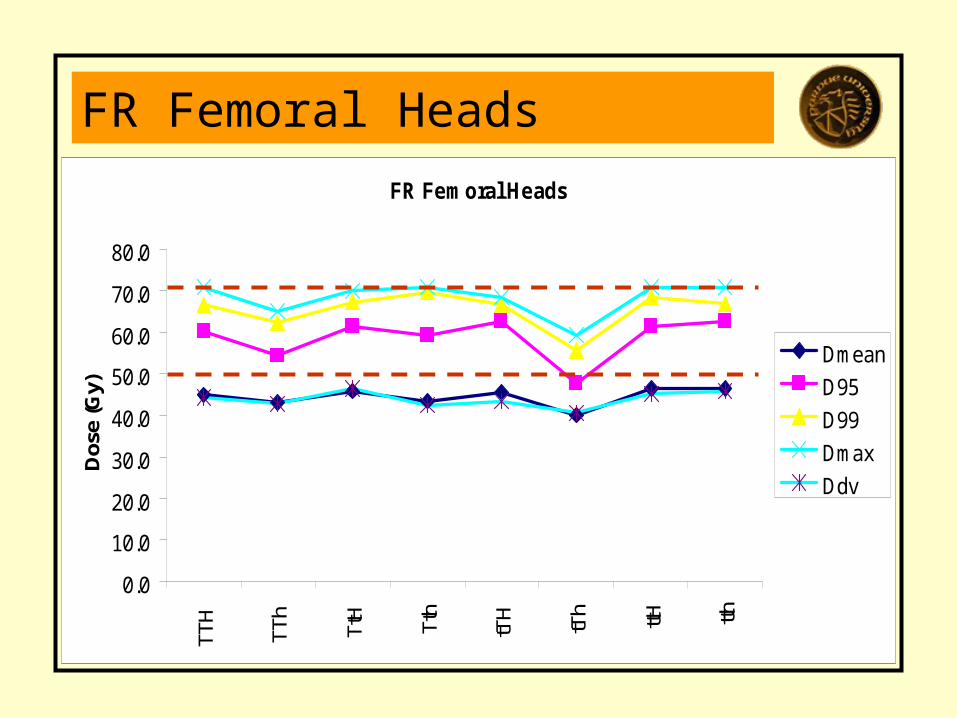
FR Femoral HeadsFR Femoral Heads
0.0
10.0
20.0
30.0
40.0
50.0
60.0
70.0
80.0
TTH
TTh
TtH
Tth
tTH
tTh ttH tth
Dos
e (G
y)
Dmean
D95
D99
Dmax
Ddv
Observations
• Small samples speed computation dramatically
• Measured tumor doses in the Target vary significantly with sampling, regardless of the exact measure used
• Small samples may be adequate in many cases to address statements about say D5 and D95, but Dmax and Dmin values will become volatile
• Dose-volume constraints are easier to satisfy with small samples that Dmax and Dmin