Effects of Residual Waste Material as Agricultural Soil ...
103
University of Rhode Island University of Rhode Island DigitalCommons@URI DigitalCommons@URI Open Access Master's Theses 2016 Effects of Residual Waste Material as Agricultural Soil Effects of Residual Waste Material as Agricultural Soil Amendments on Soil Greenhouse Gas Fluxes Amendments on Soil Greenhouse Gas Fluxes Ashley Waggoner University of Rhode Island, [email protected] Follow this and additional works at: https://digitalcommons.uri.edu/theses Recommended Citation Recommended Citation Waggoner, Ashley, "Effects of Residual Waste Material as Agricultural Soil Amendments on Soil Greenhouse Gas Fluxes" (2016). Open Access Master's Theses. Paper 818. https://digitalcommons.uri.edu/theses/818 This Thesis is brought to you for free and open access by DigitalCommons@URI. It has been accepted for inclusion in Open Access Master's Theses by an authorized administrator of DigitalCommons@URI. For more information, please contact [email protected].
Transcript of Effects of Residual Waste Material as Agricultural Soil ...

University of Rhode Island University of Rhode Island
DigitalCommons@URI DigitalCommons@URI
Open Access Master's Theses
2016
Effects of Residual Waste Material as Agricultural Soil Effects of Residual Waste Material as Agricultural Soil
Amendments on Soil Greenhouse Gas Fluxes Amendments on Soil Greenhouse Gas Fluxes
Ashley Waggoner University of Rhode Island, [email protected]
Follow this and additional works at: https://digitalcommons.uri.edu/theses
Recommended Citation Recommended Citation Waggoner, Ashley, "Effects of Residual Waste Material as Agricultural Soil Amendments on Soil Greenhouse Gas Fluxes" (2016). Open Access Master's Theses. Paper 818. https://digitalcommons.uri.edu/theses/818
This Thesis is brought to you for free and open access by DigitalCommons@URI. It has been accepted for inclusion in Open Access Master's Theses by an authorized administrator of DigitalCommons@URI. For more information, please contact [email protected].

EFFECTS OF RESIDUAL WASTE MATERIAL AS AGRICULTURAL SOIL
AMENDMENTS ON SOIL GREENHOUSE GAS FLUXES
BY
ASHLEY WAGGONER
A THESIS SUBMITTED IN PARTIAL FULFILLMENT OF THE
REQUIREMENTS FOR THE DEGREE OF
MASTER OF SCIENCE
IN
BIOLOGICAL AND ENVIRONMENTAL SCIENCES
UNIVERSITY OF RHODE ISLAND
2016
MASTER OF SCIENCE THESIS
OF
ASHLEY WAGGONER
APPROVED:
Thesis Committee:
Major Professor: José Amador
Rebecca Brown
Mark Stolt
Nasser H. Zawia
DEAN OF THE GRADUATE SCHOOL
UNIVERSITY OF RHODE ISLAND
2016
ABSTRACT
Anthropogenic causes of rising levels of greenhouse gases (GHG) such as CO2,
CH4, and N2O in the earth’s atmosphere are increasingly of concern due to their
effects on climate change. Much of the earth’s carbon is retained in sinks created when
atmospheric C is transformed into various forms of soil organic matter (SOM) and
stored as stable, decay-resistant SOM for variable periods of time. When land is in its
natural state, SOM is generally at a natural equilibrium of C inputs and outputs. Land
use changes, particularly cultivation and conventional agricultural practices, have
resulted in lower levels of SOM, leading to degraded, less productive soils. SOM is
important to the physical, chemical and biological composition of the soil, and there
has been a great deal of research addressing the impact of agricultural management
practices on the retention of SOM and nutrients. One area of research is the use of
organic waste materials as soil amendments to increase SOM. In addition to improving
SOM, soil amendments also modify the physical, chemical, and biological properties
of the soil, which affect the relative rates of production and consumption of GHG. The
direct effects of the amendments are mediated by environmental factors that influence
GHG flux, such as soil temperature and soil moisture. Organic wastes can be used as
soil amendments either directly or after composting, providing an alternative to
disposal in landfills or release into the environment as pollutants. The studies reported
here examine the effects of residual waste materials (RWM) on GHG flux from
agricultural soil. The amendments used included paper fiber with chicken manure
(PF), dehydrated food waste (DFW), yard waste compost (YW), biosolids and yard
waste compost (BIO), multisource compost (MC), and mineral fertilizer (MF). The
first study measured GHG fluxes and assessed relationships between GHG fluxes and

soil properties from a field, in Kingston, RI, sown in sweet corn during the 2014
growing season. During this study, DFW and PF produced significantly higher
maximum CO2 fluxes than the control (CTL) (a field sown in buckwheat) in June. All
other amended plots reached their maximum CO2 flux in August, but none where
significantly different from the CTL. Measurements for CH4 and N2O did not follow a
temporal pattern, and were not significantly different from the CTL. No soil properties
were significantly correlated with the change in GHG flux from all soils, but CO2 and
CH4 fluxes for CTL and MC, respectively, were significantly correlated with active C
and N2O from PF with moisture content. The second study used microcosms to
examine the effect of moisture and temperature on GHG flux and changes to soil
properties in an amended agricultural soil. The flux values of CO2, CH4 and N2O were
significantly affected by interactions between temperature, moisture and amendment.
Dehydrated food waste had highest CO2 flux observed at 25°C and field capacity and
consistently resulted in CO2 flux values higher than unamended soil (CTL) at most
moisture-temperature combinations, while MF and YW were always had the lowest
CO2 flux values. Net CH4 flux was not affected by moisture differences among
treatments, except at saturation and 25°C. Nitrous oxide production was most
responsive to moisture, regardless of temperature and amendment type. Most
amendments did not result in significantly increased GHG flux relative to CTL, and in
some instances resulted in decreased flux for CH4 and N2O at moisture contents and
temperatures likely to be encountered in the field. The exception was DFW, which
produced the largest flux of CO2 at 25°C, of N2O at 20°C saturation, and of CH4 at all
moisture contents and temperatures. Overall, we found that the use of RWM as soil

amendments affected the magnitude, direction and timing of GHG flux and responds
to differences in temperature and moisture. Generally, RWM – except for DFW – did
not cause increased GHG fluxes of concern.

v
ACKNOWLEDGEMENTS
My biggest thanks and gratitude go to Jose Amador, an amazing advisor,
teacher, and mentor. Additionally, I would like to recognize my faculty committee
members: Dr. Mark Stolt, Dr. Rebecca Brown and Dr. Carlos Garcia-Quijano for your
continued guidance. Special thanks to Dr. Dania Brandford-Calvo and Dr. Kelly Watts
at the University of Rhode Island International Center, Rebecca Long, and everyone in
the Laboratory of Soil Ecology and Microbiology, the University of Rhode Island
Greene H. Gardiner Crop Science Field Laboratory, and Lisa Tewksbury at the
University of Rhode Island’s College of Environment and Life Sciences Greenhouse
for all your assistance.
I would also like to acknowledge my friends and family who offered me limitless
support and encouragement and help during this whole process.
This research was funded in part by Rhode Island Agricultural Experiment Station
and the University of Rhode Island International Center.
vi
Preface
This thesis is organized in manuscript format in accordance with the University of
Rhode Island Graduate School guidelines. It is divided into four sections: an
introduction, two manuscripts (in preparation for submission), and a conclusion.
Manuscript I is “Response of Agricultural Soil Greenhouse Gas Fluxes to Amendment
with Residual Waste Materials in Sweet Corn Production” with authors A. Waggoner,
R. Long, and J Amador. It is in preparation for submission to HortScience. Manuscript
II is “Response of Agricultural Soil to Amendment with Residual Waste Materials:
Effects of Temperature and Moisture on Greenhouse Gas Flux. It is in preparation for
submission with authors A. Waggoner, R. Long, and J Amador to Journal of
Environmental Quality.
vii
TABLE OF CONTENTS
ABSTRACT................................................................................................................... ii
ACKNOWLEDGEMENTS ........................................................................................... v
PREFACE...................................................................................................................... vi
TABLE OF CONTENTS ............................................................................................. vii
LIST OF TABLES ........................................................................................................ ix
LIST OF FIGURES ....................................................................................................... x
INTRODUCTION ......................................................................................................... 1
MANUSCRIPT – I: RESPONSE OF AGRICULTURAL SOIL GREENHOUSE GAS
FLUXES TO AMENDMENT WITH RESIDUAL WASTE MATERIALS IN SWEET
CORN PRODUCTION .................................................................................................. 7
ABSTRACT ............................................................................................................. 8
INTRODUCTION .................................................................................................... 10
MATERIALS AND METHODS ................................................................................. 13
Study design .................................................................................................... 13
GHG flux measurements ................................................................................. 14
Soil properties ................................................................................................. 14
Residual waste materials ................................................................................ 15
Statistical analyses .......................................................................................... 16
RESULTS .............................................................................................................. 17
Carbon dioxide ............................................................................................... 17
Methane .......................................................................................................... 18
Nitrous oxide ................................................................................................... 19
DISCUSSION ......................................................................................................... 20
Carbon dioxide ............................................................................................... 20
Methane .......................................................................................................... 22
Nitrous oxide ................................................................................................... 24
REFERENCES ........................................................................................................ 29
FIGURES AND TABLES ......................................................................................... 34
MANUSCRIPT – II: RESPONSE OF AGRICULTURAL SOIL TO AMENDMENT
WITH RESIDUAL WASTE MATERIALS: EFFECTS OF TEMPERATURE AND
MOISTURE ON GREENHOUSE GAS FLUX .......................................................... 40
ABSTRACT ........................................................................................................... 41
INTRODUCTION .................................................................................................... 43
MATERIALS AND METHODS ................................................................................. 48
Microcosms ..................................................................................................... 48
Gas sampling and analysis ............................................................................. 49
Soil sampling and analysis ............................................................................. 49
Characterization of residual waste materials ................................................. 50

viii
Statistical analyses .......................................................................................... 51
RESULTS AND DISCUSSION .................................................................................. 52
Carbon dioxide ............................................................................................... 52
Methane .......................................................................................................... 57
Nitrous oxide ................................................................................................... 60
Global warming potential ............................................................................... 63
CONCLUSIONS ..................................................................................................... 64
FIGURES AND TABLES ......................................................................................... 70
CONCLUSIONS .......................................................................................................... 82
BIBLIOGRAPHY ........................................................................................................ 84
ix
LIST OF TABLES
Table 1.1. Characteristics of pre-amended soil and of amendments applied in 2014.
Values are means(n=3-4). After Long et al. (2016) .............................................. 34
Table 1.2. Significant differences (p<0.05) for CO2 flux over the growing season for
each amendment (same letter indicates no significant difference) and among
amendments within a month relative to control (indicated by *). Methane and
N2O flux values are not shown because no significant differences were observed
.............................................................................................................................. 35
Table 1.3. Pearson product moment correlation coefficients of relationships between
GHG flux and soil properties. Bold values indicate significant correlation
(p<0.05) ................................................................................................................ 36
Table 2.1. Characteristics of soil and amendments used in the microcosm experiment.
Values are means (n=3-4). After Long et al (2016)...............................................70
Table 2.2. Order of least square means (n=3) for maximum GHG flux from lowest to
highest by gas, temperature and moisture content. CTL = control; BIO = biosolids
and yardwaste co-compost; DFW = dehydrated food waste; MC = multisource
compost; MF = mineral fertilizer; PF = paper fiber with chicken manure; YW =
yardwaste compost; PWP = permanent wilting point; FC = field capacity; and
SAT = saturation. *Denotes significant difference from CTL when significant
interaction between amendment, temperature and moisture content is present....71
Table 2.3. Order of least square means (n=3) for cumulative amount of GHG produced
from lowest to highest by gas, temperature and moisture content. CTL = control;
BIO = biosolids and yardwaste co-compost; DFW = dehydrated food waste; MC
= multisource compost; MF = mineral fertilizer; PF = paper fiber with chicken
manure; YW = yardwaste compost; PWP = permanent wilting point; FC = field
capacity; and SAT = saturation. *Denotes significant difference from CTL when
significant interaction between amendment, temperature and moisture content is
present....................................................................................................................72
Table 2.4 Pearson product moment correlation coefficients of relationships between
GHG flux and soil properties. Bold values indicate significant correlation
(p<0.05).................................................................................................................73

x
LIST OF FIGURES
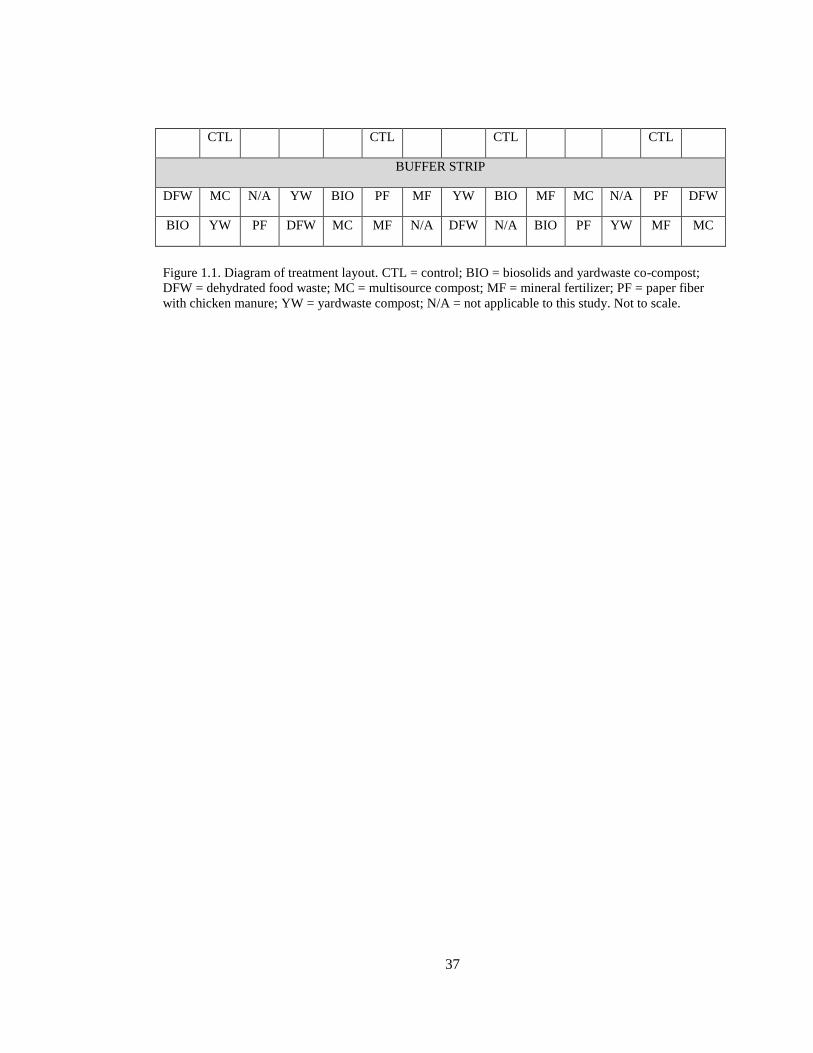
Figure 1.1. Diagram of treatment layout. CTL = control; BIO = biosolids and
yardwaste co-compost; DFW = dehydrated food waste; MC = multisource
compost; MF = mineral fertilizer; PF = paper fiber with chicken manure; YW =
yardwaste compost; N/A = not applicable to this study. Not to scale. ................. 37
Figure 1.2. Daily average soil moisture and soil temperature at 10cm as reported by
the U.S. Climate Reference Network station (at the Green H. Gardiner Crop
Science Field laboratory in Kingston, RI. Vertical dashed lines indicate dates
when flux measurements and soil sampling took place.
http://www.ncdc.noaa.gov/crn/ ............................................................................. 38
Figure 1.3. Mean (n=4) flux of CO2, CH4 and N2O in control and amended plots
during the 2014 growing season. Bars represent one standard deviation of the
mean. CTL = control; BIO = biosolids and yardwaste co-compost; DFW =
dehydrated food waste; MC = multisource compost; MF = mineral fertilizer; PF =
paper fiber with chicken manure; YW = yardwaste compost. .............................. 39
Figure 2.1. Least square mean (n =3) for maximum GHG flux from each amendment
as a function of moisture and temperature. Bars represent standard error of mean.
CTL = control; BIO = biosolids and yardwaste co-compost; DFW = dehydrated
food waste; MC = multisource compost; MF = mineral fertilizer; PF = paper fiber
with chicken manure; YW = yardwaste compost..................................................74
Figure 2.2. Least square mean (n=3) for cumulative amount of GHG produced from
amended soils as a function of temperature and moisture. Bars represent standard
error of mean. CTL = control; BIO = biosolids and yardwaste co-compost; DFW
= dehydrated food waste; MC = multisource compost; MF = mineral fertilizer; PF
= paper fiber with chicken manure; YW = yardwaste compost............................75
Figure 2.3. Mean (n=3) GHG flux from 0.5g of soil amendments with 5mL deionized
water, or deionized water alone (used as a control), measured over 3 days. CTL =
control; BIO = biosolids and yardwaste co-compost; DFW = dehydrated food
waste; MC = multisource compost; MF = mineral fertilizer; PF = paper fiber with
chicken manure; YW = yardwaste compost..........................................................76

xi
Figure 2.4. Relationship between change in EC and cumulative GHG
production/consumption for 14 day sampling period in amended soils. Bars
represent standard error of GHG mean. Line is linear regression of all treatments.
CTL = control; BIO = biosolids and yardwaste co-compost; DFW = dehydrated
food waste; MC = multisource compost; MF = mineral fertilizer; PF = paper fiber
with chicken manure; YW = yardwaste compost..................................................77
Figure 2.5. Relationship between change in pH and cumulative GHG
production/consumption for 14 day sampling period in amended soils. Bars
represent standard error of GHG mean. Line is linear regression of all treatments.
CTL = control; BIO = biosolids and yardwaste co-compost; DFW = dehydrated
food waste; MC = multisource compost; MF = mineral fertilizer; PF = paper fiber
with chicken manure; YW = yardwaste compost..................................................78
Figure 2.6. Association of mean (n=3) change in ammonium over 14 days to mean
(n=3) methane flux over 14 days by amendment. Bars represent standard error of
GHG mean. Line is linear regression of all treatments. CTL = control; BIO =
biosolids and yardwaste co-compost; DFW = dehydrated food waste; MC =
multisource compost; MF = mineral fertilizer; PF = paper fiber with chicken
manure; YW = yardwaste compost........................................................................79
Figure 2.7. Relationship between change in inorganic N content and cumulative GHG
flux for 14 day sampling period in amended soils. Bars represent standard error of
GHG mean. Line is linear regression of all treatments. CTL = control; BIO =
biosolids and yardwaste co-compost; DFW = dehydrated food waste; MC =
multisource compost; MF = mineral fertilizer; PF = paper fiber with chicken
manure; YW = yardwaste compost........................................................................80
Figure 2.8. Cumulative GHG emissions as CO2 equivalents (N2O and CH4 at 298 and
25 times CO2, respectively). CTL = control; BIO = biosolids and yardwaste co-
compost; DFW = dehydrated food waste; MC = multisource compost; MF =
mineral fertilizer; PF = paper fiber with chicken manure; YW = yardwaste
compost. Methane production was not large enough to show on graph...............81

1
INTRODUCTION
Greenhouse gases (GHG) from anthropogenic sources, such as CO2, CH4, and
N2O, are increasingly concerning due to their effects on global climate change (IPCC,
2007). Release of increased levels of these GHG changes the global carbon (C) and
nitrogen (N) cycles. Much of the earth’s C is retained in carbon sinks, created when
atmospheric C is transformed into various forms of soil organic matter (SOM) and
stored for periods that range from days to millennia.
The C process begins when plants absorb atmospheric CO2 and transform it to
organic matter via photosynthesis. This carbon is transformed to SOM through the
partial decomposition of plant litter and roots, or is ingested by heterotrophic
organisms, which either release the C back into the atmosphere as CO2, or metabolize
the C into tissues and/or waste products. The C in these tissues and waste products is
also eventually returned to the soil to decompose, where part of it is transformed into
SOM. As organic carbon decomposes, the C is either released as CO2 through
microbial respiration, transported through the soil solution into aquatic environments
as dissolved organic C (Cole et al., 2007), or becomes incorporated into soil
aggregates where, through biogeochemical processes, it becomes stable, decay-
resistant SOM. The residence time of SOM in the soil is controlled by the SOM and
soils’ physical and chemical composition, which determine the rate of microbial
decomposition (Johnson et al., 2007; Hassan et al., 2014; Lal and Bruce, 1999; Li et
al., 2013; Mondini et al., 2007).
Carbon can be sequestered in SOM when CH4 oxidation is higher than CH4
production in the soil (Segers, 1998; Smith et al., 2000). Methane is produced through

2
anaerobic respiration from methanogens using CO2, H2, and acetate created during the
decomposition of organic C (Brady and Weil, 2002). This is common in environments
such as wetlands and rice-paddies, or when aerobic environments are exposed to
extended periods of rain and/or flooding (Segers, 1998; Smith et al., 2000).
Additionally, CH4 can be produced in anaerobic microsites found within aerobic soils.
Within these mainly aerobic environments are also found methanotrophic bacteria that
oxidize CH4, produced in the soil or diffused into the soil from the atmosphere, as an
energy source. When CH4 oxidation exceeds CH4 production, the soil is considered to
be a CH4 sink.
The C and N cycles are tightly coupled due to the metabolic needs of organisms
and plants for C and N (Brady and Weil, 2002; Sylvia et al., 2005). Nitrogen enters the
soil in many forms, such as atmospheric N2 gas that is converted to NH4+ through
biological N fixation, organic N compounds from organic matter inputs, and
mineralized forms from fertilizer created through the Haber–Bosch process. Once N is
in the soil, it is susceptible to cycling between microorganisms and soils and can be
released back to the atmosphere as N2, NO, and N2O through immobilization,
mineralization, nitrification, and denitrification. Immobilization and mineralization
processes transform N between organic and inorganic forms, respectively.
Nitrification converts inorganic N from NH4+
to NO3-, denitrification transforms NO3
-
to N2, and both can result in the production of N2O as a byproduct of the process.
When land is in its native condition, the level of SOM is constant and C inputs and
outputs are in equilibrium (Balesdent et al., 2000). Land use changes, particularly
cultivation, and continued use of conventional agricultural practices, such as tillage,
3
fertilizer inputs and the removal of plant biomass result in lower levels of SOM,
leading to degraded, less productive soils (Lal and Bruce, 1999). Tillage breaks soil
aggregates, increases decomposition of recalcitrant SOM, and disrupts SOM
accumulation (Balesdent et al., 2000). Removal of plant biomass causes decreased
inputs of organic C, and fertilizer inputs accelerate microbial decomposition rates by
removing nutrient limitations.
Soil organic matter is important for moisture and nutrient retention, soil structure
and erosion control. Because of its importance to the physical, chemical and biological
properties of soil, a great deal of research has revolved around the impact of soil
management practices on the retention of SOM and nutrients (Balesdent et al., 2000;
Six et al., 2002; Johnson et al., 2010; Loecke and Roberston, 2009). This has led to
studies on the use of reduced and no-till techniques to decrease the net loss of carbon
from the soil, as well as the use of organic wastes as soil amendments to increase
SOM (Lal and Bruce, 1999; Johnson et al., 2007; Khorramdel et al., 2013; Lessard et
al., 1997; Alvarenga et al., 2015).
When soil amendments are used to increase SOM, they also modify the physical,
chemical, and biological properties of the soil. The increase in SOM causes changes to
the soil structure due to its role in aggregate formation and stability (Annabi et al.,
2007). The amendments are also often incorporated into the soil through tillage, which
causes changes to moisture content, increasing drying, soil aeration and porosity.
Amendment C:N ratio and the recalcitrance level of organic carbon affect
decomposition rates, while the pH, electrical conductivity, and nutrient levels of the
amendments affect chemical processes in the soil (Thangarajan et al., 2013).

4
Incorporation of amendments can also alter biological soil processes through shifts in
microbial community composition, changes to density and changes to ecosystem
functions (Johnson et al., 2007; Mondini et al., 2007; Khorramdel et al., 2013; Li et
al., 2013). The changes induced by the addition of organic amendments affect the flux
of GHG in soil (Johnson et al., 2007; Mondini et al., 2007; Li et al., 2013; Qiu et al.,
2013).
Environmental factors also influence GHG flux. Soil temperature and soil moisture
content alter the effects of soil amendments through effects on soil biogeochemical
processes (Johnson et al., 2007; Li et al., 2013; Thangarajan et al., 2013; Hassan et al.,
2014). Soil moisture content controls aeration because soil water directly competes
with air for pore space, and acts as a barrier for diffusion of gases in the soil. Low soil
moisture content provides more opportunity for gaseous exchanges between the soil
and the atmosphere due to more open pore space. This allows for diffusion of O2 into
the soil for use in respiration by microorganisms and plant roots, and the release of
CO2 and N2O from the soil (Brady and Weil, 2002). Conversely, high soil moisture
content restricts the diffusion of O2 into the soil, slowing the rate of aerobic microbial
activity, and supports microbial production of precursors for CH4 production and the
establishment of anoxic microsites needed for denitrification and N2O production
(Linn and Doran, 1984; Conrad, 1996; Zhu et al., 2015). Soil moisture also affects soil
temperature by altering the amount of energy needed to warm the soil.
Temperature also affects the rate of biological and chemical processes in the soil.
At low temperatures (below 10°C), microbial processes slow down, reducing the rates
of SOM decomposition and microbial respiration. Increasing temperature has been

5
associated with increasing rates of microbial processes, thus influencing GHG fluxes
(Allison, et al., 2010). Soil moisture content and temperature work synergistically to
affect soil functions, particularly the rate of decomposition of organic matter, the
cycling of C and N through the soil, and GHG flux.
In the United States in 2012, over 86 million tons of municipal solid waste, of
which the largest component were organic wastes (64.5 million tons), such as paper
and paperboard, yard trimmings and food waste, were recovered through recycling and
composting (EPA, 2012). Using these and other residual materials from industrial and
waste disposal processes as agricultural soil amendments provides an alternative to
disposal in landfills or release into the environment as pollutants. To date, research
into residual waste materials (RWM), such as paper fiber, dehydrated food waste, and
multisource composts, has focused on their effects on soil quality and crop production
(e.g. Long et al., 2016). Because use of these products will also affect the soil
biogeochemical processes, and thus GHG production and consumption, there is also a
need to investigate effects on GHG flux (Thangarajan et al., 2013; Alvarenga 2015).
Measuring GHG fluxes from agricultural soils amended with RWM will help us
understand how these amendments influence rates of production and consumption of
these gases, as well as their impact on C and N cycling in soil (Thangarajan et al.,
2013).
My thesis is composed of two manuscripts that examine the effects of RWM on
GHG flux from agricultural soil. The first, “Response of Agricultural Soil Greenhouse
Gas Fluxes to Amendment with Residual Waste Materials in Sweet Corn Production,”
is a field study that measured GHG fluxes and assessed relationships between GHG

6
fluxes and soil properties. The second, “Response of Agricultural Soil to Amendment
with Residual Waste Materials: Effects of Temperature and Moisture on Greenhouse
Gas Flux,” examines the effect of moisture and temperature on GHG flux and changes
to soil properties in an amended agricultural soil using microcosms.
7
MANUSCRIPT – I: RESPONSE OF AGRICULTURAL SOIL GREENHOUSE
GAS FLUXES TO AMENDMENT WITH RESIDUAL WASTE MATERIALS
IN SWEET CORN PRODUCTION
In preparation for submission to HortScience
Ashley Waggoner, Rebecca Long and Jose A. Amador
Laboratory of Soil Ecology and Microbiology, University of Rhode Island, Kingston, RI 02881
8
Abstract
In the United States, 64.5 million tons of organic materials – consisting of
paper and paperboard, yard trimmings, and food wastes – were recovered through
recycling and composting in 2012. The use of these and other residual waste materials
(RWM) as agricultural soil amendments may offer a solution to the problem of
reduced soil organic matter in agricultural soil. RWM can affect soil physical,
chemical and biological soil properties, and add C, N and other nutrients to the soil.
These changes can affect soil biogeochemical processes and may alter the flux of
greenhouse gases (GHG), such as CO2, CH4, and N2O. We quantified the magnitude
of GHG flux from soil plots amended with five different RWMs, paper fiber with
chicken manure (PF), dehydrated food waste (DFW), yard waste compost (YW),
biosolids and yard waste compost (BIO), multisource compost (MC), or a mineral
fertilizer (MF) used to grow corn over the course of a growing season. We used plots
planted to buckwheat to simulate a fallow field as a control (CTL). We also examined
correlations between soil properties and GHG fluxes. Amending the soil with RWMs
changed the magnitude and timing of CO2 flux. Dehydrated food waste, PF, and CTL
reached maximum CO2 flux in June, and DFW and PF had significantly higher CO2
flux than CTL. In contrast, BIO, MC, MF, and YW did not reach maximum CO2 flux
until August, with values that were not significantly different from CTL. Effects of
RWM and MF on CH4 and N2O fluxes were variable, and fluctuated between net
consumption and net production for most amendments. Carbon dioxide for CTL and
CH4 for MC fluxes were significantly correlated with active C. Nitrous oxide for PF
was significantly correlated with moisture content. GHG fluxes in plots amended with

9
RWM generally were not different from control plots over the course of a growing
season. Our results suggest that, with few exceptions, use of these RWMs as soil
amendments in sweet corn production may not cause substantial increases in GHG
fluxes from soil.
10
Introduction
There is an increasing need to reduce greenhouse gas (GHG) emissions from
anthropogenic sources, including agriculture, which is responsible for 14% of
anthropogenic GHG emissions (IPCC, 2014). Agricultural soils are one of the largest
anthropogenic sources of N2O emissions (Ball et al., 2014; Duxbury, 1994). They are
also sources of CO2, and can be sources or sinks of CH4 depending on management
practices. While atmospheric levels of N2O and CH4 are much lower than CO2,
increases in the concentration of N2O and CH4 are of particular concern because their
global warming potential is 298 and 25 times higher, respectively, than CO2 (IPCC,
2007).
Land use changes have led to increased release of soil-sequestered carbon (C) (soil
organic matter (SOM)) through increased decomposition and associated GHG
emissions (IPCC, 2014; Lal and Bruce, 1999). In addition to serving as a sink for
atmospheric C, SOM plays an essential role in soil processes, including moisture
retention, nutrient supply, and maintaining soil structure. Conventional agricultural
practices such as tillage and removal of plant biomass during harvest lower SOM, a
problem that may be remedied by amending the soil with organic materials. In the
United States, organic materials make up the largest component of municipal solid
wastes, of which 64.5 million tons was recovered in 2012 through recycling and
composting of paper and paperboard (51%), yard trimmings (22%) and food wastes
(2%) (EPA, 2012). Using these and other residual materials from industrial and waste
disposal processes as agricultural soil amendments provides an alternative to disposal
in landfills or release into the environment as pollutants (Long et al., 2016).
11
Novel residual waste materials (RWM), such as paper fiber, gelatin waste, and
dehydrated food waste, have been investigated for use as agricultural soil amendments
(Long et al., 2016). They can add C, N and other nutrients to the soil, and can affect
physical, chemical and biological soil properties. Changes in available C and nutrients
and in soil properties alter biogeochemical processes in the soil, and can affect the flux
of C and N-containing greenhouse gases (GHG), including CO2, CH4, and N2O
(Thangarajan et al., 2013). Variability in the composition of RWMs affects the
magnitude of changes to nutrient availability, organic matter, and pH in soil (Long et
al., 2016; Mondini et al., 2007; Mukherjee et al., 2014). Thus, differences in RWM
composition and effects on soil properties may also affect the magnitude and direction
of GHG flux from RWM-amended soils. Research on the use of RWM in agriculture
has mainly focused on their impact on soil properties and crop production, while their
effects on the flux of GHGs from agricultural soils have received little attention
(Johnson et al., 2007).
In a companion study, Long et al. (2016) examined the use of novel RWMs as soil
amendments and their effects on soil properties and crop production. Soil amendment
with yardwaste compost and biosolids/yardwaste co-compost resulted in significantly
higher levels of SOM. Positive effects on soil properties such as increases in soil pH,
and availability of inorganic N were observed for other RWMs. These changes can
impact C and N cycling as well as the flux of GHG from soil. To examine the effects
of novel RWM amendments on GHG flux, we measured net production of CO2, CH4,
and N2O in plots used to grow sweet corn during the 2014 growing season of the Long
et al. (2016) study. Our objectives were to (i) quantify effects of RWMs on the

12
magnitude and direction of GHG flux from amended soil plots over the course of a
growing season and (ii) examine correlations between soil properties and GHG flux.

13
Materials and Methods
Study design
Our measurements were carried out in the context of a study conducted to examine
the effects of novel RWMs as soil amendments on soil properties and crop production
during the 2013 and 2014 growing seasons at the University of Rhode Island’s Greene
H. Gardner Crop Science Field laboratory in Kingston, RI (Long et al., 2016). We
measured GHG flux from amended soil planted with sweet corn (Zea mays cvs.
Applause and Montauk) during the 2014 growing season.
The experiment employed a randomized block design of seven 4.6 m × 4.6 m plots
with four replications. Only six of the plots of each replication were used in our study.
We established an additional four 4.6 m × 4.6 m plots in which we grew and
maintained a summer cover crop of buckwheat (Fagopyrum esculentum) to simulate a
fallow agricultural field. These plots served as a control (CTL) (Fig. 1.1). In July
2014, the buckwheat was mowed and tilled into the soil, and re-sown for the
remainder of the growing season. Prior to the start of GHG flux measurements in May
of 2014, the plots were amended with paper fiber with chicken manure (PF),
dehydrated food waste (DFW), yard waste compost (YW), biosolids and yard waste
co-compost (BIO), or multisource compost (MC) at a rate of 10 Mg C/ha over a two-
year period, or mineral fertilizer (MF) at a rate of 112 kg N/ha/yr. Additional
information on management practices can be found in Long et al. (2016).

14
GHG flux measurements
The flux of CO2, CH4, and N2O was measured monthly in 2014. Samples were
collected on June 2/3, June 30/July 1, August 4/5, August 30/31, and October 13,
between 9 am and 12 pm, using the static chamber method (Flessa et al., 1995). On
each sampling date, a cylindrical plastic chamber (27-cm dia., 20-cm high), fitted at
the top with a rubber septum, was placed at random within the center interrow of each
plot, and pushed ~2.5 cm into the soil. Gas samples from the chamber were obtained
immediately after placement and at 15 and 30 min after placement using a 20-mL gas-
tight syringe. The syringe was pumped repeatedly to mix the gases in the headspace
prior to sample collection. Gas samples were transferred to 20-mL evacuated glass
vials, and analyzed using a Shimadzu GC-2014 Greenhouse Gas Analyzer (Shimadzu
Corp., Kyoto, Japan) fitted with a flame ionization detector for CH4 and CO2 (post-
methanizer) and an electron capture detector for N2O.
The best-fit linear regression was applied to the concentrations from the three
collected samples for each plot. The mass of each GHG within the chamber, n (mol),
was calculated using the Ideal Gas Law, n=RT/PV, where n=mol GHG per mol air,
P=atmospheric pressure (atm), T=chamber air temperature (K), R=universal gas
constant (0.0821 L atm/mol K), and V=volume (L). The rate of GHG production per
unit area was calculated using the slope of the best-fit line, volume of air in the
chamber and cross-sectional area.
Soil properties
Soil samples were collected monthly, during the same time period as GHG flux
sampling, and analyzed for moisture content, organic matter, pH, electrical

15
conductivity (EC), nitrate (NO3-), and ammonium (NH4
+) as described in Long et al
(2016). Additionally, we analyzed the soil samples for active C using the potassium
permanganate method of Weil et al. (2003). Active C was determined colorimetrically
by measuring absorbance at 550 nm with a Biotek Powerwave 340 Microplate
Scanning Spectrometer (Biotek Instruments, Inc., Winooski, VT). Pre-amendment soil
properties are shown in Table 1.1.
Data on soil temperature and soil moisture content were collected from a U.S.
Climate Reference Network (USCRN) station less than 500 m from the experimental
plots (Fig. 1.2).
Residual waste materials
Six soil amendment treatments were applied by hand and incorporated by disc
harrow in late May 2014 (Long et al., 2016). The amendments were applied in the
condition they were delivered. All amendments (except MF) were applied at a rate
sufficient to supply 10 Mg organic C/ha over the 2013 and 2014 growing seasons. The
MF was applied to provide 112 kg N/ha/yr. Amendments were:
1. Biosolids/yardwaste co-compost (BIO), consisting of ground leaves, brush
and municipal biosolids composted by in-vessel horizontal agitated bin.
2. Dehydrated food waste (DFW) from a New York restaurant. It was ground,
dehydrated, and aerobically incubated for 18 h to reduce bulk.
3. Multisource compost (MC) made from leaf and wood chips as bulking
agents, mixed with farm and zoo animal manure and bedding, fish scraps,
seashells, seaweed, coffee grinds, wood ash and food scraps and composted
in Rhode Island using active windrows.

16
4. Mineral fertilizer (MF) (20N-8.7P-16.6K) with 3.5% ammonium-N, 5.5%
nitrate-N and 11% urea N.
5. Paper fiber/chicken manure blend (7:1) (PF) using paper fiber from
dewatered primary sludge from recycled paper processing. To reduce its
high C:N ratio (>57:1), the paper fiber was blended with a composted
chicken manure product at a rate of 7 parts paper to 1 part chicken manure.
6. Yard waste compost (YW) produced in Rhode Island using leaves
composted in active windrows.
Amendment properties from the study site are shown in Table 1.1.
Statistical analyses
A two-way analysis of variance followed by the Holm-Sidak test was used to
identify statistically significant differences at p<0.05 for GHG flux among months for
an amendment, and among amendments within a month. A Pearson product moment
correlation coefficient (R) was used to evaluate the relationship between GHG flux
and soil properties. Statistical analyses were performed using SigmaPlot 11.0 (Systat
Software Inc., 2008).

17
Results
Carbon dioxide
A significant interaction (p = <0.001) was found between the amendments and
months. Mean CO2 fluxes from DFW and PF were significantly higher (p = <0.001)
than CTL. Significant differences were also found in mean CO2 flux between all
months (except July and August, and July and September) in the order June > August
> July > September > October.
The timing and magnitude of maximum CO2 flux among the amendments
followed a general trend (Fig. 1.3). The CTL, DFW, and PF treatments reached
maximum CO2 flux in June (with DFW and PF over three times greater than CTL),
remaining relatively constant (CTL) or declining steadily (DFW and PF) for the
remainder of the season. In contrast, CO2 flux in plots amended with MF, MC, BIO,
and YW increased monthly until reaching a maximum in August, and declined for the
remainder of the season. Maximum CO2 flux values over the growing season followed
the order: DFW > PF > YW > BIO > MC > MF > CTL.
Dehydrated food waste and PF also had the two highest fluxes observed during a
single month during the study, and were the only amendments with a CO2 flux
significantly higher than CTL in June (Table 1.2). Between July and September, most
amendments had a CO2 flux higher than CTL, but no significant differences from CTL
were observed. By the end of the growing season in October, most treatments had
lower flux values than CTL with no significant differences.

18
We found a significant correlation between CO2 flux and soil active carbon for the
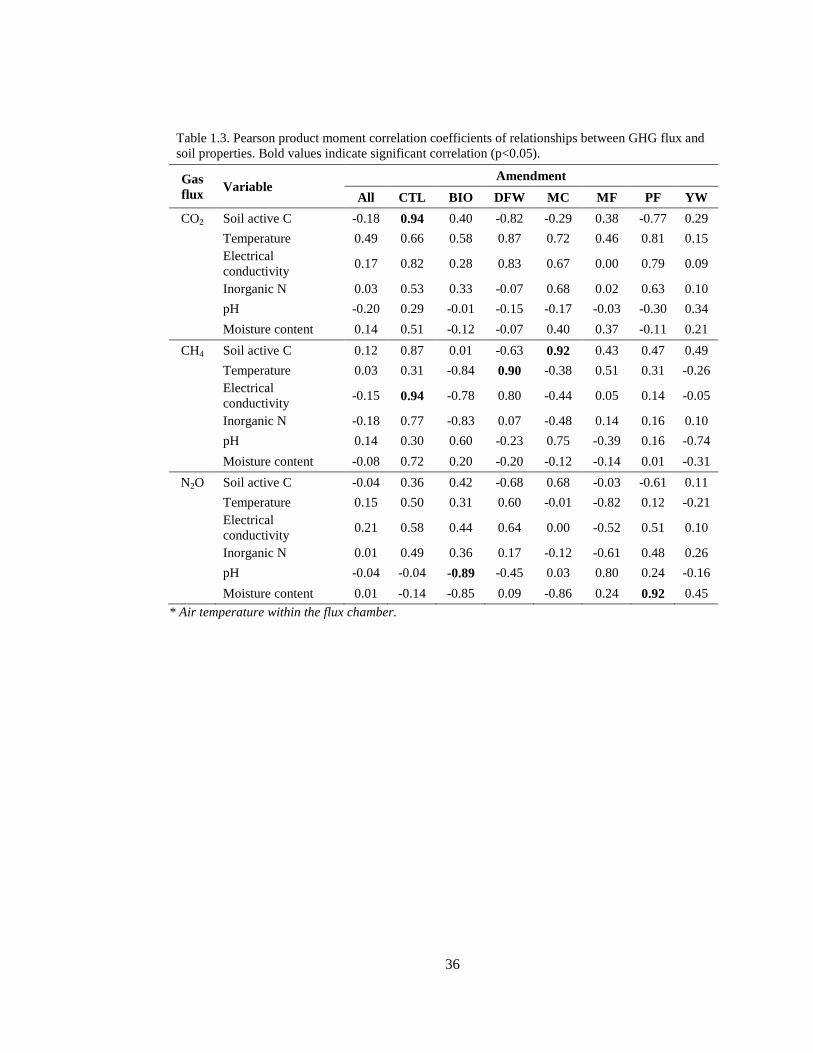
CTL treatment (R = 0.94) (Table 1.3). No other significant correlations were found
between CO2 flux and soil properties.
Methane
Amendment with MF and PF resulted in net CH4 consumption (negative flux)
throughout the growing season (Fig. 1.3). All other amendments and the CTL had
periods of net production (positive flux) and net consumption (Fig. 1.3). Net CH4
production was observed for CTL and DFW in June; for DFW and YW in July; for
MC in August and September; and for BIO and YW in October. There was no clear
temporal pattern in the magnitude or direction of methane flux for any of the
treatments.
Plots amended with MC had the highest net CH4 production over the growing
season in September, with flux values decreasing in the order: MC > YW > PF > MF
> BIO > CTL (DFW had no net CH4 flux during this sampling period). Amendment of
plots with MF resulted in the highest net consumption over the growing season in
October, with values following the order: MF > PF > DFW > MC > CTL > YW >
BIO. There were no significant differences in CH4 flux between amended plots and
the CTL, or between months for any of the treatments. There was also no significant
interaction between amendment and month (Table 1.2).
There were significant correlations between CH4 flux and soil properties that
varied by amendment. Methane flux was positively correlated with EC for the CTL
treatment (R = 0.94), with temperature for DFW, and with soil active C in MC (Table
1.3).

19
Nitrous oxide
The highest positive N2O flux (June) and the highest negative N2O flux (October)
were observed for the CTL treatment (Fig. 1.3). Net N2O production was observed for
nearly all amendments in June, with values ranging between 0.016 and 0.768 mg N2O-
N/m2/d, following the order: CTL > DFW > BIO > PF > MC > MF > YW. The
exception was YW, which had a net consumption. Flux values in other months
fluctuated between net consumption and net production for all treatments, with no
clear temporal pattern. No significant interaction was found between amendments and
months. No significant differences from the CTL were observed.
There was a significant negative correlation between N2O flux and pH for BIO,
and a positive correlation between N2O flux and moisture content for PF (Table 1.3).

20
Discussion
Carbon dioxide
Studies of CO2 flux from corn cultivation in Minnesota reported a 3-year average
between 1,019 and 1,033 mg/m2/d (Johnson et al., 2010). A study on the effects of soil
amendments in Ohio found CO2 fluxes of 1,000 to 10,000 mg/m2/d (Mukherjee et al.,
2014). Possinger and Amador (2015) reported flux values of 800 to 3100 mg CO2-
C/m2/d in a study at a nearby location growing sweet corn. The CO2 flux values we
observed were lower than those reported in these studies.
Differences in the physical and chemical properties of the amendments may
explain the significantly higher CO2 flux for DFW and PF relative to CTL in June.
Moisture content (especially in the PF treatment) and levels of easily decomposable
substrates in non-composted amendments (such as DFW and PF), can lead to
increased microbial biomass and CO2 flux in soil (Mondini et al., 2007, Li et al., 2013;
Mukherjee et al., 2014; Zhu et al., 2015). Paterson et al. (2011) suggested that
increased CO2 flux could be from microorganisms present, primarily in composted
amendments. In contrast, Saison et al. (2006) found increased CO2 flux to be the result
of increased substrate availability for the microbial community already present in soil,
with the addition of amendments inducing a response from that community.
Additionally, composting of amendments could explain the absence of significant
differences in CO2 flux between the composted amendments (BIO, MC, YW) and the
CTL treatment. Composting results in the decomposition of labile C, resulting in an
amendment enriched with more recalcitrant C, which reduces the response of CO2 flux
when these amendments are added to soil.

21
The occurrence of CO2 flux maxima in August for BIO, MC, MF, and YW-
amended plots can be explained by warmer temperatures at the end of the summer or
plant growth processes (Fig. 1.2). The effects of temperature on soil CO2 flux have
been studied extensively, with warmer temperatures leading to increased CO2 flux
(Allison et al., 2010; Navaries et al., 2015; Schaufler et al., 2010; Smith et al., 2003).
In a study of organic amendments, temperature and moisture effects on GHG, Li et al.
(2013) found that rising temperature resulted in increased CO2 flux. Since our
measurement of CO2 flux was for total soil respiration, which included CO2 from
microorganisms and plant roots, it is also possible our increased flux in August was
due to increased CO2 flux from the rhizosphere due to the plant growth processes
(Raich, 2005). In contrast, we would not see such an increase in the CO2 flux from
DFW and PF plots due to the already increased flux caused by the addition of the
easily decomposed C in these non-composted materials being consumed shortly after
application as indicated by CO2 flux maxima in June. This would leave the more
recalcitrant C in the soil, reducing the response of flux to increased temperature and
covering up the increased flux from plant roots in August. Additionally, we would not
see this pattern of flux in the control, due to the different growth patterns of
buckwheat to corn.
Application of amendments leads to changes in edaphic properties, including pH,
electrical conductivity, and availability of inorganic N (Long et al., 2016), which
affect soil microorganisms, C and N cycling, and thus would be expected to affect the
flux of GHGs (Thangarajan et al., 2013; Alvarenga et al., 2015; Annabi et al., 2007).
Although changes in soil properties were observed in response to RWM amendments

22
in the companion study by Long et al. (2016), soil properties were generally not
correlated with CO2 flux (Table 1.3). This was surprising, given the well-established
relationship between CO2 flux and temperature and moisture content (Linn and Doran,
1984; Smith et al., 2003; Li et al., 2013; Davidson et al., 1998). It is possible that
temperature and moisture content did not vary over a sufficiently large range (Fig. 1.2)
for correlations to be significant.
The significant positive correlation between CO2 and soil active C in CTL could
be explained by differences in sampling. Root structures can affect the chemical,
physical and biological properties of the soil and have differing levels of CO2
respiration, leading to altered GHG flux from different systems (Larionova et al.,
2006; Skiba et al., 1998). The amended samples were taken from between the rows of
corn, where some roots were included but the shoots were excluded, while in CTL the
chambers were placed over a portion of shoots and roots, causing CO2 values to be
affected by root respiration and plant CO2 uptake.
Methane
Our results generally showed net CH4 consumption for all treatments, with no
significant differences relative to CTL or between months. Instances in which net
production was observed never had a flux greater than 0.2 mg CH4-C/m2/d (Fig. 1.3).
The CH4 flux values from our CTL and amended plots are within the range of -18.6
and 28.7 mg CH4-C/m2/d reported for studies of organic and mineral fertilizer-
amended agricultural soils (Lessard et al, 1997; Mapanda et al., 2011). Avizinis (2012)
reported fluxes between -3.6 and 0.2 mg CH4-C/m2/d from undisturbed soils at a
similar site, within the range of those found in our study.

23
We found that the magnitude and direction of methane flux was highly variable,
regardless of amendment type. Methane production (methanogenesis) and oxidation
are microbial soil processes, both of which take place in agricultural soils (Duxbury,
1994; Segers, 1998; Johnson et al., 2007). Agricultural soils can be sinks, sources or
neutral for CH4 flux depending on the growing season, soil treatments, moisture
content, and N levels (Duxbury, 1994;Johnson et al., 2007; Mapanda et al., 2011). The
magnitude and direction of methane flux values show a high degree of spatial and
temporal variability (Conrad, 1996; Lessard et al., 1997; Smith et al., 2000). The
variable nature of CH4 flux is related to the conditions and substrates required for
methanogenesis and CH4 oxidation. Net CH4 production is a result of higher
methanogenesis than CH4 oxidation. Methanogenic archaea require anoxic conditions
(found in microsites in aerobic soils) as well as substrates (acetate, CO2, and H2) that
are produced by fermentation. Even when conditions necessary for methanogenesis
are met, methanotrophic bacteria present in agricultural soils can oxidize CH4
produced in the soil and CH4 present in the atmosphere, resulting in net CH4
consumption if the rate of consumption offsets CH4 production.
We found significant positive correlations between CH4 flux and EC for CTL,
CH4 flux and temperature for DFW, and CH4 flux and active C for MC (Table 1.3).
The correlation between CH4 flux and EC for the CTL could result from the
buckwheat in the CTL plots. When buckwheat is growing at its fastest, N is quick to
mineralize, which would have increased the amount of NH4+ present, creating
competition with CH4 for methane monooxygenase and resulting in lower net
consumption of CH4 (Bjorkman, 2009). Increased salinity can also result in reduced
24
nitrification (Adviento-Borbe et al., 2006), which would also lead to increased levels
of NH4+. This may have taken place in the CTL treatment, but not the amended soils,
because the amended plots were growing corn, which affects the levels of NH4+ and
changes in EC differently than buckwheat.
A positive correlation between CH4 flux and temperature has been shown
previously, with rising temperatures leading to increased aerobic microbial activity
(Conrad, 1996). This reduces O2 availability, creating anoxic microsites and promoting
fermentation processes, which produce substrates for methanogenesis. The correlation
between active C and CH4 flux may represent a similar mechanism to that involving
increased temperature, with higher levels of labile C causing increased microbial
oxygen consumption (Garcia-Marco et al., 2014). In addition, these relationships may
involve reduced CH4 oxidation from increased levels of NH4+ in soil, which inhibits
methane oxidation (Conrad, 1996; Thangarajan et al., 2013).
The absence of significant correlation between CH4 flux and most soil properties is
likely explained by the variable nature of CH4 flux from agricultural soils, which is
driven by the complex series of conditions needed for methanogenesis.
Methanogenesis generally takes place in anoxic microsites in agricultural soils, which
are established under certain moisture regimes. Additionally, the presence of NH4+ can
interfere with CH4 oxidation, introducing another confounding variable into the
relationship between CH4 flux and soil properties.
Nitrous oxide
Nitrous oxide flux in our study ranged between -0.7 and 0.6 mg N2O-N/m2/d –
except for CTL in June (0.8 mg N2O-N/m2/d). This is generally lower than reported by

25
others. For example, N2O fluxes as high as 0.7 mg N2O-N/m2/d (Skiba et al, 1998;
Odlare et al., 2012) and 0.8 mg N2O-N/m2/d (Mapanda et al., 2011) have been
reported for agricultural and semi-natural soils in Scotland, agricultural soil amended
with two types of biogas residues in a lab experiment, and soil amended with
composted manure or mineral fertilizer growing corn in Zimbabwe, respectively.
Values of N2O flux from corn plots in conditions similar to ours ranged between -0.04
to 10.84 mg N2O-N/m2/d (Molodovskaya et al., 2010) and 5.1 to 19.9 mg N2O-N/m
2/d
(Amador and Avizinis, 2013).
Like CH4, N2O flux shows high spatial and temporal variability that are dependent
on soil conditions (Cayula et al., 2010; Flessa et al., 1995; Johnson et al., 2007;
Loecke and Robertson, 2009). Nitrous oxide is produced primarily via nitrification and
denitrification, largely controlled by O2 diffusion in soil, and subject to the influence
of many factors, including soil properties and the physical and chemical properties of
amendments (Garcia-Marco et al., 2014; Mukherjee et al., 2014).
Differing N2O fluxes could be due to differing amounts and types of N introduced
by the amendments (Table 1.1). Since the organic amendments were added based on
total C inputs to soil, the amount and type of N added by each amendment were
different. Higher N2O fluxes could also be the result of the physical and chemical
properties of the amendments, which affect O2 diffusion and rates of nitrification and
denitrification (Zhu et al., 2015). Denitrification is a heterotrophic process in which C
and N cycling are coupled. The addition of organic C and its composition (labile or
recalcitrant) could affect N2O flux by providing organic C for denitrification and/or

26
increasing microbial respiration, which would lead to lower O2 availability, promoting
denitrification (Garcia-Marco et al., 2014; Mukherjee et al., 2014).
Because NH4+ and NO3
- are substrates, respectively, for nitrification and
denitrification, we expected to find a correlation between soil inorganic N and N2O
flux, but no significant correlations were found (Table 1.3). Others have also reported
on the absence of a relationship between inorganic N and N2O flux. For example,
Adviento-Borbe et al. (2006) found that N2O flux was more likely related to soil N
turnover than the size of the inorganic N pool. However, we observed a significant,
positive correlation between moisture content and N2O flux for PF. Nitrous oxide can
result from incomplete denitrification due to the presence of O2 (Sylvia et al., 2005).
While increased soil moisture content results in decreased O2 diffusion and anoxic
microsites where denitrification can take place, some O2 is still present in the soil.
Since PF was 1.02 g moisture/g amendment when it was added to the plots,
incorporating the amendment into the soil may have created conditions leading to
incomplete denitrification.
There was also a significant negative correlation between pH and N2O flux from
BIO. Decreases in soil pH can be caused by nitrification, when H+ are released as
NH4+ is oxidized to NO3
-, which reduces the pH of the soil. Additionally, decreased
soil pH and the ratio of N2O:N2 produced from denitrification are correlated, with a
higher ratio of N2O:N2 resulting from acidic conditions (Amos et al., 2005;
Thangarajan et al., 2013; McMillan et al., 2016). This correlation could be the result of
nitrification causing decreased soil pH resulting in higher N2O:N2 ratio in the BIO
amended plots.
27
Conclusions
The use of RWM as soil amendments affected the magnitude, direction and timing
of GHG fluxes from an agricultural field planted with corn. Maximum CO2 flux for
the amendments that were not composted (CTL, DFW and PF) – with the highest
amount of readily degradable C – was highest in June, whereas amendments that were
composted – and therefore had the lowest amount of readily degradable C – did not
reach maximum CO2 flux until August. Net flux of CH4 and N2O fluctuated between
production and consumption, with no observable temporal pattern for any of the
treatments tested. The GHG fluxes in our study were within the range of those
reported by others in the same or similar soils and conditions, suggesting that, with
few exceptions, use of these RWMs as soil amendments may not cause substantial
increases in GHG fluxes. In comparison to keeping a field sown with a cover crop of
buckwheat instead of in sweet corn production, there were also few significant
differences.
The overall lack of significant correlation between GHG flux and soil properties,
especially for CH4 and N2O flux, is likely due to complex events involved in
production/consumption of these gases and the narrow range of soil properties, like
moisture content and temperature. The impact of uncontrolled variables common to
field studies, such as precipitation, temperature and unaccounted nutrient additions,
could also contribute to the lack of correlation, but even with these variables, the GHG
fluxes we observed were not concerning. We suggest using a microcosm-scale
experiment to further evaluate the effects of environmental variables on the flux of
GHG in soils amended with RWM.
28
Acknowledgements
We are grateful for assistance from the staff and students at the University of
Rhode Island Greene H. Gardiner Crop Science Field Laboratory and the Laboratory
of Soil Ecology and Microbiology. This study was funded in part by Rhode Island
Agricultural Experiment Station and the University of Rhode Island International
Center.

29
References
Adviento-Borbe, M. A. A., Doran, J. W., Drijber, R. A., & Dobermann, A. 2006. Soil
electrical conductivity and water content affect nitrous oxide and carbon
dioxide emissions in intensively managed soils. Journal of Environmental
Quality, 35(6), 1999-2010.
Allison, S. D., Wallenstein, M. D., & Bradford, M. A. 2010. Soil-carbon response to
warming dependent on microbial physiology. Nature Geoscience, 3(5), 336-
340.
Alvarenga, P., Mourinha, C., Farto, M., Santos, T., Palma, P., Sengo, J., Morais, M.,
& Cunha-Queda, C. 2015. Sewage sludge, compost and other representative
organic wastes as agricultural soil amendments: Benefits versus limiting
factors. Waste Management, 40, 44-52.
Amador, J. A., & Avizinis, E. J. 2013. Response of nitrous oxide flux to addition of
anecic earthworms to an agricultural field. Open Journal of Soil Science, 3,
100-106.
Amos, B., Arkebauer, T. J., & Doran, J. W. 2005. Soil surface fluxes of greenhouse
gases in an irrigated maize-based agroecosystem. Soil Science Society of
America Journal, 69(2), 387-395.
Annabi, M., Houot, S., Francou, C., Poitrenaud, M., & Bissonnais, Y. L. 2007. Soil
aggregate stability improvement with urban composts of different
maturities. Soil Science Society of America Journal, 71(2), 413-423.
Avizinis, E.J. 2012. The Indirect Effect of Earthworms on Methane Flux in Two
Temperate Pasture Soils. Open Access Master's Theses. Paper 96.
Ball, B. C., Griffiths, B. S., Topp, C. F., Wheatley, R., Walker, R. L., Rees, R. M.,
Watson, C.A., Gordon, H., Hallett, P.D., McKenzie, B.M., & Nevison, I. M.
2014. Seasonal nitrous oxide emissions from field soils under reduced tillage,
compost application or organic farming. Agriculture, Ecosystems &
Environment, 189, 171-180.
Bjorkman, T. 2009. Soil and Fertilizer for Buckwheat. Retrieved February 16, 2016,
from http://www.hort.cornell.edu/bjorkman/lab/buck/guide/soil&fertilizer.php
Cayuela, M. L., Velthof, G. L., Mondini, C., Sinicco, T., & Van Groenigen, J. W.
(2010). Nitrous oxide and carbon dioxide emissions during initial
decomposition of animal by-products applied as fertilisers to soils. Geoderma,
157(3), 235-242.
30
Conrad, R. 1996. Soil microorganisms as controllers of atmospheric trace gases (H2,
CO, CH4, OCS, N2O, and NO). Microbiological Reviews, 60(4), 609-640.
Davidson, E., Belk, E., & Boone, R. D. 1998. Soil water content and temperature as
independent or confounded factors controlling soil respiration in a temperate
mixed hardwood forest. Global Change Biology, 4(2), 217-227.
Duxbury, J. M. 1994. The significance of agricultural sources of greenhouse gases.
Fertilizer Research, 38(2), 151-163.
Flessa, H., Dörsch, P., & Beese, F. 1995. Seasonal variation of N2O and CH4 fluxes in
differently managed arable soils in southern Germany. Journal of Geophysical
Research: Atmospheres, 100(D11), 23115-23124.
García-Marco, S., Ravella, S. R., Chadwick, D., Vallejo, A., Gregory, A. S., &
Cárdenas, L. M. 2014. Ranking factors affecting emissions of GHG from
incubated agricultural soils. European Journal of Soil Science, 65(4), 573-583.
Johnson, J. M. F., Franzluebbers, A. J., Weyers, S. L., & Reicosky, D. C. 2007.
Agricultural opportunities to mitigate greenhouse gas emissions.
Environmental pollution, 150(1), 107-124.
Johnson, J. M., Archer, D., & Barbour, N. 2010. Greenhouse gas emission from
contrasting management scenarios in the northern Corn Belt. Soil Science
Society of America Journal, 74(2), 396-406.
Lal, R., & Bruce, J. P. 1999. The potential of world cropland soils to sequester C and
mitigate the greenhouse effect. Environmental Science & Policy, 2(2), 177-
185.
Larionova, A. A., Sapronov, D. V., De Gerenyu, V. L., Kuznetsova, L. G., &
Kudeyarov, V. N. (2006). Contribution of plant root respiration to the CO2
emission from soil. Eurasian Soil Science, 39(10), 1127-1135.
Lessard, R., Rochette, P., Gregorich, E. G., Desjardins, R. L., & Pattey, E. 1997. CH4
fluxes from a soil amended with dairy cattle manure and ammonium
nitrate. Canadian Journal of Soil Science, 77(2), 179-186.
Li, L. J., You, M. Y., Shi, H. A., Ding, X. L., Qiao, Y. F., & Han, X. Z. 2013. Soil
CO2 emissions from a cultivated Mollisol: Effects of organic amendments, soil
temperature, and moisture. European Journal of Soil Biology, 55, 83-90.
Linn, D. M., & Doran, J. W. 1984. Effect of water-filled pore space on carbon dioxide
and nitrous oxide production in tilled and nontilled soils. Soil Science Society
of America Journal, 48(6), 1267-1272.

31
Loecke, T. D., & Robertson, G. P. (2009). Soil resource heterogeneity in terms of
litter aggregation promotes nitrous oxide fluxes and slows decomposition. Soil
Biology and Biochemistry, 41(2), 228-235.
Long, R. J., Brown, R. N., & Amador, J. A. 2016. Growing food with garbage: Effects
of six waste amendments on soil and vegetable crops. HortScience (In
preparation).
Mapanda, F., Wuta, M., Nyamangara, J., & Rees, R. M. 2011. Effects of organic and
mineral fertilizer nitrogen on greenhouse gas emissions and plant-captured
carbon under maize cropping in Zimbabwe. Plant and soil, 343(1-2), 67-81.
McMillan, A. M., Pal, P., Phillips, R. L., Palmada, T., Berben, P. H., Jha, N., Saggar,
S., & Luo, J. 2016. Can pH amendments in grazed pastures help reduce N 2 O
emissions from denitrification? –The effects of liming and urine addition on
the completion of denitrification in fluvial and volcanic soils. Soil Biology &
Biochemistry, 93, 90-104.
Molodovskaya A, M., Singurindy A, O., Richards A, B. K., Warland B, J. S., &
Steenhuis A, T. S. 2010. Monitoring nitrous oxide emissions from manure-
fertilized alfalfa and corn cropland in the Northeastern US. In Proceedings of
the 19th World Congress of Soil Science: Soil solutions for a changing world,
Brisbane, Australia, 1-6 August 2010. Congress Symposium 4: Greenhouse
gases from soils (pp. 164-167). International Union of Soil Sciences (IUSS),
c/o Institut für Bodenforschung, Universität für Bodenkultur.
Mondini, C., Cayuela, M. L., Sinicco, T., Cordaro, F., Roig, A., & Sánchez-
Monedero, M. A. 2007. Greenhouse gas emissions and carbon sink capacity of
amended soils evaluated under laboratory conditions. Soil Biology &
Biochemistry, 39(6), 1366-1374.
Mukherjee, A., Lal, R., & Zimmerman, A. R. 2014. Effects of biochar and other
amendments on the physical properties and greenhouse gas emissions of an
artificially degraded soil. Science of the Total Environment, 487, 26-36.
Nazaries, L., Tottey, W., Robinson, L., Khachane, A., Al-Soud, W. A., Sørenson, S.,
& Singh, B. K. 2015. Shifts in the microbial community structure explain the
response of soil respiration to land-use change but not to climate warming. Soil
Biology & Biochemistry, 89, 123-134.
Odlare, M., Abubaker, J., Lindmark, J., Pell, M., Thorin, E., & Nehrenheim, E. 2012.
Emissions of N2O and CH4 from agricultural soils amended with two types of
biogas residues. Biomass and Bioenergy, 44, 112-116.
Paterson, E., Neilson, R., Midwood, A. J., Osborne, S. M., Sim, A., Thornton, B., &
Millard, P. 2011. Altered food web structure and C-flux pathways associated
with mineralisation of organic amendments to agricultural soil. Applied Soil
Ecology, 48(2), 107-116.

32
Possinger, A.R. & Amador, J.A. 2016. Preliminary evaluation of seaweed application
effects on soil quality and yield of sweet corn (Zea mays L.). Communications
in Soil Science and Plant Analysis, 47(1), 121-135.
Raich, J. W., & Mora, G. 2005. Estimating root plus rhizosphere contributions to soil
respiration in annual croplands. Soil Science Society of America Journal, 69(3),
634-639.
Saison, C., Degrange, V., Oliver, R., Millard, P., Commeaux, C., Montange, D., & Le
Roux, X. 2006. Alteration and resilience of the soil microbial community
following compost amendment: effects of compost level and compost‐borne
microbial community. Environmental Microbiology, 8(2), 247-257.
Schaufler, G., Kitzler, B., Schindlbacher, A., Skiba, U., Sutton, M. A., &
Zechmeister‐Boltenstern, S. 2010. Greenhouse gas emissions from European
soils under different land use: effects of soil moisture and
temperature. European Journal of Soil Science, 61(5), 683-696.
Segers, R. 1998. Methane production and methane consumption: a review of processes
underlying wetland methane fluxes. Biogeochemistry, 41(1), 23-51.
Skiba, U. M., Sheppard, L. J., MacDonald, J., & Fowler, D. 1998. Some key
environmental variables controlling nitrous oxide emissions from agricultural
and semi-natural soils in Scotland. Atmospheric Environment, 32(19), 3311-
3320.
Smith, K. A., Dobbie, K. E., Ball, B. C., Bakken, L. R., Sitaula, B. K., Hansen, S.,
Brumme, R., Borken, W., Christensen, S., Prieme, A., Fowler, D., Macdonald,
J.A., Skiba, U., Klemedtsson, L., Kasimir-Klemedtsson, A., Degorska, A., &
Orlanski, P. 2000. Oxidation of atmospheric methane in Northern European
soils, comparison with other ecosystems, and uncertainties in the global
terrestrial sink. Global Change Biology, 6(7), 791-803.
Smith, K. A., Ball, T., Conen, F., Dobbie, K. E., Massheder, J., & Rey, A. 2003.
Exchange of greenhouse gases between soil and atmosphere: interactions of
soil physical factors and biological processes. European Journal of Soil
Science, 54(4), 779-791.
Solomon, S. (Ed.). 2007. Climate change 2007-the physical science basis: Working
group I contribution to the fourth assessment report of the IPCC (Vol. 4).
Cambridge University Press.
Stocker, T. F. (Ed.). 2014. Climate change 2013: The physical science basis: Working
Group I contribution to the Fifth assessment report of the Intergovernmental
Panel on Climate Change. Cambridge University Press.

33
Sylvia, D.M., Fuhrman, J.J., Hartel, P.G. and Zuberer, D.A. 2005. Principles and
Applications of Soil Microbiology, 2nd ed. Prentice-Hall, Upper Saddle River,
NJ.
Thangarajan, R., Bolan, N. S., Tian, G., Naidu, R., & Kunhikrishnan, A. 2013. Role of
organic amendment application on greenhouse gas emission from soil. Science
of the Total Environment, 465, 72-96.
United States Environmental Protection Agency. 2012. Municipal solid waste
generation, recycling, and disposal in the United States: Facts and figures for
2012. Retrieved from
http://www3.epa.gov/epawaste/nonhaz/municipal/pubs/2012_msw_fs.pdf
Weil, R.R., Islam, K.R., Stine, M.A., Gruver, J.B., and Samson-Liebig, S.E. 2003.
Estimating active carbon for soil quality assessment: A simplified method for
laboratory and field use. American Journal of Alternative Agriculture, 18(1), 3-
17.
Zhu, K., Bruun, S., Larsen, M., Glud, R. N., & Jensen, L. S. 2015. Heterogeneity of
O2 dynamics in soil amended with animal manure and implications for
greenhouse gas emissions. Soil Biology & Biochemistry, 84, 96-106.

34
Figures and Tables
Table 1.1. Characteristics of pre-amended soil and of amendments applied in 2014. Values are means
(n=3-4). After Long et al. (2016).
Amendment NH4+ NO3
- C N C:N
Water
Cont.
Org.
Matter EC pH
Active
C
mg/kg mg/kg % % % % mS g C/kg
Pre-amendment soil§ 1.4 2.7 - - - 18 6 - - 0.47
Biosolids/yardwaste co-
compost 47.6 4009 33 3 10.3 45 54 7.0 7.9 55.98
Dehydrated food waste 36.1 205 49 3 14.4 3 63 10.1 5.5 98.70
Multisource compost 431 392 15 2 9.2 40 19 5.3 7.1 49.73
Mineral fertilizer - - - - - 0 0 345 4.6 50.26
Paper fiber/chicken
manure (7:1 ratio) 331 1226 40 1 33.9 102 79 9.5 6.4/7.0* 62.03*
Yardwaste compost 201 2.23 20 2 13.0 78 34 1.8 6.7 52.82
§ Mean value based on samples of all plots used to grow sweet corn pre-amendment (n = 28).
* Paper fiber and chicken manure were measured separately
35
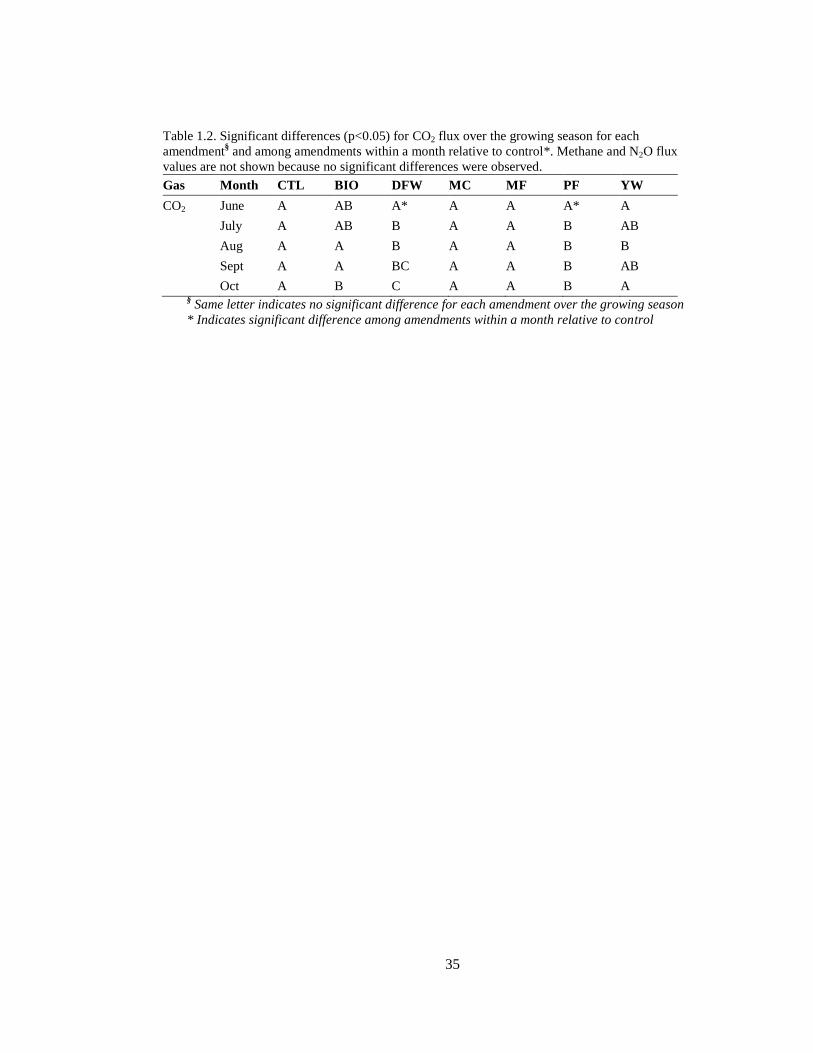
Table 1.2. Significant differences (p<0.05) for CO2 flux over the growing season for each
amendment§ and among amendments within a month relative to control*. Methane and N2O flux
values are not shown because no significant differences were observed.
Gas Month CTL BIO DFW MC MF PF YW
CO2 June A AB A* A A A* A
July A AB B A A B AB
Aug A A B A A B B
Sept A A BC A A B AB
Oct A B C A A B A § Same letter indicates no significant difference for each amendment over the growing season
* Indicates significant difference among amendments within a month relative to control
36
Table 1.3. Pearson product moment correlation coefficients of relationships between GHG flux and
soil properties. Bold values indicate significant correlation (p<0.05).
Gas
flux Variable
Amendment
All CTL BIO DFW MC MF PF YW
CO2 Soil active C -0.18 0.94 0.40 -0.82 -0.29 0.38 -0.77 0.29
Temperature 0.49 0.66 0.58 0.87 0.72 0.46 0.81 0.15
Electrical
conductivity 0.17 0.82 0.28 0.83 0.67 0.00 0.79 0.09
Inorganic N 0.03 0.53 0.33 -0.07 0.68 0.02 0.63 0.10
pH -0.20 0.29 -0.01 -0.15 -0.17 -0.03 -0.30 0.34
Moisture content 0.14 0.51 -0.12 -0.07 0.40 0.37 -0.11 0.21
CH4 Soil active C 0.12 0.87 0.01 -0.63 0.92 0.43 0.47 0.49
Temperature 0.03 0.31 -0.84 0.90 -0.38 0.51 0.31 -0.26
Electrical
conductivity -0.15 0.94 -0.78 0.80 -0.44 0.05 0.14 -0.05
Inorganic N -0.18 0.77 -0.83 0.07 -0.48 0.14 0.16 0.10
pH 0.14 0.30 0.60 -0.23 0.75 -0.39 0.16 -0.74
Moisture content -0.08 0.72 0.20 -0.20 -0.12 -0.14 0.01 -0.31
N2O Soil active C -0.04 0.36 0.42 -0.68 0.68 -0.03 -0.61 0.11
Temperature 0.15 0.50 0.31 0.60 -0.01 -0.82 0.12 -0.21
Electrical
conductivity 0.21 0.58 0.44 0.64 0.00 -0.52 0.51 0.10
Inorganic N 0.01 0.49 0.36 0.17 -0.12 -0.61 0.48 0.26
pH -0.04 -0.04 -0.89 -0.45 0.03 0.80 0.24 -0.16
Moisture content 0.01 -0.14 -0.85 0.09 -0.86 0.24 0.92 0.45
* Air temperature within the flux chamber.
37
CTL CTL CTL CTL
BUFFER STRIP
DFW MC N/A YW BIO PF MF YW BIO MF MC N/A PF DFW
BIO YW PF DFW MC MF N/A DFW N/A BIO PF YW MF MC
Figure 1.1. Diagram of treatment layout. CTL = control; BIO = biosolids and yardwaste co-compost;
DFW = dehydrated food waste; MC = multisource compost; MF = mineral fertilizer; PF = paper fiber
with chicken manure; YW = yardwaste compost; N/A = not applicable to this study. Not to scale.

38
Figure 1.2. Daily average soil moisture and soil temperature at 10 cm during the 2014 growing season
as reported by the U.S. Climate Reference Network station at the Green H. Gardiner Crop Science Field
Laboratory in Kingston, RI. Vertical dashed lines indicate dates when flux measurements and soil
sampling took place. http://www.ncdc.noaa.gov/crn/

39
Figure 1.3. Mean (n=4) flux of CO2, CH4 and N2O in control and amended plots during the 2014
growing season. Bars represent one standard deviation of the mean. CTL = control; BIO = biosolids and
yardwaste co-compost; DFW = dehydrated food waste; MC = multisource compost; MF = mineral
fertilizer; PF = paper fiber with chicken manure; YW = yardwaste compost.

40
MANUSCRIPT – II: RESPONSE OF AGRICULTURAL SOIL TO
AMENDMENT WITH RESIDUAL WASTE MATERIALS: EFFECTS OF
TEMPERATURE AND MOISTURE ON GREENHOUSE GAS FLUX
In preparation for submission to Journal of Environmental Quality
Ashley Waggoner, Rebecca Long and Jose A. Amador
Laboratory of Soil Ecology and Microbiology, University of Rhode Island, Kingston, RI 02881

41
Abstract
The conversion of forests to agricultural lands, followed by long-term agricultural
use can lead to lower levels of soil organic matter (SOM). The loss of SOM in
agricultural soils can be counteracted by amendment with residual waste materials
(RWM) like biosolids and composts. These materials add C and N to the soil,
affecting physical, chemical, and biological properties and processes, including
production of C and N-containing greenhouse gases (GHGs): CO2, CH4 and N2O.
This, coupled with spatial and temporal variations in temperature and moisture,
control the flux of C and N-containing GHGs from soil. We used microcosms to
investigate the magnitude and direction of GHG flux as a function of soil temperature
and moisture in an agricultural soil amended with RWM. Soil was amended with 10
Mg total C ha-1
in the form of paper fiber with chicken manure (PF), dehydrated food
waste (DFW), yard waste compost (YW), biosolids and yard waste compost (BIO),
multisource compost (MC), or 112 kg N ha-1
of mineral fertilizer (MF). Un-amended
soil was used as a control (CTL). Soil moisture was adjusted to permanent wilting
point, field capacity or saturation. Microcosms were incubated at 10, 15, 20, or 25°C
and gas concentrations determined over 14 days. The highest CO2 flux was observed
at 25°C and field capacity, with CO2 production following the order
DFW>MC>CTL>PF>MF>BIO>YW. When compared to the CTL, CO2 flux from
DFW was higher at most moisture-temperature combinations, while MF and YW were
always lowest. CO2 flux was not correlated with levels of active C in the amendments.
Net CH4 flux was not affected by moisture differences among treatments, but varied in
response to temperature and amendment. Nitrous oxide production was most
42
responsive to moisture, regardless of temperature and amendment type. Most
amendments did not result in increased GHG flux relative to CTL, and in some
instances resulted in decreased flux for CH4 and N2O at moisture contents and
temperatures likely to be encountered in the field. The exception was DFW, which
produced the largest flux of CO2 at 20°C and field capacity, of N2O at 20°C and
saturation, and the second largest flux of CH4 at 20°C and saturation. Relative to the
CTL, most amendments did not increase global warming potential from GHG
emissions, except under saturated conditions, where increased N2O production was
realized. In general, RWM – except for DFW – do not cause increased GHG fluxes of
concern.

43
Introduction
Soil organic matter (SOM) is essential for microbial soil processes involved in
production and consumption of C and N-containing greenhouse gases (GHGs),
including CO2, CH4 and N2O (Sylvia et al., 2005; Smith et al., 2003). The conversion
of forests and grasslands to agriculture and long-term agricultural practices, such as
tillage, has led to lower levels of SOM in agricultural soils (Balesdent et al., 2000).
The growing need to lower the amount of organic waste materials deposited into
landfills and released into the environment as pollutants has led to the evaluation of
alternative uses for residual waste materials (RWM), such as biosolids, biochar,
composts, and other residuals from industrial and waste disposal processes (Long et
al., 2016; Cayuela et al., 2010; Lal and Bruce, 1999; Li et al., 2013; Mondini et al.,
2007; Thangarajan et al., 2013; Zhu and Bruun, 2014). One alternative is the use of
organic RWM as soil amendments to counteract the loss of SOM and/or as a source of
nutrients in agricultural soils (Long et al., 2016; Huang et al., 2004; Johnson et al.,
2007; Li et al., 2013; Thangarajan et al., 2013, Zhu and Bruun, 2014).
Amendment of soil with RWM adds C and N-containing substrates, which directly
and indirectly affect physical, chemical, and biological properties and processes, and
ultimately GHG flux. In a review, Thangarajan et al. (2013) explain how the use of
organic amendments in soil leads to alteration of soil properties, and subsequently
methanogenesis, nitrification, denitrification, and priming effects. Additionally,
organic amendments can affect GHG flux through the direct emission of GHG from
the amendments, and indirectly by affecting the soil biogeochemical processes that
create these GHG.

44
Most biogeochemical processes in soil are strongly impacted by fluctuations in
temperature and moisture (Allison et al., 2010; Conant et al., 2011; Singh and Gupta,
1977; Linn and Doran, 1984; Schaufler et al., 2010). Soil moisture controls aeration
because water directly competes with air for pore space and slows down O2 diffusion
(Schaufler et al., 2010). When water filled pore space (WFPS) is low, there is more
opportunity for gas exchange between the soil and the atmosphere, allowing for
greater diffusion of O2 into the soil and release of CO2 from the soil. Although greater
diffusion of O2 allows for increased O2 consumption by microorganisms, low WFPS
can cause microbial osmotic stress and restrict the diffusion of substrates, affecting the
rate of microorganism utilization and decomposition of those substrates (Schaufler et
al., 2010). Alternatively, when WFPS is too high, O2 diffusion is restricted, leading to
anoxic conditions, and decreased rates of aerobic microbial activity. Linn and Doran
(1984) found that at ~60% WFPS microbial respiration is at a maximum, and there is
generally adequate O2 diffusion for aerobic microbial activity and sufficient moisture
for substrate diffusion, producing suitable environmental conditions for aerobic
microbial activity.
Microbial physiology and enzyme activity are temperature-sensitive (Allison et
al, 2010), such that changes in soil temperature affect the rate of C mineralization,
fermentation, methanogenesis, nitrification and denitrification. At low temperatures,
microbial processes generally experience reduced rates, which increase with rising
temperatures. This increase is faster when rising from lower temperatures, and
becomes more gradual at higher temperatures (Kirschbaum, 1995). Optimal
temperature is dependent on the process, soil, and possibly the physiological
45
adaptation of the microorganisms in soil from different locations (Fang and Moncrieff,
2001). Soil moisture also affects the amount of energy needed to warm the soil, further
confounding the effects of soil moisture and temperature.
Through alterations to the soil environment and substrate availability, the
combination of temperature and moisture amplify effects on the rate of SOM
decomposition and C and N biogeochemical processes, and thus GHG production and
consumption. Increased CO2 production can result from increasing soil moisture
content and temperature, which leads to increases in the rate of microbial activity and
O2 consumption, while restricting O2 diffusion. This can lead to the establishment of
anaerobic microsites that support microbial production of CH4 and its precursors, as
well as nitrification and denitrification, which produce N2O.
Most studies of RWM have focused on the impact of traditional amendments, like
green composts or manures, on crop yields and soil properties (Johnson et al., 2007).
In contrast, there is little information about the effects of novel RWM like paper fiber,
dehydrated food waste, yardwaste and biosolids co-compost and multisource
composts. Because of their potential effects on soil properties and biogeochemical
processes, the use of novel RWM as agricultural amendments can affect the flux of
CO2, CH4 and N2O from agricultural soils (Thangarajan et al, 2013). Agricultural soils
are already a concern when it comes to GHG fluxes due to the release of previously
stored carbon as CO2 and CH4, as well as N2O production from fertilizer. Due to the
higher global warming potential of CH4 and N2O fluxes (25 and 298 times that of
CO2, respectively) (IPCC, 2007), potential increases in the flux of these gases are of
particular concern. Therefore, it is important to understand the impact of the use of

46
RWM as soil amendments on GHG fluxes before advocating their use in agricultural
production.
In a previous field study (Waggoner et al, 2016), we examined the effects of novel
RWM as soil amendments on GHG flux in soil used to grow sweet corn. Soil was
amended with paper fiber with chicken manure (PF), dehydrated food waste (DFW),
yard waste compost (YW), biosolids and yard waste compost (BIO), multisource
compost (MC), or mineral fertilizer (MF). Plots amended with DFW or PF had
maximum CO2 flux in June, while maximum CO2 flux was observed from composted
amendments (BIO, MC, YW) and MF in August. We generally found net CH4
consumption during the study, and although there was also net CH4 production, fluxes
were never significantly different from the control. Nitrous oxide flux was variable
between months and amendments, with no detectable temporal patterns. The lack of
control on environmental variables in the field study made it difficult to identify the
factors controlling GHG fluxes, leading to our lab experiment. In the present study, we
used microcosms with soil moisture adjusted to permanent wilting point, field
capacity, and saturation and incubated at temperatures of 10, 15, 20, and 25°C – a
range of conditions likely to be encountered in the field – to better understand the role
of temperature and moisture in controlling GHG fluxes from soil amended with
RWM. Our objectives are to discern (i) how GHG fluxes in amended soils responded
to changes in temperature and moisture, and (ii) the role of active C in the
amendments, and changes in soil pH, electrical conductivity, and inorganic N on GHG
flux. Based on results from the field study, we expected higher GHG flux from
microcosms amended with DFW. Additionally, we hypothesized that the level of

47
active C in the amendments would affect the rate of CO2 flux, with amendments
having less active C producing a higher CO2 flux later in the incubation.
48
Materials and Methods
Microcosms
We used microcosms to test the combined effects of temperature and moisture on
GHG flux and soil properties after amendment with RWM or a mineral fertilizer.
Microcosms consisted of 0.95-L glass Mason jars filled with 150 g dry weight soil and
fitted with rubber septa in the lids for gas sampling. The soil was mapped as an
Enfield silt loam. It was collected in October 2014 from the top 20 cm of a field
planted with buckwheat (Fagopyrum esculentum) as a cover crop during the 2014
growing season. It was stored at 4°C before being sieved to pass a 2-mm-mesh sieve
and air-dried.
We tested six different amendments: paper fiber mixed with chicken manure (7:1
ratio) (PF), dehydrated food waste (DFW), yard waste compost (YW), biosolids and
yard waste co-compost (BIO), multisource compost (MC), and a mineral fertilizer
(20N-8.7P-16.6K) (MF). Unamended soil served as control (CTL). The RWM were
added at a field equivalent rate of 10 Mg C ha-1
, whereas the mineral fertilizer was
added at a field-equivalent rate of 112 kg N ha-1
.
To account for the flush of CO2 expected when dry soil is rewetted, we incubated
the microcosms at room temperature with lids removed for 2-3 days after adding
deionized (DI) water but before adding the amendments (Kim et al., 2012). The soil
water content was adjusted by adding DI water to achieve a final volumetric soil
moisture content of 10%, 25%, or 44%, corresponding to the permanent wilting point,
field capacity, and saturation, respectively. The bulk density was adjusted to 1.0 g cm-3

49
by tapping the jar on the lab bench, and the microcosms incubated in the dark at 10,
15, 20, or 25°C for 14 days. Each combination of moisture, temperature and
amendment was replicated three times.
Gas sampling and analysis
The concentrations of CO2, CH4, and N2O in the headspace of the microcosms
were determined for gas samples collected every 2 days over 14 days. We used a 20-
mL gas-tight syringe that was pumped repeatedly to mix the gases in the headspace
prior to sample collection. Gas samples were transferred immediately to a 20-mL
evacuated glass vial, and the samples were analyzed using a Shimadzu GC-2014
Greenhouse Gas Analyzer (Shimadzu Corp., Kyoto, Japan) fitted with a flame
ionization detector (for CH4 and CO2 (post-methanizer)) and an electron capture
detector (for N2O). After gas sampling, the lid from each microcosm was removed, the
headspace flushed with humidified compressed air, and the lid replaced.
Ambient concentration of each gas in air sampled from the lab was determined and
subtracted from the concentration of the gas from the headspace of the microcosms.
The resulting concentration, along with headspace volume (0.9 L), the cross-sectional
area (0.0064 m2) of the microcosm, and the incubation time were used to calculate
flux.
Soil sampling and analysis
50-g samples of soil were removed from the microcosms on Day 0, immediately
after addition of the amendments, and on Day 14 of the experiment. Samples were
analyzed for pH, electrical conductivity (EC), NH4+ and NO3
-. Soil pH and EC were
50
determined using a 1:2 soil/water ratio with a Denver Instruments Ultrabasic UB-10
Benchtop pH meter (Denver Instruments, Bohemia, NY) and a Fisher Scientific Dual-
Display conductivity meter (Thermo Fisher Scientific Inc., Waltham, MA),
respectively. After extraction with 2N KCl (Gugino et al., 2009), the concentration of
NH4+ and NO3
- in soil was determined colorimetrically using a microplate method
(Doane and Horwath, 2003; Weatherburn, 1967) with a Biotek Powerwave 340
Microplate Scanning Spectrometer (Biotek Instruments, Inc., Winooski, VT). Soil
moisture content was measured gravimetrically.
Prior to the experiment, the organic matter content of soil was determined by loss-
on-ignition at 550°C for 5 hours. As a measure of labile C, the active C content of the
soil was determined colorimetrically by the potassium permanganate method of Weil
et al. (2003) using a Biotek Powerwave 340 Microplate Scanning Spectrometer to
measure absorbance at 550 nm. Total C and N content were measured by flash
combustion and chromatography with a Costech Instruments ECS 4010 elemental
combustion system CHNS-O (Costech Analytical Tecnologies Inc., Valencia, CA).
Characteristics of the unamended soil are found in Table 2.1.
Characterization of residual waste materials
Total C and N content of the RWM was determined at the University of Rhode
Island Graduate School of Oceanography (Narragansett, RI) using an EA1108 CHN
Analyzer (CE Instruments, Inc., Wigan, Ireland). Levels of NH4+ and NO3
-, pH (1:5
amendment/water ratio) and active C content were determined as described above.
The paper fiber and chicken manure were tested separately, and values for the mixture

51
mathematically calculated at a 7:1 ratio. Characteristics of the individual RWM are
found in Table 2.1.
The RWM were also tested separately for their capacity to produce GHG. Residual
waste material (0.5 g dry weight) was mixed with 5 mL DI water and placed in 38-mL
glass serum bottle. The bottle was capped with a rubber septum, crimp sealed with an
aluminum collar, and incubated at 25°C. Gas samples were collected once per day for
3 days and analyzed as described above. The bottles were flushed with humidified
compressed air and resealed after each sample was collected. Each amendment was
replicated three times.
Statistical analyses
Statistical analyses were performed using SigmaPlot 11.0 (Systat Software Inc., 2008). A
three-way ANOVA using the Holm-Sidak test was used to identify statistically significant (p
< 0.05) differences for the effect of temperature, moisture, and soil amendment relative to the
control for GHG flux, changes in pH, and changes in EC. Pearson product moment correlation
coefficients were used to evaluate the relationship among soil properties and gas flux.

52
Results and Discussion
Carbon dioxide
Time course of CO2 flux. Although we controlled for the flush of gases that result
from rewetting soil (Kim et al., 2012), the maximum CO2 flux (CO2 max) over the
time course of the sampling period always occurred on the first day of sampling, or
shortly thereafter (data not shown). This was similar to reports from Fang and
Moncrieff (2001) on incubation studies of small soil samples. This timing suggests
that maximum flux could be partially related to disturbance of the soil during
microcosm setup, as this happened in all samples, including CTL. The higher flux
could result from a priming effect, caused when a flush of more readily decomposable
nutrients, such as RWM, is added to the soil, increasing activity from previously
dormant microorganisms (Fontaine et al., 2003).
Maximum CO2 flux. Because increasing temperatures lead to increased microbial
activity and higher rates of decomposition (Allison et al., 2010; Conant et al., 2011;
Garcia-Marco et al., 2014), we expected that warmer temperatures would result in an
increased CO2 flux. We found that temperature increased CO2 max for all amendments
and moisture contents, similar to results reported by Amos (2005) and Schaufler et al.
(2010). We observed the highest CO2 max from DFW (81.13 mg CO2-C/m2/d) at 25°C
and field capacity (Fig. 2.1). Under these conditions, CO2 max followed the order:
DFW > MC > CTL > PF > MF > BIO > YW, with values for DFW and MC
significantly higher, and PF, MF, BIO, and YW significantly lower, than CTL (Table
2.2). The remaining amendments (except YW) also reached CO2 max at field capacity
with BIO, CTL, and MF at 20°C and PF and MC at 25°C. Yardwaste compost

53
achieved CO2 max at saturation and 25°C, although the highest CO2 flux for YW at all
other temperatures was at field capacity.
Cumulative CO2 production. To further understand how CO2 flux is affected by
RWM, we determined the cumulative amount of CO2 produced during the 14-d
incubation period. The effect of temperature and moisture observed on CO2 max
persisted, with the highest cumulative CO2 production observed at 20°C (BIO and
DFW) and 25°C (CTL, MC, MF, PF and YW) (Fig. 2.2).
In addition to the effect of temperature on CO2 production, we also observed
significant interactions (p = <0.001) between temperature, moisture and amendment.
The highest cumulative production of CO2 was observed at field capacity for all
amendments except CTL and YW (Fig. 2.2). Saturated soil had higher CO2 production
than soil at permanent wilting point, and both generally had lower CO2 production
than soil at field capacity. Linn and Doran (1984), Fang and Moncrieff (2001), and
Schaufler et al. (2010) had comparable findings, with very dry or very wet conditions
resulting in reduced CO2 flux. The reduced levels of CO2 production in samples at
permanent wilting point are due to decreased moisture content preventing biological
activity (Linn and Doran, 1984). Conversely, increasing water content leads to
increased CO2 production from increased microbial activity, which is variable
depending on soil properties (Linn and Doran, 1984; Schaufler, 2010). Increased water
filled pore space results in reduced O2 availability and diffusion, explaining the
reduced production of CO2 between field capacity and saturated soils (Linn and
Doran, 1984; Schaufler et al, 2010).

54
For cumulative CO2 production, CTL often had higher CO2 flux relative to most
amendments, although the differences were not significant (Table 2.3). Amendment
with DFW and PF often led to increased CO2 production relative to the CTL, possibly
a result of addition of easily decomposable organic C and N substrates from DFW and
PF, which would not have been present in the composted (BIO, MC, and YW)
amendments or MF (Annabi et al., 2007). In contrast, YW and MF led to decreased
CO2 production relative to CTL. This could be due to toxicity or other negative effects
on the microbial community from the YW, or to C immobilization due to the lack of
additional C from MF. Biosolids, PF, and MC did not cause significant changes to
CO2 when compared to CTL, suggesting that they did not alter the soil environment
enough to significantly affect microbial processes.
Amendment CO2 production. Since these were organic amendments – except for
the mineral fertilizer – we expected them to host microbial communities capable of
producing GHG. We examined the possibility that some of the GHG flux from our
amended soils could be produced directly by the amendments. We found that all
amendments, except the DI water that was used as a control, produced CO2 (Fig. 2.3).
Paper fiber had the highest production, with amendments following the order: PF >
BIO > YW > DFW > MC > MF > DI. While the amendments alone did produce GHG,
this contributed to less than 0.002% of the cumulative production from the
microcosms at 25°C. Thus, the flux of CO2 from amended soil was a result of the
interactions caused by the amendments, soil, moisture, and temperature (Paterson et
al., 2011; Saison et al., 2006) and not produced by the amendments themselves.

55
Relationship of CO2 production to active C. The cumulative amount of CO2 from
soil amended with DFW was always significantly higher than CTL (Table 2.3). We
hypothesized that this was due to the level of active C in the amendment, since the
amendments were applied based on equal total C content. We tested the level of active
C in the amendments, expecting that amendments with higher levels of active C would
have higher GHG production, specifically CO2, than amendments with lower levels of
active C (Table 2.1). Specifically, we expected DFW and PF to have the highest levels
of active C and highest GHG flux based on their composition and minimal processing,
since these amendments were not composted, which results in decomposition and
removal of the most active C. In contrast, we expected that composted RWM (BIO,
MC, and YW) would have the lowest GHG fluxes, since active C content would be
lower from microbial decomposition during composting.
The active C content of the amendments was not statistically different. The
amount of active C added by the amendments was also minor compared to the level of
active C already present in the soil (~63 mg active C/microcosm). When the amount of
active C added by the amendments was compared to cumulative CO2 production, we
found that CO2 production was not directly related to the amendment active C levels.
The differences may be better explained by the differences seen through management
of moisture and temperature.
We note that the method used to determine the active C – oxidation with
potassium permanganate – was developed to test active C in soil. Since the C
composition of the amendments is different from soil, this method may not best
represent the biologically available C in the amendments. Meijide et al. (2007) suggest

56
using the C:N ratio in combination with the dissolved organic carbon in order to
predict the effect of amendments on C and N in soil. This could be a better approach
to characterize the C content of amendments and their relationship to GHG flux,
although Long et al. (2016) reported that the C:N ratio of the amendments did not
provide reliable information in regard to N mineralization from these amendments.
Relationship of CO2 production to changes in EC, pH and inorganic N. Changes
in salinity and pH of the soil can affect soil microorganisms and the related
decomposition and mineralization processes (Wichern et al., 2006). We found that
changes in pH were primarily affected by temperature, with moisture having a
minimal effect, while changes in EC were variable between moisture content and
temperature for all amendments (data not shown). Increasing moisture content
generally amplified the effect on EC, possibly a result of increased water content
releasing more ions into the soil solution.
We observed a significant negative relationship between changes in soil pH and
cumulative CO2 flux, with decreased soil pH associated with increased CO2
production (Table 2.4, Fig. 2.5). Additionally, there was a relationship with soil
moisture and temperature (data not shown) evident among samples at 25°C and field
capacity. This could suggest that microbial activity, improved by increased
temperature and moisture, produced higher levels of CO2, leading to decreased pH
from increased processes such as decomposition of organic matter and nitrification.
The varied extent of decrease in pH among the amendments (at 25°C all resulted in
net decrease) could be the result of differences in buffering capacity of the
amendments. Although organic amendments have been used to counteract the effects
57
of salinization (Wichern et al, 2006), or could potentially increase salinity, of which
there are potential detrimental effects to microorganisms (Rietz and Haynes, 2003);
nevertheless, there was no significant relationship between changes in EC and
cumulative CO2 production (Table 2.4, Fig. 2.4).
Although the C and N cycle are tightly coupled, suggesting there may be a
relationship between changes in inorganic N and cumulative CO2 production, no linear
relationship was found (Table 2.4).
Comparison to field study. In the field study (Waggoner et al., 2016), we rarely
saw significant differences between the amended soils and the control, except in June,
when DFW and PF were both significantly higher than the control and on succeeding
sampling dates. While this trend of significantly higher CO2 flux continued for DFW,
we did not always see the same significant differences with PF in the microcosm
incubations.
Methane
Time course of CH4 flux. We observed fluctuations between net production (a
result of a higher rate of methanogenesis than CH4 oxidation) and net consumption
(higher CH4 oxidation than methanogenesis) in CH4 during incubation (data not
shown). Temperature affected the magnitude and timing of the fluctuations. At 25°C,
there was minimal fluctuation from MC, MF, PF, and YW, while DFW and CTL
began the incubation with net production at sampling day 2, but generally resulted in
net consumption after sampling day 6. In contrast, at 10°C, all samples (except MF)
began with net production, with subsequently lower values until day 8, when values
increased again. Both magnitude and timing of fluctuation between net production and

58
net consumption remained variable at 15 and 20°C. These variations in the timing of
the fluctuation could be a result of the need to establish anaerobic microsites and
produce substrates needed for methanogenesis, with the initial production a result of
the incubation after rewetting the soil, but prior to amendment, which we used as a
counter measure for the increased flux of CO2 that comes from rewetting soil.
Maximum CH4 flux. Maximum flux of CH4 (CH4 max) responded with significant
differences to changes in temperature and amendment only at saturation (Fig. 2.1),
which was similar to findings from Garcia-Marco et al. (2014), who reported response
of CH4 flux mainly to soil temperature, with only a small response to moisture. In
general, CH4 max was positive (net production), with increased net production at
higher temperatures. We observed the highest CH4 max from all amendments at 25°C
and saturation following the order DFW > MC > MF > PF > BIO > YW > CTL, but
only YW, BIO, and MC were significantly higher than CTL (Fig. 2.1, Table 2.2). This
could be a result of decreased CH4 oxidation from the increased temperature.
Increased moisture could also restrict the CH4 in the headspace from diffusing into the
soil for oxidation.
Cumulative CH4 production. Cumulative CH4 production followed a trend of
decreased net production/increased net consumption with increasing temperature (Fig.
2.2). Interestingly, at 20°C and saturation, BIO, MC, PF, and YW had net
consumption, while CTL (0.03 mg CH4-C/m2/d) and DFW (0.02 mg CH4-C/m
2/d) had
the highest net production at permanent wilting point and saturation, respectively. At
15°C, CTL had net consumption, whereas most other amendments had net production
(Fig. 2.2).
59
Saturated soil generally produced the highest net production/lowest net
consumption of CH4. This is likely due to increased methanogenesis, a result of
reduced gas diffusion leading to the establishment of anoxic conditions and production
of substrates, as well as from decreased methane oxidation. Decreased oxidation could
also result from reduced gas diffusion, leaving methanotrophs unable to access the
CH4 or O2 necessary for CH4 oxidation (Segers, 1998). In contrast, lower moisture
allows for greater gas diffusion and increased methane oxidation (Smith et al., 2003).
Additionally, because of the need for an anaerobic environment and substrates created
under anoxic conditions for methanogenesis, lower moisture content also leads to less
CH4 production (Smith et al, 2003; Segers, 1998).
Amendment CH4 production. When we examined the amendments separately for
their capacity to produce or consume CH4, all amendments resulted in net CH4
consumption following the order DFW > DI > PF > YW > BIO > MF > MC (Fig. 2.3).
While this suggests that the amendments, once incorporated into the soil, could
promote increased methane oxidation or reduced production, CH4 consumption from
the amendments accounted for a minute fraction of the net change in CH4 levels at
25°C, as was the case for CO2
Relationship of CH4 production to change in N. Methane consumption is sensitive
to N fertilization because there is direct competition for the binding site on methane
monooxygenase between CH4 and NH3 due to their similarity in size and shape
(Sylvia et al., 2005; Schaufler et al, 2010). Because of this and the addition of N
compounds in the amendments, we expected to find a relationship between change in
either inorganic N and CH4 or NH4+ and CH4. No relationship was found for change in

60
inorganic N and CH4, but there was a significant positive correlation between increase
in NH4+ and increased CH4 (Table 2.4, Fig. 2.6 and 2.7). This is likely due to the
increase in NH4+
restricting CH4 oxidation through competition for methane
monooxygenase (Sylvia et al, 2005).
Comparison to field study. The microcosms incubated at warmer temperatures
generally resulted in net CH4 consumption from the amended soils. When we altered
the moisture and temperature of the microcosms, we observed significant interaction
between moisture, temperature and amendments, with significant differences between
the amended soils and CTL. Methane flux in the field study (Waggoner et al., 2016)
was variable, generally resulting net CH4 consumption, regardless of amendment type,
with no significant differences between the amended soils and the CTL.
Nitrous oxide
Time course of N2O flux. We generally observed the highest N2O fluxes (N2O
max) from saturated treatments, while fluxes from treatments at permanent wilting
point and field capacity were minimal. The N2O flux in saturated treatments were
always highest on the first day of sampling for all amendments and CTL at 20 and
25°C (data not shown). However, at 10°C (BIO, MC, MF, and YW) and 15°C (MF
and YW) the highest flux was observed on the second day of sampling. The
differences in the time course for the maximum flux could be the result of incomplete
denitrification caused by high O2 levels, and a function of how quickly the available
O2 in the pore space was consumed. The O2 is consumed more rapidly at warmer
temperatures, producing N2O max earlier. Since O2 diffuses slowly at high WFPS,
denitrification would have resulted in a higher ratio of N2:N2O. Linn and Doran (1984)

61
reported similar findings, with maximum N2O flux via denitrification occurring
shortly after rainfall, which increases WFPS, creating conditions for denitrification.
Maximum N2O flux. Unlike CO2 and CH4 flux, N2O flux did not have significant
interactions between temperature and moisture or amendment, although there was a
significant interaction between moisture and amendment (p = 0.004). The maximum
N2O flux (N2O max) was observed in saturated soil (Fig. 2.1). This is in line with
findings of a positive relationship between moisture and N2O (Schaufler et al., 2010),
but contrary to results showing that N2O flux increased with temperature (Garcia-
Marco et al, 2014; Schaufler et al., 2010). While many amendments produced N2O
max higher or lower than CTL, significant differences only existed at saturation, when
temperature was not considered (data not shown).
Cumulative N2O production. The cumulative amount of N2O produced also
responded to moisture content, with no detectable pattern in response to temperature
(Fig. 2.2). The cumulative N2O produced from amended samples was only significant
when the value was greater than CTL at a specific moisture and temperature (Table
2.3). No trend between amendment, moisture content and temperature was found. The
exception was DFW, which had generally higher production than CTL, and increased
with temperature up to 20°C under saturation.
Amendment N2O production. The amendments by themselves had net N2O
production (Fig. 2.3). The highest N2O production was from YW (0.02 µg N2O-N/g
amendment) with the rest following the order YW > BIO > MC > MF > PF > DFW >
DI. Again, N2O production from the amendments was a minor portion of the N2O flux
from the microcosms.
62
Relationship of N2O production to changes in inorganic N and pH. Most N2O
produced in soil comes from nitrification and denitrification by microorganisms. We
found a negative relationship between change in inorganic N and cumulative N2O
production (Fig. 2.7). This suggests that when the overall change in inorganic N is
negative, N2O net flux is increased, suggesting that nitrification and denitrification are
resulting in N2O production.
To further study the role of inorganic N in N2O production, we also examined the
relationship between change in NH4+ and NO3
-, respectively, with cumulative N2O
production at saturation (data not shown). We found a positive significant correlation
between change in NH4+ and N2O, and a negative significant relationship between
change in NO3- and N2O. In the saturated samples, we observed a general increase in
NH4+ from samples at 20°C (CTL, DFW, MC, YW) and 25°C (all), while NO3
-
decreased at all temperatures, except DFW and MF at 10°C, where it increased. An
increase in NH4+ suggests increased N mineralization and/or release from cation
exchange sites, creating a larger pool of inorganic N. Increased saturation could assist
in this process through the diffusion of substrates or other cations in the soil solution.
The decrease in NO3- with simultaneous N2O production could indicate incomplete
denitrification caused by presence of O2 (Sylvia et al., 2005). Nitrification is another
possible source of N2O production, which as an aerobic process would have also been
likely in the beginning of the incubation when more O2 was diffused throughout the
soil.
Because nitrification can produce N2O and release acidity into the soil, and
decreased soil pH can affect the ratio of N2O:N2 produced from denitrification, we
63
examined the relationship between change in pH and cumulative N2O flux (Fig. 2.5)
(Amos et al., 2005; Thangarajan et al., 2013; McMillan et al., 2016). No relationship
was observed (Table 2.4).
Comparison to field study. In the microcosms, we primarily observed net
production of N2O, while in the field, measurements of N2O varied between net
production and net consumption.
Global warming potential
GHG emissions are commonly converted to their CO2 equivalent in order to
understand the environmental and atmospheric impacts, or global warming potential
(GWP), of increased production. The fluxes of CH4 and N2O from soil to the
atmosphere are smaller than CO2, but these gases are more powerful: CH4 and N2O
have 25 and 298 times, respectively, the global warming potential of CO2 (IPCC,
2007). Thus, small changes to CH4 and N2O fluxes can have greater consequences
than increased CO2. When we converted the cumulative fluxes of CH4 and N2O to
their CO2 equivalent (Fig. 2.8), soils at permanent wilting point and field capacity did
not contribute substantially to the GWP from CH4 or N2O. Only at saturation was
there an increased GWP from CH4 or N2O. This was particularly true to DFW at 20oC,
especially at saturation. Caution is needed with the use of DFW in fields that
experience highly saturated conditions.

64
Conclusions
Carbon dioxide flux was the most affected by moisture, temperature and
amendment interactions, although, only DFW had consistent significantly higher CO2
production than CTL. Biosolids, MC, and YW generally had CO2 production lower
than the CTL, suggesting the amendments may provide beneficial qualities for future
C sequestration without increasing CO2 emission substantially. Dehydrated food waste
and PF often resulted in CO2 production higher than the CTL; but using active C
levels to predict increased CO2 flux did not help to discriminate between the non-
composted and composted amendments.
Methane flux was variable, responding to temperature and amendment with
minimal effect from moisture. Amendment with RWM generally resulted in lower net
CH4 production/net consumption, while the CTL resulted in lower net CH4
consumption/net production. Nitrous oxide production was only observed at
substantial levels under saturation, and was rarely significantly higher than the CTL.
Dehydrated food waste was the exception, with the highest CO2, N2O, and CH4
production under most temperature and moisture conditions, and often significantly
higher than the CTL.
Our results suggest that use of RWM materials as agricultural soil amendments
will have different effects on GHG flux. Greenhouse gas flux responses are affected
by moisture and temperature, but the effect may not be major. To further our
understanding of how the use of RWM as soil amendments alters soil properties and
GHG flux, it would be important to examine different agricultural management and
crop production practices using long term studies.

65
Acknowledgements
We are appreciative for all the assistance from Lisa Tewksbury, the University of
Rhode Island’s College of Environment and Life Sciences Greenhouse, and the
Laboratory of Soil Ecology and Microbiology. Financial support was provided by in
part by Rhode Island Agricultural Experiment Station and the University of Rhode
Island International Center.
66
References
Allison, S. D., Wallenstein, M. D., & Bradford, M. A. 2010. Soil-carbon response to
warming dependent on microbial physiology. Nature Geoscience, 3(5), 336-
340.
Amos, B., Arkebauer, T. J., & Doran, J. W. 2005. Soil surface fluxes of greenhouse
gases in an irrigated maize-based agroecosystem. Soil Science Society of
America Journal, 69(2), 387-395.
Andersen, A. J., & Petersen, S. O. 2009. Effects of C and N availability and soil-water
potential interactions on N2O evolution and PLFA composition. Soil Biology &
Biochemistry, 41(8), 1726-1733.
Balesdent, J., Chenu, C., & Balabane, M. (2000). Relationship of soil organic matter
dynamics to physical protection and tillage. Soil and tillage research, 53(3),
215-230.
Brady, N. C., & Weil, R. R. 2002. The Nature and Properties of Soils (Thirteenth ed.).
Prentice-Hall Inc.
Cayuela, M. L., Velthof, G. L., Mondini, C., Sinicco, T., & Van Groenigen, J. W.
2010. Nitrous oxide and carbon dioxide emissions during initial decomposition
of animal by-products applied as fertilisers to soils. Geoderma, 157(3), 235-
242.
Conant, R. T., Ryan, M. G., Ågren, G. I., Birge, H. E., Davidson, E. A., Eliasson, P.
E., Evans, S. E., Frey, S. D., Giardina, C. P., Hopkins, F. M., Hyvönen, R.,
Kirschbaum, M. U. F., Lavallee, J. M., Leifeld, J., Parton, W. J., Steinweg, J.
M., Wallenstein, M. D., Wetterstedt, J. Å. M., & Bradford, M. A. 2011.
Temperature and soil organic matter decomposition rates–synthesis of current
knowledge and a way forward. Global Change Biology, 17(11), 3392-3404.
Doane, T. A., & Horwath, W. R. 2003. Spectrophotometric determination of nitrate
with a single reagent. Analytical Letters, 36(12), 2713-2722.
Fang, C., & Moncrieff, J. B. 2001. The dependence of soil CO2 efflux on
temperature. Soil Biology & Biochemistry, 33(2), 155-165.
Fontaine, S., Mariotti, A., & Abbadie, L. 2003. The priming effect of organic matter: a
question of microbial competition? Soil Biology & Biochemistry, 35(6), 837-
843.
García‐Marco, S., Ravella, S. R., Chadwick, D., Vallejo, A., Gregory, A. S., &
Cárdenas, L. M. 2014. Ranking factors affecting emissions of GHG from
incubated agricultural soils. European Journal of Soil Science, 65(4), 573-583.

67
Gugino, B. K., Idowu, O. J., Schindelbeck, R. R., Van Es, H. M., Wolfe, D. W.,
Moebius-Clune, B. N., Thies, J.E., and Abawi, G.S. 2009. Cornell soil health
assessment training manual (Second ed.). Geneva, NY: Cornell University.
Huang, Y., Zou, J., Zheng, X., Wang, Y., & Xu, X. 2004. Nitrous oxide emissions as
influenced by amendment of plant residues with different C: N ratios. Soil
Biology & Biochemistry, 36(6), 973-981.
Johnson, J. M. F., Franzluebbers, A. J., Weyers, S. L., & Reicosky, D. C. 2007.
Agricultural opportunities to mitigate greenhouse gas emissions.
Environmental Pollution, 150(1), 107-124.
Kim, D. G., Vargas, R., Bond-Lamberty, B., & Turetsky, M. R. 2012. Effects of soil
rewetting and thawing on soil gas fluxes: a review of current literature and
suggestions for future research. Biogeosciences, 9(7), 2459-2483.
King, G. M., & Adamsen, A. P. S. 1992. Effects of temperature on methane
consumption in a forest soil and in pure cultures of the methanotroph
Methylomonas rubra. Applied and Environmental Microbiology, 58(9), 2758-
2763.
Kirschbaum, M. U. 1995. The temperature dependence of soil organic matter
decomposition, and the effect of global warming on soil organic C storage. Soil
Biology & Biochemistry, 27(6), 753-760.
Lal, R., & Bruce, J. P. 1999. The potential of world cropland soils to sequester C and
mitigate the greenhouse effect. Environmental Science & Policy, 2(2), 177-
185.
Li, L. J., You, M. Y., Shi, H. A., Ding, X. L., Qiao, Y. F., & Han, X. Z. 2013. Soil
CO2 emissions from a cultivated Mollisol: Effects of organic amendments, soil
temperature, and moisture. European Journal of Soil Biology, 55, 83-90.
Linn, D. M., & Doran, J. W. (1984). Effect of water-filled pore space on carbon
dioxide and nitrous oxide production in tilled and nontilled soils. Soil Science
Society of America Journal, 48(6), 1267-1272.
Meijide, A., Díez, J. A., Sánchez-Martín, L., López-Fernández, S., & Vallejo, A.
2007. Nitrogen oxide emissions from an irrigated maize crop amended with
treated pig slurries and composts in a Mediterranean climate. Agriculture,
Ecosystems & Environment, 121(4), 383-394.
Mondini, C., Cayuela, M. L., Sinicco, T., Cordaro, F., Roig, A., & Sánchez-
Monedero, M. A. 2007. Greenhouse gas emissions and carbon sink capacity of
amended soils evaluated under laboratory conditions. Soil Biology &
Biochemistry, 39(6), 1366-1374.
68
Paterson, E., Neilson, R., Midwood, A. J., Osborne, S. M., Sim, A., Thornton, B., &
Millard, P. 2011. Altered food web structure and C-flux pathways associated
with mineralisation of organic amendments to agricultural soil. Applied Soil
Ecology, 48(2), 107-116.
Rietz, D. N., & Haynes, R. J. 2003. Effects of irrigation-induced salinity and sodicity
on soil microbial activity. Soil Biology & Biochemistry, 35(6), 845-854.
Saison, C., Degrange, V., Oliver, R., Millard, P., Commeaux, C., Montange, D., & Le
Roux, X. 2006. Alteration and resilience of the soil microbial community
following compost amendment: effects of compost level and compost‐borne
microbial community. Environmental Microbiology, 8(2), 247-257.
Schaufler, G., Kitzler, B., Schindlbacher, A., Skiba, U., Sutton, M. A., &
Zechmeister‐Boltenstern, S. 2010. Greenhouse gas emissions from European
soils under different land use: effects of soil moisture and
temperature. European Journal of Soil Science, 61(5), 683-696.
Singh, J. S., & Gupta, S. R. 1977. Plant decomposition and soil respiration in
terrestrial ecosystems. The Botanical Review, 43(4), 449-528.
Smith, K. A., Ball, T., Conen, F., Dobbie, K. E., Massheder, J., & Rey, A. 2003.
Exchange of greenhouse gases between soil and atmosphere: interactions of
soil physical factors and biological processes. European Journal of Soil
Science, 54(4), 779-791.
Solomon, S. (Ed.). 2007. Climate change 2007-the physical science basis: Working
group I contribution to the fourth assessment report of the IPCC (Vol. 4).
Cambridge University Press.
Sylvia, D.M., Fuhrman, J.J., Hartel, P.G. and Zuberer, D.A. 2005. Principles and
Applications of Soil Microbiology, 2nd ed. Prentice-Hall, Upper Saddle River,
NJ.
Thangarajan, R., Bolan, N. S., Tian, G., Naidu, R., & Kunhikrishnan, A. 2013. Role of
organic amendment application on greenhouse gas emission from soil. Science
of the Total Environment, 465, 72-96.
Weatherburn, M. W. 1967. Phenol-hypochlorite reaction for determination of
ammonia. Analytical Chemistry, 39, 971-974.
Weil, R.R., Islam, K.R., Stine, M.A., Gruver, J.B., and Samson-Liebig, S.E. 2003.
Estimating active carbon for soil quality assessment: A simplified method for
laboratory and field use. American Journal of Alternative Agriculture, 18(1), 3-
17.
69
Wichern, J., Wichern, F., & Joergensen, R. G. 2006. Impact of salinity on soil
microbial communities and the decomposition of maize in acidic soils.
Geoderma, 137(1), 100-108.
Zhu, K., Christel, W., Bruun, S., & Jensen, L. S. 2014. The different effects of
applying fresh, composted or charred manure on soil N2O emissions. Soil
Biology & Biochemistry, 74, 61-69.

70
Figures and Tables
Table 2.1. Characteristics of soil and amendments used in the microcosm experiment. Values are means
(n=3-4). After Long et al (2016).
NH4+ NO3
- C N C:N
Water
Content
Organic
Matter
Active
C pH
Material mg/kg mg/kg % % % g/g g/kg
Pre-amendment soil - - 22 2 15.1 1* 5 0.42 5.0
Biosolids/yardwaste
co-compost 48 4009 33 3 10.3 45 54 55.98 7.9
Dehydrated food
waste 36 205 49 3 14.4 3 63 98.7 5.5
Multisource compost 431 392 15 2 9.2 40 19 49.73 7.1
Mineral fertilizer - - - - - 0.0 0.0 50.26 4.6
Paper fiber/chicken
manure (7:1 ratio) 331 1226 40 1 33.9 102 79 62.03
§ 6.4/7.0
§
Yardwaste compost 201 2.23 20 2 13.0 78 34 52.82 6.7
* Water content of air-dried soil § pH for paper fiber and chicken manure measured separately

71
Table 2.2. Order of least square means (n=3) for maximum GHG flux from lowest to highest
by gas, temperature and moisture content. CTL = control; BIO = biosolids and yardwaste co-
compost; DFW = dehydrated food waste; MC = multisource compost; MF = mineral fertilizer;
PF = paper fiber with chicken manure; YW = yardwaste compost; PWP = permanent wilting
point; FC = field capacity; and SAT = saturation. *Denotes significant difference from CTL
when significant interaction between amendment, temperature and moisture content is present.
Temp (°C)
Maximum GHG Flux mg/m2/d produced
Gas Moisture Lowest to Highest
CO2 10 PWP YW* MF BIO* MC* CTL PF DFW
FC YW* MF* MC BIO* PF* DFW* CTL
SAT YW MF MC BIO CTL DFW* PF
15 PWP MF PF* YW* BIO MC CTL DFW*
FC MF YW PF BIO MC CTL DFW
SAT MF YW* BIO* PF MC* CTL DFW
20 PWP MC* MF* YW BIO PF CTL DFW*
FC YW* MC* PF* MF BIO* CTL DFW*
SAT MF* YW* CTL BIO* MC* PF* DFW*
25 PWP BIO YW* MF CTL PF MC DFW
FC YW* BIO* MF* PF* CTL MC* DFW*
SAT MF BIO PF YW* CTL MC DFW*
CH4 10 PWP MF YW DFW BIO PF CTL MC
FC MF YW PF MC BIO DFW CTL
SAT MF YW BIO MC CTL DFW PF
15 PWP CTL MF YW BIO DFW MC PF
FC MF CTL YW MC BIO PF DFW
SAT MF MC BIO DFW* PF* YW CTL
20 PWP YW MC PF MF BIO CTL DFW
FC YW PF MC MF BIO CTL DFW
SAT YW* MC* PF* BIO* MF* DFW* CTL
25 PWP BIO MC YW MF DFW CTL PF
FC CTL MC BIO MF YW PF DFW
SAT CTL YW* BIO* PF MF MC* DFW
N2O 10 PWP YW DFW BIO MC MF PF CTL
FC MF CTL PF DFW MC BIO YW
SAT YW MF MC BIO DFW CTL PF
15 PWP BIO DFW YW PF CTL MF MC
FC BIO MC PF YW CTL MF DFW
SAT CTL PF MF MC BIO YW DFW
20 PWP DFW CTL BIO PF MF MC YW
FC CTL BIO PF MF MC YW DFW
SAT BIO YW MC PF MF CTL DFW
25 PWP BIO MC YW MF DFW CTL PF
FC CTL MC BIO MF YW PF DFW
SAT CTL YW BIO PF MF MC DFW

72
Table 2.3. Order of least square means (n=3) for cumulative amount of GHG produced from lowest to
highest by gas, temperature and moisture content. CTL = control; BIO = biosolids and yardwaste co-
compost; DFW = dehydrated food waste; MC = multisource compost; MF = mineral fertilizer; PF =
paper fiber with chicken manure; YW = yardwaste compost; PWP = permanent wilting point; FC =
field capacity; and SAT = saturation. *Denotes significant difference from CTL when significant
interaction between amendment, temperature and moisture content is present.
Cumulative Gas Flux (mg/m2/d) produced
Gas Temp (°C) Moisture Lowest to Highest
CO2 10 PWP YW* MF* BIO* MC CTL PF* DFW*
FC YW* MF* MC* BIO* PF* CTL DFW*
SAT YW MF* BIO MC CTL PF DFW*
15 PWP MF* PF* YW* BIO* MC* CTL DFW*
FC MF YW BIO PF CTL MC* DFW*
SAT MF* BIO* YW* CTL PF* MC DFW*
20 PWP MF MC* YW BIO CTL PF DFW*
FC YW* MC MF* BIO* CTL PF* DFW*
SAT MF* MC* CTL BIO* PF* YW* DFW*
25 PWP MF* YW* BIO* MC CTL PF DFW
FC MF* BIO* YW* MC* CTL PF* DFW*
SAT MF* BIO* PF MC YW* CTL DFW*
CH4 10 PWP YW MF BIO DFW PF* MC* CTL
FC MF YW DFW PF MC BIO CTL
SAT YW* MF* BIO* PF* MC* DFW* CTL
15 PWP CTL MF YW* DFW BIO PF MC
FC CTL MF MC YW PF DFW BIO
SAT CTL BIO MF* MC PF DFW* YW
20 PWP MC* PF YW CTL MF BIO* DFW*
FC YW* PF* MC* CTL MF* BIO DFW*
SAT PF YW* MC* CTL MF DFW BIO*
25 PWP MF MC PF YW BIO CTL DFW*
FC PF MF* YW* BIO* MC* CTL DFW*
SAT PF MF BIO MC YW DFW* CTL
N2O 10 PWP DFW MC CTL MF BIO YW PF
FC CTL MF DFW PF MC BIO YW
SAT YW CTL MC DFW MF BIO PF
15 PWP BIO YW CTL DFW MF PF MC
FC BIO MC CTL YW PF MF DFW
SAT CTL PF MC BIO MF YW DFW
20 PWP DFW CTL MF BIO PF MC YW
FC CTL BIO MF PF MC YW DFW
SAT BIO YW PF MC MF CTL DFW
25 PWP MC BIO YW MF CTL DFW PF
FC MC BIO CTL MF YW PF DFW
SAT CTL YW BIO PF MF MC DFW

73
Table 2.4 Pearson product moment correlation coefficients of relationships between GHG flux and soil
properties. Bold values indicate significant correlation (p<0.05).
Gas Flux Variable All CTL BIO DFW MC MF PF YW
CO2 pH -0.48 -0.58 -0.54 -0.70 -0.48 -0.5 -0.27 -0.64
EC 0.29 0.40 0.46 0.44 0.13 0.39 0.21 0.02
Inorg N 0.06 0.05 0.05 0.40 -0.01 -0.06 -0.02 -0.31
CH4 pH 0.26 0.28 0.87 0.12 0.57 0.09 0.19 0.42
EC 0.09 0.68 -0.46 0.50 -0.53 0.13 -0.39 -0.68
Inorg N -0.001 -0.5 -0.05 0.41 -0.16 -0.45 0.24 0.33
NH4 0.22 0.3 -0.44 0.41 0.23 0.12 0.11 0.08
N2O pH 0.0004 0.14 0.33 -0.12 0.15 0.06 0.06 0.12
EC 0.04 0.24 -0.44 0.42 -0.53 -0.29 -0.25 -0.73
Inorg N -0.45 -0.62 -0.68 -0.53 -0.81 -0.70 -0.68 -0.64
NO3 -0.46 -0.55 -0.78 -0.62 -0.88 -0.83 -0.62 -0.7
NH4 0.37 0.45 0.64 0.72 0.91 0.44 0.43 0.33
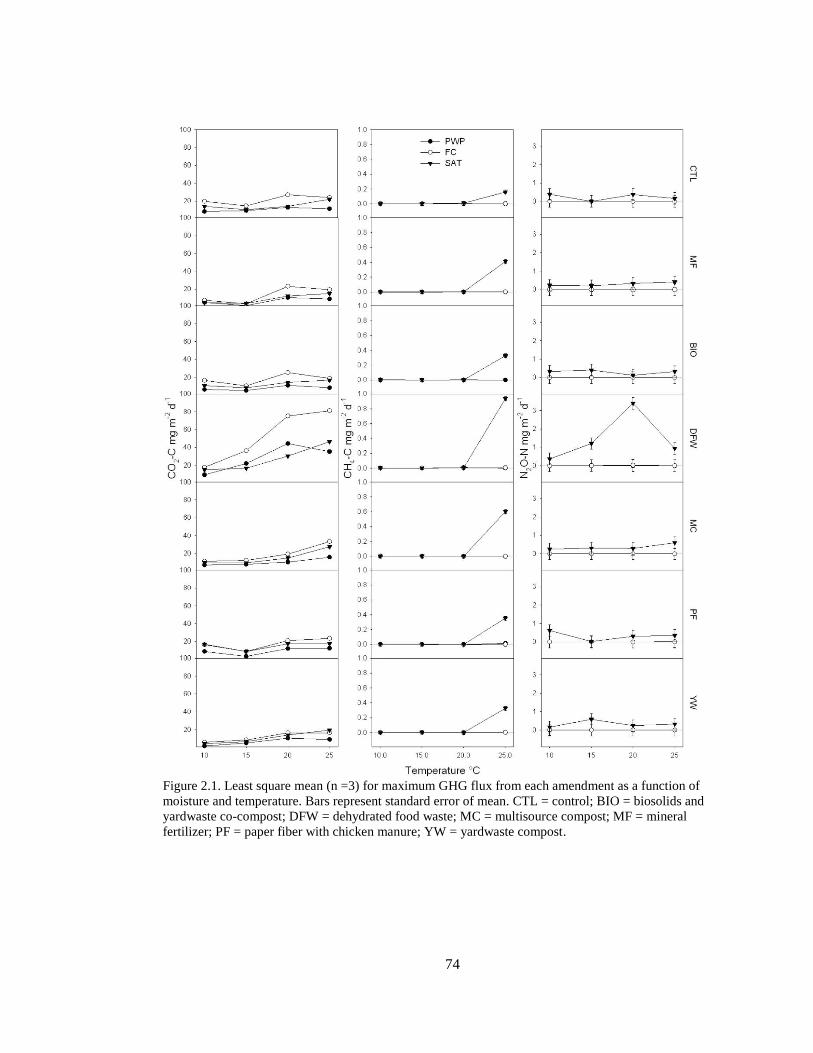
74
Figure 2.1. Least square mean (n =3) for maximum GHG flux from each amendment as a function of
moisture and temperature. Bars represent standard error of mean. CTL = control; BIO = biosolids and
yardwaste co-compost; DFW = dehydrated food waste; MC = multisource compost; MF = mineral
fertilizer; PF = paper fiber with chicken manure; YW = yardwaste compost.
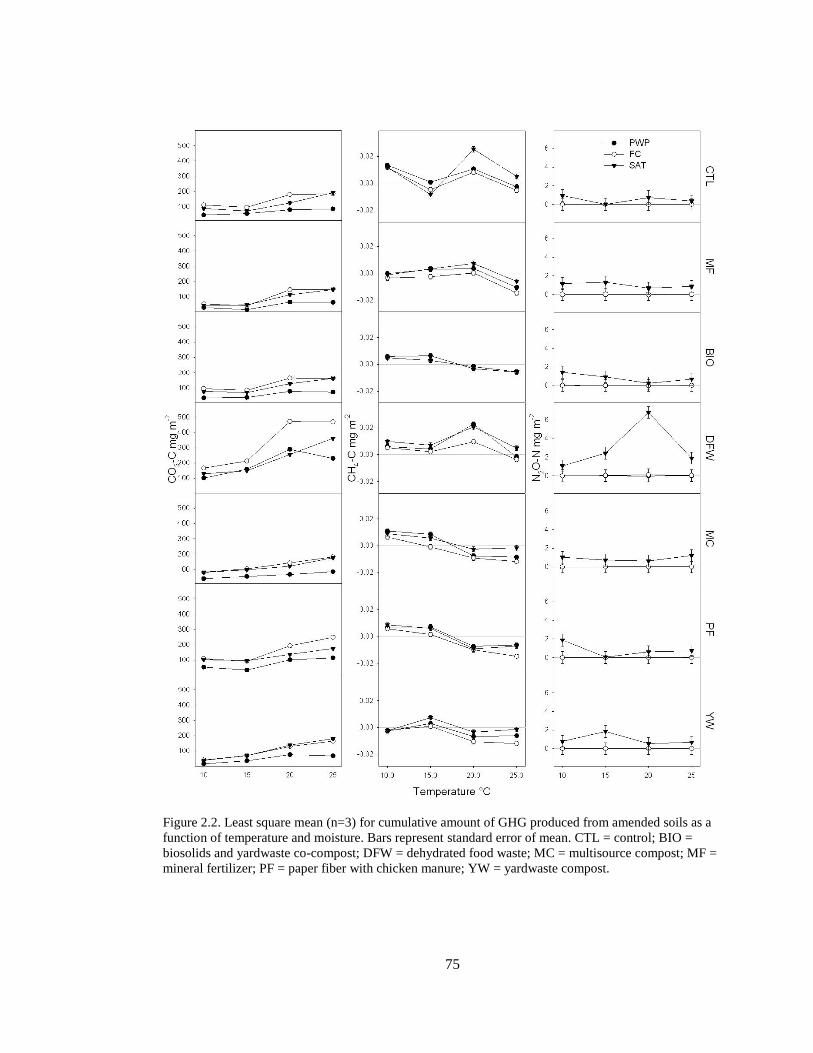
75
Figure 2.2. Least square mean (n=3) for cumulative amount of GHG produced from amended soils as a
function of temperature and moisture. Bars represent standard error of mean. CTL = control; BIO =
biosolids and yardwaste co-compost; DFW = dehydrated food waste; MC = multisource compost; MF =
mineral fertilizer; PF = paper fiber with chicken manure; YW = yardwaste compost.

76
Figure 2.3. Mean (n=3) GHG flux from 0.5g of soil amendments with 5mL deionized water, or
deionized water alone (used as a control), measured over 3 days. CTL = control; BIO = biosolids and
yardwaste co-compost; DFW = dehydrated food waste; MC = multisource compost; MF = mineral
fertilizer; PF = paper fiber with chicken manure; YW = yardwaste compost.

77
Figure 2.4. Relationship between change in EC and cumulative GHG production/consumption for 14
day sampling period in amended soils. Bars represent standard error of GHG mean. Line is linear
regression of all treatments. CTL = control; BIO = biosolids and yardwaste co-compost; DFW =
dehydrated food waste; MC = multisource compost; MF = mineral fertilizer; PF = paper fiber with
chicken manure; YW = yardwaste compost.
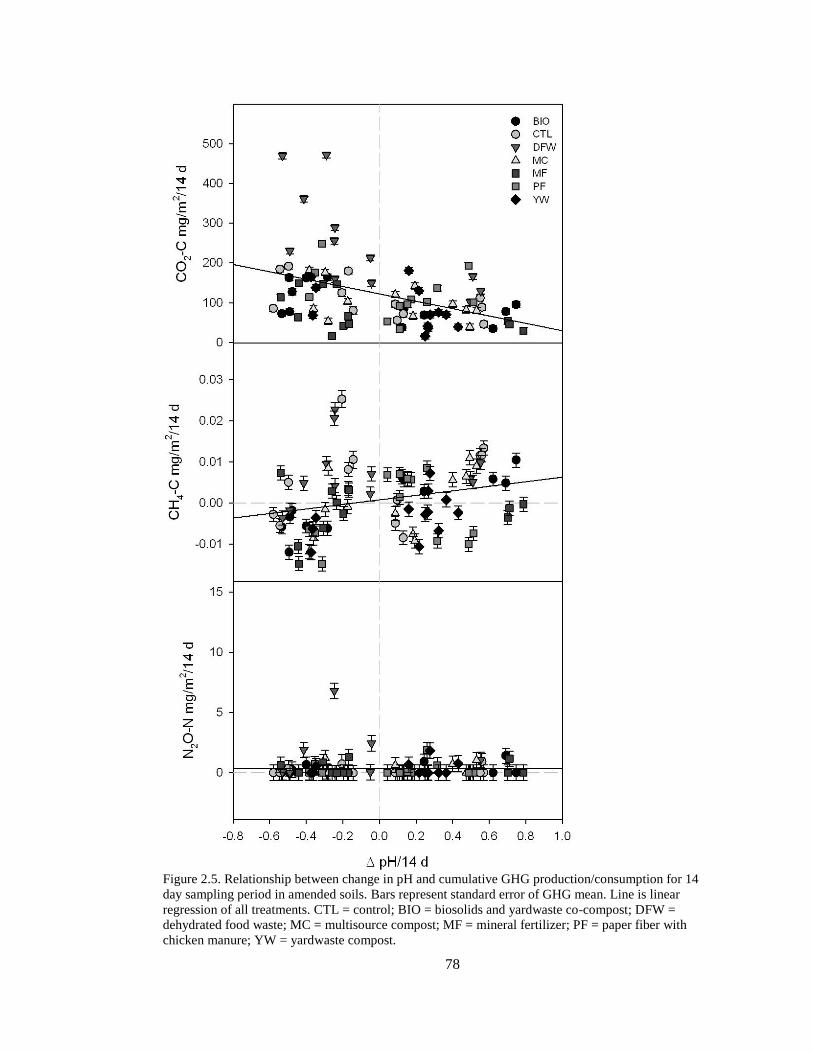
78
Figure 2.5. Relationship between change in pH and cumulative GHG production/consumption for 14
day sampling period in amended soils. Bars represent standard error of GHG mean. Line is linear
regression of all treatments. CTL = control; BIO = biosolids and yardwaste co-compost; DFW =
dehydrated food waste; MC = multisource compost; MF = mineral fertilizer; PF = paper fiber with
chicken manure; YW = yardwaste compost.

79
Figure 2.6. Relationship between mean (n=3) change in ammonium over 14 days and mean (n=3)
methane flux over 14 days by amendment. Bars represent standard error of GHG mean. Line is linear
regression of all treatments. CTL = control; BIO = biosolids and yardwaste co-compost; DFW =
dehydrated food waste; MC = multisource compost; MF = mineral fertilizer; PF = paper fiber with
chicken manure; YW = yardwaste compost.
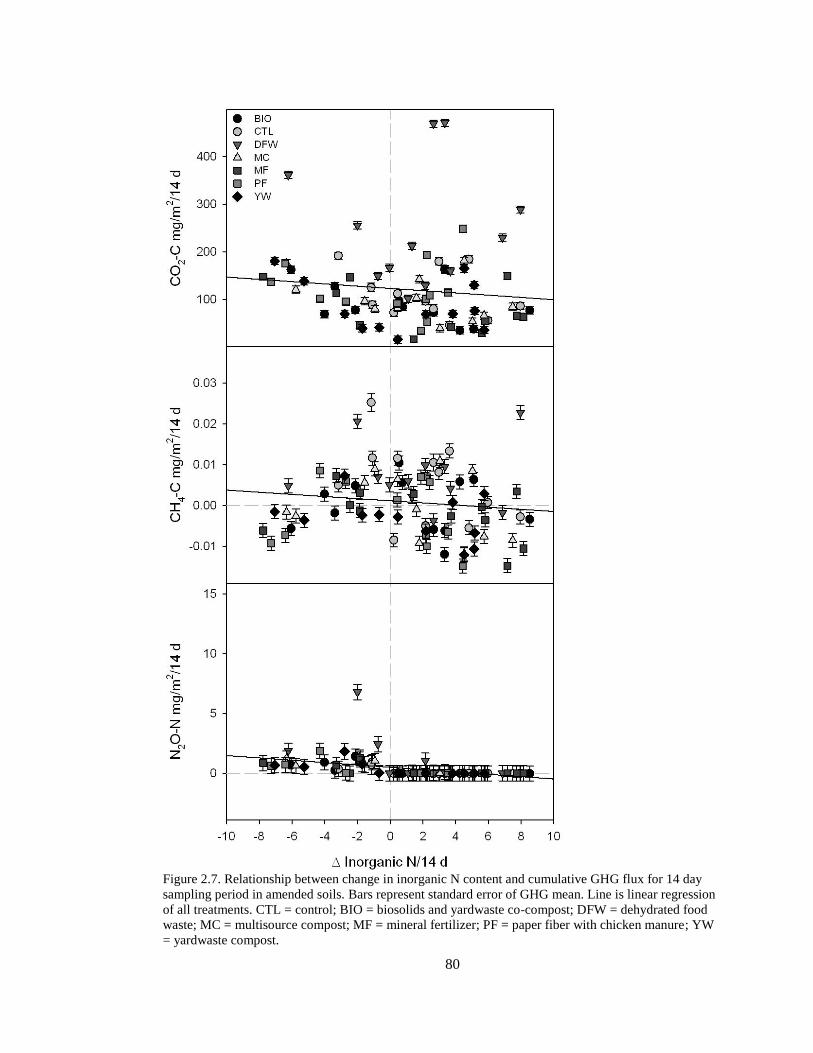
80
Figure 2.7. Relationship between change in inorganic N content and cumulative GHG flux for 14 day
sampling period in amended soils. Bars represent standard error of GHG mean. Line is linear regression
of all treatments. CTL = control; BIO = biosolids and yardwaste co-compost; DFW = dehydrated food
waste; MC = multisource compost; MF = mineral fertilizer; PF = paper fiber with chicken manure; YW
= yardwaste compost.

81
Figure 2.8. Cumulative GHG emissions as CO2 equivalents (N2O and CH4 at 298 and 25 times CO2,
respectively). CTL = control; BIO = biosolids and yardwaste co-compost; DFW = dehydrated food
waste; MC = multisource compost; MF = mineral fertilizer; PF = paper fiber with chicken manure; YW
= yardwaste compost. Methane production was not large enough to show on graph.

82
CONCLUSIONS
The use of RWM as soil amendments affected the magnitude, direction and timing
of GHG flux, and fluxes of CO2, CH4, and N2O responded to differences in
temperature and moisture. In the microcosms, we were able to replicate the increased
magnitude of CO2 flux from the amended soils in the field study. The levels of CO2
flux in the microcosms were smaller than the field study due to the lack of soil
horizons in the microcosms. In the field, biogeochemical processes, moisture and
temperature are affected variably throughout the soil horizons, which is important to
consider when making management decisions based on microcosm results.
In both the field and microcosm studies, DFW resulted in significantly higher flux
values than the CTL for CO2, CH4, and N2O, suggesting that it could cause a problem
for future use as an agricultural soil amendment. However, this analysis did not take
into account GHG emissions during the production and composting procedures prior
to application. Therefore, we would be better served using a life cycle analysis of all
amendments, before making the recommendation for use based solely on GHG
production. It is also important to note that, although DFW was one of the highest
GHG producers in our study, it was still below reported ranges from other studies. We
were not able to accept the hypothesis that the differences in GHG flux from the
amended soils could be a result of the differing levels of readily degradable organic C
(active C) in the amendments. Examination of the active C composition of the
amendments and its effects on GHG flux would be an interesting direction for future
research.

83
In the field, we saw inconsistent levels of CH4 and N2O flux produced, likely due
to the high variability and complexity in production/consumption of these gases,
and/or the narrow range of soil properties, such as water content and temperature.
Variability is common to field studies, and led to our microcosm-scale experiment to
further evaluate the effects of moisture and temperature. We often found similar or
reduced CH4 fluxes from the amended soils relative to the CTL. These amendments
may be useful in promoting C sequestration through reduced GHG flux, and would be
another direction for future research.
We found less variability in the flux of N2O from the amended soil when
temperature and moisture were controlled. While the amendments led to changes in
soil properties and N2O flux, the flux was generally more associated with changes in
moisture content than with the amendment.
Because management practices are not mimicked throughout agriculture, future
research into the effects of RWM soil amendments on GHG flux should include
different application rates, management regimens and crop production systems. This is
particularly true of systems where there would be increased moisture or temperatures,
such as tropical and subtropical environments or in paddy rice production.
This field study only examined short-term responses to the addition of these
amendments. If these amendments are to be used as a long-term solution for waste
reuse, a long-term field study on the effects to soil properties and GHG flux should be
performed. This would allow for examining the effects of reapplication, as well as
providing an opportunity to gather information about the offseason and residual effects
of application.

84
BIBLIOGRAPHY
1. Adviento-Borbe, M. A. A., Doran, J. W., Drijber, R. A., & Dobermann, A.
2006. Soil electrical conductivity and water content affect nitrous oxide and
carbon dioxide emissions in intensively managed soils. Journal of
Environmental Quality, 35(6), 1999-2010.
2. Allison, S. D., Wallenstein, M. D., & Bradford, M. A. 2010. Soil-carbon
response to warming dependent on microbial physiology. Nature
Geoscience, 3(5), 336-340.
3. Alvarenga, P., Mourinha, C., Farto, M., Santos, T., Palma, P., Sengo, J.,
Morais, M., & Cunha-Queda, C. 2015. Sewage sludge, compost and other
representative organic wastes as agricultural soil amendments: Benefits
versus limiting factors. Waste Management, 40, 44-52.
4. Amador, J. A., & Avizinis, E. J. 2013. Response of nitrous oxide flux to
addition of anecic earthworms to an agricultural field. Open Journal of Soil
Science, 3, 100-106.
5. Amos, B., Arkebauer, T. J., & Doran, J. W. 2005. Soil surface fluxes of
greenhouse gases in an irrigated maize-based agroecosystem. Soil Science
Society of America Journal, 69(2), 387-395.
6. Andersen, A. J., & Petersen, S. O. 2009. Effects of C and N availability and
soil-water potential interactions on N2O evolution and PLFA composition.
Soil Biology & Biochemistry, 41(8), 1726-1733.
7. Annabi, M., Houot, S., Francou, C., Poitrenaud, M., & Bissonnais, Y. L.
2007. Soil aggregate stability improvement with urban composts of different
maturities. Soil Science Society of America Journal, 71(2), 413-423.
8. Avizinis, E. J. 2012. The Indirect Effect of Earthworms on Methane Flux in
Two Temperate Pasture Soils. Open Access Master's Theses. Paper 96.
9. Balesdent, J., Chenu, C., & Balabane, M. (2000). Relationship of soil organic
matter dynamics to physical protection and tillage. Soil and tillage research,
53(3), 215-230.
10. Ball, B. C., Griffiths, B. S., Topp, C. F., Wheatley, R., Walker, R. L., Rees,
R. M., Watson, C.A., Gordon, H., Hallett, P.D., McKenzie, B.M., &
Nevison, I. M. 2014. Seasonal nitrous oxide emissions from field soils under
reduced tillage, compost application or organic farming. Agriculture,
Ecosystems & Environment, 189, 171-180.

85
11. Bjorkman, T. 2009. Soil and Fertilizer for Buckwheat. Retrieved February
16, 2016, from
http://www.hort.cornell.edu/bjorkman/lab/buck/guide/soil&fertilizer.php
12. Brady, N. C., & Weil, R. R. 2002. The Nature and Properties of
Soils (Thirteenth ed.). Prentice-Hall Inc.
13. Cayuela, M. L., Velthof, G. L., Mondini, C., Sinicco, T., & Van Groenigen,
J. W. (2010). Nitrous oxide and carbon dioxide emissions during initial
decomposition of animal by-products applied as fertilisers to soils.
Geoderma, 157(3), 235-242.
14. Cole, J.J., Prairie, Y.T., Caraco, N.F., McDowell, W.H., Tranvik, L.J.,
Striegl, R.G., Duarte, C.M., Kortelainen, P., Downing, J.A., Middelburg, J.J.,
& Melack, J. 2007. Plumbing the global carbon cycle: integrating inland
waters into the terrestrial carbon budget. Ecosystems, 10(1), 172-185.
15. Conant, R. T., Ryan, M. G., Ågren, G. I., Birge, H. E., Davidson, E. A.,
Eliasson, P. E., Evans, S. E., Frey, S. D., Giardina, C. P., Hopkins, F. M.,
Hyvönen, R., Kirschbaum, M. U. F., Lavallee, J. M., Leifeld, J., Parton, W.
J., Steinweg, J. M., Wallenstein, M. D., Wetterstedt, J. Å. M., & Bradford,
M. A. 2011. Temperature and soil organic matter decomposition rates–
synthesis of current knowledge and a way forward. Global Change
Biology, 17(11), 3392-3404.
16. Conrad, R. 1996. Soil microorganisms as controllers of atmospheric trace
gases (H2, CO, CH4, OCS, N2O, and NO). Microbiological Reviews, 60(4),
609-640.
17. Davidson, E., Belk, E., & Boone, R. D. 1998. Soil water content and
temperature as independent or confounded factors controlling soil respiration
in a temperate mixed hardwood forest. Global Change Biology, 4(2), 217-
227.
18. Doane, T. A., & Horwath, W. R. 2003. Spectrophotometric determination of
nitrate with a single reagent. Analytical Letters, 36(12), 2713-2722.
19. Duxbury, J. M. 1994. The significance of agricultural sources of greenhouse
gases. Fertilizer Research, 38(2), 151-163.
20. Fang, C., & Moncrieff, J. B. 2001. The dependence of soil CO2 efflux on
temperature. Soil Biology & Biochemistry, 33(2), 155-165.
21. Flessa, H., Dörsch, P., & Beese, F. 1995. Seasonal variation of N2O and CH4
fluxes in differently managed arable soils in southern Germany. Journal of
Geophysical Research: Atmospheres, 100(D11), 23115-23124.

86
22. Fontaine, S., Mariotti, A., & Abbadie, L. 2003. The priming effect of organic
matter: a question of microbial competition? Soil Biology & Biochemistry,
35(6), 837-843.
23. García-Marco, S., Ravella, S. R., Chadwick, D., Vallejo, A., Gregory, A. S.,
& Cárdenas, L. M. 2014. Ranking factors affecting emissions of GHG from
incubated agricultural soils. European Journal of Soil Science, 65(4), 573-
583.
24. Gugino, B. K., Idowu, O. J., Schindelbeck, R. R., Van Es, H. M., Wolfe, D.
W., Moebius-Clune, B. N., Thies, J.E., and Abawi, G.S. 2009. Cornell soil
health assessment training manual (Second ed.). Geneva, NY: Cornell
University.
25. Huang, Y., Zou, J., Zheng, X., Wang, Y., & Xu, X. 2004. Nitrous oxide
emissions as influenced by amendment of plant residues with different C: N
ratios. Soil Biology & Biochemistry, 36(6), 973-981.
26. Johnson, J. M., Archer, D., & Barbour, N. 2010. Greenhouse gas emission
from contrasting management scenarios in the northern Corn Belt. Soil
Science Society of America Journal, 74(2), 396-406.
27. Johnson, J. M. F., Franzluebbers, A. J., Weyers, S. L., & Reicosky, D. C.
2007. Agricultural opportunities to mitigate greenhouse gas emissions.
Environmental pollution, 150(1), 107-124.
28. Kim, D. G., Vargas, R., Bond-Lamberty, B., & Turetsky, M. R. 2012. Effects
of soil rewetting and thawing on soil gas fluxes: a review of current literature
and suggestions for future research. Biogeosciences, 9(7), 2459-2483.
29. King, G. M., & Adamsen, A. P. S. 1992. Effects of temperature on methane
consumption in a forest soil and in pure cultures of the methanotroph
Methylomonas rubra. Applied and Environmental Microbiology, 58(9),
2758-2763.
30. Kirschbaum, M. U. 1995. The temperature dependence of soil organic matter
decomposition, and the effect of global warming on soil organic C
storage. Soil Biology & Biochemistry, 27(6), 753-760.
31. Lal, R., & Bruce, J. P. 1999. The potential of world cropland soils to
sequester C and mitigate the greenhouse effect. Environmental Science &
Policy, 2(2), 177-185.
32. Larionova, A. A., Sapronov, D. V., De Gerenyu, V. L., Kuznetsova, L. G., &
Kudeyarov, V. N. (2006). Contribution of plant root respiration to the CO2
emission from soil. Eurasian Soil Science, 39(10), 1127-1135.

87
33. Lessard, R., Rochette, P., Gregorich, E. G., Desjardins, R. L., & Pattey, E.
1997. CH4 fluxes from a soil amended with dairy cattle manure and
ammonium nitrate. Canadian Journal of Soil Science, 77(2), 179-186.
34. Li, L. J., You, M. Y., Shi, H. A., Ding, X. L., Qiao, Y. F., & Han, X. Z.
2013. Soil CO2 emissions from a cultivated Mollisol: Effects of organic
amendments, soil temperature, and moisture. European Journal of Soil
Biology, 55, 83-90.
35. Linn, D. M., & Doran, J. W. 1984. Effect of water-filled pore space on
carbon dioxide and nitrous oxide production in tilled and nontilled soils. Soil
Science Society of America Journal, 48(6), 1267-1272.
36. Loecke, T. D., & Robertson, G. P. (2009). Soil resource heterogeneity in
terms of litter aggregation promotes nitrous oxide fluxes and slows
decomposition. Soil Biology and Biochemistry, 41(2), 228-235.
37. Long, R. J., Brown, R. N., & Amador, J. A. 2016. Growing food with
garbage: Effects of six waste amendments on soil and vegetable crops.
HortScience (In preparation).
38. Mapanda, F., Wuta, M., Nyamangara, J., & Rees, R. M. 2011. Effects of
organic and mineral fertilizer nitrogen on greenhouse gas emissions and
plant-captured carbon under maize cropping in Zimbabwe. Plant and soil,
343(1-2), 67-81.
39. McMillan, A. M., Pal, P., Phillips, R. L., Palmada, T., Berben, P. H., Jha, N.,
Saggar, S., & Luo, J. 2016. Can pH amendments in grazed pastures help
reduce N 2 O emissions from denitrification? –The effects of liming and
urine addition on the completion of denitrification in fluvial and volcanic
soils. Soil Biology & Biochemistry, 93, 90-104.
40. Meijide, A., Díez, J. A., Sánchez-Martín, L., López-Fernández, S., &
Vallejo, A. 2007. Nitrogen oxide emissions from an irrigated maize crop
amended with treated pig slurries and composts in a Mediterranean climate.
Agriculture, Ecosystems & Environment, 121(4), 383-394.
41. Molodovskaya A, M., Singurindy A, O., Richards A, B. K., Warland B, J. S.,
& Steenhuis A, T. S. 2010. Monitoring nitrous oxide emissions from
manure-fertilized alfalfa and corn cropland in the Northeastern US.
In Proceedings of the 19th World Congress of Soil Science: Soil solutions
for a changing world, Brisbane, Australia, 1-6 August 2010. Congress
Symposium 4: Greenhouse gases from soils (pp. 164-167). International
Union of Soil Sciences (IUSS), c/o Institut für Bodenforschung, Universität
für Bodenkultur.

88
42. Mondini, C., Cayuela, M. L., Sinicco, T., Cordaro, F., Roig, A., & Sánchez-
Monedero, M. A. 2007. Greenhouse gas emissions and carbon sink capacity
of amended soils evaluated under laboratory conditions. Soil Biology &
Biochemistry, 39(6), 1366-1374.
43. Mukherjee, A., Lal, R., & Zimmerman, A. R. 2014. Effects of biochar and
other amendments on the physical properties and greenhouse gas emissions
of an artificially degraded soil. Science of the Total Environment, 487, 26-36.
44. Nazaries, L., Tottey, W., Robinson, L., Khachane, A., Al-Soud, W. A.,
Sørenson, S., & Singh, B. K. 2015. Shifts in the microbial community
structure explain the response of soil respiration to land-use change but not to
climate warming. Soil Biology & Biochemistry, 89, 123-134.
45. Odlare, M., Abubaker, J., Lindmark, J., Pell, M., Thorin, E., & Nehrenheim,
E. 2012. Emissions of N2O and CH4 from agricultural soils amended with
two types of biogas residues. Biomass and Bioenergy, 44, 112-116.
46. Paterson, E., Neilson, R., Midwood, A. J., Osborne, S. M., Sim, A.,
Thornton, B., & Millard, P. 2011. Altered food web structure and C-flux
pathways associated with mineralisation of organic amendments to
agricultural soil. Applied Soil Ecology, 48(2), 107-116.
47. Possinger, A.R. & Amador, J.A. 2016. Preliminary evaluation of seaweed
application effects on soil quality and yield of sweet corn (Zea mays L.).
Communications in Soil Science and Plant Analysis, 47(1), 121-135.
48. Raich, J. W., & Mora, G. 2005. Estimating root plus rhizosphere
contributions to soil respiration in annual croplands. Soil Science Society of
America Journal, 69(3), 634-639.
49. Rietz, D. N., & Haynes, R. J. 2003. Effects of irrigation-induced salinity and
sodicity on soil microbial activity. Soil Biology & Biochemistry, 35(6), 845-
854.
50. Saison, C., Degrange, V., Oliver, R., Millard, P., Commeaux, C., Montange,
D., & Le Roux, X. 2006. Alteration and resilience of the soil microbial
community following compost amendment: effects of compost level and
compost‐borne microbial community. Environmental Microbiology, 8(2),
247-257.
51. Schaufler, G., Kitzler, B., Schindlbacher, A., Skiba, U., Sutton, M. A., &
Zechmeister‐Boltenstern, S. 2010. Greenhouse gas emissions from European
soils under different land use: effects of soil moisture and
temperature. European Journal of Soil Science, 61(5), 683-696.

89
52. Segers, R. 1998. Methane production and methane consumption: a review of
processes underlying wetland methane fluxes. Biogeochemistry, 41(1), 23-
51.
53. Singh, J. S., & Gupta, S. R. 1977. Plant decomposition and soil respiration in
terrestrial ecosystems. The Botanical Review, 43(4), 449-528.
54. Six, J., Conant, R.T., Paul, E.A., & Paustian, K. (2002). Stabilization
mechanisms of soil organic matter: implications for C-saturation of soils.
Plant and soil, 241(2), 155-176.
55. Skiba, U. M., Sheppard, L. J., MacDonald, J., & Fowler, D. 1998. Some key
environmental variables controlling nitrous oxide emissions from agricultural
and semi-natural soils in Scotland. Atmospheric Environment, 32(19), 3311-
3320.
56. Smith, K. A., Dobbie, K. E., Ball, B. C., Bakken, L. R., Sitaula, B. K.,
Hansen, S., Brumme, R., Borken, W., Christensen, S., Prieme, A., Fowler,
D., Macdonald, J.A., Skiba, U., Klemedtsson, L., Kasimir-Klemedtsson, A.,
Degorska, A., & Orlanski, P. 2000. Oxidation of atmospheric methane in
Northern European soils, comparison with other ecosystems, and
uncertainties in the global terrestrial sink. Global Change Biology, 6(7), 791-
803.
57. Smith, K. A., Ball, T., Conen, F., Dobbie, K. E., Massheder, J., & Rey, A.
2003. Exchange of greenhouse gases between soil and atmosphere:
interactions of soil physical factors and biological processes. European
Journal of Soil Science, 54(4), 779-791.
58. Solomon, S. (Ed.). 2007. Climate change 2007-the physical science basis:
Working group I contribution to the fourth assessment report of the IPCC
(Vol. 4). Cambridge University Press.
59. Stocker, T. F. (Ed.). 2014. Climate change 2013: The physical science basis:
Working Group I contribution to the Fifth assessment report of the
Intergovernmental Panel on Climate Change. Cambridge University Press.
60. Sylvia, D.M., Fuhrman, J.J., Hartel, P.G. and Zuberer, D.A. 2005. Principles
and Applications of Soil Microbiology, 2nd ed. Prentice-Hall, Upper Saddle
River, NJ.
61. Thangarajan, R., Bolan, N. S., Tian, G., Naidu, R., & Kunhikrishnan, A.
2013. Role of organic amendment application on greenhouse gas emission
from soil. Science of the Total Environment, 465, 72-96.

90
62. United States Environmental Protection Agency. 2012. Municipal solid
waste generation, recycling, and disposal in the United States: Facts and
figures for 2012. Retrieved from
http://www3.epa.gov/epawaste/nonhaz/municipal/pubs/2012_msw_fs.pdf
63. Weatherburn, M. W. 1967. Phenol-hypochlorite reaction for determination of
ammonia. Analytical Chemistry, 39, 971-974.
64. Weil, R.R., Islam, K.R., Stine, M.A., Gruver, J.B., and Samson-Liebig, S.E.
2003. Estimating active carbon for soil quality assessment: A simplified
method for laboratory and field use. American Journal of Alternative
Agriculture, 18(1), 3-17.
65. Wichern, J., Wichern, F., & Joergensen, R. G. 2006. Impact of salinity on
soil microbial communities and the decomposition of maize in acidic soils.
Geoderma, 137(1), 100-108.
66. Zhu, K., Bruun, S., Larsen, M., Glud, R. N., & Jensen, L. S. 2015.
Heterogeneity of O2 dynamics in soil amended with animal manure and
implications for greenhouse gas emissions. Soil Biology & Biochemistry, 84,
96-106.
67. Zhu, K., Christel, W., Bruun, S., & Jensen, L. S. 2014. The different effects
of applying fresh, composted or charred manure on soil N2O emissions. Soil
Biology & Biochemistry, 74, 61-69.