Pharmacokinetics Pharmacodynamics Pharmacokinetics Pharmacodynamics.

1
Effects of Renal Disease on Pharmacokinetics
October 15, 2009
Juan J. L. Lertora, M.D., Ph.D.Director
Clinical Pharmacology Program
Office of Clinical Research Training and Medical Education
National Institutes of HealthClinical Center
GOALS of Effects of Renal Disease on Pharmacokinetics Lecture
A. Dose Adjustment in patients with renal Impairment
B. Effect of Renal Disease on: Renal Drug Elimination
Hepatic Drug Metabolism
Drug Transporters
Drug Distribution
Drug Absorption
GOALS Of Effects of Renal Disease on PK Lecture
• DOSE ADJUSTMENT in Patients with Renal Impairment
Statement of the Problem
How is renal function assessed?
How is drug dose adjusted based on this assessment?

2
PATHOPHYSIOLOGIC FACTORSNOT ACCOUNTED FOR IN DRUG DOSING*
* Lesar TS, Briceland L, Stein DS. JAMA 1997;277:312-7.
ADVANCED AGE42%
OTHER 6%
PATIENT WEIGHT
19%
RENAL IMPAIRMENT
33%
Central Role of DRUG LABEL
The DRUG LABEL is the primary source of drug prescribing information and is reviewedby the FDA as part of the drug approval process.
As such the drug label is a distillate of theentire drug development process.
INFORMATION CONTENTOF CURRENT DRUG LABELS*
88% (84% - 93%)MECHANISM OF ACTION
43% (37% - 49%)PHARMACODYNAMICS
37% (32% - 42%)DOSE ADJUSTMENT
42% (35% - 49%)PHARMACOKINETICS
23% (16% - 29%)DRUG METABOLISM
Inclusion of Desirable Data ElementsMEAN (95% CI)
CORE INFORMATIONCATEGORY
* Spyker DA, et al. Clin Pharmacol Ther 2000;67:196-200.

3
FDA GUIDANCE FOR INDUSTRY
PHARMACOKINETICS IN PATIENTS WITHIMPAIRED RENAL FUNCTION – Study
Design, Data Analysis, and Impact on Dosing and Labeling (1998)
AVAILABLE AT: http://www.fda.gov/cder/guidance/index.htm
GOALS of Renal Disease Effects Lecture
• DOSE ADJUSTMENT in Patients with Renal Impairment
- Statement of the Problem
- How is renal function assessed?
- How is drug dose adjusted based on this assessment?
ELIMINATION by Different Routes
MEASUREMENTS RENAL HEPATIC DIALYSIS
Blood Flow +* +* +Afferent Concentration + + +Efferent Concentration 0 0 +Eliminated Drug + 0 +
*not actually measured in routine PK studies

4
RENAL CLEARANCE EQUATION
P Vx UCL =
U = URINE CONCENTRATIONV = URINE VOLUME / TIMEP = PLASMA CONCENTRATION
CLEARANCE TECHNIQUES FORASSESSING RENAL FUNCTION
GLOMERULAR FILTRATION:Normal: 120 – 130 mL/min/1.73 m2
CLEARANCE MARKERS:InulinCreatinine125I-Iothalamate
RENAL BLOOD FLOW:Normal: ♂ 1,209 ± 256 mL/min/1.73 m2
♀ 982 ± 184 mL/min/1.73 m2
CLEARANCE MARKER: Para-Aminohippuric Acid
GOALS of Renal Disease Effects Lecture
- How is renal function assessed?Commonly estimated from theCockcroft and Gault equation for creatinine clearance if renal function isstable, but the Modification of Diet in Renal Disease (MDRD) Study equationfor estimating GFR has been used also.

5
Estimation of GFR• The MDRD equation to estimate GFR from serum
creatinine is the most accurate compared to the (125)I-iothalamate standard.
• However, it is biased and tends to underestimate high GFRs and also overestimates low GFRs.
• Not validated in the elderly population
Levey AS et al. Ann Intern Med. 2006;145-247-254
http://www.nkdep.nih.gov/profesionals/gfr_calculators/idms_con.htm
Renal Clearance of Drugs
• Generally, there is a linearcorrelation between the clearance of creatinine and the clearance of drugs excreted via the kidneys.
• We take advantage of this correlation when making dose adjustments in patients with impaired renal function.
STEADY STATE CONCENTRATION
ESS CL
IC =
Continuous Infusion:
Intermittent Dosing:
ESS CL
τDOSEC =
6
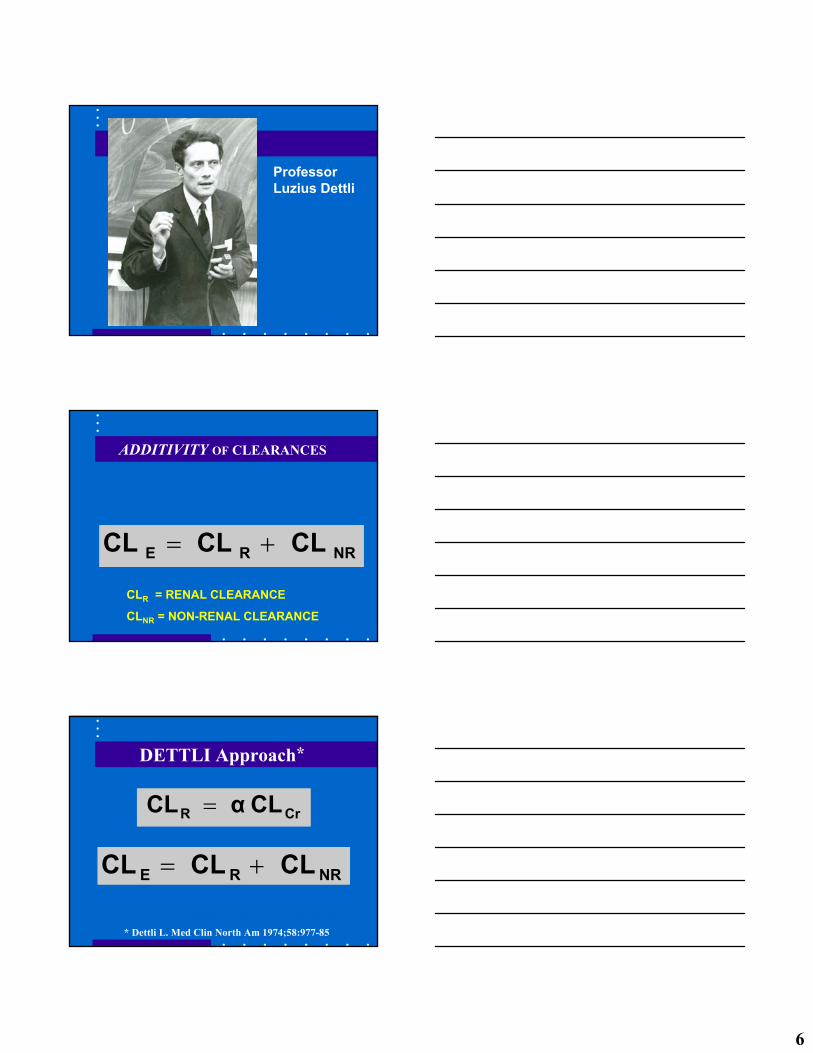
Professor Luzius Dettli
ADDITIVITY OF CLEARANCES
NRRE CLCLCL +=
CLR = RENAL CLEARANCE
CLNR = NON-RENAL CLEARANCE
DETTLI Approach*
NRRE CLCLCL +=
CrR CLαCL =
NEED: 1. CLE IN NORMAL SUBJECTS2. NORMAL % RENAL EXCRETION
* Dettli L. Med Clin North Am 1974;58:977-85

7
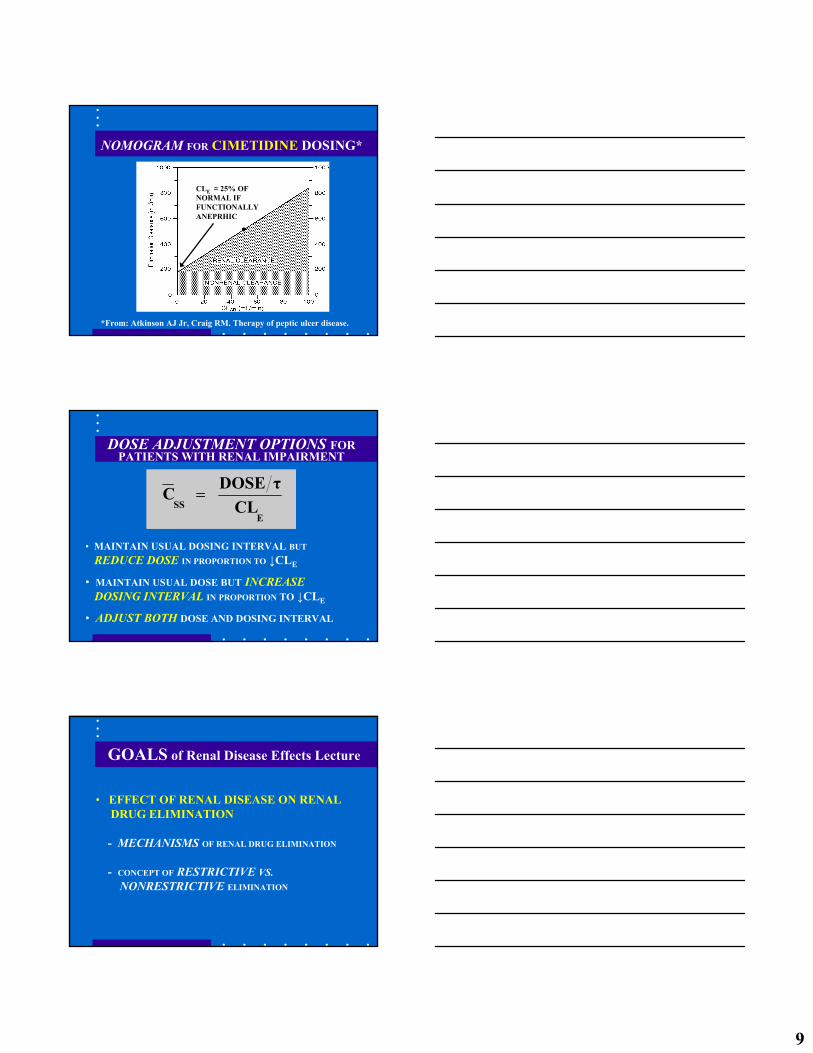
NOMOGRAM FOR CIMETIDINE DOSING*
*From: Atkinson AJ Jr, Craig RM. Therapy of peptic ulcer disease.
Key ASSUMPTIONS of Dettli Method
• CLNR remains CONSTANT when renalfunction is impaired.
• CLR declines in LINEAR FASHION with CLCR
- Intact Nephron Hypothesis- Some drugs ↓ SECRETION > GFR
with aging*
* Reidenberg MM, et al. Clin Pharmacol Ther 1980;28:732-5.
CIMETIDINE Case History
A 67-year-old veteran had been functionallyanephric, requiring outpatient hemodialysisfor several years. He was hospitalized for revision of his arteriovenous shunt and postoperatively complained of symptoms of gastroesophageal reflux. This complaint prompted institution of cimetidine therapy in a dose of 300 mg every 6 hours.
8
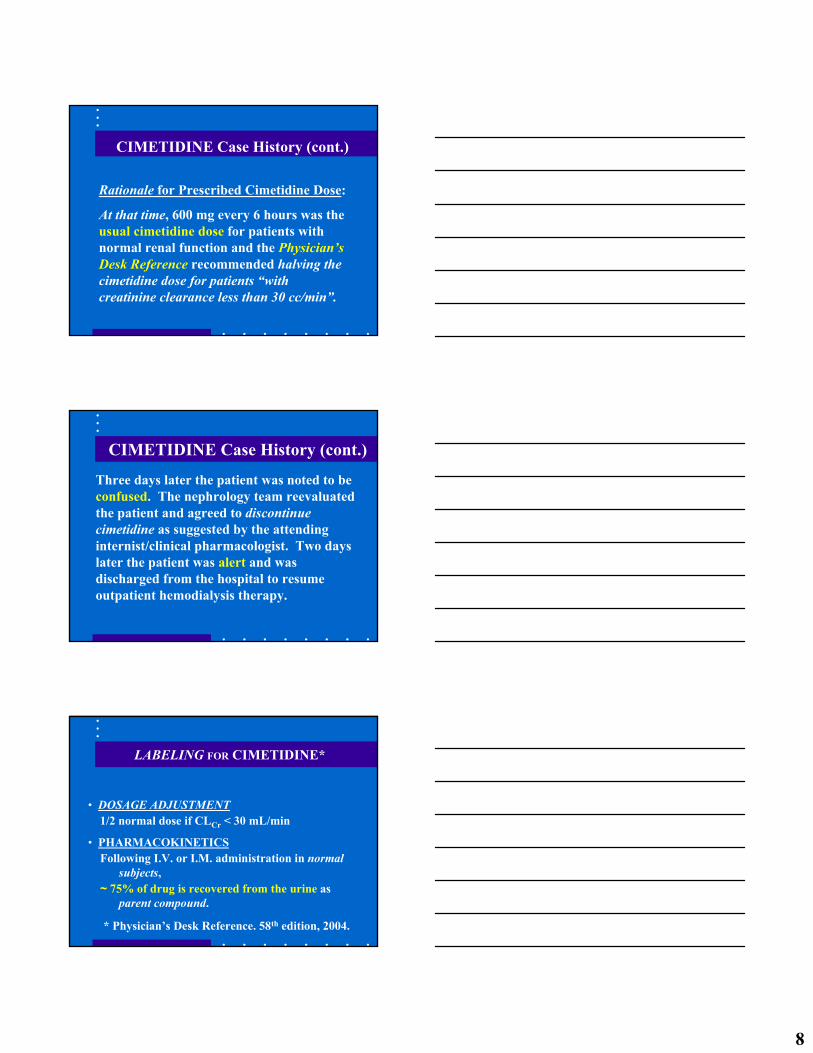
CIMETIDINE Case History (cont.)
Rationale for Prescribed Cimetidine Dose:
At that time, 600 mg every 6 hours was the usual cimetidine dose for patients with normal renal function and the Physician’sDesk Reference recommended halving thecimetidine dose for patients “withcreatinine clearance less than 30 cc/min”.
CIMETIDINE Case History (cont.)
Three days later the patient was noted to be confused. The nephrology team reevaluated the patient and agreed to discontinuecimetidine as suggested by the attending internist/clinical pharmacologist. Two days later the patient was alert and was discharged from the hospital to resume outpatient hemodialysis therapy.
LABELING FOR CIMETIDINE*
• DOSAGE ADJUSTMENT1/2 normal dose if CLCr < 30 mL/min
• PHARMACOKINETICSFollowing I.V. or I.M. administration in normal
subjects,~ 75% of drug is recovered from the urine as
parent compound.
* Physician’s Desk Reference. 58th edition, 2004.
9
NOMOGRAM FOR CIMETIDINE DOSING*
*From: Atkinson AJ Jr, Craig RM. Therapy of peptic ulcer disease.
CLE ≈ 25% OF NORMAL IF FUNCTIONALLY ANEPRHIC
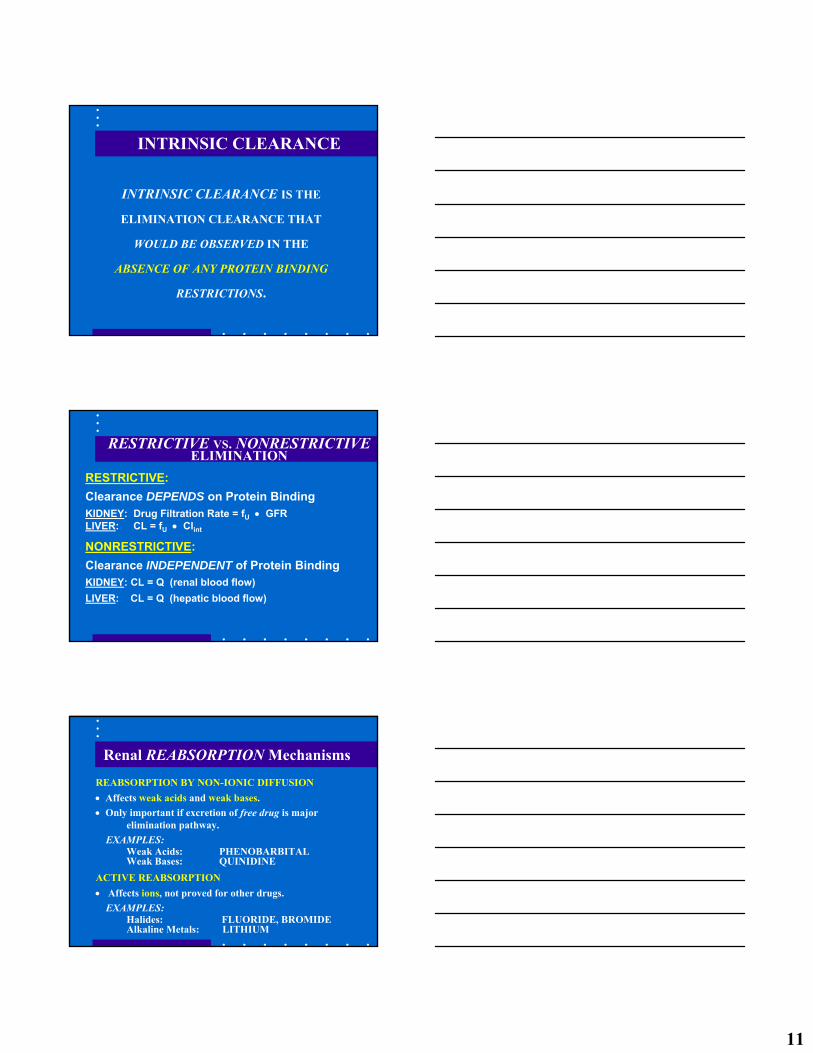
DOSE ADJUSTMENT OPTIONS FORPATIENTS WITH RENAL IMPAIRMENT
• MAINTAIN USUAL DOSING INTERVAL BUT
REDUCE DOSE IN PROPORTION TO ↓CLE
• MAINTAIN USUAL DOSE BUT INCREASEDOSING INTERVAL IN PROPORTION TO ↓CLE
• ADJUST BOTH DOSE AND DOSING INTERVAL
ESS CL
τDOSEC =
GOALS of Renal Disease Effects Lecture
• EFFECT OF RENAL DISEASE ON RENALDRUG ELIMINATION
- MECHANISMS OF RENAL DRUG ELIMINATION
- CONCEPT OF RESTRICTIVE VS.NONRESTRICTIVE ELIMINATION

10
MECHANISMS of Renal Drug Elimination
Glomerular Filtration
Renal Tubular Secretion
Reabsorption by Non-Ionic Diffusion
Active Reabsorption
MECHANISMS OF RENAL ELIMINATION
GLOMERULAR FILTRATION• Affects all drugs and metabolites of appropriate molecular size.• Influenced by protein binding
Drug Filtration Rate = GFR x fu x [Drug](fu = free fraction)
RENAL TUBULAR SECRETION• Not influenced by protein binding• May be affected by other drugs, etc.
EXAMPLES:Active Drugs: ACIDS – Penicillin
BASES – ProcainamideMetabolites: Glucuronides, Hippurates, etc.
RESTRICTIVE VS. NONRESTRICTIVEELIMINATION
RESTRICTIVE:Clearance DEPENDS on Protein Binding.KIDNEY: Drug Filtration Rate = fU • GFRLIVER: CL = fU • Clint
NONRESTRICTIVE:Clearance INDEPENDENT of Protein BindingKIDNEY: CL = Q (renal blood flow)
EXAMPLE: PARA-AMINOHIPPURATE CLEARANCEMEASURES RENAL BLOOD FLOW.
11
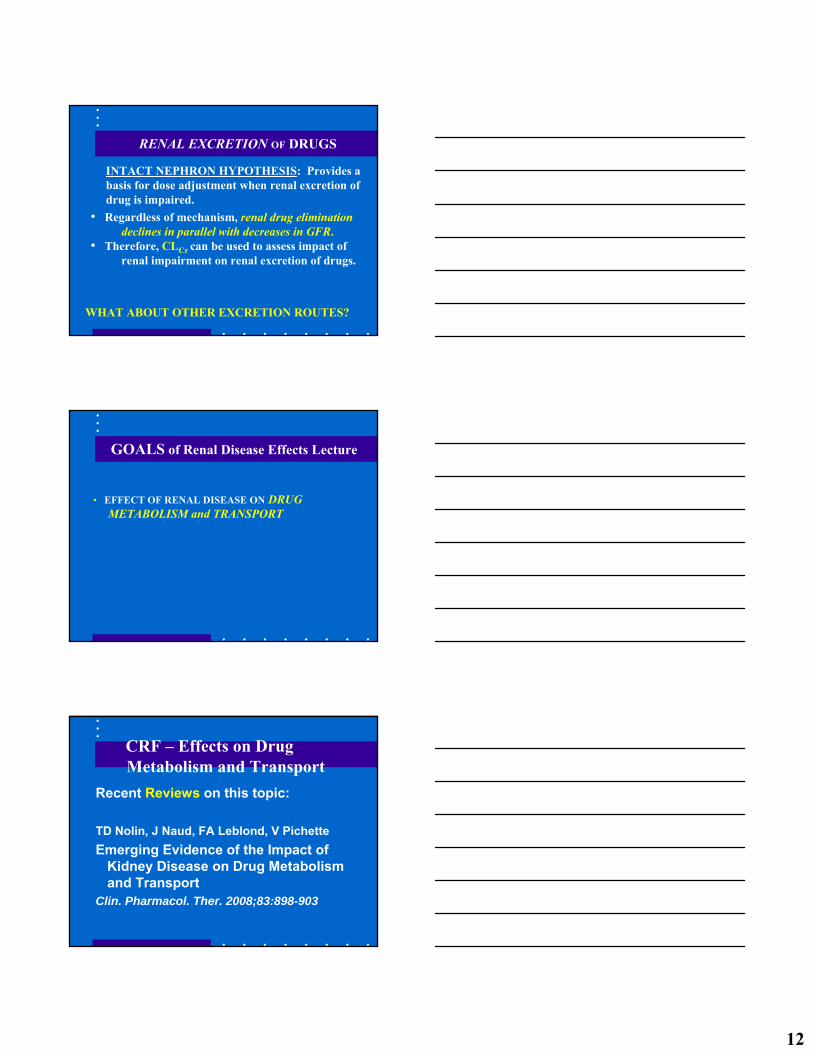
INTRINSIC CLEARANCE
INTRINSIC CLEARANCE IS THE
ELIMINATION CLEARANCE THAT
WOULD BE OBSERVED IN THE
ABSENCE OF ANY PROTEIN BINDING
RESTRICTIONS.
RESTRICTIVE VS. NONRESTRICTIVEELIMINATION
RESTRICTIVE:Clearance DEPENDS on Protein BindingKIDNEY: Drug Filtration Rate = fU • GFRLIVER: CL = fU • Clint
NONRESTRICTIVE:Clearance INDEPENDENT of Protein BindingKIDNEY: CL = Q (renal blood flow)LIVER: CL = Q (hepatic blood flow)
Renal REABSORPTION Mechanisms
REABSORPTION BY NON-IONIC DIFFUSION• Affects weak acids and weak bases.• Only important if excretion of free drug is major
elimination pathway.EXAMPLES:
Weak Acids: PHENOBARBITALWeak Bases: QUINIDINE
ACTIVE REABSORPTION• Affects ions, not proved for other drugs.
EXAMPLES:Halides: FLUORIDE, BROMIDEAlkaline Metals: LITHIUM
12
RENAL EXCRETION OF DRUGS
• Regardless of mechanism, renal drug eliminationdeclines in parallel with decreases in GFR.
• Therefore, CLCr can be used to assess impact of renal impairment on renal excretion of drugs.
INTACT NEPHRON HYPOTHESIS: Provides a basis for dose adjustment when renal excretion of drug is impaired.
WHAT ABOUT OTHER EXCRETION ROUTES?
GOALS of Renal Disease Effects Lecture
• EFFECT OF RENAL DISEASE ON DRUGMETABOLISM and TRANSPORT
CRF – Effects on Drug Metabolism and Transport
Recent Reviews on this topic:
TD Nolin, J Naud, FA Leblond, V PichetteEmerging Evidence of the Impact of
Kidney Disease on Drug Metabolism and Transport
Clin. Pharmacol. Ther. 2008;83:898-903
13
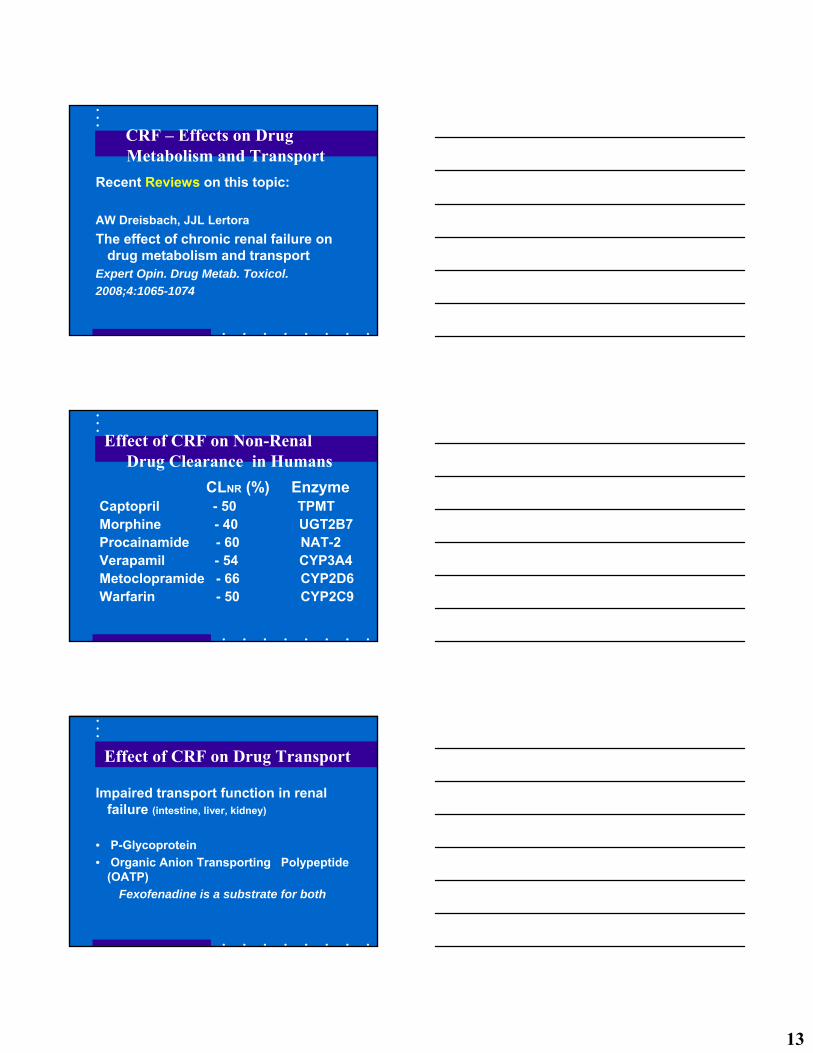
CRF – Effects on Drug Metabolism and Transport
Recent Reviews on this topic:
AW Dreisbach, JJL LertoraThe effect of chronic renal failure on
drug metabolism and transportExpert Opin. Drug Metab. Toxicol.2008;4:1065-1074
Effect of CRF on Non-Renal Drug Clearance in Humans
CLNR (%) EnzymeCaptopril - 50 TPMT Morphine - 40 UGT2B7Procainamide - 60 NAT-2Verapamil - 54 CYP3A4Metoclopramide - 66 CYP2D6Warfarin - 50 CYP2C9
Effect of CRF on Drug Transport
Impaired transport function in renal failure (intestine, liver, kidney)
• P-Glycoprotein• Organic Anion Transporting Polypeptide
(OATP)Fexofenadine is a substrate for both
14
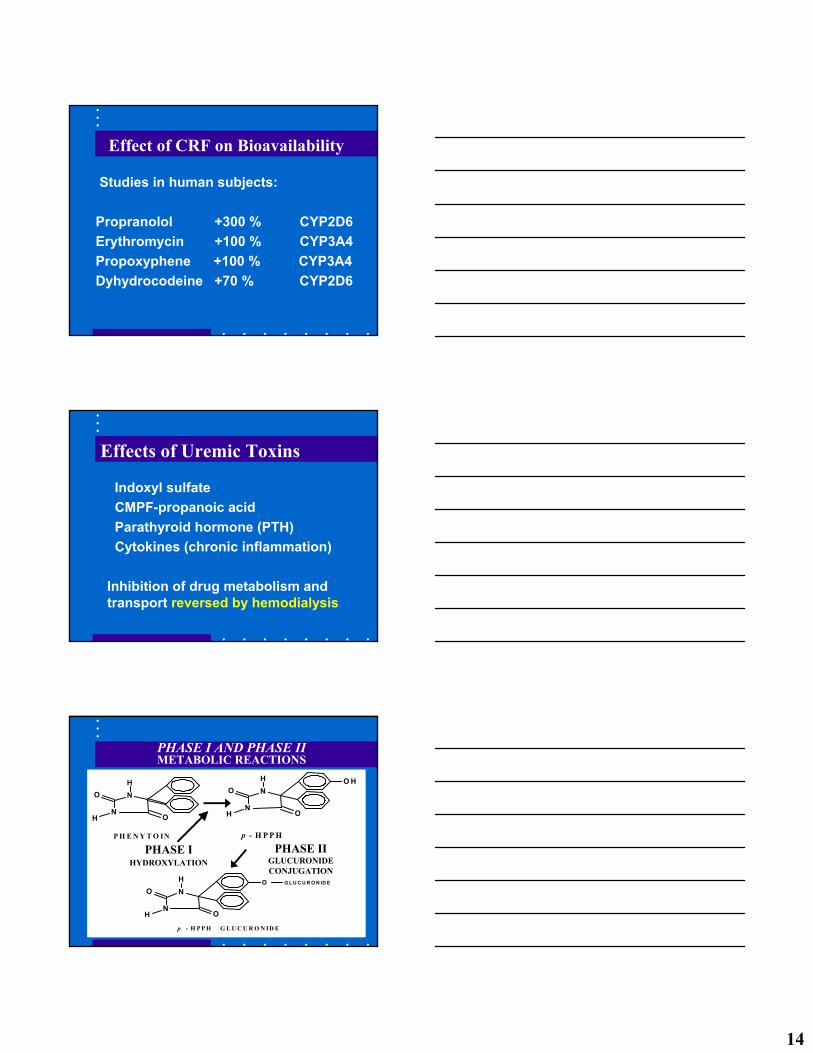
Effect of CRF on Bioavailability
Studies in human subjects:
Propranolol +300 % CYP2D6Erythromycin +100 % CYP3A4Propoxyphene +100 % CYP3A4Dyhydrocodeine +70 % CYP2D6
Effects of Uremic Toxins
Indoxyl sulfateCMPF-propanoic acidParathyroid hormone (PTH)Cytokines (chronic inflammation)
Inhibition of drug metabolism and transport reversed by hemodialysis
N
NO
OH
H
N
NO
OH
H O H
P H E N Y T O IN p - H P P H
N
NO
OH
H O G L U C U R O N ID E
p - H P P H G L U C U R O N ID E
PHASE I AND PHASE IIMETABOLIC REACTIONS
PHASE IIGLUCURONIDECONJUGATION
PHASE IHYDROXYLATION

15
GOALS of Renal Disease Effects Lecture
• EFFECT OF RENAL DISEASE ON DRUGMETABOLISM
• EXAMPLES:PROCAINAMIDE - AcetylationPHENYTOIN - Hydroxylation
PROCAINAMIDE ACETYLATION
RENAL ELIMINATON NORMALLY 50%NAT2: FAST VS. SLOW
Procainamide Kinetics inDIALYSIS PATIENTS*
* From: Gibson TP. Kidney Int 1977;12:422-9.
FUNCTIONALLYNORMALS ANEPHRIC PATIENTSFast Slow Fast Slow
T1/2 (hr) 2.6 3.5 12.2 17.0
CLE (L/kg) 809 600 118 94CLR (L/kg) 426 357 0 0 CLNR (L/kg) 383 243 118 94
Vd(ss) (L/kg) 1.95 1.93 1.41 1.93
16
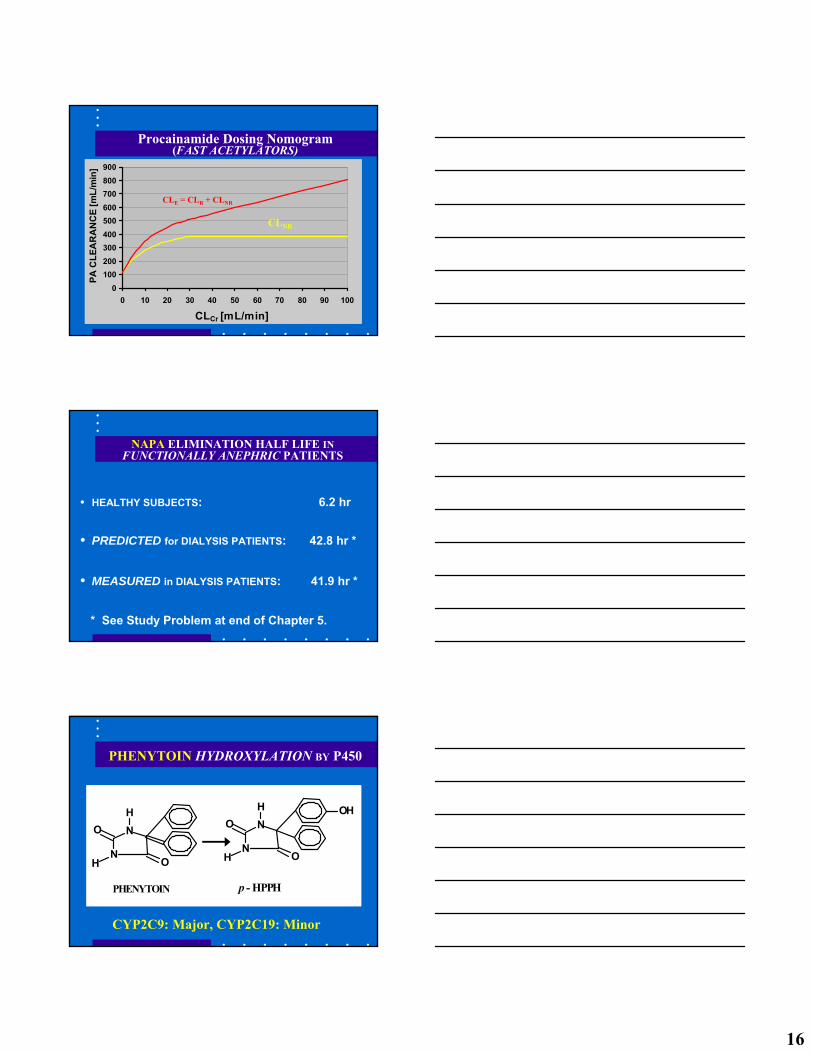
Procainamide Dosing Nomogram(FAST ACETYLATORS)
0100200300400500600700800900
0 10 20 30 40 50 60 70 80 90 100
CLCr [mL/min]
PA C
LEA
RA
NC
E [m
L/m
in]
CLNR
CLE = CLR + CLNR
NAPA ELIMINATION HALF LIFE IN FUNCTIONALLY ANEPHRIC PATIENTS
• HEALTHY SUBJECTS: 6.2 hr
• PREDICTED for DIALYSIS PATIENTS: 42.8 hr *
• MEASURED in DIALYSIS PATIENTS: 41.9 hr *
* See Study Problem at end of Chapter 5.
PHENYTOIN HYDROXYLATION BY P450
N
NO
OH
H
N
NO
OH
H OH
PHENYTOIN p - HPPH
CYP2C9: Major, CYP2C19: Minor

17
Effect of Renal Disease onPHENYTOIN PROTEIN BINDING
PHENYTOINKINETICS IN DIALYSIS PATIENTS*
* From: Odar-Cederlöf I, Borgå O: Eur J Clin Pharmacol 1974;7:31-7.
NORMALS UREMIC PATIENTS(N = 4) (N = 4)
% UNBOUND (fu) 12% 26%
CLH 2.46 L/hr 7.63 L/hr
CLint 20.3 L/hr 29.9 L/hr
CLH = fu • Clint , So: Clint = CLH/fu
NS
Effect of PROTEIN BINDING Changes on Phenytoin Plasma Concentration
ESS CL
DOSEC τ=
/
INTCL/DOSEC USS,
τ=
PHENYTOIN > 98% ELIMINATED BY HEPATIC METABOLISM, SO CLE = CLH
/fu fu
18
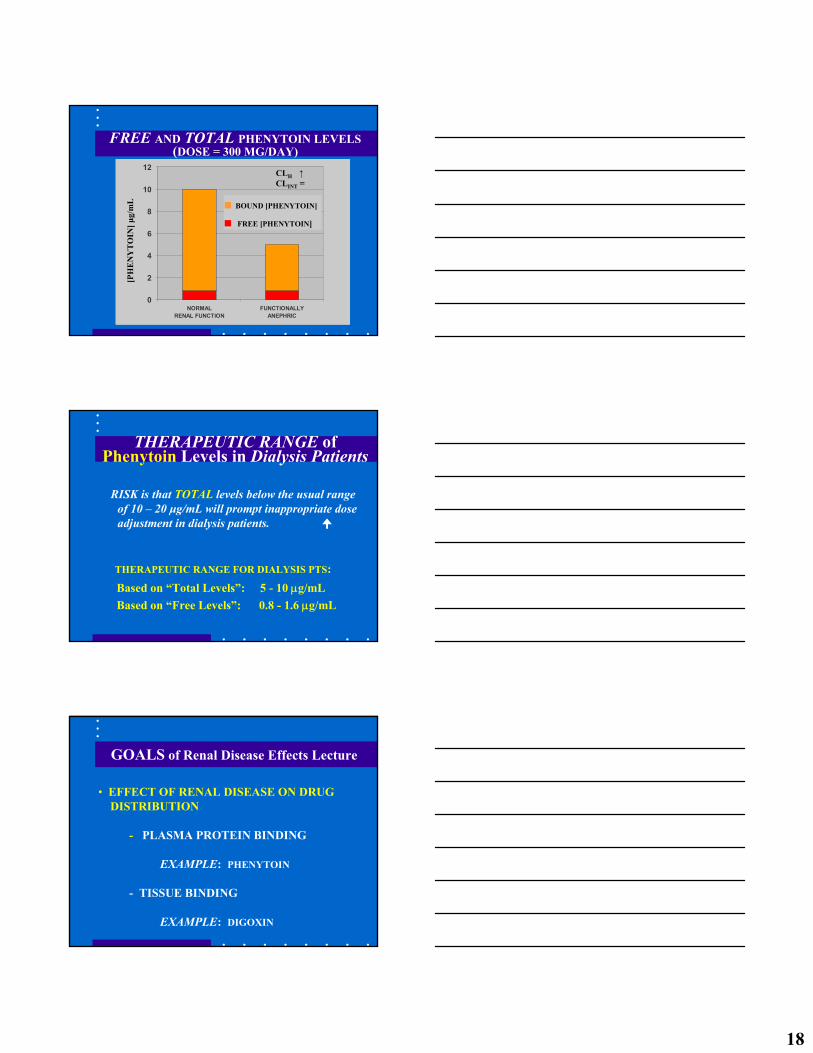
FREE AND TOTAL PHENYTOIN LEVELS(DOSE = 300 MG/DAY)
0
2
4
6
8
10
12
NORMALRENAL FUNCTION
FUNCTIONALLYANEPHRIC
[PH
EN
YT
OIN
] μg/
mL ■ BOUND [PHENYTOIN]
■ FREE [PHENYTOIN]
CLH ↑CLINT =
RISK is that TOTAL levels below the usual rangeof 10 – 20 μg/mL will prompt inappropriate doseadjustment in dialysis patients.
THERAPEUTIC RANGE of Phenytoin Levels in Dialysis Patients
THERAPEUTIC RANGE FOR DIALYSIS PTS:Based on “Total Levels”: 5 - 10 μg/mLBased on “Free Levels”: 0.8 - 1.6 μg/mL
GOALS of Renal Disease Effects Lecture
• EFFECT OF RENAL DISEASE ON DRUG DISTRIBUTION
- PLASMA PROTEIN BINDING
EXAMPLE: PHENYTOIN
- TISSUE BINDING
EXAMPLE: DIGOXIN
19
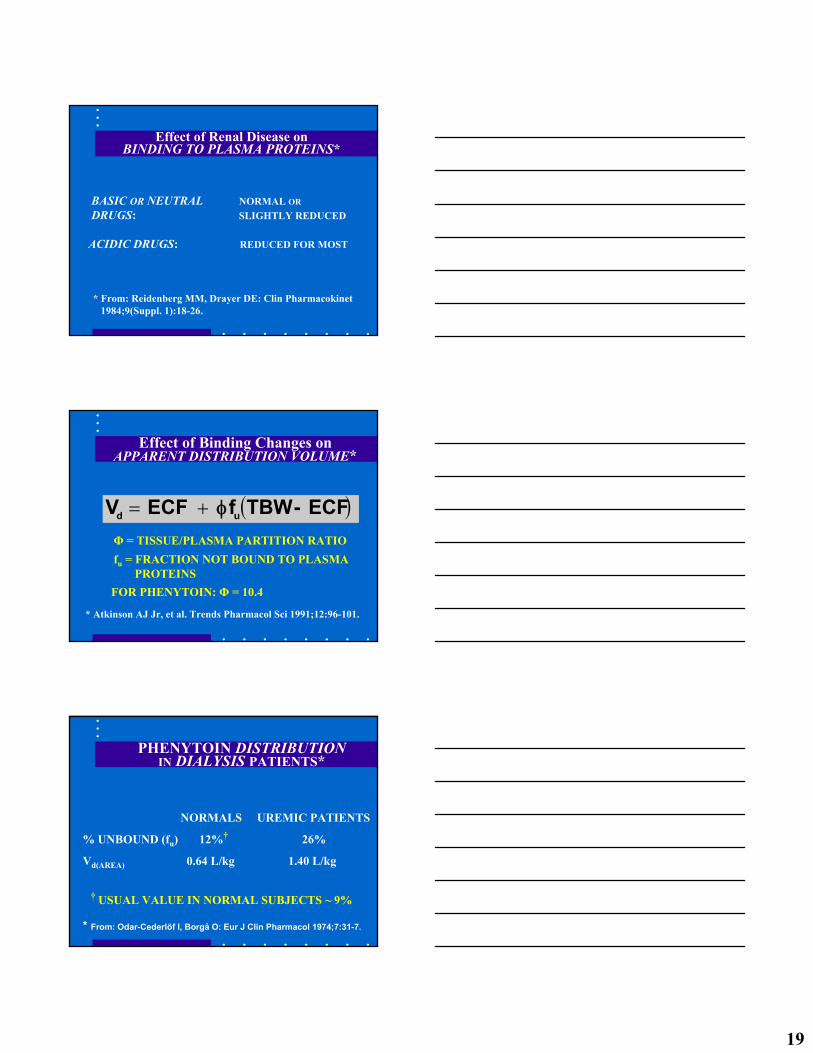
Effect of Renal Disease onBINDING TO PLASMA PROTEINS*
BASIC OR NEUTRAL NORMAL OR
DRUGS: SLIGHTLY REDUCED
ACIDIC DRUGS: REDUCED FOR MOST
* From: Reidenberg MM, Drayer DE: Clin Pharmacokinet1984;9(Suppl. 1):18-26.
Effect of Binding Changes on APPARENT DISTRIBUTION VOLUME*
( )ECF-TBWf ECFV ud φ+=
* Atkinson AJ Jr, et al. Trends Pharmacol Sci 1991;12:96-101.
Φ = TISSUE/PLASMA PARTITION RATIOfu = FRACTION NOT BOUND TO PLASMA
PROTEINSFOR PHENYTOIN: Φ = 10.4
PHENYTOIN DISTRIBUTIONIN DIALYSIS PATIENTS*
* From: Odar-Cederlöf I, Borgå O: Eur J Clin Pharmacol 1974;7:31-7.
NORMALS UREMIC PATIENTS
% UNBOUND (fu) 12%† 26%
Vd(AREA) 0.64 L/kg 1.40 L/kg
† USUAL VALUE IN NORMAL SUBJECTS ~ 9%

20
GOALS OF RENAL DISEASE EFFECTS LECTURE
• EFFECT OF RENAL DISEASE ON DRUG DISTRIBUTION
- PLASMA PROTEIN BINDING
EXAMPLE: PHENYTOIN
- TISSUE BINDING
EXAMPLE: DIGOXIN
IMPAIRED RENAL FUNCTION REDUCESDIGOXIN DISTRIBUTION VOLUME*
(mL/min)CL3.12 (kg)wt 3.84V Crd +•=
* Sheiner LB, et al. J Pharmacokinet Biopharm 1977;5:445-79.
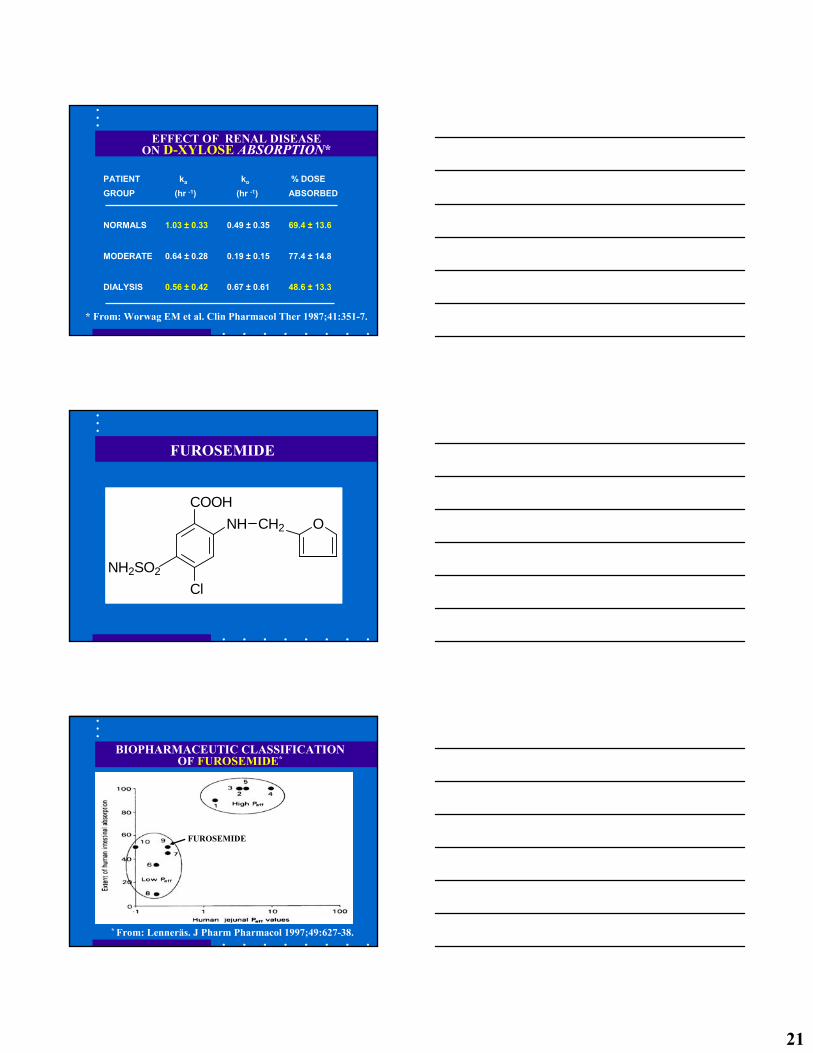
CRITERIA FOR NORMAL ABSORPTIONOF 25 GRAM D-XYLOSE DOSE
5-hr URINE RECOVERY > 4 g
[SERUM] 1 hr AFTER DOSE ≥ 0.2 mg/mL
% DOSE ABSORBED > 42%
ka > 0.37 hr-1
21
EFFECT OF RENAL DISEASEON D-XYLOSE ABSORPTION*
PATIENT ka ko % DOSEGROUP (hr -1) (hr -1) ABSORBED
NORMALS 1.03 ± 0.33 0.49 ± 0.35 69.4 ± 13.6
MODERATE 0.64 ± 0.28 0.19 ± 0.15 77.4 ± 14.8
DIALYSIS 0.56 ± 0.42 0.67 ± 0.61 48.6 ± 13.3
* From: Worwag EM et al. Clin Pharmacol Ther 1987;41:351-7.
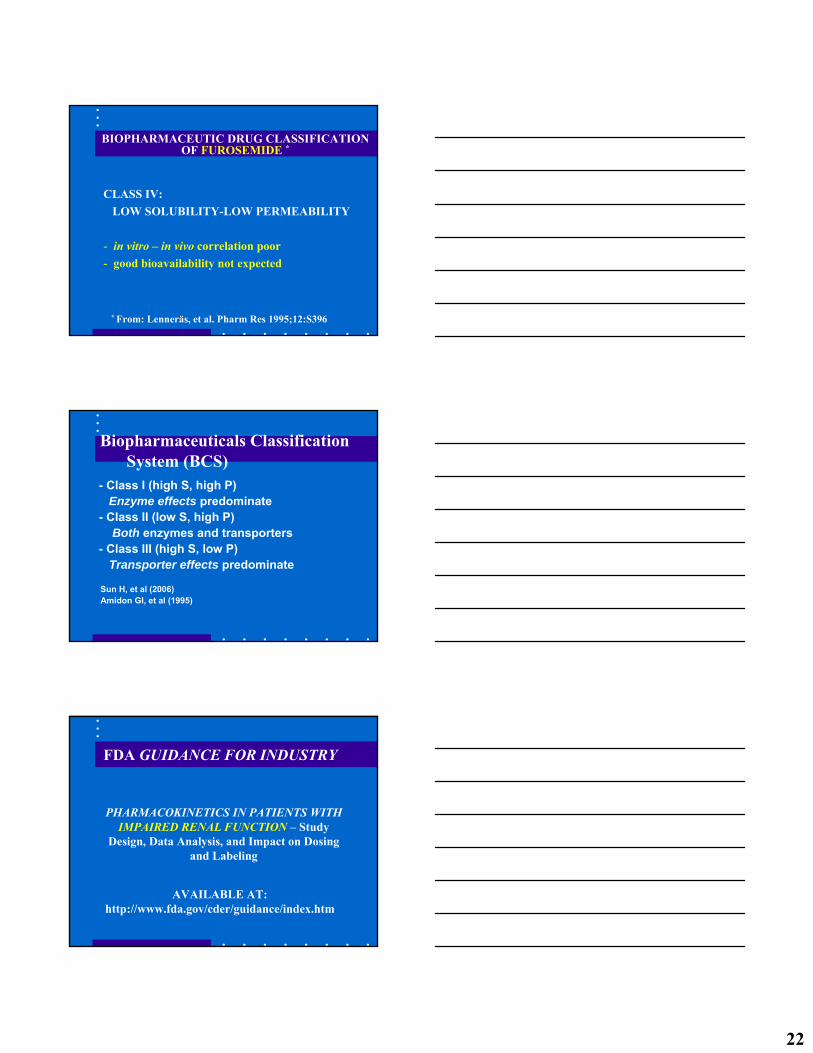
FUROSEMIDE
OCH2NH
ClNH2SO2
COOH
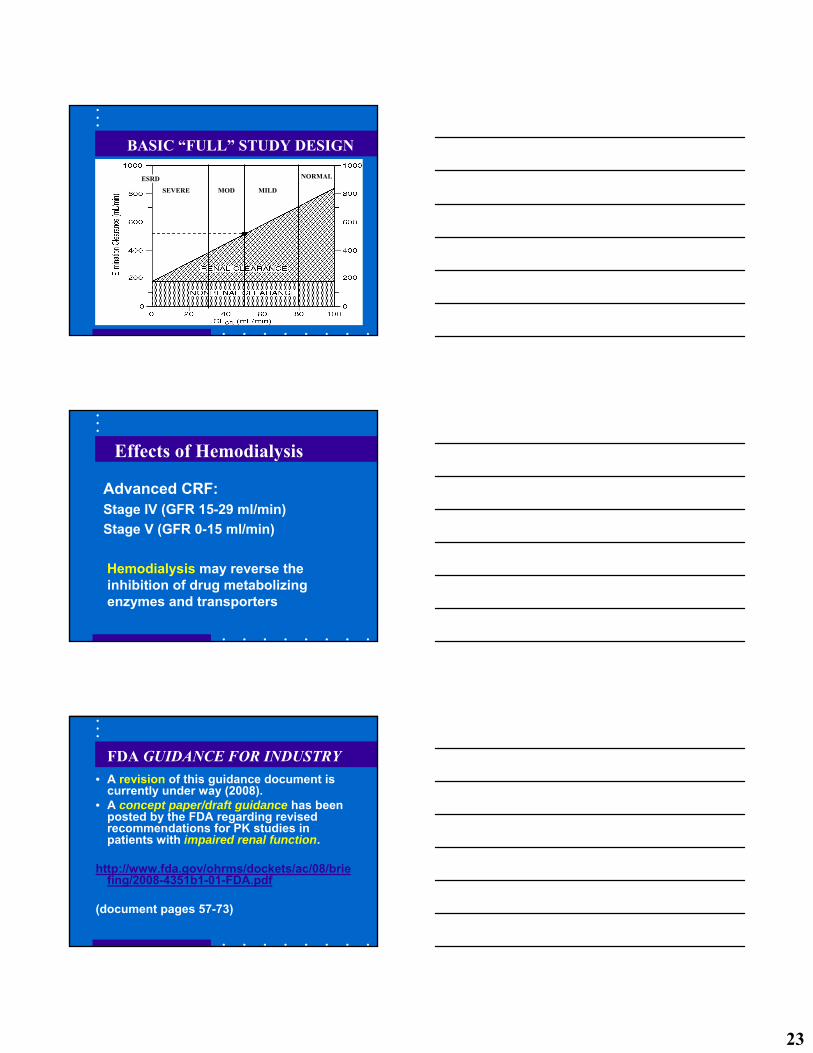
BIOPHARMACEUTIC CLASSIFICATION OF FUROSEMIDE*
* From: Lenneräs. J Pharm Pharmacol 1997;49:627-38.
FUROSEMIDE
22
BIOPHARMACEUTIC DRUG CLASSIFICATIONOF FUROSEMIDE *
CLASS IV:LOW SOLUBILITY-LOW PERMEABILITY
- in vitro – in vivo correlation poor- good bioavailability not expected
* From: Lenneräs, et al. Pharm Res 1995;12:S396
Biopharmaceuticals Classification System (BCS)
- Class I (high S, high P)Enzyme effects predominate
- Class II (low S, high P)Both enzymes and transporters
- Class III (high S, low P)Transporter effects predominate
Sun H, et al (2006)Amidon GI, et al (1995)
FDA GUIDANCE FOR INDUSTRY
PHARMACOKINETICS IN PATIENTS WITHIMPAIRED RENAL FUNCTION – Study
Design, Data Analysis, and Impact on Dosing and Labeling
AVAILABLE AT: http://www.fda.gov/cder/guidance/index.htm
23
BASIC “FULL” STUDY DESIGN
SEVERE MOD MILD
ESRD NORMAL
Effects of Hemodialysis
Advanced CRF:Stage IV (GFR 15-29 ml/min)Stage V (GFR 0-15 ml/min)
Hemodialysis may reverse the inhibition of drug metabolizing enzymes and transporters
FDA GUIDANCE FOR INDUSTRY• A revision of this guidance document is
currently under way (2008).• A concept paper/draft guidance has been
posted by the FDA regarding revised recommendations for PK studies in patients with impaired renal function.
http://www.fda.gov/ohrms/dockets/ac/08/briefing/2008-4351b1-01-FDA.pdf
(document pages 57-73)