Effects of Recombinant Adenovirus-Mediated Uncoupling...
45
Effects of Recombinant Adenovirus-Mediated Uncoupling Protein 2 Overexpression on Endothelial Function and Apoptosis Ki-Up Lee,* In Kyu Lee,* Jin Han, Dae-Kyu Song, Yun Mi Kim, Hai Sun Song, Hyoun Sik Kim, Woo Je Lee, Eun Hee Koh, Kee-Ho Song, Sung Min Han, Min Seon Kim, In-Sun Park, Joong-Yeol Park Abstract—Increased oxidative stress in vascular cells plays a key role in the development of endothelial dysfunction and atherosclerosis. Uncoupling protein 2 (UCP2) is an important regulator of intracellular reactive oxygen species (ROS) production. This study was undertaken to test the hypothesis that, UCP2 functions as an inhibitor of the atherosclerotic process in endothelial cells. Adenovirus-mediated UCP2 (Ad-UCP2) overexpression led to a significant increase in eNOS and decrease in endothelin-1 mRNA expression in human aortic endothelial cells (HAECs). Moreover, UCP2 inhibited the increase in ROS production and NF-B activation, and apoptosis of HAECs induced by lysophophati- dylcholine (LPC) and linoleic acid. LPC and linoleic acid caused mitochondrial calcium accumulation and transient mitochondrial membrane hyperpolarization, which was followed by depolarization. UCP2 overexpression prevented these processes. In isolated rat aorta, Ad-UCP2 infection markedly improved impaired vascular relaxation induced by LPC. The data collectively suggest that UCP2, functions as a physiologic regulator of ROS generation in endothelial cells. Thus, measures to increase UCP2 expression in vascular endothelial cells may aid in preventing the development and progression of atherosclerosis in patients with metabolic syndrome. (Circ Res. 2005;96:000-000.) Key Words: endothelial cells uncoupling protein oxidative stress vascular endothelial function apoptosis M etabolic syndrome is a cluster of simultaneously oc- curring vascular risk factors, such as central obesity, hypertension, dyslipidemia, and glucose intolerance. 1 Im- paired endothelium-dependent vascular relaxation (endothe- lial dysfunction), generally considered a prerequisite for atherosclerosis, is a frequent finding in metabolic syndrome. 2 Subjects with metabolic syndrome frequently display ele- vated plasma concentrations of free fatty acid (FFA) and oxidized LDL. 1,3,4,5 Lipid emulsion and oxidized LDL induce endothelial dysfunction similar to what is observed in meta- bolic syndrome. 6,7 It is therefore suggested that endothelial dysfunction in metabolic syndrome is mediated, at least in part, by elevated circulating FFA and oxidized LDL levels. Endothelium is important in the regulation of smooth muscle cell growth, migration, and proliferation. In this regard, endothelial apoptosis is an important early event in the pathogenesis of atherosclerosis. 8 Endothelium also mod- ulates vascular tone through the release of relaxing or contracting substances, including nitric oxide (NO), prosta- cyclin, endothelium-derived hyperpolarizing factor (EDHF), and endothelin-1 (ET-1). Several lines of evidence have suggested that decreased availability of NO and/or increased availability of ET-1 in the vasculature are central to the pathogenesis of impaired vascular relaxation observed in the early stages of atherosclerosis. 9,10,11 Increased oxidative stress in vascular cells is a key mech- anism of endothelial dysfunction and atherosclerosis. 12 Var- ious risk factors for atherosclerosis generate intracellular oxidative stress. A relatively high level of oxidative stress, in turn, induces vascular inflammatory “atherogenic” genes via redox-sensitive signaling pathways, and activates redox- sensitive transcription factors. 12 Mitochondrial uncoupling protein (UCP)2 is a novel member of the mitochondrial anion carrier family, and displays 60% sequence identity with the well-known thermogenic UCP1 from brown adipose tissue. 13 Previous studies suggest that UCP2 is involved in the control of mitochondrial membrane potential ( m ) 14 and reactive oxygen species (ROS) generation. 15 A direct role of UCP2 as an important regulator of atherogenesis is additionally sug- gested, in view of the finding that bone marrow transplanta- tion of UCP2-deficient mice to low-density lipoprotein receptor-deficient mice markedly increased atherosclerotic Original received October 6, 2004; resubmission received April 14, 2005; revision resubmission received May 4, 2005; accepted May 5, 2005. From the University of Ulsan College of Medicine (K.-U.L., W.J.L., E.H.K., K.-H.S., S.M.H., M.S.K., I.-S.P., J.-Y.P.), Seoul, Korea; College of Medicine (I.K.L., D.-K.S.), Keimyung University, Taegu, Korea; College of Medicine (J.H.), Inje University, Pusan, Korea; Asan Institute for Life Sciences (Y.M.K., H.S.S., H.S.K.), Seoul, Korea; Department of Anatomy, Inha University College of Medicine, Inchon, Korea *Drs K.-U. Lee and I.K. Lee contributed equally to this work. Correspondence to Dr Joong-Yeol Park, Department of Internal Medicine, University of Ulsan College of Medicine, Asan Medical Center, Song-Pa P.O. Box 145, Seoul 138-600, Korea. E-mail [email protected] © 2005 American Heart Association, Inc. Circulation Research is available at http://www.circresaha.org DOI: 10.1161/01.RES.0000170075.73039.5b 1 by guest on June 17, 2018 http://circres.ahajournals.org/ Downloaded from by guest on June 17, 2018 http://circres.ahajournals.org/ Downloaded from by guest on June 17, 2018 http://circres.ahajournals.org/ Downloaded from by guest on June 17, 2018 http://circres.ahajournals.org/ Downloaded from by guest on June 17, 2018 http://circres.ahajournals.org/ Downloaded from by guest on June 17, 2018 http://circres.ahajournals.org/ Downloaded from by guest on June 17, 2018 http://circres.ahajournals.org/ Downloaded from by guest on June 17, 2018 http://circres.ahajournals.org/ Downloaded from by guest on June 17, 2018 http://circres.ahajournals.org/ Downloaded from by guest on June 17, 2018 http://circres.ahajournals.org/ Downloaded from by guest on June 17, 2018 http://circres.ahajournals.org/ Downloaded from by guest on June 17, 2018 http://circres.ahajournals.org/ Downloaded from by guest on June 17, 2018 http://circres.ahajournals.org/ Downloaded from by guest on June 17, 2018 http://circres.ahajournals.org/ Downloaded from by guest on June 17, 2018 http://circres.ahajournals.org/ Downloaded from by guest on June 17, 2018 http://circres.ahajournals.org/ Downloaded from by guest on June 17, 2018 http://circres.ahajournals.org/ Downloaded from by guest on June 17, 2018 http://circres.ahajournals.org/ Downloaded from by guest on June 17, 2018 http://circres.ahajournals.org/ Downloaded from by guest on June 17, 2018 http://circres.ahajournals.org/ Downloaded from by guest on June 17, 2018 http://circres.ahajournals.org/ Downloaded from by guest on June 17, 2018 http://circres.ahajournals.org/ Downloaded from by guest on June 17, 2018 http://circres.ahajournals.org/ Downloaded from by guest on June 17, 2018 http://circres.ahajournals.org/ Downloaded from by guest on June 17, 2018 http://circres.ahajournals.org/ Downloaded from by guest on June 17, 2018 http://circres.ahajournals.org/ Downloaded from by guest on June 17, 2018 http://circres.ahajournals.org/ Downloaded from by guest on June 17, 2018 http://circres.ahajournals.org/ Downloaded from by guest on June 17, 2018 http://circres.ahajournals.org/ Downloaded from by guest on June 17, 2018 http://circres.ahajournals.org/ Downloaded from by guest on June 17, 2018 http://circres.ahajournals.org/ Downloaded from by guest on June 17, 2018 http://circres.ahajournals.org/ Downloaded from by guest on June 17, 2018 http://circres.ahajournals.org/ Downloaded from by guest on June 17, 2018 http://circres.ahajournals.org/ Downloaded from by guest on June 17, 2018 http://circres.ahajournals.org/ Downloaded from by guest on June 17, 2018 http://circres.ahajournals.org/ Downloaded from by guest on June 17, 2018 http://circres.ahajournals.org/ Downloaded from by guest on June 17, 2018 http://circres.ahajournals.org/ Downloaded from by guest on June 17, 2018 http://circres.ahajournals.org/ Downloaded from
Transcript of Effects of Recombinant Adenovirus-Mediated Uncoupling...
Effects of Recombinant Adenovirus-Mediated UncouplingProtein 2 Overexpression on Endothelial Function
and ApoptosisKi-Up Lee,* In Kyu Lee,* Jin Han, Dae-Kyu Song, Yun Mi Kim, Hai Sun Song, Hyoun Sik Kim,
Woo Je Lee, Eun Hee Koh, Kee-Ho Song, Sung Min Han, Min Seon Kim,In-Sun Park, Joong-Yeol Park
Abstract—Increased oxidative stress in vascular cells plays a key role in the development of endothelial dysfunction andatherosclerosis. Uncoupling protein 2 (UCP2) is an important regulator of intracellular reactive oxygen species (ROS)production. This study was undertaken to test the hypothesis that, UCP2 functions as an inhibitor of the atheroscleroticprocess in endothelial cells. Adenovirus-mediated UCP2 (Ad-UCP2) overexpression led to a significant increase ineNOS and decrease in endothelin-1 mRNA expression in human aortic endothelial cells (HAECs). Moreover, UCP2inhibited the increase in ROS production and NF-�B activation, and apoptosis of HAECs induced by lysophophati-dylcholine (LPC) and linoleic acid. LPC and linoleic acid caused mitochondrial calcium accumulation and transientmitochondrial membrane hyperpolarization, which was followed by depolarization. UCP2 overexpression preventedthese processes. In isolated rat aorta, Ad-UCP2 infection markedly improved impaired vascular relaxation induced byLPC. The data collectively suggest that UCP2, functions as a physiologic regulator of ROS generation in endothelialcells. Thus, measures to increase UCP2 expression in vascular endothelial cells may aid in preventing the developmentand progression of atherosclerosis in patients with metabolic syndrome. (Circ Res. 2005;96:000-000.)
Key Words: endothelial cells � uncoupling protein � oxidative stress � vascular endothelial function � apoptosis
Metabolic syndrome is a cluster of simultaneously oc-curring vascular risk factors, such as central obesity,
hypertension, dyslipidemia, and glucose intolerance.1 Im-paired endothelium-dependent vascular relaxation (endothe-lial dysfunction), generally considered a prerequisite foratherosclerosis, is a frequent finding in metabolic syndrome.2
Subjects with metabolic syndrome frequently display ele-vated plasma concentrations of free fatty acid (FFA) andoxidized LDL.1,3,4,5 Lipid emulsion and oxidized LDL induceendothelial dysfunction similar to what is observed in meta-bolic syndrome.6,7 It is therefore suggested that endothelialdysfunction in metabolic syndrome is mediated, at least inpart, by elevated circulating FFA and oxidized LDL levels.
Endothelium is important in the regulation of smoothmuscle cell growth, migration, and proliferation. In thisregard, endothelial apoptosis is an important early event inthe pathogenesis of atherosclerosis.8 Endothelium also mod-ulates vascular tone through the release of relaxing orcontracting substances, including nitric oxide (NO), prosta-cyclin, endothelium-derived hyperpolarizing factor (EDHF),and endothelin-1 (ET-1). Several lines of evidence have
suggested that decreased availability of NO and/or increasedavailability of ET-1 in the vasculature are central to thepathogenesis of impaired vascular relaxation observed in theearly stages of atherosclerosis.9,10,11
Increased oxidative stress in vascular cells is a key mech-anism of endothelial dysfunction and atherosclerosis.12 Var-ious risk factors for atherosclerosis generate intracellularoxidative stress. A relatively high level of oxidative stress, inturn, induces vascular inflammatory “atherogenic” genes viaredox-sensitive signaling pathways, and activates redox-sensitive transcription factors.12 Mitochondrial uncouplingprotein (UCP)2 is a novel member of the mitochondrial anioncarrier family, and displays 60% sequence identity with thewell-known thermogenic UCP1 from brown adipose tissue.13
Previous studies suggest that UCP2 is involved in the controlof mitochondrial membrane potential (��m)14 and reactiveoxygen species (ROS) generation.15 A direct role of UCP2 asan important regulator of atherogenesis is additionally sug-gested, in view of the finding that bone marrow transplanta-tion of UCP2-deficient mice to low-density lipoproteinreceptor-deficient mice markedly increased atherosclerotic
Original received October 6, 2004; resubmission received April 14, 2005; revision resubmission received May 4, 2005; accepted May 5, 2005.From the University of Ulsan College of Medicine (K.-U.L., W.J.L., E.H.K., K.-H.S., S.M.H., M.S.K., I.-S.P., J.-Y.P.), Seoul, Korea; College of
Medicine (I.K.L., D.-K.S.), Keimyung University, Taegu, Korea; College of Medicine (J.H.), Inje University, Pusan, Korea; Asan Institute for LifeSciences (Y.M.K., H.S.S., H.S.K.), Seoul, Korea; Department of Anatomy, Inha University College of Medicine, Inchon, Korea
*Drs K.-U. Lee and I.K. Lee contributed equally to this work.Correspondence to Dr Joong-Yeol Park, Department of Internal Medicine, University of Ulsan College of Medicine, Asan Medical Center, Song-Pa
P.O. Box 145, Seoul 138-600, Korea. E-mail [email protected]© 2005 American Heart Association, Inc.
Circulation Research is available at http://www.circresaha.org DOI: 10.1161/01.RES.0000170075.73039.5b
1
by guest on June 17, 2018http://circres.ahajournals.org/
Dow
nloaded from
by guest on June 17, 2018http://circres.ahajournals.org/
Dow
nloaded from
by guest on June 17, 2018http://circres.ahajournals.org/
Dow
nloaded from
by guest on June 17, 2018http://circres.ahajournals.org/
Dow
nloaded from
by guest on June 17, 2018http://circres.ahajournals.org/
Dow
nloaded from
by guest on June 17, 2018http://circres.ahajournals.org/
Dow
nloaded from
by guest on June 17, 2018http://circres.ahajournals.org/
Dow
nloaded from
by guest on June 17, 2018http://circres.ahajournals.org/
Dow
nloaded from
by guest on June 17, 2018http://circres.ahajournals.org/
Dow
nloaded from
by guest on June 17, 2018http://circres.ahajournals.org/
Dow
nloaded from
by guest on June 17, 2018http://circres.ahajournals.org/
Dow
nloaded from
by guest on June 17, 2018http://circres.ahajournals.org/
Dow
nloaded from
by guest on June 17, 2018http://circres.ahajournals.org/
Dow
nloaded from
by guest on June 17, 2018http://circres.ahajournals.org/
Dow
nloaded from
by guest on June 17, 2018http://circres.ahajournals.org/
Dow
nloaded from
by guest on June 17, 2018http://circres.ahajournals.org/
Dow
nloaded from
by guest on June 17, 2018http://circres.ahajournals.org/
Dow
nloaded from
by guest on June 17, 2018http://circres.ahajournals.org/
Dow
nloaded from
by guest on June 17, 2018http://circres.ahajournals.org/
Dow
nloaded from
by guest on June 17, 2018http://circres.ahajournals.org/
Dow
nloaded from
by guest on June 17, 2018http://circres.ahajournals.org/
Dow
nloaded from
by guest on June 17, 2018http://circres.ahajournals.org/
Dow
nloaded from
by guest on June 17, 2018http://circres.ahajournals.org/
Dow
nloaded from
by guest on June 17, 2018http://circres.ahajournals.org/
Dow
nloaded from
by guest on June 17, 2018http://circres.ahajournals.org/
Dow
nloaded from
by guest on June 17, 2018http://circres.ahajournals.org/
Dow
nloaded from
by guest on June 17, 2018http://circres.ahajournals.org/
Dow
nloaded from
by guest on June 17, 2018http://circres.ahajournals.org/
Dow
nloaded from
by guest on June 17, 2018http://circres.ahajournals.org/
Dow
nloaded from
by guest on June 17, 2018http://circres.ahajournals.org/
Dow
nloaded from
by guest on June 17, 2018http://circres.ahajournals.org/
Dow
nloaded from
by guest on June 17, 2018http://circres.ahajournals.org/
Dow
nloaded from
by guest on June 17, 2018http://circres.ahajournals.org/
Dow
nloaded from
by guest on June 17, 2018http://circres.ahajournals.org/
Dow
nloaded from
by guest on June 17, 2018http://circres.ahajournals.org/
Dow
nloaded from
by guest on June 17, 2018http://circres.ahajournals.org/
Dow
nloaded from
by guest on June 17, 2018http://circres.ahajournals.org/
Dow
nloaded from
by guest on June 17, 2018http://circres.ahajournals.org/
Dow
nloaded from
by guest on June 17, 2018http://circres.ahajournals.org/
Dow
nloaded from

lesion sizes.16 However, the function of UCP2 in vascularendothelial cells is currently unclear.
In this study, we examined the possible antiatherogenicrole of UCP2 in vascular endothelial cells. For this purpose,we analyzed the effects of adenovirus-mediated UCP2 over-expression on ��m, ROS generation, mitochondrial Ca2�
flux, apoptosis, mRNA expression of endothelial nitric oxidesynthase (eNOS), and ET-1 genes in cultured human aorticendothelial cells (HAECs), as well as on relaxation of isolatedrat aorta.
Materials and MethodsCell CultureHAECs were obtained from BioWhittaker Inc. (Walkersville, Md),and maintained in endothelial basal medium (EBM, BioWhittaker)supplemented with various growth factors and 2% fetal bovine serum(FBS). Cells were passaged more than 5 times before use inexperiments. Cells were transferred to modified Eagle’s medium(MEM) containing 0.5% FBS, and incubated in media containingvarious substances for the indicated times.
Preparation of Recombinant AdenovirusAdenoviruses containing human UCP2 (Ad-UCP2) and �-galactosidase(Ad-�-gal) cDNA were transferred (6�106 p.f.u./mL) to confluentHAEC by 1 hour infection at 37°C in DMEM without serum andincubation in normal growth media for 48 hours.17 Western blots insubcellular fractions showed that UCP2 was overexpressed mainlywithin mitochondria (see Figure I available in the online data supple-ment at http://circres.ahajournals.org). Overexpression of the UCP2gene in the rat aortic ring was achieved by 30 minute adenoviralinfection of 6�106 p.f.u./mL at 37°C in DMEM without serum andincubation in media containing 5% BSA for 24 hours.18
Preparation of iRNAThe iRNA specific for human UCP2 (5�-AAC UGU UUG ACAGAA UCA UAC AGG C-3�) and control iRNA (5�- AAC ACUUGU UAG ACA GUA ACA UGG C-3�), which has same GCcontents as target sequences and has no effect on silencing of UCP2gene expression, were synthesized (Invitrogen, Carlsbad, Calif).
Northern Blot AnalysisET-1 and eNOS mRNA levels were analyzed by Northern blotanalysis, as described previously.19 Band intensities were determinedwith a densitometer and corrected by that of GAPDH.
Measurement of Intracellular NO LevelThe NO level in HAECs was measured in situ by using DAF-FMdiacetate (Molecular Probes Inc.).20
Measurement of Intracellular ROS ProductionHAECs were incubated with 10 �mol/mL carboxydichlorodihydroflu-orescein diacetate (DCFH2-DA, Molecular Probes, Eugene, Ore) at37°C. After 15 minutes incubation, the increase in DCFH2 oxidationwas measured using FACSCalibur (Becton Dickinson).21,22
Electrophoretic Mobility Shift Assay (EMSA)NF-�B activity was determined by EMSA as previously described.23
Analysis of ApoptosisApotosis was measured by various methods; ELISA, DNA ladder-ing, FACScan, and caspase assay.
Confocal Fluorescence Imaging of MitochondrialCa2� Concentration and Membrane PotentialMitochondrial Ca2� concentration ([Ca2�]m) and membrane potential(��m) were measured using confocal microscope (Carl Zeiss) asdescribed.14,24
Assessment of the Opening of MitochondrialPermeability Transition (PT) Pores and Releaseof Cytochrome cOpening of PT pores and release of cytochrome c were assessed aspreviously described.25
Measurement of Activity of MitochondrialRespiratory ChainMitochondrial respiration was measured as previously described.26
Vascular Function StudyVascular function study was performed using an isometric forcedisplacement transducer (Hugo Sachs Elektronik KG D-7806) and apolygraph (Graphtec Linerecorder mark 8 WR3500) as describedpreviously.18
Statistical AnalysisResults are expressed as means�SEM. Statistical significance wasestimated by 1-way ANOVA and Student Newman-Keuls test forcomparison of several groups. Differences were classified as signif-icant at P�0.05.
An expanded Materials and Methods section is available in theonline data supplement at http://circres.ahajournals.org.
ResultsUCP2 mRNA Expression in HAECsCultured HAECs displayed significant levels of UCP2 mRNA(online data supplement Figure IIA). Lysophosphatidylcholine
Figure 1. Effect of adenoviral overexpression of the humanUCP2 gene on ET-1 (A) and eNOS (B) mRNA expression andNO production (C) in HAECs. HAECs were infected withAd-UCP2 or Ad-�-gal. Two days after infection, HAECs weremaintained in media containing 0.5% FBS for 12 hours, andexposed to 4 �g/mL LPC for 4 hours or 300 �mol/L linoleic acidfor 6 hours. Cells were lysed, and total RNA extracted. TotalRNA (10 �g) was hybridized with human ET-1 and eNOS probe.RNA quantity was normalized by GAPDH. The NO level inHAECs was measured in situ by using DAF-FM diacetate. Val-ues are presented as means�SEM of 4 independent experi-ments. *P�0.01 versus Control, **P�0.01 versus �-gal.
2 Circulation Research June 10, 2005
by guest on June 17, 2018http://circres.ahajournals.org/
Dow
nloaded from
(LPC) and linoleic acid increased UCP2 mRNA levels by 3.5 and4.1-fold, respectively.
Effects of Adenoviral UCP2 Gene Transfer onUCP2 mRNA ExpressionHAEC infected with adenovirus containing UCP2 (Ad-UCP2)cDNA at doses of 3, 6, 12, and 24�106 p.f.u./mL exhibited 2-, 6-,
13-, and 26-fold increase in UCP2 mRNA levels, respectively,compared with cells infected with Ad-�-gal (online data supple-ment Figure IIB). The level of UCP2 mRNA following adenoviralUCP2 gene transfer at the dose of 6�106 p.f.u. was �2-fold higherthan that induced by LPC and linoleic acid. Accordingly, this doseof Ad-UCP2 was used in subsequent experiments.
Effects of Adenoviral UCP2 Gene Transfer onET-1 and eNOS mRNA Expression andIntracellular NO LevelLPC and linoleic acid induced a significant increase in ET-1 mRNAexpression, compared with the control (P�0.01). Notably, thisincreased ET-1 mRNA expression was diminished to levels com-parable to that of the control, following treatment with Ad-UCP2(Figure 1A).
Expression of eNOS mRNA was significantly increased inthe presence of LPC or linoleic acid, relative to the control(P�0.01, Figure 1B). However, intracellular NO level wasdecreased by LPC or linoleic acid (Figure 1C). UCP2overexpression increased eNOS mRNA expression and intra-cellular NO level (Figure 1B and C).
Effects of Adenoviral UCP2 Gene Transfer onIntracellular ROS Generation andNF-�B ActivationIncubation with LPC and linoleic acid significantly increasedintracellular ROS production. On UCP2 overexpression, theincrease in ROS production induced by LPC and linoleic acidwas suppressed (Figure 2A). Catalase and uric acid, whichscavenges hydrogen peroxide and peroxynitrite respectively,inhibited linoleic acid/LPC-increased DCF fluorescence, in-dicating that linoleic acid and LPC increased both hydrogenperoxide and peroxynitrite production (online data supple-
Figure 2. Effect of adenoviral overexpression of UCP2 on ROS gener-ation (A) and NF-�B activation (B). Quiescent HAECs were infectedwith Ad-UCP2 or Ad-�-gal. Two days after infection, cells were main-tained in media containing 0.5% FBS for 12 hours, and exposed to 4�g/mL LPC for 4 hours or 300 � mol/L linoleic acid for 6 hours. (A)After 15 minutes incubation with 10 �mol/mL carboxydichlorodihydro-fluorescein diacetate (DCFH2-DA), the increase in DCFH2 oxidationwas measured using FACSCalibur. Values are presented asmeans�SEM of 4 independent experiments. *P�0.01 versus Control,**P�0.01 versus �-gal. (B) NF-�B binding activity was determined byEMSA. Nuclear extracts were prepared from HAECs. For the antibodysupershift assay, nuclear extracts were incubated with 10 �g of anti-p50 polyclonal antibody for 15 minutes at room temperature beforethe addition of the 32P-labeled oligonucleotides. The upper arrow indi-cates the p50 supershift, and the lower arrow specifies the position ofthe NF-�B-specific complex. The bottom depicts the free probe.
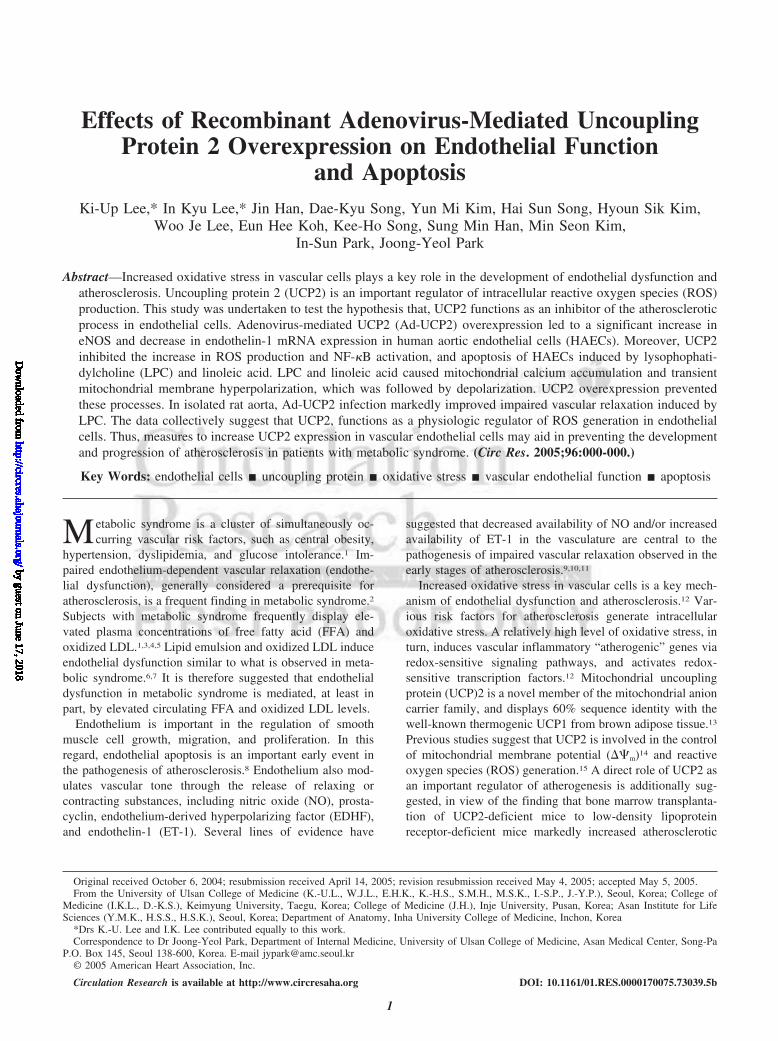
Figure 3. Effect of adenoviral overex-pression of UCP2 on LPC- and linoleicacid-induced apoptosis and caspaseactivation. HAECs were infected withAd-UCP2 or Ad-�-gal. Two days afterinfection, cells were maintained in mediacontaining 0.5% FBS for 12 hours andexposed to 4 �g/mL LPC for 8 hours or300 �mol/L linoleic acid for 16 hours.After treatment, apoptosis was analyzedby measuring the levels of cytosolichistone-bound DNA fragments using acell death ELISA assay kit (A) and visual-ization of DNA fragmentation usingSouthern blot (B). Caspase-3 activationwas analyzed by measuring activitiesusing a caspase fluorescence assay kit(C) and immunoblotting for active subunitof caspase-3 (D). The values are present-ed as means�SEM of 5 independentexperiments. *P�0.01 versus Control,**P�0.01 versus �-gal.
Lee et al Uncoupling Protein 2 in Endothelial Cells 3
by guest on June 17, 2018http://circres.ahajournals.org/
Dow
nloaded from

ment Figure III). LPC and linoleic acid activated NF-�B inHAECs. Ad-UCP2 infection markedly decreased activationof NF-�B induced by these agents (Figure 2B).
Effects of Adenoviral UCP2 Gene Transfer onApoptosis and Caspase ActivationLPC and linoleic acid increased endothelial apoptosis by 2.3-and 2.5-fold, respectively. UCP2 overexpression protectedHAEC from LPC- and linoleic acid-induced apoptosis by38% and 40%, respectively (Figure 3A). Southern blottingdata additionally revealed that UCP2 decreased linoleicacid-induced DNA fragmentation (Figure 3B). FACScanrevealed that UCP2 overexpression inhibited both apoptosisand necrosis of HAECs (online data supplement Figure IV).
LPC and linoleic acid induced a significant increase incaspase-3 (Figure 3C), -8, and -9 activities (online datasupplement Figure VA and B) in HAECs. Following UCP2overexpression, this lipid-induced increase in caspase activitywas inhibited. The generation of active caspase-3 from theproenzyme was enhanced in the presence of linoleic acid(Figure 3D). Linoleic acid-induced cleavage of caspase-3 intoactive subunits was prevented in the presence of UCP2.
Effects of UCP2 iRNA on Apoptosis andCaspase ActivationUCP2 iRNA could effectively reduce the endogenous level ofUCP2 mRNA at doses higher than 10 pmol/L compared withcontrol iRNA (Figure 4A). The UCP2 iRNA activatedcaspase 3 to a significant extent, whereas the control iRNAdid not (Figure 4B). UCP2 iRNA exaggerated LPC or linoleicacid-induced apoptosis compared with control cells (Figure4C). UCP1 and UCP3 iRNA did not affect apoptosis incontrol and UCP2 overexpressed cells (data not shown),indicating that the effect of UCP2 is specific. These datademonstrate that endogenous UCP2 expression is importantfor preventing apoptosis in HAECs.
Figure 4. Effect of UCP2 iRNA transfectionon caspase activation and apoptosis.HAECs were transfected with UCP2 or con-trol iRNA. Two days after transfection,UCP2 mRNA expression was examined byRT-PCR (A). Transfected cells were main-tained in media containing 0.5% FBS for 12hours, and 2 �g/mL LPC for 8 hours or200 �mol/L linoleic acid for 16 hours. Fol-lowing treatment, caspase-3 activation andapoptosis were analyzed by measuringactivities using a caspase fluorescenceassay kit (B) and the cell death ELISA assaykit that measures the levels of cytosolichistone-bound DNA fragments (C). The val-ues are presented as means�SEM of 4independent experiments. *P�0.01 versusControl iRNA, **P�0.01 versus LPC or lino-leic acid�Control iRNA.
Figure 5. Effects of adenoviral overexpression of UCP2 on LPC- andlinoleic acid-induced change in ��m and [Ca2�]m. UCP2 overexpres-sion attenuated the 4 �g/mL LPC (A)- and 300 �mol/L linoleic acid(B)-induced change in TMRE fluorescence. Vertical axis wasexpressed as the arbitrary units of TMRE fluorescence. UCP2 overex-pression attenuated the 4 �g/mL LPC (C)- and 300 �mol/L linoleicacid (D)-induced increase in Rhod-2 fluorescence. Pretreatment with100 �mol/L ruthenium red inhibits the 4 �g/mL LPC (E)- and300 �mol/L linoleic acid (F)-induced increase in Rhod-2 fluorescence.Vertical axis was expressed as the ratio of the baseline value. F is themeasured Rhod-2 fluorescence and Fo is that at the beginning of theexperiment.
4 Circulation Research June 10, 2005
by guest on June 17, 2018http://circres.ahajournals.org/
Dow
nloaded from

Effects of UCP2 Overexpression on the LPC-and Linoleic Acid-Induced Changes in ��m
and [Ca2�]mIn the Ad-UCP2-infected HAECs, the intensity of TMREfluorescence at baseline was lower than that in the Ad-�-gal-infected HAECs (Figure 5A and B), indicating that themitochondria are partially depolarized. LPC and linoleic acidcaused transient hyperpolarization, which was followed by agradual decrease in ��m. In the Ad-UCP2-infected HAECs,LPC and linoleic acid did not cause these changes (Figure 5A,B, and online data supplement Figure VIA).
Mitochondrial Ca2� uptake, particularly in association withoxidative stress, was shown to trigger cell death.27 A reduc-tion of ��m was shown to limit intramitochondrial Ca2�
accumulation.27 LPC and linoleic acid increased, and UCP2overexpression prevented Ca2� accumulation (Figure 5C andD, and online data supplement Figure VIB and C). Pretreat-ment with ruthenium red, the mitochondrial Ca2� uniporterblocker, blocked the LPC- and linoleic acid-induced increasein [Ca2�]m (Figure 5E and F). These data show that thecytoprotective effect of UCP2 overexpression is related to theinhibition of mitochondrial Ca2� overload.
Effects of UCP2 Overexpression on the Activity ofMitochondrial Respiratory ChainLinoleic acid and LPC significantly decreased state 3 respi-ration (increased ADP/O ratio; less oxygen consumed peramount of ADP converted to ATP) and state 4 respiration, asmeasured by O2 consumption rate in the presence of oligo-mycin to inhibit ATP synthase (Figure 6B and C). Adenoviral
overexpression of UCP2 significantly increased both state 3and state 4 respiration (Figure 6B and C).
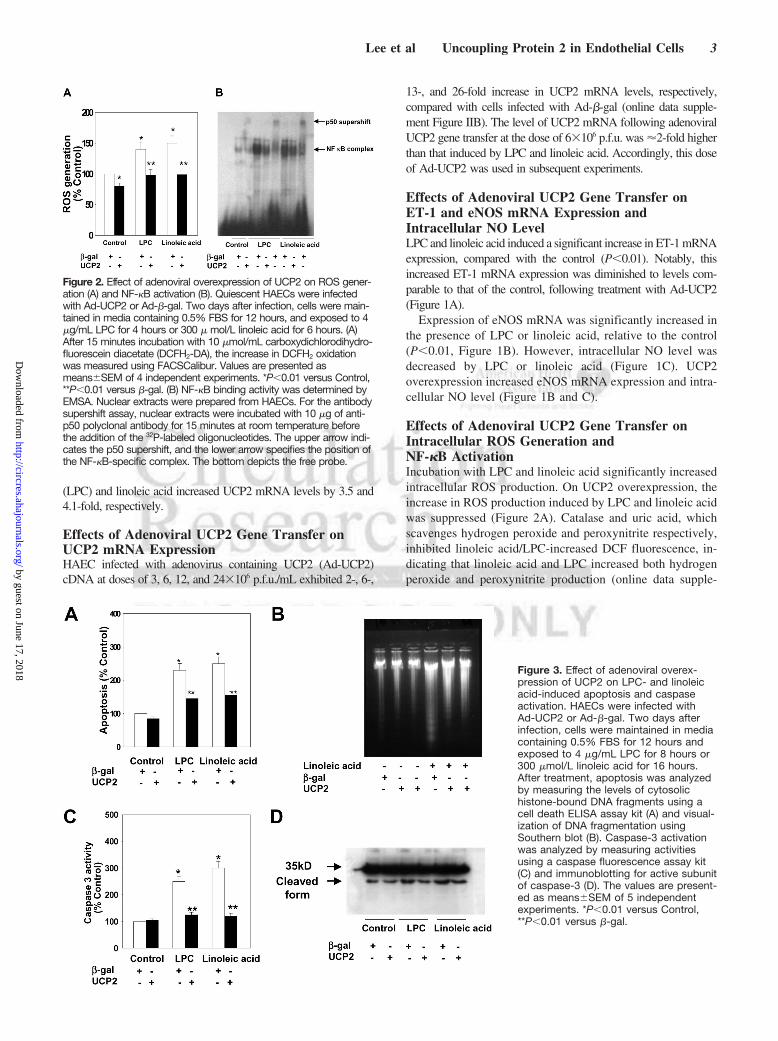
Inhibition of the Opening of PT Pores in UCP2Overexpressed CellsThe fluorescence because of calcein in isolated mitochondriafrom LPC or linoleic acid-treated cells was significantlylower than that of control cells (Figure 7A), indicating anopening of PT pores (PTP). In contrast, UCP2 overexpressioninhibited the opening of PTP (Figure 7A). In addition,treatment with linoleic acid resulted in the liberation ofcytochorome c from mitochondria to cytosol (Figure 7B). Theliberation of cytochrome c by linoleic acid was blocked incells overexpressing UCP2 (Figure 7B).
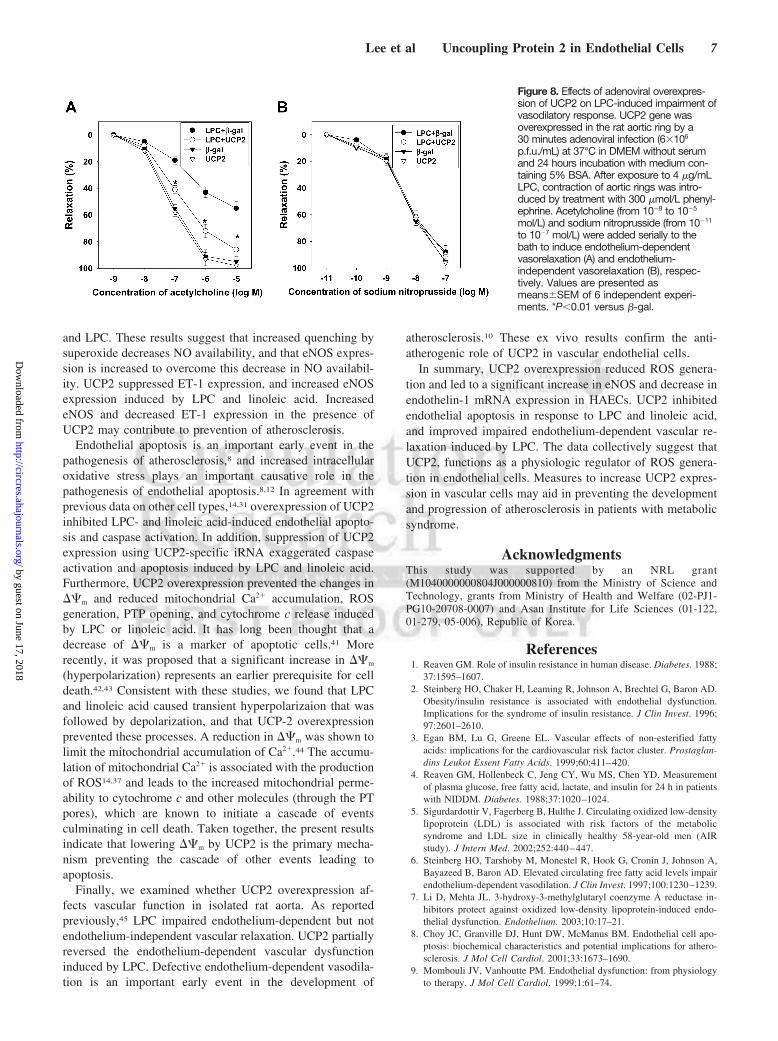
Effects of Adenoviral UCP2 Gene Transfer onLPC-Induced Vascular DysfunctionTo determine whether UCP2 overexpression in aortic tissueimproves vascular function, we infected the aortic ring withAd-UCP2 ex vivo, and measured endothelium-dependent andindependent vasorelaxation. Immunohistochemical stainingfor UCP2 protein in Ad-UCP2-treated vessel preparationsshowed that UCP2 protein was found mainly in endotheliumand adventitia in Ad-UCP2-treated aortas (online data sup-plement Figure VII).
Endothelium-dependent (acetylcholine-induced) and inde-pendent (nitroprusside-induced) relaxation was not affectedby Ad-UCP2 alone (Figure 8A and B). LPC significantlydecreased endothelium-dependent relaxation of the aorticring infected with Ad-�-gal (Figure 8A), but did not affect
Figure 6. Effects of adenoviral overex-pression of UCP2 on mitochondrialoxygen consumption. A, Representativerecording of oxygen consumption bymitochondria isolated from HAECs.Mitochondria isolated from Ad-UCP2 orAd-�-gal infected HAECs treated withLPC or linoleic acid were suspended at60% (vol/vol) in incubat ion buffer.Additions of succinate, ADP, and car-bonyl cyanide p-[trifluoromethoxy]-phenyl-hydrazone (FCCP) were asshown. The ADP/O ratio (B) is calcu-lated from the amount of oxygen con-sumed during ADP consumption andthe known amount of ADP added.State 4 respiration (C) was measured inthe presence of oligomycin (2 �mol/L)to inhibit ATP synthase. The values arepresented as means�SEM of 4 inde-pendent experiments. *P�0.01 versusControl, **P�0.01 versus �-gal.
Lee et al Uncoupling Protein 2 in Endothelial Cells 5
by guest on June 17, 2018http://circres.ahajournals.org/
Dow
nloaded from
endothelium-independent relaxation. Ad-UCP2 infection sig-nificantly improved impaired endothelium-dependent relax-ation induced by LPC.
DiscussionIn this study, we have shown that UCP2 is expressed inHAECs, and upregulated by LPC and linoleic acid.Adenovirus-mediated transfer of the UCP2 gene into HAECsprofoundly suppressed ROS generation, NF-�B activation,and mRNA expression of ET-1, and enhanced eNOS tran-scription. UCP2 additionally inhibited caspase activation andendothelial apoptosis in response to LPC and linoleic acid.LPC and linoleic acid caused mitochondrial calcium accumu-lation, transient mitochondrial membrane hyperpolarization(followed by depolarization), decreased oxygen consumption,and cytochrome c release. UCP2 overexpression prevented allthese processes and improved impaired endothelium-dependent vascular relaxation induced by LPC. Suppression
of endogenous expression of UCP2 exaggerated linoleic acid-and LPC-induced caspase activation and apoptosis.
UCPs are located in the mitochondrial inner membrane,and partially dissipate the ��m. Previous studies have shownthat UCP2 is beneficial to cells and organisms, because itreduces ROS formation.15,28–30 For example, UCP2 preventsthe apoptosis of cardiomyocytes and neuronal cells by de-creasing ROS.15,31,32 The mitochondrial respiratory chaingenerate ROS when the electrochemical gradient across themitochondrial inner membrane is high and the rate of electrontransport is limited.15 In agreement with previous studies inother cells,26 we found that adenoviral UCP2 overexpressiondecreased coupling of mitochondrial oxidation and phosphor-ylation, as evidenced by a decrease in the ADP/O ratio andincreased state 4 respiration. These results suggest that UCP2decreases ROS generation by reducing ��m and increasingthe rate of electron transport.
Linoleic acid and LPC stimulate ROS generation in cellsand activate the redox-sensitive transcription factors, NF�Band AP-1.33,34 The promoter region of human UCP2 containsAP-1 binding sites near the transcription initiation site.35 Thisfinding strongly suggests that transcription of the UCP2 geneis induced by intracellular ROS and the consequent activationof AP-1. Consistent with this theory, recent studies demon-strated that superoxide activates UCPs in various tissues.36 Ithas been proposed that induction of UCP2 by ROS is acompensatory mechanism to counteract increased intracellu-lar oxidative stress.37 In this study, UCP2 mRNA expressionincreased 3- to 4-fold by LPC or linoleic acid. However, thisincrease in UCP2 may not be sufficient to protect againstLPC/linoleic acid-induced increases in ROS. Supporting thisidea, UCP2 overexpression at a sufficient dose (6�106 p.f.u.)almost completely suppressed the increase in ROS productioninduced by LPC and linoleic acid, whereas at a lower dose(3�106 p.f.u.), UCP2 incompletely suppressed ROS genera-tion (online data supplement Figure IX).
Endothelium acts not only as a barrier, but also as aregulator of vascular tone and smooth muscle cell growth,migration, and proliferation. Vascular tone is modulatedthrough the release of relaxing and contracting substances.Among them, NO and ET-1 are the physiologically mostimportant regulators of vascular tone. NO produced by eNOShas anti-inflammatory effects on the vascular wall, andinhibits the migration and proliferation of vascular smoothmuscle cells.11 On the other hand, ET-1 displays vasocon-strictive and cell-proliferating effects.38 In agreement withprevious studies,39,40 linoleic acid and LPC increased theexpression of both eNOS and ET-1 in HAECs. This findingprompts the question of why LPC and linoleic acid decreasevascular relaxation yet increase eNOS levels. The bioavail-ability of NO is determined by the balance between produc-tion and degradation. NO is quenched by superoxide to formperoxynitrite. In this study, both catalase and uric acid, whichscavenge hydrogen peroxide and peroxynitrite respectively,significantly inhibited linoleic acid/LPC-increased DCF fluo-rescence, indicating that linoleic acid and LPC increase bothhydrogen peroxide and peroxynitrite production. In addition,direct measurement of NO in the cells by using DAF-FMdiacetate showed that NO level is decreased by linoleic acid
Figure 7. Effects of adenoviral overexpression of UCP2 on opening ofpermeability transition (PT) pores and cytochrome c release. Mito-chondria (1 mg of protein/mL) were isolated from Ad-UCP2 or Ad-�-gal infected HAECs treated with LPC or linoleic acid. To measure therelease of calcein from PT pores (A), isolated mitochondria were sus-pended in a mitochondrion-isolation buffer. Calcein was introducedinto the mitochondrial matrix by incubation with 1 �mol/L calcein-AM.The mitochondria were then washed and fluorescence was measuredwith microplate spectrofluorometer. For analysis of the release ofcytochrome c from mitochondria into the cytosol (B), proteins in cyto-solic and mitochondrial fractions were separated by SDS/PAGE. Cyto-chrome c was detected with an enhanced chemiluminescence sys-tem with specific monoclonal antibodies. The values are presented asmeans�SEM of 5 independent experiments. *P�0.01 versus Control
6 Circulation Research June 10, 2005
by guest on June 17, 2018http://circres.ahajournals.org/
Dow
nloaded from
and LPC. These results suggest that increased quenching bysuperoxide decreases NO availability, and that eNOS expres-sion is increased to overcome this decrease in NO availabil-ity. UCP2 suppressed ET-1 expression, and increased eNOSexpression induced by LPC and linoleic acid. IncreasedeNOS and decreased ET-1 expression in the presence ofUCP2 may contribute to prevention of atherosclerosis.
Endothelial apoptosis is an important early event in thepathogenesis of atherosclerosis,8 and increased intracellularoxidative stress plays an important causative role in thepathogenesis of endothelial apoptosis.8,12 In agreement withprevious data on other cell types,14,31 overexpression of UCP2inhibited LPC- and linoleic acid-induced endothelial apopto-sis and caspase activation. In addition, suppression of UCP2expression using UCP2-specific iRNA exaggerated caspaseactivation and apoptosis induced by LPC and linoleic acid.Furthermore, UCP2 overexpression prevented the changes in��m and reduced mitochondrial Ca2� accumulation, ROSgeneration, PTP opening, and cytochrome c release inducedby LPC or linoleic acid. It has long been thought that adecrease of ��m is a marker of apoptotic cells.41 Morerecently, it was proposed that a significant increase in ��m
(hyperpolarization) represents an earlier prerequisite for celldeath.42,43 Consistent with these studies, we found that LPCand linoleic acid caused transient hyperpolarizaion that wasfollowed by depolarization, and that UCP-2 overexpressionprevented these processes. A reduction in ��m was shown tolimit the mitochondrial accumulation of Ca2�.44 The accumu-lation of mitochondrial Ca2� is associated with the productionof ROS14,37 and leads to the increased mitochondrial perme-ability to cytochrome c and other molecules (through the PTpores), which are known to initiate a cascade of eventsculminating in cell death. Taken together, the present resultsindicate that lowering ��m by UCP2 is the primary mecha-nism preventing the cascade of other events leading toapoptosis.
Finally, we examined whether UCP2 overexpression af-fects vascular function in isolated rat aorta. As reportedpreviously,45 LPC impaired endothelium-dependent but notendothelium-independent vascular relaxation. UCP2 partiallyreversed the endothelium-dependent vascular dysfunctioninduced by LPC. Defective endothelium-dependent vasodila-tion is an important early event in the development of
atherosclerosis.10 These ex vivo results confirm the anti-atherogenic role of UCP2 in vascular endothelial cells.
In summary, UCP2 overexpression reduced ROS genera-tion and led to a significant increase in eNOS and decrease inendothelin-1 mRNA expression in HAECs. UCP2 inhibitedendothelial apoptosis in response to LPC and linoleic acid,and improved impaired endothelium-dependent vascular re-laxation induced by LPC. The data collectively suggest thatUCP2, functions as a physiologic regulator of ROS genera-tion in endothelial cells. Measures to increase UCP2 expres-sion in vascular cells may aid in preventing the developmentand progression of atherosclerosis in patients with metabolicsyndrome.
AcknowledgmentsThis study was supported by an NRL grant(M1040000000804J000000810) from the Ministry of Science andTechnology, grants from Ministry of Health and Welfare (02-PJ1-PG10-20708-0007) and Asan Institute for Life Sciences (01-122,01-279, 05-006), Republic of Korea.
References1. Reaven GM. Role of insulin resistance in human disease. Diabetes. 1988;
37:1595–1607.2. Steinberg HO, Chaker H, Leaming R, Johnson A, Brechtel G, Baron AD.
Obesity/insulin resistance is associated with endothelial dysfunction.Implications for the syndrome of insulin resistance. J Clin Invest. 1996;97:2601–2610.
3. Egan BM, Lu G, Greene EL. Vascular effects of non-esterified fattyacids: implications for the cardiovascular risk factor cluster. Prostaglan-dins Leukot Essent Fatty Acids. 1999;60:411–420.
4. Reaven GM, Hollenbeck C, Jeng CY, Wu MS, Chen YD. Measurementof plasma glucose, free fatty acid, lactate, and insulin for 24 h in patientswith NIDDM. Diabetes. 1988;37:1020–1024.
5. Sigurdardottir V, Fagerberg B, Hulthe J. Circulating oxidized low-densitylipoprotein (LDL) is associated with risk factors of the metabolicsyndrome and LDL size in clinically healthy 58-year-old men (AIRstudy). J Intern Med. 2002;252:440–447.
6. Steinberg HO, Tarshoby M, Monestel R, Hook G, Cronin J, Johnson A,Bayazeed B, Baron AD. Elevated circulating free fatty acid levels impairendothelium-dependent vasodilation. J Clin Invest. 1997;100:1230–1239.
7. Li D, Mehta JL. 3-hydroxy-3-methylglutaryl coenzyme A reductase in-hibitors protect against oxidized low-density lipoprotein-induced endo-thelial dysfunction. Endothelium. 2003;10:17–21.
8. Choy JC, Granville DJ, Hunt DW, McManus BM. Endothelial cell apo-ptosis: biochemical characteristics and potential implications for athero-sclerosis. J Mol Cell Cardiol. 2001;33:1673–1690.
9. Mombouli JV, Vanhoutte PM. Endothelial dysfunction: from physiologyto therapy. J Mol Cell Cardiol. 1999;1:61–74.
Figure 8. Effects of adenoviral overexpres-sion of UCP2 on LPC-induced impairment ofvasodilatory response. UCP2 gene wasoverexpressed in the rat aortic ring by a30 minutes adenoviral infection (6�106
p.f.u./mL) at 37°C in DMEM without serumand 24 hours incubation with medium con-taining 5% BSA. After exposure to 4 �g/mLLPC, contraction of aortic rings was intro-duced by treatment with 300 �mol/L phenyl-ephrine. Acetylcholine (from 109 to 105
mol/L) and sodium nitroprusside (from 1011
to 107 mol/L) were added serially to thebath to induce endothelium-dependentvasorelaxation (A) and endothelium-independent vasorelaxation (B), respec-tively. Values are presented asmeans�SEM of 6 independent experi-ments. *P�0.01 versus �-gal.
Lee et al Uncoupling Protein 2 in Endothelial Cells 7
by guest on June 17, 2018http://circres.ahajournals.org/
Dow
nloaded from
10. Ross R. Atherosclerosis-an inflammatory disease. N Engl J Med. 1999;340:115–126.
11. Williams IL, Wheatcroft SB, Shah AM, Kearney MT. Obesity, athero-sclerosis and the vascular endothelium: mechanisms of reduced nitricoxide bioavailability in obese humans. Int J Obes Relat Metab Disord.2002;26:754–764.
12. Kunsch C, Medford RM. Oxidative stress as a regulator of geneexpression in the vasculature. Circ Res. 1999;85:753–766.
13. Boss O, Hagen T, Lowell BB. Uncoupling proteins 2 and 3: potentialregulators of mitochondrial energy metabolism. Diabetes. 2000;49:143–156.
14. Teshima Y, Akao M, Jones SP, Marban E. Uncoupling protein-2 over-expression inhibits mitochondrial death pathway in cardiomyocytes. CircRes. 2003;93:192–200.
15. Arsenijevic D, Onuma H, Pecqueur C, Raimbault S, Manning BS, MirouxB, Couplan E, Alves-Guerra MC, Goubern M, Surwit R, Bouillaud F,Richard D, Collins S, Ricquier D. Disruption of the uncoupling protein-2gene in mice reveals a role in immunity and reactive oxygen speciesproduction. Nat Genet. 2000;26:435–439.
16. Blanc J, Alves-Guerra MC, Esposito B, Rousset S, Gourdy P, Ricquier D,Tedgui A, Miroux B, Mallat Z. Protective role of uncoupling protein 2 inatherosclerosis. Circulation. 2003;107:388–390.
17. Becker TC, BeltrandelRio H, Noel RJ, Johnson JH, Newgard CB. Over-expression of hexokinase I in isolated islet of Langerhans via recombinantadenovirus. Enhancement of glucose metabolism and insulin secretion atbasal but not stimulatory glucose levels. J Biol Chem. 1994;269:21234–21238.
18. Zanetti M, Sato J, Jost CJ, Gloviczki P, Katusic ZS, O’Brien T. Genetransfer of manganese superoxide dismutase reverses vascular dys-function in the absence but not in the presence of atherosclerotic plaque.Hum Gene Ther. 2001;12:1407–1416.
19. Park JY, Takahara N, Gabriele A, Chou E, Naruse K, Suzuma K,Yamauchi T, Ha SW, Meier M, Rhodes CJ, King GL. Induction ofendothelin-1 expression by glucose: an effect of protein kinase C acti-vation. Diabetes. 2000;49:1239–1248.
20. Shao C, Stewart V, Melvyn Folkard M, Michael BD, Prise KM. NitricOxide-Mediated Signaling in the Bystander Response of IndividuallyTargeted Glioma Cells. Cancer Res. 2003;63:8437–8442.
21. van Reyk DM, King NJ, Dinauer MC, Hunt NH. The intracellular oxi-dation of 2�,7�-dichlorofluorescin in murine T lymphocytes. Free RadicBiol Med. 2001;30:82–88.
22. Bass DA, Parce JW, Dechatelet LR, Szejda P, Seeds MC, Thomas M.Flow cytometric studies of oxidative product formation by neutrophils: agraded response to membrane stimulation. J Immunol. 1983;130:1910–1917.
23. Ahn JD, Morishita R, Kaneda Y, Lee KU, Park JY, Jeon YJ, Song HS,Lee IK. Transcription factor decoy for activator protein-1 (AP-1) inhibitshigh glucose- and angiotensin II-induced type 1 plasminogen activatorinhibitor (PAI-1) gene expression in cultured human vascular smoothmuscle cells. Diabetologia. 2001;44:713–720.
24. Trollinger DR, Cascio WE, Lemasters JJ. Mitochondrial calcium tran-sients in adult rabbit cardiac myocytes: inhibition by ruthenium red andartifacts caused by lysosomal loading of Ca2�-indicating fluorophores.Biophys J. 2000;79:39–50.
25. Imai H, Koumura T, Nakajima R, Nomura K, Nakagawa Y. Protectionfrom inactivation of the adenine nucleotide translocator duringhypoglycaemia-induced apoptosis by mitochondrial phospholipidhydroperoxide glutathione peroxidase. Biochem J. 2003;371:799–809.
26. Hong Y, Fink BD, Dillon JS, Sivitz WI. Effects of adenoviral overex-pression of UCP-2 and -3 on mitochondrial respiration in insulinomacells. Endocrinology. 2001;142:249–256.
27. Duchen MR. Mitochondria and calcium: from cell signaling to cell death.J of Physiol. 2000;529:57–68.
28. Skulachev VP. Uncoupling: new approaches to an old problem of bioen-ergetics. Biochim Biophys Acta. 1998;1363:100–124.
29. Lee F-YJ, Li Y, Yang EK, Yang SQ, Lin HZ, Trush MA, Dannenberg AJ,Diehl AM. Phenotypic abnormalities in macrophages from leptin-deficient, obese mice. Am J Physiol. 1999;276:C386–C394.
30. Li LX, Skorpen F, Egenberg K, Jorgensen IH, Grill V. Uncouplingprotein 2 participates in cellular defence against oxidative stress in clonalbeta-cells. Biochem Biophys Res Commun. 2001;282:273–277.
31. Mattiasson G, Shamloo M, Gido G, Mathi K, Tomasevic G, Yi S, WardenCH, Castilho RF, Melcher T, Gonzalez-Zulueta M, Nikolich K, WielochT. Uncoupling protein-2 prevents neuronal death and diminishes braindysfunction after stroke and brain trauma. Nat Med. 2003;9:1062–1068.
32. Vincent AM, Olzmann JA, Brownlee M, Sivitz WI, Russell JW.Uncoupling proteins prevent glucose-induced neuronal oxidative stressand programmed cell death. Diabetes. 2004;53:726–734.
33. Masamune A, Sakai Y, Yoshida M, Satoh A, Satoh K, Shimosegawa T.Lysophosphatidylcholine activates transcription factor NF-kappaB andAP-1 in AR42J cells. Dig Dis Sci. 2001;46:1871–1881.
34. Park JY, Kim YM, Song HS, Park KY, Kim YM, Kim MS, Pak YK, LeeIK, Lee JD, Park SJ, Lee KU. Oleic acid induces endothelin-1 expressionthrough activation of protein kinase C and NF-kappa B. Biochem BiophysRes Commun. 2003;303:891–895.
35. Tu N, Chen H, Winnikes U, Reinert I, Marmann G, Pirke KM, LentesKU. Molecular cloning and functional characterization of the promoterregion of the human uncoupling protein-2 gene. Biochem Biophys ResCommun. 1999;265:326–334.
36. Echtay KS, Roussel D, St-Pierre J, Jekabsons MB, Cadenas S, Stuart JA,Harper JA, Roebuck SJ, Morrison A, Pickering S, Clapham JC, BrandMD. Superoxide activates mitochondrial uncoupling proteins. Nature.2002;415:96–99.
37. Paradis E, Clavel S, Bouillaud F, Ricquier D, Richard D. Uncouplingprotein 2: a novel player in neuroprotection. Trends Mol Med. 2003;9:522–525.
38. Schiffrin EL. Role of Endothelin-1 in Hypertension and VascularDisease. Am J Hypertens. 2001;14:83S–89S.
39. Ramasamy S, Parthasarathy S, Harrison DG. Regulation of endothelialnitric oxide synthase gene expression by oxidized linoleic acid. J LipidRes. 1998;39:268–276.
40. Hirata K, Miki N, Kuroda Y, Sakoda T, Kawashima S, Yokoyama M.Low concentration of oxidized low-density lipoprotein and lysophos-phatidylcholine upregulate constitutive nitric oxide synthase mRNAexpression in bovine aortic endothelial cells. Circ Res. 1995;76:958–962.
41. Zamzami N, Marchetti P, Castedo M, Zanin C, Vayssiere JL, Petit PX,Kroemer G. Reduction in mitochondrial potential constitutes an earlyirreversible step of programmed lymphocyte death in vivo. J Exp Med.1995;181:1661–1672.
42. Russell JW, Golovoy D, Vincent AM, Mahendru P, Olzmann JA,Mentzer A, Feldman EL. High glucose-induced oxidative stress andmitochondrial dysfunction in neurons. FASEB J. 2002;16:1738–1748.
43. Matarrese P, Gambardella L, Cassone A, Vella S, Cauda R, Malorni W.Mitochondrial membrane hyperpolarization hijacks activated T lym-phocytes toward the apoptotic-prone phenotype: homeostatic mechanismsof HIV protease inhibitors. J Immunol. 2003;170:6006–6015.
44. Krieger C, Duchen MR. Mitochondria, Ca2� and neurodegenerativedisease. Eur J Pharmacol. 2002;447:177–188.
45. Murohara T, Kugiyama K, Ohgushi M, Sugiyama S, Ohta Y, Yasue H.LPC in oxidized LDL elicits vasocontraction and inhibits endothelium-dependent relaxation. Am J Physiol. 1994;267:H2441–H2449.
8 Circulation Research June 10, 2005
by guest on June 17, 2018http://circres.ahajournals.org/
Dow
nloaded from
Joong-Yeol ParkWoo Je Lee, Eun Hee Koh, Kee-Ho Song, Sung Min Han, Min Seon Kim, In-Sun Park and
Ki-Up Lee, In Kyu Lee, Jin Han, Dae-Kyu Song, Yun Mi Kim, Hai Sun Song, Hyoun Sik Kim,Endothelial Function and Apoptosis
Effects of Recombinant Adenovirus-Mediated Uncoupling Protein 2 Overexpression on
Print ISSN: 0009-7330. Online ISSN: 1524-4571 Copyright © 2005 American Heart Association, Inc. All rights reserved.is published by the American Heart Association, 7272 Greenville Avenue, Dallas, TX 75231Circulation Research
published online May 19, 2005;Circ Res.
http://circres.ahajournals.org/content/early/2005/05/19/01.RES.0000170075.73039.5b.citationWorld Wide Web at:
The online version of this article, along with updated information and services, is located on the
http://circres.ahajournals.org/content/suppl/2005/06/10/01.RES.0000170075.73039.5b.DC1 http://circres.ahajournals.org/content/suppl/2005/05/19/01.RES.0000170075.73039.5bv1.DC1
Data Supplement (unedited) at:
http://circres.ahajournals.org//subscriptions/
is online at: Circulation Research Information about subscribing to Subscriptions:
http://www.lww.com/reprints Information about reprints can be found online at: Reprints:
document. Permissions and Rights Question and Answer about this process is available in the
located, click Request Permissions in the middle column of the Web page under Services. Further informationEditorial Office. Once the online version of the published article for which permission is being requested is
can be obtained via RightsLink, a service of the Copyright Clearance Center, not theCirculation Researchin Requests for permissions to reproduce figures, tables, or portions of articles originally publishedPermissions:
by guest on June 17, 2018http://circres.ahajournals.org/
Dow
nloaded from

Expanded Materials and Methods
Linoleic acid and lysophosphatidylcholine supplementation of culture media
Stock solution of linoleic acid (Sigma, St. Louis, Missouri) and lysophosphatidylcholine (LPC,
Sigma) were prepared by dissolving linoleic acid in 0.1 N NaOH solution in a bath of boiling
water and LPC in distilled water. Appropriate volumes of freshly prepared linoleic acid stock
solution were slowly added to medium containing fatty acid-free bovine serum albumin (100
µmol/L) during continuous agitation.
Preparation of recombinant adenovirus
Full-length human UCP2 cDNA was cloned into the HindIII/BamHI site of the pAd-YC2 shuttle
vector. The pAd-YC2 shuttle vector (5 µg) and pJM17 rescue vector (5 µg) were co-transfected
into human embryonic kidney 293 (HEK-293) cells cultured in 24-well plates the day before
transfection. After 12-15 days, recombinants were identified by polymerase chain reaction. Next,
recombinants were amplified in HEK-293 cells, purified and isolated using CsCl2 (Sigma).
Preparations were collected and desalted, and titers determined by the measurement of plaque
counts. Control adenovirus containing β-galactosidase (Ad-β-gal) cDNA was generated and
identified as described above.
1

UCP2 iRNA transfection
Target sequences were aligned to the human genome database in a BLAST search to ensure that
the chosen sequences were not highly homologous with those of other genes. Cells were planted
in six-well plates and cultured in drug-free medium. At 90–95% confluence, cells were washed
twice with PBS and grown in 2 ml EBM without antibiotics. Using Lipofectamine 2000 reagent
(Invitrogen), indicated concentration of UCP2 iRNA oligo was transfected into HAECs
according to the manufacturer’s instructions. The cells transfected with control iRNA served as
negative control. Forty-eight hours later, the expression levels of UCP2 were evaluated by RT-
PCR. The cells transfected with iRNA were used for experiments 48 h after the transfection.
Measurement of NO level
Cells were washed twice with serum-free medium containing 10 mM HEPES and then treated
with 3.5 µM DAF-FM diacetate for 45 min at 37°C. After the excess probe was removed, cells
were incubated for an additional 20 min to allow complete de-esterification of the intracellular
diacetates. Fluorescence was measured at 515 nm with microplate spectrofluorometer
(SPECTRAmax GEM-INI-XS; Molecular Devices, Sunnyvale, California) with excitation at
495 nm.
2

Analysis of apoptosis
ELISA assay. Cells were plated in 96-well plates at a density of 2×10⁴ cells/well in MEM
supplemented with 0.5% FBS, and assayed in triplicate. Apoptosis was quantified by measuring
the levels of cytosolic histone-bound DNA fragments, using a cell death ELISA assay kit
(Boehringer Mannheim, Indianapolis, Indiana).1 Mean values calculated from three separate
experiments were used for analysis.
DNA laddering. For the detection of DNA fragmentation, DNA laddering analysis was
performed, as described previously.2
FACScan. For quantification of cellular viability, cells were double-stained with annexin V and
propidium iodide (PI) according to the manufacturer’s instructions (ANNEXIN V-FITC
APOPTOSIS DETECTION KITⅠ (BD Biosciences). The proportion of apoptotic and necrotic
cells was determined by FACSCalibur (Becton Dickinson, San Jose, California). Annexin-V is a
marker of apoptosis and propidium iodide reflects the integrity of the cell membrane, thereby
serving as a marker of necrosis.
Caspase assay. Activities of specific caspases (caspase-3, caspase-8, and caspase-9) were
measured using an ApoAlert caspase fluorescence assay kit (Clontech, Palo Alto, California)
following the manufacturer's instructions. Western blot analysis of caspase-3 was performed
according to a previous report,3 using anti-rabbit polyclonal antibodies against caspase-3 (Cell
3

Signaling Technology, Beverly, Massachusetts).
Assessment of the opening of mitochondrial permeability transition (PT) pores and release
of cytochrome c
Mitochondria (1 mg of protein/ml) isolated from cultured cells were suspended in 200 mM
mannitol, 70 mM sucrose, 10 mM HEPES pH 7.4, 1 mM EGTA, and 0.1% BSA. To measure
the release of calcein from PT pores, we suspended isolated mitochondria at 0.5 mg of
protein/ml in a mitochondrion-isolation buffer. Calcein was introduced into the mitochondrial
matrix by incubation with 1 µM calcein-AM, which is capable of permeating mitochondrial
membranes. The mitochondria were then washed and fluorescence was measured at 517 nm
with microplate spectrofluorometer (SPECTRAmax GEM-INI-XS; Molecular Devices) with
excitation at 494 nm. For analysis of the release of cytochrome c from mitochondria into the
cytosol, proteins in cytosol and mitochondrial fractions were separated by SDS/PAGE. Bands of
proteins were transferred on to a PVDF membrane (Millipore, Bedford, Massachusetts).
Cytochrome c were detected with an enhanced chemiluminescence Western-blotting analysis
system (Amersham, Buckinghamshire, U.K.) with monoclonal antibodies specific for
cytochrome c (Clontech, Palo Alto, California).
4
Confocal fluorescence imaging of mitochondrial Ca2+ concentration ([Ca2+]m) and
membrane potential (∆Ψm)
Images of Rhod-2 AM and thetramethylrhodamine ethyl ester (TMRE) were collected at 27°C
with a Zeiss 510 META laser scanning confocal microscope (Carl Zeiss, Jena, Germany). To
measure the changes in [Ca2+]m, HAECs were loaded with Rhod-2 AM (Molecular Probes, 10
µmol/L) for 120 minutes at 4°C and then incubated for 30 minutes at 37°C in the culture
medium. Although a small portion of the Rhod-2 AM remained within the cytosolic and nuclear
compartment, this cold/warm loading protocol is widely used to introduce Rhod-2 AM into
mitochondria.
The ∆Ψm was monitored with a ∆Ψm indicator, TMRE (Molecular Probes, 200 nmol/L). HAECs
were incubated with TMRE for 30 minutes at 37°C in the culture medium. After dye loading,
HAECs were washed with the culture medium. Throughout the experiments, 200 nmol/L TMRE
was incubated in the perfusion solution. Rhod-2 and TMRE were excited, respectively, with the
514- and 568-nm lines of an argon-krypton laser. Rhod-2 and TMRE fluorescence were directed
to separate photomultipliers by a 560-nm long-pass dichronic reflector through 590-nm long-
pass and 550-nm (35-nm bandpass) barrier filters, respectively. To confirm that Rhod-2 and
TMRE fluorescence did indeed originate from mitochondria, we verified that the mitochondrial
distribution of fluorescence was identical to that observed by loading HAECs with the
5
mitochondrial dye rhodamine-123 or MitoTracker Green (Molecular Probes), molecules that
covalently bind to the inner mitochondrial membrane and fluoresce independently of [Ca2+]m
and ∆Ψm. HAECs loaded with Rhod-2 and TMRE were perfused with a normal Tyrode solution
containing 143 mM NaCl, 5.4 mM KCl, 1.8 mM CaCl2, 0.5 mM MgCl2, 5.5 mM glucose, and
HEPES 5 (pH 7.4).
Measurement of activity of mitochondrial respiratory chain
Mitochondrial respiration was measured using a 782 Oxygen Meter (Strathkelvin Instruments
Ltd., Glasgow, UK) at 37o C in respiratory medium (220 mM mannitol, 70 mM sucrose, 2.5 mM
KH2PO4, 2 mM MgCl2, 1 mM EDTA, and 2 mM HEPES, pH 7.4) with 0.1% fatty acid-free
BSA. Isolated mitochondria (0.5 mg protein/ml) were incubated in the respiratory medium, and
oxygen consumption was quantified. To determine state 3 respiration, oxygen consumption was
recorded with sequential additions of 5 mM succinate, 0.2 mM ADP, and finally 0.2 µM
carbonyl cyanide p-[trifluoromethoxy]-phenyl-hydrazone to induce maximal chemical
uncoupling. To determine state 4 respiration, 2 µM oligomycin was added to inhibit ATP
synthase before the above sequential additions.
6

Vascular function study
The thoracic aorta was excised from nine week-old male Sprague-Dawley rats, and cleaned of
fat and adhering tissue. The vessel was cut into several individual ring segments 2-3 mm in
width, and suspended from a force-displacement transducer in a tissue bath. Ring segments were
washed in Krebs-Henseleit buffer (118 mM NaCl, 4.6 mM KCl, 27.2 mM NaHCO3, 1.2 mM
KH2PO4, 1.2 mM MgSO4, 1.75 mM CaCl2, 0.03 mM Na2EDTA, and 11.1 mM glucose)
maintained at 37° C and aerated with 95% O2-5% CO2. A passive load of 2g was applied to the
ring segment and maintained throughout the experiment. The tension was measured with an
isometric force displacement transducer (Hugo Sachs Elektronik KG D-7806, Freiburg,
Germany) and recorded using a polygraph (Graphtec Linerecorder mark 8 WR3500, Irvine,
California). After exposure to 4 µg/ml lysophosphatidylcholine (LPC, Sigma), sub-maximal
contraction of the aortic ring was induced by treatment with 300 µmol/L phenylephrine
(Research Biochemicals International, Natick, Massachusetts). When vascular tension reached a
plateau, acetylcholine (from 10-9 to 10-5 mol/L) was added serially to the bath to induce
endothelium-dependent vasorelaxation. In a separate set of experiments, endothelium-
independent vasorelaxation was determined by the serial addition of sodium nitroprusside (from
10-11 to 10-7 mol/L). Vascular relaxation data were calculated as the percentage of the maximal
vasorelaxation, and the dose-response profile for each experiment was analyzed.
7
References
1. Yu K, Kennedy CA, O'Neill MM, Barton RW, Tatake RJ. Disparate cleavage of poly-
(ADP-ribose)-polymerase (PARP) and a synthetic tetrapeptide, DEVD, by apoptotic
cells. Apoptosis. 2001;6: 151-160.
2. Kaneta S, Satoh K, Kano S, Kanda M, Ichihara K. All hydrophobic HMG-CoA
reductase inhibitors induce apoptotic death in rat pulmonary vein endothelial cells.
Atherosclerosis. 2003;170:237-243.
3. Kim GS, Hong JS, Kim SW, Koh JM, An CS, Choi JY, Cheng SL. Leptin induces
apoptosis via ERK/cPLA2/cytochrome c pathway in human bone marrow stromal cells.
J Biol Chem. 2003;278:21920-21929.
8

Online Figure 1. Subcellular localization of UCP2 protein expression in cells overexpressing
UCP2. Adenovirus-mediated gene transfer (6 x 10⁶ p.f.u./ml) to confluent HAECs was
performed by 1 h infection at 37°C in DMEM without serum. After 48 hours, Western blots
were performed on cytosolic and mitochondrial preparations using antibody against human
UCP2 (Alpha Diagnostics International, San Antonio, Texas) and subunit IV of cytochrome
oxidase (Clontech, Palo Alto, California), a standard mitochondrial marker. UCP2 was
overexpressed mainly within mitochondria. Cyt, cytosol; mt, mitochondria.
9

Online Figure 2. (A) Expression of UCP2 mRNA in HAEC. HAECs were maintained in media
containing 0.5% FBS for 12 h, and exposed to 4 µg/ml LPC for 4 h or 300 µM linoleic acid for
6 h. Cell were lysed, and total RNA was extracted. Total RNA (10 µg) was hybridized to the
human UCP2 probe. Values are presented as means ± SEM of four independent experiments. *
P<0.05 vs. Control.
(B) Dose-response effect of adenoviral overexpression of the human UCP2 gene on UCP2
mRNA expression in HAECs. HAECs were infected with Ad-UCP2 or Ad-β-gal. Two days after
infection, HAECs were maintained in media containing 0.5% FBS for 12 h and lysed. Total
RNA was extracted from HAECs. Total RNA (10 µg) was hybridized with human UCP2 probe.
The RNA quantity was normalized using GAPDH.
10
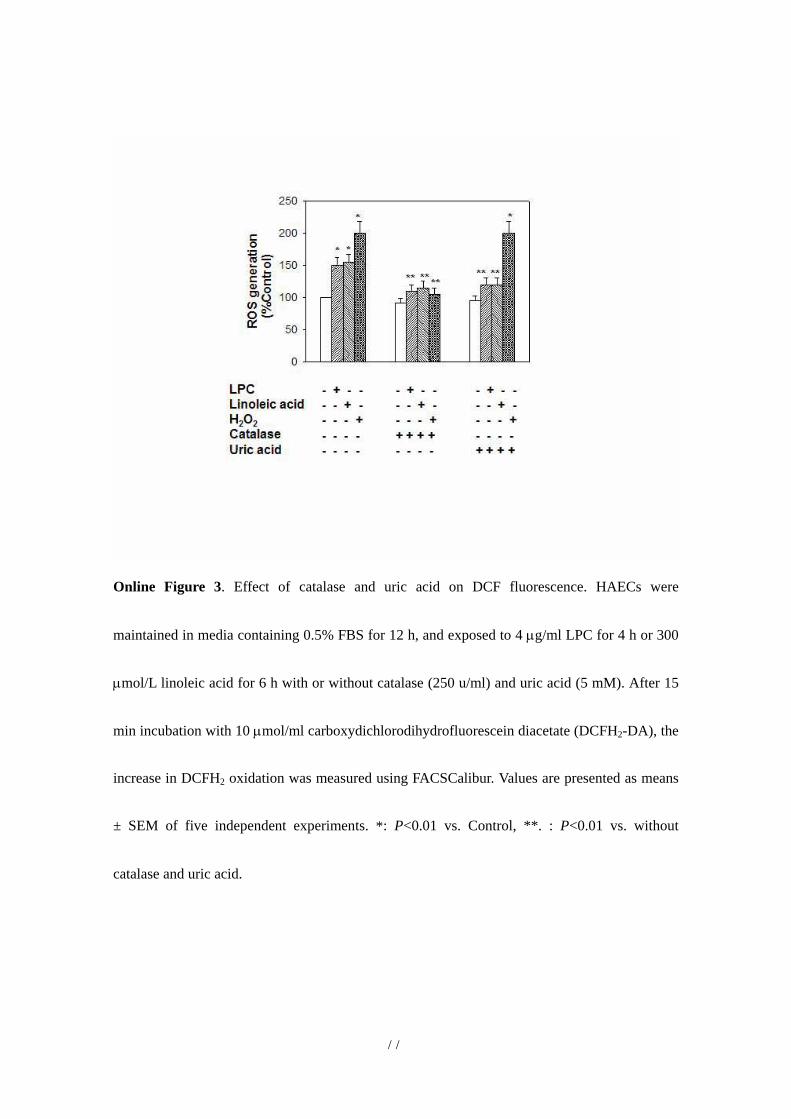
Online Figure 3. Effect of catalase and uric acid on DCF fluorescence. HAECs were
maintained in media containing 0.5% FBS for 12 h, and exposed to 4 µg/ml LPC for 4 h or 300
µmol/L linoleic acid for 6 h with or without catalase (250 u/ml) and uric acid (5 mM). After 15
min incubation with 10 µmol/ml carboxydichlorodihydrofluorescein diacetate (DCFH2-DA), the
increase in DCFH2 oxidation was measured using FACSCalibur. Values are presented as means
± SEM of five independent experiments. *: P<0.01 vs. Control, **. : P<0.01 vs. without
catalase and uric acid.
11

Online Figure 4. Effect of UCP2 overexpression on apoptosis and necrosis. (A) Representative
figures. Ad-UCP2 or Ad-β-gal infected HAECs treated with LPC or linoleic acid were double-
stained with annexin V and propidium iodide (PI) using ANNEXIN V-FITC APOPTOSIS
DETECTION KIT I. The proportion of apoptotic and necrotic cells was determined by
FACSCalibur (Becton Dickinson, San Jose, California). (B) The effect of UCP overexpression
on LPC- or linoleic acid-induced apoptosis and necrosis. Apoptotic and necrotic cells were
identified by staining with annexin V (early apoptosis) or annexin V/PI (late apoptosis) and PI,
respectively. Values are presented as means ± SEM of four independent experiments. *: P<0.01
vs. Control, **: P < 0.01 vs. β-gal.
12
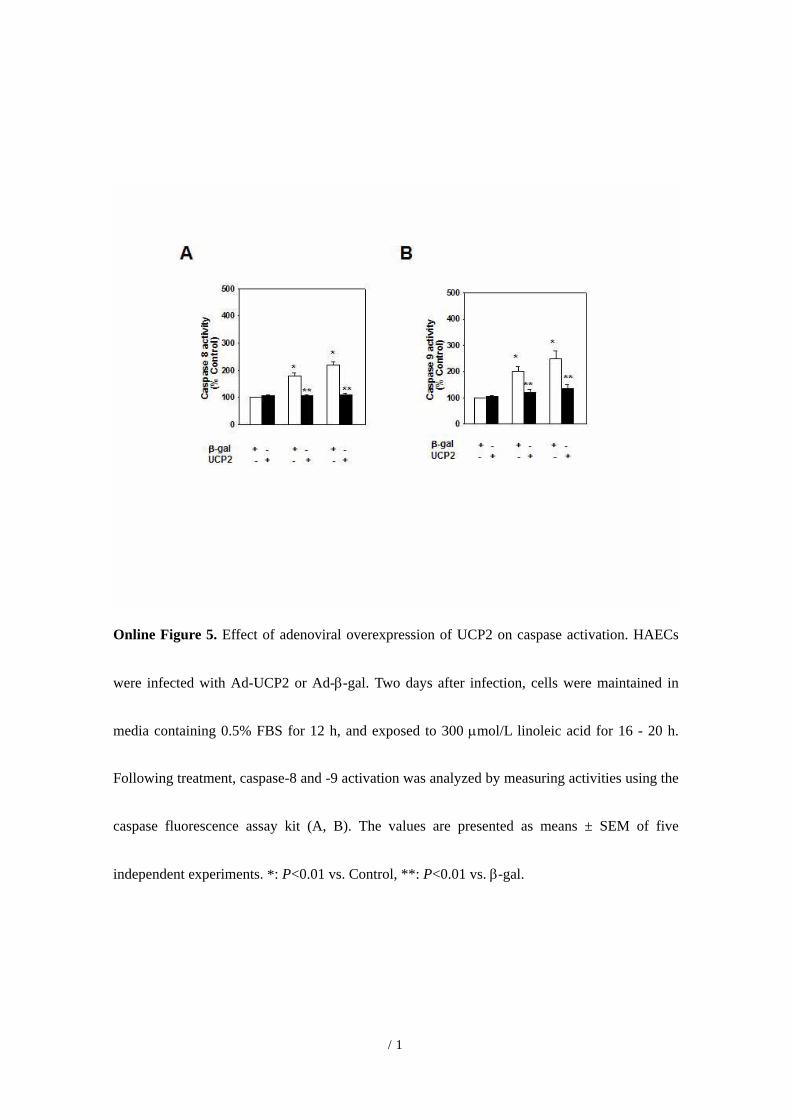
Online Figure 5. Effect of adenoviral overexpression of UCP2 on caspase activation. HAECs
were infected with Ad-UCP2 or Ad-β-gal. Two days after infection, cells were maintained in
media containing 0.5% FBS for 12 h, and exposed to 300 µmol/L linoleic acid for 16 - 20 h.
Following treatment, caspase-8 and -9 activation was analyzed by measuring activities using the
caspase fluorescence assay kit (A, B). The values are presented as means ± SEM of five
independent experiments. *: P<0.01 vs. Control, **: P<0.01 vs. β-gal.
13
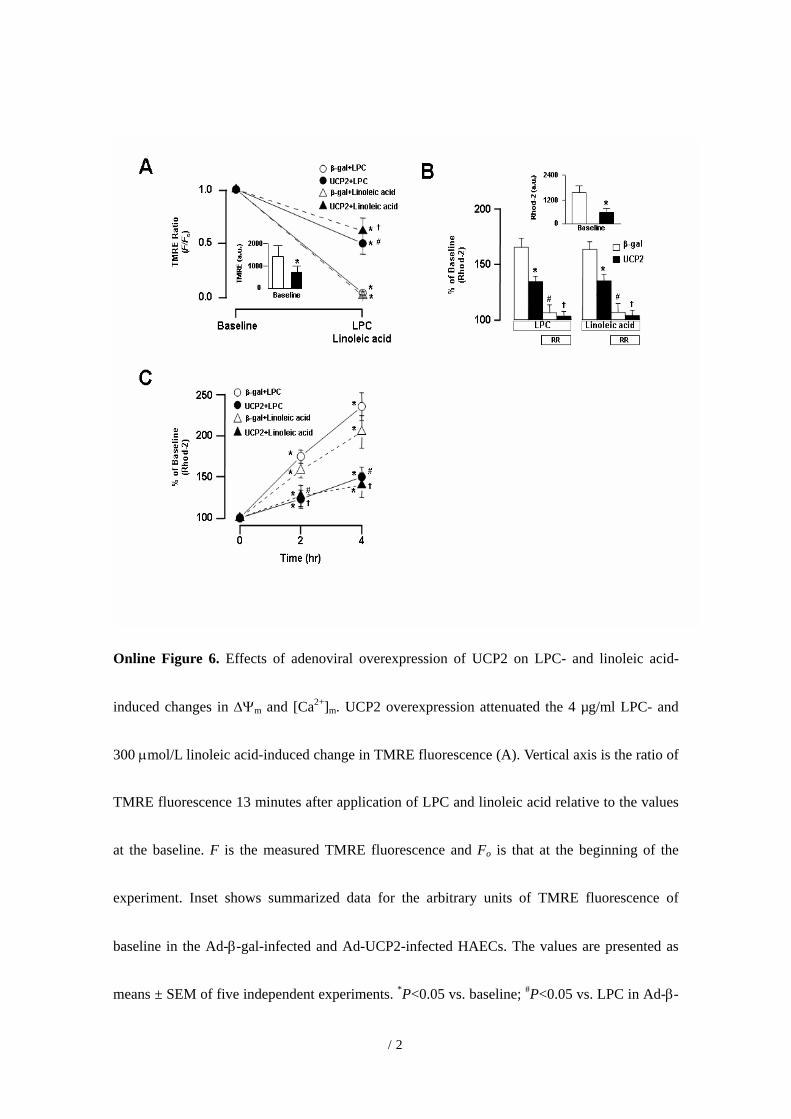
Online Figure 6. Effects of adenoviral overexpression of UCP2 on LPC- and linoleic acid-
induced changes in ∆Ψm and [Ca2+]m. UCP2 overexpression attenuated the 4 µg/ml LPC- and
300 µmol/L linoleic acid-induced change in TMRE fluorescence (A). Vertical axis is the ratio of
TMRE fluorescence 13 minutes after application of LPC and linoleic acid relative to the values
at the baseline. F is the measured TMRE fluorescence and Fo is that at the beginning of the
experiment. Inset shows summarized data for the arbitrary units of TMRE fluorescence of
baseline in the Ad-β-gal-infected and Ad-UCP2-infected HAECs. The values are presented as
means ± SEM of five independent experiments. *P<0.05 vs. baseline; #P<0.05 vs. LPC in Ad-β-
14

gal-infected HAECs. P<0.05 vs. linoleic acid in Ad-β-gal-infected HAECs. UCP2
overexpression attenuated the 4 µg/ml LPC- and 300 µmol/L linoleic acid-induced increase in
Rhod-2 fluorescence (B). Pretreatment with 100 µM ruthenium red inhibits the 4 µg/ml LPC-
and 300 µmol/L linoleic acid-induced increase in Rhod-2 fluorescence. Inset shows summarized
data for the arbitrary units (a.u.) of Rhod-2 fluorescence at baseline in the Ad-β-gal-infected and
Ad-UCP2-infected HAECs. *P<0.05 vs. Ad-β-gal-infected HAECs; #P<0.05 vs. ruthenium red
(-) in Ad-β-gal-infected HAECs. P<0.05 vs. ruthenium red (-) in Ad-UCP2-infected HAECs.
RR indicates ruthenium red. (C) Summarized data for the time courses of changes in Rhod-2
fluorescence. *P<0.05 vs. baseline; #P<0.05 vs. LPC in Ad-β-gal-infected HAECs. P<0.05 vs.
linoleic acid in Ad--β-gal-infected HAECs.
15

Online Figure 7. Immunohistochemical staining of UCP2 protein in aortic tissue
overexpressing UCP2. Overexpression of the UCP2 gene in the rat aortic ring was achieved by
30-min adenoviral infection (6 x 10⁶ p.f.u./ml) at 37°C in DMEM without serum and incubation
with media containing 5% BSA for 24 hours. Immunohistochemical staining for UCP2 protein
in Ad-UCP2-treated vessel preparations was performed using antibody against human UCP2
(Alpha Diagnostics International, San Antonio, Texas). UCP2 protein (arrow, brown color) was
found mainly in endothelium and adventitia in adeno-UCP2 treated aortas. En, endothelial cell;
smc, smooth muscle cell; ad, adventitia.
16

Online Figure 8. Effects of antioxidants on ET-1 (A) and eNOS (B) mRNA expression. HAECs
were maintained in media containing 0.5% FBS for 12 h, and exposed to 4 µg/ml LPC for 4 h or
300 µmol/L linoleic acid for 6 h with or without N-acetyl cysteine (NAC, 10 mM) and alpha-
lipoic acid (ALA, 5 mM). Cells were lysed, and total RNA extracted. Total RNA (10 µg) was
hybridized with human ET-1 and eNOS probe. RNA quantity was normalized using GAPDH.
Values are presented as means ± SEM of four independent experiments. *: P<0.01 vs. Control,
**: P < 0.01 vs. without NAC and ALA.
17

Online Figure 9. Effects of adenoviral overexpression of UCP2 on ROS generation. Quiescent
HAECs were infected with Ad-UCP2 or Ad-β-gal (3 x 10⁶ p.f.u./ml). Two days after infection,
cells were maintained in media containing 0.5% FBS for 12 h, and exposed to either 4 µg/ml
LPC for 4 h or 300 µmol/L linoleic acid for 6 h. After 15 min incubation with 10 µmol/ml
carboxydichlorodihydrofluorescein diacetate (DCFH2-DA), the increase in DCFH2 oxidation
was measured using FACSCalibur. Values are presented as means ± SEM of three independent
experiments. *: P<0.01 vs. Control.
18
Expanded Materials and Methods
Linoleic acid and lysophosphatidylcholine supplementation of culture media
Stock solution of linoleic acid (Sigma, St. Louis, Missouri) and lysophosphatidylcholine (LPC,
Sigma) were prepared by dissolving linoleic acid in 0.1 N NaOH solution in a bath of boiling
water and LPC in distilled water. Appropriate volumes of freshly prepared linoleic acid stock
solution were slowly added to medium containing fatty acid-free bovine serum albumin (100
µmol/L) during continuous agitation.
Preparation of recombinant adenovirus
Full-length human UCP2 cDNA was cloned into the HindIII/BamHI site of the pAd-YC2 shuttle
vector. The pAd-YC2 shuttle vector (5 µg) and pJM17 rescue vector (5 µg) were co-transfected
into human embryonic kidney 293 (HEK-293) cells cultured in 24-well plates the day before
transfection. After 12-15 days, recombinants were identified by polymerase chain reaction. Next,
recombinants were amplified in HEK-293 cells, purified and isolated using CsCl2 (Sigma).
Preparations were collected and desalted, and titers determined by the measurement of plaque
counts. Control adenovirus containing β-galactosidase (Ad-β-gal) cDNA was generated and
identified as described above.
1

UCP2 iRNA transfection
Target sequences were aligned to the human genome database in a BLAST search to ensure that
the chosen sequences were not highly homologous with those of other genes. Cells were planted
in six-well plates and cultured in drug-free medium. At 90–95% confluence, cells were washed
twice with PBS and grown in 2 ml EBM without antibiotics. Using Lipofectamine 2000 reagent
(Invitrogen), indicated concentration of UCP2 iRNA oligo was transfected into HAECs
according to the manufacturer’s instructions. The cells transfected with control iRNA served as
negative control. Forty-eight hours later, the expression levels of UCP2 were evaluated by RT-
PCR. The cells transfected with iRNA were used for experiments 48 h after the transfection.
Measurement of NO level
Cells were washed twice with serum-free medium containing 10 mM HEPES and then treated
with 3.5 µM DAF-FM diacetate for 45 min at 37°C. After the excess probe was removed, cells
were incubated for an additional 20 min to allow complete de-esterification of the intracellular
diacetates. Fluorescence was measured at 515 nm with microplate spectrofluorometer
(SPECTRAmax GEM-INI-XS; Molecular Devices, Sunnyvale, California) with excitation at
495 nm.
2
Analysis of apoptosis
ELISA assay. Cells were plated in 96-well plates at a density of 2×10⁴ cells/well in MEM
supplemented with 0.5% FBS, and assayed in triplicate. Apoptosis was quantified by measuring
the levels of cytosolic histone-bound DNA fragments, using a cell death ELISA assay kit
(Boehringer Mannheim, Indianapolis, Indiana).1 Mean values calculated from three separate
experiments were used for analysis.
DNA laddering. For the detection of DNA fragmentation, DNA laddering analysis was
performed, as described previously.2
FACScan. For quantification of cellular viability, cells were double-stained with annexin V and
propidium iodide (PI) according to the manufacturer’s instructions (ANNEXIN V-FITC
APOPTOSIS DETECTION KITⅠ (BD Biosciences). The proportion of apoptotic and necrotic
cells was determined by FACSCalibur (Becton Dickinson, San Jose, California). Annexin-V is a
marker of apoptosis and propidium iodide reflects the integrity of the cell membrane, thereby
serving as a marker of necrosis.
Caspase assay. Activities of specific caspases (caspase-3, caspase-8, and caspase-9) were
measured using an ApoAlert caspase fluorescence assay kit (Clontech, Palo Alto, California)
following the manufacturer's instructions. Western blot analysis of caspase-3 was performed
according to a previous report,3 using anti-rabbit polyclonal antibodies against caspase-3 (Cell
3

Signaling Technology, Beverly, Massachusetts).
Assessment of the opening of mitochondrial permeability transition (PT) pores and release
of cytochrome c
Mitochondria (1 mg of protein/ml) isolated from cultured cells were suspended in 200 mM
mannitol, 70 mM sucrose, 10 mM HEPES pH 7.4, 1 mM EGTA, and 0.1% BSA. To measure
the release of calcein from PT pores, we suspended isolated mitochondria at 0.5 mg of
protein/ml in a mitochondrion-isolation buffer. Calcein was introduced into the mitochondrial
matrix by incubation with 1 µM calcein-AM, which is capable of permeating mitochondrial
membranes. The mitochondria were then washed and fluorescence was measured at 517 nm
with microplate spectrofluorometer (SPECTRAmax GEM-INI-XS; Molecular Devices) with
excitation at 494 nm. For analysis of the release of cytochrome c from mitochondria into the
cytosol, proteins in cytosol and mitochondrial fractions were separated by SDS/PAGE. Bands of
proteins were transferred on to a PVDF membrane (Millipore, Bedford, Massachusetts).
Cytochrome c were detected with an enhanced chemiluminescence Western-blotting analysis
system (Amersham, Buckinghamshire, U.K.) with monoclonal antibodies specific for
cytochrome c (Clontech, Palo Alto, California).
4

Confocal fluorescence imaging of mitochondrial Ca2+ concentration ([Ca2+]m) and
membrane potential (∆Ψm)
Images of Rhod-2 AM and thetramethylrhodamine ethyl ester (TMRE) were collected at 27°C
with a Zeiss 510 META laser scanning confocal microscope (Carl Zeiss, Jena, Germany). To
measure the changes in [Ca2+]m, HAECs were loaded with Rhod-2 AM (Molecular Probes, 10
µmol/L) for 120 minutes at 4°C and then incubated for 30 minutes at 37°C in the culture
medium. Although a small portion of the Rhod-2 AM remained within the cytosolic and nuclear
compartment, this cold/warm loading protocol is widely used to introduce Rhod-2 AM into
mitochondria.
The ∆Ψm was monitored with a ∆Ψm indicator, TMRE (Molecular Probes, 200 nmol/L). HAECs
were incubated with TMRE for 30 minutes at 37°C in the culture medium. After dye loading,
HAECs were washed with the culture medium. Throughout the experiments, 200 nmol/L TMRE
was incubated in the perfusion solution. Rhod-2 and TMRE were excited, respectively, with the
514- and 568-nm lines of an argon-krypton laser. Rhod-2 and TMRE fluorescence were directed
to separate photomultipliers by a 560-nm long-pass dichronic reflector through 590-nm long-
pass and 550-nm (35-nm bandpass) barrier filters, respectively. To confirm that Rhod-2 and
TMRE fluorescence did indeed originate from mitochondria, we verified that the mitochondrial
distribution of fluorescence was identical to that observed by loading HAECs with the
5

mitochondrial dye rhodamine-123 or MitoTracker Green (Molecular Probes), molecules that
covalently bind to the inner mitochondrial membrane and fluoresce independently of [Ca2+]m
and ∆Ψm. HAECs loaded with Rhod-2 and TMRE were perfused with a normal Tyrode solution
containing 143 mM NaCl, 5.4 mM KCl, 1.8 mM CaCl2, 0.5 mM MgCl2, 5.5 mM glucose, and
HEPES 5 (pH 7.4).
Measurement of activity of mitochondrial respiratory chain
Mitochondrial respiration was measured using a 782 Oxygen Meter (Strathkelvin Instruments
Ltd., Glasgow, UK) at 37o C in respiratory medium (220 mM mannitol, 70 mM sucrose, 2.5 mM
KH2PO4, 2 mM MgCl2, 1 mM EDTA, and 2 mM HEPES, pH 7.4) with 0.1% fatty acid-free
BSA. Isolated mitochondria (0.5 mg protein/ml) were incubated in the respiratory medium, and
oxygen consumption was quantified. To determine state 3 respiration, oxygen consumption was
recorded with sequential additions of 5 mM succinate, 0.2 mM ADP, and finally 0.2 µM
carbonyl cyanide p-[trifluoromethoxy]-phenyl-hydrazone to induce maximal chemical
uncoupling. To determine state 4 respiration, 2 µM oligomycin was added to inhibit ATP
synthase before the above sequential additions.
6

Vascular function study
The thoracic aorta was excised from nine week-old male Sprague-Dawley rats, and cleaned of
fat and adhering tissue. The vessel was cut into several individual ring segments 2-3 mm in
width, and suspended from a force-displacement transducer in a tissue bath. Ring segments were
washed in Krebs-Henseleit buffer (118 mM NaCl, 4.6 mM KCl, 27.2 mM NaHCO3, 1.2 mM
KH2PO4, 1.2 mM MgSO4, 1.75 mM CaCl2, 0.03 mM Na2EDTA, and 11.1 mM glucose)
maintained at 37° C and aerated with 95% O2-5% CO2. A passive load of 2g was applied to the
ring segment and maintained throughout the experiment. The tension was measured with an
isometric force displacement transducer (Hugo Sachs Elektronik KG D-7806, Freiburg,
Germany) and recorded using a polygraph (Graphtec Linerecorder mark 8 WR3500, Irvine,
California). After exposure to 4 µg/ml lysophosphatidylcholine (LPC, Sigma), sub-maximal
contraction of the aortic ring was induced by treatment with 300 µmol/L phenylephrine
(Research Biochemicals International, Natick, Massachusetts). When vascular tension reached a
plateau, acetylcholine (from 10-9 to 10-5 mol/L) was added serially to the bath to induce
endothelium-dependent vasorelaxation. In a separate set of experiments, endothelium-
independent vasorelaxation was determined by the serial addition of sodium nitroprusside (from
10-11 to 10-7 mol/L). Vascular relaxation data were calculated as the percentage of the maximal
vasorelaxation, and the dose-response profile for each experiment was analyzed.
7

References
1. Yu K, Kennedy CA, O'Neill MM, Barton RW, Tatake RJ. Disparate cleavage of poly-
(ADP-ribose)-polymerase (PARP) and a synthetic tetrapeptide, DEVD, by apoptotic
cells. Apoptosis. 2001;6: 151-160.
2. Kaneta S, Satoh K, Kano S, Kanda M, Ichihara K. All hydrophobic HMG-CoA
reductase inhibitors induce apoptotic death in rat pulmonary vein endothelial cells.
Atherosclerosis. 2003;170:237-243.
3. Kim GS, Hong JS, Kim SW, Koh JM, An CS, Choi JY, Cheng SL. Leptin induces
apoptosis via ERK/cPLA2/cytochrome c pathway in human bone marrow stromal cells.
J Biol Chem. 2003;278:21920-21929.
8
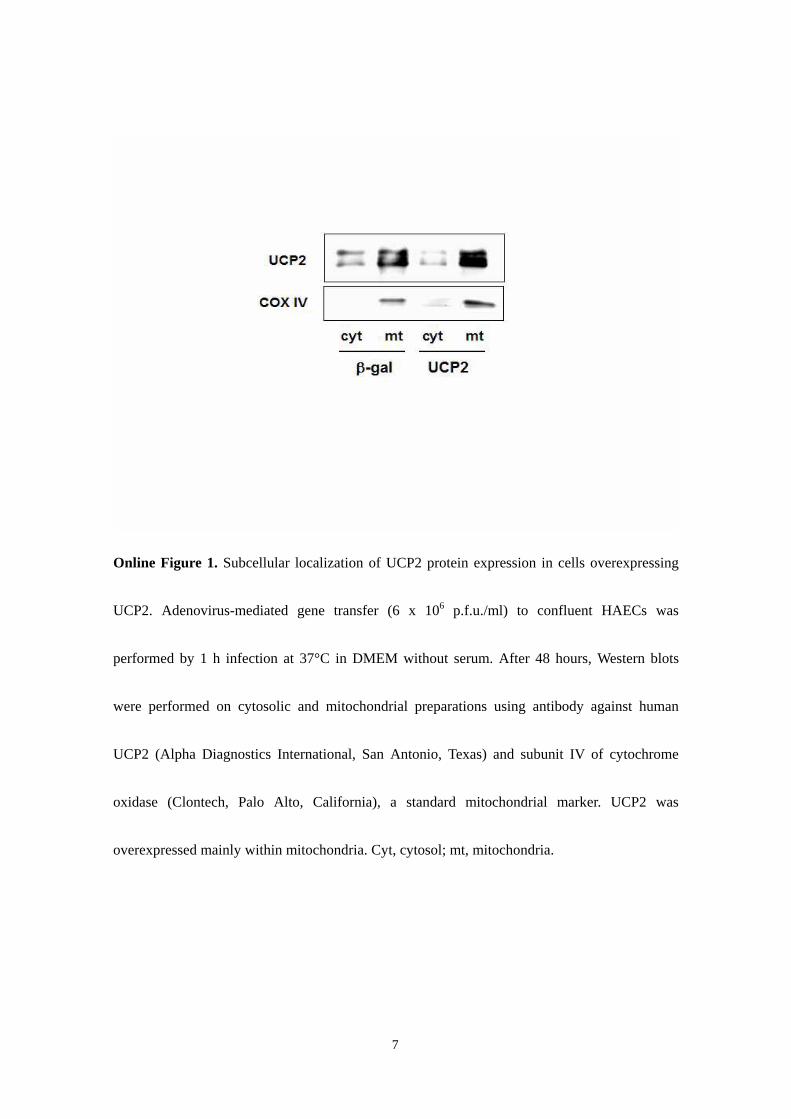
Online Figure 1. Subcellular localization of UCP2 protein expression in cells overexpressing
UCP2. Adenovirus-mediated gene transfer (6 x 10⁶ p.f.u./ml) to confluent HAECs was
performed by 1 h infection at 37°C in DMEM without serum. After 48 hours, Western blots
were performed on cytosolic and mitochondrial preparations using antibody against human
UCP2 (Alpha Diagnostics International, San Antonio, Texas) and subunit IV of cytochrome
oxidase (Clontech, Palo Alto, California), a standard mitochondrial marker. UCP2 was
overexpressed mainly within mitochondria. Cyt, cytosol; mt, mitochondria.
9
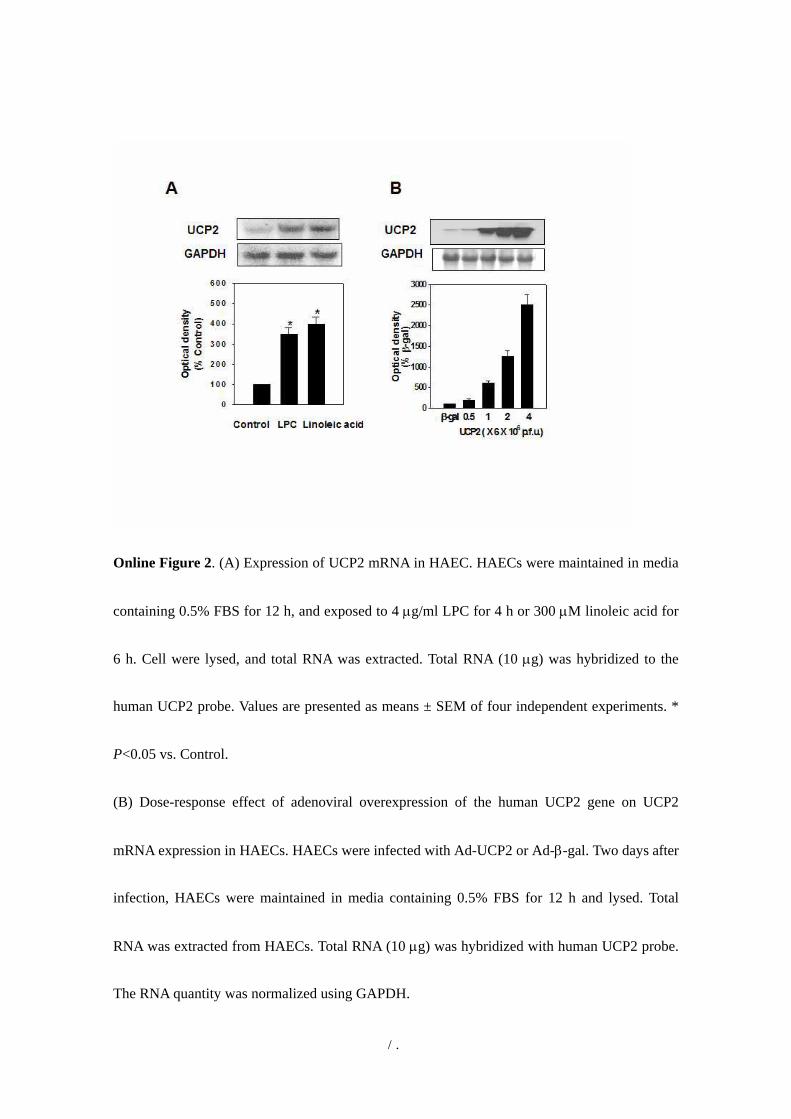
Online Figure 2. (A) Expression of UCP2 mRNA in HAEC. HAECs were maintained in media
containing 0.5% FBS for 12 h, and exposed to 4 µg/ml LPC for 4 h or 300 µM linoleic acid for
6 h. Cell were lysed, and total RNA was extracted. Total RNA (10 µg) was hybridized to the
human UCP2 probe. Values are presented as means ± SEM of four independent experiments. *
P<0.05 vs. Control.
(B) Dose-response effect of adenoviral overexpression of the human UCP2 gene on UCP2
mRNA expression in HAECs. HAECs were infected with Ad-UCP2 or Ad-β-gal. Two days after
infection, HAECs were maintained in media containing 0.5% FBS for 12 h and lysed. Total
RNA was extracted from HAECs. Total RNA (10 µg) was hybridized with human UCP2 probe.
The RNA quantity was normalized using GAPDH.
10

Online Figure 3. Effect of catalase and uric acid on DCF fluorescence. HAECs were
maintained in media containing 0.5% FBS for 12 h, and exposed to 4 µg/ml LPC for 4 h or 300
µmol/L linoleic acid for 6 h with or without catalase (250 u/ml) and uric acid (5 mM). After 15
min incubation with 10 µmol/ml carboxydichlorodihydrofluorescein diacetate (DCFH2-DA), the
increase in DCFH2 oxidation was measured using FACSCalibur. Values are presented as means
± SEM of five independent experiments. *: P<0.01 vs. Control, **. : P<0.01 vs. without
catalase and uric acid.
11

Online Figure 4. Effect of UCP2 overexpression on apoptosis and necrosis. (A) Representative
figures. Ad-UCP2 or Ad-β-gal infected HAECs treated with LPC or linoleic acid were double-
stained with annexin V and propidium iodide (PI) using ANNEXIN V-FITC APOPTOSIS
DETECTION KIT I. The proportion of apoptotic and necrotic cells was determined by
FACSCalibur (Becton Dickinson, San Jose, California). (B) The effect of UCP overexpression
on LPC- or linoleic acid-induced apoptosis and necrosis. Apoptotic and necrotic cells were
identified by staining with annexin V (early apoptosis) or annexin V/PI (late apoptosis) and PI,
respectively. Values are presented as means ± SEM of four independent experiments. *: P<0.01
vs. Control, **: P < 0.01 vs. β-gal.
12

Online Figure 5. Effect of adenoviral overexpression of UCP2 on caspase activation. HAECs
were infected with Ad-UCP2 or Ad-β-gal. Two days after infection, cells were maintained in
media containing 0.5% FBS for 12 h, and exposed to 300 µmol/L linoleic acid for 16 - 20 h.
Following treatment, caspase-8 and -9 activation was analyzed by measuring activities using the
caspase fluorescence assay kit (A, B). The values are presented as means ± SEM of five
independent experiments. *: P<0.01 vs. Control, **: P<0.01 vs. β-gal.
13

Online Figure 6. Effects of adenoviral overexpression of UCP2 on LPC- and linoleic acid-
induced changes in ∆Ψm and [Ca2+]m. UCP2 overexpression attenuated the 4 µg/ml LPC- and
300 µmol/L linoleic acid-induced change in TMRE fluorescence (A). Vertical axis is the ratio of
TMRE fluorescence 13 minutes after application of LPC and linoleic acid relative to the values
at the baseline. F is the measured TMRE fluorescence and Fo is that at the beginning of the
experiment. Inset shows summarized data for the arbitrary units of TMRE fluorescence of
baseline in the Ad-β-gal-infected and Ad-UCP2-infected HAECs. The values are presented as
means ± SEM of five independent experiments. *P<0.05 vs. baseline; #P<0.05 vs. LPC in Ad-β-
14

gal-infected HAECs. P<0.05 vs. linoleic acid in Ad-β-gal-infected HAECs. UCP2
overexpression attenuated the 4 µg/ml LPC- and 300 µmol/L linoleic acid-induced increase in
Rhod-2 fluorescence (B). Pretreatment with 100 µM ruthenium red inhibits the 4 µg/ml LPC-
and 300 µmol/L linoleic acid-induced increase in Rhod-2 fluorescence. Inset shows summarized
data for the arbitrary units (a.u.) of Rhod-2 fluorescence at baseline in the Ad-β-gal-infected and
Ad-UCP2-infected HAECs. *P<0.05 vs. Ad-β-gal-infected HAECs; #P<0.05 vs. ruthenium red
(-) in Ad-β-gal-infected HAECs. P<0.05 vs. ruthenium red (-) in Ad-UCP2-infected HAECs.
RR indicates ruthenium red. (C) Summarized data for the time courses of changes in Rhod-2
fluorescence. *P<0.05 vs. baseline; #P<0.05 vs. LPC in Ad-β-gal-infected HAECs. P<0.05 vs.
linoleic acid in Ad--β-gal-infected HAECs.
15

Online Figure 7. Immunohistochemical staining of UCP2 protein in aortic tissue
overexpressing UCP2. Overexpression of the UCP2 gene in the rat aortic ring was achieved by
30-min adenoviral infection (6 x 10⁶ p.f.u./ml) at 37°C in DMEM without serum and incubation
with media containing 5% BSA for 24 hours. Immunohistochemical staining for UCP2 protein
in Ad-UCP2-treated vessel preparations was performed using antibody against human UCP2
(Alpha Diagnostics International, San Antonio, Texas). UCP2 protein (arrow, brown color) was
found mainly in endothelium and adventitia in adeno-UCP2 treated aortas. En, endothelial cell;
smc, smooth muscle cell; ad, adventitia.
16
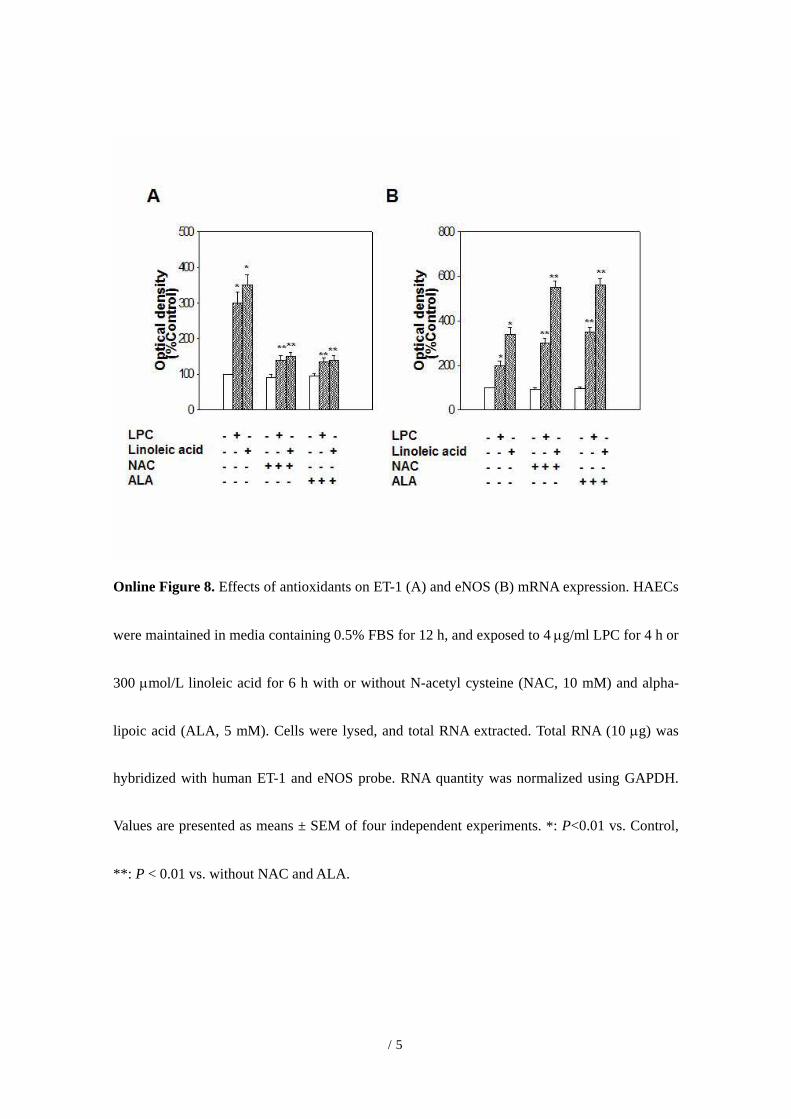
Online Figure 8. Effects of antioxidants on ET-1 (A) and eNOS (B) mRNA expression. HAECs
were maintained in media containing 0.5% FBS for 12 h, and exposed to 4 µg/ml LPC for 4 h or
300 µmol/L linoleic acid for 6 h with or without N-acetyl cysteine (NAC, 10 mM) and alpha-
lipoic acid (ALA, 5 mM). Cells were lysed, and total RNA extracted. Total RNA (10 µg) was
hybridized with human ET-1 and eNOS probe. RNA quantity was normalized using GAPDH.
Values are presented as means ± SEM of four independent experiments. *: P<0.01 vs. Control,
**: P < 0.01 vs. without NAC and ALA.
17

Online Figure 9. Effects of adenoviral overexpression of UCP2 on ROS generation. Quiescent
HAECs were infected with Ad-UCP2 or Ad-β-gal (3 x 10⁶ p.f.u./ml). Two days after infection,
cells were maintained in media containing 0.5% FBS for 12 h, and exposed to either 4 µg/ml
LPC for 4 h or 300 µmol/L linoleic acid for 6 h. After 15 min incubation with 10 µmol/ml
carboxydichlorodihydrofluorescein diacetate (DCFH2-DA), the increase in DCFH2 oxidation
was measured using FACSCalibur. Values are presented as means ± SEM of three independent
experiments. *: P<0.01 vs. Control.
18