Effects of Paternity Leave on Maternal Postpartum ... · and neonatal complications. Sample Size...
14
Paternity Leave And Postpartum Depression HKJGOM 2015; 15(2) 187 Correspondence to: Dr Ka-Wai Ho Email: [email protected] Effects of Paternity Leave on Maternal Postpartum Depression in Hong Kong Chinese Ka-Wai HO MBBS, MRCOG Department of Obstetrics and Gynaecology, Tuen Mun Hospital, New Territories, Hong Kong Felix YF IU MBChB, MRCOG, FHKAM (O&G) Department of Obstetrics and Gynaecology, Tuen Mun Hospital, New Territories, Hong Kong Sin-Ying TSE MBChB Department of Obstetrics and Gynaecology, Tuen Mun Hospital, New Territories, Hong Kong Chui-Shan YIP MBChB Department of Obstetrics and Gynaecology, Tuen Mun Hospital, New Territories, Hong Kong Sidney KC AU YEUNG MBBS, FRCOG, FHKAM (O&G) Department of Obstetrics and Gynaecology, Tuen Mun Hospital, New Territories, Hong Kong Hon-Cheung LEE MBBS, FRCOG, FHKAM (O&G) Department of Obstetrics and Gynaecology, Tuen Mun Hospital, New Territories, Hong Kong Objectives: To examine the effects of paternity leave on maternal postpartum depression, paternal involvement in neonatal care, and maternal perception of social support in Hong Kong Chinese. Methods: A prospective study was conducted from July to September 2013 in Tuen Mun Hospital, Hong Kong, among postpartum women with liveborn babies. The subjects were assessed by a self-administered survey between 1 and 5 days postpartum, and again at 6 to 8 weeks postpartum. Postpartum depression and social support were assessed using the Edinburgh Postnatal Depression Scale and the Multidimensional Scale of Perceived Social Support, respectively. Paternal involvement in baby care was rated on a Likert scale. Results: A total of 424 (65.1%) of the 651 subjects responded to the second survey between 6 and 8 weeks postpartum. The prevalence of postpartum depression was 31.4% (133/423). Postpartum depression was associated with shorter duration of stay in Hong Kong, lower family income, lower perceived social support, and lower paternal involvement. The prevalence of paternity leave was 61.6% (261/424) with a mean duration of 8.9 days. Paternity leave was associated with paternal involvement, partner companionship during labour, and some demographic variables (marital status, maternal work status, education level, duration of stay in Hong Kong, family income, household size, number of existing children, helper availability, and pregnancy plan). Paternity leave had no statistically significant effect on maternal perception of social support or postpartum depression. Conclusion: Although paternity leave was associated with increased paternal involvement in baby care, which was in turn associated with a reduced risk of postpartum depression, it had no direct effect on postpartum depression. Hong Kong J Gynaecol Obstet Midwifery 2015; 15(2):187-200 Keywords: Depression, postpartum; Parental leave; Paternal behavior; Pregnancy complications; Social support Introduction Paternity leave is a form of parental leave offered to the father of a newborn so that he can give support to the mother, bond with the newborn, and participate in baby care. Laws about paternity leave vary around the world, with some places offering very generous terms up to months, and others fewer measures in place to promote and protect parental leave. Paternity leave can be taken both before and after a birth, for varying lengths of time. In some places, people are entitled to full or partial pay during their paternity leave. In places where paternity leave is not required by law, it is still provided by some proactive employers. In other instances, the employee has to negotiate with the employer to obtain leave to care for a newborn, and may be forced to take limited time off without pay. Other employers may grant annual leave to facilitate the new father who wants to spend some time at home. In this study, paternity leave refers to leave taken around the time of delivery that can be paid or unpaid paternity leave, annual leave, or other kinds of leave, and is equally applicable to births within both marital and non- marital partnerships. The Hong Kong community attaches increasing importance to the father’s responsibilities in the family.
Transcript of Effects of Paternity Leave on Maternal Postpartum ... · and neonatal complications. Sample Size...

Paternity Leave And Postpartum Depression
HKJGOM 2015; 15(2) 187
Correspondence to: Dr Ka-Wai HoEmail: [email protected]
Effects of Paternity Leave on Maternal Postpartum Depression in Hong Kong Chinese
Ka-Wai HO MBBS, MRCOGDepartment of Obstetrics and Gynaecology, Tuen Mun Hospital, New Territories, Hong KongFelix YF IU MBChB, MRCOG, FHKAM (O&G)Department of Obstetrics and Gynaecology, Tuen Mun Hospital, New Territories, Hong KongSin-Ying TSE MBChBDepartment of Obstetrics and Gynaecology, Tuen Mun Hospital, New Territories, Hong KongChui-Shan YIP MBChBDepartment of Obstetrics and Gynaecology, Tuen Mun Hospital, New Territories, Hong KongSidney KC AU YEUNG MBBS, FRCOG, FHKAM (O&G)Department of Obstetrics and Gynaecology, Tuen Mun Hospital, New Territories, Hong KongHon-Cheung LEE MBBS, FRCOG, FHKAM (O&G)Department of Obstetrics and Gynaecology, Tuen Mun Hospital, New Territories, Hong Kong
Objectives: To examine the effects of paternity leave on maternal postpartum depression, paternal involvement in neonatal care, and maternal perception of social support in Hong Kong Chinese.Methods: A prospective study was conducted from July to September 2013 in Tuen Mun Hospital, Hong Kong, among postpartum women with liveborn babies. The subjects were assessed by a self-administered survey between 1 and 5 days postpartum, and again at 6 to 8 weeks postpartum. Postpartum depression and social support were assessed using the Edinburgh Postnatal Depression Scale and the Multidimensional Scale of Perceived Social Support, respectively. Paternal involvement in baby care was rated on a Likert scale. Results: A total of 424 (65.1%) of the 651 subjects responded to the second survey between 6 and 8 weeks postpartum. The prevalence of postpartum depression was 31.4% (133/423). Postpartum depression was associated with shorter duration of stay in Hong Kong, lower family income, lower perceived social support, and lower paternal involvement. The prevalence of paternity leave was 61.6% (261/424) with a mean duration of 8.9 days. Paternity leave was associated with paternal involvement, partner companionship during labour, and some demographic variables (marital status, maternal work status, education level, duration of stay in Hong Kong, family income, household size, number of existing children, helper availability, and pregnancy plan). Paternity leave had no statistically significant effect on maternal perception of social support or postpartum depression.Conclusion: Although paternity leave was associated with increased paternal involvement in baby care, which was in turn associated with a reduced risk of postpartum depression, it had no direct effect on postpartum depression.Hong Kong J Gynaecol Obstet Midwifery 2015; 15(2):187-200
Keywords: Depression, postpartum; Parental leave; Paternal behavior; Pregnancy complications; Social support
Introduction Paternity leave is a form of parental leave offered to the father of a newborn so that he can give support to the mother, bond with the newborn, and participate in baby care. Laws about paternity leave vary around the world, with some places offering very generous terms up to months, and others fewer measures in place to promote and protect parental leave. Paternity leave can be taken both before and after a birth, for varying lengths of time. In some places, people are entitled to full or partial pay during their paternity leave. In places where paternity leave is not required by law, it is still provided by some proactive employers. In other instances, the employee has to negotiate with the employer to obtain leave to care for a newborn, and may be forced to take limited time off
without pay. Other employers may grant annual leave to facilitate the new father who wants to spend some time at home. In this study, paternity leave refers to leave taken around the time of delivery that can be paid or unpaid paternity leave, annual leave, or other kinds of leave, and is equally applicable to births within both marital and non-marital partnerships.
The Hong Kong community attaches increasing importance to the father’s responsibilities in the family.

KW HO et al
HKJGOM 2015; 15(2)188
There is an increasing trend for provision of paternity leave by private enterprises for their employees. According to statistics from the Labour Department of the Hong Kong SAR Government, the percentage of respondent private organisations who offer paternity leave on their own volition has increased from 16% in 2006 to 32.5% in 20101. Starting from April 2012, eligible government employees can enjoy 5 working days of full-pay paternity leave on each occasion of childbirth. There are views that the Government should legislate for the provision of paternity leave by all employers.
Postpartum depression is a common disorder, with a prevalence estimated at about 12.7% to 24.2% of deliveries in Hong Kong Chinese women2. Maternal depression has deleterious effects on the new mother, her baby, and her family3. Risk factors for postpartum depression include stressful life events during pregnancy, difficult birth, marital difficulties, lack of social support, personal history of mood disorders, and depressed mood and / or anxiety during pregnancy4. The lack of social support as a risk factor for postpartum depression has been particularly studied. Women who perceive to receive more social support have less psychological distress in the postpartum period5. Depressed women tend to have less social support than others6 and report less support from their partner7. The partner’s supportive role seems to be a protective factor against the development of postpartum depression8,9. The lack of paternal involvement in baby care may predict the intensity of maternal depressive symptoms10,11. The provision of paternity leave may encourage paternal support for the mother and paternal involvement in baby care, and thus prevent postpartum depression.
To our knowledge, there has been no local research about the relationship between paternity leave and postpartum health. In this study we examined the effects of paternity leave on maternal postpartum depression, paternal involvement in neonatal care, and maternal perception of social support in the Chinese population of Hong Kong.
MethodsStudy Design A prospective observational study was conducted from July 2013 to September 2013 at Tuen Mun Hospital, Hong Kong. Ethics approval was obtained from the New Territories West Cluster Clinical and Research Ethics Committee before commencement of the study. Postpartum women with liveborn babies were invited to participate in the study by the authors while they were in the postnatal ward. Women who: (1) had active psychiatric disease; (2)
were not ethnic Chinese; (3) were not permanent residents in Hong Kong; (4) did not have a partner (husband or boyfriend); or (5) whose partner was not in full-time employment were excluded.
Informed consent was obtained from women who agreed to participate. Each woman was assigned a unique research number and asked to complete a demographic questionnaire, the Edinburgh Postnatal Depression Scale (EPDS) and the Multidimensional Scale of Perceived Social Support (MSPSS) between the first and fifth day postpartum (time 1). The subjects were given another self-administered survey, along with a stamped envelope, to be completed and returned 6 weeks postpartum (time 2). The subjects would be asked several questions about paternity leave, paternal involvement, EPDS, and MSPSS. If the subjects did not return the survey, they would be reminded by phone to complete and return the second survey before 8 weeks postpartum. This study was conducted in Chinese. All printed materials for the subjects, including information leaflets, consent forms and questionnaires, were in traditional Chinese.
Study Instruments Postpartum depression was assessed using the Chinese version of the EPDS. The original EPDS is a 10-item self-report scale widely used to screen for postpartum depression, with items of the scale corresponding to various clinical depressive symptoms12. The Chinese version of the EPDS has been validated among Hong Kong Chinese women. Its psychometric performance is comparable with the original scale. It has been shown to have satisfactory sensitivity and specificity using a cut-off point of 9/10 for detecting depression in Chinese women at 6 weeks postpartum13.
The MSPSS was used to assess social support perceived by the mother. This scale consists of 12 questions divided equally between three sources of perceived social support: family members including the husband; friends; and a significant other14. The Chinese version of the MSPSS has been validated among Hong Kong Chinese and its psychometric performance is comparable with the original scale15.
Paternal involvement in baby care was assessed over four areas (overall care, changing clothes and napkins, play, and taking care of the baby alone). Subjects were asked to rate the father’s level of participation in each area through a Likert item ranging from 0 (‘never’) to 4 (‘all the time’), and the responses were summed to give a maximum

Paternity Leave And Postpartum Depression
HKJGOM 2015; 15(2) 189
score of 16. Cronbach’s alpha for the scale used in a study10 was 0.85.
We used a demographic questionnaire to collect socio-demographic information from subjects based on known risk factors for postpartum depression. The information included age, education, marital status, number of existing children, whether the pregnancy was unplanned, employment, family income, housing, financial assistance, social support including presence of domestic helper or peiyue maid, and father’s disappointment with the baby’s gender16.
Obstetric and neonatal data were also collected. These included age and parity, gestation at delivery, mode of delivery, partner companionship during labour, history of medical or psychiatric illness, obstetric complications, and neonatal complications.
Sample Size Calculation Assuming a prevalence of postpartum depression of 15%, prevalence of paternity leave of 50% and precision of 3.8%, a total of 190 subjects would be required to achieve a 5% level of significance17. With an estimated response rate of 50%, 380 cases were required for the study.
Statistical Analysis Data were analysed using the Statistical Package for the Social Sciences Windows version 20.0 (SPSS Inc., Chicago [IL], US). For continuous variables, p values were obtained from the Mann-Whitney U test. For discrete variables, p values were obtained from the Fisher’s exact test. Logistic regression models were used to control for the effect of several significant variables on postpartum depression. For all analyses, a p<0.05 was considered statistically significant.
Results A total of 872 mothers were approached during the study period. In all, 99 mothers were excluded based on the exclusion criteria; 122 mothers opted out of the study. A total of 651 mothers agreed to participate in the study. Written informed consent was obtained and the first survey completed while they were on our postnatal ward.
Among the subjects, 424 (65.1%) responded (‘respondents’) to the second survey between 6 and 8 weeks postpartum and their data were valid for analysis (Table 1). Those who completed the first survey but failed to respond to the second survey between 6 and 8 weeks postpartum are classified as ‘non-respondents’. In
all, 37.7% of them required a phone reminder to return the second survey. The sample sizes for individual items in the surveys varied slightly because inadmissible or incomplete responses were rejected for analysis. For example, because a small number of respondents neglected to specify the duration or type of paternity leave, the denominators used in the corresponding analyses ranged from 421 to 424 (Table 2).
The mean EPDS score at time 1 for respondents (7.5) and non-respondents (7.9) were not significantly different (p=0.39) [Table 1]. Respondents and non-respondents also shared similar demographic characteristics, except that respondents were more likely to be older (p<0.001) and more likely to have obstetric complications (p=0.01).
The prevalence of postpartum depression at 6 to 8 weeks postpartum (i.e. EPDS score at time 2 ≥10) was 31.4% (133/423) [Table 2]. The mean ± standard deviation EPDS score at time 2 for all respondents was 7.6 ± 5.0.
The prevalence of paternity leave was 61.6% (261/424) [Table 2] with an overall mean duration (among those with paternity leave) of 8.9 days. In all, 23% (98/423) had paid paternity leave ranging from 1 to 31 days (mean, 4.7 days). A further 12.6% (53/421) had non-paid paternity leave ranging from 1 to 35 days (mean, 6.4 days). In addition 27.7% (117/422) took annual leave ranging from 2 to 50 days (mean, 7.6 days), and 8.8% (37/421) took other kinds of leave, such as event leave and leave from own business, ranging from 1 to 120 days (mean, 16.1 days).
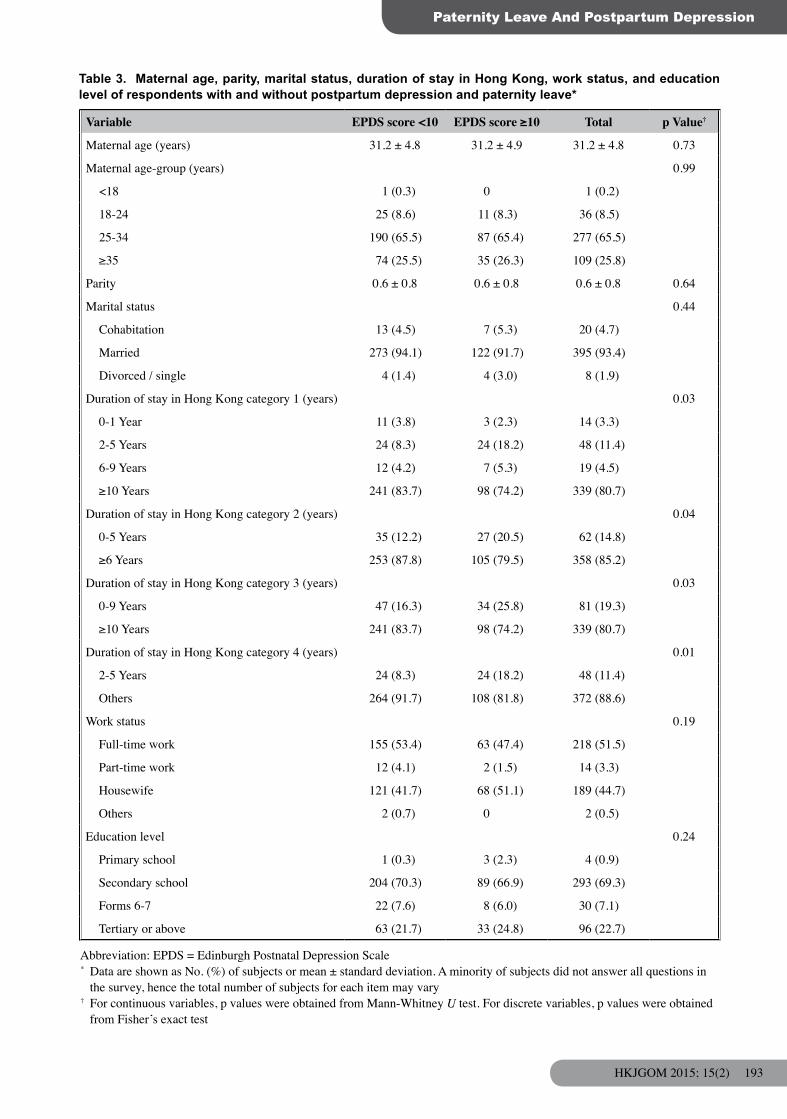
Postpartum depression was associated with duration of stay in Hong Kong, family income, MSPSS at time 1, MSPSS at time 2, and paternal involvement individually. The prevalence of postpartum depression increased with shorter duration of stay in Hong Kong (p=0.01-0.04) [Table 3], lower family income (p=0.03) [Table 4], lower MSPSS scores (p<0.001) [Table 5], and lower scores of paternal involvement (p=0.001) [Table 6].
Paternity leave was associated with increased paternal involvement (p=0.001) [Table 6], but had no statistically significant effect on MSPSS score at time 2 (p=0.48) [Table 5]. Paternity leave increased the scores for each of the assessed areas of paternal involvement in baby care (overall care, p=0.001; changing clothes and napkins, p=0.002; playing with the baby, p=0.01; and taking care of the baby alone, p=0.01).

KW HO et al
HKJGOM 2015; 15(2)190
Abbreviations: EPDS = Edinburgh Postnatal Depression Scale; MSPSS = Multidimensional Scale of Perceived Social Support; time 1 = first survey* Data are shown as No. (%) of respondents or mean ± standard deviation. A minority of subjects did not answer all questions
in the survey, hence the total number of subjects for each item may vary† Respondents refer to those who responded to the second survey between 6 and 8 weeks postpartum. Non-respondents refer
to those who completed the first survey but failed to respond to the second survey between 6 and 8 weeks postpartum‡ For continuous variables, p values were obtained from Mann-Whitney U test. For discrete variables, p values were obtained
from Fisher’s exact test
Table 1. Characteristics of respondents and non-respondents*
Characteristics Respondents† (n=424)
Non-respondents†
(n=227)Overall (n=651) p Value‡
Maternal age (years) <0.001
Mean 31.2 ± 4.8 29.0 ± 5.2 30.5 ± 5.1<18 1 (0.2) 1 (0.4) 2 (0.3)18-24 36 (8.5) 47 (20.7) 83 (12.7)25-34 278 (65.6) 143 (63.0) 421 (64.7)≥35 109 (25.7) 36 (15.9) 145 (22.3)
Parity 0.6 ± 0.8 0.5 ± 0.7 0.6 ± 0.7 0.14Marital status 0.06
Cohabitation 20 (4.7) 21 (9.3) 41 (6.3)Married 396 (93.4) 200 (88.1) 596 (91.6)Divorced / single 8 (1.9) 6 (2.6) 14 (2.2)
Duration of stay in Hong Kong 0.310-1 Year 14 (3.3) 5 (2.2) 19 (2.9)2-5 Years 48 (11.4) 29 (12.9) 77 (11.9)6-9 Years 19 (4.5) 17 (7.6) 36 (5.6)>10 Years 340 (80.8) 173 (77.2) 513 (79.5)
Work status 0.12Full-time work 219 (51.7) 110 (48.5) 329 (50.5)Part-time work 14 (3.3) 12 (5.3) 26 (4.0)Housewife 189 (44.6) 100 (44.1) 289 (44.4)Others 2 (0.5) 5 (2.2) 7 (1.1)
Education level 0.32Primary school 4 (0.9) 3 (1.3) 7 (1.1)Secondary school 294 (69.3) 167 (73.6) 461 (70.8)Forms 6-7 30 (7.1) 19 (8.4) 49 (7.5)Tertiary or above 96 (22.6) 38 (16.7) 134 (20.6)
Family income (HK$) 0.49<10,000 46 (10.9) 25 (11.1) 71 (11.0)10,000-29,999 249 (59.1) 146 (64.6) 395 (61.1)30,000-49,999 100 (23.8) 45 (19.9) 145 (22.4)≥50,000 26 (6.2) 10 (4.4) 36 (5.6)
Living environment 0.53Owned private housing 135 (32.2) 64 (29.0) 199 (31.1)Rented private housing 66 (15.8) 44 (19.9) 110 (17.2)A part of rented private housing 9 (2.1) 4 (1.8) 13 (2.0)Owned public housing 53 (12.6) 19 (8.6) 72 (11.3)Rented public housing 132 (31.5) 78 (35.3) 210 (32.8)Temporary housing 6 (1.4) 4 (1.8) 10 (1.6)Others 18 (4.3) 8 (3.6) 26 (4.1)
Economic support 0.09No 414 (98.6) 217 (96.4) 631 (97.8)Yes 6 (1.4) 8 (3.6) 14 (2.2)

Paternity Leave And Postpartum Depression
HKJGOM 2015; 15(2) 191
Table 1. (cont’d)
Characteristics Respondents† (n=424)
Non-respondents†
(n=227)Overall (n=651) p Value‡
Household size 3.0 ± 1.7 3.0 ± 1.6 3.0 ± 1.7 0.74
No. of existing children 0.7 ± 0.8 0.7 ± 0.9 0.7 ± 0.9 0.16Living with parents 0.14
No 371 (88.3) 188 (83.9) 559 (86.8)Yes 49 (11.7) 36 (16.1) 85 (13.2)
Living with parents-in-law 0.17No 312 (74.3) 155 (68.9) 467 (72.4)Yes 108 (25.7) 70 (31.1) 178 (27.6)
Helper availability 0.92No 322 (76.8) 171 (76.3) 493 (76.7)Yes 97 (23.2) 53 (23.7) 150 (23.3)
Planned pregnancy 0.13No 126 (30.0) 81 (36.0) 207 (32.1)Yes 294 (70.0) 144 (64.0) 438 (67.9)
Partner disappointment about the baby’s gender 1.00No 402 (95.7) 215 (95.6) 617 (95.7)Yes 18 (4.3) 10 (4.4) 28 (4.3)
Gestation at delivery 0.99<28 Weeks 1 (0.2) 1 (0.4) 2 (0.3)28-31+ Weeks 2 (0.5) 1 (0.4) 3 (0.5)32-33+ Weeks 4 (0.9) 2 (0.9) 6 (0.9)34-36+ Weeks 32 (7.5) 18 (7.9) 50 (7.7)37-41+ Weeks 385 (90.8) 205 (90.3) 590 (90.6)
Mode of delivery 0.52Normal spontaneous delivery 265 (62.5) 149 (65.6) 414 (63.6)Assisted vaginal delivery 41 (9.7) 25 (11.0) 66 (10.1)Elective Caesarean section 37 (8.7) 20 (8.8) 57 (8.8)Emergency Caesarean section 81 (19.1) 33 (14.5) 114 (17.5)
Partner companionship during labour 0.80No 195 (49.4) 108 (50.7) 303 (49.8)Yes 200 (50.6) 105 (49.3) 305 (50.2)
History of medical illness 0.14No 365 (86.1) 185 (81.5) 550 (84.5)Yes 59 (13.9) 42 (18.5) 101 (15.5)
History of psychiatric illness 0.87No 396 (93.4) 211 (93.0) 607 (93.2)Yes 28 (6.6) 16 (7.0) 44 (6.8)
Obstetric complications 0.01No 213 (50.2) 138 (60.8) 351 (53.9)Yes 211 (49.8) 89 (39.2) 300 (46.1)
Neonatal complications 0.77No 324 (76.4) 171 (75.3) 495 (76.0)Yes 100 (23.6) 56 (24.7) 156 (24.0)
EPDS score at time 1 7.5 ± 4.2 7.9 ± 4.6 7.7 ± 4.4 0.39EPDS score at time 1 ≥10 0.66
No 282 (67.5) 148 (65.8) 430 (66.9)Yes 136 (32.5) 77 (34.2) 213 (33.1)
MSPSS score at time 1 69.5 ± 13.9 68.3 ± 14.9 69.1 ± 14.3 0.50

KW HO et al
HKJGOM 2015; 15(2)192
It was also associated with partner companionship during labour (p=0.01) [Table 7], and some demographic variables (marital status, maternal work status, education level, duration of stay in Hong Kong, family income, household size, number of existing children, helper availability, and pregnancy plan) [Table 3].
Paternity leave had no statistically significant effect on maternal postpartum depression (p=0.75) [Table 2], even after controlling for significant variables (duration of stay in Hong Kong, family income, MSPSS score at time 2, and paternal involvement) using logistic regression (p=0.85). Sub-categories of paternity leave also had no statistically significant effect on postpartum depression (p values, 0.57-0.74). Subgroup analyses of paid and non-paid paternity leave likewise showed no statistically significant effect on postpartum depression (Table 2).
Discussion The prevalence of postpartum depression in Asian countries ranges from 3.5% to 63.3%, and the prevalence in Hong Kong Chinese women ranges from 12.7 to 24.2%2. In our study, the prevalence of postpartum
depression at 6 to 8 weeks postpartum was 31.4%, relatively high compared with previous studies of Hong Kong Chinese2. The women in our locality might be more prone to develop postpartum depression because of their socio-economic characteristics. The obstetric population in the New Territories West Cluster tended to be younger, less educated, and of lower income compared with those in other parts of Hong Kong18. Our estimation of the prevalence was limited by self-selection bias, as our subjects might differ significantly in their susceptibility to depression from women who opted out of the study. Despite a reasonably high response rate, the risk of non-response bias, where depressed subjects would be more likely or less likely to respond to the second survey, could not be eliminated. The characteristics of respondents and non-respondents were largely comparable, except that the respondents tended to be older and suffer from obstetric complications (which were not shown to be associated with postpartum depression in this study). Finally, direct comparison with previous studies might be inappropriate because of differences in timing and methods for detection of postpartum depression, cut-off scores for diagnosis, and inclusion criteria.
Table 2. Characteristics of paternity leave taken by partners of respondents with and without postpartum depression*
Variable EPDS score <10 EPDS score ≥10 Total p Value†
Presence of PL 0.75No 110 (37.9) 53 (39.8) 163 (38.5)Yes 180 (62.1) 80 (60.2) 260 (61.5)
Total duration of leave (for respondents with / without paternity leave)
5.7 ± 8.9 4.9 ± 11.3 5.4 ± 9.7 0.43
Paid PL 1.0 ± 2.6 1.2 ± 3.4 1.1 ± 2.9 0.70Non-paid PL 0.9 ± 3.5 0.6 ± 2.0 0.8 ± 3.1 0.57Annual leave 2.2 ± 5.5 1.8 ± 3.7 2.1 ± 5.0 0.72Other kinds of leave 1.5 ± 6.7 1.3 ± 10.5 1.4 ± 8.1 0.74
Comparison of paid PL with other categories 0.91Paid PL 66 (23.1) 32 (24.1) 98 (23.4)No PL 110 (38.5) 53 (39.8) 163 (38.9)Non-paid / annual / others 110 (38.5) 48 (36.1) 158 (37.7)
Comparison of non-paid PL with other categories 0.86Non-paid PL 38 (13.3) 15 (11.3) 53 (12.6)No PL 110 (38.5) 53 (39.8) 163 (38.9)Paid / annual / others 138 (48.3) 65 (48.9) 203 (48.4)
Abbreviations: EPDS = Edinburgh Postnatal Depression Scale; PL = paternity leave* Data are shown as No. (%) of respondents or mean ± standard deviation. A minority of subjects did not answer all questions
in the survey, hence the total number of subjects for each item may vary† For continuous variables, p values were obtained from Mann-Whitney U test. For discrete variables, p values were obtained
from Fisher’s exact test
Paternity Leave And Postpartum Depression
HKJGOM 2015; 15(2) 193
Variable EPDS score <10 EPDS score ≥10 Total p Value†
Maternal age (years) 31.2 ± 4.8 31.2 ± 4.9 31.2 ± 4.8 0.73
Maternal age-group (years) 0.99
<18 1 (0.3) 0 1 (0.2)
18-24 25 (8.6) 11 (8.3) 36 (8.5)
25-34 190 (65.5) 87 (65.4) 277 (65.5)
≥35 74 (25.5) 35 (26.3) 109 (25.8)
Parity 0.6 ± 0.8 0.6 ± 0.8 0.6 ± 0.8 0.64
Marital status 0.44
Cohabitation 13 (4.5) 7 (5.3) 20 (4.7)
Married 273 (94.1) 122 (91.7) 395 (93.4)
Divorced / single 4 (1.4) 4 (3.0) 8 (1.9)
Duration of stay in Hong Kong category 1 (years) 0.03
0-1 Year 11 (3.8) 3 (2.3) 14 (3.3)
2-5 Years 24 (8.3) 24 (18.2) 48 (11.4)
6-9 Years 12 (4.2) 7 (5.3) 19 (4.5)
≥10 Years 241 (83.7) 98 (74.2) 339 (80.7)
Duration of stay in Hong Kong category 2 (years) 0.04
0-5 Years 35 (12.2) 27 (20.5) 62 (14.8)
≥6 Years 253 (87.8) 105 (79.5) 358 (85.2)
Duration of stay in Hong Kong category 3 (years) 0.03
0-9 Years 47 (16.3) 34 (25.8) 81 (19.3)
≥10 Years 241 (83.7) 98 (74.2) 339 (80.7)
Duration of stay in Hong Kong category 4 (years) 0.01
2-5 Years 24 (8.3) 24 (18.2) 48 (11.4)
Others 264 (91.7) 108 (81.8) 372 (88.6)
Work status 0.19
Full-time work 155 (53.4) 63 (47.4) 218 (51.5)
Part-time work 12 (4.1) 2 (1.5) 14 (3.3)
Housewife 121 (41.7) 68 (51.1) 189 (44.7)
Others 2 (0.7) 0 2 (0.5)
Education level 0.24
Primary school 1 (0.3) 3 (2.3) 4 (0.9)
Secondary school 204 (70.3) 89 (66.9) 293 (69.3)
Forms 6-7 22 (7.6) 8 (6.0) 30 (7.1)
Tertiary or above 63 (21.7) 33 (24.8) 96 (22.7)
Table 3. Maternal age, parity, marital status, duration of stay in Hong Kong, work status, and education level of respondents with and without postpartum depression and paternity leave*
Abbreviation: EPDS = Edinburgh Postnatal Depression Scale* Data are shown as No. (%) of subjects or mean ± standard deviation. A minority of subjects did not answer all questions in
the survey, hence the total number of subjects for each item may vary† For continuous variables, p values were obtained from Mann-Whitney U test. For discrete variables, p values were obtained
from Fisher’s exact test

KW HO et al
HKJGOM 2015; 15(2)194
Variable With paternity leave
Without paternity leave
Total p Value†
Maternal age (years) 31.4 ± 4.6 31.0 ± 5.1 31.2 ± 4.8 0.51
Maternal age-group (years)
<18 0 1 (0.6) 1 (0.2)
18-24 21 (8.0) 15 (9.2) 36 (8.5)
25-34 171 (65.5) 107 (65.6) 278 (65.6)
≥35 69 (26.4) 40 (24.5) 109 (25.7)
Parity 0.6 ± 0.8 0.7 ± 0.8 0.6 ± 0.8 0.07
Marital status category 1 0.02
Cohabitation 13 (5.0) 7 (4.3) 20 (4.7)
Married 247 (94.6) 149 (91.4) 396 (93.4)
Divorced / single 1 (0.4) 7 (4.3) 8 (1.9)
Marital status category 2 0.01
Cohabitation / married 260 (99.6) 156 (95.7) 416 (98.1)
Divorced / single 1 (0.4) 7 (4.3) 8 (1.9)
Duration of stay in Hong Kong category 1 (years) <0.001
0-1 Year 6 (2.3) 8 (5.0) 14 (3.3)
2-5 Years 18 (6.9) 30 (18.6) 48 (11.4)
6-9 Years 8 (3.1) 11 (6.8) 19 (4.5)
≥10 Years 228 (87.7) 112 (69.6) 340 (80.8)
Duration of stay in Hong Kong category 2 (years) <0.001
0-5 Years 24 (9.2) 38 (23.6) 62 (14.7)
≥6 Years 236 (90.8) 123 (76.4) 359 (85.3)
Duration of stay in Hong Kong category 3 (years) <0.001
0-9 Years 32 (12.3) 49 (30.4) 81 (19.2)
≥10 Years 228 (87.7) 112 (69.6) 340 (80.8)
Duration of stay in Hong Kong category 4 (years) <0.001
2-5 Years 18 (6.9) 30 (18.6) 48 (11.4)
Others 242 (93.1) 131 (81.4) 373 (88.6)
Work status <0.001
Full-time work 156 (59.8) 63 (38.7) 219 (51.7)
Part-time work 10 (3.8) 4 (2.5) 14 (3.3)
Housewife 94 (36.0) 95 (58.3) 189 (44.6)
Others 1 (0.4) 1 (0.6) 2 (0.5)
Education level <0.001
Primary school 1 (0.4) 3 (1.8) 4 (0.9)
Secondary school 160 (61.3) 134 (82.2) 294 (69.3)
Forms 6-7 23 (8.8) 7 (4.3) 30 (7.1)
Tertiary or above 77 (29.5) 19 (11.7) 96 (22.6)
Table 3. (cont’d)

Paternity Leave And Postpartum Depression
HKJGOM 2015; 15(2) 195
Variable EPDS score <10 EPDS score ≥10 Total p Value†
Family income category 1‡ (HK$) 0.03
<10,000 25 (8.7) 21 (15.8) 46 (11.0)
10,000-29,999 168 (58.5) 81 (60.9) 249 (59.3)
30,000-49,999 78 (27.2) 22 (16.5) 100 (23.8)
≥50,000 16 (5.6) 9 (6.8) 25 (6.0)
Family income category 2‡ (HK$) 0.04
<10,000 25 (8.7) 21 (15.8) 46 (11.0)
≥10,000 262 (91.3) 112 (84.2) 374 (89.0)
Living environment 0.31
Owned private housing 97 (33.9) 37 (28.0) 134 (32.1)
Rented private housing 44 (15.4) 22 (16.7) 66 (15.8)
A part of rented private housing 3 (1.0) 6 (4.5) 9 (2.2)
Owned public housing 39 (13.6) 14 (10.6) 53 (12.7)
Rented public housing 87 (30.4) 45 (34.1) 132 (31.6)
Temporary housing 4 (1.4) 2 (1.5) 6 (1.4)
Others 12 (4.2) 6 (4.5) 18 (4.3)
Economic support 0.08
No 284 (99.3) 129 (97.0) 413 (98.6)
Yes 2 (0.7) 4 (3.0) 6 (1.4)
Household size 3.0 ± 1.6 2.9 ± 1.8 3.0 ± 1.7 0.15
No. of existing children 0.8 ± 0.8 0.7 ± 0.9 0.7 ± 0.8 0.68
Living with parents 0.74
No 251 (87.8) 119 (89.5) 370 (88.3)
Yes 35 (12.2) 14 (10.5) 49 (11.7)
Living with parents-in-law 1.00
No 212 (74.1) 99 (74.4) 311 (74.2)
Yes 74 (25.9) 34 (25.6) 108 (25.8)
Helper availability 0.17
No 213 (74.7) 108 (81.2) 321 (76.8)
Yes 72 (25.3) 25 (18.8) 97 (23.2)
Planned pregnancy 0.26
No 81 (28.3) 45 (33.8) 126 (30.1)
Yes 205 (71.7) 88 (66.2) 293 (69.9)
Partner disappointment with the baby’s gender 0.30
No 276 (96.5) 125 (94.0) 401 (95.7)
Yes 10 (3.5) 8 (6.0) 18 (4.3)
Table 4. Demographics of household of respondents with and without postpartum depression and paternity leave*
Abbreviation: EPDS = Edinburgh Postnatal Depression Scale* Data are shown as No. (%) of subjects or mean ± standard deviation. A minority of subjects did not answer all questions in
the survey, hence the total number of subjects for each item may vary† For continuous variables, p values were obtained from Mann-Whitney U test. For discrete variables, p values were obtained
from Fisher’s exact test ‡ Family income was grouped into two categories, including 4 subgroups as category 1 and 2 subgroups as category 2

KW HO et al
HKJGOM 2015; 15(2)196
Variable With paternity leave
Without paternity leave
Total p Value†
Family income category 1‡ (HK$) <0.001
<10,000 14 (5.4) 32 (20.0) 46 (10.9)
10,000-29,999 146 (55.9) 103 (64.4) 249 (59.1)
30,000-49,999 78 (29.9) 22 (13.8) 100 (23.8)
≥50,000 23 (8.8) 3 (1.9) 26 (6.2)
Family income category 2‡ (HK$) <0.001
<10,000 14 (5.4) 32 (20.0) 46 (10.9)
≥10,000 247 (94.6) 128 (80.0) 375 (89.1)
Living environment <0.001
Owned private housing 99 (38.4) 36 (22.4) 135 (32.2)
Rented private housing 41 (15.9) 25 (15.5) 66 (15.8)
A part of rented private housing 3 (1.2) 6 (3.7) 9 (2.1)
Owned public housing 36 (14.0) 17 (10.6) 53 (12.6)
Rented public housing 67 (26.0) 65 (40.4) 132 (31.5)
Temporary housing 1 (0.4) 5 (3.1) 6 (1.4)
Others 11 (4.3) 7 (4.3) 18 (4.3)
Economic support 0.21
No 256 (99.2) 158 (97.5) 414 (98.6)
Yes 2 (0.8) 4 (2.5) 6 (1.4)
Household size 2.8 ± 1.6 3.2 ± 1.8 3.0 ± 1.7 0.04
No. of existing children 0.7 ± 0.8 0.9 ± 0.9 0.7 ± 0.8 0.01
Living with parents 0.21
No 232 (89.9) 139 (85.8) 371 (88.3)
Yes 26 (10.1) 23 (14.2) 49 (11.7)
Living with parents-in-law 0.49
No 195 (75.6) 117 (72.2) 312 (74.3)
Yes 63 (24.4) 45 (27.8) 108 (25.7)
Helper availability 0.02
No 188 (72.9) 134 (83.2) 322 (76.8)
Yes 70 (27.1) 27 (16.8) 97 (23.2)
Planned pregnancy 0.002
No 63 (24.4) 63 (38.9) 126 (30.0)
Yes 195 (75.6) 99 (61.1) 294 (70.0)
Partner disappointment with the baby’s gender 0.81
No 246 (95.3) 156 (96.3) 402 (95.7)
Yes 12 (4.7) 6 (3.7) 18 (4.3)
Table 4. (cont’d)

Paternity Leave And Postpartum Depression
HKJGOM 2015; 15(2) 197
Table 5. MSPSS score with and without postpartum depression and paternity leave*
Abbreviations: EPDS = Edinburgh Postnatal Depression Scale; MSPSS = Multidimensional Scale of Perceived Social Support; time 1 = first survey; time 2 = second survey* Data are shown as mean ± standard deviation† For continuous variables, p values were obtained from Mann-Whitney U test. For discrete variables, p values were obtained
from Fisher’s exact test
Table 6. Rating of paternal involvement with and without postpartum depression and paternity leave*
Abbreviation: EPDS = Edinburgh Postnatal Depression Scale* Data are shown as mean ± standard deviation, unless otherwise specified† For continuous variables, p values were obtained from Mann-Whitney U test. For discrete variables, p values were obtained
from Fisher’s exact test
Variable EPDS score <10 EPDS score ≥10 Overall p Value†
MSPSS score at time 1 71.5 ± 12.9 65.3 ± 15.1 69.5 ± 13.9 <0.001MSPSS score at time 2 69.6 ± 13.0 60.0 ± 16.9 66.6 ± 15.0 <0.001Variable With paternity leave Without paternity
leaveOverall p Value†
MSPSS score at time 1 69.7 ± 13.4 69.2 ± 14.7 69.5 ± 13.9 0.94MSPSS score at time 2 67.2 ± 14.6 65.8 ± 15.7 66.6 ± 15.0 0.48Correlation Overall EPDS score at time 1 ≥10
Change in EPDS score p Value Change in EPDS score p Value†
MSPSS score at time 2 -0.146 0.003 -0.197 0.02
Variable EPDS score <10 EPDS score ≥10 Overall p Value†
Paternal involvement in baby care 12.1 ± 3.9 10.8 ± 4.0 11.7 ± 3.9 0.001Taking care of the baby 3.2 ± 1.0 3.0 ± 1.0 3.1 ± 1.0 0.04Changing clothes and napkins 2.9 ± 1.2 2.6 ± 1.3 2.8 ± 1.3 0.002Playing with the baby 3.4 ± 0.9 3.1 ± 1.0 3.3 ± 0.9 0.002Taking care of the baby alone 2.6 ± 1.3 2.2 ± 1.3 2.5 ± 1.3 0.003Variable With paternity leave Without paternity
leaveOverall p Value†
Paternal involvement in baby care 12.3 ± 3.5 10.8 ± 4.4 11.7 ± 3.9 0.001Taking care of the baby 3.3 ± 0.9 2.9 ± 1.1 3.1 ± 1.0 0.001Changing clothes and napkins 3.0 ± 1.1 2.5 ± 1.4 2.8 ± 1.3 0.002Playing with the baby 3.4 ± 0.8 3.1 ± 1.0 3.3 ± 0.9 0.01Taking care of the baby alone 2.6 ± 1.2 2.2 ± 1.4 2.5 ± 1.3 0.01Correlation Overall EPDS score at time 1 ≥10
Change in EPDS score
p Value Change in EPDS score
p Value†
Paternal involvement in baby care -0.177 <0.001 -0.344 <0.001Taking care of the baby -0.160 0.001 -0.306 <0.001Changing clothes and napkins -0.155 0.002 -0.314 <0.001Playing with the baby -0.185 <0.001 -0.429 <0.001Taking care of the baby alone -0.130 0.01 -0.189 0.03

KW HO et al
HKJGOM 2015; 15(2)198
Variable EPDS score <10 EPDS score ≥10 Total p Value†
Gestation at delivery 0.23<28 Weeks 1 (0.3) 0 1 (0.2)28-31+ Weeks 1 (0.3) 1 (0.8) 2 (0.5)32-33+ Weeks 3 (1.0) 1 (0.8) 4 (0.9)34-36+ Weeks 17 (5.9) 15 (11.3) 32 (7.6) 37-41+ Weeks 268 (92.4) 116 (87.2) 384 (90.8)
Mode of delivery 0.84Normal spontaneous delivery 182 (62.8) 82 (61.7) 264 (62.4)Assisted vaginal delivery 26 (9.0) 15 (11.3) 41 (9.7)Elective Caesarean section 27 (9.3) 10 (7.5) 37 (8.7)Emergency Caesarean section 55 (19.0) 26 (19.5) 81 (19.1)
Partner companionship during labour 0.11No 125 (46.6) 70 (55.6) 195 (49.5)Yes 143 (53.4) 56 (44.4) 199 (50.5)
History of medical illness 0.45No 252 (86.9) 112 (84.2) 364 (86.1)Yes 38 (13.1) 21 (15.8) 59 (13.9)
History of psychiatric illness 1.00No 271 (93.4) 124 (93.2) 395 (93.4)Yes 19 (6.6) 9 (6.8) 28 (6.6)
Obstetric complications 0.47No 149 (51.4) 63 (47.4) 212 (50.1)Yes 141 (48.6) 70 (52.6) 211 (49.9)
Neonatal complications 0.11No 228 (78.6) 95 (71.4) 323 (76.4)Yes 62 (21.4) 38 (28.6) 100 (23.6)
Variable With paternity leave Without paternity leave Total p Value†
Gestation at delivery 0.22<28 Weeks 1 (0.4) 0 1 (0.2)28-31+ Weeks 1 (0.4) 1 (0.6) 2 (0.5)32-33+ Weeks 4 (1.5) 0 4 (0.9)34-36+ Weeks 16 (6.1) 16 (9.8) 32 (7.5) 37-41+ Weeks 239 (91.6) 146 (89.6) 385 (90.8)
Mode of delivery 0.10Normal spontaneous delivery 155 (59.4) 110 (67.5) 265 (62.5) Assisted vaginal delivery 24 (9.2) 17 (10.4) 41 (9.7)Elective Caesarean section 29 (11.1) 8 (4.9) 37 (8.7)Emergency Caesarean section 53 (20.3) 28 (17.2) 81 (19.1)
Partner companionship during labour 0.01No 108 (44.1) 87 (58.0) 195 (49.4) Yes 137 (55.9) 63 (42.0) 200 (50.6)
History of medical illness 0.39No 228 (87.4) 137 (84.0) 365 (86.1) Yes 33 (12.6) 26 (16.0) 59 (13.9)
History of psychiatric illness 0.55No 242 (92.7) 154 (94.5) 396 (93.4) Yes 19 (7.3) 9 (5.5) 28 (6.6)
Obstetric complications 0.23No 125 (47.9) 88 (54.0) 213 (50.2) Yes 136 (52.1) 75 (46.0) 211 (49.8)
Neonatal complications 0.91No 200 (76.6) 124 (76.1) 324 (76.4) Yes 61 (23.4) 39 (23.9) 100 (23.6)
Table 7. Obstetric characteristics and co-morbidities of respondents*
Abbreviation: EPDS = Edinburgh Postnatal Depression Scale* Data are shown as No. (%) of subjects. A minority of subjects did not answer all questions in the survey, hence the total
number of subjects for each item may vary† For continuous variables, p values were obtained from Mann-Whitney U test. For discrete variables, p values were obtained
from Fisher’s exact test

Paternity Leave And Postpartum Depression
HKJGOM 2015; 15(2) 199
Obstetric complications, neonatal complications, and a history of psychiatric illness were not shown to be statistically significant risk factors for postpartum depression in this study (Table 7). Nonetheless all obstetric and neonatal complications and a history of psychiatric illnesses (after exclusion of active psychiatric illness) were included, and their nature and severity were not further categorised or studied. Therefore, the effects of severe complications and a history of major psychiatric illness might be lessened by the inclusion of minor conditions in the analysis.
Consistent with previous studies2,10,11, paternal involvement in baby care and high MSPSS scores at time 1 and time 2 were shown to be protective against postpartum depression (Tables 5 and 6). This highlights the importance of encouraging paternal involvement and social support in the postpartum period. Our result was limited by the use of a non-validated questionnaire for the mother to rate paternal involvement in baby care. Women with postpartum depression might perceive their partners to be less supportive than others7. This could affect the correlation between maternal perception of paternal involvement and actual paternal involvement. The reduced paternal involvement demonstrated in women with postpartum depression could be attributable to bias in maternal perception.
Consistent with the studies by Séjourné et al10,11 in France, our study did not demonstrate any significant effect of paternity leave on postpartum depression in Hong Kong Chinese (Table 2). This could not be attributed to the limited duration of paternity leave, as there was no difference in the mean duration of paternity leave between those with or without postpartum depression. Hence, we did not stratify the duration of paternity leave for further analysis. It is possible that some paternity leave was taken in response to the development of maternal depressive symptoms in the postpartum period. This might offset the possible reduction in postpartum depression caused by longer paternity leave taken in the absence of depressive symptoms.
Although it was shown that those with paternity leave experienced higher paternal involvement, and that higher paternal involvement was associated with a lower risk of developing postpartum depression (Table 6), the magnitude of the association might be small. This might explain why this study failed to demonstrate any direct statistically significant effect of paternity leave on postpartum depression.
There were likely other factors associated with postpartum depression and paternity leave that were not addressed in this study. Such confounding factors might include marital conflict, relationship problems with in-laws, active psychiatric illness such as antepartum depression, and severe obstetric or neonatal complications. The sample size of this study may also not have been sufficiently large to demonstrate the ‘small’ effect in the presence of confounding factors.
Actual paternal involvement in maternal and neonatal care might be more important in the prevention of maternal postpartum depression than paternity leave per se. The provision of paternity leave did not necessarily lead to increased paternal involvement. Differences in the fathers’ motivation for taking paternity leave, which was not explored in our study, might lead to differences in paternal support for the mother and newborn.
Given the positive effects of paternity leave on paternal involvement, we consider paternity leave to be a desirable component of postpartum care. In addition, our study showed that paternity leave was positively associated with partner companionship during labour (Table 7). Previous studies19 have shown that partner companionship is associated with better maternal satisfaction and obstetric outcomes.
Strengths and Limitations To our knowledge, this is the first study to examine the effects of paternity leave on postpartum depression in Hong Kong women. Its strengths included the large sample size, reasonably high response rate, prospective design, and use of validated instruments.
It might not be appropriate to extrapolate the results of our study to all Chinese women in Hong Kong. Socio-demographic characteristics of the obstetric population vary across Hong Kong18 and this study was conducted in one regional hospital only. One-third of the subjects did not respond to the second survey, and there were some demographic differences between respondents and non-respondents. Other limitations of this study included a lack of data on the fathers’ motivation for taking paternity leave, and the lack of an objective instrument to measure actual paternal involvement in baby care.
Conclusion Although paternity leave was associated with increased paternal involvement in baby care, which

KW HO et al
HKJGOM 2015; 15(2)200
References
1. Labour and Welfare Bureau. Study on legislating for the provision of paternity leave in Hong Kong. Paper presented to Legislative Council Panel on Manpower on 20 June 2012. LC Paper No. CB(2)2353/11-12(03).
2. Klainin P, Arthur DG. Postpartum depression in Asian cultures: a literature review. Int J Nurs Stud 2009; 46:1355-73.
3. Leiferman J. The effect of maternal depressive symptomatology on maternal behaviors associated with child health. Health Educ Behav 2002; 29:596-607.
4. O’Hara MW. The nature of postpartum disorders. In: Murray L, Cooper PJ, editors. Postpartum depression and child development. New York: Guilford Press 1997; 3-31.
5. Stemp PS, Turner RJ, Noh S. Psychological distress in the postpartum period: the significance of social support. J Marriage Fam 1986; 48:271-7.
6. Stein A, Cooper PJ, Campbell EA, Day A, Altham PM. Social adversity and perinatal complications: their relation to postnatal depression. BMJ 1989; 298:1073-4.
7. O’Hara MW. Social support, life events, and depression during pregnancy and the puerperium. Arch Gen Psychiatry 1986; 43:569-73.
8. Gotlib IH, Whiffen VE, Wallace PM, Mount JH. Prospective investigation of postpartum depression: factors involved in onset and recovery. J Abnorm Psychol 1991; 100:122-32.
9. Marks M, Wieck A, Checkley S, Kumar C. How does marriage protect women with histories of affective disorder from post-partum relapse? Br J Med Psychol 1996; 69:329-42.
10. Séjourné N, Beaumé M, Vaslot V, Chabrol H. Effect of paternity leave on maternal postpartum depression [in
French]. Gynecol Obstet Fertil 2012; 40:360-4.11. Séjourné N, Vaslot V, Beaumé M, Goutaudier N, Chabrol
H. The impact of paternity leave and paternal involvement in child care on maternal postpartum depression. J Reprod Infant Psychol 2012; 30:135-44.
12. Cox JL, Holden JM, Sagovsky R. Detection of postnatal depression. Development of the 10-item Edinburgh Postnatal Depression Scale. Br J Psychiatry 1987; 150:782-6.
13. Lee DT, Yip SK, Chiu HF, et al. Detecting postnatal depression in Chinese women. Validation of the Chinese version of the Edinburgh Postnatal Depression Scale. Br J Psychiatry 1998; 172:433-7.
14. Zimet GD, Dahlem NW, Zimet SG, Farley GK. The Multidimensional Scale of Perceived Social Support. J Pers Assess 1988; 52:30-41.
15. Chou KL. Assessing Chinese adolescents’ social support: the Multidimensional Scale of Perceived Social Support. Pers Individ Dif 2000; 28:299-307.
16. Lee DT, Yip AS, Leung TY, Chung TK. Identifying women at risk of postnatal depression: prospective longitudinal study. Hong Kong Med J 2000; 6:349-54.
17. Naing L, Winn T, Rusli BN. Practical issues in calculating the sample size for prevalence studies. Arch Orofac Sci 2006; 1:9-14.
18. Tiwari A, Chan KL, Fong D, et al. A territory-wide survey on intimate partner violence among pregnant women in Hong Kong. Hong Kong J Gynaecol Obstet Midwifery 2007; 7:7-15.
19. Hodnett ED, Gates S, Hofmeyr GJ, Sakala C. Continuous support for women during childbirth. Cochrane Database Syst Rev 2012;(10):CD003766.
was in turn associated with a reduced risk of developing postpartum depression, paternity leave had no statistically significant direct effect on the prevalence of maternal postpartum depression. Our study highlights the importance of paternal involvement and social support in the prevention of postpartum depression.
Future research may explore the timing and duration of and motivation for paternity leave to clarify its relationship with postpartum depression. Data on known risk factors for postpartum depression such as antepartum depression and marital conflict2 may be collected to study the effects of paternity leave on high-risk women who are
especially in need of family support. Future research may also study other possible beneficial effects of paternity leave, for example, its influence on breastfeeding rate.
Acknowledgements The authors are grateful to all the mothers who took valuable time from their families to complete the surveys, and to the midwives of our postnatal wards for their dedicated work. We would like to thank Dr Yat Chow (Department of Psychiatry, Kwai Chung Hospital) for his comments on the manuscript, and Mr Jaden Lam (Quality and Safety Division, Tuen Mun Hospital) for his advice and statistical support.