Effects of On-Site PV Generation and Residential Demand ...
13
applied sciences Article Effects of On-Site PV Generation and Residential Demand Response on Distribution System Reliability Sıtkı Güner 1 , Ay¸ se Kübra Ereno ˘ glu 2 , ˙ Ibrahim ¸ Sengör 3 , Ozan Erdinç 2 and João P. S. Catalão 4, * 1 Department of Electrical and Electronics Engineering, Faculty of Engineering and Architecture, Istanbul Arel University, Tepekent-Buyukcekmece, 34537 Istanbul, Turkey; [email protected] 2 Department of Electrical Engineering, Faculty of Electric-Electronics, Yildiz Technical University Davutpasa Campus, Esenler, 34220 Istanbul, Turkey; [email protected] (A.K.E.); [email protected] (O.E.) 3 Department of Electrical and Electronics Engineering, Faculty of Engineering and Architecture, Izmir Katip Çelebi University, Çi˘ gli, 35620 Izmir, Turkey; [email protected] 4 Faculty of Engineering of the University of Porto and INESC TEC, 4200-465 Porto, Portugal * Correspondence: [email protected] Received: 23 August 2020; Accepted: 3 October 2020; Published: 12 October 2020 Abstract: In the last few decades, there has been a strong trend towards integrating renewable-based distributed generation systems into the power grid, and advanced management strategies have been developed in order to provide a reliable, resilient, economic, and sustainable operation. Moreover, demand response (DR) programs, by taking the advantage of flexible loads’ energy reduction capabilities, have presented as a promising solution considering reliability issues. Therefore, the impacts of combined system architecture with on-site photovoltaic (PV) generation units and residential demand reduction strategies were taken into consideration on distribution system reliability indices in this study. The load model of this study was created by using load data of the distribution feeder provided by Bosphorus Electric Distribution Corporation (BEDAS). Additionally, the reliability parameters of the feeder components were determined based on these provided data. The calculated load point and feeder side indicators were analyzed comprehensively from technical and economic perspectives. In order to validate the effectiveness of the proposed structure, four case studies were carried out in both DigSILENT PowerFactory and MATLAB environments. Keywords: distribution system; PV generation; reliability; residential demand response programs 1. Introduction 1.1. Motivation and Background Power system reliability can be evaluated as one of the most important factors in the operation, planning, and design process of the utility network and sometimes state-regulated area. This complicated architecture including numerous different types of loads, transformers, substations, switching components, and long transmission lines targets to supply hundreds of millions of electricity consumers’ daily needs in a reliable fashion. The North American Electric Reliability Corporation (NERC), one of the most widely-known institutions, has provided a definition for reliability as [1]“the ability to meet the electricity needs of end-use customers even when unexpected equipment failures or other factors reduce the amount of available electricity”. Additionally, from European energy providers’ viewpoint, European Network of Transmission System Operators (ENTSO-E) provided the widely-known definition as “a general term encompassing all the measures of the ability of the system, Appl. Sci. 2020, 10, 7062; doi:10.3390/app10207062 www.mdpi.com/journal/applsci
Transcript of Effects of On-Site PV Generation and Residential Demand ...

applied sciences
Article
Effects of On-Site PV Generation and ResidentialDemand Response on Distribution System Reliability
Sıtkı Güner 1 , Ayse Kübra Erenoglu 2, Ibrahim Sengör 3 , Ozan Erdinç 2 andJoão P. S. Catalão 4,*
1 Department of Electrical and Electronics Engineering, Faculty of Engineering and Architecture,Istanbul Arel University, Tepekent-Buyukcekmece, 34537 Istanbul, Turkey; [email protected]
2 Department of Electrical Engineering, Faculty of Electric-Electronics, Yildiz Technical UniversityDavutpasa Campus, Esenler, 34220 Istanbul, Turkey; [email protected] (A.K.E.);[email protected] (O.E.)
3 Department of Electrical and Electronics Engineering, Faculty of Engineering and Architecture, Izmir KatipÇelebi University, Çigli, 35620 Izmir, Turkey; [email protected]
4 Faculty of Engineering of the University of Porto and INESC TEC, 4200-465 Porto, Portugal* Correspondence: [email protected]
Received: 23 August 2020; Accepted: 3 October 2020; Published: 12 October 2020�����������������
Abstract: In the last few decades, there has been a strong trend towards integrating renewable-baseddistributed generation systems into the power grid, and advanced management strategies havebeen developed in order to provide a reliable, resilient, economic, and sustainable operation.Moreover, demand response (DR) programs, by taking the advantage of flexible loads’ energyreduction capabilities, have presented as a promising solution considering reliability issues. Therefore,the impacts of combined system architecture with on-site photovoltaic (PV) generation units andresidential demand reduction strategies were taken into consideration on distribution system reliabilityindices in this study. The load model of this study was created by using load data of the distributionfeeder provided by Bosphorus Electric Distribution Corporation (BEDAS). Additionally, the reliabilityparameters of the feeder components were determined based on these provided data. The calculatedload point and feeder side indicators were analyzed comprehensively from technical and economicperspectives. In order to validate the effectiveness of the proposed structure, four case studies werecarried out in both DigSILENT PowerFactory and MATLAB environments.
Keywords: distribution system; PV generation; reliability; residential demand response programs
1. Introduction
1.1. Motivation and Background
Power system reliability can be evaluated as one of the most important factors in the operation,planning, and design process of the utility network and sometimes state-regulated area.This complicated architecture including numerous different types of loads, transformers, substations,switching components, and long transmission lines targets to supply hundreds of millions ofelectricity consumers’ daily needs in a reliable fashion. The North American Electric ReliabilityCorporation (NERC), one of the most widely-known institutions, has provided a definition forreliability as [1] “the ability to meet the electricity needs of end-use customers even when unexpected equipmentfailures or other factors reduce the amount of available electricity”. Additionally, from European energyproviders’ viewpoint, European Network of Transmission System Operators (ENTSO-E) providedthe widely-known definition as “a general term encompassing all the measures of the ability of the system,
Appl. Sci. 2020, 10, 7062; doi:10.3390/app10207062 www.mdpi.com/journal/applsci

Appl. Sci. 2020, 10, 7062 2 of 13
generally given as numerical indices, to deliver electricity to all points of utilization within acceptable standardsand in the amounts desired” [1].
Recently, increasing environmental concerns and growing demand paved the way for expandingthe portion of renewable-based energy systems on the generation side, ensuring reliable, sustainable,and resilient power grid operation [2]. In order to reduce greenhouse gas emissions, there havebeen great attempts and incentives within the context of signing protocols by most of the countries.Among them, Malta and Sweden target to increase the installed renewable energy resources (RESs)capacity respectively by 10% and 49% [3]. The European Council has agreed on the 2030 climate andenergy framework, including targets and policy objectives. Particularly, reducing greenhouse gasemission at least by 40% compared to the level of 1990, increasing renewable energy consumption rate atleast 32%, and improving energy efficiency level by 32.5% are the key targets for 2030 [4]. According tothe Renewable Energy Roadmap (Remap) 2030 [5], the world’s biggest energy consumer, China,is aiming to increase the share of renewables in the power sector from 20% to 40% by 2030. It is obviousthat it requires a market reform as well as significant growth in transmission and grid capacity.
There are many types of renewable energy resources in the energy sector, such as wind, solar,hydro, and biomass [5]. Among them, photovoltaic (PV) generation is accepted as one of the mostprominent sources, and its globally installed capacity is increasing day by day considering technologicaldevelopments and economic achievements, especially for implementing at the scale of distributedgeneration (DG). This green resource can be installed at a large-scale in utility facilities or at a small-scaleat the end-users’ premises with the aim of meeting the local demand. It is to be highlighted thatgrid-connected units can play a key role in system operation, especially in case of failures in any partof the system and in providing reliability improvement by decreasing unsupplied power.
From the other perspective, demand side has also witnessed spectacular changes in its architecture,e.g., prosumers (consumers also with on-site production facilities) with flexible loads are stronglyencouraged to alter their load profiles for the purpose of accomplishing particular objectives suchas load leveling, reliability enhancement, and voltage regulation within the paradigm of smart grid.Unlike the conventional network operation in which expanding generating capacity means to increasereserve margin and reliability factor [6], modern structure turns its perspective from the power supplyside to the demand side. A conceptual definition of demand response (DR) by US Energy InformationAdministration viewpoint is as follows: “Demand-side management (DSM) programs consist of the planning,implementing, and monitoring activities of electric utilities which are designed to encourage consumers to modifytheir level and pattern of electricity usage” [7]. It is worthy to indicate that new approaches play a criticalrole in electrical system planning while considering its sophisticated structure, and the last decade hasseen a growing trend towards incorporating DR strategies into operational stages to increase networkperformance and quality of services. Here, smart households that can alter their internal operation in anoptimized way, especially if a home energy management system (HEM) exists, have further capabilityto enhance effective implementation of residential DR, which is an area where more implementationshave been provided recently.
1.2. Literature Review
In recent years, integrating modular RESs into the power system as well as demand sidemanagement implementations have been widely investigated in the literature to cope with reliabilityissues and increase the quality of services. In this respect, Yoo et al. [6] proposed a reliability-basedDR program in which traditional DR programs such as summer vacation period DR program,direct load control, and demand bidding were reconstructed considering the system requirements.The presented structure consisting of consumer data management and program operation parts aidednetwork operation, especially in emergency conditions, by trading emergency DR resources instantly.
Wu et al. [8] examined the effect of aggregated electric water heaters (EWHs) DR capabilityand their load shifting performance analysis, especially in peak hours for the purpose of achievingreliability improvement. According to the results, it should be highlighted that the reliability indices

Appl. Sci. 2020, 10, 7062 3 of 13
were enhanced thanks to the provided certain amount of operating reserve by aggregated EWHs.The optimization-based strategy also aimed to reduce end-users’ total cost while maintaining thecomfort levels. In order to improve the reliability indices in modern power systems, controllable demandsources were taken into consideration in [9] as an alternative for extra generation (reserves). On theother hand, DR implementation affects the generating system reliability. In [10], the short-term reliabilitymodel of DR capacity was proposed using a multi-state continuous-time Markov chain model.
A stochastic security constrained scheduling approach integrating DR model was presentedin [11] with the objective of determining an optimal strategy for the independent system operatorconsidering market conditions, system security, and reliability needs as well as air pollution. Moreover,total operational cost was also aimed to be minimized by implementing an efficient DR programthrough mixed-integer linear programming. Goel et al. [12] conducted a study in which the effectsof stochastic demand side load shifting approach on electricity price volatility and reliability issueswere examined by using optimal power flow combined with some reliability evaluation techniques inrestructured power systems. Additionally, in [13], the impacts of real-time price-based DR applicationon system reliability were investigated by taking into account nodal price volatility and potentialDR resources. The optimal power system operation was guaranteed within the generation and thetransmission constraints. However, no attempt was made to investigate RES-based generating unit’simpact on the power grid reliability indices in studies [12,13].
Li et al. [14] created a model for a micro-grid including loads, distribution generators, and energystorage systems (ESSs) combined with possible DR strategies for reliability evaluation in a distributionsystem unlike the obsolete conventional methods. RES penetrations as well as charging/dischargingstrategies of ESSs were taken into consideration evaluating their impacts on the operational perspective.In order to validate the effectiveness of the proposed scheme, sequential Monte Carlo simulation andminimal path method were used.
The effects of the DR program on the reliability assessment of a microgrid was also studiedin [15] considering its complicated architecture. The authors in [16] presented a new bus weightingmethodology with the aim of optimizing system operation, especially in case of unfavorable weatherconditions or peak demand periods. It is significant to indicate that expected interruption costs weredecreased approximately by 20% thanks to the proposed framework, in which it is possible to distributethe total system’s DR requirement in critical loading events.
Su et al. [17] proposed a reliability assessment model considering aging period of conventionalpower equipment for determining reliability of the distribution network also including PV generation.In [18], the climate change effects were taken into account for assessing reliability of the PV integratedpower systems. Several positive and negative impacts of the roof-top PV systems on the reliability ofdistribution transformers were identified in [18]. The negative impacts of the roof-top PV systemsaccording to penetration level were presented in [19].
Hybrid systems usually increase power system reliability, and, in this manner, Raghuwanshi andArya [20] studied the impacts of hybrid systems having different combinations of diesel/PV/batterysystems on power system reliability. Markov model and frequency–duration (F–D) reliability techniqueswere used for assessing reliability indices, namely, loss of load probability (LOLP), expected energynot supplied (EENS), and mean downtime (MDT). In [21], optimum restoration strategies weregenerated together with the consideration of distribution system reliability assessment consideringhybrid renewable DG systems. A time-sequential Monte Carlo simulation was used for evaluatingdistribution system reliability in the mentioned study.
Cao et al. [22] examined the effects of wind power integration on the reliability assessment ofpower systems. The authors in [23] constructed a power system reliability model by taking highlyintegrated wind farms into account and analyzed the results by an IEEE-RTS79 based case studythrough Monte Carlo simulation technique. However, any types of DR programs combined with RESintegration under reliability assessment architecture were not considered in [22,23].

Appl. Sci. 2020, 10, 7062 4 of 13
1.3. Contributions and Organization of the Paper
A mathematical model for reliability indices improvement in power system architecture includingon-site PV generation and efficient DR strategies is proposed in this study. The main objective of thepropounded concept is to increase system reliability performances by reducing the impact of failureson end-users’ power supply during the critical day periods. The contributions of the study can bedetailed as follows:
• Both the management of DR and DG penetration are crucial tasks for the improvement ofdistribution system reliability; hence, this paper presents the contribution of both methods interms of reliability level of the system.
• The results of this study by modeling the distribution system and the PV generation unit withreal data may provide guidance for more effective integration of PV generation from reliabilityenhancement perspective.
The rest of paper is organized as follows: the relevant basic mathematical background of reliabilityindices is detailed in Section 2. Afterwards, Section 3 provides the declarations of case studies and thediscussion of results. Finally, concluding remarks and future work are presented in Section 4.
2. Reliability Assessment Approach
This part discusses the generally known facts regarding the reliability assessment for the sake of acomplete problem overview. One of the main targets of distribution system operators is to supplyend-users’ demand with acceptable continuation and power quality. However, it is sometimes possibleto interrupt large parts of the load point’s electrical demand due to small-scale faults in any equipmentsuch as lines, cables, transformers, breakers, switches, busbars, and relays.
Therefore, the measurements of outage rates and power interruption duration should be takeninto account in this sophisticated architecture to determine reliability performance standards [24].
Load point indices and system reliability indices are frequently used parameters [25] in the literaturethat are essential in planning, management, and operation stages from the master controller’s viewpoint.The fundamental below-mentioned criteria to calculate reliability performance of distribution feeder atthe load point are as follows [26]:
• Load point failure rate (λ)• The average outage time (r)• Average annual unavailability or outage (U)
The basic reliability parameters of a distribution system are described in Equations (1)–(3) inwhich i shows the index of the components that are assumed to be connected in series between thesource and the load point, in terms of failure.
λs =∑
i
λi (1)
Us �∑
i
λiri (2)
rs =Us
λs�
∑i λiri∑i λi
(3)
It is to be highlighted that load point indices have importance for individual end-users’ perspectivebut are not sufficient for evaluating the whole system performance. Therefore, system reliabilityindices are additionally used in this study by taking into account the number and the load of end-usersconnected at each load point in the system [27,28]. The most commonly used criteria for measuringdistribution system reliability performances are categorized into two parts as follows:

Appl. Sci. 2020, 10, 7062 5 of 13
2.1. Interruption Indices
System Average Interruption Frequency Index (SAIFI) and System Average Interruption DurationIndex (SAIDI) are the most widely used indices by utility companies in order to reach their targets interms of customer satisfaction, service restoration, and quality of services [29]. Throughout this study,these mentioned indicators are used for assessing the reliability improvements.
SAIFI gives the average number of interruptions per end-user per year in the system and can bedecreased by reducing outages at the load points [27]. SAIFI is represented as given in Equation (4)where i indicates load point, while Ni is the total number of end-users served.
SAIDI index is expressed in Equation (5) that means the average interruption duration per end-userexperienced during the year [30]. It is possible to achieve improvements in SAIDI by reducing failurerestoration times with effective crew management strategies.
SAIFI =∑
i λiNi∑i Ni
(4)
SAIDI =∑
i UiNi∑i Ni
(5)
2.2. Energy Oriented Indices
The most commonly used load-energy-oriented reliability criterion is the annual total energy notsupplied (ENS). There are also energy-oriented indices such as average energy not supplied (AENS)and average customer curtailment index (ACCI), but ENS is used to determine loss of load capacity ofthe distribution system in this study. This reliability indicator is formulated as in Equation (6), where Liindicates the demand at ith load point.
ENS =∑
i
UiLi (6)
3. Test and Results
3.1. Input Data of Distribution System
The network topology of the distribution system consisting of approximately 40% residential and60% commercial load is depicted in Figure 1. In this modified framework, daily load curves wereobtained from Bosphorus Electric Distribution Corporation (BEDAS) in which the feeder includednine load-points each having different consumption and transformers as 34.5/0.4 kV. There were 3503consumers included in the feeder. The connection between utility grid and feeder was also provided by154/34.5 kV transformer. In order to make realistic assumptions and observe the effect of PV power planton the reliability improvement, a prosumer (factory with on-site PV generation) was taken into accountas in LP9. The used real radiation data for PV generation were obtained from the National RenewableEnergy Laboratory (NREL) [31] by considering the latitude of the region and were normalized inaccordance with the ambient temperature. The evaluated radiation data are demonstrated in Figure 2and validated by comparison of those data with the relevant literature in [32,33]. It should be notedthat the radiation data may have changed according to the weather condition based on whether it wasa cloudy day or a sunny day. The power demand of load points was procured by both utility grid andPV energy supply unit for providing a reliable and sustainable network.

Appl. Sci. 2020, 10, 7062 6 of 13
Appl. Sci. 2020, 7, x FOR PEER REVIEW 6 of 12
households oriented concepts on system reliability improvement. The system reliability indices were calculated in DigSILENT PowerFactory and MATLAB environments by using the given parameters of distribution system components, as indicated in Table 1. In addition, load point interruption frequency (LPIF), load point interruption time (LPID), and load point energy not supplied (LPENS) criteria were also analyzed to evaluate the effects of PV based generation unit and DR on reliability from end-user standpoint.
Figure 1. General overview of the distribution system model for the test cases.
Figure 2. The used radiation data taken from National Renewable Energy Laboratory (NREL).
Figure 3. Daily load curve of the distribution feeder for winter.
0100200300400500600700800900
5:00
6:00
7:00
8:00
9:00
10:00
11:00
12:00
13:00
14:00
15:00
16:00
17:00
18:00
19:00
Radiati
on [w
/m2]
Time of the day
0102030405060708090
100
1:00
2:00
3:00
4:00
5:00
6:00
7:00
8:00
9:00
10:00
11:00
12:00
13:00
14:00
15:00
16:00
17:00
18:00
19:00
20:00
21:00
22:00
23:00 0:00
Loadin
g (%)
Time of the period
Figure 1. General overview of the distribution system model for the test cases.
Appl. Sci. 2020, 7, x FOR PEER REVIEW 6 of 12
households oriented concepts on system reliability improvement. The system reliability indices were calculated in DigSILENT PowerFactory and MATLAB environments by using the given parameters of distribution system components, as indicated in Table 1. In addition, load point interruption frequency (LPIF), load point interruption time (LPID), and load point energy not supplied (LPENS) criteria were also analyzed to evaluate the effects of PV based generation unit and DR on reliability from end-user standpoint.
Figure 1. General overview of the distribution system model for the test cases.
Figure 2. The used radiation data taken from National Renewable Energy Laboratory (NREL).
Figure 3. Daily load curve of the distribution feeder for winter.
0100200300400500600700800900
5:00
6:00
7:00
8:00
9:00
10:00
11:00
12:00
13:00
14:00
15:00
16:00
17:00
18:00
19:00
Radiati
on [w
/m2]
Time of the day
0102030405060708090
100
1:00
2:00
3:00
4:00
5:00
6:00
7:00
8:00
9:00
10:00
11:00
12:00
13:00
14:00
15:00
16:00
17:00
18:00
19:00
20:00
21:00
22:00
23:00 0:00
Loadin
g (%)
Time of the period
Figure 2. The used radiation data taken from National Renewable Energy Laboratory (NREL).
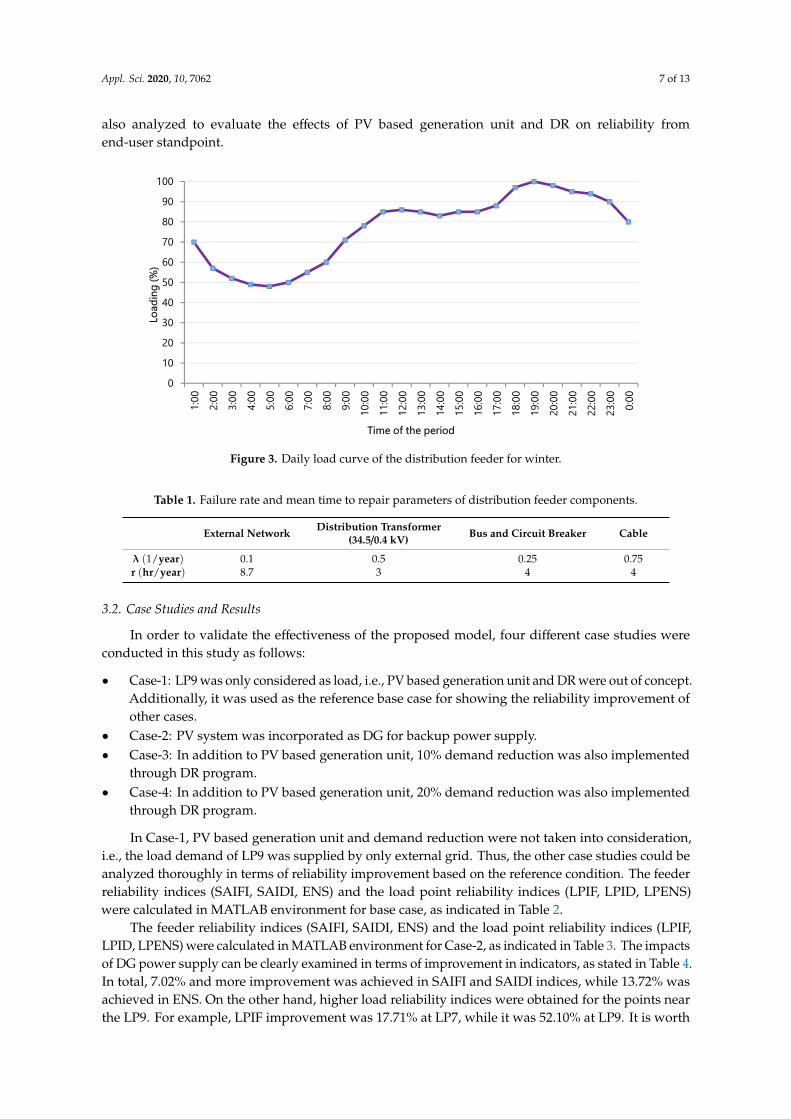
The daily load curve of the distribution feeder was obtained by using provided one year hourlyenergy consumption data from the distribution company. According to these raw data, the loadingpattern of every season on hourly basis was acquired. The peak values of the load curves were3.52 MVA, 2.93 MVA, and 2.40 MVA for winter, spring, and summer, respectively. The highest amountof consumption occurred in winter periods, and its characteristic was accordingly used in this studyfor modeling the loads, as shown in Figure 3.
A detailed study was carried out on the above mentioned radial distribution feeder for investigatingthe impacts of both incorporated PV plant and DR programs, including smart households orientedconcepts on system reliability improvement. The system reliability indices were calculated inDigSILENT PowerFactory and MATLAB environments by using the given parameters of distributionsystem components, as indicated in Table 1. In addition, load point interruption frequency (LPIF),load point interruption time (LPID), and load point energy not supplied (LPENS) criteria were
Appl. Sci. 2020, 10, 7062 7 of 13
also analyzed to evaluate the effects of PV based generation unit and DR on reliability fromend-user standpoint.
Appl. Sci. 2020, 7, x FOR PEER REVIEW 6 of 12
households oriented concepts on system reliability improvement. The system reliability indices were calculated in DigSILENT PowerFactory and MATLAB environments by using the given parameters of distribution system components, as indicated in Table 1. In addition, load point interruption frequency (LPIF), load point interruption time (LPID), and load point energy not supplied (LPENS) criteria were also analyzed to evaluate the effects of PV based generation unit and DR on reliability from end-user standpoint.
Figure 1. General overview of the distribution system model for the test cases.
Figure 2. The used radiation data taken from National Renewable Energy Laboratory (NREL).
Figure 3. Daily load curve of the distribution feeder for winter.
0100200300400500600700800900
5:00
6:00
7:00
8:00
9:00
10:00
11:00
12:00
13:00
14:00
15:00
16:00
17:00
18:00
19:00
Radiati
on [w
/m2]
Time of the day
0102030405060708090
1001:0
02:0
03:0
04:0
05:0
06:0
07:0
08:0
09:0
010:
0011:
0012:
0013:
0014:
0015:
0016:
0017:
0018:
0019:
0020:
0021:
0022:
0023:
00 0:00
Loadin
g (%)
Time of the periodFigure 3. Daily load curve of the distribution feeder for winter.
Table 1. Failure rate and mean time to repair parameters of distribution feeder components.
External Network Distribution Transformer(34.5/0.4 kV) Bus and Circuit Breaker Cable
λ (1/year) 0.1 0.5 0.25 0.75r (hr/year) 8.7 3 4 4
3.2. Case Studies and Results
In order to validate the effectiveness of the proposed model, four different case studies wereconducted in this study as follows:
• Case-1: LP9 was only considered as load, i.e., PV based generation unit and DR were out of concept.Additionally, it was used as the reference base case for showing the reliability improvement ofother cases.
• Case-2: PV system was incorporated as DG for backup power supply.• Case-3: In addition to PV based generation unit, 10% demand reduction was also implemented
through DR program.• Case-4: In addition to PV based generation unit, 20% demand reduction was also implemented
through DR program.
In Case-1, PV based generation unit and demand reduction were not taken into consideration,i.e., the load demand of LP9 was supplied by only external grid. Thus, the other case studies could beanalyzed thoroughly in terms of reliability improvement based on the reference condition. The feederreliability indices (SAIFI, SAIDI, ENS) and the load point reliability indices (LPIF, LPID, LPENS)were calculated in MATLAB environment for base case, as indicated in Table 2.
The feeder reliability indices (SAIFI, SAIDI, ENS) and the load point reliability indices (LPIF,LPID, LPENS) were calculated in MATLAB environment for Case-2, as indicated in Table 3. The impactsof DG power supply can be clearly examined in terms of improvement in indicators, as stated in Table 4.In total, 7.02% and more improvement was achieved in SAIFI and SAIDI indices, while 13.72% wasachieved in ENS. On the other hand, higher load reliability indices were obtained for the points nearthe LP9. For example, LPIF improvement was 17.71% at LP7, while it was 52.10% at LP9. It is worth

Appl. Sci. 2020, 10, 7062 8 of 13
noting that PV based generation units can even supply energy needs of end-users in case of any failure,and they may also aid to provide a sustainable and reliable electrical grid in general if some rare casesare neglected for a properly monitored and managed grid structure.
Table 2. Calculated reliability indices for Case-1.
FeederReliability
Indices
Load PointReliability
Indices
Load Points
LP1 LP2 LP3 LP4 LP5 LP6 LP7 LP8 LP9
SAIFI( f
c−y )5.84 LPIF ( f
c−y ) 2.92 3.92 4.92 5.92 6.92 7.92 8.92 9.92 11.17
SAIDI( h
c−y )23.32 LPID ( h
c−y ) 11.64 15.64 19.64 23.64 27.64 31.64 35.64 39.64 44.64
ENS( MWs
y ) 63.64 LPENS ( MWsy ) 1.06 17.74 3.27 8.78 2.32 2.68 10.10 9.74 5.80
SAIFI: System Average Interruption Frequency Index; SAIDI: System Average Interruption Duration Index;ENS: energy not supplied; LPIF: load point interruption frequency; LPID: load point interruption time;LPENS: load point energy not supplied.
Table 3. Calculated reliability indices for Case-2.
FeederReliability
Indices
Load PointReliability
Indices
Load Points
LP1 LP2 LP3 LP4 LP5 LP6 LP7 LP8 LP9
SAIFI( f
c−y )5.43 LPIF ( f
c−y ) 2.92 3.92 4.92 5.92 6.92 7.92 7.34 5.88 5.35
SAIDI( h
c−y )21.69 LPID ( h
c−y ) 11.64 15.64 19.64 23.64 27.64 31.64 29.34 23.50 21.39
ENS( MWs
y ) 54.91 LPENS ( MWsy ) 1.06 17.74 3.27 8.78 2.32 2.68 8.22 5.69 3.20
Table 4. Feeder and load point reliability indices improvement for Case-2.
Load Points
LP1 LP2 LP3 LP4 LP5 LP6 LP7 LP8 LP9
SAIFI (%) 5.43 LPIF (%) 0 0 0 0 0 0 17.71 40.73 52.10SAIDI (%) 21.69 LPID (%) 0 0 0 0 0 0 17.68 40.72 52.08ENS (%) 54.91 LPENS (%) 0 0 0 0 0 0 18.61 41.58 44.83
In order to investigate the combined effects of DR implementation and on-site PV generation onreliability improvement, Case-3 and Case-4 were carried out in which the demand reduction capabilitiesof flexible load by 10% and 20% were considered from system and end-user standpoints. Herein,especially for obtaining this DR-based demand reduction from residential end-users, the mentionedhouseholds were considered as HEM equipped and therefore could respond to the DR based reductionsignals from the system operator automatically. The feeder reliability indices (SAIFI, SAIDI, ENS)and the load point reliability indices (LPIF, LPID, LPENS) were calculated in MATLAB environment forCase-3 and Case-4, as indicated in Tables 5 and 6, respectively. Additionally, the impacts of combinedDR implementation and PV generation on feeder and load point reliability indices are shown in Tables 7and 8, respectively.
The interaction between the bus based reduction signal and the response of each residentialend-user was not considered in detail in this current concept but will be the main topic of a nearfuture optimization-oriented study, similar to a previous study of the authors that did not consider thereliability point-of-view [34].

Appl. Sci. 2020, 10, 7062 9 of 13
Table 5. Calculated reliability indices for Case-3.
FeederReliability
Indices
Load PointReliability
Indices
Load Points
LP1 LP2 LP3 LP4 LP5 LP6 LP7 LP8 LP9
SAIFI( f
c−y )7.02 LPIF ( f
c−y ) 2.92 3.92 4.92 5.92 6.92 7.92 7.11 5.84 5.35
SAIDI( h
c−y )6.99 LPID ( h
c−y ) 11.64 15.64 19.64 23.64 27.64 31.64 28.42 23.35 21.39
ENS( MWs
y ) 13.72 LPENS ( MWsy ) 1.04 17.32 3.19 8.58 2.27 2.62 7.83 5.64 3.20
Table 6. Calculated reliability indices for Case-4.
FeederReliability
Indices
Load PointReliability
Indices
Load Points
LP1 LP2 LP3 LP4 LP5 LP6 LP7 LP8 LP9
SAIFI( f
c−y )5.13 LPIF ( f
c−y ) 2.92 3.92 4.92 5.92 6.92 7.69 6.90 5.80 5.35
SAIDI( h
c−y )20.48 LPID ( h
c−y ) 11.64 15.64 19.64 23.64 27.64 30.71 27.58 23.18 21.39
ENS( MWs
y ) 48.54 LPENS ( MWsy ) 1.02 16.91 3.12 8.37 2.22 2.48 7.51 5.60 3.20
Table 7. Feeder and load point reliability indices improvement for Case-3.
Load Points
LP1 LP2 LP3 LP4 LP5 LP6 LP7 LP8 LP9
SAIFI (%) 9.42 LPIF (%) 0 0 0 0 0 0 20.29 41.13 52.10SAIDI (%) 9.52 LPID (%) 0 0 0 0 0 0 20.26 41.09 52.08ENS (%) 18.73 LPENS (%) 1.89 2.37 2.45 2.28 2.16 2.24 22.48 42.09 44.83
Table 8. Feeder and load point reliability indices improvement for Case-4.
Load Points
LP1 LP2 LP3 LP4 LP5 LP6 LP7 LP8 LP9
SAIFI (%) 12.16 LPIF (%) 0.00 0.00 0.00 0.00 0.00 2.90 22.65 41.53 52.10SAIDI (%) 12.18 LPID (%) 0.00 0.00 0.00 0.00 0.00 2.94 22.62 41.52 52.08ENS (%) 23.73 LPENS (%) 3.77 4.68 4.59 4.67 4.31 7.46 25.64 42.51 44.83
As a result of Case-3 and Case-4, it is seen that this combined structure helped to achievea significant amount of contributions into the distribution system operation through increasingreliability indices. It is evident that the improvement was achieved even at LP1 point in LPIF, LPID,and LPENS as shown in Figures 4–6, respectively. The results show that the improvements dependedon the location of the load points and on the capacity of the transformer. As a conclusion, it canbe said that a respectable reliability improvement was achieved with DG availability and effectiveDR strategies.

Appl. Sci. 2020, 10, 7062 10 of 13
1
Figure 4. LPIF improvement in load points for case studies compared to Case-1.
2
Figure 5. LPID improvement in load points for case studies compared to Case-1.
2
Figure 6. LPENS improvement in load points for case studies compared to Case-1.

Appl. Sci. 2020, 10, 7062 11 of 13
4. Conclusions
In this study, the effects of a combined architecture of on-site PV generation and residential DRapplications on distribution system reliability were taken into account from system operator andend-user points of view. It should be highlighted that the real data of the distribution feeder wereprovided by BEDAS, and one of the most widely used reliability parameters was also integratedinto DigSILENT PowerFactory and MATLAB programs. Unlike the other valuable literature studies,the proposed structure considered the DG and the DR impacts on reliability simultaneously for thefirst time in the literature to the best knowledge of the authors.
As it can be seen in this study, the obtained results were reasonable, and the most important thingwas that the backup power supply as well as the demand reduction strategies played a key role in termsof reliability improvement in case of any failure at feeder or some other components. According tothe case studies, feeder reliability indices were improved by approximately 24%, while load pointindices were increased nearly 53% thanks to the combined structure. As a future study, it is aimed toimplement an optimization-based framework to determine and apply the appropriate DR strategies ina distribution system structure including a PV generation unit.
Author Contributions: S.G.: Conceptualization, Software, Data curation; A.K.E.: Writing—Original draft preparation,Visualization, Investigation; I.S.: Conceptualization, Investigation; O.E.: Methodology, Software Validation,Writing—Reviewing and Editing; J.P.S.C.: Supervision, Writing—Reviewing and Editing. All authors have readand agreed to the published version of the manuscript.
Funding: J.P.S.C. acknowledges the support by FEDER funds through COMPETE 2020 and by Portuguese fundsthrough FCT, under POCI-01-0145-FEDER-029803 (02/SAICT/2017).
Conflicts of Interest: The authors declare no conflict of interest.
References
1. Bompard, E.; Huang, T.; Wu, Y.; Cremenescu, M. Classification and trend analysis of threats origins to thesecurity of power systems. Int. J. Electr. Power Energy Syst. 2013, 50, 50–64. [CrossRef]
2. Strasser, T.; Andrén, F.; Kathan, J.; Cecati, C.; Buccella, C.; Siano, P.; Leitão, P.; Zhabelova, G.; Vyatkin, V.;Vrba, P.; et al. A Review of Architectures and Concepts for Intelligence in Future Electric Energy Systems.IEEE Trans. Ind. Electron. 2015, 62, 2424–2438. [CrossRef]
3. European Commission: Renewable Energy. Available online: http://ec.europa.eu/energy/en/topics/renewable-energy (accessed on 14 June 2020).
4. 2030 Climate & Energy Framework. Available online: https://ec.europa.eu/clima/policies/strategies/2030_en(accessed on 1 October 2020).
5. Renewable Energy Prospects: China. IRENA, Remap 2030. November 2014. Available online:https://www.irena.org/-/media/Files/IRENA/Agency/Publication/2014/Nov/IRENA_REmap_China_summary_2014_EN.ashx?la=en&hash=807F1019E27CA5C3D36FBA445EC48F150D58A6B5 (accessed on 2October 2020).
6. Yoo, T.H.; Kwon, H.-G.; Lee, H.C.; Rhee, C.-H.; Yoon, Y.T.; Park, J.-K. Development of reliability basedDemand response program in Korea. ISGT 2011. [CrossRef]
7. US Energy Information Administration—Electric Utility Demand Side Management Archive. Available online:https://www.eia.gov/electricity/data/eia861/dsm/ (accessed on 2 October 2020).
8. Wu, Q.; Wang, L.; Li, B. An optimized demand response strategy for electric water heaters and the associatedimpact on power system operational reliability. In Proceedings of the 2017 International Smart CitiesConference (ISC2), Wuxi, China, 14–17 September 2017; pp. 1–6. [CrossRef]
9. Gaspar, C.; Gomes, A. A contribution of demand response for the reliability of a power system. In Proceedingsof the 2016 IEEE 16th International Conference on Environment and Electrical Engineering (EEEIC), Florence,Italy, 7–10 June 2016; pp. 1–6.
10. Qi, X.; Ji, Z.; Wu, H.; Zhang, J.; Wang, L. Short-term reliability assessment of generating systems consideringdemand response reliability. IEEE Access 2020, 8, 74371–74384. [CrossRef]

Appl. Sci. 2020, 10, 7062 12 of 13
11. Ribeiro, M.F.; Shafie-Khah, M.; Osório, G.J.; Hajibandeh, N.; Catalão, J.P.S. Optimal demand response schemefor power systems including renewable energy resources considering system reliability and air pollution.In Proceedings of the 2017 IEEE International Conference on Environment and Electrical Engineeringand 2017 IEEE Industrial and Commercial Power Systems Europe (EEEIC/I&CPS Europe), Milan, Italy,6–9 June 2017; pp. 1–6.
12. Goel, L.; Wu, Q.; Wang, P. Reliability enhancement and nodal price volatility reduction of restructured powersystems with Stochastic demand side load shift. In Proceedings of the 2007 IEEE Power Engineering SocietyGeneral Meeting, Tampa, FL, USA, 24–28 June 2007; pp. 1–8.
13. Song, M.; Amelin, M.; Shayesteh, E.; Hilber, P. Impacts of flexible demand on the reliability of power systems.In Proceedings of the 2018 IEEE Power & Energy Society Innovative Smart Grid TechnologiesConference (ISGT), Washington, DC, USA, 19–22 February 2018; pp. 1–5.
14. Li, G.; Bie, Z.; Hua, B.; Wang, X. Reliability evaluation of distribution systems including micro-gridsconsidering demand response and energy storage. In Proceedings of the 2012 47th International UniversitiesPower Engineering Conference (UPEC), London, UK, 4–7 September 2012; pp. 1–6.
15. Zhou, P.; Chen, Z.; Yang, H.; Wen, L.; Liu, Y.; Hu, B.; Ma, Y.; Xia, Y.; Xiao, R.; Li, B. Reliability evaluation ofgrid-connected micro-grid considering demand response. In Proceedings of the 2016 International Conferenceon Probabilistic Methods Applied to Power Systems (PMAPS), Beijing, China, 16–20 October 2016; pp. 1–5.
16. Abogaleela, M.; Kopsidas, K. Reliability enhancements from demand response considering interruptedenergy assessment rates. In Proceedings of the 2016 Eighteenth International Middle East Power SystemsConference (MEPCON), Cairo, Egypt, 27–29 December 2016; pp. 330–335.
17. Su, S.; Hu, Y.; He, L.; Yamashita, K.; Wang, S. An assessment procedure of distribution network reliabilityconsidering photovoltaic power integration. IEEE Access 2019, 7, 60171–60185. [CrossRef]
18. Altamimi, A.; Jayaweera, D. Reliability of power systems with climate change impacts on hierarchical levelsof PV systems. Electr. Power Syst. Res. 2020, 190, 106830. [CrossRef]
19. Hamzeh, M.; Vahidi, B. Reliability evaluation of distribution transformers considering the negative andpositive effects of rooftop photovoltaics. IET Gener. Transm. Distrib. 2020, 14, 3063–3069. [CrossRef]
20. Raghuwanshi, S.S.; Arya, R. Reliability evaluation of stand-alone hybrid photovoltaic energy system forrural healthcare centre. Sustain. Energy Technol. Assess. 2020, 37, 100624. [CrossRef]
21. Zou, K.; Mohy-Ud-Din, G.; Agalgaonkar, A.P.; Muttaqi, K.M.; Perera, S. Distribution System Restoration WithRenewable Resources for Reliability Improvement Under System Uncertainties. IEEE Trans. Ind. Electron.2020, 67, 8438–8449. [CrossRef]
22. Shi, S.; Lo, K.L. Reliability assessment of power system considering the impact of wind energy.In Proceedings of the 2012 47th International Universities Power Engineering Conference (UPEC), London,UK, 4–7 September 2012; pp. 1–6.
23. Fang, C.; Xiang, G.; Junwei, Y. Study on reliability assessment of composite generation and transmissionsystem integrated wind farm. In Proceedings of the 2012 IEEE International Conference on Power SystemTechnology (POWERCON), Auckland, New Zealand, 30 October–2 November 2012; pp. 1–5.
24. Manandhar, S. Reliability Assessment of Smart Distribution System and Analysis of Automatic Line Switches.Master’s Thesis, The University of Tennessee, Chattanooga, TN, USA, 2013.
25. Distribution System Reliability Evaluation Services. Chapter 4. Available online: https://shodhganga.inflibnet.ac.in/bitstream/10603/10247/9/09_chapter%204.pdf (accessed on 2 October 2020).
26. Mohagheghi, S.; Yang, F.; Falahati, B. Impact of demand response on distribution system reliability.In Proceedings of the 2011 IEEE Power and Energy Society General Meeting, Detroit, MI, USA, 24–28 July 2011;pp. 1–7.
27. Billinton, R.; Allan, R.N.; Snaith, E.R. Book Review of ‘Reliability Evaluation of Power Systems’; Springer:New York, NY, USA, 1996.
28. Billinton, R.; Allan, R.N. Reliability Assessment of Large Electric Power Systems; Springer Science and BusinessMedia LLC: Berlin/Heidelberg, Germany, 1988.
29. Balijepalli, N.; Venkata, S.; Richter, C.; Christie, R.; Longo, V. Distribution System Reliability Assessment Dueto Lightning Storms. IEEE Trans. Power Deliv. 2005, 20, 2153–2159. [CrossRef]
30. Brown, R.E. Reliability Metrices and Indices. In Electric Power Distribution Reliability; CRC Press: New York,NY, USA, 2009; pp. 41–102.

Appl. Sci. 2020, 10, 7062 13 of 13
31. National Renewable Energy Laboratory—Measurement and Instrumentation Data Center. Available online:https://midcdmz.nrel.gov/ (accessed on 12 June 2020).
32. Topcu, S.; Dilmac, S.; Aslan, Z. Study of hourly solar radiation data in Istanbul. Renew. Energy 1995, 6,171–174. [CrossRef]
33. Bulut, H. Generation of typical solar radiation data for Istanbul, Turkey. Int. J. Energy Res. 2003, 27,847–855. [CrossRef]
34. Paterakis, N.G.; Santos, S.F.; Catalão, J.P.S.; Erdinç, O.; Bakirtzis, A.G. Coordination of smart-householdactivities for the efficient operation of intelligent distribution systems. In Proceedings of the IEEE PESInnovative Smart Grid Technologies (ISGT) European 2014 Conference, Istanbul, Turkey, 12–15 October 2014;pp. 1–6.
© 2020 by the authors. Licensee MDPI, Basel, Switzerland. This article is an open accessarticle distributed under the terms and conditions of the Creative Commons Attribution(CC BY) license (http://creativecommons.org/licenses/by/4.0/).