
Effects of Office Layout on Job Satisfaction, Productivity ...
22
Colonial Academic Alliance Colonial Academic Alliance Undergraduate Research Journal Undergraduate Research Journal Volume 1 Article 8 2010 Effects of Office Layout on Job Satisfaction, Productivity and Effects of Office Layout on Job Satisfaction, Productivity and Organizational Commitment as Transmitted through Face-to-Face Organizational Commitment as Transmitted through Face-to-Face Interactions Interactions Leah R. Wolfeld George Mason University, [email protected] Follow this and additional works at: https://scholarworks.wm.edu/caaurj Recommended Citation Recommended Citation Wolfeld, Leah R. (2010) "Effects of Office Layout on Job Satisfaction, Productivity and Organizational Commitment as Transmitted through Face-to-Face Interactions," Colonial Academic Alliance Undergraduate Research Journal: Vol. 1 , Article 8. Available at: https://scholarworks.wm.edu/caaurj/vol1/iss1/8 This Article is brought to you for free and open access by the Journals at W&M ScholarWorks. It has been accepted for inclusion in Colonial Academic Alliance Undergraduate Research Journal by an authorized editor of W&M ScholarWorks. For more information, please contact [email protected].
Transcript of Effects of Office Layout on Job Satisfaction, Productivity ...

Colonial Academic Alliance Colonial Academic Alliance
Undergraduate Research Journal Undergraduate Research Journal
Volume 1 Article 8
2010
Effects of Office Layout on Job Satisfaction, Productivity and Effects of Office Layout on Job Satisfaction, Productivity and
Organizational Commitment as Transmitted through Face-to-Face Organizational Commitment as Transmitted through Face-to-Face
Interactions Interactions
Leah R. Wolfeld George Mason University, [email protected]
Follow this and additional works at: https://scholarworks.wm.edu/caaurj
Recommended Citation Recommended Citation Wolfeld, Leah R. (2010) "Effects of Office Layout on Job Satisfaction, Productivity and Organizational Commitment as Transmitted through Face-to-Face Interactions," Colonial Academic Alliance Undergraduate Research Journal: Vol. 1 , Article 8. Available at: https://scholarworks.wm.edu/caaurj/vol1/iss1/8
This Article is brought to you for free and open access by the Journals at W&M ScholarWorks. It has been accepted for inclusion in Colonial Academic Alliance Undergraduate Research Journal by an authorized editor of W&M ScholarWorks. For more information, please contact [email protected].

In any organization, communication is essential. Modern-day
organizations increasingly rely on e-mail, conference calls, and web-based
meetings that allow individuals to communicate from afar (Igbaria & Tan, 1998).
These tools, while certainly useful, also limit face-to-face interaction. This may be
problematic as face-to-face interactions and communication within the workplace
are crucial to outcomes such as productivity, job satisfaction and organizational
commitment (Campbell & Campbell, 1988; Kirschner et al., 2009; Mesmer-
Magnus & DeChurch, 2009; Reagans & Zuckerman, 2001; Short, 1974; Strubler
& York, 2007).
Given these latter findings, organizations have an interest in promoting
face-to-face interactions that manifest themselves in group work, teamwork, and
impromptu interactions. One way to do so is to use workspace as a tool. As a few
studies mention, humans are subject to the constraints of their physical
environment – people cannot walk through walls and have to stand to walk to the
other side of the room (Pfeffer, 1982; Davis 1984). Despite these natural
hindrances of working in an office, the layout itself can promote face-to-face
interactions Gerstberger & Allen, 1968; Penn, 1999; Peponis et al., 2007; Rashid
et al., 2006). This can be executed by controlling movement within the space, and
by controlling spatial interconnectedness.
The current study is an effort to investigate these ideas. Specifically, this
study examines the effect that office layout has on outcomes such as productivity,
job satisfaction and organizational commitment. In the following pages, I first
discuss the importance of face-to-face interactions in organizations and how these
interactions enhance productivity, job satisfaction and organizational commitment
through collaboration. I then touch on the effects of face-to-face communication
that occurs in informal, impromptu interactions, and its effects on these outcomes.
Lastly, I discuss the ways in which the office layout can be manipulated to foster
informal, impromptu interactions and thus encourage face-to- face interactions
and enhance these outcomes.
Importance of Face-to-Face Communication
Face-to-face interactions are crucial to collaboration between employees. The
social presence theory (Short, Williams, & Christie, 1976 as cited in Ramirez &
Zhang, 2007) suggests that non-verbal cues, which are only available via face-to-
face meetings, are essential to communication within a group. Relationships can
be strengthened with frequent communication and face-to-face interactions,
resulting in a higher network density. As defined by Reagans and Zuckerman
(2001), network density is the “average strength of the relationship between team
members” (p. 502). When employees meet face-to-face, cohesion is enhanced and
they may understand each other better on personal levels. Effective collaboration
relies heavily on face-to-face interactions, suggesting that the underlying
characteristics of face-to-face interactions increase network density.
1
Wolfeld: Effects of Office Layout
Published by W&M ScholarWorks, 2010

These underlying characteristics of face-to-face communication include
interpersonal factors and “socio-emotional” information, which are present with
face-to-face interactions. For example, in an experiment by Short (1974), pairs of
96 civil servant participants were asked to collaborate with their partners,
communicating through strictly audio means, a live video, or face-to-face (16
pairs in each setting). Afterwards, each participant completed a questionnaire that
documented the agreement reached and rated the task as well as the partner. Short
(1974) found that strictly audio communication lacks interpersonal information
essential to collaboration that face-to-face interactions provide. This suggests that
face-to-face interactions in the workplace could promote interpersonal
information sharing.
Face-to-Face Communication in Collaborative Work Settings
Face-to-face interaction is especially important in a work context when employees
must work collaboratively on job tasks. Research on group work and teamwork
provides especially strong support for this idea. In administering learning,
retention and transfer tasks to a group of 70 high school biology students,
Kirschner, et al. (2009) studied the effects of group work on performance, and
found that communication within these groups is essential to coordination and
team success (Kirschner et al., 2009). Their theory suggests that information
retention takes less mental effort for individuals learning in the presence of others
than those learning alone because the cognitive load is distributed over a number
of people. Strubler and York (2007) studied teamwork among 500 university staff
members. Not only did Strubler and York (2007) find collaboration to increase
satisfaction and control over the participants’ work, they also found an
enhancement in productivity. Lastly, Reagans and Zuckerman (2001) found that
frequent communication between employees with varying skills, information and
experience increases the group’s capacity for creativity and productivity.
Similarly, the extensive meta-analysis conducted by Mesmer-Magnus and
DeChurch (2009) on the effects of teamwork strongly supports the notion that
effective information sharing between team members increases both performance
and productivity through interaction. That is, the more that individuals share
information with group members, the higher the group’s performance and
productivity is as a whole. In sum, face-to-face interactions, such as those that
often occur within groups and team work, play an important role in fostering
outcomes such as greater information retention and coordination (Reagans &
Zuckerman, 2001), and ultimately, higher productivity.
Face-to-Face Interactions in Informal Communication and Impromptu
Interactions
Although face-to-face interactions that occur in formal collaborative relationships
(e.g., work teams) are important to productivity, the more subtle face-to-face
interactions like informal communication and impromptu interactions also likely
2
Colonial Academic Alliance Undergraduate Research Journal, Vol. 1 [2010], Art. 8
https://scholarworks.wm.edu/caaurj/vol1/iss1/8

affect productivity, job satisfaction and organizational commitment as well.
Campbell and Campbell (1988) define informal communication as “relatively
unstructured information exchanges that tend to occur in face-to-face encounters
during ‘off-task’ moments” (p. 212). These seemingly trivial interactions can
increase employees’ sense of belonging, and thereby enhance work performance
and increase their identification with and commitment to the organization
(Campbell & Campbell, 1988). Similarly, Rashid, et al. (2006) state that informal
communication is often seen as a way to strengthen “organizational culture”,
interpersonal relations, and to share information. In fact, information often
spreads faster and more efficiently if the interaction is informal instead of formal
(Davis, 1984). Impromptu, or unplanned, interactions are the interactions within
which informal communication takes place. Thus, increases in impromptu
interactions and thereby the amount of informal communication within an
organization should also lead to positive outcomes such as enhanced network
density, productivity, job satisfaction, and identification with and commitment to
the organization. Organizational commitment can be defined as a combination of
identification with the organization, perception of the costs of leaving the
organization, and obligation to stay with the organization (Allen & John P.
Meyer, 1990). To this end, the current study investigated the relationships among
these various constructs through a self-report online survey. Based on the
reasoning above, I offer the following hypotheses:
Hypothesis 1: More frequent formal and informal face-to-face
interactions will be positively related to H1a) job satisfaction,
H1b) self-reported productivity, and H1c) organizational
commitment.
Effects of Layout on Ease of Face-to-Face Communication
Given these predicted benefits, organizations have an interest in increasing the
likelihood and frequency of face-to-face interactions. One way to do so is by
creating a physical layout conducive to frequent face-to-face interactions.
Intuitively, and as noted by Penn, et al. (1999), the layout of a workplace affects
how employees move about the office. On a basic level, the office layout can
create a connected, interactive space or can separate work areas. By administering
a survey investigating the frequency of contact with the employees in spatially
isolated workspaces, Penn et al. (1999) found that employees are more likely to
interact with their coworkers in spaces that are more accessible. That is, Penn et
al. (1999) concluded that the spatial configuration of an office does have a direct
impact on the frequency of reported interactions. Similarly, Peponis, et al. (2007)
found that with more available locations for interaction (work-related or social) in
a communication design firm called ThoughtForm, the density of interactions
increased. That is, the roughly 50 employees at ThoughtForm interacted more
frequently with a new workplace layout than they did in the old workplace layout.
3
Wolfeld: Effects of Office Layout
Published by W&M ScholarWorks, 2010

Although density of interactions may not have a direct effect on an individual’s
productivity, the increase in probability of interacting with other employees also
increases the probability of teamwork. Teamwork can then lead to better retention
of information (Kirschner et al., 2009) and in turn, higher productivity and the
like (Strubler & York, 2007).
A study by Gerstberger and Allen (1968) supports the theory that
employees will seek to obtain information from the source that is the least costly
to them. By surveying electrical engineers in an organization, Gerstberger and
Allen compared the costs and benefits of using different information channels
such as customers, literature and technical service. The results strongly suggest
that the engineers in this company use the channel that will cost them the least (in
choosing efficiency or reliability of a source, for example) in order to gain
information. Therefore, if face-to-face, impromptu interactions were the
information channel that required the least amount of effort, then face-to-face
communication should be the most frequently used information channel between
employees. This can be facilitated by manipulating the office layout.
Manipulating Layout to Facilitate Informal, Impromptu, Face-to-Face
Interactions
Spatial arrangement can increase impromptu interactions (Peponis et al., 2007),
and employees tend to choose the easiest method of communication (Gerstberger
& Allen, 1968). Given that these interactions can lead to stronger collaboration
and productivity (Campbell & Campbell, 1988; Rashid et al., 2006), adjusting the
workplace to promote such interactions is in an organization’s best interest. Ways
to increase the probability of impromptu interactions and ease of communication
within an office fall under two categories: movement control and spatial
interconnectedness. One way to control movement is through the use of
integration, a spatial measurement defined by the accessibility of a local “line,” or
pathway, within an office. Integration of pathways encourages people to choose to
use the same pathways as others out of convenience. Hillier et al. (1990, as cited
in Penn et al., 1999), Hillier and Penn (1991, as cited in Penn et al., 1999) and
Penn and Hillier (1992, as cited in Penn et al., 1999) found that the mean
integration of an office positively correlates with the mean degree of “usefulness”
(as defined by perceived status, knowledge and skills) of other employees, both
within and between departments, as reported by individuals.
Penn et al. (1999) speculate that the increase in mean degree of
“usefulness” could correlate with the degree of interactions. This suggestion is
consistent with the integration of a workspace, which can directly assist or impede
interactions within or between departments. Peponis et al. (2007) also found an
increase in unplanned interactions when ThoughtForm moved to a new location
that had a higher mean integration than their previous location. Based on this
evidence, the following hypothesis seems warranted for the current study:
4
Colonial Academic Alliance Undergraduate Research Journal, Vol. 1 [2010], Art. 8
https://scholarworks.wm.edu/caaurj/vol1/iss1/8

Hypothesis 2: The level of individual integration will positively
relate to the frequency of the individual’s impromptu and unplanned face-
to-face interactions.
Movement within an office can also be manipulated through spatial
interconnectedness, a broad, global measurement of accessibility in a workplace.
This includes distance between employees, employee visibility, and employee
location. Allen (1970, as cited in Rashid et al., 2006) found that the greater the
distance between employees, the less likely they are to communicate. The length
of the axial lines, or the length of the pathways available to employees, predicted
their frequency of communication. Similarly, when observing an organization’s
relocation, Peponis et al. (2007) found that a decrease in perceived distance
between employees correlated with an increase in ease of communication. In
accordance with the phenomenon proposed by Peponis et al. (2007), Penn et al.
(1999) found that distance greatly affects “eagerness” to travel for face-to-face
interactions. This finding directly relates to the Gerstberger and Allen (1968)
study in which employees chose the least costly method to gather information.
Visibility is another facet of spatial interconnectedness within an office
that can predict face-to-face interactions. After making between 20 and 30
observations in four different organizations and work spaces, Rashid et al. (2006)
focused on the simple phenomenon that the layout dictates whose workspaces are
passed when other employees move about the office. By quantifying visibility
through axial map drawings and spatial syntax software, Rashid et al. (2006)
concluded that visibility and location play a role in the frequency of face-to-face,
impromptu and informal interactions. Muchinsky (1977) argues that if people
have the opportunity to initiate face-to-face interactions, they also have a higher
level of job satisfaction.
Backhouse and Drew (1992) videotaped interactions in a workplace with
high visibility, and found that over 80% of the interactions were impromptu.
When one employee is in motion and the other is at a visible workplace, the
deciding factor between an unplanned interaction and no interaction is nonverbal
cues. Unplanned interactions are discouraged if the employee in motion is focused
and looking ahead, or if the employee at the desk is leaning forward and focusing.
Similarly, unplanned interactions are encouraged if the employee in motion is
looking around, or if the employee at the desk is leaned back and looking around.
While the Backhouse and Drew (1992) findings weigh on the notion that
movement encourages unplanned interactions, Rashid et al. (2006) focus on the
extent of visibility in the study, and argue that in fact visibility is a better predictor
of face-to-face interactions than movement. However, Penn et al. (1999) make
note of situations in which lack of visibility promotes unplanned interactions
between a seated and a moving person. If two people cannot see each other, then
there is no way to know whether or not the other is available. The lack of
5
Wolfeld: Effects of Office Layout
Published by W&M ScholarWorks, 2010

Independent Variable:
Office Layout
Transmission:
Face-to-Face Interactions
Outcome Measures:
Productivity
Job Satisfaction
Organizational Commitment
visibility promotes unplanned interaction simply because there is no opportunity
to plan. That said, it may be that a higher level of visibility is ideal despite the
argument Penn et al. (1999) put forth. Although the nonverbal cues between two
employees in a space with high visibility may decrease the probability of
unplanned interactions, it leaves room for either individual to stay focused and
prevent interruption. In the long run, the leniency provided by visibility and last-
minute predictable interactions allows employees more control over their work. I
believe that control over work and unplanned interactions and the balance
between them are influential in job satisfaction and productivity. Thus, the
following hypothesis is appropriate:
Hypothesis 3: Employees’ level of visibility within the admissions
office will positively correlate with the frequency of the
individual’s impromptu and unplanned face-to-face interactions.
Spatial interconnectedness is also determined by location of employees
within an office space. Simply put, the presence of people instigates interactions,
so people are more likely to interact face-to-face if they are in close proximity to
one another (Altman & Stokols, 1987). Working in close proximity to group
members is important to facilitate communication and encourage task-related
interaction. As mentioned in the context of group work and teamwork, effective
information sharing with multiple people increases performance and productivity
(Mesmer-Magnus & DeChurch, 2009).
As hypothesized above, face-to-face interactions through group work,
teamwork, and impromptu, informal communication enhance network density and
therefore productivity and job satisfaction. Taken together, these ideas imply the
following:
Hypothesis 4: The frequency of face-to-face interaction will
partially mediate the relationships between office layout (with
regard to integration, spatial interconnectedness, visibility and
location) and H4a) job satisfaction, H4b), self-reported
productivity, and H4c) organizational commitment.
Thus, the present study sought to support the mediation model in which
the office layout (consisting of integration, spatial interconnectedness, visibility
and location) affects the nature and frequency of the face-to-face interactions
(such as unplanned, impromptu interactions). These interactions should then
influence the outcomes, including job satisfaction, productivity and organizational
commitment, as seen in Figure 1. The purpose of this study was to investigate
these ideas.
6
Colonial Academic Alliance Undergraduate Research Journal, Vol. 1 [2010], Art. 8
https://scholarworks.wm.edu/caaurj/vol1/iss1/8
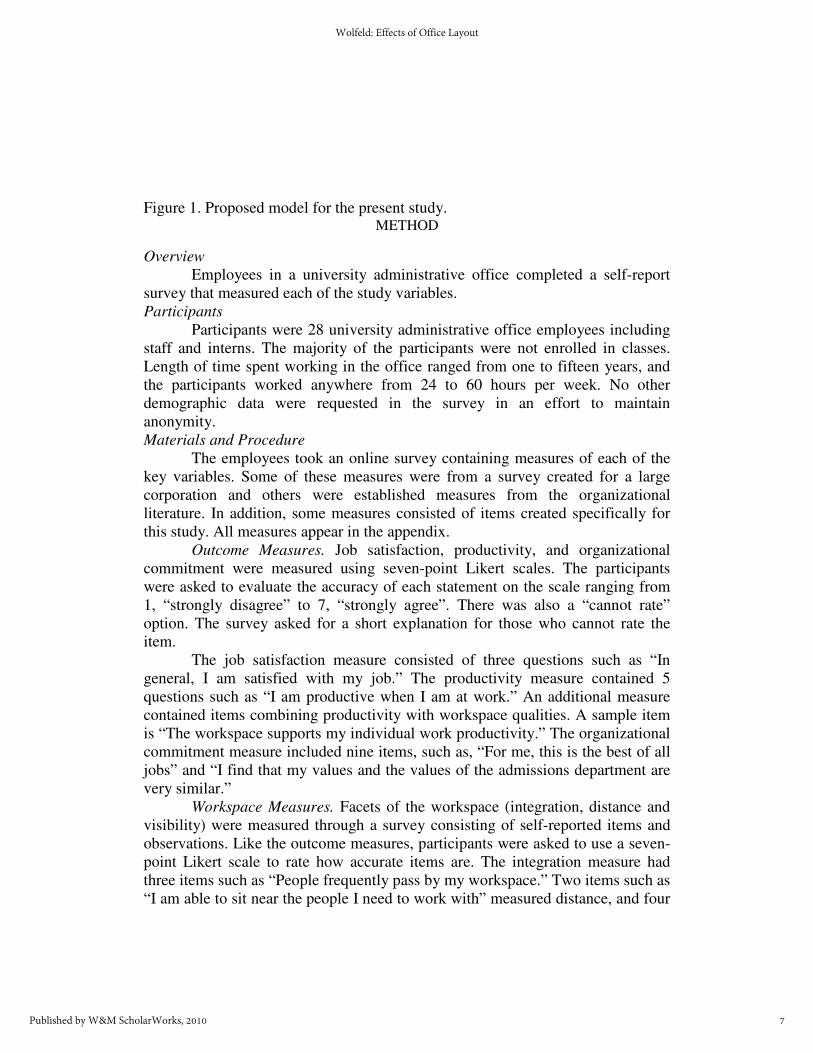
Figure 1. Proposed model for the present study. METHOD
Overview
Employees in a university administrative office completed a self-report
survey that measured each of the study variables.
Participants
Participants were 28 university administrative office employees including
staff and interns. The majority of the participants were not enrolled in classes.
Length of time spent working in the office ranged from one to fifteen years, and
the participants worked anywhere from 24 to 60 hours per week. No other
demographic data were requested in the survey in an effort to maintain
anonymity.
Materials and Procedure
The employees took an online survey containing measures of each of the
key variables. Some of these measures were from a survey created for a large
corporation and others were established measures from the organizational
literature. In addition, some measures consisted of items created specifically for
this study. All measures appear in the appendix.
Outcome Measures. Job satisfaction, productivity, and organizational
commitment were measured using seven-point Likert scales. The participants
were asked to evaluate the accuracy of each statement on the scale ranging from
1, “strongly disagree” to 7, “strongly agree”. There was also a “cannot rate”
option. The survey asked for a short explanation for those who cannot rate the
item.
The job satisfaction measure consisted of three questions such as “In
general, I am satisfied with my job.” The productivity measure contained 5
questions such as “I am productive when I am at work.” An additional measure
contained items combining productivity with workspace qualities. A sample item
is “The workspace supports my individual work productivity.” The organizational
commitment measure included nine items, such as, “For me, this is the best of all
jobs” and “I find that my values and the values of the admissions department are
very similar.”
Workspace Measures. Facets of the workspace (integration, distance and
visibility) were measured through a survey consisting of self-reported items and
observations. Like the outcome measures, participants were asked to use a seven-
point Likert scale to rate how accurate items are. The integration measure had
three items such as “People frequently pass by my workspace.” Two items such as
“I am able to sit near the people I need to work with” measured distance, and four
7
Wolfeld: Effects of Office Layout
Published by W&M ScholarWorks, 2010

items including “I have easy visibility to other people in the workplace” measured
visibility. After conducting exploratory factor analyses, however, the items
intended to measure distance and integration respectively, loaded on one factor
that is referred to as accessibility and is further explained in the results and
discussion sections of this paper.
Other items asked participants to express as a percentage the time they
spend on various activities. For example, one question asked the participants to
divide up their time (in percentages) spent between working alone, engaging in
impromptu face-to-face interactions, scheduled face-to-face interactions, remote
real-time communication with others and remote delayed communication with
others.
Interactions. Frequency of interactions within the office were assessed on
a six-item measure along a seven-point Likert scale. One such item is “I interact
with many people when I am moving about the office”.
Open Response Questions. These questions were meant to allow any input
from the participants that was not covered by the other questions. One item is “If
you could change anything about the workspace, what would it be and why?”
RESULTS
Prior to examining the study hypotheses, I conducted exploratory factor analyses
on the measures to ensure that the items performed as anticipated. In general,
these analyses supported the a priori factor structures of the various measures.
The one exception that warrants mention is that items meant to tap distance and
integration, respectively, loaded on one factor. Taking into account the content of
these items, this overarching factor is labeled as “accessibility”. This factor refers
to the proximity of one employee to another and the frequency with which the
employees pass by others’ workspaces. The coefficient alpha reliability for this
and the other variables are presented in Table 2. As seen there, the reliability for
all of the study variables was adequate and, in most cases, quite high.
To test the hypotheses, I computed bivariate correlations. These
correlations appear in Table 1. According to Hypothesis 1, more frequent
impromptu interactions were expected to be positively related to job satisfaction,
productivity and organizational commitment. As seen in Table 1, frequency of
impromptu interactions does not significantly correlate with productivity, job
satisfaction or organizational commitment. Therefore, Hypothesis 1 is not
supported by the present study.
As noted above, distance and integration loaded on one factor. Therefore,
the hypotheses involving these variables were tested by using the accessibility
factor. Hypothesis 2 states that the degree of accessibility will positively relate to
the frequency of the individual’s informal and impromptu interactions. The
8
Colonial Academic Alliance Undergraduate Research Journal, Vol. 1 [2010], Art. 8
https://scholarworks.wm.edu/caaurj/vol1/iss1/8

correlation between accessibility and frequency of impromptu interactions was
statistically significant (r = .631, p < .01), which supports Hypothesis 2, indicating
that higher integration levels and lower distance between employees may foster
impromptu interactions.
According to Hypothesis 3, the visibility of the employees’ workplaces
should be positively correlated with productivity, job satisfaction and
organizational commitment. The correlations between visibility and the outcome
measures were weak (r = .044), resulting in a lack of support for Hypothesis 3.
Hypothesis 4 predicts that the average physical distance between
employees will have a negative relationship with productivity, job satisfaction and
organizational commitment. Accessibility (in place of a distance measure) was
significantly correlated with productivity (r = .408, p < .05) but showed no
relationship with job satisfaction or with organizational commitment. Thus,
Hypothesis 4 is partially supported by these data.
The present study also found a few important correlations that were not
directly related to the hypotheses. As seen in Table 1, job satisfaction and
organizational commitment were significantly correlated (r = .413, p < .05) but
neither was highly correlated with productivity.
Also, additional variables were included in the surveys that were not
related to the hypotheses. These led to some noteworthy findings. As seen in
Table 2, the percent of time spent working alone was significantly negatively
correlated with job satisfaction (r = -.446, p < .05), percent total time spent in
unscheduled face-to-face interactions (r = -.619, p < .01), and percent total time
spent in scheduled, face-to-face interactions (r = -.751, p < .01). Thus, it appears
that individuals who spend a significant amount of time working alone are
relatively dissatisfied with their jobs and interact with their coworkers
infrequently. Being interrupted while trying to concentrate was significantly
positively correlated with both unscheduled and scheduled face-to-face
interactions (r = .495, p < .05, r = .634, p < .01, respectively), highlighting the
notion that any type of interaction while trying to concentrate is a disruption. Both
productivity and job satisfaction had a significant negative relationship with time
spent with the immediate workgroup (r = -0.524, p < .05, r = -.427, p < .05).
Hence, it seems as though spending time with the immediate workgroup is
counterproductive and decreases job satisfaction. Informal and unplanned
interactions were positively correlated with all three outcomes (though not
significantly). Also, time spent traveling within the office positively correlated
with both accessibility and frequency of interactions though neither was
significant. That is, the more an individual moves about the office the more
accessible their coworkers are. Lastly, as seen in Table 2, the items that measure
the outcomes and the workplace together was significantly correlated with not
being distracted (r = .568, p < .01). When measured separately the outcome items
9
Wolfeld: Effects of Office Layout
Published by W&M ScholarWorks, 2010

and workplace items do not correlate significantly with not being distracted;
however, they do correlate significantly with not being distracted when the two
constructs are combined into one item.
Table 1
Bivariate Correlations of Outcome Measures, Workspace Measures and
Interactions
Notes. OC = organizational commitment. PT working Alone = percent time spent
working alone. Time spent in U-FTFI = time spent in unscheduled face-to-face
interactions. Time Spent in S-FTFI = time spent in scheduled face-to-face
interactions. Remote RT CWO = remote real-time communication with others.
Remote D CWO = remote delayed communication with others. Percent of total
interactions spent with IW = percent of total interactions spent with immediate
workgroup. *p < .05. **p < .01. All tests two-tailed.
Table 2
Variables 1 2 3 4 5 6 7 8 9 10 11 12 13 14 15 16
1. Productivity -
2. Job Satisfaction 0.037 -
3. OC 0.278 .413* -
4. PT spent
Working Alone0.234 -.446* -0.19 -
5. Time Spent in
U-FTFI-0.192 0.28 0.212 -.619** -
6. Time Spent in
S-FTFI-0.032 0.398 0.265 -.751** 0.361 -
7. Remote RT
CWO-0.295 0.22 -0.171 -.562** -0.027 0.266 -
8. Remote D
CWO-0.15 0.214 0.023 -.618** 0.078 0.138 .522** -
9. Interrupted 0.112 0.167 0.317 -.518** .495* .634** -0.147 0.102 -
10. Not distracted -0.08 0.091 0.143 0.237 -0.397 -0.305 0.331 -0.008 -.569** -
11. Work and
Outcomes-0.026 0.253 0.283 0.05 0.175 -0.08 -0.105 -0.154 -0.144 .568** -
12. Percent of
Total
Interactions
spent with IW
-.524* -.427* -0.154 0.368 0.028 -0.368 -0.307 -0.329 -0.202 -0.047 0.095 -
13. Finding a Place
to Work-0.128 -.594** -.445* 0.13 -0.142 -0.152 -0.056 0.042 0.121 -0.154 -0.351 0.373 -
14. Frequency of
Interactions0.234 0.204 0.233 -0.307 .611** 0.305 -0.462 0.034 .555** -.393* 0.212 0.032 -0.078 -
15. Visibility 0.102 -0.066 -0.037 0.068 0.006 -0.162 -0.254 0.174 0.193 -0.242 0.044 0.077 0.046 0.3 -
16. Accessibility .408* -0.056 -0.02 0.108 0.109 -0.1 -.533** 0.057 0.262 -0.214 0.154 0.032 0.165 .631** .412* -
10
Colonial Academic Alliance Undergraduate Research Journal, Vol. 1 [2010], Art. 8
https://scholarworks.wm.edu/caaurj/vol1/iss1/8

Alpha Reliability Coefficients
DISCUSSION
The purpose of this study was to investigate the effects of the workplace
characteristics of integration, physical distance and visibility on impromptu
interactions and job-related outcomes (job satisfaction, productivity and
organizational commitment). Among the most important findings from the study
was the significant positive relationship between accessibility and frequency of
impromptu interactions as predicted by Hypothesis 2. This is consistent with the
Allen (1970, as cited in Rashid et al., 2006) study in which less distance
correlated with a higher likelihood of communication. Similarly, the current study
also found a significant positive relationship between accessibility among
employees and productivity.
The results also support various notions that were not predicted in the
hypotheses. One such finding was the significant positive relationship between
organizational commitment and job satisfaction, and a lack of a relationship
between productivity and either of the other outcome measures. According to
these data, employees’ organizational commitment relates to their job satisfaction,
but neither relates to productivity. This is consistent with findings in other
organizational research (e.g. Wall, Kemp, Jackson, & Clegg, 1986).
Another unforeseen finding was the negative relationship between job
satisfaction and percent of time spent alone at work. As seen in Table 1, four
types of employee interactions (unscheduled face-to-face, scheduled face-to-face,
remote real-time and remote delayed communication) are all positively correlated
with job satisfaction. We can therefore speculate that with a larger sample size,
higher job satisfaction may in fact have a significant positive relationship with
most types of interaction within the office.
One exception to a potential increase in job satisfaction with interactions
is the interactions within the immediate workgroup. Both productivity and job
satisfaction have a significant negative relationship (and organizational
commitment, though non-significant) with time spent with the immediate
workgroup. This finding suggests a few possibilities. One possibility is that, with
a larger sample size, a curvilinear relationship between these variables would
emerge. In other words, there could be an optimal frequency of interaction that
Variable Reliability
Productivity 0.562
Job Satisfaction 0.896
Organizational Commitment 0.829
Frequency of Interactions 0.784
Visibility 0.738
Accessibility (integration and distance) 0.669
11
Wolfeld: Effects of Office Layout
Published by W&M ScholarWorks, 2010

enhances productivity most; too much interaction or too little interaction could
decrease productivity. A second possibility is that the communication within these
workgroups is relatively ineffective. Collaboration skills and effective
information sharing within work groups have been found to be positively
correlated with performance and productivity (Kirschner, et al., 2009; Mesmer-
Magnus & DeChurch, 2009; Strubler & York, 2007), suggesting that the
participants in the current study may be unhappy with their workgroups because
they lack effective communication skills. Perhaps with communication training
within immediate workgroups, employees in the current sample could reverse the
negative relationship between time spent in the immediate workgroup and
productivity and job satisfaction. Another possibility is that the nature of the jobs
within this particular office may cater more towards individual work rather than
group work, resulting in little time spent with the immediate workgroup to begin
with.
In accordance with the findings in the study by Campbell and Campbell
(1988), informal and unplanned interactions were positively correlated (though
not significantly) with all three outcome measures. This finding supports the
notion that impromptu interactions, though distracting, can enhance the
individual’s sense of belonging within the organization.
Percent of time spent alone at work also had a significant positive
relationship with being interrupted while trying to concentrate. The more time the
participants spent working alone, the more they felt interrupted; at the same time,
they experienced less interactions with others (unscheduled face-to-face,
scheduled face-to-face, remote real-time and remote delayed). This can be
explained by the nature of working alone—by definition, it does not include other
people. As supported by these data, any type of interaction is an interruption,
because working alone signifies lack of interaction with others. According to
Backhouse and Drew (1992), it is possible that a lack of or misinterpretation of
non-verbal cues allows interruptions. A heightened awareness of sending and
receiving non-verbal cues within the office could alter the negative relationship
between time spent working alone and interruptions.
A common concern with employee interactions is the level of distraction.
The items measuring the outcomes and the workplace together (such as “The
workspace supports collaboration and teamwork” and “I am efficient and
productive working in the work environment”) were significantly correlated with
not being distracted. This suggests that although workspace and the outcomes
when separated do not support this finding, when the participants consider job
satisfaction, productivity and organizational commitment within the context of the
work environment, they perceive less distraction. This could be due to a problem
among the items (such as wording the items in a positive light) or due to a
12
Colonial Academic Alliance Undergraduate Research Journal, Vol. 1 [2010], Art. 8
https://scholarworks.wm.edu/caaurj/vol1/iss1/8

difference in the participants’ cognitive framework when assessing the workplace
characteristics and outcomes together.
The outcome constructs were negatively (though not significantly)
correlated with travel time within the office, possibly because the participants
perceive making necessary trips around the office as a nuisance. Nevertheless,
consistent with Hypothesis 2, travel time within the office does positively (though
not significantly) correlate with accessibility and with frequency of interactions.
This corresponds to the findings by Penn et al. (1999), in which spatial
configuration of an office had a direct impact on the frequency of interactions. As
the proposed model and hypotheses in this study do not specifically incorporate
the time spent travelling within the office, and the methods in the present study do
not measure the spatial configuration of the office, a subsequent study should
incorporate distance travelled as well as time spent travelled in the research
model.
In future studies, researchers also should further revise measurements of
the key independent variables. Unlike self-report items, more objective
measurements actually quantify aspects of the office layout like integration,
distance, and visibility. Also, social network analysis could provide more accurate
assessments of frequency and type of interaction (Selfhout, Burk, Branje,
Denissen, van Aken, & Meeus, 2010). This type of measurement assesses unique
patterns of interaction and relationships among different individuals, thereby
providing a more nuanced examination of the effects of these variables on the
study outcomes. Moreover, with maps of the office, level of integration can be
assessed visually and other constructs such as density of interactions can be
measured. The effects of the office layout can also more easily be measured with
a survey before and after a physical workspace change within the organization.
Despite the benefits of quantitative data, the open-ended questions added a
dimension to the present study that numerical data could not. Participants
mentioned a few influential workspace characteristics that were not addressed in
the other items. In response to the question, “If you could change anything about
your workspace, what would it be and why?” participants suggested replacing
fluorescent lights, regulating the temperature, creating a break room, and working
near a window. Adjustments such as choosing a chair or closing a door to
minimize distraction and maximize privacy arose in response to needing more
control over the workspace. These responses suggest that small changes to
workspaces can dramatically impact job satisfaction, organizational commitment
and productivity; in fact, simply asking employees their opinions and preferences
about the workspace and the various factors affecting it could do so in and of
itself. As eloquently expressed by Alain de Botton (2006) in his book The
Architecture of Happiness, most people seem oblivious to the physical
environment because contemplating its power and the blatant lack of recognition
13
Wolfeld: Effects of Office Layout
Published by W&M ScholarWorks, 2010

of this power is troublesome. Many organizations have yet to realize how
influential the workspace can be, and how apt manipulation thereof can truly
work in their favor.
The present study was not without some limitations. One obvious
limitation is the small sample size. The results would clearly be more reliable if
the response rate had been higher. With a larger sample size, some of the non-
significant but higher correlations could be statistically significant. With
statistically significant correlations, future studies can be more certain of the
relationship between variables. Another limitation is that the data were collected
in one setting, and in a context in which employees held a variety of jobs. Perhaps
by taking data from multiple offices and restricting the sample to one job type,
other studies could reduce the effects of potential confounding variables. Despite
these limitations, the current study suggests some important and, in some cases,
counterintuitive, findings which beg future inquiry.
REFERENCES
Allen, N. J., & Meyer, J. P.. (1990). The measurement and antecedents of
affective, continuance and normative commitment to the organization.
Journal of Occupational Psychology, 63(1), 1-18.
Altman, I., & Stokols, D. (1987). Handbook of Environmental Psychology. New
York: Wiley.
Backhouse A., & Drew P. (1992). The design implications of social interaction in
a workplace setting. Environment and Planning B: Planning and Design,
(19), 573-584.
Campbell, J. P., & Campbell, R. J. (1988). Productivity in organizations: new
perspectives from industrial and organizational psychology (1st ed.). San
Francisco: Jossey-Bass Publishers.
Davis, T. R. (1984). The influence of the physical environment in offices. The
Academy of Management Review, 9(2), 271-283.
Gerstberger, P. G., & Allen, T. J. (1968). Criteria used by research and
development engineers in the selection of an information source. Journal
of Applied Psychology, 52(4), 272-279.
Goodwin, D. (2007). Upsetting the order of teamwork: Is 'the same way every
time' a good aspiration? Sociology, 41(2), 259-275.
Igbaria, M., & Tan, M. (1998). The Virtual Workplace. Idea Group Publishing,
Hershey, PA.
Kirschner, F., Paas, F., & Kirschner, P. A. (2009). Individual and group-based
learning from complex cognitive tasks: Effects on retention and transfer
efficiency. Computers in Human Behavior, 25(2), 306-314.
14
Colonial Academic Alliance Undergraduate Research Journal, Vol. 1 [2010], Art. 8
https://scholarworks.wm.edu/caaurj/vol1/iss1/8

Mesmer-Magnus, J. R., & DeChurch, L. A. (2009). Information sharing and team
performance: A meta-analysis. Journal of Applied Psychology, 94(2), 535-
546.
Muchinsky, P. M. (1977). Organizational communication: relationships to
organizational climate and job satisfaction. The Academy of Management
Journal, 20(4), 592-607.
Penn, A., Desyllas, J. & Vaughan, L. (1999). The space of innovation: interaction
and communication in the work environment. Environment and Planning
B-Planning & Design 26(2), 193-218.
Peponis, J., Bafna, S., Bajaj, R., Bromberg, J., Congdon, C., Rashid, M., et al.
(2007). Designing space to support knowledge work. Environment and
Behavior, 39(6), 815-840.
Pfeffer, J. (1982) Organizations and Organization Theory. Pitman, Marshfield,
MA.
Ramirez, A., Jr., & Zhang, S. (2007). When online meets offline: The effect of
modality switching on relational communication. Communication
Monographs, 74(3), 287-310.
Rashid, M., Kampschroer, K., Wineman, J., & Zimring, C. (2006). Spatial layout
and face-to-face interaction in office study of the mechanisms of spatial
effects on face-to-face interaction. Environment and Planning B: Planning
and Design, 33, 825-844.
Reagans, R., & Zuckerman, E. W. (2001). Networks, Diversity, and Productivity:
The Social Capital of Corporate R&D Teams. Organization Science,
12(4), 502-517.
Selfhout, M., Burk, W., Branje, S., Denissen, J., van Aken, M., & Meeus, W.
(2010). Emerging late adolescent friendship networks and Big Five
personality traits: A social network approach. Journal of Personality,
78(2), 509-538.
Short, J. A. (1974). Effects of medium of communication on experimental
negotiation. Human Relations, 27(3), 225-234.
Strubler, D. C., & York, K. M. (2007). An exploratory study of the Team
Characteristics Model using organizational teams. Small Group Research,
38(6), 670-695.
Wall, T. D., Kemp, N. J., Jackson, P. R., & Clegg, C. W. (1986). Outcomes of
Autonomous Workgroups: A Long-Term Field Experiment. The Academy
of Management Journal, 29(2).
APPENDIX
15
Wolfeld: Effects of Office Layout
Published by W&M ScholarWorks, 2010
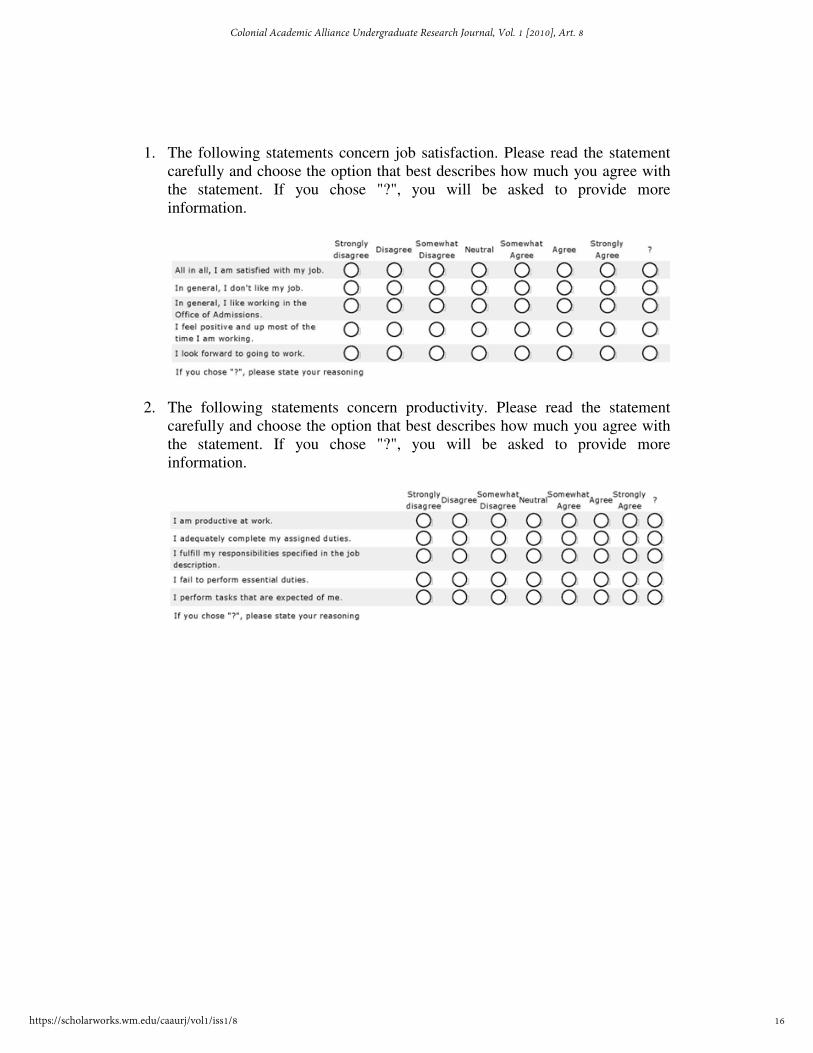
1. The following statements concern job satisfaction. Please read the statement
carefully and choose the option that best describes how much you agree with
the statement. If you chose "?", you will be asked to provide more
information.
2. The following statements concern productivity. Please read the statement
carefully and choose the option that best describes how much you agree with
the statement. If you chose "?", you will be asked to provide more
information.
16
Colonial Academic Alliance Undergraduate Research Journal, Vol. 1 [2010], Art. 8
https://scholarworks.wm.edu/caaurj/vol1/iss1/8

3. The following statements concern organizational commitment. Please read the
statement carefully and choose the option that best describes how much you
agree with the statement. If you chose "?", you will be asked to provide more
information.
4. The following statements concern workplace characteristics. Please read the
statement carefully and choose the option that best describes how much you
agree with the statement. If you chose "?", you will be asked to provide more
information.
17
Wolfeld: Effects of Office Layout
Published by W&M ScholarWorks, 2010

5. The following statements concern workplace experiences. Please read the
statement carefully and choose the option that best describes how much you
agree with the statement. If you chose "?", you will be asked to provide more
information.
6. The following statements concern group work. Please read the statement
carefully and choose the option that best describes how much you agree with
the statement. If you chose "?", you will be asked to provide more
information.
7. The following statements concern workplace policies and practices. Please
read the statement carefully and choose the option that best describes how
much you agree with the statement. If you chose "?", you will be asked to
provide more information.
18
Colonial Academic Alliance Undergraduate Research Journal, Vol. 1 [2010], Art. 8
https://scholarworks.wm.edu/caaurj/vol1/iss1/8

8. The following statements concern both the outcomes and the workplace.
Please read the statement carefully and choose the option that best describes
how much you agree with the statement. If you chose "?", you will be asked to
provide more information.
9. What percent of your work time do you spend in each of the following
locations? Percentage (0 – 100%)
10. When working in the Office of Admissions what percent of your total work
time do you spend on the following activities? Percentage (0 – 100%)
19
Wolfeld: Effects of Office Layout
Published by W&M ScholarWorks, 2010
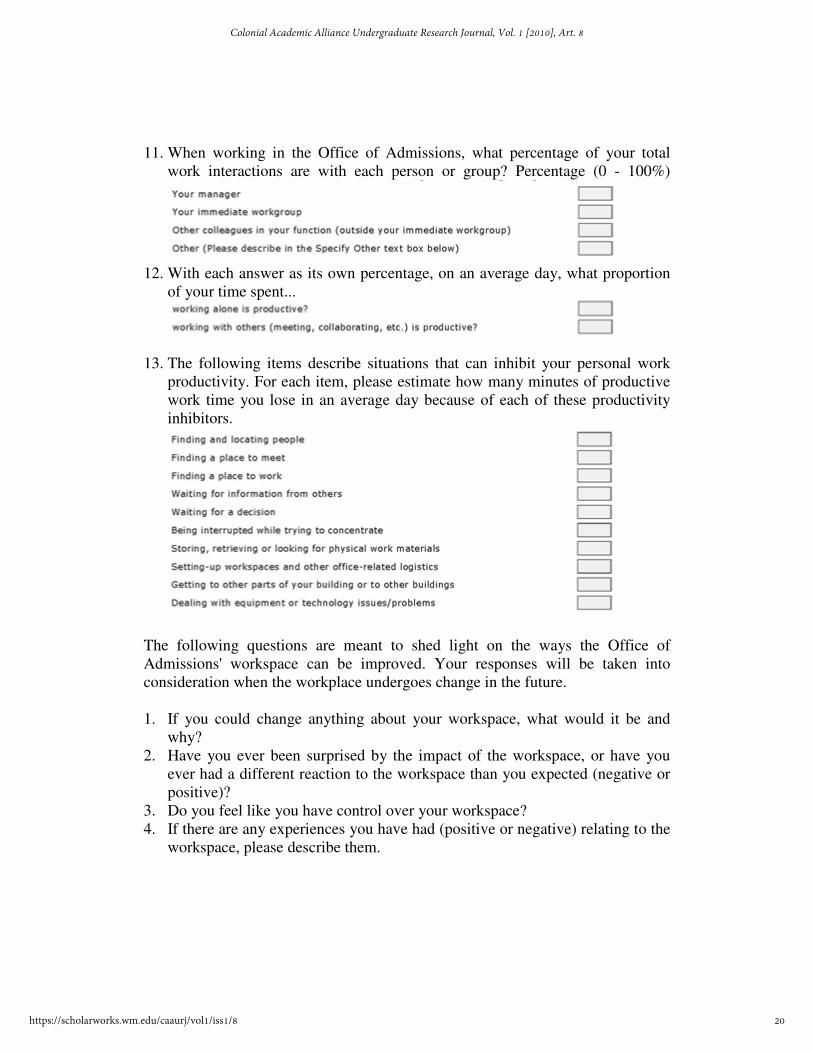
11. When working in the Office of Admissions, what percentage of your total
work interactions are with each person or group? Percentage (0 - 100%)
12. With each answer as its own percentage, on an average day, what proportion
of your time spent...
13. The following items describe situations that can inhibit your personal work
productivity. For each item, please estimate how many minutes of productive
work time you lose in an average day because of each of these productivity
inhibitors.
The following questions are meant to shed light on the ways the Office of
Admissions' workspace can be improved. Your responses will be taken into
consideration when the workplace undergoes change in the future.
1. If you could change anything about your workspace, what would it be and
why?
2. Have you ever been surprised by the impact of the workspace, or have you
ever had a different reaction to the workspace than you expected (negative or
positive)?
3. Do you feel like you have control over your workspace?
4. If there are any experiences you have had (positive or negative) relating to the
workspace, please describe them.
20
Colonial Academic Alliance Undergraduate Research Journal, Vol. 1 [2010], Art. 8
https://scholarworks.wm.edu/caaurj/vol1/iss1/8

Please answer the following questions. All information is strictly for academic
purposes and will be kept confidential.
1. What is your position at Mason’s Office of Admissions?
2. Are you currently enrolled in classes at Mason?
3. How long have you worked in Mason’s Office of Admissions?
4. On average, how many hours a week do you work in Mason’s Office of
Admissions?
21
Wolfeld: Effects of Office Layout
Published by W&M ScholarWorks, 2010


