Effects of non-linear soil behaviour on the seismic ... · PDF fileIn order to investigate the...
14
RIVISTA ITALIANA DI GEOTECNICA 2/2008 Effects of non-linear soil behaviour on the seismic performance evaluation of structures Esteban Saez,* Fernando Lopez-Caballero,* Arezou Modaressi-Farahmand-Razavi* Summary When an earthquake occurs, the surrounding soil and the structural elements can exhibit non-linear behaviour. In com- mon practice, only non-linear behaviour of structural elements is evaluated. But, actually, the soil reaches the limit of its elastic behaviour before the structural elements. In general, the soil-structure interaction effects are assumed beneficial and thus ignored. Nevertheless, a more precise knowledge of the expected structural seismic response can allow to reduce the cost of the structure and to improve the earthquake engineering practice. This paper concerns the assessment of the effects of non-linear soil behaviour on the structural seismic demand evaluation. For this purpose, non-linear dynamic analyses are performed in order to study the role of several parameters on the seismic performance evaluation. This paper presents a summary of the main findings. Keywords: Seismic Performance Evaluation, Capacity Spectrum Method, non-linear Soil-Structure Interaction. 1. Introduction In the present earthquake engineering practice, the capacity spectrum method is widely used for seismic performance evaluation of existing and new structures. Nevertheless, usually the effects of dy- namic soil-structure interaction (SSI) and the non- linear behaviour of the surrounding ground are ne- glected. Some simplified procedures taking into account the dynamic SSI effects on the determination of the design earthquake forces and the corresponding dis-placements exist. For instance, FEMA 356 [2000] and ATC-40 [1996] documents give some provisions to include ground flexibility in the struc- tural analysis model. Recently, FEMA 440 [2003] draft document proposes some techniques to im- prove the traditional non-linear static seismic anal- ysis. Concerning soil-structure interaction effects, this document presents procedures to take into ac- count kinematical effects as well as foundation damping effects. Kinematical effects are related to filtering the ground shaking transmitted to the structure i.e. a modification factor is applied to the input motion. Foundation damping is combined with the structural damping to obtain a revised damping for the system. All these procedures are based on traditional soil-structure interaction ex- pressions with linear-elastic soil behaviour assump- tion. However, it is well-known that the limit of lin- ear-elastic soil behaviour is very low (γ <10 -5 ). This strain limit is normally exceeded during a real mo- tion. In this work the influence of SSI effects on the seismic performance evaluation is investigated. For this purpose, numerical simulations of pushover tests and non-linear dynamic analyses (i.e. non-lin- earity of the soil and the structure behaviour) are performed in order to study the role of several pa- rameters on the seismic performance evaluation. This parametric study concerns the mechanical properties of the soil foundation (e.g. V s30 and fun- damental soil deposit frequency) and the structure (i.e. fundamental period, effective height and mass) as well as the characteristics of the input motion (i.e. amplitude and frequency content). Thus, several 2D finite element computations are carried out using non-linear elastoplastic models to represent both the soil and the structure behaviour. Results ob- tained by simplified computations performed fol- lowing a two-step approach (which will be described below), are compared with the ones obtained from fully non-linear time-history finite element model- ling analyses. These results allow to identify and to quantify the differences between the two approaches. Thus, it is possible to establish the situations for which the approximate techniques might tend to overestimate or underestimate the displacement demand. We present a summary of the main findings including some recommendations to consider in a perform- ance evaluation following the Capacity Spectrum Method (CSM). * Laboratoire MSS-Mat CNRS UMR 8579, Ecole Centrale Paris, Grande Voie des Vignes, 92290 Châtenay-Malabry, France
Transcript of Effects of non-linear soil behaviour on the seismic ... · PDF fileIn order to investigate the...
RIVISTA ITALIANA DI GEOTECNICA 2/2008
Effects of non-linear soil behaviour on the seismic performance evaluation of structures
Esteban Saez,* Fernando Lopez-Caballero,* Arezou Modaressi-Farahmand-Razavi*
SummaryWhen an earthquake occurs, the surrounding soil and the structural elements can exhibit non-linear behaviour. In com-
mon practice, only non-linear behaviour of structural elements is evaluated. But, actually, the soil reaches the limit of itselastic behaviour before the structural elements. In general, the soil-structure interaction effects are assumed beneficial andthus ignored. Nevertheless, a more precise knowledge of the expected structural seismic response can allow to reduce thecost of the structure and to improve the earthquake engineering practice. This paper concerns the assessment of the effectsof non-linear soil behaviour on the structural seismic demand evaluation. For this purpose, non-linear dynamic analysesare performed in order to study the role of several parameters on the seismic performance evaluation. This paper presentsa summary of the main findings.
Keywords: Seismic Performance Evaluation, Capacity Spectrum Method, non-linear Soil-Structure Interaction.
1. Introduction
In the present earthquake engineering practice,the capacity spectrum method is widely used forseismic performance evaluation of existing and newstructures. Nevertheless, usually the effects of dy-namic soil-structure interaction (SSI) and the non-linear behaviour of the surrounding ground are ne-glected.
Some simplified procedures taking into accountthe dynamic SSI effects on the determination of thedesign earthquake forces and the correspondingdis-placements exist. For instance, FEMA 356[2000] and ATC-40 [1996] documents give someprovisions to include ground flexibility in the struc-tural analysis model. Recently, FEMA 440 [2003]draft document proposes some techniques to im-prove the traditional non-linear static seismic anal-ysis. Concerning soil-structure interaction effects,this document presents procedures to take into ac-count kinematical effects as well as foundationdamping effects. Kinematical effects are related tofiltering the ground shaking transmitted to thestructure i.e. a modification factor is applied to theinput motion. Foundation damping is combinedwith the structural damping to obtain a reviseddamping for the system. All these procedures arebased on traditional soil-structure interaction ex-pressions with linear-elastic soil behaviour assump-tion. However, it is well-known that the limit of lin-
ear-elastic soil behaviour is very low (γ<10-5). Thisstrain limit is normally exceeded during a real mo-tion.
In this work the influence of SSI effects on theseismic performance evaluation is investigated. Forthis purpose, numerical simulations of pushovertests and non-linear dynamic analyses (i.e. non-lin-earity of the soil and the structure behaviour) areperformed in order to study the role of several pa-rameters on the seismic performance evaluation.This parametric study concerns the mechanicalproperties of the soil foundation (e.g. Vs30 and fun-damental soil deposit frequency) and the structure(i.e. fundamental period, effective height and mass)as well as the characteristics of the input motion (i.e.amplitude and frequency content). Thus, several 2Dfinite element computations are carried out usingnon-linear elastoplastic models to represent boththe soil and the structure behaviour. Results ob-tained by simplified computations performed fol-lowing a two-step approach (which will be describedbelow), are compared with the ones obtained fromfully non-linear time-history finite element model-ling analyses.
These results allow to identify and to quantifythe differences between the two approaches. Thus,it is possible to establish the situations for which theapproximate techniques might tend to overestimateor underestimate the displacement demand. Wepresent a summary of the main findings includingsome recommendations to consider in a perform-ance evaluation following the Capacity SpectrumMethod (CSM).
* Laboratoire MSS-Mat CNRS UMR 8579, Ecole Centrale Paris, Grande Voie des Vignes, 92290 Châtenay-Malabry, France
64 SAEZ - LOPEZ-CABALLERO - MODARESSI-FARAHMAND-RAZAVI
RIVISTA ITALIANA DI GEOTECNICA
2. Proposed approaches
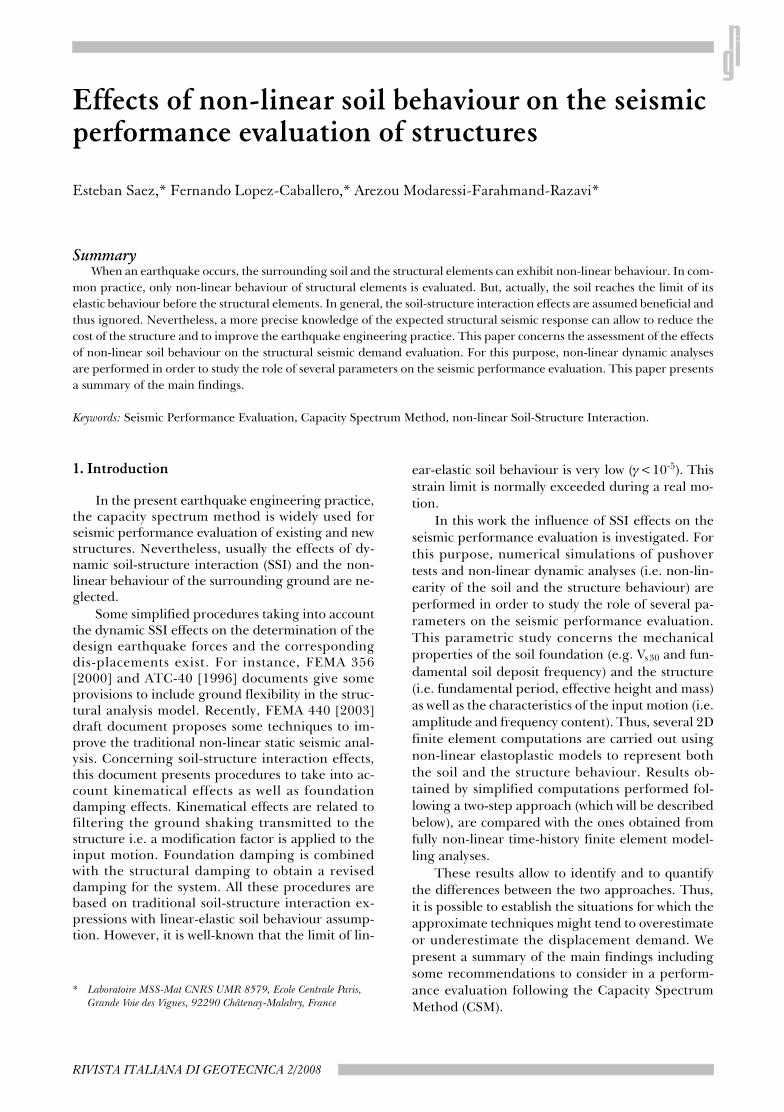
In order to investigate the effect of non-linearsoil behaviour on seismic demand evaluation, acomparative dynamic analysis is carried out. First, acomplete finite element model including soil andstructural non-linear behaviour is used to asses theeffect of non-linear dynamic soil-structure interac-tion on the structural response. Secondly, a two-stepapproach is carried out where: a non-linear 1D wavepropagation problem is solved for a soil column ofthe foundation soil. Next, the obtained free fieldmotion is imposed as the ground motion to a fixedbase structural model. The two approaches aresketched in Figure 1.
The analysis is carried out for several non-lin-ear SDOF models, with fundamental period vary-ing from 0.1 s to 0.4 s. The mass and height of eachSDOF is obtained with typical weight and heightvalues, relating its fundamental period to thenumber of levels of the structure. The same infi-nitely rigid shallow foundation is considered for allSDOF models.
In order to simulate the soil foundation, twonon-linear homogenous dense sandy soil depositswere used. The first one is in dry condition and thesecond one is fully saturated. The bedrock is placedat the depth of 30 m. Four Europeans earthquakesare considered, scaled to different maximum out-cropping acceleration values.
2.1. Soil constitutive model
The ECP’s elastoplastic multi-mechanismmodel [AUBRY and MODARESSI, 1992; HUJEUX, 1985] ,commonly called Hujeux model is used to representthe soil behaviour. This model can take into accountthe soil behaviour in a large range of deformations.The model is written in terms of effective stress. Therepresentation of all irreversible phenomena ismade by four coupled elementary plastic mecha-nisms: three plane-strain deviatoric plastic defor-mation mechanisms in three orthogonal planes andan isotropic one. The model uses a Coulomb typefailure criterion and the critical state concept. Theevolution of hardening is based on the plastic strain(deviatoric and volumetric strain for the deviatoricmechanisms and volumetric strain for the isotropicone). To take into account the cyclic behaviour akinematical hardening based on the state variablesat the last load reversal is used. The soil behaviouris decomposed into pseudo-elastic, hysteretic andmobilized domains.
The model’s parameters of the soil are obtainedusing the methodology suggested by LOPEZ-CABAL-LERO et al. [2003; 2007]. In order to verify themodel’s parameters, the behaviour of the sand mustbe studied by simulating drained (DCS) and und-rained cyclic shear tests (UCS). The Figure 2a showsthe response of a DCS test obtained by the model ofthe sand at an effective stress of 100 kPa. The test re-sults are compared with the reference curves givenby IWASAKI [1978].
Fig. 1 – Summary of proposed approaches.Fig. 1 – Sintesi degli approcci proposti.

65EFFECTS OF NON-LINEAR SOIL BEHAVIOUR ON THE SEISMIC PERFORMANCE EVALUATION OF STRUCTURES
APRILE - GIUGNO 2008
In saturated conditions, the evolution of shearstrain and pore pressure can be observed during theUCS. The Figure 2c and Figure 2d shows the testsimulation for a stress controlled shear test with thesame model’s parameters. The generation of porepressure reduces the effective stress inducing cyclicmobility without liquefaction.
Two levels of water table were considered:deeper than the model (dry) and at surface level (sat-urated or wet). The shear wave velocity of the soil in-creases with depth (Fig.6a). The shear wave velocityprofile gives an average shear wave velocity in the up-per 30 m (VS ,30) of 232.8 m/s for dry conditions and204.3 m/s for saturated condition. This soil profilecorresponds to a category C site of Eurocode 8 (deepdeposit of dense or medium dense soil) in both cases.
2.2. Structural model
The typical one-story frame chosen to representeach SDOF structure is shown in Figure 3a. Themass of the building is assumed to be uniformly dis-tributed along beam elements and the columns are
supposed massless. Non-linear material behaviouris taken into account through an elastic-perfect plas-tic strain-stress relation. Figure 3b shows a normal-ized moment-curvature (M –Ψ) diagram obtainedfrom the computation of a simply fixed beam withthis behaviour model. As it can be noticed, the stiff-ness decreases when the elastic limit is reached (atMy or Ψy), and under load reversal the curve formshysteresis loops. The maximum resisting momentremains constant under increasing deformation andthe member rotates as a hinge with this constant re-sisting moment. The value of stress yield is sup-posed to be the same for all computations.
The elastic modulus (E) and the yielding stress(σy) of structural elements are 25.5 GPa and 18 MPa,respectively. The mass and height of each SDOF isobtained with typical weight and height values. A typ-ical value of 20000 kg is assumed for each level. Aconstant value of 2.5 m is considered for each inter-story height. Thus, the equivalent SDOF correspond-ing to a building of n levels is computed assuming amass of 20000n (kg), a fixed base period of T0 = n/10(s) and equivalent height H = 2/3 × 2.5n (m), and fi-
Fig. 2 – Simulated drained (DCS) and undrained (UCS) cyclic shear test results obtained with the soil’s constitutive model.Fig. 2 – Risultati delle simulazioni di prove di taglio ciclico drenate (DCS) e non drenate (UCS) condotte con il modello costitutivo adottato per il terreno.

66 SAEZ - LOPEZ-CABALLERO - MODARESSI-FARAHMAND-RAZAVI
RIVISTA ITALIANA DI GEOTECNICA
nally solving for b and h (lateral stiffness). Table Ishows the basic properties for the used SDOF.
A viscous damping of β i = 0.02 was consideredfor all computations. The same infinitely rigid shal-low foundation with a characteristic length of 6mwas used for alls SDOF.
2.3. Input earthquake motion
The used seismic input motions are the acceler-ation records of Friuli earthquake - San-Rocco site(Italy-1976), Superstition Hills earthquake - Supers.Mountain site (USA-1987), Kozani earthquake(Greece - 1995) and Aegion earthquake (Greece -1995). The frequency content was characterizedwith the mean period (Tm) [RATHYE et al., 1998] (Tab.II). All signals are consistent with the response spec-tra of Type A soil of Eurocode 8.
Each motion will be used as the outcroppingmotion and scaled to different values ranging from0.15 g to 0.30 g linearly increased by an incrementof 0.05 g, resulting in a total of 16 events for eachframe on dry soil. For frames exhibiting importantnon-linear structural behavior, this range will be ex-tended to 0.35 g (see section 4).
2.4. Finite element approach (SSI-FE)
The Finite Element model is composed of: thestructure, the soil foundation and a part of the bed-rock. The considered structure is a one-story, onebay frame. The 30 m thick homogenous soil depositis modelled by 4 node linear elements. In the bot-tom, a layer of 5 m of elastic bedrock (Vs = 1000 m/sand ρ = 2000 kg/m3) is added to the model. The fi-nite element mesh used for modelling this problemis showed in Figure 4. Plane strain condition is as-sumed for the soil deposit and the bedrock.
As the main purpose of this paper is to investi-gate the role of the general parameters as T0, Tm,[aout], etc. in order to establish general tendencies ofthe results and identify when the non-linear SSI is amajor issue, the set of SDOFs analysed for this pa-per does not correspond to a specific set of struc-tures. They are idealizations of typical values ofheight, mass and fundamental periods. The effect ofthe structural weight on the effective stress in thesoil is neglected in this paper and will be extensivelytreated in further works.
For the bedrock’s boundary condition, paraxialelements simulating a deformable unbounded bedrockhave been used. The incident waves, defined at theoutcropping bedrock are introduced into the base
Fig. 3 – Structural model description.Fig. 3 – Descrizione del modello strutturale.
Tab. I – Properties of equivalent SDOF.Tab. I – Caratteristiche delle strutture SDOF equivalenti.
Tab. II – Used input earthquake motions.Tab. II – Terremoti di input utilizzati nelle analisi.

67EFFECTS OF NON-LINEAR SOIL BEHAVIOUR ON THE SEISMIC PERFORMANCE EVALUATION OF STRUCTURES
APRILE - GIUGNO 2008
of the model after deconvolution. In the analysis, asthe lateral limits of the problem are considered tobe far enough periodic conditions are verified.Then, only vertically propagating shear waves arestudied resulting in the free field response. Thus,equivalent boundaries have been imposed on thenodes of these boundaries (i.e. the normal stress onthese boundaries remains constant and the dis-placements of nodes at the same depth in two oppo-site lateral boundaries are the same in all direc-tions). Thus, the obtained movement at the bedrockis composed of the incident waves and the reflectedsignal. The computations are carried-out in thetime domain. The simulations are performed withthe Finite Element tool GEFDYN [AUBRY et al.,1985; AUBRY and MODARESSI, 1996].
2.5. Numerical tool Validation
Before proceeding to the non-linear analysis ef-fects, a validation of the soil-structure interactionphenomenon assuming linear elasticity behaviourfor both the soil and the structure is performed (i.e.a sample seismic signal is imposed at very low am-plitude to ensure linear-elastic soil behaviour). Atwo-story frame taken from [SAEZ et al., 2006] (fixedbase fundamental frequency of 4.25 Hz) is supposedto lie on the studied soil profile under dry condi-tion. Figure 5 shows the obtained response of spec-tral ratio amplitude between the displacements atthe top and at the base (top/base) of the structurecompared with the response calculated using thenumerical BE-FE tool MISS3D [CLOUTEAU, 2003] forthe dry soil case. Figure 5 also shows the spectral ra-tio amplitude between the free field and the bed-rock motion (ff/bedrock) and the fixed base transferfunction of the structure. For coupled BE-FE com-putations, the analysis is directly carried out in thefrequency domain.
For linear elastic SSI computations, the first twonatural frequencies of the soil profile are 2.2(Tsoil = 0.46 s) and 6.15 Hz (Fig.5). Thus, due to the
value of the fixed base fundamental frequency ofthe structure compared to the one of elastic soil de-posit (i.e. fstr > fsoil), it is expected that SSI phenom-ena appears.
From the comparative results, it can be seen thatthe two different results obtained by the tools are inperfect agreement. The shift of the main frequencyof the structure to 4.17 Hz results from the flexibilityof the foundation soil, whereas the change in theamplitude results from the material soil and radia-tion damping added. The numerical value of periodshifting is compatible with the standard simple ex-pression to compute linear-elastic soil-structure in-teraction provided in design codes.
2.6. Two-step approach
The first step is to solve a non-linear one-di-mensional wave propagation prob-lem for a soil col-
Fig. 4 – Finite element mesh.Fig. 4 – Reticolo di elementi finiti.
Fig. 5 – Spectral ratio amplitudes obtained with the cou-pled BE-FE linear elastic tool MISS3D compared to FEcomputations with GEFDYN for an elastic domain.Fig. 5 – Rapporti di ampiezza spettrale ottenuti con il codice elastico lineare BE-FE MISS3D e con il codice GEFDYN nel caso di risposta elastica lineare.

68 SAEZ - LOPEZ-CABALLERO - MODARESSI-FARAHMAND-RAZAVI
RIVISTA ITALIANA DI GEOTECNICA
umn. The mesh consists of one column of solid ele-ments obeying the same constitutive model as in theSSI-FE approach. The same boundary conditionshave been imposed. The incident waves, defined atthe outcropping bedrock, are introduced into thebase of the model after deconvolution. In the sec-ond step, the obtained free field motion is imposedas the ground motion to a fixed base structuralmodel. This two-step approach neglects all SSI ef-fects, but takes into account the effect of non-linear-ity behaviour of both soil and structure.
3. Soil analysis and results
In order to define the input motion for the two-step approach, a free field dynamic analysis of thesoil profile is performed. The response of the freefield soil profile is analysed for the four earthquakerecords (Tab. II) as outcropping input with ampli-tudes increased with an increment of 0.05 g from
0.1 g to 0.5 g.The Figure 6b shows the obtained val-ues and a tendency curve for the PGA (Peak GroundAcceleration) with respect to maximum accelerationon the bedrock (amax,bedrock). These results are com-pared with the one for an AB deep soil profile ac-cording to the classification proposed by DICKENSON
and SEED [1996]. It is possible to see that for weakbase acceleration, the behaviour of both dry and sat-urated soil deposits is similar and thus the reductionin the effective stress due tue water has not evidenteffect. It is noted that an amplification of theground response for moderate range of amax,bedrock isobtained. For strong base acceleration the soil weak-ening attenuates the seismic motion. In saturatedconditions, the pore pressure build-up acts as a fre-quency filter and the soil de-amplifies the input mo-tion for large amax,bedrock values [GHOSH and MADAB-HUSHI, 2003; LOPEZ-CABALLERO, 2008].
The influence of the inelastic behaviour of thesoil deposit on the structural response can be di-rectly related to 2% damped pseudo-acceleration
Fig. 6 – Effect of the presence of water on soil response.Fig. 6 – Effetto della presenza dell’acqua sulla risposta del terreno.
Fig. 7 – Effect of the water on PSA.Fig. 7 – Effetto della presenza dell’acqua sul PSA.

69EFFECTS OF NON-LINEAR SOIL BEHAVIOUR ON THE SEISMIC PERFORMANCE EVALUATION OF STRUCTURES
APRILE - GIUGNO 2008
response spectra (PSA) at the free field. The com-parison between outcropping and obtained freefield normalized PSA for different acceleration lev-els using Friuli earthquake scaled to 0.10 g (Fig. 7a)and 0.35 g (Fig. 7b) are shown in Figure 7. For weakacceleration (aout = 0.1 g), the computed PSA is sim-ilar for both dry and saturated cases shouing thetthe modification in the initial effective stress due tothe presence of water has not a significant influence.
According to Figure 7b (aout = 0.35 g), the spec-tral amplitude of saturated soil is greater than thatof dry soil for large periods. This amplification ofthe PSA for the saturated soil with respect to dry soilcan be explained by the pore water pressure built up(Fig. 8) phenomenon properly simulated by the soilconstitutive model [LOPEZ-CABALLERO, 2008]. Forshort periods, the spectral amplitude of saturatedsoil is smaller than that of dry soil. It can be noted
that it is not possible to identify this feature of soilbehaviour using a simplified approach such asequivalent linear method.
4. Non-linear SSI analysis and results
Concerning the seismic demand evaluation, themaximum top displacement D (top drift) and itscorresponding base shear, in terms of spectral accel-eration A, are plotted for each studied SDOF struc-ture following the two approaches for dry soil. Foreach SDOF, the corresponding capacity curve ob-tained by modelling the pushover test is also plotted(dashed lines in Fig. 9a).
In the SSI-FE approach, the obtained structuralresponse for SDOFs with T0 ≤0.25 s is approxi-mately elastic even for high acceleration levels. Thepurpose of the paper is to investigate the role of thenon-linear soil behaviour on the computed struc-tural damage (i.e. structural non-linear behaviour).In order to focus the analysis of the results on theSDOFs exhibiting non-linear behaviour, theT0=0.3 s and T0=0.4 s SDOFs were studied for aslighty larger range of outcropping acceleration lev-els (0.1 g ÷ 0.35 g) compared to 0.1 g 0.3 g rangeused for the other SDOFs. Similary, the saturatedsoil case is carried out only for T0 = 0.3 s andT0=0.4 s frames.
To visualize the SSI effect on seismic demandevaluation, it is possible to take for example theT0=0.4 s fundamental period SDOF (Fig.9b). Solidsymbols correspond to the two-step approach, whilethe hollow ones are obtained by the SSI-FE ap-proach. Each point represents a response obtainedby one input motion scaled to a specific value.
The effect of the non-linear SSI on the seis-mic response can be represented by the ratioDtwostep/DSSIFE between the computed top drift ob-
Fig. 8 – Pore pressure ratio ru at 4m depth for two earth-quake amplitudes. Fig. 8 – Rapporto di pressione interstiziale ru alla profondità di 4 m dal piano campagna, per due terremoti di diversa ampiezza.
Fig. 9 – Summary of computations.Fig. 9 – Sintesi dei risultati delle simulazioni.

70 SAEZ - LOPEZ-CABALLERO - MODARESSI-FARAHMAND-RAZAVI
RIVISTA ITALIANA DI GEOTECNICA
tained following the two-step approach (Dtwostep) andthe computed value from the SSI-FE approach(DSSIFE) for the same outcropping motion. Figures10a and 10b show this ratio in terms of the outcrop-ping acceleration imposed (aout) for the four usedmotions, with amplitudes varying from 0.1 g to 0.35g with an increment of 0.05 g.
It is well-known that the stiffness degradation ofthe soil of the foundation introduces additionaldamping in the system, modifying the structural re-sponse. Additionally, radiation damping appears.According to our computations, the predicted topdisplacement obtained by the two-step approach isconservative, i.e. larger than the one obtained in theSSI-FE approach if Tm ~< 1.3T0. On the contrary, formean periods Tm larger than approximately 1.3 ti-mes the fixed base fundamental period of the frameT0, the two-step computations give smaller valuescompared to non-linear SSI approach. Further-more, the evolution of this ratio with the amplitudedepends on the frame. For the T0=0.4 s, the valuesof the ratio DItwostep/ DISSIFE vary between 0.6 and 0.8for motions with Tm≤1.3T0, but for the T0=0.3 s theratio varies between 0.5-1.1 for the same range ofTm.
Figure 9a shows that, even for relatively weakmotion, the SSI-FE dynamic response of the struc-ture (hollow symbols)is not placed on the pushovercurve. Then, the non linear soil behaviour and theSSI effect induce a significant variation of the effec-tive period (Teff) of the structure and can decrease/increase the top displacement depending on themotion characteristics (Tm and aout) and the struc-ture properties (T0 and m). In order to explain thisbehaviour, it is possible to see the distribution ofprincipal strains in the neighboring soil of the struc-
ture during the Friuli earthquake scaled to 0.25 g atoutcropping (Fig. 11a).
Figures 11b and 11c show the the principalstrains distribution in two different steps of the anal-ysis (Fig. 11a). After the first part of strong motion(t = 3.6 s) the soil is extensively deformed, then forthe subsequent part of the motion its stiffness anddamping differ considerably from their initial val-ues. After the strong motion (t=12 s), an asymmet-rical distribution of irreversible deformations isfound. Permanent settlements are also generated.This soil deformation induces a high material soildamping. This damping has a direct influence onthe seismic response of the structure and it cannotbe properly evaluated following a fixed based ap-proach or even if elastic SSI is taken into account.Therefore, the total seismic demand is highly con-trolled by the surrounding non-linear soil behav-iour. For motions able to induce damage into astructure, the soil behaviour will be certainly non-linear.
To complete the previous analysis, the saturatedsoil results are also included in Figure l2a for theT0=0.4 s SDOF. The tendency of the results is thesame. The computed results are clearly aligned fol-lowing an effective period. This value of Teff can becalculated from a linear fìtting. After this approxi-mately linear portion, the computed values of seis-mic demand approach asymptotically the fìxed basecapacity curve. The plateau of the curve does notchange because it depends only upon the strengthof structural elements. For a given motion, it can benoticed that the Performance Point (P.P.) from thetwo-step dynamic computation is approximatelyplaced on the capacity curve; this indicates that ca-pacity spectrum method is adequate for fixed baseanalysis. However, when SSI effects are taken into
Fig. 10 – Top drift ratio between two-step computation (Dtwostep) and SSI-FE approach DSSIFE for T0 = 0.3s (a) and 0.4s (b)frames in terms of the maximum imposed outcropping acceleration.Fig. 10 – Rapporto tra gli spostamenti orizzontali calcolati nelle analisi “two-step” (Dtwo-step) e SSI-FE (DSSI-FE) per telai con T0 = 0.3 s (a) and 0.4 s (b), in funzione della massima accelerazione imposta aout.

71EFFECTS OF NON-LINEAR SOIL BEHAVIOUR ON THE SEISMIC PERFORMANCE EVALUATION OF STRUCTURES
APRILE - GIUGNO 2008
account, the P.P. from SSI-FE dynamic computationis placed approximately on the modified capacityspectrum with Teff (Fig. l2b).
4.1. Period lengthening due to SSI
The computed effective period (Teff) may be re-lated to the height (h), mass (m) and foundationcharacteristic length (a) (Fig. 13) of the SDOF struc-ture by traditional linear elastic soil-structure inter-action expressions for rigid shallow foundations.
Fig. 11 – Principal strains and the deformed mesh (scaled ×50) in the neighboring saturated soil for two different steps ofanalysis for the T0 = 0.3 s SDOF.Fig. 11 – Analisi con struttura SDOF, con T0 = 0.3s. Direzione e ampiezza delle deformazioni principali, sovrapposte al reticolo deformato (spostamenti amplificati di 50 volte), nelle vicinanze della struttura, per due diversi passi di calcolo.
Fig. 12 – Summary of results.Fig. 12 – Sintesi dei risultati.
Fig. 13 – Geometrical scheme.Fig. 13 – Schema geometrico.
72 SAEZ - LOPEZ-CABALLERO - MODARESSI-FARAHMAND-RAZAVI
RIVISTA ITALIANA DI GEOTECNICA
With these expressions, an effective shear wave ve-locity can be computed (Vs,eff)
(1):
where v is the Poisson ratio and p is the mass perunit volume of the soil.
It is possible to obtain for each SDOF, the varia-tion of effective period and effective shear wavevelocity.
According to Figure 14a, soil-structure interac-tion effects seem important only for structures withelastic periods placed between the two first elasticperiods of the soil deposit (T1
soil and T2soil). For pe-
riods smaller than the second period of soil, the ef-fective periods approach quickly that of the fixedbase value. The ratio between the fixed base valueand effective value is near to 90% for this type ofsoil.
From Figure 14b, it can be noticed that the ef-fective shear wave velocity is approximately con-stant for structures with fundamental periods be-tween the two first ones of the soil. This value can beconsidered like approximately constant and equalto two third of VS ,30 Eurocode 8’s parameter in thiscase. Then, according to our results, a typical value
of VS ,30 into traditional elastic SSI relations can
be used to compute an effective period for the usedSDOFs.
4.2. Structural damping quantification
The application of the CSM procedure impliesthe computation of an equivalent viscous damping
coefficient at the performance point (βeq). This pa-rameter includes the inherent structural damping (βi) andthe damping related to the damage of the structure(β0).
A bilinear representation of the capacity spec-trum is constructed following ATC-40 guidelines toestimate β0 (Fig. 15a). The values of β0 are com-puted using f ixed base capacity spectrum.Figure 15b show the computed values of dampingas a function of the peak ground acceleration at thefree field (amax,ff). (solid symbols on Fig. 15b). ForSSI-FE computations, the capacity spectrum curvefitted using the obtained results of the dynamic SSIcomputations was used. With this capacity spectrum,the equivalent viscous damping β0 values are alsocomputed using the bilinear approximation sug-gested by ATC-40 (hollow symbols on Fig. 15b).Some cases exhibiting structural linear behaviourhave been omitted in Figure 15b: outcropping ac-celerations of 0.1 g and Aegion earthquake.
It can be noticed that the damping developed inthe structure is significantly reduced when SSI ef-fects are included in computations. According toour results, for motions with a frequency contentnear to the fundamental period of the fixed base
structure (i.e. ) the damping attains a
maximum, i.e. a higher level of damage. The damp-ing added to the system by nonlinear soil behaviourincreases the energy dissipation mechanisms, thenthe expected damage in the structure is reduced.
When the ratio is near to 1.4, the structural
behaviour for fixed based condition is approxi-mately elastic. But, when SSI effects are taken intoaccount, the structure develops nonlinear behaviourand undergoes damage. In this case, the lengthen-ing of fundamental period approaches the effective
Fig. 14 – Effective period and shear wave velocity values.Fig. 14 – Valori efficaci del periodo e della velocità delle onde di taglio.

73EFFECTS OF NON-LINEAR SOIL BEHAVIOUR ON THE SEISMIC PERFORMANCE EVALUATION OF STRUCTURES
APRILE - GIUGNO 2008
period value to resonance condition and inducesplasticity in the structure for moderate values of ac-celeration thus increasing the damping.
4.3. Damage index
The damage index used in this paper to evalu-ate the structural damage of the structures is basedon the PARK and ANG damage model [PARK and ANG,1985] for reinforced concrete. The PARK and ANG
damage model accounts for damage due to maxi-mum inelastic excursions, as well as damage due tothe history of deformations. Both components ofdamage are linearly combined.
Two damage indices are computed using thisdamage model:– Local element damage index (DIloc): columns
and beams.– Overall structure damage (DIov).
Since the inelastic behaviour is confined to plas-tic zones near the ends of some members, the rela-tion between element and overall structure integrityis not direct. According to the used structural non-linear model, for each element section i, it is possi-ble to compute a local index of damage (Fig. 16a):
(2)
Fig. 15 – Equivalent damping computation.Fig. 15 – Calcolo dello smorzamento equivalente.
(a) Bilinear representation of the capacity curve:α is the ratio of postyield stiffness to effectiveelastic stiffness (Ke) and µ is the ductility factor.
(b) βi + β0 values for T0 = 0.3s SDOF. Solidssymbols refer to fixed base computation whilehollow symbols are for SSI-FE approach.Earthquake notation according to Tab. II
Fig. 16 – Damage index computation.Fig. 16 – Calcolo dell’indice di danno.
(a) Shematic representation of the use damageindex.
(b) Overall damage index for the T0=0.3s SDOFon dry soil.

74 SAEZ - LOPEZ-CABALLERO - MODARESSI-FARAHMAND-RAZAVI
RIVISTA ITALIANA DI GEOTECNICA
where Ψm,i is the maximum curvature reached dur-ing the load history, Ψu is the ultimate curvature ca-pacity of the section, My is the yield moment and Ei
is the energy dissipated in the section. λp is a modelconstant parameter. For nominal strength deterio-ration of reinforced concrete sections a value of 0.1for this parameter has been suggested by the sameauthor [PARK and ANG, 1985]. The value of My iscomputed for a simple fixed beam with the used structur-al non-linear model (Fig.3b). Finally, the Ψu value cor-responds to the most plastified section at the end ofpushover test.
The overall damage index is computed usingweighting factors based on dissipated hysteretic en-ergy at each component section i:
(3)
where λi are the energy weighting factors of the sec-tion i.
Figure 16b displays the computed overall dam-age index of the T0=0.4 s SDOF on dry soil for SSI-FE computations (hollow symbols) and two-step ap-proach (solid symbols) in terms of the Arias intensityat the base of the structure (IAbase). When SSI effectsare taken into account, in general a reduction ofdamage index is found. Assuming that a thresholdlimit for slight damage can be fixed at DIov<0.3, theSSI-FE computations shows that this limit is reachedonly if Tm is larger than the SDOF’s effective funda-mental period Teff. If Tm<Teff, the non-linear soil be-havior avoids the structural damage. Furthermore,only for fixed-based computation the total collapseis found, i.e. a DIov near to 1.
5. Vulnerability Assessment
According to the results of the previous section,the dynamic non-linear soil-structure interactioncan significantly modify the structural damage in-duced by an earthquake, then a variation of seismicvulnerability is expected. In order to investigate theeffect of non-linear SSI on the vulnerability assess-ment, a fragility curve approach is followed in termsof more representative index of structural damagerather than an equivalent viscous damping coeffi-cient βeq.
The likelihood of structural damage due to dif-ferent levels of seismic ground motion can be ex-pressed by a fragility curve. The fragility curve de-scribes the damage probability corresponding tospecific damage state, for various earthquakes. If itis assumed that the fragility curve can be expressedin the form of two-parameters lognormal distribu-
tion function, the corresponding analytical form(F(a)) is:
(4)
where a represents the Arias Intensity (IArias) [ARIAS,1970] and Φ is the standardized normal distributionfunction. The distribution parameters α and β canbe obtained following the maximum likelihoodmethod treating each event of damage as a realiza-tion from a Bernouilli experiment [SHINOZUKA,1998]. The likelihood function is expressed as:
(5)
where ak is the Arias Intensity of the kth set of accele-ration time histories to which each structure is sub-jected, yk represents the realization of the Bernouillirandom variable Yk with yk = 1 or 0 depending onwhether or not the structure sustains the specificstate of damage under the IArias equal to ak, and N isthe total number of sets of time histories for whichthe structure is analyzed. The computation is per-formed numerically using a standard optimizationalgorithm.
Two different damage levels are defined interms of the overall damage index DIov. The firstone, corresponds to a none to slight damage, and itis assumed for a value of DIov<0.3. The second one,associated with a moderate damage, is defined for avalue of 0.3 ≤ DIov < 0.6.
For problems involving stiffness degradation,the duration and the frequency content of strongmotion (i.e. severity intensity) have a great effect onthe response of the system. A measure characteriz-ing the severity intensity of an earthquake can bethe Arias Intensity.
Figures 17a and 17b displays the computed fra-gility curves for the damage states related to thedamage index defined below. Figure 17a shows thecomputed fragility curves by following the two-stepapproach for the T0=0.4 s SDOF. The fragilitycurves obtained for the second approach (SSI-FE)for the same structure are showed in Figure 17b.The fragility curves reflect the variations of the com-puted damage index obtained for each case(Fig.16b). In Figures 17a and 17b, black cross areused to plot the corresponding values of yk for slightdamage levels and grey circles the correspondingvalues of yk for moderate damage.
In the case when the SSI is taken into accountdirectly, (SSI-FE) a significantly higher level of seis-mic energy is required to induce a damage.

75EFFECTS OF NON-LINEAR SOIL BEHAVIOUR ON THE SEISMIC PERFORMANCE EVALUATION OF STRUCTURES
APRILE - GIUGNO 2008
6. Conclusions
Non-linear dynamic soil-structure interactionanalysis is a complex problem were several phenom-ena take place and interact with each other. Some ofthis aspects have been studied in this paper in orderto highlight the influence of some parameters con-cerning the structure, the input signal and the soil.
The main conclusion of this study is that thesoil-structure interaction with a non-linear soilmodel varies significantly the response of the stud-ied structure set with respect to the one with fixedbase condition.
It is well-known that the soil exhibits an elasticbehaviour only in a very small range of distortion.This range is certainly exceeded for a motion able toinduce inelastic deformations in a structure. Thus, acoupled approach using non-linear structural be-haviour with linear soil hypothesis is not consistent.In fact, the results show that when non-linear SSI isproperly taken into account, the seismic demand isnot on the capacity curve.
According to our computations and for the stud-ied cases, a first approximation for Teff may be ob-
tained with Vs,30 and with traditionally elastic SSI
expressions. Nevertheless, the major challenge toquantify the non-linear SSI effects in seismic de-mand evaluation is to predict an accurate globaldamping, able to be related to a simpler approach.
Concerning the vulnerability assessment, ac-cording to our computations, if the SSI is taken intoaccount, a higher level of seismic energy is requiredto exceed a moderate damage level (DIov) for a givenlikelihood. For none to slight damage level, the typeof followed approach seems not to be important forvulnerability evaluation purposes.
The results of the study illustrate clearly the im-portance of accounting for the non-linear soil be-
haviour. In this case, the non-linear SSI has a fa-vourable effect related to decreasing the maximumtop displacements and the base forces. However,the non-linear SSI could increase or decrease theseismic demand depending on the type of thestructure (e.g. m, h and T0), the input motion (e.g.Tm), and the dynamic soil properties (e.g. Tsoil,Vs,30). Furthermore, there is an economic justifica-tion to take into account the modification effectsdue to non-linear soil behaviour. Further investiga-tions in this way will be needed in order to obtainmore general conclusions for diverse structure andsoil typologies.
Acknowledgements
This work has benefited of a grant from theFrench “Agence National de la Recherche” in theframework of the VEDA (Seismic Vulnerability ofstructures: a Damage mechanics Approach) re-search project (ANR-05-CATT-017-01). E. Saez hasbeen partially financed by CONICYT-Embassy ofFrance in Chile Postgraduate Fellowship Programand BRGM.
References
ARIAS A. (1970) – A measure of earthquake intensity.Seismic design for nuclear power plants. R.J.Hansen. MIT Press. Cambridge, Mass, pp. 438-483.
AUBRY D., CHOUVET D., MODARESSI A., MODARESSI H.(1985) – GEFDYN 5, Logiciel d’analyse du comporte-ment statique et dynamique des sols par éléments finisavec prise en compte du couplage sol-eau-air.
AUBRY D., MODARESSI A. (1992) – Strain localization inmultipotential elastoplasticity. International Journal
Fig. 17 – Computed fragility curves.Fig. 17 – Curve di fragilità calcolate.

76 SAEZ - LOPEZ-CABALLERO - MODARESSI-FARAHMAND-RAZAVI
RIVISTA ITALIANA DI GEOTECNICA
for Numerical Methods in Engineering, 3, 34,pp. 349-363.
AUBRY D., MODARESSI A. (1996) – GEFDYN ManuelScientifique.
ATC 40 (1996) – Seismic evaluation and retrofit of con-crete buildings. Report ATC, Applied TechnologyCouncil.
CLOUTEAU D. (2003) – MISS 6.3 Manuel Utilisateur.DICKENSON S., SEED R. (1996) – Nonlinear dynamic re-
sponse of soft and deep cohesive soil deposits. in: Proc.of the International Workshop on Site ResponseSubjected to Strong Earthquake Motions, Yoko-suka, Japan.
FEMA 356 (2000) – Prestandard and commentary forthe seismic rehabilitation of buildings. Report FEMA,Federal Emergency Management Agency.
FEMA 450 (2003) – NEHRP recommended provisionsfor seismic regulations for new buildings and otherstructures. Provisions. commentary. Report FEMA,Federal Emergency Management Agency.
GHOSH B., MADABHUSHI S.P.G. (2003) – Effects of local-ised soil inhomogenity in modyfyng seismic soil structureinteraction. in: 16th ASCE Engineering MechanicsConference, University of Washington, Seattle.
HUJEUX J. (1985) – Une loi de comportement pour lechargement cyclique des sols. in: Génie Parasis-mique, Presse ENPC, pp. 287-302.
IWASAKI T., TATSUOKA F., TAKAGI Y. (1978) – Shearmoduli of sands under cyclic torsional shear loading.Soils and Foundations, 18, (1), pp. 39-55.
LOPEZ-CABALLERO F. (2008) – Modaressi-FarahmandRazavi, Numerical simulation of liquefaction effects onseismic ssi. Soil Dynamics and Earthquake Engi-neering, 28, (2), pp. 85-98.
LOPEZ-CABALLERO F., MODARESSI A., ELMI F. (2003) –Identification of an elastoplastic model parameters us-ing laboratory and in-situ tests. in: DeformationCharacteristics of Geomaterials ISLyon 03, pp.1183-1190.
LOPEZ-CABALLERO F., MODARESSI A., MODARESSI H.(2007) – Nonlinear numerical method for earthquakesite response analysis i- elastoplastic cyclic model andparameter identification strategy. Bulletin of Earth-quake Engineering, 5, (3), pp. 303-323.
PARK Y., ANG A. (1985) – Mechanistic seismic damagemodel for reinforced concrete. Journal of StructuralEngineering, ASCE, 111, (4), pp. 722-739.
RATHJE E., ABRAHAMSON N., BRAY J. (1998) – Simplifiedfrequency content estimates of earthquake ground mo-tions. Journal of Geotechnical and Geoenviron-mental Engineering, 124, (2), pp. 150-159.
SAEZ E., LOPEZ-CABALLERO F., MODARESSI A. (2006) –Effects of ssi on the capacity spectrum method. in: Proc.First European Conference on Earthquake Engi-neering and Seismology, p. id 1073.
SHINOZUKA M. (1998) – Statical analysis of bridge fragil-ity curves. in: Proceedings of the US-Italy Work-shop on Protective Systems for Bridges, NewYork, N.Y.
Effects of non-linear soil behaviour on
the seismic performance evaluation of
structures
SommarioDurante un evento sismico, le strutture e il terreno
interagente con esse possono manifestare una risposta non lineare. Nella pratica corrente, tuttavia, solo il comportamento non lineare degli elementi strutturali viene preso in conto nelle analisi di interazione terreno-struttura, nonostante il terreno raggiunga il limite elastico ben prima degli elementi strutturali. In generale, gli effetti della interazione terreno-struttura sono considerati benefici per la struttura e sono dunque ignorati in favore di sicurezza. Peraltro, una descrizione più accurata della risposta strutturale attesa in condizioni sismiche può consentire una significativa riduzione dei costi e può condurre, più in generale, ad un miglioramento delle pratiche progettuali correnti in ingegneria antisismica.
Obiettivo del presente lavoro è la valutazione dell’influenza del comportamento non lineare dei terreni di fondazione sulla previsione della richiesta di prestazione sismica delle strutture. A tale scopo, una serie di simulazioni dinamiche non lineari sono state condotte in forma parametrica per analizzare il ruolo dei diversi parametri del modello sulla risposta sismica prevista. L’articolo sintetizza i principali risultati di tale lavoro.