Effects of Nanotexture on Electrical Profiling of Single ... of nanotexture on... · Effects of...
9
1 SCIENTIFIC REPORTS | 5:13031 | DOI: 10.1038/srep13031 www.nature.com/scientificreports Effects of Nanotexture on Electrical Profiling of Single Tumor Cell and Detection of Cancer from Blood in Microfluidic Channels Muhymin Islam 1,2,3 , Mohammad Motasim Bellah 1,3,4 , Adeel Sajid 1,3,4 , Mohammad Raziul Hasan 1,2,3 , Young-tae Kim 3,5,6 & Samir M. Iqbal 1,2,3,5,6 Microfluidic channels have been implemented to detect cancer cells from blood using electrical measurement of each single cell from the sample. Every cell provided characteristic current profile based on its mechano-physical properties. Cancer cells not only showed higher translocation time and peak amplitude compared to blood cells, their pulse shape was also distinctively different. Prevalent microfluidic channels are plain but we created nanotexture on the channel walls using micro reactive ion etching (micro-RIE). The translocation behaviors of the metastatic renal cancer cells through plain and nanotextured PDMS microchannels showed clear differences. Nanotexture enhanced the cell-surface interactions and more than 50% tumor cells exhibited slower translocation through nanotextured channels compared to plain devices. On the other hand, most of the blood cells had very similar characteristics in both channels. Only 7.63% blood cells had slower translocation in nanotextured microchannels. The tumor cell detection efficiency from whole blood increased by 14% in nanotextured microchannels compared to plain channels. This interesting effect of nanotexture on translocation behavior of tumor cells is important for the early detection of cancer. Circulating tumor cells (CTCs) are found in peripheral blood of many cancer patients 1–3 . Definite enu- meration of CTCs can serve as an indicator of the effectiveness of therapeutic interventions and to estimate disease prognosis 4–6 . Exceedingly low numbers of CTCs, ranging 1-200 per milliliter (ml) of blood, makes it extremely challenging to detect them 7–11 . A number of cancer cell sorting techniques like centrifugation, chromatography, and fluorescence/magnetic-activated cell sorting have been employed, however, these are limited in yield, and purity 12 , and some of these require expensive optical equip- ment 5,13–15 . Microfluidic systems have emerged as fascinating platforms to detect cancer cells. Due to high specificity and selectivity, aptamers have been incorporated in several microfluidic setups to detect and enrich tumor cells 13,15–17 . However, aptamers are not available for all types of cancers. eir reproduction and faithful attachment to device surfaces is also composed of long and tedious processes. erefore, label-free microfluidic isolation that does not require multiple additional “tags” or “labels” of rare cells is preferable 18 . e opportunity lies in using distinctive physical properties of CTCs such as density, adhesion, size, and deformability for label-free separation. 1 Nano-Bio Lab, University of Texas at Arlington, Arlington, TX 76019, USA. 2 Department of Electrical Engineering, University of Texas at Arlington, Arlington, TX 76011, USA. 3 Nanotechnology Research Center, University of Texas at Arlington, Arlington, TX 76019, USA. 4 Department of Interdisciplinary Studies and Department of Biology, University of Texas at Arlington, Arlington, TX 76011, USA. 5 Department of Bioengineering, University of Texas at Arlington, Arlington, TX 76010, USA. 6 Department of Urology, University of Texas Southwestern Medical Center at Dallas, Dallas, Texas, 75390, USA. Correspondence and requests for materials should be addressed to S.M.I. (email: [email protected]) Received: 15 January 2015 Accepted: 16 July 2015 Published: 16 September 2015 OPEN
-
Upload
trinhtuong -
Category
Documents
-
view
214 -
download
1
Transcript of Effects of Nanotexture on Electrical Profiling of Single ... of nanotexture on... · Effects of...
1Scientific RepoRts | 5:13031 | DOi: 10.1038/srep13031
www.nature.com/scientificreports
Effects of Nanotexture on Electrical Profiling of Single Tumor Cell and Detection of Cancer from Blood in Microfluidic ChannelsMuhymin Islam1,2,3, Mohammad Motasim Bellah1,3,4, Adeel Sajid1,3,4, Mohammad Raziul Hasan1,2,3, Young-tae Kim3,5,6 & Samir M. Iqbal1,2,3,5,6
Microfluidic channels have been implemented to detect cancer cells from blood using electrical measurement of each single cell from the sample. Every cell provided characteristic current profile based on its mechano-physical properties. Cancer cells not only showed higher translocation time and peak amplitude compared to blood cells, their pulse shape was also distinctively different. Prevalent microfluidic channels are plain but we created nanotexture on the channel walls using micro reactive ion etching (micro-RIE). The translocation behaviors of the metastatic renal cancer cells through plain and nanotextured PDMS microchannels showed clear differences. Nanotexture enhanced the cell-surface interactions and more than 50% tumor cells exhibited slower translocation through nanotextured channels compared to plain devices. On the other hand, most of the blood cells had very similar characteristics in both channels. Only 7.63% blood cells had slower translocation in nanotextured microchannels. The tumor cell detection efficiency from whole blood increased by 14% in nanotextured microchannels compared to plain channels. This interesting effect of nanotexture on translocation behavior of tumor cells is important for the early detection of cancer.
Circulating tumor cells (CTCs) are found in peripheral blood of many cancer patients1–3. Definite enu-meration of CTCs can serve as an indicator of the effectiveness of therapeutic interventions and to estimate disease prognosis4–6. Exceedingly low numbers of CTCs, ranging 1-200 per milliliter (ml) of blood, makes it extremely challenging to detect them7–11. A number of cancer cell sorting techniques like centrifugation, chromatography, and fluorescence/magnetic-activated cell sorting have been employed, however, these are limited in yield, and purity12, and some of these require expensive optical equip-ment5,13–15. Microfluidic systems have emerged as fascinating platforms to detect cancer cells. Due to high specificity and selectivity, aptamers have been incorporated in several microfluidic setups to detect and enrich tumor cells13,15–17. However, aptamers are not available for all types of cancers. Their reproduction and faithful attachment to device surfaces is also composed of long and tedious processes. Therefore, label-free microfluidic isolation that does not require multiple additional “tags” or “labels” of rare cells is preferable18. The opportunity lies in using distinctive physical properties of CTCs such as density, adhesion, size, and deformability for label-free separation.
1Nano-Bio Lab, University of Texas at Arlington, Arlington, TX 76019, USA. 2Department of Electrical Engineering, University of Texas at Arlington, Arlington, TX 76011, USA. 3Nanotechnology Research Center, University of Texas at Arlington, Arlington, TX 76019, USA. 4Department of Interdisciplinary Studies and Department of Biology, University of Texas at Arlington, Arlington, TX 76011, USA. 5Department of Bioengineering, University of Texas at Arlington, Arlington, TX 76010, USA. 6Department of Urology, University of Texas Southwestern Medical Center at Dallas, Dallas, Texas, 75390, USA. Correspondence and requests for materials should be addressed to S.M.I. (email: [email protected])
Received: 15 January 2015
Accepted: 16 July 2015
Published: 16 September 2015
OPEN

www.nature.com/scientificreports/
2Scientific RepoRts | 5:13031 | DOi: 10.1038/srep13031
Several studies have demonstrated that cell capture, cell growth, adhesion and orientation are influ-enced by nanoscale topography of the surfaces19–22. In tissue engineering, studies have shown that nano-structured scaffolds can significantly increase densities of certain cells23,24. Some applications of textured surfaces are also found in biosensors, proteomics, and light emitting diodes25–28. Nanotextured surfaces can be prepared using processes like micro-contact printing, stencil assisted patterning, long polymer chemical etching etc. which are all time-consuming or cost-prohibitive19,22,29. Several studies have also reported plasma etching to prepare nanotextured surfaces30–32.
Recently, we reported single micropore device to detect tumor cells from whole blood at an efficiency of 70%1. The tumor cells exhibited characteristic electrical signals which distinguished the malignant cells from the other blood-based cells. Here, a microfluidic channel device with nanotextured walls is shown to detect metastatic renal cancer cells from mixture of whole blood based on their translocation behavior at 86% efficiency. The nanotexture resulted in added feature to slow down the translocation of more than 50% of tumor cells. Consequently, the added tumor cell detection efficiency came from fun-damental cell-surface interactions which mimic cell-basement membrane interactions that occur during intravasation and extravasation. It is known that metastatic tumor cells depict large elastic deformations to pass through endothelial cell layers and basement membrane during these steps33.
The translocation mechanism of cells depends on applied fluid pressure, cell size, orientation of the cells, cellular and nuclear mechanical properties and interactions of cells with the surface of the device5,14,34. The mechanical rigidity of a cell is defined by its cytoskeleton components, which in turn is a function of cell health35,36. When a normal cell mutates to a malignant one, it undergoes reorganization of the cytoskeleton which leads to changes in mechanical properties of that cell. It has been reported already that many types of cancer cells not only have larger sizes than red and white blood cells (RBCs and WBCs), but also have different elasticity than healthy cells5,14,34.
The reported microdevice is simple, reusable and efficient. This scheme does not require fluores-cent tags, surface functionalization or pre-processing of the blood except dilution for the detection of tumor cells. As cells pass through the microchannel, the physical blockage of the channel results into distinctive current pulses for different cells. Pulse magnitude depends on the cell size and pulse duration corresponds to the time required for the cell to pass through the microchannel. The translocation time depends on cell elasticity and cell-surface interactions in the channel. Pulse shape corresponds to the physical and mechanical properties of the cells. The tumor cells show distinctive translocation behavior because of their size, mechano-physical properties, and possibly due to their increased interactions with the nanotextured surfaces.
Materials and MethodsAll chemicals were obtained from Sigma-Aldrich (St. Louis, MO) unless noted otherwise. All the meth-ods were carried out in accordance with the approved guidelines.
Device Fabrication. Soft lithography was done to fabricate the PDMS device and micro-RIE was used to create nanotexture. The microfluidic device contained one inlet and one outlet connected via single microchannel. The dimension of the channel was 20 μ m × 20 μ m × 5 μ m (width × height × length) (Fig. 1(A)). The layout of the device was first designed in AutoCAD and transferred to a glass photomask. The device was fabricated on a silicon wafer by spin coating SU-8 2010 (1000 rpm, 35 seconds) followed by photolithography. Next, the pattern was translated to PDMS which was mixed (10:1, wt/wt) with Sylgard 184 silicone elastomer curing agent (Dow Corning). This mixture was degassed in a desiccator
Figure 1. (A) Schematic diagram of the measurement setup. The syringe pump is connected to the inlet of microfluidic device. The Ag/AgCl electrode pair is connected to data acquisition system (DAQ) to record the data. (B) Optical micrograph of the microchannel.
www.nature.com/scientificreports/
3Scientific RepoRts | 5:13031 | DOi: 10.1038/srep13031
for 1 h to get rid of the bubbles. Then PDMS was poured on the master and heated to 75 °C for 5 min and then 150 °C for 10 min. The PDMS mold was peeled off the master and fluidic ports were punched in PDMS mold. The mold was cleaned in isopropyl alcohol (IPA), rinsed in de-ionized water (DI water) and dried in nitrogen flow.
To create nanotexture, the channel surface was etched in reactive ion etch series 800 plasma system. The etching was performed using oxygen (O2) and carbon tetra fluoride (CF4) for 20 min. After etch, device was washed in sonicated IPA followed by dip in piranha solution (H2O2:H2SO4 in a 1:3 ratio). Glass slides, cleaned in piranha solution, were used to cover both nanotextured and plain PDMS devices. The PDMS devices with glass slides were treated with UV-Ozone plasma for 15 min and hermetically bonded together. The fabricated devices were filled with 1X PBS that contained 5 mM magnesium chloride (pH 7.5).
Device Characterization. A confocal microscope was used to image the fabricated silicon master mold (Fig. 1(B)) and KLA-Tencor Alpha-Step IQ profilometer was used to measure heights of the fea-tures. Surface topography of PDMS and nanotextured PDMS surfaces were evaluated quantitatively using a Dimension 5000 atomic force microscope (AFM). The root mean square surface roughness was meas-ured over scan area of 10 μ m × 10 μ m. Micrographs of PDMS samples were captured in the ambient air with 15% to 20% humidity at a tapping frequency of ~300 kHz. The analyzed field was measured at a scan rate of 1 Hz with 256 scanning lines.
Measurement Setup and Optimization of the System. The measurement setup was very similar as it has been reported before1. Ag/AgCl electrodes were biased through a data acquisition card (National Instruments) to measure ionic current. The inlet of the microchannel was connected to a syringe pump (Harvard Apparatus) through a tubing adapter. The cells were suspended in phosphate buffered saline (PBS) and controlled fluid pressure was applied using the syringe pump to push cells through microchan-nel. Schematic diagram of the entire measurement setup is shown in Fig. 1(A). The ionic conductivity of the microchannel reduced due to physical blockage of the channel when cells passed. The microfluidic device consisted of single channel and the dimensions of the channel did not allow more than one tumor cell to travel through. It has been reported before that at a flow rate above 20 μ l/min, the measurement system would miss some fast cell translocation events1,37. Additionally, to enhance the cell surface inter-actions lower flow rate is preferable. But lower flow rates, for example 5 μ l/min or less, result into very low throughput. Considering all these constrains, a flow rate of 16.67 μ l/min was used (1 ml/hour). A similar optimization was done for the sampling frequency of the electrical measurements1,37. As a first principle, at 16.67 μ l/min, cells take 15–350 μ s to pass through. These numbers translate to sampling fre-quency range of 0.002–0.04 MHz if we were to measure only one data point for each translocation event. The 0.2 MHz sampling frequency measured a data point after every 5 μ s thus capturing 3 data points for the fastest cell (15 μ s) event and 70 data points for a slowest cell (350 μ s). Hence the current sampling interval was set at 5 μ s (0.20 MHz) and the applied bias voltage was 5 volts.
Human Derived Primary Renal Cancer Cell Culture and Collection of Rat Blood. Metastatic renal tumor cells were isolated from the brain tissue of consenting patient at the University of Texas Southwestern Medical Center at Dallas, Texas, USA as per the approved Institutional Review Board pro-tocol38. The cell dissociation and collection has been reported before39. These cells were known metastatic renal cancer cells that had metastasized to the brain of the patient.
The blood samples were collected from tail of a rat by restraining the animal. The blood was collected in tubes with K2-EDTA as anticoagulant.
Results and DiscussionSurface Topography of Nanotextured Substrates. The measured average roughness of plain and nanotextured PDMS surfaces were19.95 ± 9.17 nm and 519.17 ± 103.71 nm, respectively. The AFM micrographs of plain and nanotextured surfaces are shown in Fig. 2.
Translocation Behavior of Tumor Cells through Plain and Nanotextured Microchannels. The tumor cells were suspended in PBS at a concentration of 1000 cells/ml. These cells were passed through plain and nanotextured microchannels for 10 min. The experiments were repeated at least 5 times. All the cancer cells gave distinct pulses. The values of average current peaks for metastatic tumor cells were not statistically different between two types of devices. For plain and nanotextured microchannels, average current peaks were 20.53 ± 5.21 μ A and 20.76 ± 4.81 μ A, respectively. The average translocation time was higher in nanotextured microchannels compared to plain microchannels. For plain and nanotextured microchannels, average translocation times were 149.23 ± 49.99 μ s and 239.85 ± 62.30 μ s, respectively. More than 50% tumor cells took longer to pass through the nanotextured microchannels compared to plain microchannels (Fig. 3(A)) and the average translocation time increased by ~60% (Fig. 3(B)). Current peak depended on the physical blockage of the channel and amount of blockage depended on cell size and orientation. As the cell sizes were same for both devices the current peak was same (Fig. 3(C)). On the other hand, the translocation time showed difference which stemmed from the cells’ interactions with the nanotextured channel surfaces.

www.nature.com/scientificreports/
4Scientific RepoRts | 5:13031 | DOi: 10.1038/srep13031
Nanotopographic surfaces have various impacts on cell functions40–47. Nanotextured topography offers biomimetic cell-stimulating cues very similar to nanotextured interfaces in vivo. Basement mem-branes of most tissues are composed of complex mixtures of nanoscale structures40. In our experiments, cells sensed nanotopography and reacted by bridging or conforming in a selective manner. The nanos-cale patterning is known to significantly impact the organization and type of focal adhesions either by
Figure 2. AFM micrographs of (A) plain and (B) nanotextured PDMS surfaces. Nanotexture was achieved with O2: CF4 plasma etch.
Figure 3. Translocation behavior of renal cancer cells through plain and nanotextured microchannels (n ≈ 200). (A) Scatter plot shows data for tumor cells through plain channel (♦) and nanotextured channel (◊). (B,C) show the averages of pulse peak amplitudes and pulse widths (translocation time) through the two types of channels (* p-value < 0.01).

www.nature.com/scientificreports/
5Scientific RepoRts | 5:13031 | DOi: 10.1038/srep13031
disrupting their formation or by inducing specific integrin recruitment41. As integrins are directly linked to the nucleus, the response of cells to the nanoscale topography may have also resulted in altered gene expression. Upon adhesion to a substrate, the cells are known to probe their environment and move using nanoscale processes like filopodia and lamellipodia. Filopodia probe the environment and their ends serve as anchor points for cell movement41. Cells also interact with the topography by deform-ing membrane and by modifying the functioning of cell surface. These factors may all be inducing significant impacts on mechanical properties of cells such as stretching, spreading, elasticity etc40–44. Nanotextured surfaces also influence the volume and shape of the nucleus and increase the elastic mod-ulus of the cells42–44. The translocation time of a cell fundamentally depends on the cell elasticity and cell-surface interactions37, but the cumulative effects of aforementioned facts might have all contributed to the increased translocation time of tumor cells in nanotextured microchannels. Statistical analysis of translocation time and peak amplitude for tumor cells in plain and nanotextured microchannels were performed using one-way analysis of variance (ANOVA). The peak amplitude did not show appreciable statistical difference (p-value > 0.7) but translocation time was significantly different between two types of microchannels (p-value < 0.01).
Translocation Behavior of Blood Cells in Plain and Nanotextured Microchannels. Trans- location behavior of blood cells was also characterized through plain and nanotextured microchannels. Blood cells were diluted 100 times in 1X PBS and processed through the microchannels for 5 minutes. The experiments were repeated at least three times and the results through the two types of channels were similar (Fig. 3(B),(C)). The RBCs are smaller compared to WBCs, thus a single RBC would be very small to create significant detectable pulse. The microchannels would miss many of the RBCs. The average peak amplitudes for blood cells in plain and nanotextured microchannels were 2.23 ± 1.53 μ A and 2.43 ± 1.85 μ A, respectively and average translocation times were 66 ± 30.65 μ s and 67.74 ± 36.07 μ s, respectively. Thus, for blood cells, the average translocation time and average peak amplitude were not significantly different between plain and nanotextured microchannels. Only 7.63% blood cells had slightly higher translocation time in nanotextured microchannel compared to plain channel and the average translocation time increased by 2.63%. The nanotexture thus did not show increased affinity towards blood cells. As a result, translocation behavior remained very similar in both microchannels for majority of the blood cells. Statistical analysis of translocation time and peak amplitude in plain and nanotextured microchannels was performed using ANOVA. Statistical difference of translocation time and peak amplitude in two devices was not significant for blood cells (p-values > 0.05).
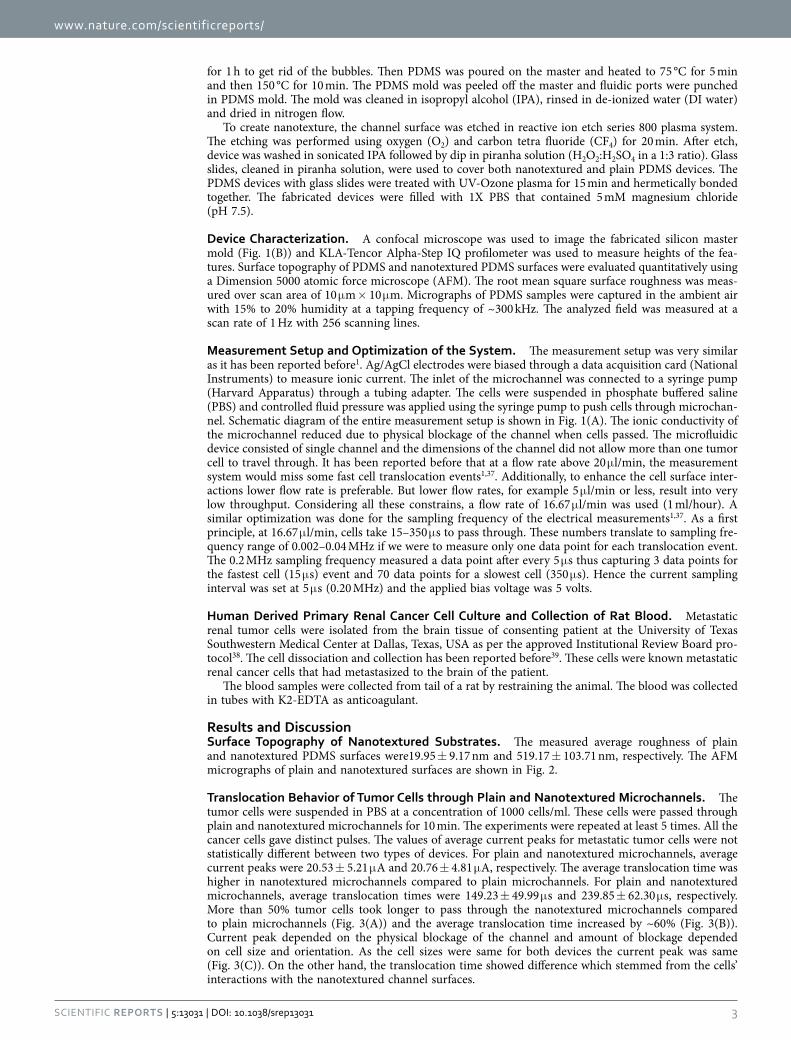
Pulse Shapes of Tumor and Blood Cells. Pulse shapes of cancer cells were very uniform (Fig. 4(A), (B)). Due to deformable nature, pseudopod formation, and interactions with the surface, tumor cells had higher translocation time and ripples of very small magnitude were observed at the bottoms of inverted bell shaped pulses. This is again related to the ionic current stability during the translocation of tumor cells. The pulse bottoms did not show fluctuations like those seen in blood cell pulses. The uniform pulse shape confirmed that only one cancer cell passed through the microchannel at a time and the ionic current was uniformly blocked. The sampling interval of the data acquisition system was 5 μ s. The average translocation times for tumor cells in plain and nanotextured microchannels were 149.23 μ s and 239.85 μ s, respectively. Hence, in plain and nanotextured microchannels a pulse for one tumor cell contained 30 and 48 data points, respectively. Each current value thus corresponded to a cross-sectional contour depicting the physical dimension of the whole cell1. The translocation data gave enough infor-mation to precisely track the three dimensional electrical profile of the tumor cells. From Fig. 4(A),(B) it can be seen that for cancer cells, the pulse width is more in nanotextured microchannel and also higher number of ripples can be seen at the bottom of the pulse. The plausible explanation can be the formation of pseudopods in the nanotextured channel. The interactions of tumor cells were higher with nanotextured surfaces and cells created higher number of pseudopods in nanotextured microchannel19. The formation of pseudopod resulted change in shape of tumor cells and affected their translocation profile. It was also observed that the current rose slightly at the end of every pulse of tumor cells in both types of channels. It was transient and current stabilized in very short period of time (20 μ s). This transient might have been due to sudden rush of ions under the applied bias to equilibrate the potential across the channel. For blood cells, some pulses had several spikes which indicated that more than one cells, most probably RBCs, passed together. The diameters of WBCs vary within a range of 5-16 μ m. The larger WBCs showed deeper pulses but the bottom of the pulses had sharper angles (Fig. 4(C)) as blood cells were stiffer and did not create any pseudopod. Figure 4(D–F) show close-up electrical profile of blood cells. These pulses had multiple spikes or depicted irregular shapes, in contrast to the pulses of cancer cells. At the sampling rate of 5 μ s, in both channels on an average, a pulse contained approximately 13 data points of current for a blood cell. Thus, the pulse shapes can depict the physical dimension of blood cells as well. Statistical analysis of translocation time and peak amplitude for blood and tumor cells showed significant differences between both microchannels (p-value < 0.01).
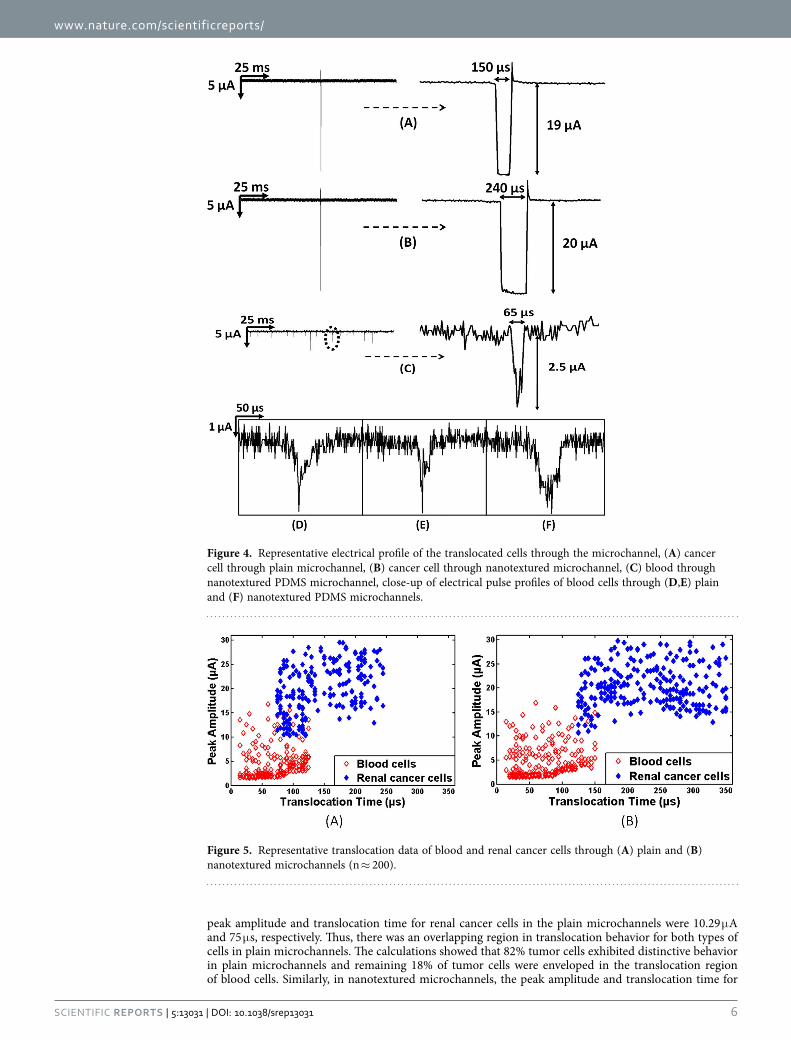
Discrimination of Tumor and Blood Cells. The pulse data for blood and renal cancer cells through plain and nanotextured microchannels is shown in Fig. 5. In plain microchannels, the peak amplitude and translocation time for blood cells were 16.81 μ A and 125 μ s, respectively. On the other hand, lowest
www.nature.com/scientificreports/
6Scientific RepoRts | 5:13031 | DOi: 10.1038/srep13031
peak amplitude and translocation time for renal cancer cells in the plain microchannels were 10.29 μ A and 75 μ s, respectively. Thus, there was an overlapping region in translocation behavior for both types of cells in plain microchannels. The calculations showed that 82% tumor cells exhibited distinctive behavior in plain microchannels and remaining 18% of tumor cells were enveloped in the translocation region of blood cells. Similarly, in nanotextured microchannels, the peak amplitude and translocation time for
Figure 4. Representative electrical profile of the translocated cells through the microchannel, (A) cancer cell through plain microchannel, (B) cancer cell through nanotextured microchannel, (C) blood through nanotextured PDMS microchannel, close-up of electrical pulse profiles of blood cells through (D,E) plain and (F) nanotextured PDMS microchannels.
Figure 5. Representative translocation data of blood and renal cancer cells through (A) plain and (B) nanotextured microchannels (n ≈ 200).
www.nature.com/scientificreports/
7Scientific RepoRts | 5:13031 | DOi: 10.1038/srep13031
blood cells were 16.95 μ A and 150 μ s, respectively. On the other hand, lowest peak amplitude and translo-cation time for renal cancer cells in nanotextured microchannels were 10.73 μ A and 125 μ s, respectively. In nanotextured microchannels, 93% of tumor cells were discriminated from blood cells based on their translocation time and peak amplitude. Translocation time of tumor cells was higher in nanotextured microchannels as discussed above and consequently the discrimination efficiency was improved.
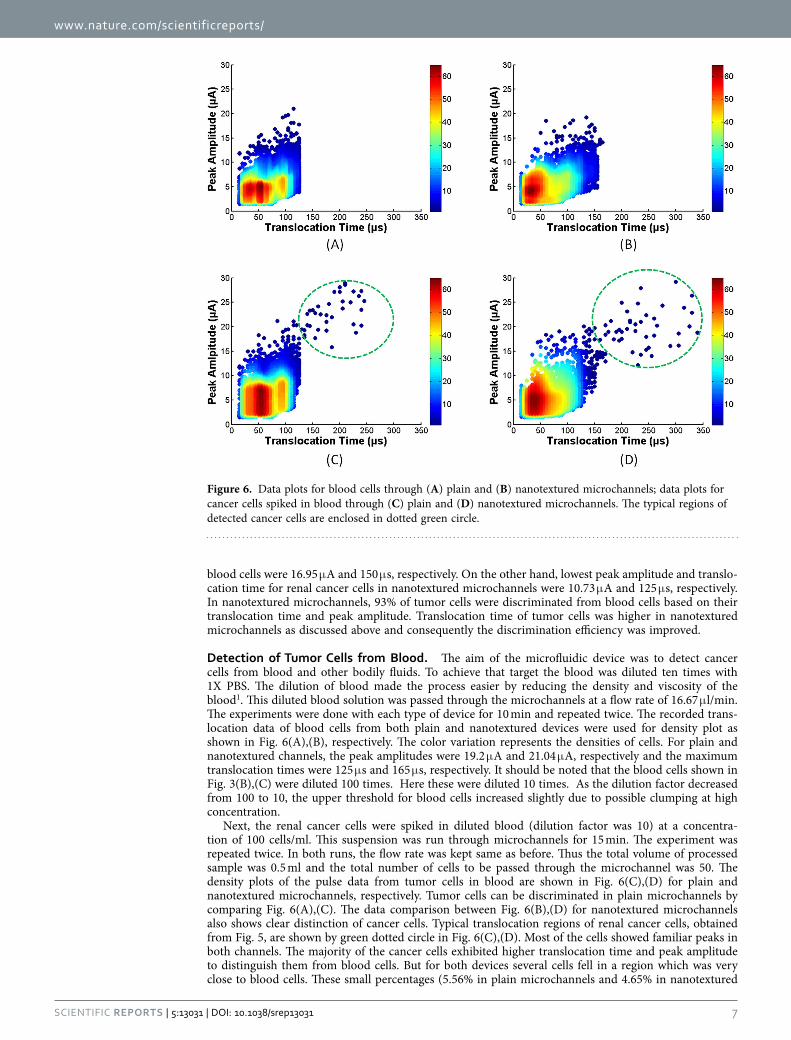
Detection of Tumor Cells from Blood. The aim of the microfluidic device was to detect cancer cells from blood and other bodily fluids. To achieve that target the blood was diluted ten times with 1X PBS. The dilution of blood made the process easier by reducing the density and viscosity of the blood1. This diluted blood solution was passed through the microchannels at a flow rate of 16.67 μ l/min. The experiments were done with each type of device for 10 min and repeated twice. The recorded trans-location data of blood cells from both plain and nanotextured devices were used for density plot as shown in Fig. 6(A),(B), respectively. The color variation represents the densities of cells. For plain and nanotextured channels, the peak amplitudes were 19.2 μ A and 21.04 μ A, respectively and the maximum translocation times were 125 μ s and 165 μ s, respectively. It should be noted that the blood cells shown in Fig. 3(B),(C) were diluted 100 times. Here these were diluted 10 times. As the dilution factor decreased from 100 to 10, the upper threshold for blood cells increased slightly due to possible clumping at high concentration.
Next, the renal cancer cells were spiked in diluted blood (dilution factor was 10) at a concentra-tion of 100 cells/ml. This suspension was run through microchannels for 15 min. The experiment was repeated twice. In both runs, the flow rate was kept same as before. Thus the total volume of processed sample was 0.5 ml and the total number of cells to be passed through the microchannel was 50. The density plots of the pulse data from tumor cells in blood are shown in Fig. 6(C),(D) for plain and nanotextured microchannels, respectively. Tumor cells can be discriminated in plain microchannels by comparing Fig. 6(A),(C). The data comparison between Fig. 6(B),(D) for nanotextured microchannels also shows clear distinction of cancer cells. Typical translocation regions of renal cancer cells, obtained from Fig. 5, are shown by green dotted circle in Fig. 6(C),(D). Most of the cells showed familiar peaks in both channels. The majority of the cancer cells exhibited higher translocation time and peak amplitude to distinguish them from blood cells. But for both devices several cells fell in a region which was very close to blood cells. These small percentages (5.56% in plain microchannels and 4.65% in nanotextured
Figure 6. Data plots for blood cells through (A) plain and (B) nanotextured microchannels; data plots for cancer cells spiked in blood through (C) plain and (D) nanotextured microchannels. The typical regions of detected cancer cells are enclosed in dotted green circle.
www.nature.com/scientificreports/
8Scientific RepoRts | 5:13031 | DOi: 10.1038/srep13031
microchannels) of cells were discriminated by observing pulse shape very closely. In plain microchannel, cancer cells were detected with an efficiency of 72% while in nanotextured microchannel 86% efficiency was achieved. Enhanced cell-surface interactions in nanotextured channel thus appreciably increased the detection efficiency of tumor cells.
ConclusionsMicrofluidic device was fabricated to detect cancer cells from whole blood based on their distinctive translocation behavior. The surface nanotexture of the microfluidic channel retarded the metastatic renal cancer cells’ translocation by 50%. This interesting phenomenon increased tumor cell detection efficiency by 14% in nanotextured microchannel compared to plain channel. There may be possibility of false positives or false negatives, especially if there are larger-than-average blood cells or smaller-than-average tumor cells. This limitation can be overcome by observing the pulse shape closely. But more rigorous approach can be obtained to distinguish tumor cells by considering their biochemical properties. To improve the efficiency and sensitivity ligands such as antibodies or aptamers can be incorporated in the device. Using multiple devices in parallel can increase the throughput. Nanotextured microchannel devices can also be implemented to distinguish various types of cells identify cancer cells at different stages such as metastatic and non-metastatic tumor cells.
References1. Asghar, W. et al. Electrical fingerprinting, 3D profiling and detection of tumor cells with solid-state micropores. Lab on a Chip
12, 2345–2352 (2012).2. Wang, L. et al. Nanostructured substrates for isolation of circulating tumor cells. Nano Today 8, 374–387 (2013).3. Wan, Y. et al. Nanotextured substrates with immobilized aptamers for cancer cell isolation and cytology. Cancer 118, 1145–1154
(2012).4. Kohn, E. C. & Lance, L. A. Molecular insights into cancer invasion: strategies for prevention and intervention. Cancer Research
55, 1856–1862 (1995).5. Yu, K. N. et al. Multiplex targeting, tracking, and imaging of apoptosis by fluorescent surface enhanced Raman spectroscopic
dots. Bioconjugate Chemistry 18, 1155–1162 (2007).6. Vona, G. et al. Isolation by size of epithelial tumor cells: a new method for the immunomorphological and molecular
characterization of circulating tumor cells. The American Journal of Pathology 156, 57–63 (2000).7. Kahn, H. J. et al. Enumeration of circulating tumor cells in the blood of breast cancer patients after filtration enrichment:
correlation with disease stage. Breast Cancer Research and Treatment 86, 237–247 (2004).8. Pelkey, T. J., Frierson, H. F. & Bruns, D. E. Molecular and immunological detection of circulating tumor cells and micrometastases
from solid tumors. Clinical Chemistry 42, 1369–1381 (1996).9. Rolle, A. et al. Increase in number of circulating disseminated epithelial cells after surgery for non-small cell lung cancer
monitored by MAINTRAC® is a predictor for relapse: A preliminary report. World Journal of Surgical Oncology 3, 18 (2005).10. Zieglschmid, V., Hollmann, C. & Bocher, O. Detection of disseminated tumor cells in peripheral blood. Critical Reviews in
Clinical Laboratory Sciences 42, 155–196 (2005).11. Krivacic, R. T. et al. A rare-cell detector for cancer. Proceedings of the National Academy of Sciences of the United States of America
101, 10501–10504 (2004).12. Yu, M. et al. Circulating tumor cells: approaches to isolation and characterization. The Journal of Cell Biology 192, 373–382
(2010).13. Nagrath, S. et al. Isolation of rare circulating tumour cells in cancer patients by microchip technology. Nature 450, 1235–1239
(2007).14. Adams, A. A. et al. Highly efficient circulating tumor cell isolation from whole blood and label-free enumeration using polymer-
based microfluidics with an integrated conductivity sensor. Journal of the American Chemical Society 130, 8633–8641 (2008).15. Zabaglo, L. et al. Cell filtration-laser scanning cytometry for the characterisation of circulating breast cancer cells. Cytometry Part
A 55, 102–108 (2003).16. Dharmasiri, U. et al. Highly efficient capture and enumeration of low abundance prostate cancer cells using prostate-specific
membrane antigen aptamers immobilized to a polymeric microfluidic device. Electrophoresis 30, 3289–3300 (2009).17. Xu, Y. et al. Aptamer-based microfluidic device for enrichment, sorting, and detection of multiple cancer cell. Analytical
Chemistry 81, 7436–7442 (2009).18. Gossett, D. R. et al. Label-free cell separation and sorting in microfluidic systems. Analytical and Bioanalytical Chemistry 397,
3249–3267 (2010).19. Wan, Y. et al. Surface-immobilized aptamers for cancer cell isolation and microscopic cytology. Cancer Research 70, 9371–9380
(2010).20. Asghar, W. et al. Synthesis of nano-textured biocompatible scaffolds from chicken eggshells. Nanotechnology 23, 475601- (2012).21. Islam, M. et al. Nanotextured polymer substrates show enhanced cancer cell isolation and cell culture. Nanotechnology 26, 225101
(2015).22. Bacakova, L. et al. Modulation of cell adhesion, proliferation and differentiation on materials designed for body implants.
Biotechnology Advances 29, 739–767 (2011).23. Thapa, A. et al. Nano-structured polymers enhance bladder smooth muscle cell function. Biomaterials 24, 2915–2926 (2003).24. Miller, D. C. et al. Endothelial and vascular smooth muscle cell function on poly (lactic-co-glycolic acid) with nano-structured
surface features. Biomaterials 25, 53–61 (2004).25. Cheng, M. M.-C. et al. Nanotechnologies for biomolecular detection and medical diagnostics. Current Opinion in Chemical
Biology 10, 11–19 (2006).26. Soleymani, L. et al. Programming the detection limits of biosensors through controlled nanostructuring. Nature Nanotechnology
4, 844–848 (2009).27. Devabhaktuni, S. & Prasad, S. Nanotextured organic light emitting diode based chemical sensor. Journal of Nanoscience and
Nanotechnology 9, 6299–6306 (2009).28. Dylewicz, R. et al. Nanotexturing of GaN light-emitting diode material through mask-less dry etching. Nanotechnology 22,
055301 (2011).29. Park, T. H. & Shuler, M. L. Integration of cell culture and microfabrication technology. Biotechnology Progress 19, 243–253 (2003).

www.nature.com/scientificreports/
9Scientific RepoRts | 5:13031 | DOi: 10.1038/srep13031
30. Tsougeni, K. et al. Control of nanotexture and wetting properties of polydimethylsiloxane from very hydrophobic to super-hydrophobic by plasma processing. Plasma Processes and Polymers 4, 398–405 (2007).
31. Vlachopoulou, M. E. et al. High-aspect-ratio plasma-induced nanotextured poly (dimethylsiloxane) surfaces with enhanced protein adsorption capacity. Journal of Vacuum Science & Technology B: Microelectronics and Nanometer Structures 26, 2543–2548 (2008).
32. Vlachopoulou, M. E. et al. Protein arrays on high-surface-area plasma-nanotextured poly (dimethylsiloxane)-coated glass slides. Colloids and Surfaces B: Biointerfaces 83, 270–276 (2011).
33. Wirtz, D., Konstantopoulos, K. & Searson, P. C. The physics of cancer: the role of physical interactions and mechanical forces in metastasis. Nature Reviews Cancer 11, 512–522 (2011).
34. Lekka, M. et al. Elasticity of normal and cancerous human bladder cells studied by scanning force microscopy. European Biophysics Journal 28, 312–316 (1999).
35. Kumar, S. & Weaver, V. M. Mechanics, malignancy, and metastasis: the force journey of a tumor cell. Cancer and Metastasis Reviews 28, 113–127 (2009).
36. Suresh, S. Biomechanics and biophysics of cancer cells. Acta Materialia 55, 3989–4014 (2007).37. Ilyas, A. et al. Electrophysiological analysis of biopsy samples using elasticity as an inherent cell marker for cancer detection.
Analytical Methods 6, 7166–7174 (2014).38. Valencia, I. M. et al. Glucose metabolism via the pentose phosphate pathway, glycolysis and Krebs cycle in an orthotopic mouse
model of human brain tumors. NMR in Biomedicine 25, 1177–1186 (2012).39. Valencia, I. M. et al. Analysis of tumor metabolism reveals mitochondrial glucose oxidation in genetically diverse human
glioblastomas in the mouse brain in vivo. Cell Metabolism 15, 827–837 (2012).40. Lim, J. Y. & Donahue, H. J. Cell sensing and response to micro-and nanostructured surfaces produced by chemical and
topographic patterning. Tissue Engineering 13, 1879–1891 (2007).41. Anselme, K. et al. The interaction of cells and bacteria with surfaces structured at the nanometre scale. Acta Biomaterialia 6,
3824–3846 (2010).42. McKee, C. T. et al. Topographic modulation of the orientation and shape of cell nuclei and their influence on the measured elastic
modulus of epithelial cells. Biophysical Journal 101, 2139 (2011).43. Hansen, J. C. et al. Effect of surface nanoscale topography on elastic modulus of individual osteoblastic cells as determined by
atomic force microscopy. Journal of Biomechanics 40, 2865–2871 (2007).44. Yim, E. K. F. et al. Nanotopography-induced changes in focal adhesions, cytoskeletal organization, and mechanical properties of
human mesenchymal stem cells. Biomaterials 3, 1299–1306 (2010).45. Prodanov, L. et al. The interaction between nanoscale surface features and mechanical loading and its effect on osteoblast-like
cells behavior. Biomaterials 31, 7758–7765 (2010).46. Kwon, I. K., Kidoaki, S. & Matsuda, T. Electrospun nano-to microfiber fabrics made of biodegradable copolyesters: structural
characteristics, mechanical properties and cell adhesion potential. Biomaterials 26, 3929–3939 (2005).47. Richert, L. et al. Surface nanopatterning to control cell growth. Advanced Materials 20, 1488–1492 (2008).
AcknowledgementsThe authors would like to acknowledge useful discussions with and help from Azhar Ilyas, Waqas Ali and Nuzhat Mansur. The work was supported by Cancer Research Foundation of North Texas, Arlington, Texas, USA and National Science Foundation under grant ECCS-1407990.
Author ContributionsM.I. and S.M.I. designed the experiments. M.M.B., A.S. and M.R.H. setup the current measurement system and analyzed the data. M.I. and Y.T.K. performed experiments. SMI directed the project and supervised this work. All authors have read and approved the final manuscript.
Additional InformationCompeting financial interests: The authors declare no competing financial interests.How to cite this article: Islam, M. et al. Effects of Nanotexture on Electrical Profiling of Single Tumor Cell and Detection of Cancer from Blood in Microfluidic Channels. Sci. Rep. 5, 13031; doi: 10.1038/srep13031 (2015).
This work is licensed under a Creative Commons Attribution 4.0 International License. The images or other third party material in this article are included in the article’s Creative Com-
mons license, unless indicated otherwise in the credit line; if the material is not included under the Creative Commons license, users will need to obtain permission from the license holder to reproduce the material. To view a copy of this license, visit http://creativecommons.org/licenses/by/4.0/