Effects of microclimate and human parameters on outdoor ... · Effects of microclimate and human...
17
SPECIAL ISSUE: SUBJECTIVE APPROACHES TO THERMAL PERCEPTION Effects of microclimate and human parameters on outdoor thermal sensation in the high-density tropical context of Dhaka Tania Sharmin 1 & Koen Steemers 1 Received: 6 December 2017 /Revised: 13 July 2018 /Accepted: 25 August 2018 # The Author(s) 2018 Abstract A thermal comfort questionnaire survey was carried out in the high-density, tropical city Dhaka. Comfort responses from over 1300 subjects were collected at six different sites, alongside meteorological parameters. The effect of personal and psychological parameters was examined in order to develop predictive models. Personal parameters included gender, age, activity, profession- type (indoor or outdoor-based), exposure to air-conditioned space and sweat-levels. Psychological parameters, such as ‘the reason for visiting the place’ and ‘next destination is air-conditioned’, had statistically significant effects on thermal sensation. Other parameters, such as ‘body type’, ‘body exposure to sun’, ‘time living in Dhaka’, ‘travelling in last_30 min’, and ‘hot food’ did not have any significant impact. Respondents’ humidity, wind speed and solar radiation sensation had profound impacts and people were found willing to adjust to the thermal situations with adaptive behaviour. Based on actual sensation votes from the survey, empirical models are developed to predict outdoor thermal sensation in the case study areas. Ordinal linear regression techniques are applied for predicting thermal sensation by considering meteorological and personal conditions of the field survey. The inclusion of personal and weather opinion factors produced an improvement in models based on meteorological factors. The models were compared with the actual thermal sensation using the cross-tabulation technique. The predictivity of the three models (meteorological, thermos-physiological and combined parameter) as expressed by the gamma coefficient were 0.575, 0.636 and 0.727, respectively. In all three models, better predictability was observed in the ‘Slightly Warm’ (71% in meteoro- logical model) and ‘Hot’ (64.9% in combined parameter model) categories—the most important ones in a hot-humid climate. Keywords Outdoor thermal comfort . Questionnaire survey . Thermal sensation vote (TSV) . Predictive model . Tropical climate Introduction Evidence suggests that urbanisation encourages economic growth (Turok & McGranahan 2013); however, without proper planning, urbanisation can adversely affect the natural environ- ment and public health conditions. The trend is more severe in rapidly urbanising developing nations in the tropics where limited resources for managing planning and investment are un- able to lead to a sustainable urban growth. The unbridled urban- isation in many tropical cities has eradicated green-cover and intensified the vulnerability to climate change. Furthermore, de- clining air quality caused by the exhausts from traffic and indus- try, and the generation of urban heat islands (UHIs), caused by the unplanned growth of the built environment, have worsened the microclimatic conditions in tropical cities. Adverse microclimatic conditions greatly affect the thermal comfort, health and wellbeing of people in urban outdoor spaces. For tropical countries in particular, the implications of thermal stress on health and productivity needs to be tackled largely by proper urban and building design details that are affordable. To address this need, recent studies have examined the relationship among microclimate, thermal comfort and human behaviour with the aim to provide guidelines and implications for outdoor space design and planning practice. Important studies in a trop- ical climate include da Silveira Hirashima et al. ( 2016); Ignatius et al. (2015); Villadiego & Velay-Dabat (2014); Yang et al. Part of a Special Issue on Subjective approaches to thermal perception Electronic supplementary material The online version of this article (https://doi.org/10.1007/s00484-018-1607-2) contains supplementary material, which is available to authorized users. * Tania Sharmin [email protected] 1 The Martin Centre for Architectural and Urban Studies, Department of Architecture, University of Cambridge, 1-5 Scroope Terrace, Cambridge CB2 1PX, UK https://doi.org/10.1007/s00484-018-1607-2 International Journal of Biometeorology (2020) 64:187–203 /Published online: 12 September 2018
Transcript of Effects of microclimate and human parameters on outdoor ... · Effects of microclimate and human...

SPECIAL ISSUE: SUBJECTIVE APPROACHES TO THERMAL PERCEPTION
Effects of microclimate and human parameters on outdoor thermalsensation in the high-density tropical context of Dhaka
Tania Sharmin1& Koen Steemers1
Received: 6 December 2017 /Revised: 13 July 2018 /Accepted: 25 August 2018# The Author(s) 2018
AbstractA thermal comfort questionnaire survey was carried out in the high-density, tropical city Dhaka. Comfort responses from over1300 subjects were collected at six different sites, alongside meteorological parameters. The effect of personal and psychologicalparameters was examined in order to develop predictive models. Personal parameters included gender, age, activity, profession-type (indoor or outdoor-based), exposure to air-conditioned space and sweat-levels. Psychological parameters, such as ‘thereason for visiting the place’ and ‘next destination is air-conditioned’, had statistically significant effects on thermal sensation.Other parameters, such as ‘body type’, ‘body exposure to sun’, ‘time living in Dhaka’, ‘travelling in last_30 min’, and ‘hot food’did not have any significant impact. Respondents’ humidity, wind speed and solar radiation sensation had profound impacts andpeople were found willing to adjust to the thermal situations with adaptive behaviour. Based on actual sensation votes from thesurvey, empirical models are developed to predict outdoor thermal sensation in the case study areas. Ordinal linear regressiontechniques are applied for predicting thermal sensation by considering meteorological and personal conditions of the field survey.The inclusion of personal and weather opinion factors produced an improvement in models based on meteorological factors. Themodels were compared with the actual thermal sensation using the cross-tabulation technique. The predictivity of the threemodels (meteorological, thermos-physiological and combined parameter) as expressed by the gamma coefficient were 0.575,0.636 and 0.727, respectively. In all three models, better predictability was observed in the ‘Slightly Warm’ (71% in meteoro-logical model) and ‘Hot’ (64.9% in combined parameter model) categories—the most important ones in a hot-humid climate.
Keywords Outdoor thermal comfort . Questionnaire survey . Thermal sensation vote (TSV) . Predictive model . Tropicalclimate
Introduction
Evidence suggests that urbanisation encourages economicgrowth (Turok & McGranahan 2013); however, without properplanning, urbanisation can adversely affect the natural environ-ment and public health conditions. The trend is more severe inrapidly urbanising developing nations in the tropics where
limited resources for managing planning and investment are un-able to lead to a sustainable urban growth. The unbridled urban-isation in many tropical cities has eradicated green-cover andintensified the vulnerability to climate change. Furthermore, de-clining air quality caused by the exhausts from traffic and indus-try, and the generation of urban heat islands (UHIs), caused bythe unplanned growth of the built environment, have worsenedthe microclimatic conditions in tropical cities.
Adverse microclimatic conditions greatly affect the thermalcomfort, health and wellbeing of people in urban outdoor spaces.For tropical countries in particular, the implications of thermalstress on health and productivity needs to be tackled largely byproper urban and building design details that are affordable. Toaddress this need, recent studies have examined the relationshipamong microclimate, thermal comfort and human behaviourwith the aim to provide guidelines and implications for outdoorspace design and planning practice. Important studies in a trop-ical climate include da Silveira Hirashima et al. (2016); Ignatiuset al. (2015); Villadiego & Velay-Dabat (2014); Yang et al.
Part of a Special Issue on Subjective approaches to thermal perception
Electronic supplementary material The online version of this article(https://doi.org/10.1007/s00484-018-1607-2) contains supplementarymaterial, which is available to authorized users.
* Tania [email protected]
1 The Martin Centre for Architectural and Urban Studies, Departmentof Architecture, University of Cambridge, 1-5 Scroope Terrace,Cambridge CB2 1PX, UK
https://doi.org/10.1007/s00484-018-1607-2International Journal of Biometeorology (2020) 64:187–203
/Published online: 12 September 2018

(2013); Johansson et al. (2018), etc. which provide an extensiveknowledge of the effects of outdoor climatic conditions on peo-ple’s thermal sensation. However, there has been a limitedamount of research in these areas focussing on the tropical mega-city of Dhaka. As one of the worst victims of climate change,Dhaka is particularly vulnerable with poor outdoormicroclimaticconditions exacerbated by the urban heat island (UHI) effect(Kotharkar et al. 2018; Santamouris & Asimakopoulos 2001)and an elevated level of air pollution (Carlsen et al. 2018;Begum et al. 2011; Azad & Kitada 1998). This makes outdoorcomfort research particularly important for Dhaka, since outdoorspaces-users are exposed to severe heat stress during the mostpart of the year. The only scholarly work concerning outdoorthermal comfort and urban microclimate was carried out by(Ahmed 2003). The study, however, did not identify the impactof various parameters on outdoor thermal comfort other than theenvironmental ones. It mainly emphasised specific microclimaticfeatures, such as the presence or absence of greenery, proximityto a river, etc. No prediction tool was proposed. This study,therefore, intends to contribute in understanding the impact ofvarious personal and psychological parameters alongside meteo-rological parameters on thermal perception in order to be able toidentify priorities in climate-responsive urban design.
Outdoor thermal comfort can be affected by a wide range ofparameters. Environmental factors play the most important rolein thermal sensation. However, people’s ability to thermal ad-aptation through personal and cultural behavioural adjustmentsis significant. Similarly, thermal comfort research remains in-complete without consideration of physiological (genetic adap-tation or acclimatisation) and psychological (habituation or ex-pectation) factors (Brager and De Dear 1998; Knez et al. 2009;Lin 2009; Nikolopoulou and Steemers 2003; Nikolopoulouet al. 2001; Thorsson et al. 2004). These parameters indicatethat people’s thermal comfort sensation depend on climate, cul-ture, personal and psychological backgrounds. It is, therefore,important to conduct field studies to examine outdoor thermalconditions and human thermal comfort perceptions in variousplaces to complement existing knowledge on thermal comfortconditions in outdoor urban spaces.
Several studies have investigated the relation between me-teorological variables and thermal sensation. For example,Nikolopoulou and Lykoudis (2006) have reported correlationsbetween thermal sensation vote (TSV) and air temperature(r = 0.43) or globe temperature (r = 0.53). Their study advisedthat independent microclimatic parameters are unable to ex-plain all variations in outdoor comfort conditions. Other stud-ies, such as Villadiego and Velay-Dabat (2014), have reportedcorrelations between TSVand air temperature (r = 0.305), rel-ative humidity (r = − 0.117) and wind speed (r = null).
In terms of personal parameters, studies have found thatwomen are more sensitive to thermal conditions than men(Krüger & Rossi 2011; Karjalainen 2007). In a more recentstudy, Kruger and Drach (2017) have identified gender effects
to be insignificant whereas age was an important variable foropen space users in Rio de Janeiro, Brazil. People aged over55 were found to be vulnerable to heat increase (Pantavouet al. 2013). Responses from people with chronic asthmaand various allergies were also examined in the same studyalong with people’s psychological states. Those who werealone in the interview site were found to be more likely toexpress their thermal sensations in the extreme categories thanthose who had company.
Yang et al. (2013) have tested the impact of visiting purposeand frequency, exposure time and exposure to air-conditionedspace prior to the interview. Only exposure to air-conditionedspace was found to have a significant impact on thermal sensa-tion in their study. The respondents who stayed in air-conditionedrooms prior to the survey had a slightly higher TSV than thosewho were not, suggesting the latter group were more tolerant tothe heat stress in outdoor spaces. Nikolopoulou and Steemers(2003) have done a comprehensive study on psychological fac-tors that affect thermal sensation considering naturalness, pastexperience, perceived control, time of exposure, environmentalstimulation and expectations. For the purpose of this study, per-sonal and psychological parameters are chosen in view of thesocioeconomic background and cultural influences associatedwith the case study context.
Alongside dealing with the above parameters, this studydeals with developing a thermal sensation prediction modelusing Ordinal Logistic Regression (OLR) techniques.Generally, empirical thermal sensation models based on actualsensation votes use multiple linear regression techniques andincorporate only meteorological parameters (Andrade et al.2011; Metje et al. 2008; Nikolopoulou & Lykoudis 2006;Nikolopoulou et al. 2003 and Ghali et al. 2011). Recent stud-ies by Pantavou et al. (2013) suggest that OLR is a betteralternative to the linear regression model in outdoor thermalcomfort studies. Here, the dependent variable, TSV, is an or-dinal variable based on the ASHRAE seven-point scale (− 3cold; − 2 cool; − 1 slightly cool; 0 neutral; + 1 slightly warm;+ 2 warm; + 3 hot) (ANSI/ASHRAE Standard 55. 2004). Thisindicates, it may be unsuitable to apply a linear regressionmodel to predict thermal sensations, since multiple linear re-gression is mainly applicable when the dependent variable iscontinuous. Therefore, OLR techniques are applied in thisstudy and the outcome is compared with the actual TSV col-lected through the field survey.
Methodology
Study area
A questionnaire survey was carried out along with physicalmeasurements in the tropical megacity of Dhaka. Eight urbancanyons in six representative case study areas were chosen for
Int J Biometeorol (2020) 64:187–203188

the study. These included four residential case study areascalled South Kafrul, Mid-Kafrul, Mahakhali DOHS andBaridhara DOHS; one commercial area called BananiCommercial Area and one educational area called TSCShahbagh (see Fig. 1 in the supplementary material for an over-view of the case study areas).
Microclimatic measurements
The measured climatic parameters include air temperature,humidity, wind speed and globe temperature. Instrumentswere placed at the height of 1.1 m from the ground with theaid of a tripod. The height corresponds to the average height ofthe centre of gravity of the human body (ISO 7726 1998). Theinstruments consisted of Tiny-tag data loggers to measure airtemperature and humidity, an OM-CP-WIND101A data log-ger with a three-cup anemometer to measure wind speed and aglobe thermometer to measure globe temperature. The globethermometer used a Tiny-tag data logger with a thermocouplethermistor probe inserted into a grey Ping-Pong ball (40 mmdiameter). Mean radiant temperature was calculated using themethod described in Thorsson et al. (2007). Measurementswere taken between 9:00 and 18:00.
Questionnaire survey
The survey includes 1302 interviews conducted across thecase study areas. The analysis of the questionnaire data leadto two main outcomes: firstly, understanding how thermalcomfort sensation is affected by climatic, personal, psycholog-ical and additional variables for the climatic context of Dhaka;and secondly, providing a predictive thermal comfort modelfor the case study areas. The questionnaire was prepared onthe basis of previous research (Ng & Cheng 2012; Yang et al.2013). Participants were selected at random. They were askedabout their thermal sensation, acceptability and preferencesalong with humidity, wind speed and solar radiation sensa-tions. Physical attributes like age, gender, and activity werenoted. Body type (normal/ obese/ skinny) and clothing infor-mation were obtained from observation.
Interviewees were asked to express their thermal sensationbased on the ASHRAE seven-point scale representing the TSV.Their thermal preference was noted on a three-point McIntyreScale (prefer warmer, prefer no change, prefer cooler)(McIntyre 1980). Thermal acceptability was assessed by askingwhether the thermal environment was acceptable or unaccept-able. Humidity, wind speed and solar radiation sensations wererecorded on individual five-point scales (Ng & Cheng 2012).
The rest of the questionnaire consisted of questions to deter-mine the most important personal and psychological attributesthat affected thermal comfort sensations. These parameters,along with meteorological ones used for this study, are listedin Table 1. It also includes additional parameters discussed under
‘adaptive behaviour’ and ‘weather opinion’. Personal informa-tion of the respondents, such as gender, age, body type, activity,exposure to direct sunlight and clothing level were also includedin the table. These were determined by observation during thesurvey. Several personal characteristics were noted by directlyasking the respondents about their residence status in the city,nature of their profession, interviewees’ sweat-levels (Ng &Cheng 2012), exposure to air-conditioned space and travellingsituations in the last 30 min, etc. Profession is grouped asBindoor type^, who work in an indoors environment andBoutdoor type^, who work mostly outdoors (e.g. street traders)(Ahmed 2003). Respondents’ psychological factors includedvisiting purposes to the site and whether the next destination isair conditioned or not. Choice of adaptive behaviour, consump-tion of hot food or cold drinks, etc. were considered under‘adaptive behaviour’. Additionally, interviewees’ judgement ofthe prevailing humidity, wind speed and solar radiation condi-tions during the survey were recorded. The reason for consider-ing the ‘visiting purpose’ and ‘next destination is air condi-tioned’ under the psychological category is that both have con-siderable psychological impact on the respondent’s mental situ-ation. Visiting a place for leisure could have a different psycho-logical effect to someone who is present for work. Pantavou andLykoudis (2014) and Pantavou et al. (2013) have shown in theirstudies that people visiting the site for work felt cooler than thosevisiting the site for rest, due to both psychological effects andalso because the former group had better adaptation due to lon-ger exposure time than those simply passing by. Similarly, peo-ple whose next destination is air-conditioned could be moretolerant to warm situations as they know any discomfort is tem-porary. Regarding ‘weather opinion’, although Pantavou et al.(2013) have discussed this under psychological parameters, it isdiscussed separately in this study as these can be broadly treatedas comparable to theASHRAETSV. This is similarly applicablein the case of adaptive behaviour.
Regression analysis
This study has applied OLR techniques, for predictingTSV in the case study context, in three stages: first, usingonly meteorological variables to produce a meteorologicalmodel; second, combining personal variables with meteo-rological variables to produce a thermo-physiologicalmodel; third, incorporating ‘Weather opinion’ with per-sonal and meteorological variables to produce a combinedparameter model. While producing the models, each inde-pendent variable is examined against TSV separately. Theimpact of each continuous, as well as categorical, variableon the dependent variable TSV is individually checkedbeforehand, using the one-way ANOVA, Kruskal-Wallisand Mann-Whitney tests. All statistical analysis in thisstudy has been carried out in ‘R’ programming language(https://www.r-project.org/).
Int J Biometeorol (2020) 64:187–203 189

The OLR applied in this study is used to model the rela-tionship of an ordinal dependent variable and a set of indepen-dent variables that are either categorical or continuous. In anOLR model, the outcome variable is ordered and has morethan two levels. The distance between the levels is generallyunknown (Christensen 2011). In this study, the ordinal out-come variable is TSV, which is coded on the seven-pointscale. Please see the discussion on OLR in the supplementarydocument for further information.
Results and discussion
Thermal sensation and meteorological variables
During the questionnaire survey, air temperature ranged be-tween 27.6 and 38.5 °C, relative humidity between 51 and85%, globe temperature between 27.9 and 42.9 °C and Tmrtbetween 27.7 and 47.8 °C. Wind speed remained generallylow (mean = 0.9 m/s). However, some gusts were recordedin the traditional areas with greater building height variationand in the commercial area with high-rise structures, especial-ly where funnelling effect was noted. According to the datacollected from the Bangladesh Meteorological Department atDhaka, the survey days can be regarded as typical days whenthe high temperature is coupled with high humidity, havingaverage cloud coverage of 5.5 oktas.
Questionnaire data
The survey was conducted for 12 days, of which 6 days werein Autumn 2014 and 5 days were in Summer 2015. Around
42% of the data was collected in Autumn and the remaining58% during Summer. The descriptive statistics of the popula-tion has been included in Table 1 in the supplementary mate-rial. Out of 1302 respondents, 76% were male. Ninety-onepercent of respondents consisted of people aged between16–30 and 30–50. Themost common physical feature (termedas ‘body type’) was ‘normal’. Considering this study exam-ines outdoor comfort conditions, different activities that takeplace in the outdoor urban environment were considered. Themajority of the respondents (49%) were standing or involvedin light work, and the second largest group of people (37%)were walking at a slow pace (light walking).
During the questionnaire survey, 92% of people were walk-ing in the shaded part of the street and therefore not exposed todirect sun. Clothing values were estimated by observation andcompared to the garment checklist included in the question-naire. The mean and median values for clothing were both0.5 clo, which is normal considering the thermal conditionsduring the survey. Maximum values were around 1.2 clo, assome women were dressed in the Islamic manner. People’sacclimatisation was also considered, and 76% were a residentof the city for over 5 years. Respondents were also askedabout their profession. The highest percentage (37%) was in-volved in office jobs and 31% were students. Among thesepeople, 73% of jobs were indoor-based, while 26% were out-door-based.
It can be assumed that respondents were already acclima-tised during the survey with the thermal environment as 71%had not had any exposure to air-conditioned space in the last30 min. Furthermore, 79% were not travelling before the in-terview, while 21% were either on public transport or anothertype of transport. The largest percentage (80%) was at the
Table 1 Meteorological, personal, psychological and additional parameters in the study
Measured parameters Questionnaire parameters
Meteorological Personal Psychological Adaptive behaviour Weather opinion
Air temperature, Ta (°C) Gender Visiting purpose Cold drink in the last 15 min Humidity sensation
Relative humidity, RH (%) Age Next destination isair-conditioned
Hot food in the last 15 min Wind speed sensation
Wind speed (m/s) Body type Preferred adaptive behaviour Solar radiationsensation
Globe temperature, GT (°C) Activity, metabolic rate (W/m2)
Mean radiant temperature, Tmrt (°C) Body exposure to the sun
Clothing, Clo
Time living in Dhaka
Profession-type (outdoor orindoor)
Exposure to air-conditioned spacein the last 30 min
Travelling in the last 30 min
Sweat-levels
Int J Biometeorol (2020) 64:187–203190
interview site due to proximity to home, office, school ortransport node.
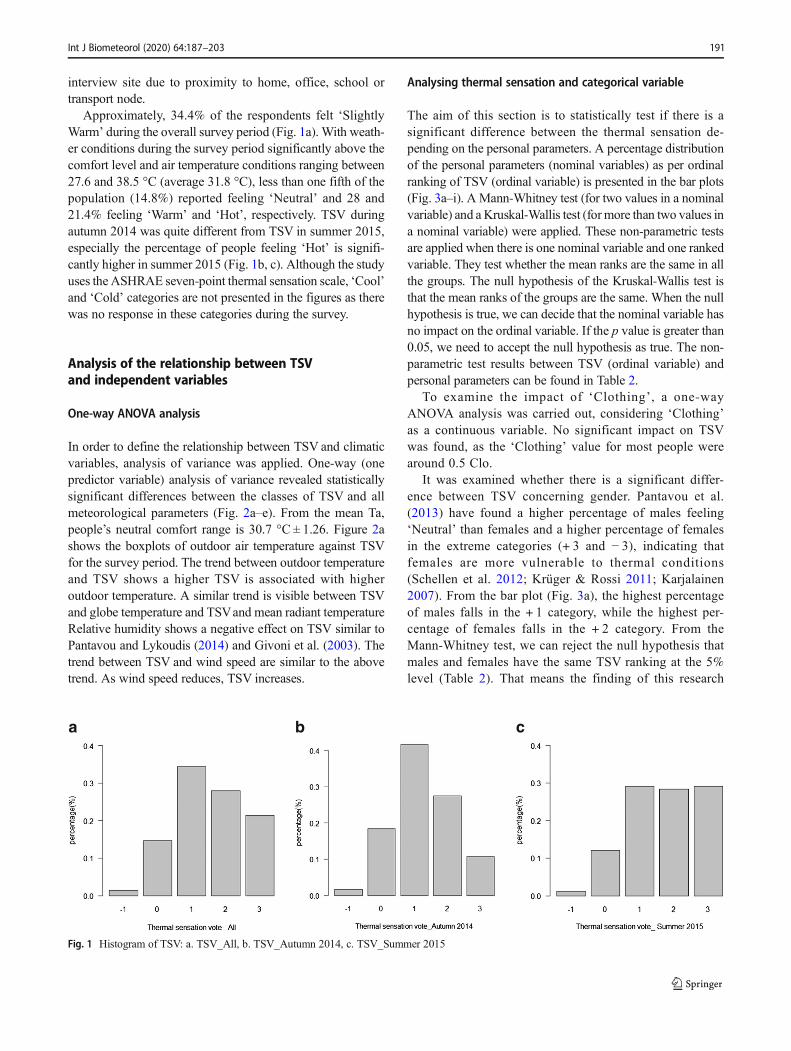
Approximately, 34.4% of the respondents felt ‘SlightlyWarm’ during the overall survey period (Fig. 1a). With weath-er conditions during the survey period significantly above thecomfort level and air temperature conditions ranging between27.6 and 38.5 °C (average 31.8 °C), less than one fifth of thepopulation (14.8%) reported feeling ‘Neutral’ and 28 and21.4% feeling ‘Warm’ and ‘Hot’, respectively. TSV duringautumn 2014 was quite different from TSV in summer 2015,especially the percentage of people feeling ‘Hot’ is signifi-cantly higher in summer 2015 (Fig. 1b, c). Although the studyuses the ASHRAE seven-point thermal sensation scale, ‘Cool’and ‘Cold’ categories are not presented in the figures as therewas no response in these categories during the survey.
Analysis of the relationship between TSVand independent variables
One-way ANOVA analysis
In order to define the relationship between TSV and climaticvariables, analysis of variance was applied. One-way (onepredictor variable) analysis of variance revealed statisticallysignificant differences between the classes of TSV and allmeteorological parameters (Fig. 2a–e). From the mean Ta,people’s neutral comfort range is 30.7 °C ± 1.26. Figure 2ashows the boxplots of outdoor air temperature against TSVfor the survey period. The trend between outdoor temperatureand TSV shows a higher TSV is associated with higheroutdoor temperature. A similar trend is visible between TSVand globe temperature and TSVand mean radiant temperatureRelative humidity shows a negative effect on TSV similar toPantavou and Lykoudis (2014) and Givoni et al. (2003). Thetrend between TSV and wind speed are similar to the abovetrend. As wind speed reduces, TSV increases.
Analysing thermal sensation and categorical variable
The aim of this section is to statistically test if there is asignificant difference between the thermal sensation de-pending on the personal parameters. A percentage distributionof the personal parameters (nominal variables) as per ordinalranking of TSV (ordinal variable) is presented in the bar plots(Fig. 3a–i). A Mann-Whitney test (for two values in a nominalvariable) and a Kruskal-Wallis test (formore than two values ina nominal variable) were applied. These non-parametric testsare applied when there is one nominal variable and one rankedvariable. They test whether the mean ranks are the same in allthe groups. The null hypothesis of the Kruskal-Wallis test isthat the mean ranks of the groups are the same. When the nullhypothesis is true, we can decide that the nominal variable hasno impact on the ordinal variable. If the p value is greater than0.05, we need to accept the null hypothesis as true. The non-parametric test results between TSV (ordinal variable) andpersonal parameters can be found in Table 2.
To examine the impact of ‘Clothing’, a one-wayANOVA analysis was carried out, considering ‘Clothing’as a continuous variable. No significant impact on TSVwas found, as the ‘Clothing’ value for most people werearound 0.5 Clo.
It was examined whether there is a significant differ-ence between TSV concerning gender. Pantavou et al.(2013) have found a higher percentage of males feeling‘Neutral’ than females and a higher percentage of femalesin the extreme categories (+ 3 and − 3), indicating thatfemales are more vulnerable to thermal conditions(Schellen et al. 2012; Krüger & Rossi 2011; Karjalainen2007). From the bar plot (Fig. 3a), the highest percentageof males falls in the + 1 category, while the highest per-centage of females falls in the + 2 category. From theMann-Whitney test, we can reject the null hypothesis thatmales and females have the same TSV ranking at the 5%level (Table 2). That means the finding of this research
a b c
Fig. 1 Histogram of TSV: a. TSV_All, b. TSV_Autumn 2014, c. TSV_Summer 2015
Int J Biometeorol (2020) 64:187–203 191

Table a-1Thermal sensation
median mean std.dev
Slightly cool 29.9 30.1 1.52
Neutral 30.7 30.6 1.26
Slightly warm 31.8 32.0 1.75
Warm 32.2 32.5 1.76
Hot 33.1 33.6 2.16
Air temperature ~ Thermal sensationTable a-2Thermal sensation
median mean std.dev
Slightly cool 30.1 30.6 2.6
Neutral 31.1 31.2 1.6
Slightly warm 32.5 33.0 2.3
Warm 32.9 33.7 2.5
Hot 35.3 35.2 2.8
Globe temperature ~ Thermal sensationTable a-3Thermal sensation
median mean std.dev
Slightly cool 30.2 30.7 3.0
Neutral 31.2 31.4 1.8
Slightly warm 32.6 33.2 2.4
Warm 33.1 33.8 2.6
Hot 35.4 35.5 3.2
Tmrt ~ Thermal sensation
Table a-4Thermal sensation
median mean std.dev
Slightly cool 73 75 5
Neutral 76 75 5
Slightly warm 72 72 7
Warm 70 70 7
Hot 67 66 9
Relative humidity ~ Thermal sensation
Table a-5Thermal sensation median mean std.devSlightly cool 2.2 2.4 1.6
Neutral 0.4 1.1 1.5
Slightly warm 0.1 0.7 1.3
Warm 0.1 0.5 1.3
Hot 0.1 1.2 2.2
Wind speed ~ Thermal sensation
a
b
c
d
e
Fig. 2 Results of one-way analysis of variance between TSVand climaticvariables: a. Table a-1: air temperature against TSV, b. Table a-2: globetemperature against TSV, c. Table a-3 Tmrt against TSV, d. Table a-4
relative humidity against TSV, e. Table a-5 wind speed against TSVbox-plot and table
Int J Biometeorol (2020) 64:187–203192

agrees with the finding of the previous research that wom-en are more vulnerable to heat than men.
Regarding age, Pantavou et al. (2013) have noticed in-creased sensitivity to heat among older people, althoughKrüger and Rossi (2011) found an opposite trend. In Fig. 3b,there is seemingly no difference between people of differentages for different groups of TSV rankings.
Considering the ‘Activity’ of the respondents, those involvedin ‘Light walking’ or ‘Standing, light work’ show similar pat-terns where the majority fall in the + 1 category and the nextgroup in the + 2 category (Fig. 3c). Majority of the respondentswho were in ‘Moderate walking’ group, fall in the + 2 category.Their higher metabolism makes them feel hotter. Most of thepeople who are in neutral category are found ‘Sitting’. Thus, the
Gender per category of TSV
Age per category of TSV
Activity per category of TSV
1
13
31
34
22
2
15
36
26
21
0
5
10
15
20
25
30
35
40
-1 0 1 2 3
Per
centa
ge
(%)
Thermal Sensation Vote
Female Male
0
19
38
28
15
2
15
35
27
21
1
15
33
29
22
2
14
38
2225
0
5
10
15
20
25
30
35
40
45
-1 0 1 2 3
Per
cen
tag
e (%
)
Thermal Sensation Vote
Teenager
Young
Middle-aged
Old
2
19
3437
8
2
13
3028 27
0
17
40
26
17
0
5
35
20
40
0
5
10
15
20
25
30
35
40
45
-1 0 1 2 3
Per
centa
ge
(%)
Thermal Sensation Vote
Sitting
Standing, light work
Light walking
Moderate walking
a
b
c
Fig. 3 Personal, adaptive,psychological and weathersensation parameters per class ofTSV: a. Gender, b. Age, c.Activity, d. Body exposure, e.Profession type, f. Exposure toair-conditioned space, g. Sweatlevels, h. Next destination is air-conditioned, i. Cold food in 15minutes, j. Reason for visiting theplace, k. Chosen adaptive behav-iour, l. Humidity sensation, m.Wind speed sensation, n. Solarradiation sensation per categoryof TSV
Int J Biometeorol (2020) 64:187–203 193

difference in TSV between the groups is evident as TSV seemsto increase with the increase of activity levels. This means ac-tivity levels have a statistically significant impact on TSV.
In terms of ‘Profession type’, people who are ‘Indoor-type’(involved in indoor-based work) have 9% higher percentage inthe category + 3 than people who are ‘Outdoor type’ (Fig. 3e).Also, the percentage of the former group in the ‘0’ and + 1categories is 7% higher than the latter. This suggests ‘Indoor-
type’ people are more sensitive to hot situations. Also, peoplewho had exposure to air-conditioned space prior to the survey,have 10% higher percentage in the + 3 category than those whodid not (Fig. 3f). This suggests air-conditioning experiencehave led people to feel hotter in outdoor spaces similar to thefindings reported in Yang et al. (2013) as discussed before.Those who did not have any air-conditioning experience have7% higher percentage in the ‘0’ and + 1 categories than the
Body exposure to the sunper category of TSV
Profession type
Exposure to air-conditioned space per category of TSV
1
15
34
28
21
37
39
23
29
0
10
20
30
40
50
-1 0 1 2 3
Per
centa
ge
(%)
Thermal Sensation Vote
No Yes
1
15
33
2824
1
16
39
29
15
0
5
10
15
20
25
30
35
40
45
-1 0 1 2 3
Per
centa
ge
(%)
Thermal Sensation Vote
Indoor typeOutdoor type
2
16
36
29
19
1
13
32
2629
0
5
10
15
20
25
30
35
40
-1 0 1 2 3
Per
centa
ge
(%)
Thermal Sensation Vote
No Yes
d
e
f
Fig. 3 continued.
Int J Biometeorol (2020) 64:187–203194

other group. The respectiveMann-Whitney tests as presented inTable 2 support these findings.
‘Sweat-levels’ has been examined in this study to understandthe thermal sensation of people. From the barplot in Fig. 3g, peoplefeeling ‘Just right’ in terms of ‘Sweat-levels’mostly belong to the
‘0’ or + 1 category. On the other hand, people who felt ‘Moist’ fallin the + 1, + 2 and + 3 categories. Similarly, people experiencing‘Drops of sweat’ feel mostly ‘Hot’. However, it is not clear why50% of the people feeling ‘Dry’ fall in the + 2 category. It wasanticipated that people feeling ‘Warm’ would link their thermal
Sweat-levelsper category of TSV
Next destination is air conditioned
Cold food in 15 minutes
13 13
25
50
03
3538
15
8
04
35 36
25
0 2
8
16
75
0
10
20
30
40
50
60
70
80
-1 0 1 2 3
Per
centa
ge
(%)
Thermal Sensation Vote
Dry
Just right
Moist
Drops of sweat
3
22
39
27
9
0
12
46
29
13
0
5
10
15
20
25
30
35
40
45
50
-1 0 1 2 3
Per
centa
ge
(%)
Thermal Sensation Vote
No Yes
2
20
43
26
9
2
13
38
31
17
0
5
10
15
20
25
30
35
40
45
50
-1 0 1 2 3
Per
cen
tag
e (%
)
Thermal Sensation Vote
No Yes
g
h
i
Fig. 3 continued.
Int J Biometeorol (2020) 64:187–203 195

sensation with ‘Moist’ or ‘Drops of sweat’ conditions. Seemingly,some people got confused in distinguishing between ‘Dry’ and‘Moist’. However, the Kruskal-Wallis test suggests that there is adifference in TSV level among people with different groups of‘Sweat-levels’.
Other parameters, such as ‘Body type’, ‘Body exposure tosun’ (Fig. 3d), ‘Time living in Dhaka’, ‘Travelling in last_30min’ and ‘Hot food in last 15 min’ did not have any statisticallysignificant impact on the respective levels for the different cat-egories of TSV. The reason why ‘body type’ did not have anyimpact could be that most people (76%) had ‘Normal’ bodytype. ‘Body exposure to sun’ (Fig. 3d), ‘Time living in Dhaka’and ‘Travelling in last_30 min’ did not have an impact for
similar reasons relating to survey population as 92% of thepeople did not have solar exposure, 76% have lived in the cityfor over 5 years and 79% were not travelling in the last 30 min.The effect of ‘Hot food’ could only be speculated as not havinga lasting effect after 15 min or more prior to the survey.
It was initially assumed that people whose next destinationwas air-conditioned will be more tolerant (and psychological-ly convinced) towards the temporary discomfort in hot out-door conditions. Although most people in both groups fall inthe + 1 category, those with air-conditioned destinations are 7,2 and 4% higher in the + 1, + 2 and + 3 categories respectively,showing more dissatisfaction with existing conditions(Fig. 3h). Conversely, people without an air-conditioned
Reason for visiting the place
Chosen adaptive behaviour
1
14
34
28
24
3
19
28
33
17
0
20
60
20
00
27
18
45
9
0
22
67
11
0
5
18
46
25
5
0
10
20
30
40
50
60
70
-1 0 1 2 3
Per
centa
ge
(%)
Thermal Sensation Vote
Close to home, office, school or station
For No particular reason
Meeting someone
Prefer Not yo say
Shopping
To take rest and enjoy environment(sun-shine,breeze, nice view)
1
11
34
28 27
1
13
40
27
19
3
26 28 28
15
35
3234
26
2
13
40
27
18
0
5
10
15
20
25
30
35
40
45
-1 0 1 2 3
Per
centa
ge
(%)
Thermal Sensation Vote
Get more drink
Move to shaded trees or shelter
Nothing, I want to get to the destination soon
Open umbrella or wear hat
Reduce clothing
j
k
Fig. 3 continued.
Int J Biometeorol (2020) 64:187–203196
destination have a 10% higher percentage in the ‘Neutral’category, showing they are more tolerant towards the prevail-ing situation. There could be various reasons for that: theanticipation of comfort made them more aware of currentdiscomfort, the destination is far away, they were getting late,etc. The Mann-Whitney test (Table 2) confirms the negativeeffect of air-conditioned destination on TSV levels.
Next, the consumption of cold food or drink (Fig. 3i) alsoseemed to have an impact on the thermal sensation, althoughin an opposite way as the Mann-Whitney test (Table 2)
suggests. Consumption of cold food or drink did not seem tohave lowered the thermal sensation of people as it shows 5 and8% higher percentage of people in the + 2 and + 3 categories,respectively. The reason could be that the thermal sensationsof these people were affected by other factors which exceededthe effect of cold food or drink. Or maybe, considering thehot-humid conditions during the survey period, the effect ofthe cold food or drink did not last for 15 min. Since pastactivities of the respondents could not be monitored, it is dif-ficult to assume.
Humidity sensation
Wind speed sensation
Solar radiation sensation
0 14
20
75
06
35 36
22
0
10
20
30
40
50
60
70
80
90
-1 0 1 2 3
Per
centa
ge
(%)
Thermal Sensation Vote
Too dry
Dry
OK
Humid
Too humid
0
9
29
38
24
1
12
42
30
14
1
28
35
22
15
3
20
26
16
35
0
50
0 0
50
0
10
20
30
40
50
60
-1 0 1 2 3
Per
cen
tag
e (%
)
Thermal Sensation Vote
Still air
Little windy
OK
Windy
Too much wind
5
3026 28
11
1
20
43
25
11
1
19
49
22
9
1 3
35
42
19
0 2
12
18
68
0
10
20
30
40
50
60
70
80
-1 0 1 2 3
Per
centa
ge
(%)
Thermal Sensation Vote
Too weakLittle weakOKLittle strongToo strong
l
m
n
Fig. 3 continued.
Int J Biometeorol (2020) 64:187–203 197
Eighty percent of the survey population claimed to be inthe sites because of closeness to home, office, school ortransport node (see Table 1 in the supplementary material).Overall, the reason for visiting the place (also includingmeeting someone, shopping, to take rest and enjoy envi-ronment, etc.) had a statistically significant impact on theTSV levels as can be seen from the Kruskal-Wallis test onTable 2 and Fig. 3j. Similarly, people at the different TSVlevels expressed different preferences for adaptive behav-iour (Fig. 3k). For example, people in the ‘Neutral’ cate-gory mostly (28%) did not choose an adaptive behaviour;they were happy to continue to their destination. Most peo-ple (80%) in the ‘Slightly warm’ category showed prefer-ences for moving under shaded trees or shelter (40%) andreducing clothing (40%). People feeling ‘Warm’ and ‘Hot’were preferred to open an umbrella or wear a hat (26–34%)or get more drink (27–28%).
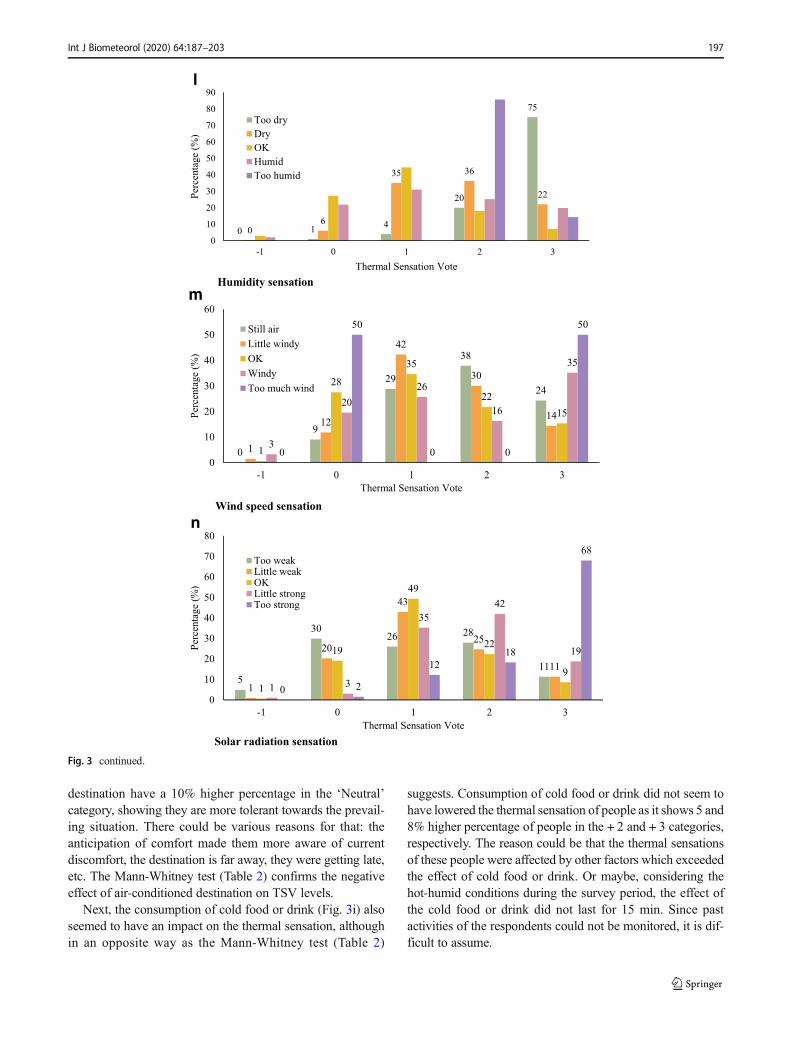
Regarding humidity sensation, most people feeling‘Neutral’ or ‘Slightly warm’ found the humidity conditionsto be ‘OK’ and people feeling ‘Warm’ have associated it tobe ‘Too humid’ (Fig. 3l). However, 75% of people feeling‘Too dry’ fall under the + 3 category. This is slightly un-usual because in an already humid condition, feeling worseshould be associated with more humid rather than drierconditions. Therefore, it seems that respondents feeling‘Too dry’ (7% of the population) were not fully able toevaluate the humidity conditions. Pantavou et al. (2013)in a similar study have revealed that people have Bdoubtfulperception of relative humidity .̂ In other words, there isseemingly a difference between how people perceive
humidity from the actual humidity levels. Results fromVilladiego and Velay-Dabat (2014) also indicated thatsurvey-respondents did not clearly notice the role that hu-midity plays in their thermal sensation.
It is hard to tell the effect of wind from Fig. 3m given theamount of variations (as indicated in the number of outliersin Fig. 2) and the fact that there were very low levels ofprevailing wind during the measurement campaign. InFig. 3n, most people who were in the ‘Slightly warm’ cat-egory identified solar radiation to be ‘OK’, while people inthe ‘Hot’ category responded ‘Too strong’. People who feltsolar radiation to be ‘Too weak’ fell in the ‘− 1’ or ‘0’category and people who felt it to be ‘Little strong’ werein the + 2 category. Overall, all humidity, wind speed andsolar radiation sensation levels varied for different catego-ries of thermal sensations. Kruskal-Wallis tests for each ofthese parameters show statistically significant results(Table 2) and therefore their impact on thermal sensationlevels is confirmed.
Prediction of TSV
Prediction of TSV using OLR
This section of the study is carried out with the aim todevelop predictive thermal comfort models for the casestudy area. OLR is applied for three different sets of param-eters: meteorological, thermo-physiological and a combi-nation of thermo-physiological and weather opinion fac-tors. Application of OLR to the meteorological parameters
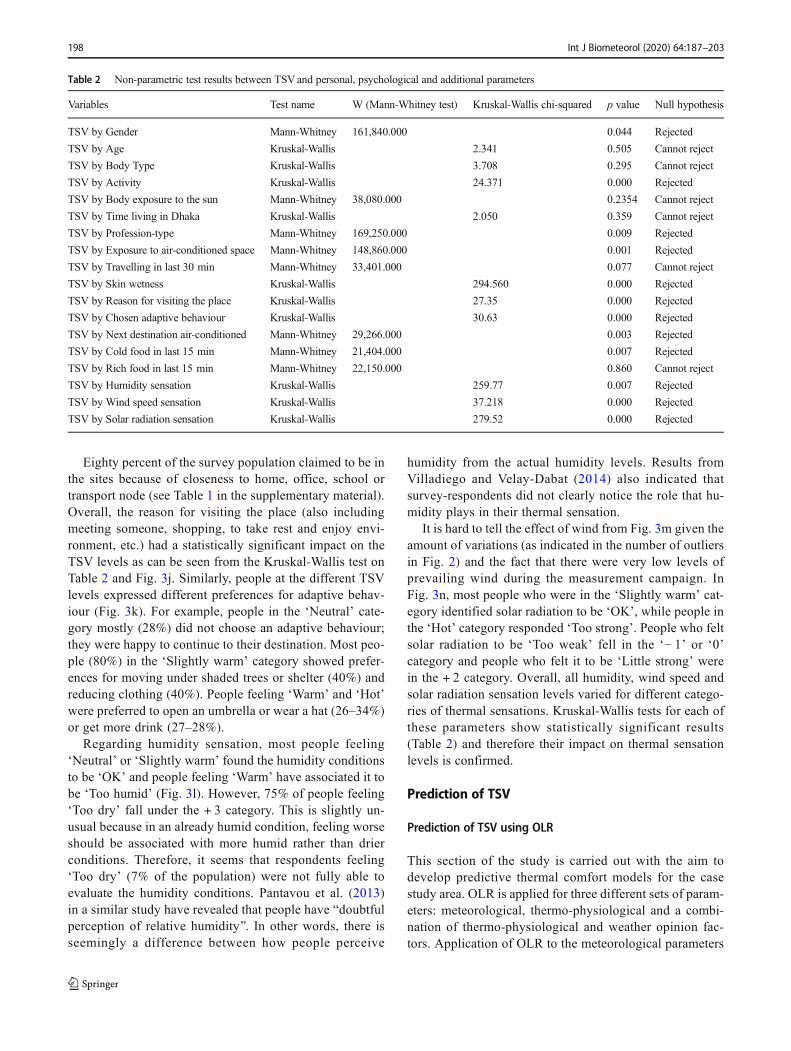
Table 2 Non-parametric test results between TSVand personal, psychological and additional parameters
Variables Test name W (Mann-Whitney test) Kruskal-Wallis chi-squared p value Null hypothesis
TSV by Gender Mann-Whitney 161,840.000 0.044 Rejected
TSV by Age Kruskal-Wallis 2.341 0.505 Cannot reject
TSV by Body Type Kruskal-Wallis 3.708 0.295 Cannot reject
TSV by Activity Kruskal-Wallis 24.371 0.000 Rejected
TSV by Body exposure to the sun Mann-Whitney 38,080.000 0.2354 Cannot reject
TSV by Time living in Dhaka Kruskal-Wallis 2.050 0.359 Cannot reject
TSV by Profession-type Mann-Whitney 169,250.000 0.009 Rejected
TSV by Exposure to air-conditioned space Mann-Whitney 148,860.000 0.001 Rejected
TSV by Travelling in last 30 min Mann-Whitney 33,401.000 0.077 Cannot reject
TSV by Skin wetness Kruskal-Wallis 294.560 0.000 Rejected
TSV by Reason for visiting the place Kruskal-Wallis 27.35 0.000 Rejected
TSV by Chosen adaptive behaviour Kruskal-Wallis 30.63 0.000 Rejected
TSV by Next destination air-conditioned Mann-Whitney 29,266.000 0.003 Rejected
TSV by Cold food in last 15 min Mann-Whitney 21,404.000 0.007 Rejected
TSV by Rich food in last 15 min Mann-Whitney 22,150.000 0.860 Cannot reject
TSV by Humidity sensation Kruskal-Wallis 259.77 0.007 Rejected
TSV by Wind speed sensation Kruskal-Wallis 37.218 0.000 Rejected
TSV by Solar radiation sensation Kruskal-Wallis 279.52 0.000 Rejected
Int J Biometeorol (2020) 64:187–203198

yielded sets of equations for calculating cumulative proba-bilities (Eq. (1)). Instead of considering the probability ofan individual event, the probability of that event and allevents that are ordered before it is considered in the case
of cumulative probabilities. The probability of each indi-vidual category can be computed by subtracting the highercorresponding class from the lower one.
P ≤−1ð Þ ¼ 1þ exp − 10:2538– 0:317*Taþ 0:1426*Tmrt−0:1565*Windspeedsqrtð Þð Þ½ �f g−1P ≤0ð Þ ¼ 1þ exp − 12:9702– 0:317*Taþ 0:1426*Tmrt−0:1565*Windspeedsqrt
� �� �� �� �−1
P ≤1ð Þ ¼ 1þ exp − 14:9472– 0:317*Taþ 0:1426*Tmrt−0:1565*Windspeedsqrt� �� �� �� �
−1
P ≤2ð Þ ¼ 1þ exp − 16:4530– 0:317*Taþ 0:1426*Tmrt−0:1565*Windspeedsqrt� �� �� �� �
−1
P ≤3ð Þ ¼ 1
ð1Þ
The ordinal meteorological models are produced by multi-ple meteorological variables, air temperature, Tmrt andwindspeedsqrt. The coefficients and standard errors can befound in Table 3a. The intercepts in each set of equations varyas can be seen in Eq. (1). The coefficients for meteorologicalvariables are identical. The model was tested for the propor-tional odds assumption and ordinal regression was applied asthe assumption was satisfied in all three ordinal models. Theodds ratio, that is simply the inverse log (i.e. the exponential)of the estimated coefficient, can be read from Table 3. Theinterpretation of the odds ratio is that, for a one-unit change inthe predictor variable, the odds for cases in a group that isgreater than j versus less than or equal to j are the proportionalodds times larger. For example, when air temperature moves 1unit, the odds of TSV being in the ‘Hot’ category are 1.373times greater than TSV being in ‘Warm’ and lower category.
In order to test the correspondence between actual TSVandthe respective predicted votes in the meteorological model, thelatter were classified into five categories using simple roundingto the nearest integer as only five categories were identifiedduring the field survey (‘Slightly cool’, ‘Neutral’, ‘Slightlywarm’, ‘Warm’ and ‘Hot’). The cross-tabulation of actualTSVand TSV predicted meteorological model (Fig. 4a) showsthat the model predicted thermal sensation in four categoriesthat exclude ‘Slightly cool’. 71.3% of ‘Slightly warm’ and47.1% of ‘Hot’ were correctly predicted by the model.However, reduced predictability is seen in other categories:‘Neutral’ (9.6%) and ‘Slightly warm’ (17.8%). A Pseudo R2
value of 0.245 (Table 3a) indicates that meteorological variablesexplain 24.5% of the comfort sensation of the pedestrians.
Next, an ordinal thermo-physiological modelwas created byusing both meteorological and personal parameters. Amongstatistically significant personal parameters, ‘Gender’,‘Profession-type’ and ‘Cold food’ were not included in themodel to avoid a complex model. Kruger and Drach (2017)in their multiple regression model using anthropometric vari-ables for estimating thermal sensation have also excludedGender, Age and BMI (Body Mass Index) as they were notstatistically significant.
Even though the ‘Activity’ of the respondents was found tobe a significant parameter and metabolic heat production is an
established parameter in the heat balance equation(Katavoutas et al. 2009; Fanger 1970), it was not included inthe model, since the focus of this study is on pedestrian com-fort where the difference of metabolic rate was little (Pantavouet al. 2013). Also, the difference of metabolic rate among thesurvey population was already less as only 2% of the totalpopulation were found under the category of ‘Moderate walk-ing’ (see supplementary material). The other personal param-eter to significantly affect thermal sensation was ‘Sweat-levels’ and ‘Exposure to air-conditioned space’. These wereincorporated along with meteorological variables to produce athermo-physiological model. The model statistics can befound in Table 3b. The model explains 38.5% (Pseudo R2 =0.385) of the variation in TSVof the pedestrians compared to24.5% explained by the previous metrological model.
Cross-tabulation of the model outcome compared to theactual TSV (Fig. 4b) shows that the model predicted the upperfour categories of thermal sensation: namely 0, + 1, + 2 and +3. 63.9% of ‘Slightly warm’ category and 51.3% of ‘Hot’category was correctly predicted by the model. Again, slightlylesser predictability is seen in ‘Neutral’ (25.4%) and ‘Slightlywarm’ (20.7%) categories.
Among the psychological and additional variables, signif-icant correlation was found between TSV and ‘Reason forvisiting the place’, ‘Chosen adaptive behaviour’ and ‘Nextdestination air-conditioned’ (Table 2). However, the psycho-logical parameters were not included in the model as they arevery subjective. Weather opinions have significant correla-tions. Again, in order produce a simple model, only solarradiation sensation (SSV) is incorporated into the model as ithad the highest correlation with TSV than other weather opin-ions. Subsequently, the previous thermo-physiological modelwas combined with SSV. The combined parameter model sta-tistics output can be found in Table 3c. Predicted values wereclassified in the same manner as in the previous model tocompare with actual TSV using the cross-tabulation method,and the model is able to predict all four categories of interest.The model produces a gamma coefficient of 0.727 and PseudoR2 value of 0.456, meaning that almost 45.6% of the variationin thermal sensation can be explained by this model.
Approximately, over one third (34.4%) of the respondentsfelt ‘SlightlyWarm’ during the overall survey period (Fig. 1a).
Int J Biometeorol (2020) 64:187–203 199

Table 3 Result of ordinal regression
Parameters Coefficients Standard error Further model parameters
a. TSV predicted ordinal meteorological model
Slightly cool = −1 10.254 0.934 Pseudo R2 0.245
Neutral = 0 12.970 0.919 Gamma 0.575
Slightly warm = 1 14.947 0.939 std. error 0.029
Warm = 2 16.453 0.958 CI 0.517 0.632
Hot = 3 0.000 cor.test 0.417
Air temperature 0.317 0.045 Pseudo R2 0.245
Tmrt 0.143 0.032 Odds ratio 2.50% 97.50%
Windspeedsqrt − 0.157 0.082 Air temperature 1.373 1.256 1.501
Tmrt 1.153 1.084 1.228
Windspeedsqrt 0.855 0.728 1.004
b. TSV predicted ordinal thermo-physiological model
Slightly cool = −1 7.739 1.000 Pseudo R2 0.385
Neutral = 0 10.616 0.988 gamma 0.636
Slightly warm = 1 12.903 1.006 std. error 0.024
Warm = 2 14.575 1.024 CI 0.589 0.683
Hot = 3 0.000 cor.test 0.508
Air temperature 0.272 0.047 Odds ratio 2.50% 97.50%
Tmrt 0.133 0.033 Air temperature 1.312 1.197 1.439
Windspeedsqrt 0.009 0.086 Tmrt 1.142 1.070 1.219
SkW1 =Drops of sweat 2.308 0.317 Windspeedsqrt 1.010 0.853 1.195
SkW2 =Dry − 0.577 0.687 SkW1 =Drops of sweat 10.054 5.400 18.730
SkW3 = Just right − 1.522 0.130 SkW2 =Dry 0.561 0.146 2.161
SkW4 =Moist 0.000 SkW3 = Just right 0.218 0.168 0.282
E1 =Yes 0.001 0.125 E1 =Yes 1.001 0.783 1.279
c. TSV predicted ordinal combined parameter model
Slightly cool = −1 4.158 1.086 Pseudo R2 0.456
Neutral = 0 7.051 1.072 gamma 0.727
Slightly warm = 1 9.412 1.085 std. error 0.021
Warm = 2 11.282 1.099 CI 0.686 0.768
Hot = 3 0.000 cor.test 0.607
Air temperature 0.228 0.048
Tmrt 0.079 0.035 Odds ratio 2.50% 97.50%
Windspeedsqrt − 0.200 0.089 Air temperature 1.256 1.147 1.384
SkW1 =Drops of sweat 2.356 0.335 Tmrt 1.081 1.011 1.151
SkW2 =Dry − 0.409 0.704 Windspeedsqrt 0.819 0.690 0.977
SkW3 = Just right − 1.417 0.134 SkW1 =Drops of sweat 10.548 5.491 20.372
SkW4 =Moist 0.000 SkW2 =Dry 0.664 0.166 2.617
E1 =Yes − 0.028 0.129 SkW3 = Just right 0.242 0.186 0.313
SSV1 = Too weak − 0.530 0.186 E1 =Yes 0.972 0.755 1.251
SSV2 = Little weak − 0.550 0.150 SSV1 = Too weak 0.588 0.407 0.838
SSV3 =OK − 0.615 0.194 SSV2 = Little weak 0.577 0.430 0.778
SSV4 = Little strong 0.000 SSV3 =OK 0.541 0.370 0.792
SSV5 = Too strong 1.705 0.208 SSV5 = Too strong 5.501 3.601 8.109
Int J Biometeorol (2020) 64:187–203200
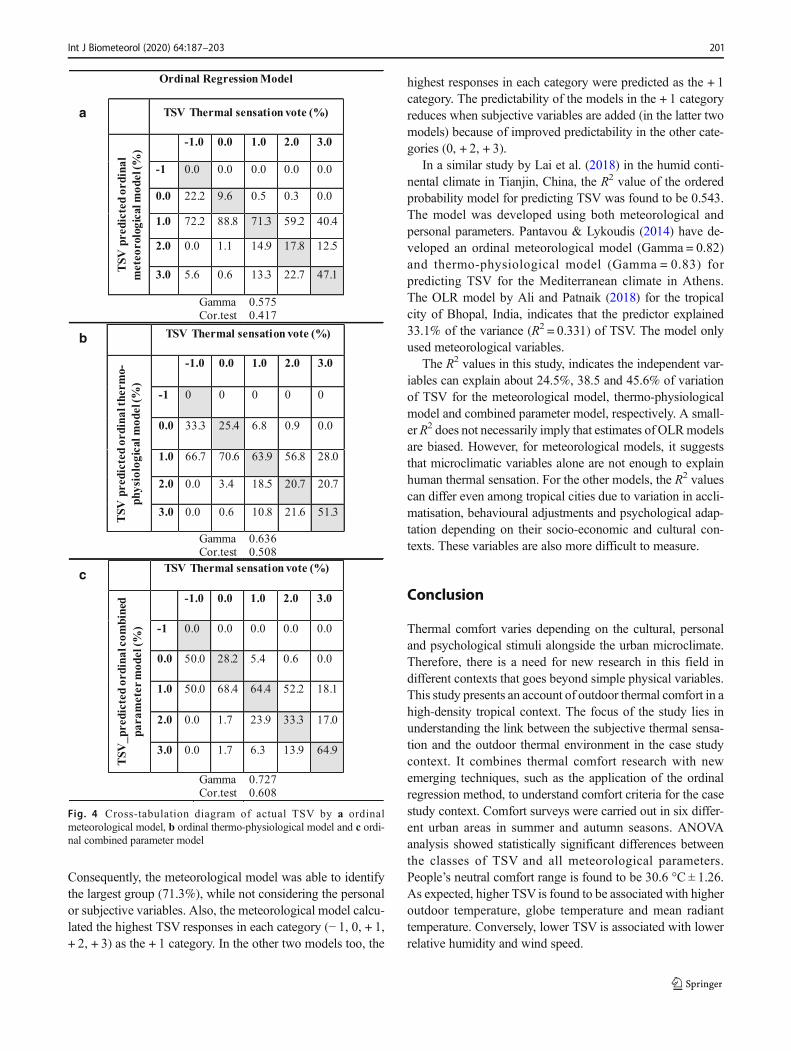
Consequently, the meteorological model was able to identifythe largest group (71.3%), while not considering the personalor subjective variables. Also, the meteorological model calcu-lated the highest TSV responses in each category (− 1, 0, + 1,+ 2, + 3) as the + 1 category. In the other two models too, the
highest responses in each category were predicted as the + 1category. The predictability of the models in the + 1 categoryreduces when subjective variables are added (in the latter twomodels) because of improved predictability in the other cate-gories (0, + 2, + 3).
In a similar study by Lai et al. (2018) in the humid conti-nental climate in Tianjin, China, the R2 value of the orderedprobability model for predicting TSV was found to be 0.543.The model was developed using both meteorological andpersonal parameters. Pantavou & Lykoudis (2014) have de-veloped an ordinal meteorological model (Gamma = 0.82)and thermo-physiological model (Gamma = 0.83) forpredicting TSV for the Mediterranean climate in Athens.The OLR model by Ali and Patnaik (2018) for the tropicalcity of Bhopal, India, indicates that the predictor explained33.1% of the variance (R2 = 0.331) of TSV. The model onlyused meteorological variables.
The R2 values in this study, indicates the independent var-iables can explain about 24.5%, 38.5 and 45.6% of variationof TSV for the meteorological model, thermo-physiologicalmodel and combined parameter model, respectively. A small-er R2 does not necessarily imply that estimates of OLRmodelsare biased. However, for meteorological models, it suggeststhat microclimatic variables alone are not enough to explainhuman thermal sensation. For the other models, the R2 valuescan differ even among tropical cities due to variation in accli-matisation, behavioural adjustments and psychological adap-tation depending on their socio-economic and cultural con-texts. These variables are also more difficult to measure.
Conclusion
Thermal comfort varies depending on the cultural, personaland psychological stimuli alongside the urban microclimate.Therefore, there is a need for new research in this field indifferent contexts that goes beyond simple physical variables.This study presents an account of outdoor thermal comfort in ahigh-density tropical context. The focus of the study lies inunderstanding the link between the subjective thermal sensa-tion and the outdoor thermal environment in the case studycontext. It combines thermal comfort research with newemerging techniques, such as the application of the ordinalregression method, to understand comfort criteria for the casestudy context. Comfort surveys were carried out in six differ-ent urban areas in summer and autumn seasons. ANOVAanalysis showed statistically significant differences betweenthe classes of TSV and all meteorological parameters.People’s neutral comfort range is found to be 30.6 °C ± 1.26.As expected, higher TSV is found to be associated with higheroutdoor temperature, globe temperature and mean radianttemperature. Conversely, lower TSV is associated with lowerrelative humidity and wind speed.
Ordinal Regression Model
TSV Thermal sensation vote (%)TS
V p
redi
cted
ord
inal
)%(ledo
mlacigoloroetem
-1.0 0.0 1.0 2.0 3.0
-1 0.0 0.0 0.0 0.0 0.0
0.0 22.2 9.6 0.5 0.3 0.0
1.0 72.2 88.8 71.3 59.2 40.4
2.0 0.0 1.1 14.9 17.8 12.5
3.0 5.6 0.6 13.3 22.7 47.1
Gamma 0.575Cor.test 0.417
TSV Thermal sensation vote (%)
TSV
pre
dict
ed o
rdin
al th
erm
o-ph
ysio
logi
calm
odel
(%)
-1.0 0.0 1.0 2.0 3.0
-1 0 0 0 0 0
0.0 33.3 25.4 6.8 0.9 0.0
1.0 66.7 70.6 63.9 56.8 28.0
2.0 0.0 3.4 18.5 20.7 20.7
3.0 0.0 0.6 10.8 21.6 51.3
Gamma 0.636Cor.test 0.508
TSV Thermal sensation vote (%)
denibmoclanidro
detciderp_VST
para
met
er m
odel
(%)
-1.0 0.0 1.0 2.0 3.0
-1 0.0 0.0 0.0 0.0 0.0
0.0 50.0 28.2 5.4 0.6 0.0
1.0 50.0 68.4 64.4 52.2 18.1
2.0 0.0 1.7 23.9 33.3 17.0
3.0 0.0 1.7 6.3 13.9 64.9
Gamma 0.727Cor.test 0.608
a
b
c
Fig. 4 Cross-tabulation diagram of actual TSV by a ordinalmeteorological model, b ordinal thermo-physiological model and c ordi-nal combined parameter model
Int J Biometeorol (2020) 64:187–203 201

The research attempted to identify the most important per-sonal parameters responsible for outdoor thermal sensation.Both personal variables (gender, activity, profession-type, ex-posure to air-conditioned space before survey’, ‘sweat-levels’)and psychological parameters (‘reason for visiting the place’and ‘next destination air-conditioned’) had statistically signif-icant effects on thermal sensation. Other parameters, such as‘age’, ‘body type’, ‘body exposure to sun’, ‘time living inDhaka’, ‘travelling in last 30 min’, and ‘hot food in last 15min’ did not have any significant impact. Weather opinionregarding humidity, wind speed and solar radiation had a sig-nificant impact on thermal sensation, although, people’s un-derstanding of the humidity situation was slightly confused.Overall, psychological parameters and weather opinions arefound to be important factors for understanding human ther-mal comfort as they construct people’s perception which con-sequently determines their behaviour and activities.
Three models were developed in this study for predictingthermal sensation using the ordinal logistic regressionmethods. Firstly, models concerning only meteorological pa-rameters were developed. The ordinal meteorological modelscan explain a 25% variation in TSV. Subsequently, personalparameters were incorporated to produce a thermo-physiological model. Finally, combined parameter modelswere developed by further incorporating weather opinion fac-tors to the thermo-physiological models. A greater improve-ment was visible when weather opinions are considered. Thisis evident from the gamma statistics 0.575, 0.636 and 0.729for the meteorological, thermo-physiological and combinedparameter models, respectively. In each model case, modelshave shown good predictability, especially in the ‘Slightlywarm’ and ‘Hot’ categories and lower predictability in the‘Warm’ and ‘Neutral’ categories.
The models show how people’s personal backgrounds andsubjective responses can affect their thermal sensation levels.The meteorological model is helpful for predicting comfortsituations when no personal data or weather opinion is avail-able. The thermo-physiological model could be applied inplaces with high humidity levels where sweat-levels may varydepending on personal circumstances and thus, have a directimpact on the TSV. Depending on the socio-economic context,other personal variables, such as exposure to air-conditioning,may also be a helpful parameter for understanding the TSVlevels. Same is applicable for clothing and gender for placeswhere ‘Clo’-value for men is distinctly different from that ofwomen for social reasons. The combined model, on the otherhand, could be applicable for medium-rise, medium density,tropical urban areas where pedestrians may be affected by highsolar radiation and, therefore, may prefer shaded areas.
The results of this study are helpful in estimating thermalcomfort in high-density, tropical contexts, especially in a de-veloping country situation, where the urban microclimate israpidly deteriorating due to unplanned urban growth. While
tourism aspects are not the main concerns for such cities,decent planning of outdoor spaces can have a significant im-pact on the health and wellbeing of its inhabitants.
Acknowledgements This paper is drawn from research funded by theSchlumberger Foundation at the University of Cambridge, Departmentof Architecture.
Open Access This article is distributed under the terms of the CreativeCommons At t r ibut ion 4 .0 In te rna t ional License (h t tp : / /creativecommons.org/licenses/by/4.0/), which permits unrestricted use,distribution, and reproduction in any medium, provided you giveappropriate credit to the original author(s) and the source, provide a linkto the Creative Commons license, and indicate if changes were made.
References
Ahmed KS (2003) Comfort in urban spaces: defining the boundaries ofoutdoor thermal comfort for the tropical urban environments.Energy and Buildings 35(1):103–110. https://doi.org/10.1016/S0378-7788(02)00085-3
Ali SB, Patnaik S (2018) Thermal comfort in urban open spaces: objec-tive assessment and subjective perception study in tropical city ofBhopal, India. Urban Climate 24(October 2017):954–967. https://doi.org/10.1016/j.uclim.2017.11.006
Andrade H, Alcoforado MJ, Oliveira S (2011) Perception of temperatureand wind by users of public outdoor spaces: relationships withweather parameters and personal characteristics. Int J Biometeorol55(5):665–680. https://doi.org/10.1007/s00484-010-0379-0
Azad AK, Kitada T (1998) Characteristics of the air pollution in the cityof Dhaka, Bangladesh in winter. Atmos Environ 32(11):1991–2005.https://doi.org/10.1016/S1352-2310(97)00508-6
Begum BA, Biswas SK, Hopke PK (2011) Key issues in controlling airpollutants in Dhaka, Bangladesh. Atmos Environ 45(40):7705–7713. https://doi.org/10.1016/j.atmosenv.2010.10.022
Brager GS, De Dear RJ (1998) Thermal adaptation in the built environ-ment: a literature review. Energy and Buildings 27:83–96. https://doi.org/10.1016/S0378-7788(97)00053-4
Carlsen L, Bruggemann R, Kenessov B (2018) Use of partial order inenvironmental pollution studies demonstrated by urban BTEX airpollution in 20 major cities worldwide. Sci Total Environ 610–611:234–243. https://doi.org/10.1016/j.scitotenv.2017.08.029
Christensen R (2011) Analysis of ordinal data with cumulative linkmodels—estimation with the ordinal package. R-package ver-sion, pp 1–31
Fanger O (1970) Thermal comfort analysis and applications in environ-mental engineering. McGraw Hill, New York
Ghali K, Ghaddar N, Bizri M (2011) The influence of wind on outdoorthermal comfort in the city of Beirut: a theoretical and field study.HVAC&R Research 17(March 2015):813–828. https://doi.org/10.1080/10789669.2011.607746
Givoni B et al 2003 Outdoor comfort research issues. , 35, pp.77–86da Silveira Hirashima SQ, de Assis ES, Nikolopoulou M (2016) Daytime
thermal comfort in urban spaces: a field study in Brazil. Build Environ107:245–253. https://doi.org/10.1016/j.buildenv.2016.08.006
Ignatius M, Wong NH, Jusuf SK (2015) Urban microclimate analysiswith consideration of local ambient temperature, external heat gain,urban ventilation, and outdoor thermal comfort in the tropics.Sustainable Cities and Society 19:121–135. https://doi.org/10.1016/j.scs.2015.07.016
ISO 7726 1998. Ergonomics of the thermal environment—instrumentsfor measuring physical quantities, Geneva
Int J Biometeorol (2020) 64:187–203202

Johansson E et al (2018) Outdoor thermal comfort in public space inwarm-humid Guayaquil, Ecuador. Int J Biometeorol:1–13. https://doi.org/10.1007/s00484-017-1329-x
Karjalainen S (2007) Gender differences in thermal comfort and use ofthermostats in everyday thermal environments. Build Environ 42(4):1594–1603. https://doi.org/10.1016/j.buildenv.2006.01.009
Katavoutas G, Theoharatos G, Flocas HA, Asimakopoulos DN (2009)Measuring the effects of heat wave episodes on the human body’sthermal balance. Int J Biometeorol 53(2):177–187. https://doi.org/10.1007/s00484-008-0202-3
Knez I, Thorsson S, Eliasson I, Lindberg F (2009) Psychological mech-anisms in outdoor place and weather assessment: towards a concep-tual model. Int J Biometeorol 53(1):101–111. https://doi.org/10.1007/s00484-008-0194-z
Kotharkar R, Ramesh A, Bagade A (2018) Urban heat island studies inSouth Asia: a critical review. Urban Clim. https://doi.org/10.1016/J.UCLIM.2017.12.006
Kruger EL, Drach P (2017) Identifying potential effects from anthropo-metric variables on outdoor thermal comfort. Build Environ 117:230–237. https://doi.org/10.1016/j.buildenv.2017.03.020
Krüger EL, Rossi FA (2011) Effect of personal and microclimatic vari-ables on observed thermal sensation from a field study in southernBrazil. Build Environ 46(3):690–697. https://doi.org/10.1016/j.buildenv.2010.09.013
Lai D, Chen C, Liu W, Shi Y, Chen C (2018) An ordered probabilitymodel for predicting outdoor thermal comfort. Energ Buildings 168:261–271. https://doi.org/10.1016/j.enbuild.2018.03.043
Lin TP (2009) Thermal perception, adaptation and attendance in a publicsquare in hot and humid regions. Build Environ 44(10):2017–2026.https://doi.org/10.1016/j.buildenv.2009.02.004
McIntyre DA (1980) Indoor climate. Applied Science Publishers,London
Metje N, Sterling M, Baker CJ (2008) Pedestrian comfort using clothingvalues and body temperatures. J Wind Eng Ind Aerodyn 96(4):412–435. https://doi.org/10.1016/j.jweia.2008.01.003
Ng E, Cheng V (2012) Urban human thermal comfort in hot andhumid Hong Kong. Energ Buildings 55:51–65. https://doi.org/10.1016/j.enbuild.2011.09.025
Nikolopoulou M, Baker N, Steemers K (2001) Thermal comfort inoutdoor urban spaces: understanding the human parameter. SolEnergy 70(3):227–235. https://doi.org/10.1016/S0038-092X(00)00093-1
Nikolopoulou M, Lykoudis S (2006) Thermal comfort in outdoor urbanspaces: analysis across different European countries. Build Environ41(11):1455–1470. https://doi.org/10.1016/j.buildenv.2005.05.031
Nikolopoulou M, Lykoudis S, Kikira M (2003) Thermal comfort in out-door spaces: field studies in Greece. Proceedings of the fifth inter-national conference on urban climate, Lodz, pp. 1–5
NikolopoulouM, Steemers K (2003) Thermal comfort and psychologicaladaptation as a guide for designing urban spaces. Energ Buildings35(1):95–101. https://doi.org/10.1016/S0378-7788(02)00084-1
Pantavou K, Theoharatos G, Santamouris M, Asimakopoulos D (2013)Outdoor thermal sensation of pedestrians in aMediterranean climateand a comparison with UTCI. Build Environ 66:82–95. https://doi.org/10.1016/j.buildenv.2013.02.014
Pantavou K, Lykoudis S (2014) Modeling thermal sensation in aMediterranean climate-a comparison of linear and ordinal models.Int J Biometeorol 58(6):1355–1368. https://doi.org/10.1007/s00484-013-0737-9
Santamouris M, Asimakopoulos DN (2001) Energy and climate inthe urban built environment. James and James SciencePublishers, London
Schellen L, Loomans MGLC, de Wit MH, Olesen BW, LichtenbeltWDM (2012) The influence of local effects on thermal sensationunder non-uniform environmental conditions—gender differencesin thermophysiology, thermal comfort and productivity during con-vective and radiant cooling. Physiol Behav 107(2):252–261. https://doi.org/10.1016/j.physbeh.2012.07.008
Thorsson S et al (2007) Different methods for estimating the mean radianttemperature in an outdoor urban setting. Int J Climatol1993(October):1983–1993. https://doi.org/10.1002/joc
Thorsson S, Lindqvist M, Lindqvist S (2004) Thermal bioclimatic con-ditions and patterns of behaviour in an urban park in Goteborg,Sweden. Int J Biometeorol 48(3):149–156. https://doi.org/10.1007/s00484-003-0189-8
Turok I, McGranahan G (2013) Urbanization and economic growth: thearguments and evidence for Africa and Asia. Environ Urban 25(2):465–482. https://doi.org/10.1177/0956247813490908
Villadiego K, Velay-Dabat MA (2014) Outdoor thermal comfort in ahot and humid climate of Colombia: a field study inBarranquilla. Build Environ 75:142–152. https://doi.org/10.1016/j.buildenv.2014.01.017
Yang W, Wong NH, Jusuf SK (2013) Thermal comfort in outdoor urbanspaces in Singapore. Build Environ 59:426–435. https://doi.org/10.1016/j.buildenv.2012.09.008
Int J Biometeorol (2020) 64:187–203 203


!['Real-time Urban Microclimate Analysis Using … Urban Microclimate Analysis Using Internet of Things ... In many IoT applications, ... urban microclimate monitoring [20]. To study](https://static.fdocuments.in/doc/165x107/5ac834157f8b9aa3298bdae6/real-time-urban-microclimate-analysis-using-urban-microclimate-analysis-using.jpg)