Effects of Manufactured Sands and Blended Aggregates … · Effects of Manufactured Sands and...
186
Effects of Manufactured Sands and Blended Aggregates on the Durability of Concrete Bridge Decks and Pavements Michael L. Leming, PhD, Principal Investigator Ufuk Dilek, PhD, PE, Research Associate Highway Research Project HWY-98-6 Final Report (Draft) In Cooperation with the North Carolina Department of Transportation CENTER FOR TRANSPORTATION ENGINEERING STUDIES Department of Civil, Construction, and Environmental Engineering North Carolina State University i
Transcript of Effects of Manufactured Sands and Blended Aggregates … · Effects of Manufactured Sands and...

Effects of Manufactured Sands and Blended Aggregates on the Durability of Concrete Bridge Decks and Pavements
Michael L. Leming, PhD, Principal Investigator
Ufuk Dilek, PhD, PE, Research Associate
Highway Research Project HWY-98-6
Final Report (Draft)
In Cooperation with the
North Carolina Department of Transportation
CENTER FOR TRANSPORTATION ENGINEERING STUDIES
Department of Civil, Construction, and Environmental Engineering
North Carolina State University
i

Technical Report Documentation Page
1. Report No. FHWA/NC/2006-64
2. Government Accession No.
3. Recipient’s Catalog No.
4. Title and Subtitle Effects of Manufactured Sands and Blended Aggregates on the
5. Report Date August 2008
Durability of Concrete Bridge Decks and Pavements 6. Performing Organization Code
7. Author(s) Michael L. Leming, Ph.D., Ufuk Dilek, Ph.D., P.E.
8. Performing Organization Report No.
9. Performing Organization Name and Address North Carolina State University Dept. of Civil, Construction, & Environmental Engrg.
10. Work Unit No. (TRAIS)
Campus Box 7908 Raleigh, NC 27695-7908
11. Contract or Grant No.
12. Sponsoring Agency Name and Address North Carolina Department of Transportation Research and Analysis Group
13. Type of Report and Period Covered Final Report
July 1997 – June 1999 1 South Wilmington Street Raleigh, North Carolina 27601
14. Sponsoring Agency Code 1998-06
15. Supplementary Notes:
16. Abstract Diminishing natural sand resources have created a need for alternate materials for use as fine aggregate in portland cement concrete. Manufactured sands generally are more angular and contain a higher percentage of fines than natural sands, both of which can affect workability and water demand, and the properties of concrete. While manufactured sands have been used in a number of locations in North Carolina’s interstate highways, only a few aggregate sources have a long service record, particularly under freezing conditions. Much of the research on manufactured sand use in concrete has been conducted by the aggregate industry with conclusions based primarily on compressive strength. There is a general lack of information on frost durability, salt scaling resistance and permeability of concrete produced with manufactured sands, or on the effects of the higher water demands typical of manufactured sands on bleeding or segregation. This study was conducted to analyze selected manufactured sand characteristics and to determine the effects of manufactured sands on the fresh and hardened properties emphasizing deicer salt scaling resistance of concrete. This report describes the effects of various manufactured sands on the durability of concrete, including the effects of w/c ratio and supplementary cementitious materials. A limited investigation was also conducted on the effects of overall aggregate grading and manufactured sand gradation. 17. Key Words Natural sand, manufactured sand, compressive strength, durability, salt scaling resistance, permeability, water/cement ratio
18. Distribution Statement
19. Security Classif. (of this report) Unclassified
20. Security Classif. (of this page) Unclassified
21. No. of Pages 186
22. Price
Form DOT F 1700.7 (8-72) Reproduction of completed page authorized

DISCLAIMER
The contents of this report reflect the views of the author(s) and not necessarily the views of the
University. The author(s) are responsible for the facts and the accuracy of the data presented
herein. The contents do not necessarily reflect the official views or policies of either the North
Carolina Department of Transportation or the Federal Highway Administration at the time of
publication. This report does not constitute a standard, specification, or regulation.

TABLE OF CONTENTS
Table of Contents
Executive Summary
Chapter 1 Introduction
Chapter 2 Literature Review and Problem Statement 2.1 Stone Dust in Concrete 2.1.1 Specifications 2.1.3 North Carolina Experience with Manufactured Sand 2.2 Angularity and Particle Shape Measures 2.2.1 Angularity Measures 2.2.2 Particle Shape Measures 2.3 Effects of Angular Sands in Concrete and Mortar 2.3.1 Effects of Sand Angularity on Water Demand Bleeding And Strength 2.3.2 Effects of Sand Angularity on Frost Durability 2.3.2.1 Measurement and Mechanisms of Frost Durability 2.3.2.2 Frost Durability Testing of Manufactured Sand Concrete 2.4 Problem Statements 2.5 Overview of Research
Chapter 3 Characteristics of Sands in the Study 3.1 Selection of Sands for Initial Testing 3.2 Determination of Sand Characteristics - Test Methods 3.2.1 Standard Test Methods 3.2.2 Image Analysis of Geometric Properties - Test Methods 3.2.2.1 Image Analysis Apparatus 3.2.2.2 Procedure for Image Preparation and Acquisition 3.2.2.3 Procedures for Image Analysis 3.3 Results and Discussion - Bulk Sand Testing 3.4 Geometric Shape Characteristics 3.4.1 Definitions 3.4.2 Discussion of Shape Characteristics 3.5 Results and Discussion - Sand Particle Testing 3.5.1 Differences in Shape Characteristics and Angularity Based on Size 3.5.2 Comparison of Particle Based Shape Characteristics and Void Contents 3.5.2.1 Correlation Between Shape Characteristics 3.5.2.2 Relationship Between Shape Characteristics and Void Content 3.5.3 Implications of the Model
ii

3.6 Conclusions - Sand Characteristics
Chapter 4 Characteristics of Mortar with Manufactured Sands 4.1 Test Methods for Mortars 4.2 Results of Mortar Testing 4.3 Conclusions of Mortar Testing
Chapter 5 Concrete Testing Program - Methodology 5.1 Composition and Raw Materials 5.2 Concrete Properties Tested 5.2.1 Fresh Concrete Properties 5.2.2 Hardened Concrete Properties 5.3 Mixing and Fabrication Procedures 5.4 Test Methods 5.4.1 Test Methodologies for Workability and Water Demand of Fresh Concrete 5.4.1.1 Conventional Workability Test Methods 5.4.1.2 Water Demand 5.4.2 Frost Durability 5.4.2.1 Standard Deicer Salt Scaling Resistance 5.4.2.1 Alternate Deicer Salt Scaling Resistance Test Method 5.4.3 Tests of Hardened Concrete 5.4.3.1 Mechanical Properties 5.4.3.2 Dynamic Modulus of Thin Disks 5.4.3.3 Segregation and Bleeding 5.4.3.4 Air Permeability Index 5.5 Detailed Test Matrices 5.6 Statistical Analysis
Chapter 6 Fresh and Mechanical Properties of Concrete 6.1 Fresh Concrete Properties 6.1.1 Overview 6.1.2 Results and Discussion of the Adjusted Water Demand Model 6.1.3 Discussion of Other Contributing Factors 6.1.3.1 Effects of Cement Content on Water Demand 6.1.3.2 Effects of Fly Ash on Water Demand 6.1.4 Factors with Marginal Effects 6.1.4.1 Alternative Test Methods 6.1.4.2 Comparison of Angularity Measures 6.1.5 Effects of Extended Mixing 6.2 Mechanical Properties of Manufactured Sand Concrete 6.2.1 Relationships Between Mechanical Properties 6.2.2 Effects of Water Demand 6.2.3 Effects of Extended Mixing
iii

6.3 Shrinkage 6.4 Bleeding and Segregations 6.4.1 Results of the Preliminary Study 6.4.1.1 Bleeding and Segregation Test Procedures, Preliminary Study 6.4.1.2 Results of the Preliminary Bleeding and Segregation Study 6.4.2 Bleeding and Segregation Tests; Secondary Testing 6.4.2.1 Results of the Bleeding and Segregation Study 6.4.2.2 Conclusions, Bleeding and Segregation 6.5 Conclusions - Fresh and Mechanical Properties of Concrete
Chapter 7 Influence of Manufactured Sands on Deicer Salt Scaling Durability and Permeability 7.0 Overview 7.1 Air Permeability 7.2 Deicer Salt Scaling Resistance 7.2.1 Effects of SCM 7.2.2 Effects of Increased Entrained Air Content 7.2.3 Effects of Strength, API, and Water Content 7.2.4 Sand Characteristics Affecting Deicer Salt Scaling Resistance 7.2.5 Conclusions - ASTM C 672 Testing 7.3 Quantification of Frost Damage Using Mechanical Properties 7.3.1 Dynamic Modulus Loss in Cores 7.3.2 Alternative Deicer Salt Scaling Test Method 7.3.2.1 Results of Dynamic Modulus Testing 7.3.2.2 Effects of Finishing 7.3.2.3 Results of Visual Rankings and Mass Lost 7.3.3 Conclusions - Mechanical Properties and Alternate Test Methods 7.4 Possible Use of a Non-Linear Factor Product 7.4 Discussion and Conclusions - Deicer Salt Scaling Resistance
Chapter 8 Effects of Modified Aggregate Gradations on Deicer Salt Scaling 8.1 Background 8.2 Overall Aggregate Grading 8.2.1 Aggregates 8.2.2 Concrete Mixtures 8.2.2.1 Conventional Aggregate Mixture (Control) 8.2.2.2 "8-to-18" Aggregate Mixture 8.2.2.3 Three Aggregate Blend Mixture 8.2.2.4 Composition and Properties 8.2.3 Results and Discussion, Combined Aggregate Gradation 8.3 Effects of Fine Aggregate Gradation 8.3.1 Sand Gradations 8.3.2 Testing 8.3.3 Results and Discussion - Fresh Concrete
iv

8.3.3.1 Fresh Concrete 8.3.3.2 Hardened Concrete 8.3.4 Effects of Differences in Fine Aggregate Grading - Conclusions 8.4 Conclusions
Chapter 9 Conclusions and Recommendations 9.1 Sand Characteristics 9.2 Mortar Testing 9.3 Fresh and Mechanical Properties of Concrete 9.4 Permeability 9.5 Deicer Salt Scaling (Frost) Resistance 9.6 Deicer Salt Scaling Assessment using Cores from ASTM C 672 Slabs 9.7 Alternate Deicer Salt Scaling Test Method - Findings and Assessment 9.8 Effects of Aggregate Grading on Deicer Salt Scaling Resistance 9.9 General Recommendations
References
v

EXECUTIVE SUMMARY
Diminishing natural sand resources have created a need for alternate materials for use as
fine aggregate in portland cement concrete. Manufactured sands generally are more angular and
contain a higher percentage of fines than natural sands, both of which can affect workability and
water demand, and the properties of concrete. While manufactured sands have been used in a
number of locations in North Carolina’s interstate highways, only a few aggregate sources have a
long service record, particularly under freezing conditions.
Much of the research on manufactured sand use in concrete has been conducted by the
aggregate industry with conclusions based primarily on compressive strength. There is a general
lack of information on frost durability, salt scaling resistance and permeability of concrete
produced with manufactured sands, or on the effects of the higher water demands typical of
manufactured sands on bleeding or segregation.
This study was conducted to analyze selected manufactured sand characteristics and to
determine the effects of manufactured sands on the fresh and hardened properties emphasizing
deicer salt scaling resistance of concrete. This report describes the effects of various
manufactured sands on the durability of concrete, including the effects of w/c ratio and
supplementary cementitious materials. A limited investigation was also conducted on the effects
of overall aggregate grading and manufactured sand gradation.
vi
XS.1 Literature Review
The literature related to manufactured sand use in concrete can be grouped into three
broad categories:
1. the effects of stone dust or fines in portland cement concrete,
2. the determination of the angularity and particle shape of sands, and
3. the effects of angular sands in portland cement concrete and mortar.
Published studies are is almost exclusively related to the effects of manufactured sands on water
demand and strength. Research conducted on angularity and on incorporating stone dust, a waste
product of the crushing process, in concrete, has generally focused on compressive strength with
some discussion of water demand. Very little modern data exists examining the frost durability
of concrete produced with manufactured sand, which tends to be more angular and have higher
fines content.
Sand angularity affects mortar and concrete properties primarily by changing water
demand and, when a water-cement (w/c) ratio is specified, through related changes in paste
content. Lower angularity sands are typically desired, if available. Manufactured sands tend to
be more angular than natural sands due to the crushing operations needed to produce the sand
and to the lack of abrading occurring with natural sands. The crushing process also tends to
produce a considerable quantity of fines that must be wasted unless permitted to remain in the
manufactured sand. Since the fines are primarily stone dust rather than clay or other
contaminants, a higher percentage is allowed in manufactured sand specifications. The higher
fines content will also increase water demand, all else being equal.
vii
Angularity of fine aggregate is usually quantified as the void content using the method
proposed by the National Aggregates Association and standardized as ASTM C 1252 (AASHTO
TP33). Particle shape will clearly affect the void content, but individual particle shape analysis
has been conducted on coarse aggregate constituents. A similar analytical tool for fine aggregate
would be useful.
Frost durability of concrete is currently measured using two standard methods, which
assess durability for two different phenomena, rapid freezing and thawing resistance and
resistance to deicer salt scaling. ASTM C666 (AASHTO T161-86) [ASTM 1998] involves rapid
freezing and thawing cycles in the presence of water. Frost durability determined using ASTM
C666 Resistance of Concrete to Rapid Freezing and Thawing measures only the effectiveness of
the air void system for concrete with frost durable aggregate.
For a concrete to be resistant to ASTM C 672 [ASTM 1998] deicer scaling, it must also
have an acceptable air void system, however it is also sensitive to finishing effects and surface
condition, among other factors. This test involves slower, more realistic freezing cycles in the
presence of a deicing salt solution and attempts to more realistically simulate frost conditions in
a pavement or bridge deck. One difficulty with this test is that deterioration is determined
visually and this qualitative evaluation is subjective.
Scaling, delamination, and poor surface durability can be affected by paste and water
content effects, including bleeding and types of surface finishes, by formation of layers,
including segregation and placing (finishing) effects, and by strength and entrained air content.
Problems with fly ash in deicer scaling are well established. Although fly ash improves
permeability and pore refinement it does not improve scaling durability. ACI 318, the
viii
Reinforced Concrete Building Code, limits the fly ash content to a maximum of 25 % for
concretes exposed to deicer salts and frost. Silica fume is reported to perform better than fly ash
mixtures in scaling but is still not as durable as comparable cement only mixtures.
XS.2 Problem Statement
(1) Most of the specifications, recommended practices and guidance on limits or
requirements for aggregate characteristics have been established for portland cement concretes
produced using natural sands. Manufactured sands typically have higher fines content and
higher angularity than natural sands. The implications of the differences in properties on water
demand and compressive strength are reasonably well known. The influence of the differences
on the frost scaling resistance of pavements in North Carolina have not yet been fully
established. In addition, the effects of or interactions with fly ash and manufactured sand, and
the relative sensitivity of w/c ratio on scaling resistance have not yet been established. Further,
preliminary assessment of gradation effects is also needed.
(2) The characteristics of the manufactured sand must be established so that the
relationships between the characteristics and performance of concrete can be determined and
appropriate specifications developed for the widespread, informed use of manufactured sands in
portland cement concrete.
XS.3 Overview of Research and Findings
The bulk of this study was conducted in three sequential phases. The first phase was to
determine the properties and characteristics of a wide variety of manufactured sands in
ix
comparison with a local, natural sand with a long service record of successful performance (see
Ch. 3). Unique image analysis techniques were developed for this study. Image analysis of sand
particles was conducted to quantify particle characteristics of selected sands by size; standard
fine aggregate tests were also conducted. A quantitative relationship was found between the bulk
measure of angularity of a sand, the void content, and various geometric characteristics of
individual sand particles.
In the next phase, a limited study of the effect of sand characteristics s on water demand
of mortars was conducted (see Ch. 4). Mortar testing was found to provide largely ancillary
results and was useful primarily as an intermediate testing phase to identify sands for further
evaluation. Results of mortar and concrete tests were generally similar, but mortar tests cannot
be substituted exclusively for concrete tests. A number of sands encompassing a variety of
properties were selected for in-depth examination based on the results of these first two phases.
Fourteen manufactured sands from three different aggregate producing companies
serving the North Carolina market were testing in the first two phases of this study. These sands
were selected in conjunction with the Materials and Test Unit of the North Carolina Department
of Transportation, based on geographical and geological variety, and to ensure a wide range of
characteristics. Sands used were from the Clarks, Rocky Point, Belgrade, Salem Stone,
Jamestown, New Bern, Pomona, Woodleaf, and Castle Hayne quarries operated by Martin
Marietta, the Smith Grove, South Boston, and Hendersonville quarries operated by Vulcan
Materials, and the Butner quarry operated by Carolina Sunrock. Natural sand from the Lillington
quarry was chosen to be the control. This sand was selected because it has a long history of
x

durable and successful use in practice and its properties, including excellent frost durability, were
well known from previous investigations.
A number of the sands had very similar properties and a slightly smaller subset of sands
was selected for much of the in-depth analysis subsequently conducted in this study. Two
subsets were selected for the remaining phases. Both the larger subset [Belgrade, Castle Hayne,
Clark, Jamestown, New Bern, Pomona, Rocky Point, Salem Stone, Smith Grove and Woodleaf]
and the smaller subset [Pomona, Salem Stone, Smith Grove, and Lillington] maintained adequate
geographic, manufacturer, and material characteristic diversity, while permitting the more
detailed testing required in later stages.
The bulk of the remaining research concentrated on determining the effects of the sands
on the fresh properties, mechanical properties, permeability, and most importantly, the deicer salt
scaling resistance of concretes produced using manufactured sands. Fresh properties included
workability and water demand, bleeding and segregation, and response to extended mixing.
Mechanical properties included compressive and flexural strength, elastic modulus, and very
limited shrinkage testing. Frost resistance was evaluated in accordance with ASTM C 672,
Freezing and Thawing Test in the Presence of Deicing Chemicals. This method is more
appropriate for pavements and bridge decks than ASTM C 666, which only measures the
effectiveness of the entrained air void system. The basis of comparison was a concrete produced
with a durable, natural sand. Since evaluation is based on visual assessment, several alternate
evaluation techniques and test methods were also examined. See Ch. 5 for a detailed description
of the test program.
xi
The effects of sand characteristics on fresh and mechanical properties are reviewed in
detail in Ch. 6; critical findings are given below. The complete list of findings are provided in
Ch. 6. A list of findings of this study from all phases is given in Ch. 9.
The water demand was higher for concrete produced with manufactured sands than with
the natural sand, but the workability was acceptable for paving and surface course applications
for all mixtures. Water demand was functionally dependent on void content and, to a lesser but
still important extent, on the fines content of the sands used. Blending sands produced a concrete
with a water demand approximately proportional to the quantity and the water demand of the
sands used although improvement was disproportional with high water demand sands.
No meaningful difference was found with air and slump losses due to extended mixing
were within expectations and sand characteristics had little, if any, effect. The air content after
extended mixing was also within expectations for all mixtures. No significant difference in
segregation or bleeding was found in concrete mixtures with manufactured sand. Bleeding and
segregation were observed when concrete mixtures were exposed to heavy vibration and to
extreme vibration, but the response of mixtures containing manufactured sand appear to be
similar to those for mixtures containing natural sand. The current NCDOT specifications for
placement and slump of concrete in pavements and bridge decks help minimize problems related
to segregation or bleeding for conventional concrete mixtures and remain appropriate for
mixtures with manufactured sand.
Mechanical properties, including shrinkage, were consistent with values found with other
mixtures incorporating the Garner coarse aggregate.
xii

The effects of manufactured sands on deicer salt scaling are reviewed in detail in Ch. 7.
The deicer salt scaling performance of the concrete mixtures tested in this study are provided in
Tables 7.2a, 7.2b, and 7.3c. Strength is given in US customary units for convenience. Rank is
from best to worst. The visual rating conforms to ASTM C 672 categories. Although these
ratings must be used with caution, in the opinion of the investigators, they may be used to
classify mixtures according to likely behavior in service in North Carolina. Mixtures with
ratings of 1 or 2 will likely provide good salt scaling resistance in practice in pavements or
bridge decks with significant road salting. Mixtures with ratings of 3 will likely provide
acceptable, but ranging from fair to marginal, salt scaling resistance in practice in pavements or
bridge decks with significant road salting. Those mixtures with ratings of 4 will likely provide
marginal or poor salt scaling resistance in practice in pavements or bridge decks with significant
road salting; these mixtures will likely have acceptable frost resistance in other applications as
long as the entrained air system and content are acceptable.
xiii

Table 7.2a Deicer Salt Scaling - Good
SandRank Rating Class Air Voids -75 µm fc API
C 672 % % (A) pcy psi m2/s
Pomona 1 1 AA 5.2 46.3 45.2 5570 0.54
Lillington 2 1 AA 5.4 45.1 8.0 6020 0.25
Pomona 3 1 AA, SCM 7.0 46.3 40.6 4180 0.40
Salem St, 75% 4 1 AA 6.0 n/a 25.8 4890 0.92
Clark 5 1 AA 5.4 46.6 36.5 6190 0.47
Castle Hayne 6 1 AA 6.4 46.9 21.1 6250 0.47
Smith Gr, 75% 7 2 AA 4.7 n/a 51.2 5670 0.65
New Bern 8 2 AA 6.8 46.7 38.4 5800 0.49
Salem Stone 9 2 AA, SCM 5.6 49.8 27.9 4230 0.38
Lillington 10 2 A 5.4 45.1 8.4 5250 0.56
Rocky Point 11 2 AA 6.7 47.1 37.4 6920 0.37
Belgrade 12 2 AA 4.6 46.0 37.2 6030 0.39
"Air" is total air content determined using the pressure method; "f c" is compressive strength in pounds per square inch (psi) at 28 days; "API" is the Air Permeability Index in square meters per second (m2/s); "AA" and "A" are NCDOT classes of concrete (w/c = 0.45 or 0.50, respectively); "SCM" is supplementary cementitious material. Percent of a manufactured sand indicates the percent blended with Lillington sand.
xiv
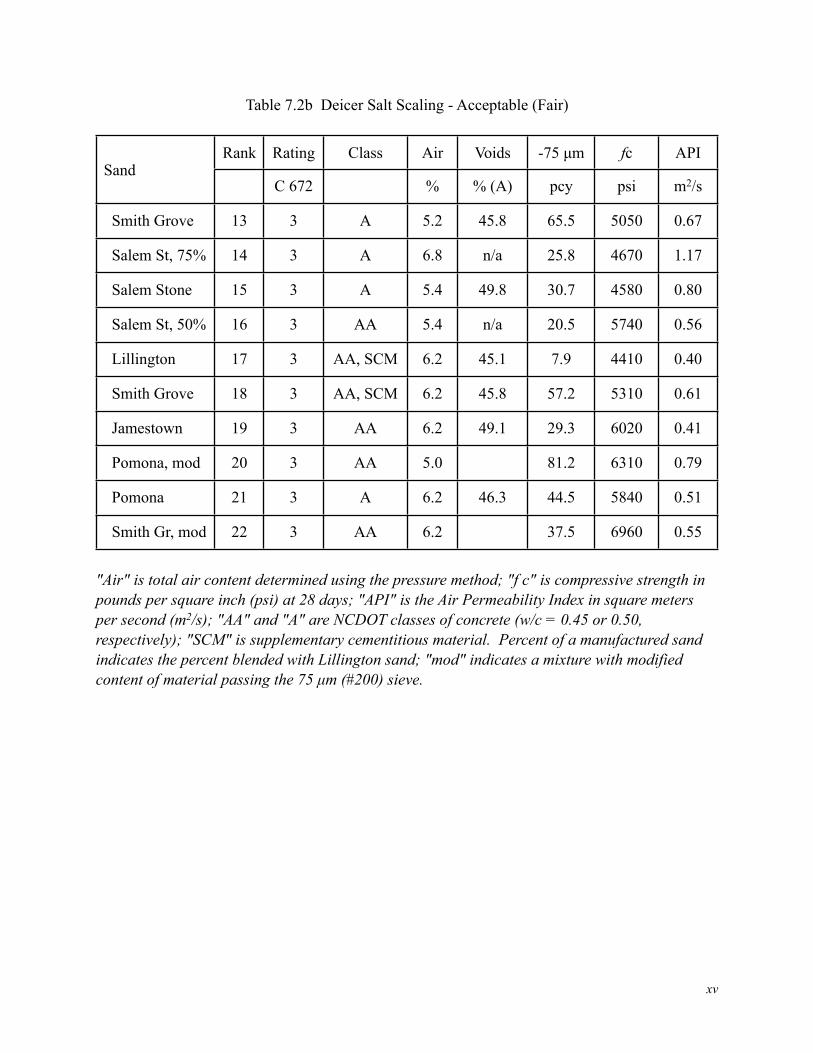
Table 7.2b Deicer Salt Scaling - Acceptable (Fair)
SandRank Rating Class Air Voids -75 µm fc API
C 672 % % (A) pcy psi m2/s
Smith Grove 13 3 A 5.2 45.8 65.5 5050 0.67
Salem St, 75% 14 3 A 6.8 n/a 25.8 4670 1.17
Salem Stone 15 3 A 5.4 49.8 30.7 4580 0.80
Salem St, 50% 16 3 AA 5.4 n/a 20.5 5740 0.56
Lillington 17 3 AA, SCM 6.2 45.1 7.9 4410 0.40
Smith Grove 18 3 AA, SCM 6.2 45.8 57.2 5310 0.61
Jamestown 19 3 AA 6.2 49.1 29.3 6020 0.41
Pomona, mod 20 3 AA 5.0 81.2 6310 0.79
Pomona 21 3 A 6.2 46.3 44.5 5840 0.51
Smith Gr, mod 22 3 AA 6.2 37.5 6960 0.55
"Air" is total air content determined using the pressure method; "f c" is compressive strength in pounds per square inch (psi) at 28 days; "API" is the Air Permeability Index in square meters per second (m2/s); "AA" and "A" are NCDOT classes of concrete (w/c = 0.45 or 0.50, respectively); "SCM" is supplementary cementitious material. Percent of a manufactured sand indicates the percent blended with Lillington sand; "mod" indicates a mixture with modified content of material passing the 75 µm (#200) sieve.
xv

Table 7.2c Deicer Salt Scaling - Poor
SandRank Rating Class Air Voids -75 µm fc API
C 672 % % (A) pcy psi m2/s
Woodleaf 23 4 AA 6.6 47.5 62.2 5030 0.61
Smith Grove 24 4 AA 5.0 45.8 64.9 5640 0.81
Salem Stone 25 4 AA 5.0 49.8 29.8 5900 0.75
Pomona 26 4 A, SCM 5.0 46.3 46.0 4500 0.46
Smith Grove 27 4 A, SCM 5.5 45.8 64.4 3800 0.54
Smith Grove 28 4 AA, SCM 5.2 45.8 59.4 4420 0.63
Salem Stone 29 4 A, SCM 5.2 49.8 29.5 3840 0.72
"Air" is total air content determined using the pressure method; "f c" is compressive strength in pounds per square inch (psi) at 28 days; "API" is the Air Permeability Index in square meters per second (m2/s); "AA" and "A" are NCDOT classes of concrete (w/c = 0.45 or 0.50, respectively); "SCM" is supplementary cementitious material. Percent of a manufactured sand indicates the percent blended with Lillington sand.
Preliminary classification of manufactured sands for potential resistance to deicer salt
scaling in Class AA mixtures was found to be possible based on bulk angularity and stone dust
content:
Manufactured sands are likely to have good to fair resistance to deicer salt scaling if:
-194.5 + 4.17 Vs + 0.518 D < 12 Eq. 7.4a
Manufactured sands are likely to have poor resistance to deicer salt scaling if:
-194.5 + 4.17 Vs + 0.518 D ≥ 15 Eq. 7.4b
where Vs is the void content (Method A), and D is the quantity of material passing the 75µm
(#200) sieve (kg/m3).
xvi

Manufactured sands likely to have good resistance to deicer salt scaling may have
excellent resistance if both
- Roundness is less than 1.4, and Eq. 7.4c(1)
- Blade shaped particles do not exceed 10% of the sand, Eq. 7.4c(2)
for sands geologically similar to those examined in this study. The proposed preliminary
classification should be used with caution, however, due to the significant scatter in the results.
Geology of the parent rock alone was found to have no effect on the deicer salt scaling of Class
AA mixtures produced with manufactured sand. Manufactured sands may be blended with
natural sands to improve deicer salt scaling resistance. Characteristics of these mixtures will
largely be the weighted averages of the characteristics of mixtures with either sand.
Class A mixtures were found, as expected, to be unsuited for use in pavements and bridge
decks exposed to substantial deicer salt exposure. The use of 25% fly ash, in a one-to-one
replacement of portland cement, contributed to a reduction in deicer salt scaling resistance, as
expected. The effect was minimal in those mixtures with acceptable deicer salt scaling resistance
without fly ash, however.
This study found that the current finishing techniques used in slipform operations for
bridge decks and highway pavements in North Carolina may be continue to be used with
mixtures containing manufactured sand. These findings also indicate that grinding the surface
should restore serviceability of pavements and bridge decks showing signs of scaling.
This study also examined several ancillary, but important issues. A new method for
measuring the angularity of fine aggregate was developed using sophisticated, computer-based
image analysis techniques (see Ch. 3). A new method for assessing the scaling resistance of
xvii
concrete appears promising in that it was easier and simpler to conduct, and results were
generally comparable to C 672 evaluations, but is not sufficiently well developed at this time to
be used in NCDOT labs without additional study (see Ch. 7).
Another important part of the study examined the effects of proposed total aggregate
gradation requirements, often called the "8 to 18" proportioning criteria, which is claimed to
reduce water demand and improve durability. This study also examined the differences in deicer
salt scaling and other properties between a well graded and a uniformly graded manufactured
sand; these effects were compounded experimentally with fines. The findings of this part of the
study are reviewed in detail in Ch. 8; critical findings are given below.
Water demand and deicer salt scaling resistance were compromised for mixtures
proportioned in general accordance with the “8-to-18” guideline compared to the performance of
the conventionally proportioned concrete mixture. It is strongly recommended that tests be
conducted to confirm the performance of concrete produced with the specific aggregates and
grading to be used when a history of satisfactory service is not available with a proposed
combination of materials and non-standard gradings.
No meaningful difference in water demand or deicer salt scaling resistance was observed
between otherwise similar concretes produced with well graded or uniformly graded
manufactured sands. The effects of void and fines content were consistent with the findings
discussed in Ch. 7 with both types of fine aggregate grading.
The results of this study are limited to the materials examined. Additional testing with
additional mixtures including a wider variation in material properties such as fines contents,
gradations and void contents may be beneficial.
xviii
CHAPTER 1INTRODUCTION
Diminishing natural sand resources have created a need for alternate sources of fine
aggregate for use in Portland cement concrete. Manufactured sands are created by crushing
stone to appropriate sizes and sorting the crushed material to provide a suitable aggregate
meeting published specifications. Manufactured sands are generally more angular and contain a
higher percentage of fines than natural sands, which can affect workability and water demand,
and therefore the properties of concrete. The North Carolina Department of Transportation was
one of the first government agencies to include manufactured sand in their Standard
Specifications for Roads and Structures [1995]. While manufactured sands have been used in a
number of locations in North Carolina’s interstate highways, only a few aggregate sources have a
long service record, particularly under freezing conditions [Saunders 1995].
Much of the research on manufactured sand has been conducted by the aggregate
industry with conclusions based on compressive strength. Research has also been conducted on
angularity of aggregate and on incorporating stone dust, a waste product of crushed stone
production, into concrete. There is little information, however, on frost durability and
permeability of concrete produced with manufactured sands, or the related effects on
performance in service due to the higher water demand often found with manufactured sands.
Research is needed to determine the effects of manufactured sands on the fresh and
hardened properties, including scaling resistance, of concrete. This study describes the results of
an investigation of effects of various manufactured sands on the durability of concrete, including
the effects of w/c ratio and mineral admixtures, and on the effects of particle characteristics on
1 - 1

water demand and durability. A limited scope investigation was also conducted on the effects of
combined aggregate gradation in order to help assess the possibility of improving overall
performance by modifying current gradation requirements for concrete.
1 - 2
CHAPTER 2LITERATURE REVIEW AND PROBLEM STATEMENT
The literature related to manufactured sand use in concrete can be grouped into three
categories:
1. the effects of stone dust or fines in portland cement concrete,
2. the determination of the angularity and particle shape of sands, and
3. the effects of angular sands in portland cement concrete and mortar.
It is important to note that the literature is almost exclusively related to the effects of the
manufactured sands on water demand and compressive strength or related mechanical properties.
Virtually no modern data exists which examines the effects of manufactured sand characteristics
on concrete durability.
2.1 STONE DUST IN CONCRETE
Clay and silt in natural sands in sufficient quantities are deleterious. Even small
quantities of clay or silt, which are not uncommon in natural, alluvial sand deposits, can cause a
dramatic increase in water demand and a reduction in durability [Forster 1994]. The fine
material in manufactured sands is typically relatively free from clay and silt. Fines in
manufactured sands can generally be permitted to be higher without deleterious effects
[McKeagney 1995].
2 - 1
2.1.1 Specifications
The material passing the 150 µm (#100) and 75 µm (#200) sieves typically contains the
bulk of these materials and the maximum fines content is restricted by specifications. For
example AASHTO M6 limits the material passing the 150 µm (#100) sieve to a maximum of
10%. A minimum quantity of fines is typically also recommended for lean concretes or non-air
entrained concretes to provide sufficient fines for finishing or closing the surface.
The quantity of fines smaller than 75 µm (#200) are typically determined by washing
since fines this small frequently adhere to larger particles. The material passing the 75 µm sieve
is limited to 2% in AASHTO M6 for Class A concrete subjected to abrasion. Manufactured
sands required to conform to natural sand standards typically require significant washing to
remove the fine material. Based on research funded by the aggregate industry, higher quantities
of rock dust in portland cement concrete are generally permitted. Research has indicated
acceptable concrete can be produced with higher fines as long as the fines are “fractured
material” or “stone dust” rather than active materials such as clay or silt. Acceptability has
normally been determined based on strength alone, however. The maximum quantity of
manufactured sand passing the 75 µm sieve is increased to 7% and 5% for abrasion since the
fines are primarily stone dust rather than clay [ASTM C33 1999]. North Carolina Department of
Transportation Standard Specifications for Roads and Structures 2MS specification permits a
maximum of 8% for material passing the 75 µm sieve for manufactured sands.
2 - 2
2.1.2 Effects of Stone Dust on Water Demand, Bleeding and Strength
Hudson [1997] reported that the dust in manufactured sand is not typically detrimental to
concrete behavior but is, in fact, beneficial. He claimed that a well-graded sand with a high
percentage of fines provides a denser and less permeable concrete. Fines in manufactured sand
are claimed to act as lubricants and to also help finishing, particularly if rounded [Hudson 1994].
Malhotra and Carette [1985] investigated the effects of different percentages of limestone dust in
conventional concrete made with natural sands. No problems were found with fresh or hardened
concrete with up to 10% fines passing the #200 sieve at a 0.70 water cement ratio and with up to
5% at 0.53 water cement ratio. Concrete made with limestone dust had comparable strength and
freeze thaw durability but an increase in shrinkage of up to 20 per cent was observed. Air
entraining agent and superplasticizer dosage demand was increased and the cohesiveness of the
mixture increased with increasing fines.
Ahmed and El Kourd [1989] examined the difference between incorporating crushed
stone fines and natural sand fines passing 75 µm sieve, in concrete. Water demand was found to
increase rapidly after 5% natural fines and after 15% crushed stone fines. For a constant water
content, an increase in fines reduced the slump. For constant slump and constant cement content,
the fines increased water demand and naturally reduced the strength. Increasing fines were
reported to reduce bleeding and increase shrinkage. Ahmed and El Kourd claimed that concrete
containing natural sand fines exhibited more problems in maintaining air or slump.
Nagaraj and Banu [1996] reported that stone dust requires more cement to maintain
satisfactory workability due to the high surface area in comparison with sand but the strengths
were comparable. Celik and Marar [1996] reported slump and air loss with an increase in stone
2 - 3
dust. Quantities of stone dust up to 10% were not detrimental to strength. Impact resistance
was acceptable for fines contents up to 5%. Water permeability was reported to improve with the
addition of fines. Celik and Marar concluded that stone dust acts as a filler up to 15% fines
content, reducing water absorption in hardened concrete. These data were not based on the lower
w/c ratio typical of DOT Class A and AA mixtures. Kronlof [1994] reported fines to be
beneficial in superplasticized concrete. Ghosh and Sethi [1970] indicated that manufactured
sands with FM’s ranging from 1.8 to 2.5 were suitable for use in portland cement concrete.
2.1.3 North Carolina Experience with Manufactured Sand
The North Carolina Department of Transportation was one of the first government
agencies to permit higher fines in manufactured sands [McKeagney 1985; Saunders 1995;
Nichols 1983]. A Vulcan Materials report [Saunders 1995] on manufactured sand use in North
Carolina states that the first experiences in highway construction in North Carolina had poor
results due to edge slumping, difficulty in finishing and excessive bleeding. The workability was
reported to be improved and bleeding was reduced with an increase in fines. It was claimed that
fines fill voids that would otherwise be filled with water and cement.
Manufactured sand was used in a demonstration project in I 40 westbound lanes, west of
Benson, North Carolina. In 1999, these lanes were in excellent condition. Discussions with the
project engineer, superintendents and inspectors indicated satisfactory workability and
construction progress. The sand used in this project was produced at the Pomona quarry by
Martin Marietta aggregates.
2 - 4

2.2 ANGULARITY AND PARTICLE SHAPE MEASURES
Angularity and particle shape are clearly related concepts but particle shape is normally
determined on individual particles while angularity is often considered a bulk characteristic.
Several techniques have been developed for quantifying particle shape and angularity.
2.2.1 Angularity Measures
Rex and Peck [1956] developed a simple test based on flow through an orifice, which is
also known as the Bureau of Public Roads method. A jar fitted with a tapered cone containing an
orifice of standard dimension is filled with a dry sample of sand. The time required for a known
volume of sand to flow through the orifice is measured. This rate of flow is divided by the rate
of flow for standard Ottawa sand and the ratio is termed the “Time Index.” Angular sands or
sands with a rough particle surface will have higher interparticle friction which impedes flow
through the orifice producing a higher time index.
Another method was proposed by Huang [1962] and later standardized by ASTM as D
3398 [ASTM 1997]. This method characterizes particle angularity with a parameter called the
“Particle Index.” The Particle Index is read from a chart using two different void contents
determined using two different compaction efforts. This test is laborious and rarely used [Meier
and Elnicky 1989]
The method proposed by the National Aggregates Association (formerly the National
Crushed Stone Association) has received wide acceptance [Cross, Smith and Clowers 1994].
The test apparatus resembles the apparatus for the time index test by Rex and Peck. A sample of
known mass flows through the orifice into a container with a volume less than the volume of the
2 - 5
sample. The excess sand is struck off and the mass of the retained sample is determined. The
volume of loose voids is calculated using the bulk dry specific gravity of the sand. This method,
which determines the “void content”, has been standardized as ASTM C 1252 and provisionally
as AASHTO TP33.
British Standards describe a method to characterize particle angularity using the
“angularity number” which is calculated as 67- solid volume of aggregates expressed in percent.
A higher angularity number is obtained with angular sands due to a high void content. A New
Zealand method is a modification of Rex and Peck's method, measuring both the time of flow
and the void content of material passing a 3/16" sieve.
2.2.2 Particle Shape Measures
ASTM Special Technical Publications STP 169 A and B include work by Ozol [1978] and
Mather [1955] which discuss particle characteristics such as sphericity, roundness and surface
texture. Particle characteristics are compared to ideal shapes such as a cube or a sphere. A cube
is fully equidimensional; a sphere has the lowest surface area per unit volume; surface texture, or
rugosity, is the micro-texture of the particle.
According to Hudson [1995] the volume of voids in the aggregate changes according to
the axial ratios of the individual particles. The void content in a mass of aggregate therefore
depends on particle equidimensionality and surface texture as well as the gradation [Hudson
1995; Ozol 1978]. Hudson also reports that flat particles up to 20% of total particles do not have
a significant effect on void content, however surface texture always affects void content [1995].
2 - 6
Equidimensional particles and low unit surface areas are frequently assumed to be desirable
characteristics due to an expectation of a low water demand.
Direct measurements of axial ratios are made with calipers on coarse aggregates as part
of ASTM D 4791 standard method [ASTM 1999]. The higher the axial ratio, the greater the
departure from equidimensionality and the higher the surface area per unit volume and the void
content [Hudson 1995; Ozol 1978]. Hand measurements with calipers are clearly impractical
with sands, however.
Several methods have been proposed using analysis of the particle surface to quantify
surface angularity of individual grains. These methods include techniques based on fractal
analysis or Fourier transform of images of grains. Fractal analysis parameters describe
deviations of a line surface or volume from a topological ideal such as a reference line along the
perimeter. A Fourier series expansion of the radius about the center of mass using coordinates of
points on the perimeter of the particle would describe the frequency and the amplitude of the
undulations on the surface [Ozol 1978; Carr, Norris and Newcomb 1990], although these
methods may not be practical for individual sand grain surfaces. Mitchell and Leming [1998]
demonstrated that computerized image analysis techniques could be used to determine the area
of alkali-silica gel deposits in concrete cores. These techniques appear promising for
applications to sand angularity.
2 - 7
2.3 EFFECTS OF ANGULAR SANDS IN CONCRETE AND MORTAR
2.3.1 Effects of Sand Angularity on Water Demand Bleeding And Strength
Hudson [1995] reported that particle shape and surface texture will affect void content
and frictional properties of sands and thus the concrete made using those sands. Hudson
suggested that use of cubical particles may lower the water demand and increase workability
without affecting quality. At lower void contents, less paste is reported to be required to fill the
voids. An additional 3 to 10 % paste is required for workability and mobility. The range of paste
volume required for mobility is a function of particle roughness and frictional properties.
Johansen, Laanke and Smeplass [1991] investigated blending manufactured sands and
natural sands to optimize performance by minimizing bleeding while maximizing workability
and balancing water demand in concrete. They used a particle matrix model, which defines the
matrix as cement, water and fines smaller than 0.125 mm (0.005 in). The remaining aggregates
are then assumed to act as filler. This distinction is similar to the one used by Hudson. One of
the tests used by Johansen, et al, is a modified Marsh cone test that measures the viscosity of the
mortar by timing the flow through a cone.
Johansen, et al [1991], reported that manufactured sands with a gradation close to the
Fuller curve may be blended with natural sands to improve packing and reduce voids. The
blends had a lower water demand at low percentages of manufactured sand in the blend but water
demand increased at higher percentages of manufactured sand. An optimum was found for the
particular sands used. However, this type of replacement approach may not work for all blends
because the manufactured sand used in the blend may or may not have a low voids ratio and the
results are specific for the particular angularities and gradations of the sands that are blended.
2 - 8
Johansen, et al [1991] concluded that the presence of crushed particles decreased bleeding and
increased shearing resistance. They recommended using sands with good particle cubicity, grain
size less than 4 mm, a high percentage of fines and a dense gradation such as obtained with a
Fuller curve. No results were reported on freezing and thawing durability of concrete containing
this type of fine aggregate.
McKeagney [1985] states that when dealing with angular particles with a high void
content it is desirable to include fines to fill voids and impede bleeding. McKeagney also
reported that some manufactured sands could result in excessive bleeding, harsh and unworkable
surfaces, and lower strengths.
Bloem and Gaynor [1963] used a modified AASHTO T106 (ASTM C 109) flow table
test to compare water demands for sands. They found a good correlation between mortar flow
values, the time index and the void content. The time index, void content and the mortar flow
were all found to be good predictors of water demand in concrete. They also found that fine
aggregate angularity was more important for water demand of concrete than coarse aggregate
angularity. Bloem and Gaynor also found that neither fineness modulus nor quantity of fines was
correlated with water demand.
Malhotra [1964] tested angular manufactured sands as well as rounded fine aggregates
and found that manufactured sands have a higher time index. The time index was found to be a
good predictor of mortar flow as well as concrete water demand. Lorenzen [1958] found that
rounded sands had a higher flow value and less water demand. Compressive strengths of
concrete containing angular sands were somewhat improved especially in flexure, however.
2 - 9

Wills [1967] reported that void content was the most satisfactory predictor of water demand of
concrete. He found that time index and mortar flow were also good predictors. He also reported
that void content of fine aggregates is proportional to void content of coarse aggregates of the
same source and therefore angularity appears to be related to the geological properties of the
parent rock.
Gaynor and Meininger [1983] found a high correlation between the void content and the
time index tests. They report that manufactured sands are mostly angular and exhibit a higher
void content and time index as well as a higher water demand than rounded sands. They also
noted that natural sands do not automatically qualify as rounded material, depending on the
geology and exposure conditions of the sand.
Nichols [1982] worked with one natural and five manufactured sands, which had void
contents ranging from 47% to 55% and also had higher fines contents. He reported that
satisfactory concrete can be produced with fine aggregate containing higher fines. Water demand
was found to be related to particle shape. Changes in gradation of a given stone were reported to
have little effect on water requirement, however these changes did affect strength. Cement rich
mixes with high fines had slightly reduced strengths.
Nichols also found that concrete produced with angular sands did not bleed more than
rounded sands when comparably graded. Bleed water was, as expected, found to decrease with
increasing cement content. Manufactured sands with higher fines exhibited less bleeding than
comparable sands with low fines. No significant increase was observed in water demand with an
increase in fines content.
2 - 10
2.3.2 Effects of Sand Angularity on Frost Durability
2.3.2.1 Measurement and Mechanisms of Frost Durability - Frost durability of concrete
is currently measured using two standard methods, which assess durability for to rapid freezing
and thawing resistance or resistance to deicer salt scaling. AASHTO T161-86 (ASTM C666)
involves very rapid freezing and thawing cycles, typically while the specimen is immersed in
water. The rate of temperature change is much greater than that found in service. Durability
against this type of exposure is primarily dependent on a well-established air void system. Frost
durability based on rapid freezing and thawing therefore measures only the effectiveness of the
air void system for concrete with frost durable aggregate.
Concrete resistance to deicer salt scaling testing (ASTM C672), also requires an
acceptable air void system, however, finishing effects and surface condition, among other
factors, also have important effects. This test involves slower, more realistic freezing cycles in
the presence of a deicing salt solution and attempts to more realistically simulate frost conditions
in a pavement or a bridge deck. One difficulty with this test is that deterioration is determined
visually and this qualitative evaluation is subjective [Pigeon and Pleau 1995].
The Swedish Frost Resistance test, SS 13 72 44 [Swedish Standards Institute 1988] is
similar to ASTM C672, however, the test is conducted on a sawn surface of concrete rather than
a finished surface and the sample preparation is more detailed, involving thermal isolation to
promote heat transfer through the top surface only.
Rapid freeze thaw cycles induce a thermal shock to the concrete and a high degree of
internal damage, primarily due to expansion of water upon freezing. Slow cycles on the other
hand, are not associated with a high degree of internal damage. Scaling can occur in concrete
2 - 11
with an excellent entrained air system and without any internal damage. Bilodeau and Carette
[1989] also state that air entrainment does not guarantee scaling durability, however non-air
entrained mixtures scale extensively [Jacobsen and Sellevold 1997].
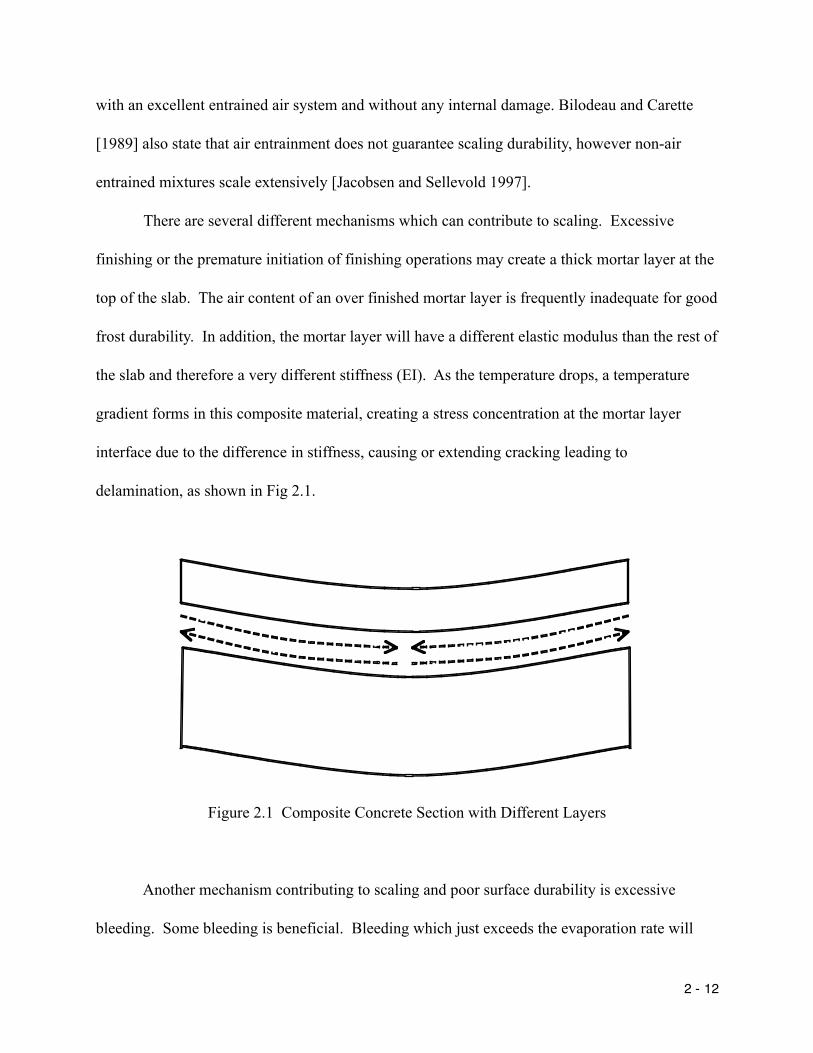
There are several different mechanisms which can contribute to scaling. Excessive
finishing or the premature initiation of finishing operations may create a thick mortar layer at the
top of the slab. The air content of an over finished mortar layer is frequently inadequate for good
frost durability. In addition, the mortar layer will have a different elastic modulus than the rest of
the slab and therefore a very different stiffness (EI). As the temperature drops, a temperature
gradient forms in this composite material, creating a stress concentration at the mortar layer
interface due to the difference in stiffness, causing or extending cracking leading to
delamination, as shown in Fig 2.1.
Figure 2.1 Composite Concrete Section with Different Layers
Another mechanism contributing to scaling and poor surface durability is excessive
bleeding. Some bleeding is beneficial. Bleeding which just exceeds the evaporation rate will
2 - 12
mitigate or prevent drying shrinkage cracks. However, bleeding can cause problems if, in
conjunction with premature finishing, the bleed water is worked into the surface resulting in a
higher water content at the surface and, as a consequence, lower strength and less abrasion
resistance.
Scaling and delamination associated with bleeding are typically the result of different
mechanisms, however in concretes with a potential for excessive or prolonged bleeding or in
concretes which have been prematurely finished, the bleed-water can be trapped under the
surface after the concrete is finished. An accumulation of bleed-water at the boundary will cause
a weak zone just under the surface layer. In addition, the pockets of bleed-water which form
prior to setting will eventually dry, leaving air pockets which can collapse under load or can refill
with water and freeze resulting in scaling and delamination.
Chloride gradients through the depth of a concrete slab can also contribute to surface
delamination. A high salt content at the surface will force the freezing zone below the surface of
the slab. Difference in mechanical properties between frozen and unfrozen concrete create stress
concentrations at the interface, similar to that shown in Fig 2.1. This interface is typically
located at approximately the same depth as the interface between the mortar layer and the rest of
the slab and the location of any bleed pockets, thus exacerbating the problems discussed above.
Chloride contamination, and especially chloride gradients, also affect capillary and
osmotic effects which dominate frost damage in air entrained concretes undergoing slow freeze
thaw cycles. Capillary and osmotic effects cause migration of water towards the freezing zone in
concrete. The movement of water creates hydraulic pressures, which can cause damage, and ice
accretion at the freezing point will create expansive forces causing disruption of the concrete.
2 - 13
Water-cement ratio, permeability of the concrete, especially the top layer, and mineral admixture
contents all play a role in the frost durability of concrete.
Cordon [1966] examined the effect of bleeding on scaling potential in a case study of
decks built on impermeable bases, promoting most of the bleed-water to rise to the top. The
presence of an impermeable base can delay the completion of bleeding, frequently until after a
finished, compacted layer is formed on the surface. A weak interface is formed under the layer
with continued bleeding which promotes scaling. Cordon also indicated that an increase in fines
tends to reduce the size of surface capillaries which increases the capillary forces upon drying.
Capillary forces due to premature drying and surface finishing increase the compaction of the top
layer which also contributes to scaling.
Saeki, Fujita and Takada [1986] worked on the influence of surface layer strength as an
indicator of scaling durability and found that pull out tests conducted on the surface of concrete
corresponded well with surface layer strength and scaling durability. Langlois et al [1989]
indicated scaling is a surface phenomenon with no evidence of internal damage. Scaling was
reported to be related to excessive bleeding, poor finishing, shrinkage cracks, carbonation, lack
of curing, early exposure to high temperature and freezable water content [Pigeon and Pleau
1995; Aitcin 1998]. Marchand, et al [1992] conducted scaling tests on sawn surfaces and
reported less scaling compared to a finished mortar surface by eliminating variability due to
finishing. Bilodeau and Carette [1989] report improved scaling results with broomed surfaces.
Problems with fly ash in deicer scaling are well established. Although fly ash improves
permeability and pore refinement [Bilodeau and Malhotra 1992], fly ash does not improve
scaling durability [Marchand et al. 1997]. Problems with air entrainment and the high air
2 - 14

entraining dosage associated with fly ash can also contribute to frost durability [Gebler and
Klieger 1986] . In ACI 318 [ACI 2002], the fly ash content is limited to a maximum of 25% for
concretes exposed to deicer salts and frost.
Paillere, Raverdi and Grimaldi [1986] reported an increase in depth of carbonation in
concrete mixtures with mineral admixtures after scaling. Stark [1997] also indicated that percent
of hydration and depth of carbonation are likely to contribute to scaling. Stark and Ludwig
[1997] reported heavy scaling occurs in carbonated areas.
ASTM C 672 requires air drying of specimens after 14 days. This will minimize the
pozzolanic contributions of fly ash, and reduce the percent hydration at the time the scaling test
begins, due to the longer time required for fly ash concretes to hydrate. Fly ash can also increase
the extent of carbonation, particularly in poorly cured mixtures, and increase the volume of paste
which may affect surface layer characteristics. Silica fume is reported to perform better than fly
ash mixtures in scaling but is still not as durable as comparable cement only mixtures [Bilodeau
and Carette 1989].
2.3.2.2 Results of Frost Durability Testing of Manufactured Sand Concrete - In 1936
Goldbeck [1938] examined frost durability of concrete using manufactured sands with very high
water cement ratios using a non-standard freezing and thawing test in the presence of water. This
work did not include measurement of sand characteristics such as void content. A review of the
gradation of manufactured sand used reveals that only 5% was allowed to pass #100 sieve which
indicates that less fines were present compared to current manufactured sand specifications. The
study found that freezing and thawing durability decreases as fineness modulus (FM) and w/c
ratio increase. A higher FM typically results in lower sand contents.
2 - 15

Nichols [1982] ran ASTM C666, rapid freezing and thawing in water, on mixtures with
different water cement ratios and found that lean mixtures and mixtures with angular sands at
high water cement ratios performed poorly. Freezing and thawing resistance was relatively
unaffected by changes in gradation. These findings are expected, since C 666 primarily tests the
effectiveness of the air void system but the results are sensitive to tensile strength.
2.4 PROBLEM STATEMENTS
(1) Most of the specifications, recommended practices and guidance on limits or
requirements for aggregate characteristics have been established for portland cement concretes
produced using natural sands. Manufactured sands typically have higher fines content and
higher angularity than natural sands. The implications of the differences in properties on water
demand and compressive strength are reasonably well known. The influence of the differences
on the frost scaling resistance of pavements in North Carolina have not yet been fully
established. In addition, the effects of or interactions with fly ash and manufactured sand, and
the relative sensitivity of w/c ratio on scaling resistance have not yet been established. Further,
preliminary assessment of gradation effects is also needed.
(2) The characteristics of the manufactured sand must be established so that the
relationships between the characteristics and performance of concrete can be determined and
appropriate specifications developed for the widespread, informed use of manufactured sands in
portland cement concrete.
2 - 16

2.5 OVERVIEW OF RESEARCH
The bulk of this study was conducted in three sequential phases. The first phase was to
determine the properties and characteristics of a wide variety of manufactured sands in
comparison with a local, natural sand with a long service record of successful performance.
Details of this phase are presented in Chapter 3, Characteristics of Sands. In the second phase, a
limited study of the effect of sands on water demand of mortars was conducted. Details of the
second phase are presented in Chapter 4, Mortar Characteristics. Based on the results of both of
these phases, a number of sands, encompassing a variety of properties, were selected for in-depth
examination.
The bulk of the remaining research concentrated on determining the effects of the sands
on the water demand, bleeding and segregation, permeability and, most importantly, the deicer
salt scaling resistance of concretes produced using the sands. As with the first two phases, the
basis of comparison was a concrete produced with a durable, natural sand. The detailed research
plan is presented in Chapter 5, Methodology.
This study also examined several ancillary, but important issues. Several new test
methods were used to assess sand properties or concrete behavior. The development of these test
methods required separate but clearly inter-related studies. A new method for measuring the
angularity of fine aggregate was developed using easy-to-implement image analysis techniques.
The description of this procedure and the results of the testing are included in Chapter 3,
Characteristics of Sands.
A new method for assessing the scaling resistance of concrete was evaluated. The
proposed method was intended to be easier to conduct than existing methods and provide results
2 - 17

in about two weeks, but results were mixed. The findings of this portion of the study are
included in Chapter 7, Deicer Salt Scaling and Permeability.
Another important part of the study examined the effects of proposed total aggregate
gradation requirements, often called the "8 to 18" proportioning criteria. The proponents of this
criteria, which requires that between 8% and 18% be retained on each sieve except the top and
bottom sieves, claim that it reduces water demand and improves durability. The findings of this
part of the study are presented Chapter 8, Modified Gradation Effects.
2 - 18

CHAPTER 3CHARACTERISTICS OF SANDS IN THE STUDY
3.1 SELECTION OF SANDS FOR INITIAL TESTING
Fourteen manufactured sands from three different aggregate producing companies
serving the North Carolina market were selected for testing in the first two phases of this study.
These sands were selected in conjunction with the Materials and Test Unit of the North Carolina
Department of Transportation, based on geographical and geological variety, and to ensure a
wide range of characteristics.
Sands used were from the Clarks, Rocky Point, Belgrade, Salem Stone, Jamestown, New
Bern, Pomona, Woodleaf, and Castle Hayne quarries operated by Martin Marietta, the Smith
Grove, South Boston, and Hendersonville quarries operated by Vulcan Materials, and the Butner
quarry operated by Carolina Sunrock. Natural sand from the Lillington quarry was chosen to be
the control. This sand was selected because it has a long history of durable and successful use in
practice and its properties, including excellent frost durability, were well known from previous
investigations.
A number of the sands had very similar properties and a slightly smaller subset of sands
was selected for much of the in-depth analysis subsequently conducted in this study. Two
subsets were selected for the remaining phases. Both the larger subset [Belgrade, Castle Hayne,
Clark, Jamestown, New Bern, Pomona, Rocky Point, Salem Stone, Smith Grove and Woodleaf]
and the smaller subset [Pomona, Salem Stone, Smith Grove, and Lillington] maintained adequate
geographic, manufacturer, and material characteristic diversity, while permitting the more
detailed testing required in later stages.
3 - 1
Image analysis based determination of particle angularity was primarily conducted with
the larger subset with some in-depth analysis conducted with the smaller subset. The majority of
the remaining research conducted utilized the sands in the smaller subset with at least one
mixture produced with all sands in the larger subset.
3.2 DETERMINATION OF SAND CHARACTERISTICS - TEST METHODS
3.2.1 Standard Test Methods
Various routine tests of sand properties and characteristics were conducted including
specific gravity, absorption, gradation, fines content and several voids content measures. A
number of other standard, but less frequently used tests were also conducted.
The gradation, bulk specific gravity and absorption for each sand was determined in
accordance with AASHTO T 84 (ASTM C 136 and C 128). The quantity of material passing the
75 µm (#200) sieve was determined in accordance with AASHTO T 11 (ASTM C 117), by
washing. The sand equivalence of selected sands was determined in accordance with AASHTO
T 176. This test estimates the quantity and relative activity of clay fines in the sand.
ASTM C 1252 was used to determine the void contents of the sands. This test can be
conducted in three different ways. Method A uses a sample blended to a specified gradation that
includes 1.18 mm, 600 µm, 300 µm, 150 µm (#16, #30, #50 and #100) size particles but no fines.
Method B calculates the void content as an average of void contents of three individual sieve
sizes (1.18 mm, 600 µm, 300 µm; #16, #30 and #50). Method C determines the void content of
the sand “as received.” All three methods were used in this study. The calculation of voids using
individual sieves permitted comparison of the changes in void content by sieve size.
3 - 2

The Time Index [Rex and Peck 1956] for each sample was also determined. The Time
Index is based on the time required to pass a given volume of a sand sample through a standard
orifice under gravitational acceleration. The time of flow for the sand divided by the time for
standard Ottawa Sand is the Time Index for that particular sand. The Time Index increases with
the angularity of the sample. The time of flow was measured using the ASTM C 1252 void
content test apparatus. Measurements were taken using 500 gram sample as specified by Rex
and Peck as well as 190 gram samples used in the ASTM C1252 void content test.
3.2.2 Image Analysis of Geometric Properties - Test Methods
The void content and the time of flow tests described in the previous section are bulk
measures or indicators of fine aggregate angularity; they do not measure angularity directly.
Image analysis techniques were developed in this study to measure the angularity of fine
aggregate. Image analysis techniques have the advantage of providing a direct, rational
measurement of the angularity. The measures are particle specific and average values are based
only on a relatively small number of particles compared to bulk measures, however. Image
analysis was conducted on particles retained on different specific sieves. This reduced potential
bias caused by differences in resolution of different sized particles and permitted comparison of
differences in angularity with size.
3.2.2.1 Image Analysis Apparatus - The system described by Mitchell and Leming
[1998] was used to capture and analyze images. A SonyTM DXC-151 A, RGB Color Video
Camera using a charge-coupled display (CCD) imager was fitted with a MinoltaTM 35 mm lens
and a variety of close-up lens attachments that provide the ability for lens aperture adjustment
3 - 3
and for focusing the camera for optimum clarity. Images were captured using a digitizer card
and a video card internally mounted in a computer. Image-Pro Plus software by Media
Cybernetics provided image acquisition, image processing and filtering, and arithmetic and
geometric operations on the images. Contrast, brightness and color were adjusted to produce the
sharpest possible image.
3.2.2.2 Procedure for Image Preparation and Acquisition - Since it was possible to
photograph only a relatively small quantity of material, a sample of sand retained on a given
sieve during gradation analysis was taken and split to provide a random sample of approximately
100 particles. Individual particles were spread on a clean glass plate so that particle to particle
contact was eliminated. Separation of particles was verified visually through the camera.
Particles retained on sieves larger than 1.18 mm (#16) were photographed using the camera
directly while particles retained on the 300 µm and 150 µm (#50 and #100) sieves were
photographed through a microscope attached to the camera. Particles retained on the 600 µm
(#30) sieve were not used in general because the particles were too small for the camera to
provide satisfactory resolution yet too big for satisfactory results with the microscope.
A bright red background was placed beneath the glass plate, which was then elevated such that
the background was out of focus. Bright red is very atypical of natural sand colors and is easy to
select out electronically. A backlit view was obtained by indirectly illuminating the red
background and viewing the particles in the reflected light. Using this approach, the sand
particles show up as solid, dark objects in focus, in front of a red field. This simplifies image
analysis and allows semi-transparent particles, such as quartz or quartzite, to be easily identified
3 - 4
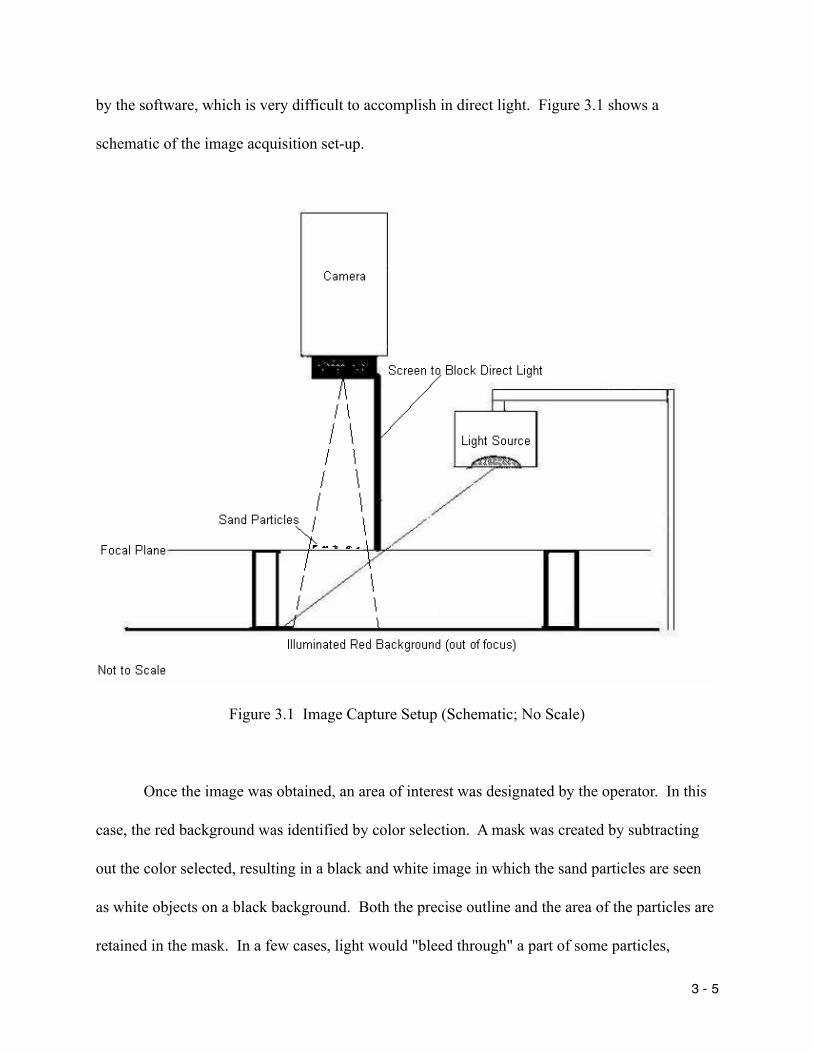
by the software, which is very difficult to accomplish in direct light. Figure 3.1 shows a
schematic of the image acquisition set-up.
Figure 3.1 Image Capture Setup (Schematic; No Scale)
Once the image was obtained, an area of interest was designated by the operator. In this
case, the red background was identified by color selection. A mask was created by subtracting
out the color selected, resulting in a black and white image in which the sand particles are seen
as white objects on a black background. Both the precise outline and the area of the particles are
retained in the mask. In a few cases, light would "bleed through" a part of some particles,
3 - 5
creating an indistinct particle edge in the mask. When this occurred, the particle was not
included in the analysis.
Each particle image was then individually selected electronically and various shape and
two-dimensional geometric characteristics were determined. This technique captured all of the
protruding edges of a particle, including protrusions from various planes within the particle,
which contribute to particle angularity and void content. At least 100 particles were
photographed for each source of sand. This typically required about 10 different images, each
taken of a separate sample. While the number of tests would appear to be adequate, 100 particles
is still a relatively small mass. One of the advantages of the bulk measures is that a larger mass
of sample is used and variability is lower.
3.2.2.3 Procedures for Image Analysis - Using the computer generated mask with the
particle outlines, geometric measurements including particle area, perimeter, roundness
coefficient, aspect ratio, dimensions of an encompassing rectangle, and maximum and minimum
radii from the centroid to the perimeter of the particle were determined. These measurements
were used to calculate a number of non-dimensional, derivative parameters which permitted
determination of two-dimensional, geometric characterizations of particle shape. Reference to
either an internal or external calibration procedure to account for size is not needed, although
dimensional calibration is easily established by including an object of known size in the image.
More importantly, it was believed that the use of non-dimensional parameters would permit
easier and more meaningful comparison between particles of various sizes.
3 - 6
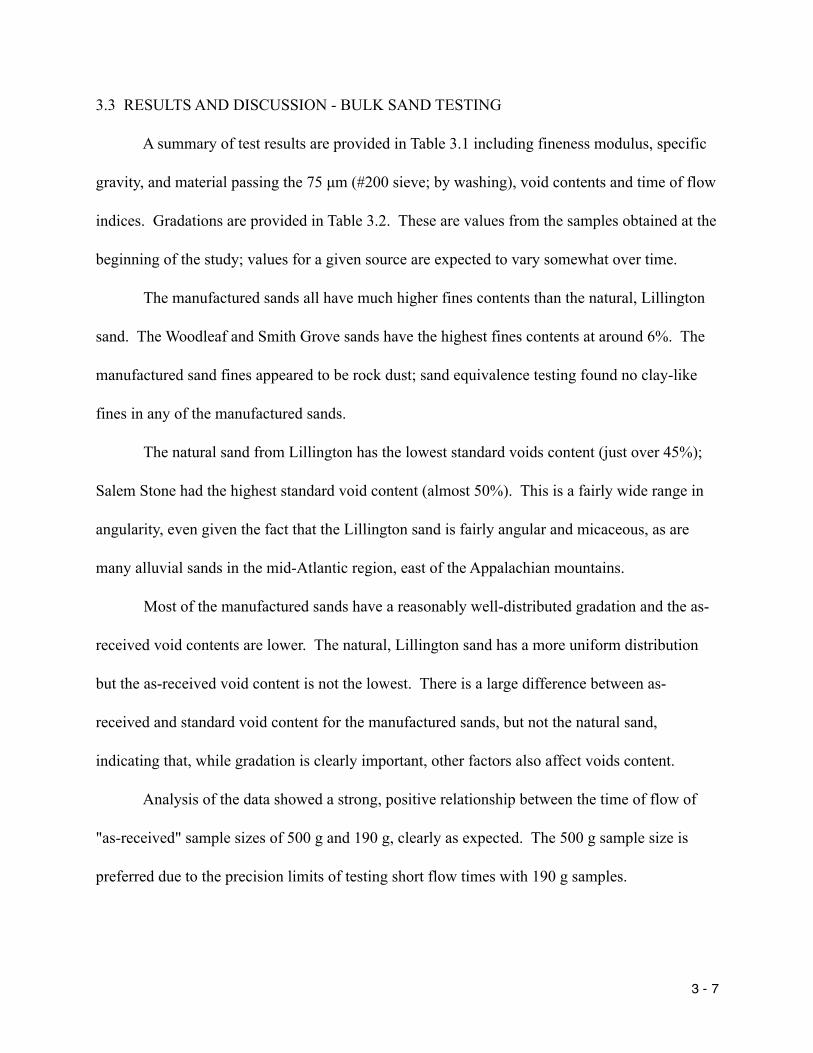
3.3 RESULTS AND DISCUSSION - BULK SAND TESTING
A summary of test results are provided in Table 3.1 including fineness modulus, specific
gravity, and material passing the 75 µm (#200 sieve; by washing), void contents and time of flow
indices. Gradations are provided in Table 3.2. These are values from the samples obtained at the
beginning of the study; values for a given source are expected to vary somewhat over time.
The manufactured sands all have much higher fines contents than the natural, Lillington
sand. The Woodleaf and Smith Grove sands have the highest fines contents at around 6%. The
manufactured sand fines appeared to be rock dust; sand equivalence testing found no clay-like
fines in any of the manufactured sands.
The natural sand from Lillington has the lowest standard voids content (just over 45%);
Salem Stone had the highest standard void content (almost 50%). This is a fairly wide range in
angularity, even given the fact that the Lillington sand is fairly angular and micaceous, as are
many alluvial sands in the mid-Atlantic region, east of the Appalachian mountains.
Most of the manufactured sands have a reasonably well-distributed gradation and the as-
received void contents are lower. The natural, Lillington sand has a more uniform distribution
but the as-received void content is not the lowest. There is a large difference between as-
received and standard void content for the manufactured sands, but not the natural sand,
indicating that, while gradation is clearly important, other factors also affect voids content.
Analysis of the data showed a strong, positive relationship between the time of flow of
"as-received" sample sizes of 500 g and 190 g, clearly as expected. The 500 g sample size is
preferred due to the precision limits of testing short flow times with 190 g samples.
3 - 7
Table 3.1 - Sand Characteristics
Voids (%) Time of Flow (sec)FM SpG -75 µm As Rcd Std 190g 500g Std
N: Lillington 3.04 2.61 0.7 44.5 45.1 5.3 13.8 5.1MM: Clark 2.66 2.65 3.2 45.8 46.6 6.8 16.6 5.8 Rocky Point 2.71 2.63 3.4 46.6 47.1 6.5 15.3 --- Belgrade 3.04 2.59 3.1 42.4 46.0 6.6 15.4 --- Salem Stone 2.56 2.71 3.1 46.2 49.8 5.5 14.2 5.7 Jamestown 2.75 2.68 2.9 43.1 49.1 5.7 15.0 --- New Bern 2.86 2.60 3.4 41.7 46.7 5.9 15.8 --- Pomona 3.09 2.76 3.9 40.7 46.3 5.6 13.9 5.2 Woodleaf 2.69 2.67 6.1 41.8 47.5 5.6 14.2 --- Castle Hayne 2.97 2.61 1.8 41.4 46.9 6.2 16.0 ---V: Smith Grove 2.67 2.93 5.5 40.8 45.8 4.5 --- 5.0 Hendersonville 3.09 2.65 --- 39.8 47.9 6.2 --- 5.8 South Boston 3.37 2.74 --- 41.7 47.6 6.5 --- 5.6S: Butner 2.75 2.97 --- 40.9 46.2 4.6 --- 5.2
Notes: "N" is natural sand, "MM" is Martin Marietta, "V" is Vulcan, "S" is Sunrock; "FM" is Fineness Modulus, "SpG" is Bulk Specific Gravity (dry), "As-Rcd" is As-Received Voids Content (%), "Std" is Standard (specified) Gradation Voids Content (%); "190g" and "500g" indicate the As-Received sample size used (g); "---" is not measured; Ottawa sand has a voids content (as received) of 40% and a 190 g flow time of 4.0 s.
3 - 8

Table 3.2 Gradations - Individual Percents Retained
Sieve Size 4.75 mm 2.36 mm 1.18 mm 600 µm 300 µm 150 µmSand #4 #8 #16 #30 #50 #100Nat: Lillington 0.0 2.5 22.3 56.4 15.3 2.7MM: Clark 0.4 6.2 17.2 56.6 9.5 7.9 Rocky Point 0.3 10.8 26.5 17.5 17.8 22.0 Belgrade 0.2 15.3 26.0 15.8 33.7 8.3 Salem Stone 0.6 5.7 23.5 19.6 26.0 18.7 Jamestown 0.1 11.6 27.0 18.4 19.6 14.7 New Bern 0.3 12.1 29.6 19.2 15.6 17.3 Pomona 0.1 12.8 37.0 20.0 14.0 8.4 Woodleaf 0.2 13.6 24.9 15.8 17.4 18.8 Castle Hayne 1.7 17.8 24.4 15.1 17.9 19.4V: Smith Grove 0.2 12.0 26.5 16.3 17.3 16.2 Hendersonville 4.0 23.6 21.4 13.5 14.3 12.7 South Boston 0.1 29.1 27.2 15.6 13.3 9.4S: Butner 0.1 15.5 22.8 16.5 20.2 16.2
There is only a very general relationship between the as-received voids content and the
void content obtained using a standard gradation. The Lillington natural sand may not follow the
trend of the manufactured sands, although there is significant scatter in the data.
There is a poor relationship at best between the voids content and the time of flow; the
Smith Grove and Butner sand may be outliers. Tests for these sands were repeated to confirm
findings. Using test values which include gradation effects in the voids content measure, no
relationship was found between the time of flow and voids content; again the Smith Grove and
Butner sands would appear to be outliers. This suggests that no simple relationship exists
between flow characteristics and bulk characteristics such as gradation and voids content. Due
to the lack of correlation between time of flow and voids content, the fact that other factors, not
3 - 9
yet fully identified or characterized, could affect the results, along with the continuing popularity
of the voids content tests, further analysis was conducted using the standard void content
(Method A) as the primary bulk angularity measure of fine aggregate, recognizing, however, that
additional factors, including gradation, and possibly particle texture, affect the inter-particle
behavior.
Numerous statistical models comparing the relationships between FM, voids content,
#200 fines content, and flow were examined. Model results were relatively poor, and, although
these models were expected to have little, if any, practical application, analysis did provide
useful insight. No correlation was found between FM and -75 µm (-#200) content, which was
expected based on the definition of the FM. More importantly, this also indicates that finer
manufactured sands do not necessarily have a higher fines content, at least at the 75 µm (#200)
size. This finding is important since no cross-correlation was found for any model containing
both the FM and the 75 µm (#200) fines.
Models incorporating 75 µm (#200) fines content invariably showed the natural
(Lillington) sand, with a very low 75 µm (#200) content, as an outlier; models had very low
correlation coefficients when the Lillington sand was included. Models including only the voids
content and FM had a correlation coefficient of 0.39 when the Lillington sand was included and
0.68 when excluded, indicating that one or more factors affected the particle to particle
interaction in the flow test, which was not identified in voids content, after adjusting for
gradation effects. Since the voids content is a measure of angularity, it was again speculated that
particle texture could be affecting behavior. The lack of correlation with voids content of the as-
3 - 10

received sands indicates that the 75 µm (#200) material appears to have an insignificant role in
filling voids in the sand, at least with the percentages found with these materials.
3.4 GEOMETRIC SHAPE CHARACTERISTICS
3.4.1 Definitions
The definitions of particle shape characteristics given below are not necessarily standard.
Figure 3.2 shows measurements on a hypothetical particle.
Rmin
Rmaxd
c
a
b
Figure 3.2 Basis of Angularity Measures
where a and b are the height and width, respectively, of an enclosing rectangle;
c and d are the height and width, respectively, of an enclosing ellipse;
and Rmin and Rmax are the minimum and maximum distances, respectively from the
centroid of the particle to the edges.
3 - 11

Roundness and Aspect Ratio are commonly accepted definitions and the ratio of particle area to
area of an enclosing rectangle is an obvious derivative. The Perimeter Ratio and Radius Ratio
measures were developed in this study. Other commonly used measures, such as Perimeter (P)
and Area (A) are conventionally defined. Derivative measures, explained below, may be defined
as:
Aspect Ratio Ra = d/c;
Radius Ratio Rr = Rmax / Rmin;
Perimeter Ratio Rp = P / [2 (a+b)];
Roundness = P2 / (4πA);
and Ratio Area of Enclosing Rectangle RAR = A/ (ab).
Aspect Ratio (Ra): the ratio of the major to minor axes of an ellipse that has the same
area moment as the particle outline. It is a measure of particle elongation represented by the
slenderness of the ellipse.
Radius Ratio (Rr): the ratio of the maximum to the minimum distance, or radius, from
the centroid of the particle to its perimeter. In this respect, Rr is another measure of elongation.
Since the radii are measured to the actual perimeter of the particle, however, Rr is strongly
influenced by deep indentations on the surface, which can be termed the "macro-texture". A
highly irregular surface with deep indentations is likely to have a very small minimum radius,
therefore Rr is a combined measure of elongation and deep indentations in a particle surface.
3 - 12
Ratio Area of Enclosing Rectangle (RAR): the ratio of the particle area to the area of the
rectangle enclosing the particle. This measure was developed with the intention of improving
differentiation between cubical, particles with smooth surfaces and angular particles with deep
indentations. Cubical, rectangular and smooth surfaced particles are likely to occupy a higher
percentage of the enclosing rectangle compared to particles with an irregular shape or outline.
Blade Shaped Particles (BSP): the percentage of flat or blade shaped particles in the
sample. In spreading the particles onto the glass plate for image analysis, the particles tended to
orient such that the largest dimensions were photographed, that is, the particles tended to lay flat.
It was desirable to distinguish between cubical particles and more "blade shaped" or "flat
particles" as described in Standard Terminology Relating to Concrete and Concrete Aggregates
(ASTM C 125, Ozol 1978). For this study, the term "blade shaped particle" was defined as a
particle for which the height is less than approximately one-third of the longest dimension, as
suggested by Galloway (1994). A simple determination of the percentage of blade shaped
particles was made visually. These values based on count were determined by observation of the
glass plate from the side during image acquisition.
Perimeter Ratio (Rp): the ratio of the perimeter of the particle to the perimeter of a
rectangle which encloses the particle. Since particle perimeter would increase with surface
irregularity or roughness, the perimeter ratio provides a measure of surface roughness or micro-
texture, but is clearly best suited to regular rectangular profiles from essentially cubical or
rectangular shaped particles.
Roundness: the ratio of the perimeter squared to 4π times the area; a perfect circle will
have a roundness of exactly 1.00. Although this is a well established definition, the name is
3 - 13
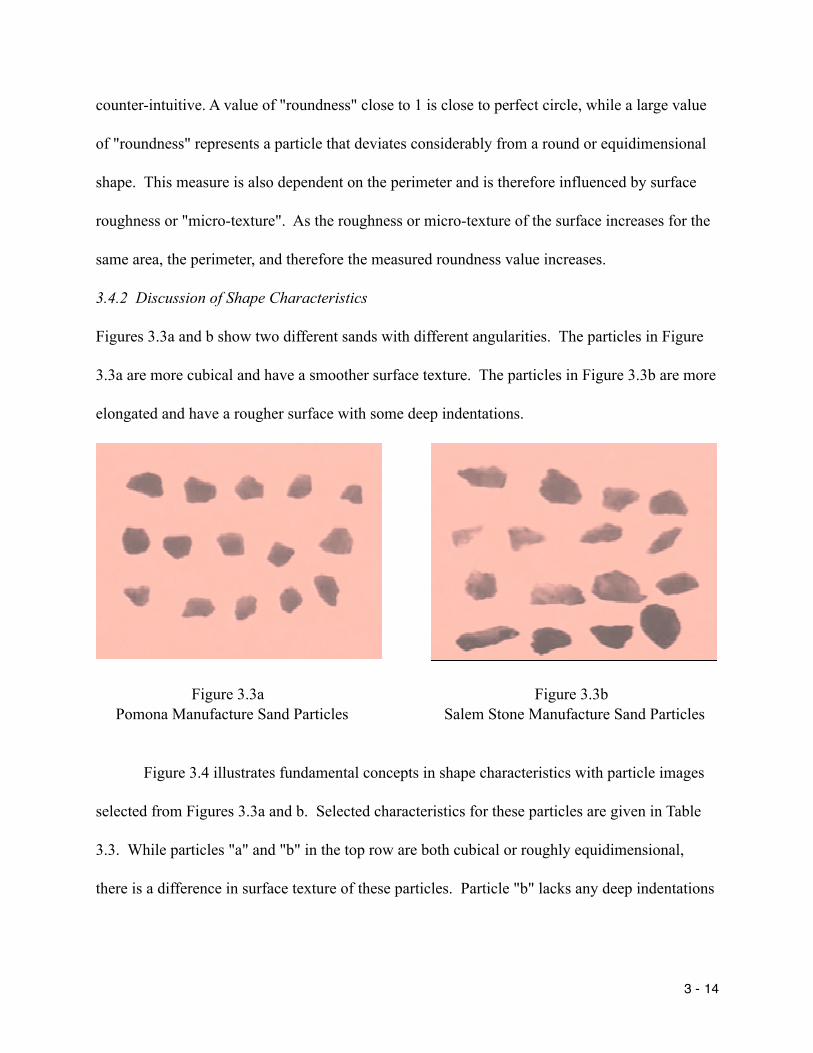
counter-intuitive. A value of "roundness" close to 1 is close to perfect circle, while a large value
of "roundness" represents a particle that deviates considerably from a round or equidimensional
shape. This measure is also dependent on the perimeter and is therefore influenced by surface
roughness or "micro-texture". As the roughness or micro-texture of the surface increases for the
same area, the perimeter, and therefore the measured roundness value increases.
3.4.2 Discussion of Shape Characteristics
Figures 3.3a and b show two different sands with different angularities. The particles in Figure
3.3a are more cubical and have a smoother surface texture. The particles in Figure 3.3b are more
elongated and have a rougher surface with some deep indentations.
Figure 3.3a Figure 3.3b Pomona Manufacture Sand Particles Salem Stone Manufacture Sand Particles
Figure 3.4 illustrates fundamental concepts in shape characteristics with particle images
selected from Figures 3.3a and b. Selected characteristics for these particles are given in Table
3.3. While particles "a" and "b" in the top row are both cubical or roughly equidimensional,
there is a difference in surface texture of these particles. Particle "b" lacks any deep indentations
3 - 14

and maintains a cubical or rectangular shape, the small irregularities (relatively rougher micro-
texture) affect the perimeter which leads to higher perimeter ratio and roundness values than "a."
Particles "c" and "d" in the second row show the difference between a rectangular but
elongated particle and a more equidimensional particle. Both Radius Ratio and Aspect Ratio
indicate particle "c" is more elongated. The deep indentation near the centroid of particle "c"
also contributes to the relatively high Radius Ratio. Particle "d" is is more elliptical so its aspect
ratio and radius ratio are numerically close.
Particles "e" and "f" demonstrate the difference between micro-texture and macro-
texture. Particle "e" has a rough surface with many small indentations while particle "f" has only
a few, relatively larger indentations. The RAR can be expected to be low due to the particle
irregularity; a portion of the particle extends like a "foot."
Figure 3.4 Comparison of Shape Characteristics
3 - 15

Table 3.3 Image Analysis Measures (based on Figure 3.4)
Object Roundness Rugosity Aspect Ratio Radius Ratio % Area (R)ab
1.231.35
0.880.95
1.171.13
1.441.45
0.800.76
cd
2.591.31
3.411.56
0.790.75
ef
0.760.68
3.5 RESULTS AND DISCUSSION - SAND PARTICLE TESTING
3.5.1 Differences in Shape Characteristics and Angularity Based on Size
Angularity studies using particles from individual sieves were conducted on selected
sands with a range of characteristics. Particles retained on the 2.36 mm and 1.18 mm (#8 and
#16) sieves were photographed using the camera while particles retained on the 300 µm and 150
µm (#50 and #100) sieves were photographed using the microscope. Although images and
measurements of particles on the 600 µm (#30) sieve were obtained, the results were excluded
from this analysis because the particles were too small for the camera to provide satisfactory
resolution yet too big for satisfactory results with the microscope. Table 3.4 shows the angularity
measures for different particles sizes of selected sands.
The effect of grain size on voids content was examined by determining the void content
of material from different sieves of selected sands with a variety of characteristics. The void
content will increase simply due to testing a uniformly graded sample, however, the void content
for the sands studied was found to increase with decreasing grain, or particle, size, indicating that
3 - 16

the smaller sized fractions are more angular. Figure 3.5 shows that while the changes in void
content versus grain size were similar for all four sands, there were some differences.
Table 3.4 Angularity by Size - Selected Sands
Void Content (%) Aspect Ratio (Ra) Radius Ratio (Rr) RoundnessLillington
#8 44.1 1.23 1.63 1.25#16 46.1 1.35 1.85 1.26#50 51.1 1.45 1.88 1.47#100 53.7 1.61 2.09 1.57
Pomona#8 45.9 1.31 1.68 1.29#16 48.0 1.40 1.85 1.27#50 53.0 1.61 2.12 1.76#100 55.2 1.71 2.21 1.66
Salem Stone#8 51.5 1.76 2.27 1.51#16 52.4 1.38 1.91 1.38#50 57.1 1.51 1.94 1.55#100 58.8 1.48 2.34 1.62
Smith Grove#8 47.0 1.33 1.67 1.21#16 48.9 1.43 1.75 1.18#50 51.8 1.47 2.00 1.42#100 53.5 1.63 2.11 1.44
The general similarity in changes in particle characteristics with increasing angularity
and, by implication, decreasing size, may be due, at least in part, to similarities in the parent rock
of the manufactured sands - siliceous materials which were often derived from granite or granitic
gneiss. Differences in angularity between different sands tended to be similar for any given size
3 - 17
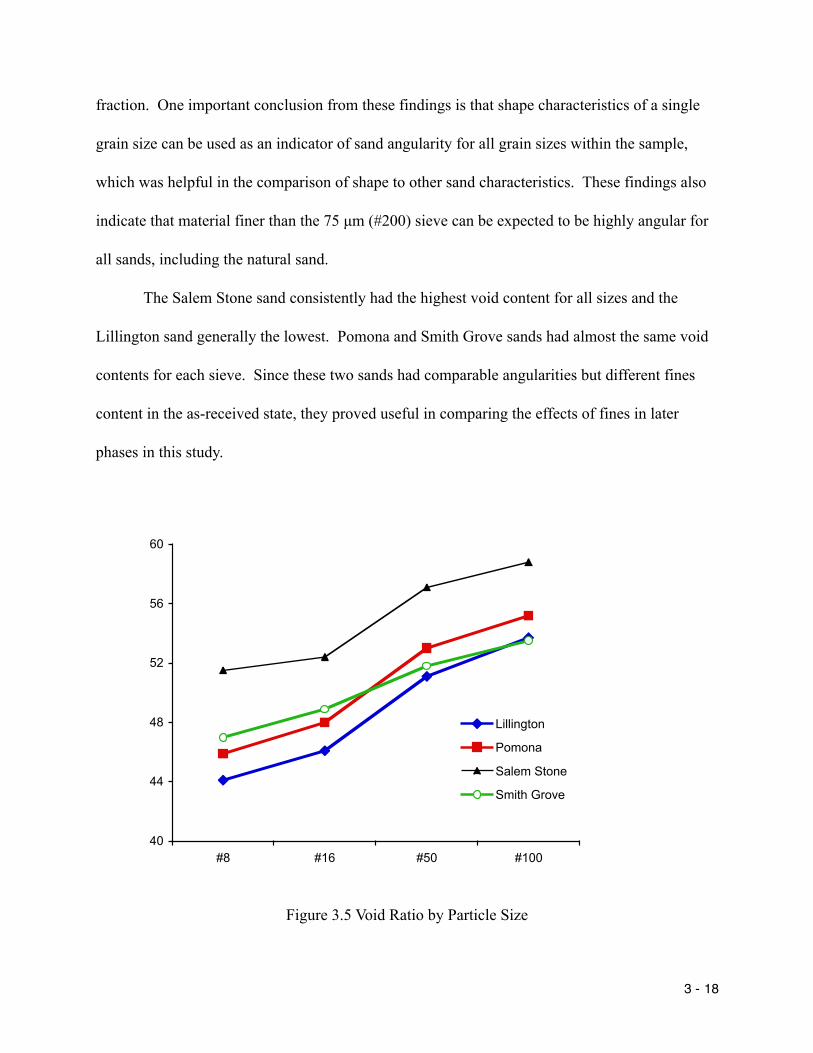
fraction. One important conclusion from these findings is that shape characteristics of a single
grain size can be used as an indicator of sand angularity for all grain sizes within the sample,
which was helpful in the comparison of shape to other sand characteristics. These findings also
indicate that material finer than the 75 µm (#200) sieve can be expected to be highly angular for
all sands, including the natural sand.
The Salem Stone sand consistently had the highest void content for all sizes and the
Lillington sand generally the lowest. Pomona and Smith Grove sands had almost the same void
contents for each sieve. Since these two sands had comparable angularities but different fines
content in the as-received state, they proved useful in comparing the effects of fines in later
phases in this study.
40
44
48
52
56
60
#8 #16 #50 #100
Lillington
Pomona
Salem Stone
Smith Grove
Figure 3.5 Void Ratio by Particle Size
3 - 18

3.5.2 Comparison of Particle Based Shape Characteristics and Void Contents
Based on the findings discussed above, particle shape characteristics were determined for
the remaining part of the study based on images of material passing the # 4 sieve and retained on
the #10 sieve. Particles this size are easy to handle and test. They provided good resolution
using the camera with a 35 mm lens and an arrangement of close-up lens attachments (+4
power). In addition, important characteristics of concrete behavior discussed in subsequent
chapters were found to be most closely related to the shape of the coarser sized fraction and the
amount of fines in the sands.
Table 3.5 provides the average values of the shape characteristics of at least 100 particles,
as defined above, and the void content. In order to provide the most meaningful comparisons,
the void content used in this portion of the study was measured using the same sized material
used to determine shape characteristics with image analysis techniques. This approach is
consistent with the use of a standard gradation for samples used to determine void contents
recommended previously, but will give slightly higher values on average due to the uniform
gradation of the sample.
The particles of the natural sand (Lillington) in this size range were visibly cubical to
rounded and rarely irregular. The BSP was significantly less than for the manufactured sands as
well. The natural sand particles, as noted previously, also had the lowest void content.
3 - 19

Table 3.5 - Summary Data, Shape Characteristics
Source VoidContent (%)
Ra (Aspect)
Rr (Radius)
Roundness Rp
(Perimeter)AR BSP
RkPt 55.7 1.52 2.15 1.52 0.88 0.67 0.28Blgr 54.4 1.46 1.98 1.44 0.86 0.68 0.21Clrk 53.9 1.55 2.15 1.51 0.88 0.68 0.19NBrn 53.3 1.45 1.94 1.44 0.87 0.69 0.19CslH 53.2 1.45 1.93 1.44 0.87 0.69 0.20SlmS 51.6 1.51 1.98 1.53 0.89 0.69 0.30Jmst 51.6 1.51 1.98 1.42 0.86 0.68 0.38Wdlf 51.1 1.60 2.09 1.44 0.87 0.69 0.12SmGr 50.2 1.43 1.85 1.57 0.91 0.70 0.21Pom 48.2 1.38 1.76 1.35 0.86 0.72 0.10Lilln 44.1 1.43 1.80 1.37 0.86 0.70 0.06
*measured on photographed particles between 4.75 mm (No. 4) and 2.00 mm (No. 10) sieves
Table 3.6 - Correlation Matrix
Voids* Ra Rr Round Rp AR BSPVoid Content* (%) 1.00 0.44 0.74 0.53 0.18 -0.80 0.57Aspect Ratio 1.00 0.88 0.38 0.02 -0.58 0.29Radius Ratio 1.00 0.49 0.05 -0.82 0.39Roundness 1.00 0.88 -0.58 0.49Perimeter Ratio 1.00 -0.13 0.26% AR 1.00 -0.66% BSP 1.00
*measured on photographed particles between 4.75 mm (No. 4) and 2.00 mm (No. 10) sievesCorrelation Coefficients larger than |0.6| are bold (except self-correlations)
3.5.2.1 Correlation Between Shape Characteristics - Table 3.6 provides a matrix of
correlation coefficients between the shape characteristics of the various sands examined. It is not
surprising that the two elongation measures, Radius Ratio (Rr) and Aspect Ratio (Ra) are highly
3 - 20
correlated, as are the two perimeter based measures (Roundness and Perimeter Ratio). While Ra
is a measure of elongation, or, at least, deviation from particle equidimensionality, Rr is based on
the actual outline of the particle rather than a representative ellipse and so is more sensitive to
deep indentations on the particle surface, that is, macro-texture. Deep indentations on the
surface also yield a low RAR; a relatively strong correlation between Rr and RAR is not
surprising.
A weaker correlation was found between BSP and particle shape irregularity as measured
by RAR. This relationship is reasonable since RAR is also related to elongation in the plane
photographed, as measured by Rr. Ozol (1978) reports that these properties are related, in part,
to the geology of the parent rock. This also implies that as particle irregularity and elongation
increase, BSP increases. Recognizing that RAR was determined in two dimensions, while BSP
was determined from simultaneous observations orthogonally, this suggests that sand particles
which are long relative to their height are also more likely to have an elongated image shape with
surface irregularities, or, a high Rr and low RAR, at least for the sands evaluated.
One of the prior expectations of this study was that roundness might be related to void
content. This study did not find a strong correlation between roundness and void content,
although that may be related to the lack of round particles in the sands used in this investigation.
Another factor which may affect the lack of strong correlation is that uniformly graded spheres
produce numerous voids as they settle into a container, although friction, and thereby water
demand, may be reduced with a more rounded aggregate. One of the highest correlations was
found between the perimeter ratio and roundness which were both perimeter based. Neither
3 - 21
roundness nor perimeter ratio were found to be statistically significant alone or when combined
with the models described below, however.
3.5.2.2 Relationship Between Shape Characteristics and Void Content - The relationships
between void content and the various shape characteristics described above were examined using
regression analysis. As discussed above, Rr and RAR had the strongest single-measure
correlations with void content. The values of the correlations (0.74 and -0.80 for Rr and RAR
respectively) mean that the regression is not particularly strong (r2, the square of the correlation,
will not be particularly high), and so more complex models were investigated. Examination of
the simplest model is informative, however, and also shows some of the difficulties in
developing a strong model with little scatter.
Examining the relationship between the void content and the shape characteristic with the
single highest correlation, RAR, shown in Figure 3.6, it is apparent that the void content of the
manufactured sands is affected by the RAR but the natural sand is clearly an outlier. This
demonstrates the limited value of analysis of variance (ANOVA) in this study. It is significant to
recall that Rr and RAR were not only the two single characteristics with the highest correlation,
they were themselves highly correlated, in effect quantifying related concepts with different
mathematical relationships. Since these characteristics are sensitive to an irregular particle
outline and a rectangular cross section, one may conclude that particle irregularity plays an
important, or possibly even a dominant role in void content, but it is not the only important
mechanism. Models with multiple parameters were therefore examined.
3 - 22
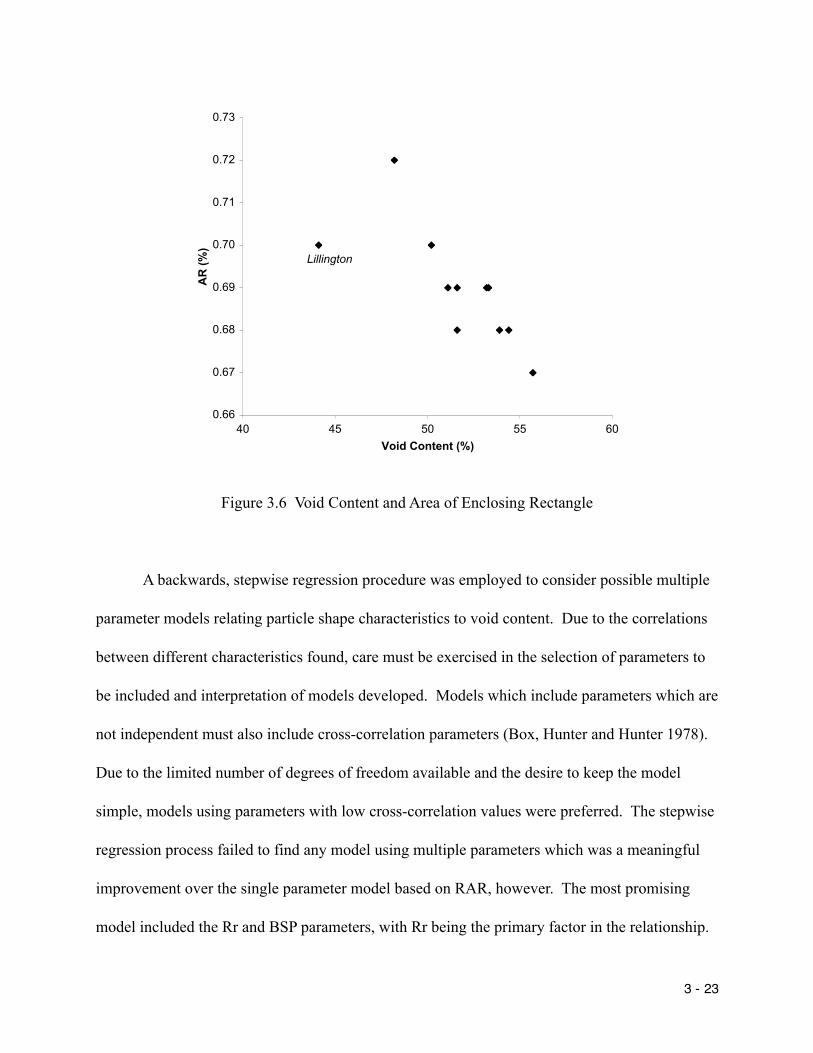
0.66
0.67
0.68
0.69
0.70
0.71
0.72
0.73
40 45 50 55 60Void Content (%)
AR
(%)
Lillington
Figure 3.6 Void Content and Area of Enclosing Rectangle
A backwards, stepwise regression procedure was employed to consider possible multiple
parameter models relating particle shape characteristics to void content. Due to the correlations
between different characteristics found, care must be exercised in the selection of parameters to
be included and interpretation of models developed. Models which include parameters which are
not independent must also include cross-correlation parameters (Box, Hunter and Hunter 1978).
Due to the limited number of degrees of freedom available and the desire to keep the model
simple, models using parameters with low cross-correlation values were preferred. The stepwise
regression process failed to find any model using multiple parameters which was a meaningful
improvement over the single parameter model based on RAR, however. The most promising
model included the Rr and BSP parameters, with Rr being the primary factor in the relationship.
3 - 23
Recalling that Rr and RAR, as well as BSP and RAR, were found to be highly correlated, this
model also implies that sands with highly irregular particles would have a high void content.
One of the problems with the geometric shape characteristics originally defined was that
many were affected by several features of interest. For example, Rr is affected by particle
elongation as well as by the presence of deep indentations in the outline, that is, a highly
irregular shape, since the minimum radius was determined from the centroid to the closest point
on the perimeter. Several additional parameters were developed in an attempt to isolate various
particle characteristics and provide a better fitting model while remaining physically reasonable.
Particle Macro-Texture (PMT) Index was defined as the Radius Ratio divided by the
Aspect Ratio (Rr / Ra). Since Rr contains the effect of particle elongation as well as the presence
of deep indentations in the surface, Rr was "normalized" by Ra, which is a measure of particle
elongation based on an equivalent ellipse. The PMT Index was developed to help isolate the
surface irregularity effects from the effects of particle elongation.
Particle Perimeter Roughness (PPR) Index was defined as the Roundness divided by
Aspect Ratio. Roundness measure increases with deviation from an equidimensional particle
outline or elongation as well as with increases in perimeter due to surface roughness or micro
texture. Roundness was “normalized” by Ra to isolate the surface roughness or micro texture
effects from the effects of particle elongation.
Particle Cubicity (PC) Index was defined as the percent Area of an Enclosing Rectangle
divided by the percent Blade Shaped Particles (RAR / BSP). A sand with a high RAR and a low
BSP would indicate particle profiles are close to rectangular with a high degree of regularity in
the outline and not very flat. This type of sand would therefore be predominantly cubical and
3 - 24

have a high PC Index. Alternately, a sand with a low RAR or a high BSP would have a low PC
Index due to a two dimensional outline that does not effectively fill a rectangular area or has a
large number of flat particles.
The correlation between the indices was examined. The highest of the correlation factors
was between the PMT Index and the PC Index and was found to be less than 0.60. This is a
marginally weak correlation and for the purposes of this study, the indices were assumed to be
independent, so no interaction terms were used in the regression model. Additional study in this
area is recommended, however. The PPR index did not prove to be statistically significant.
The following regression model was developed based on the PMT and PC Indices:
V = 40.8 PMT - 0.589 PC Eq. 3.1
where V = Void content (%) (r2 = 0.94),
PMT = Particle Macro-Texture Index (Rr / Ra) (std err = 0.4), and
PC = Particle Cubicity Index (RAR / BSP) (std err = 0.095).
The intercept was not statistically significantly different from 0. These values, and the high r2,
indicate a useful model with statistically significant parameters, although the degrees of freedom
were limited.
3.5.3 Implications of the Model
Figure 3.7 shows the actual void content versus the predicted void content, indicating that
a linear model is appropriate and that void content increases as macro-texture, or surface
3 - 25
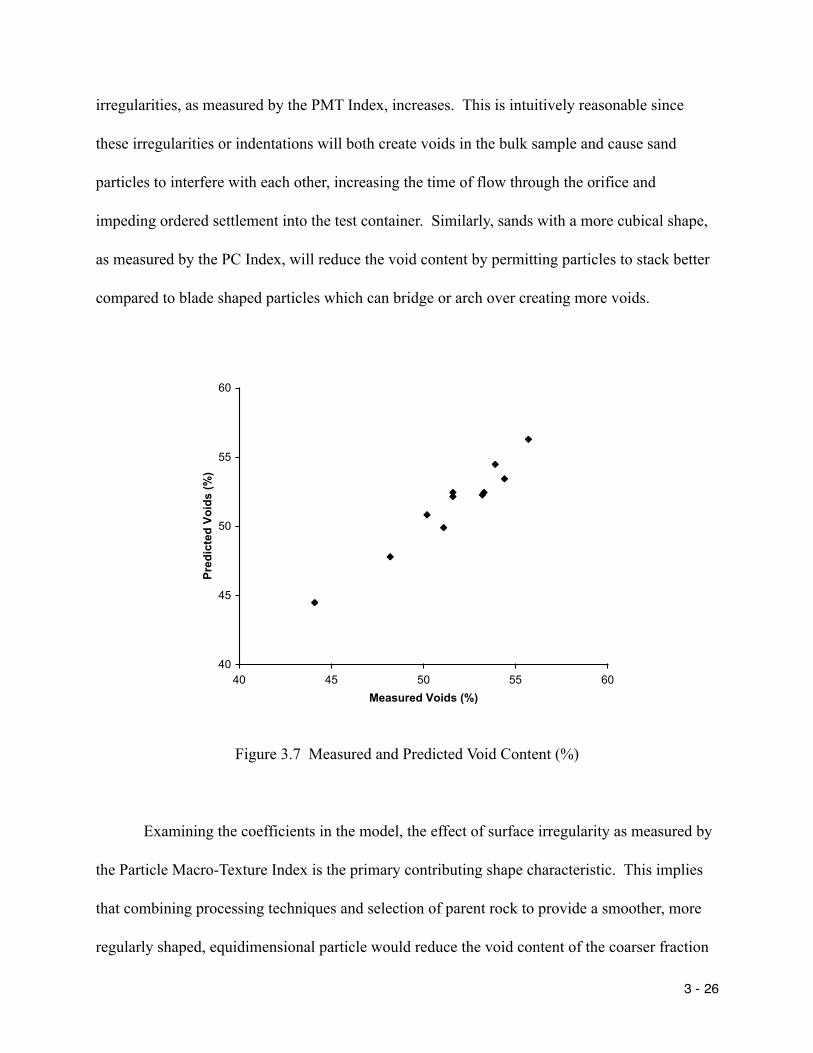
irregularities, as measured by the PMT Index, increases. This is intuitively reasonable since
these irregularities or indentations will both create voids in the bulk sample and cause sand
particles to interfere with each other, increasing the time of flow through the orifice and
impeding ordered settlement into the test container. Similarly, sands with a more cubical shape,
as measured by the PC Index, will reduce the void content by permitting particles to stack better
compared to blade shaped particles which can bridge or arch over creating more voids.
40
45
50
55
60
40 45 50 55 60Measured Voids (%)
Pred
icte
d Vo
ids
(%)
Figure 3.7 Measured and Predicted Void Content (%)
Examining the coefficients in the model, the effect of surface irregularity as measured by
the Particle Macro-Texture Index is the primary contributing shape characteristic. This implies
that combining processing techniques and selection of parent rock to provide a smoother, more
regularly shaped, equidimensional particle would reduce the void content of the coarser fraction
3 - 26

of manufactured sand. In subsequent chapters, the importance of angularity of the coarse
fraction of sand and the quantity of fine particles on water demand is discussed.
The correlation between the void contents of only the coarser sizes used in the analysis
and Method A (ASTM C 1252) void contents was relatively poor for the sands tested. Method A
void content requires determination of void content using a prescribed gradation of particles
smaller than 2.36 mm (No. 8) which eliminates differences due different gradations. This
indicated that shape characteristics or the contributions of shape characteristics to void content,
may vary with particle size or may be related to correlations between size and shape as well as
gradation. Additional studies are needed to examine the effects of shape characteristics on void
content with size and possible cross correlations between the effects of size and shape on void
content of sand.
3.6 CONCLUSIONS - SAND CHARACTERISTICS
1. Time of flow of dry sand grains was found to be generally correlated with void content
of sands, however the relationship is non-linear. Sands with high angularities can be better
differentiated on the basis of void content.
2. Measurements of shape characteristics required the development of image analysis
techniques which could quickly and easily determine the two dimensional shape characteristics
of individual sand grains, and the development of geometrically based measures of particle
shape. The image analysis techniques and shape characteristics developed in this study appear to
be appropriate for the types and ranges of particle shapes encountered in the sands studied.
3 - 27
3. This study demonstrated that particle shape of fine aggregate plays an important role
in determining void content.
4. Void content was found to increase with decreasing grain size. Changes in the void
content and the grain size are approximately parallel for manufactured sands, therefore results
using a single grain size could be used to develop models of behavior based on angularity.
5. Although differences in surface texture could be detected with particle based image
analysis techniques, measures which were more sensitive to the surface roughness or micro-
texture of the particles, such as roundness and the perimeter ratio, were not strongly related to
void content.
6. The coarse sand particles in this study that were long relative to their height when
viewed from the side, that is, the smaller dimension, are more elongated and have distinct surface
irregularities when viewed perpendicular to the side.
7. No single parameter model based on the shape characteristics used in this study
provided a useful way to predict void content of sand particles. It was necessary to develop
derivative particle shape characteristics or indices based on physically meaningful relationships
between basic shape characteristics.
8. The regression model developed in this study demonstrated that larger sized sand
particles with highly irregular profiles have higher void contents. Similarly, the model
demonstrated that larger sized sands with more cubically shaped particles have lower void
contents. The numerical relationship found may provide producers with a tool to help select
crushing equipment and techniques to minimize void content.
3 - 28
9. The recommended model for predicting the effects of larger sized fine aggregate
particle shape on void content is V = 40.8 PMT - 0.589 PC, where V is void content, PMT is
Particle Macro-Texture Index, defined as the radius ratio divided by the aspect ratio (Rr / Ra),
and PC is the Particle Cubicity Index, defined as the ratio of area of the particle to the area of an
enclosing rectangle and the fraction of blade shaped particles (RAR / BSP).
10. The findings of this study provide guidance on the relative effects of particle shape
on void content of coarse sand particles. Further investigation is needed using a number of
natural and manufactured sands with a wider range of angularity characteristics and geologic
source or parent aggregate. Additional studies are needed to examine the effects of shape
characteristics of different sized particles on void content and possible cross correlations between
the effects of size and shape on void content of sand.
3 - 29

CHAPTER 4CHARACTERISTICS OF MORTAR WITH MANUFACTURED SANDS
Mortars were tested to help confirm the selection of sands to be used in concrete testing
and provide additional information on the effects of sand characteristics on water demand and
relative workability. The sands in the small subset were primarily used in this testing, however
additional sand sources from the larger subset were included in some tests. Blends of selected
sands in the small subset were used in certain tests as well.
4.1 TEST METHODS FOR MORTAR
Four different mortar tests were used to compare water demand and workability. Two
tests were based on standard ASTM flow table test methods. One test, the "mim-slump" test
method described by Cook, was a non-standard test reported to be well correlated with concrete
slump values. The time of flow through an orifice was also measured.
The flow table test apparatus described in ASTM C 109 (AASHTO T106) [ASTM 1999]
measures relative water demand by comparing the spread of mortars with given proportions after
dropping the flow table 15 times. Since the water demand of the manufactured sands tested in
this study varied widely, two different water cement ratios and two different drop factors were
used in order to increase resolution of the test results. The flow, or spread of the mortar after 10
drops and an additional 5 drops (for a total of 15) were measured. The mortars were initially
prepared using the proportions specified in AASHTO T 106 / ASTM C 109 which requires a
water cement ratio of 0.484. After measuring the flow at 10 and 15 drops, the mortar was mixed
with additional water sufficient to raise the water cement ratio to 0.55 and an additional set of
flow measurements were taken. All testing was completed in less than ten minutes so that
stiffening of the mortar during the test was minimized.
The “mini slump” test is conceptually similar to the conventional slump test AASHTO T
119 / ASTM C143 but is conducted using the small brass cone specified in AASHTO T 84 /
ASTM C 128. Compaction of the mortar followed the procedure outlined in ASTM C 128. The
"mini-slump" of the mortar was measured to the nearest millimeter after the cone was removed.
A test similar to the Time Index of Rex and Peck [1956] and the flow test reported by
Johansen, et al [1991], in which the time of flow of mortar was determined, was also examined.
The mortar was produced using 500 grams of sand with the cement quantity specified in ASTM
C109. This test was also carried out with different water contents to cover the wide range of
water demand encountered. The apparatus specified in the ASTM C 1252 void content test was
used to measure flow time of mortar through a 25 mm (1 in.) orifice.
4.2 RESULTS OF MORTAR TESTING
Mortar test results are summarized in Tables 4.1a and 4.1b. Figure 4.1a shows the
relationship between the “mini-slump” and the as-received void content. Figure 4.1b. shows the
relationship between the flow table spread and the as-received void contents. These figures show
the expected increase in water demand with increased angularity.
Figure 4.1c shows the relationship between flow table spread and void content for mortar
using sand with the gradation specified for Method A. The relationship, possibly non-linear,
appears to show the Lillington and Clark Sands as outliers. These two sands appear to have
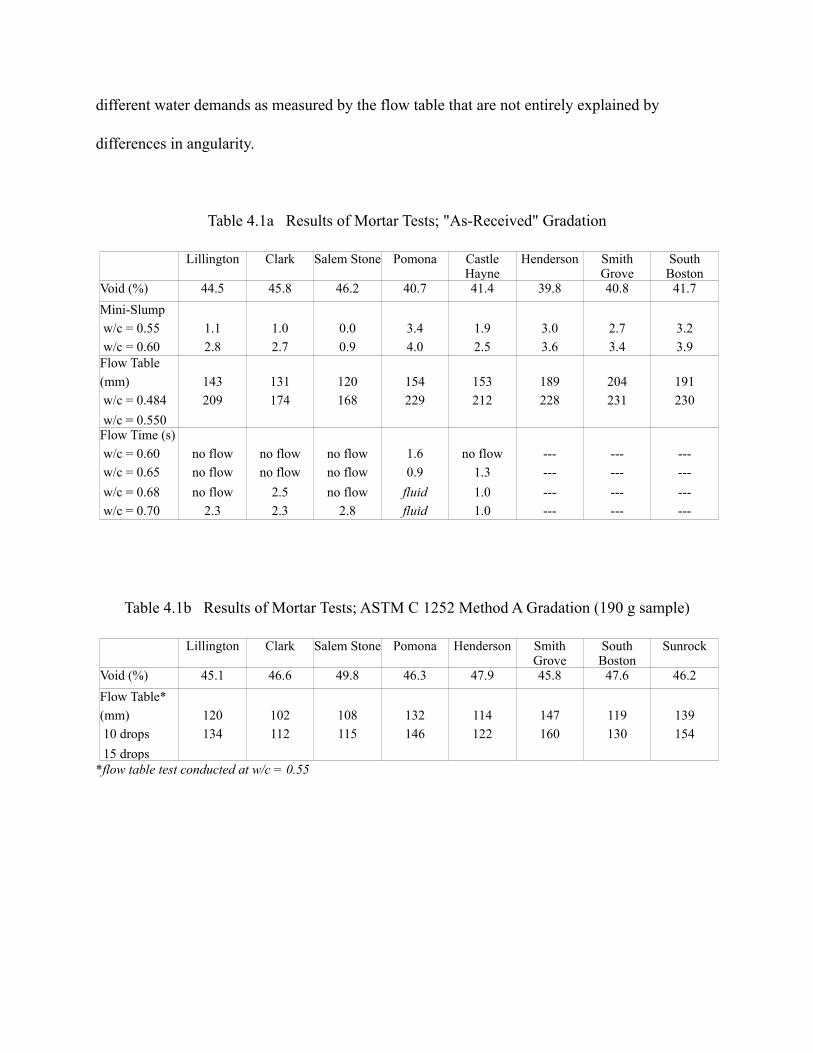
different water demands as measured by the flow table that are not entirely explained by
differences in angularity.
Table 4.1a Results of Mortar Tests; "As-Received" Gradation
Lillington Clark Salem Stone Pomona Castle Hayne
Henderson Smith Grove
South Boston
Void (%) 44.5 45.8 46.2 40.7 41.4 39.8 40.8 41.7Mini-Slump w/c = 0.55 w/c = 0.60
1.12.8
1.02.7
0.00.9
3.44.0
1.92.5
3.03.6
2.73.4
3.23.9
Flow Table (mm) w/c = 0.484 w/c = 0.550
143209
131174
120168
154229
153212
189228
204231
191230
Flow Time (s) w/c = 0.60 w/c = 0.65 w/c = 0.68 w/c = 0.70
no flowno flowno flow
2.3
no flowno flow
2.52.3
no flowno flowno flow
2.8
1.60.9
fluidfluid
no flow1.31.01.0
------------
------------
------------
Table 4.1b Results of Mortar Tests; ASTM C 1252 Method A Gradation (190 g sample)
Lillington Clark Salem Stone Pomona Henderson Smith Grove
South Boston
Sunrock
Void (%) 45.1 46.6 49.8 46.3 47.9 45.8 47.6 46.2Flow Table* (mm) 10 drops 15 drops
120134
102112
108115
132146
114122
147160
119130
139154
*flow table test conducted at w/c = 0.55

0.5
1.0
1.5
2.0
2.5
3.0
3.5
4.0
4.5
39 40 41 42 43 44 45 46 47As Received Voids (%)
Min
i-Slu
mp
(mm
)
Figure 4.1a Effect of As-Received Void Content on Mortar Water Demand ("Mini-Slump")
150
175
200
225
250
39 40 41 42 43 44 45 46 47As Received Voids (%)
Flow
Tab
le (%
; w/c
= 0
.550
)
Figure 4.1b Effect of As-Received Void Content on Mortar Water Demand (Flow Table)

100
110
120
130
140
150
160
170
44 45 46 47 48 49 50 51Void Content (%; Method A)
Flow
Tab
le (m
m; 1
5 dr
ops)
Lillington
Clark
Figure 4.1c Effect of Method A Void Content on Mortar Water Demand (Flow Table)
Water demand was affected by other factors, particularly for low angularity sands. For
example, the difference in the static shear capacity as measured by the mini-slump test between
Pomona and Smith Grove sands cannot be explained on the basis of angularity alone. The
difference in fines content between these two sands was approximately 1.6 %, however. A
higher fines content will increase the water demand of both mortars and concretes since there is
more surface to wet. The difference in water demand due to fines was investigated in more
detail with concrete tests.
Table 4.2 gives the void content and flow values for various size fractions of sands from
two sources, Salem Stone and Smith Grove. These two sands had previously been found to have
relatively large differences in void content and were near the maximum and minimum for
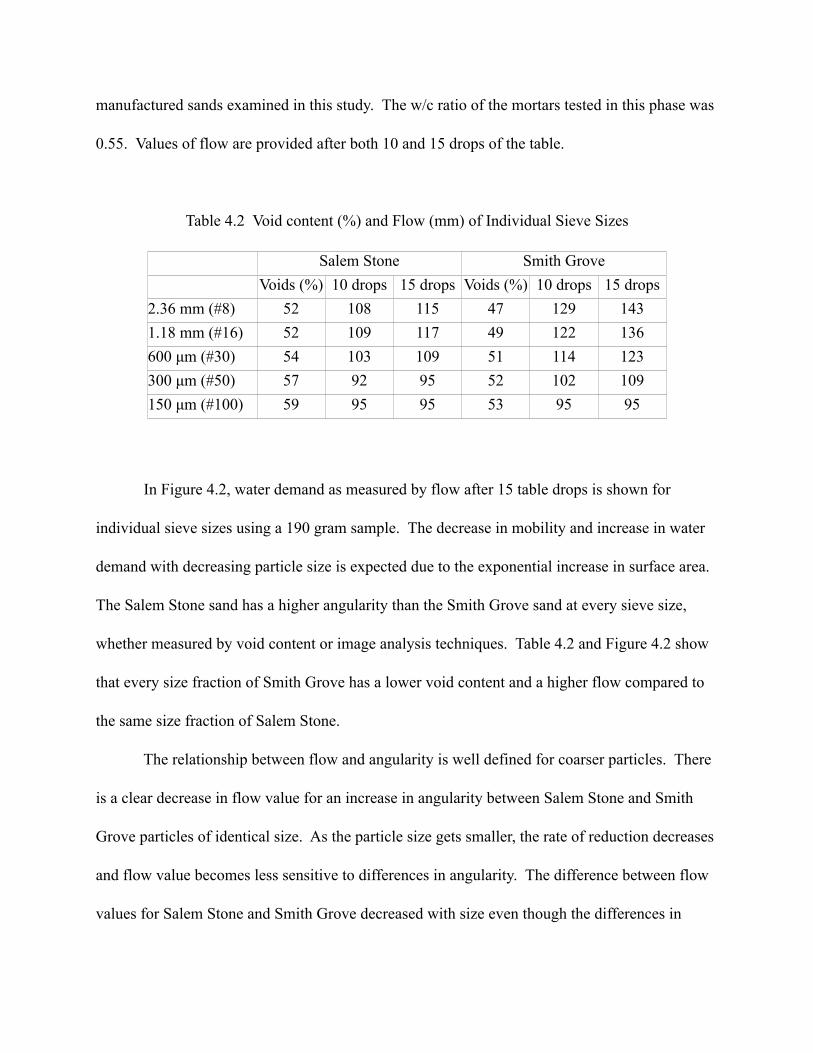
manufactured sands examined in this study. The w/c ratio of the mortars tested in this phase was
0.55. Values of flow are provided after both 10 and 15 drops of the table.
Table 4.2 Void content (%) and Flow (mm) of Individual Sieve Sizes
Salem Stone Smith GroveVoids (%) 10 drops 15 drops Voids (%) 10 drops 15 drops
2.36 mm (#8) 52 108 115 47 129 1431.18 mm (#16) 52 109 117 49 122 136600 µm (#30) 54 103 109 51 114 123300 µm (#50) 57 92 95 52 102 109150 µm (#100) 59 95 95 53 95 95
In Figure 4.2, water demand as measured by flow after 15 table drops is shown for
individual sieve sizes using a 190 gram sample. The decrease in mobility and increase in water
demand with decreasing particle size is expected due to the exponential increase in surface area.
The Salem Stone sand has a higher angularity than the Smith Grove sand at every sieve size,
whether measured by void content or image analysis techniques. Table 4.2 and Figure 4.2 show
that every size fraction of Smith Grove has a lower void content and a higher flow compared to
the same size fraction of Salem Stone.
The relationship between flow and angularity is well defined for coarser particles. There
is a clear decrease in flow value for an increase in angularity between Salem Stone and Smith
Grove particles of identical size. As the particle size gets smaller, the rate of reduction decreases
and flow value becomes less sensitive to differences in angularity. The difference between flow
values for Salem Stone and Smith Grove decreased with size even though the differences in

angularity were high. The exponential increase in surface area with finer particles apparently
overshadows the angularity effect. This finding, along with that of the effects of fines noted
earlier, implies that the percentage of fines is a critical factor, and may be more important than
the angularity of fines, although both are important factors in workability and water demand.
90
100
110
120
130
140
150
45 50 55 60Void Content (%)
Flow
(15
drop
; mm
)
Salem StoneSmith Grove
Figure 4.2 Size and Angularity Effects on Void Content
This finding also partly accounts for the low water demand of Lillington sand, since it
had low fines even though the fine particles were angular. This finding is also consistent with
many of the findings reported in the literature regarding the effects of stone dust, that is, the
quantity is a dominant, and can be the most critical, effect on water demand.
4.3 CONCLUSIONS OF MORTAR TESTING
1. The flow table values and the “mini slump” tests are related to void content, whether
measured using the as-received or standardized gradation.

2. The results of mortar testing confirmed that flow of mortars decreases with increasing
angularity regardless of the test method used. This was true with both blends and individual
sieve sizes.
3. As particle size decreased, flow values became insensitive to angularity, even with
large differences in angularity. The surface area effect apparently dominated the angularity
effect. The quantity of fines is a critical factor and may be as or more important than the
angularity of fines on water demand. Additional testing is required to confirm these results with
concrete (see Chapter 6).

CHAPTER 5CONCRETE TESTING PROGRAM - METHODOLOGY
A primary purpose of this study was to determine the influence of manufactured sands on
the deicer salt scaling resistant of concrete. The effects on workability and, to a limited degree,
on strength were also examined for completeness and possible relationships with salt scaling.
Gradation effects were examined in a limited study of selected sands and mixture composition.
Table 5.1 shows the broad categories of concrete composition examined in the study.
These categories provided a range of characteristics of most practical interest to the North
Carolina Department of Transportation. Detailed test matrices are provided following a
discussion of the materials, mixtures, and test methods used.
Table 5.1 Concrete Composition Factors
W/C RatioSupplementary Cementitious
Materials ("Mineral Admixtures")
Sand
Angularity Fines Parent Rock
0.45 (Class AA)
0.50 (Class A)
Fly Ash
Fly Ash + Silica Fume
High
Moderate
Low
Higher
Lower
Carbonate
Silicious
(various locations)
5.1 COMPOSITION AND RAW MATERIALS
The standard mixture was the NCDOT Class AA concrete which would typically be used
on interstate pavements and bridge decks. Eleven sands were used to produce Class AA mixes
which were then tested for frost durability using the ASTM C 672 deicer salt scaling test:
5 - 1
Belgrade, Castle Hayne, Clark, Jamestown, New Bern, Rocky Point, Woodleaf, Pomona, Salem
Stone, Smith Grove, and Lillington.
The coarse aggregate used in this study was #57 stone from the Garner quarry of Martin
Marietta Aggregates. Saylor Type I portland cement and Pro Ash Class F Fly Ash were used as
the cementitious material. PSI 400 and DARAVAIR were the water reducing and air entraining
admixtures, respectively, used in the concrete mixtures.
The Lillington, Salem Stone, Pomona and Smith Grove sands were used in more
extensive testing. The Class AA and Class A mixtures have different minimum cement and w/c
ratio requirements. While concrete with a 0.5 w/c is not recommended for use in applications
exposed to severe freezing and thawing, Class A mixtures were included to confirm current
NCDOT specifications and to provide better resolution in deterioration if the Class AA mixtures
did not show a wide range of performance.
Fly ash quantities are limited to a maximum of 25% in the ACI 318 Building Code for
concrete exposed to deicing salts in freezing conditions. The study included both Class AA and
A mixtures with a 25% replacement (by mass) of portland cement with a high-quality, Class F
Fly Ash. A combination of 5% silica fume plus 20% fly ash were examined in one mixture.
The sands used in the in-depth testing program were selected to provide a range of
material characteristics of interest. The natural sand (Lillington), with a proven service record for
durability, was the control. Salem Stone had one of the highest angularities as measured by both
the standard void content and particle based measures obtained with image analysis techniques.
Smith Grove and Pomona sands had moderate to low angularities. Since the natural sand had a
relatively low angularity compared to the manufactured sands in this region, these four sands
5 - 2

provided a good range of particle angularity for the test program. This selection also provided a
comparison of the effects of stone dust fines since the Smith Grove and Pomona had high and
low fines contents respectively at comparable angularities. Smith Grove and Salem Stone sands
had a reasonably well-graded distribution of grain sizes, as received, while Pomona and
Lillington sands had a more dominant grain size, permitting comparison between uniformly and
well-graded manufactured sands. Manufactured sands included those from silicious and
carbonate parent rock, from a variety of geographical locations.
The effects of gradation and fines content were further examined using samples from
sand sources blended to achieve two types of gradation, a well-graded sand, essentially following
the 0.45 (Fuller) curve, except for the fines content, and a uniform gradation, where much of the
aggregate grain size was limited to two adjacent sieve sizes. These two gradations had similar
fineness moduli but, due to aggregate characteristics, yield significantly different void contents.
Two more mixtures were tested in which the entire aggregate gradation was blended to
achieve an aggregate gradation which conformed to the "8 - 18" guidelines to evaluate claims of
improved performance of aggregates meeting specified gradation limits. This phase of the study
was not intended to be comprehensive but the findings were sufficiently conclusive to eliminate
the necessity for further research in this area.
A selected number of fine aggregate blends composed of two sand sources were also
evaluated. It was desirable to analyze the effects of blending to determine if one given sand
could be used to "save" a mixture if durability was compromised with a particular sand.
5 - 3

5.2 CONCRETE PROPERTIES TESTED
5.2.1 Fresh Concrete Properties
Although the use of water-reducing, water-reducing and retarding, and high range water
reducing admixtures can be used to offset variations in water demand, it was believed, a priori,
that understanding the differences between various manufactured sands would not only be of
intrinsic value but might provide some insight into frost durability. The effects were analyzed
using conventional test methods and estimates commonly used in practice.
5.2.2 Hardened Concrete Properties
A number of tests of hardened concrete were conducted. Frost durability, strength, elastic
(Young's) modulus, and the air permeability index were determined. Shrinkage was also
evaluated for selected mixtures. The potential for segregation was examined by comparing the
elastic modulus of disks from the top and the center of cylinders.
Deicer salt scaling resistance (ASTM C 672), in which a concrete slab, ponded using
deicing salt solution, is then frozen and thawed at a realistic but relatively slow rate, was selected
to evaluate frost durability since ASTM C 666, "Standard Test Method for Resistance of
Concrete to Rapid Freezing and Thawing" primarily evaluates the adequacy of the air void
system. The dynamic elastic (Young's) modulus of disks sawed from the tops of cores taken
from the slabs were examine to try to evaluated deterioration of mechanical properties after
deicer salt scaling exposure.
An alternative frost durability test method was also examined in this study in an attempt
to provide a numerical assessment of frost durability and to both reduce the effort and the time
5 - 4

involved in conducting deicer salt tests. Damage was quantitatively assessed by measuring the
dynamic elastic (Young's) modulus of concrete disks, similar in concept to the method used in
ASTM C 666, and intended to complement analysis of cores from the slab after exposure. The
disks were ponded with the same salt solution as used on the slabs and subjected to the same
freezing and thawing temperature cycles.
Mechanical properties determined for the mixtures include compressive strength at 14
and 28 days and flexural strength of beams of beams at 14 days. The tests were conducted at 14
days since AASHTO design guides for pavement structures use the flexural strength at 14 days,
and since water curing for frost durability testing ends at 14 days.
The dynamic elastic (Young's) modulus is determined non-destructively. The elastic
modulus of flexural beams and of thin disks sawed from cylinders or cores was determined at the
same ages as strength tests.
The shrinkage characteristics of manufactured sand concrete were examined for a few
mixtures. Shrinkage is strongly related to water content and to paste content. A higher water
content mixture will have more shrinkage, all else being equal. A mixture with more paste will
also have a higher shrinkage since it is the paste which shrinks, at least with the coarse
aggregates used in this study. It was desirable to determine if the shrinkage characteristics of
concrete mixtures containing manufactured sands were significantly different than mixtures with
a natural sand typical of North Carolina. Manufactured sands with significantly different water
demands, and therefore concrete paste contents, were chosen for the shrinkage study. The
shrinkage characteristics were compared with results from a previous study conducted for the
5 - 5
NCDOT [Leming, 1998] which included shrinkage and creep testing of a NCDOT Class AA
mixtures using Garner coarse aggregate and Lillington natural sand.
5.3 MIXING AND FABRICATION PROCEDURES
The concrete mixtures were batched to provide a target slump of 3 +/- 1 inches and 6 +/-
1.5 % air content in general conformance with NCDOT specifications. Due to the large variation
in water demand and moderate difference in air entraining agent demand, it was difficult to
simultaneously meet all of the targets, even after adjustment of multiple batches. Batches
generally conformed to targets, however, except where noted. Batches ranged from
approximately 1 cubic foot to just over 3.5 cubic feet. Batches were produced in a rotary drum
mixer in a sequence similar to that used in practice with "dry batch" or transit-mixed operations.
In order to examine the effects of angularity, fines or gradation on slump loss or air loss
with extended periods of mixing, specimens were produced in two stages for selected mixtures:
- Routine handling (specimens cast 10 minutes after the water contacted cement),
- Extended handling (specimens cast 45 minutes after the water contacted cement).
In both stages, the effects of normal and increased vibration times on properties of concrete
cylinders were examined. For both routine and extended handling, total air content was
determined in accordance with ASTM C 231 and unit weight was determined in accordance with
ASTM C 138. The specimens were consolidated on a vibrating table, at a frequency of 25Hz, for
30 seconds for normal vibration; an additional 30 seconds of vibration was applied to examine
the effects of increased vibration times. This constitutes a severe, but not unrealistic exposure in
practice.
5 - 6

5.4 TEST METHODS
5.4.1 Test Methodologies for Workability and Water Demand of Fresh Concrete
5.4.1.1 Conventional Workability Test Methods - The slump test, ASTM C 143
(AASHTO T119-82), is a widely used, conventional measure to estimate the workability and
consistency of concrete. It is a convenient but crude measure of the static shearing capacity of a
cone of fresh concrete under its own weight.
The Deutsches Institut fur Normalung (DIN) flow table test [DIN 1991] is also widely
used in research and in practice in some locations. In this test, an 20 cm (8 in.) high cone of
fresh concrete is placed on a rectangular plate with a hinge on one edge. The free edge of the
plate, opposite to the hinge, is slowly raised to a height of 4 cm (1.5 in.) and then permitted to
fall. This is repeated 15 times, after which the spread of the concrete cone is measured. The
DIN test estimates the "dynamic" shearing capacity of fresh concrete as opposed to the "static"
shearing capacity estimated by the slump test.
5.4.1.2 Water Demand - Manufactured sands have been reported to frequently have a
higher water demand than natural sands. The concrete mixtures tested were kept at one of the
two specific water cement ratios corresponding to Class AA and Class A requirements. Different
water demands result in different cement contents and therefore different paste and mortar
contents which can themselves affect water demand.
It was necessary to quantitatively characterize the water demand of test mixtures with
slight differences in slump and air content. The nominal water demand was defined as the
quantity of water required to produce a 75 mm (3 in.) and a 6 % air including the effects of the
minimum dosage (1.3 ml/kg; 2 oz/cwt) of water-reducing admixture then required by NCDOT
5 - 7

specifications. Differences in mixtures were normalized to this slump and air content with
relatively simple approximations. After the batch was completed, the as-mixed water was
determined on an equivalent cubic yard basis. The water was adjusted to a common basis using:
+/- 5.9 kg/m3 (+/- 10 pcy) water for each additional +/- 25 mm (+/- 1 inch) of slump,
-/+ 3 kg/m3 (-/+ 5 pcy) water for each +/- 1 % of additional air, and
+/- 5.9 kg/m3 (+/- 10 pcy) water for each +/- 1 oz/cwt water reducing admixture.
5.4.2 Frost Durability
5.4.2.1 Standard Deicer Salt Scaling Resistance - Concrete slabs were evaluated in
accordance with ASTM C 672, Freezing and Thawing Test in the Presence of Deicing
Chemicals. In this test, a concrete slab is cast, finished (typically with a float finish, but this can
be varied), cured for 14 days, then air dried for 14 days. A dam is formed around the perimeter
of the slab and the surface ponded with a 4% CaCl2 solution. The slab is then frozen and thawed
at a realistic but slow rate. At the end of the 50 cycles the slabs are visually ranked according to
the extent of surface scaling and delamination. The slabs are a significant heat sink and care
must be taken to ensure as nearly identical freezing and thawing exposures as possible. The
freezer was equipped with a fan to circulate air at all times and slabs were rotated to different
positions in the freezer over time. An example of a specimen with moderate deterioration at the
end of the test is shown in Figure 5.1.
5 - 8
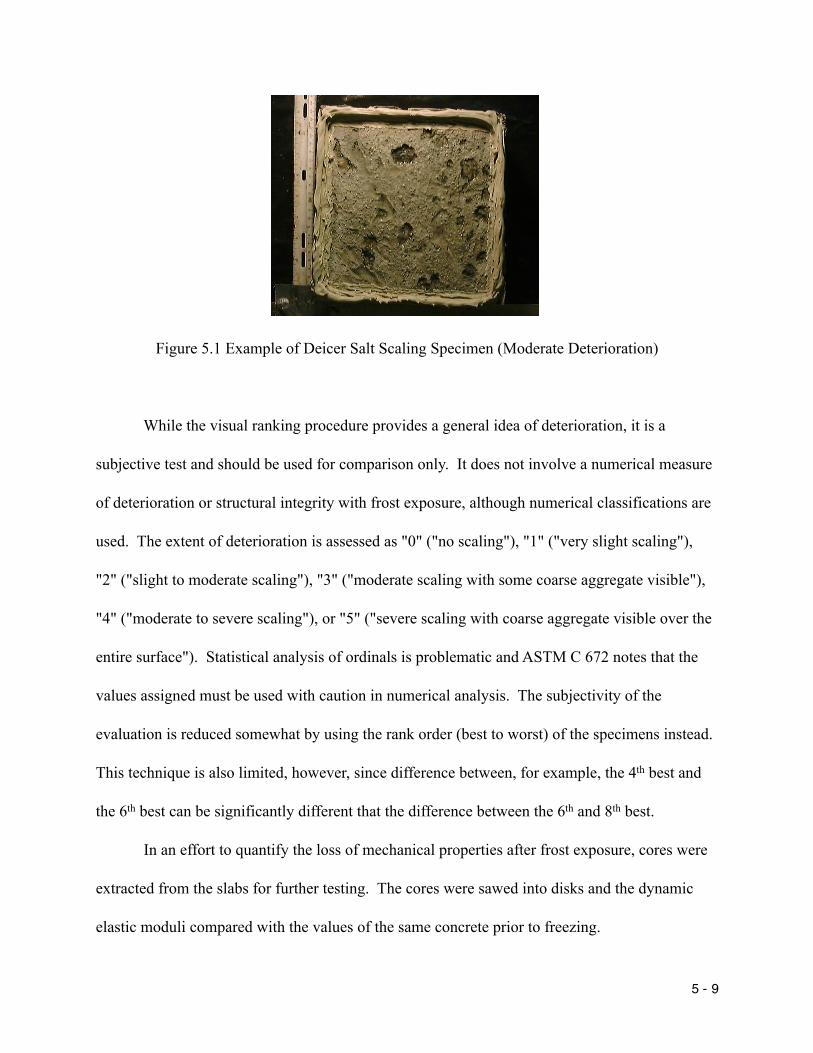
Figure 5.1 Example of Deicer Salt Scaling Specimen (Moderate Deterioration)
While the visual ranking procedure provides a general idea of deterioration, it is a
subjective test and should be used for comparison only. It does not involve a numerical measure
of deterioration or structural integrity with frost exposure, although numerical classifications are
used. The extent of deterioration is assessed as "0" ("no scaling"), "1" ("very slight scaling"),
"2" ("slight to moderate scaling"), "3" ("moderate scaling with some coarse aggregate visible"),
"4" ("moderate to severe scaling"), or "5" ("severe scaling with coarse aggregate visible over the
entire surface"). Statistical analysis of ordinals is problematic and ASTM C 672 notes that the
values assigned must be used with caution in numerical analysis. The subjectivity of the
evaluation is reduced somewhat by using the rank order (best to worst) of the specimens instead.
This technique is also limited, however, since difference between, for example, the 4th best and
the 6th best can be significantly different that the difference between the 6th and 8th best.
In an effort to quantify the loss of mechanical properties after frost exposure, cores were
extracted from the slabs for further testing. The cores were sawed into disks and the dynamic
elastic moduli compared with the values of the same concrete prior to freezing.
5 - 9

5.4.2.1 Alternate Deicer Salt Scaling Resistance Test Method - The specimens used for
deicer salt scaling are large, cumbersome to handle and difficult to prepare. They also require
considerable space to test and a relatively long test period. The large size is required for visual
assessment of the extent of scaling. A test using small disks, with the potential for quantitative
evaluation would be extremely useful. Advantages of such a test include the ability to measure
the dynamic modulus on the same specimen before and after freezing cycles, a smaller, much
easier to handle specimen, and the ability to evaluate deterioration using both visual scaling
assessment and deterioration of mechanical properties. A potential test method developed to
benefit from these advantages was evaluated simultaneously with the other deicer scaling test.
Disks were sawed from the top, finished part of the cylinder and from the middle of the
cylinder. Differences in deicer salt scaling resistance betwen disks from finished surfaces and
sawed surfaces, were intended to help assess surface durability versus inherent concrete
durability, similar to the Swedish scaling test SS 13 72 44 [Swedish Standards Institute, 1988].
The mass of the disk, the mass of scaled particles, and the dynamic elastic modulus were
determined for each disk before and after the exposure. Due to the smaller specimen size, time
to saturation is reduced considerably and temperature gradient effects are less significant; these
effects may or may not affect the severity of the test. Disks were ranked visually for deicer salt
scaling resistance at the end of the test.
In a preliminary study, concrete disks without entrained air and compressive strength in
excess of 35 Mpa (5000 psi), disintegrated completely after 15 freezing and thawing cycles.
Since it was also desirable to have as short a test period as possible, 15 cycles were used for the
evaluation of the test method.
5 - 10
The salt solution was retained on the surface by providing an easily attached "dam." A
layer of impermeable tape was wrapped around the circumference of the disk to form a water-
tight seal. The temperature cycle times and rates used were those specified in ASTM C 672.
5.4.3 Tests of Hardened Concrete
5.4.3.1 Mechanical Properties - Mechanical properties determined for the mixtures
included compressive strength at 14 and 28 days and flexural strength of beams and elastic
dynamic modulus of beams at 14 days. Compressive strength was determined using 4 inch by 8
inch (nominal 100 mm by 200 mm) cylinders. Tests were conducted in accordance with ASTM
C 39 (AASHTO T22) using unbounded, neoprene caps.
Flexural strength test of beams was conducted in accordance with ASTM C 78
(AASHTO T97) using 3 x 4 x 16 inch (nominal 75 by 100 by 400 mm) prisms. This specimen
size was selected for reasons of convenience in determination of beam dynamic modulus in
accordance with ASTM C 215. Specimens of this size will result in a measured flexural strength
higher (perhaps up to 20%) than when using conventional sized prisms, however. The dynamic
modulus of beams is determined non-destructively; this test was conducted immediately prior to
determining the modulus of rupture (flexural strength).
5.4.3.2 Dynamic Modulus of Thin Disks - Disks approximately 100 mm (4 in.) in
diameter and 25 mm (1 in.) thick were obtained by transversely sawing concrete cylinders or
cores using a water-cooled, diamond blade. The method of determining the dynamic elastic
modulus of circular concrete disks based on resonant frequency is discussed in detail by Leming,
5 - 11

Nau and Fukuda [1997] who report that the dynamic elastic modulus of a disk under free-free
vibration can be determined as
Ed = 2 (1+ν) ρ (π f d / Ω0)2 Eq. 5.1
where Ed = the elastic (dynamic) modulus,
ν = Poisson’s ratio (assumed to be 1/6 in this study),
ρ = the mass density of the disk,
f = the fundamental cyclic natural frequency in Hertz,
d = the diameter of the disk, and
Ω0 = the frequency parameter associated with the fundamental vibration mode.
Ed may be determined by measuring f, d and ρ, estimating ν and obtaining Ω0 from an iterative
solution easily implemented in a spreadsheet (all values in consistent units).
The fundamental cyclic natural frequency of the disk is determined experimentally using
a small, piezoelectric accelerometer connected to one side of the specimen with a soft, adhesive
wax with good acoustical properties. The disk is excited by striking it a small steel ball-bearing,
12.5 mm (½ inch) in diameter. The disk is suspended vertically to reduce damping. The output
signal from the accelerometer is captured with a digital acquisition board in a computer at a
sampling rate of at least 90 kilohertz.
The signal is analyzed and the fundamental frequency identified using Fast Fourier
Transform (FFT) techniques. The vibrations damp out rapidly, therefore self-initiating data
5 - 12

acquisition is not used; either 256 or 512 data points are used in the FFT. At least three tests
were conducted on each disk.
5.4.3.3 Segregation and Bleeding - Differences in or evidence of segregation due to
vibration was examined for selected mixtures by determining both the differences in unit weight
and dynamic modulus of concrete disks along the depth of the cylinders, or by visual
examination of cylinders split longitudinally.
5.4.3.4 Air Permeability Index - Permeability of the concrete was characterized using the
air permeability index (API). Whiting [1981] has shown that gas permeability measures give a
comparable classification of concrete permeability to other more time consuming tests such as
ponding tests, chloride penetration as measured electrically, or sorptivity based test methods.
The API involves measuring the time required for a volume of air to permeate through a concrete
disk due to differences in pressure on the opposite faces of the disk (a falling head permeameter).
The test was conducted in accordance with the procedures established by Schonlin and Hilsdorf
[1988]. A concrete disk approximately 25 mm (1in.) thick is air dried for at least 7 days prior to
testing to avoid blocking pores with moisture. Dilek, Leming, and Guth [2004] note that the
same disk used in dynamic modulus testing can be used in air permeability testing, reducing
scatter in correlations between permeability and mechanical properties.
The procedure involves applying a vacuum to one side of the disk and recording the time
for a given change in pressure. The air permeability index is based on Boyle-Marriotte's law and
is calculated as shown in Equation 5.2.
5 - 13
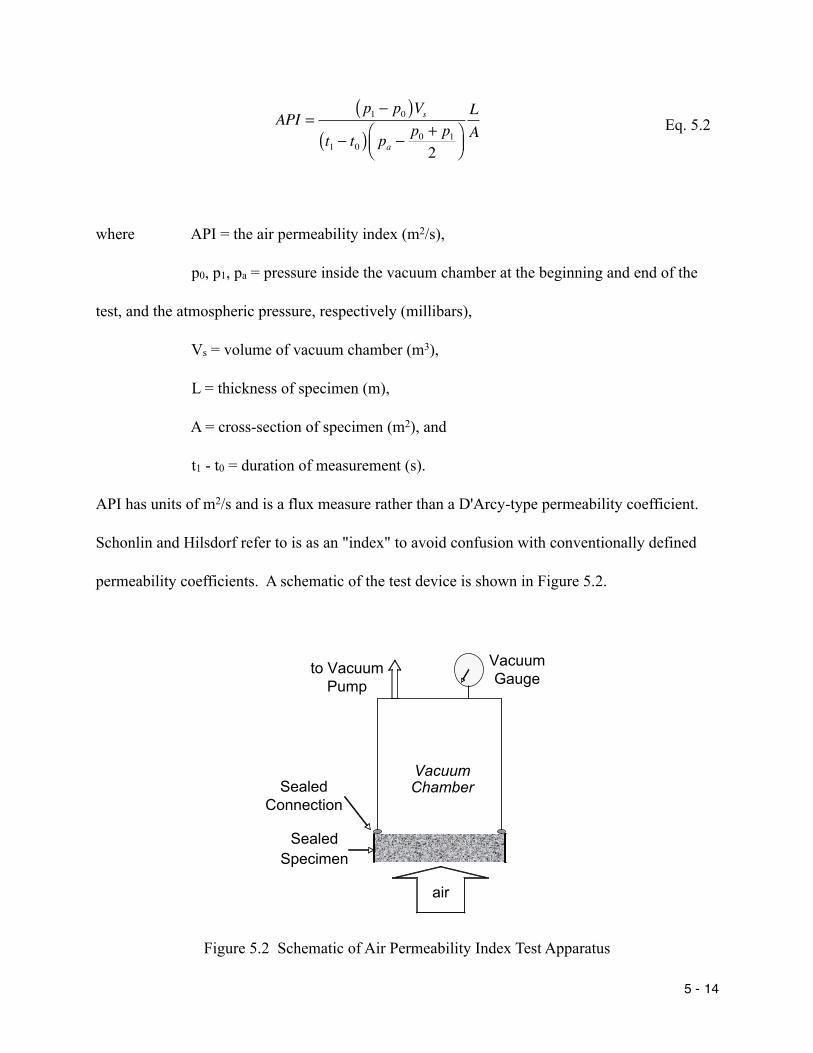
API =p1 − p0( )Vs
t1 − t0( ) pa −p0 + p12
⎛⎝⎜
⎞⎠⎟
LA
where API = the air permeability index (m2/s),
p0, p1, pa = pressure inside the vacuum chamber at the beginning and end of the
test, and the atmospheric pressure, respectively (millibars),
Vs = volume of vacuum chamber (m3),
L = thickness of specimen (m),
A = cross-section of specimen (m2), and
t1 - t0 = duration of measurement (s).
API has units of m2/s and is a flux measure rather than a D'Arcy-type permeability coefficient.
Schonlin and Hilsdorf refer to is as an "index" to avoid confusion with conventionally defined
permeability coefficients. A schematic of the test device is shown in Figure 5.2.
VacuumChamber
SealedSpecimen
VacuumGauge
to VacuumPump
SealedConnection
air
Figure 5.2 Schematic of Air Permeability Index Test Apparatus
5 - 14
Eq. 5.2
The volume of the steel test chamber is approximately 650 ml; the volume of each
chamber was determined individually using mass of water held by the chamber. The chamber is
sealed to the sawed face of the concrete disk using a thin strip of soft clay. The original, outside
surface of the disk is sealed with 2 layers of heavy, plastic tape to eliminate air flow through the
sides. This method of specimen preparation was quick and was found to provide the same
measured air permeability index as an epoxy seal.
Testing is conducted by applying a vacuum to the chamber which will firmly seated the
chamber to the disk. Once a stable vacuum is obtained, the valve to the vacuum pump is closed
and the time required for the pressure to fall from 924 millibars (28.0 inches Hg) to 891 millibars
(27.0 inches Hg) determined. The test is conducted three times for each specimen.
5 - 15
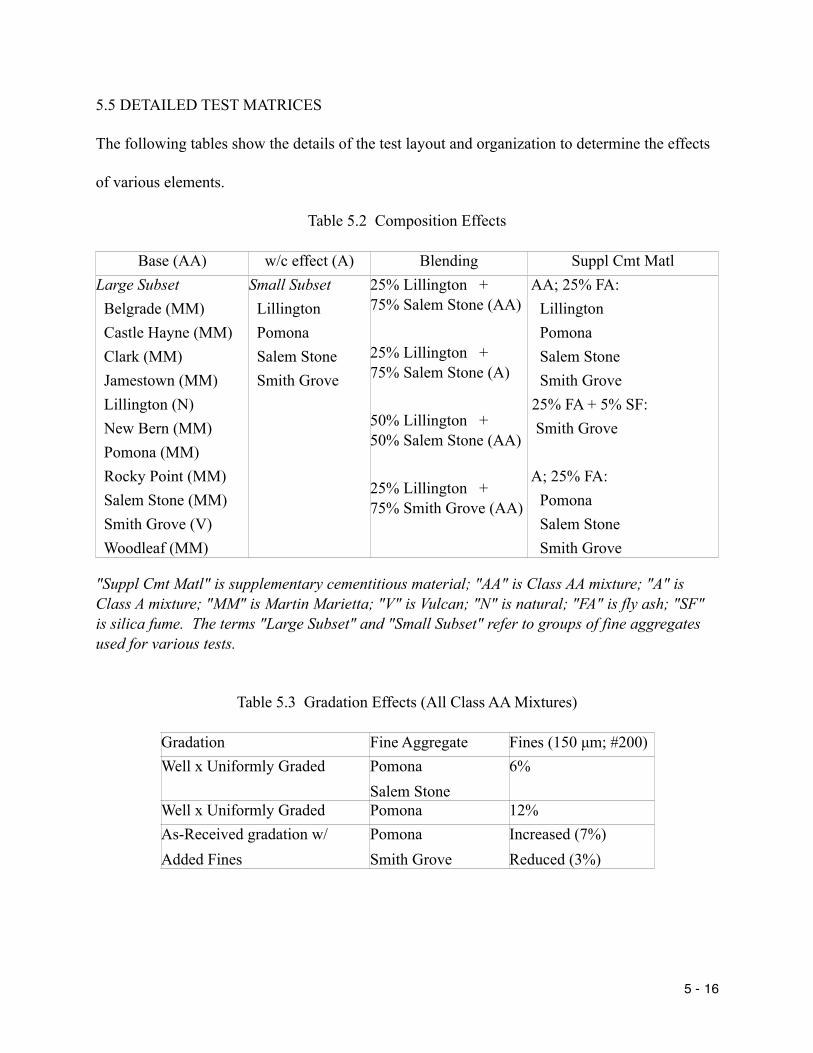
5.5 DETAILED TEST MATRICES
The following tables show the details of the test layout and organization to determine the effects
of various elements.
Table 5.2 Composition Effects
Base (AA) w/c effect (A) Blending Suppl Cmt MatlLarge Subset Belgrade (MM) Castle Hayne (MM) Clark (MM) Jamestown (MM) Lillington (N) New Bern (MM) Pomona (MM) Rocky Point (MM) Salem Stone (MM) Smith Grove (V) Woodleaf (MM)
Small Subset Lillington Pomona Salem Stone Smith Grove
25% Lillington + 75% Salem Stone (AA)
25% Lillington + 75% Salem Stone (A)
50% Lillington + 50% Salem Stone (AA)
25% Lillington + 75% Smith Grove (AA)
AA; 25% FA: Lillington Pomona Salem Stone Smith Grove 25% FA + 5% SF: Smith Grove
A; 25% FA: Pomona Salem Stone Smith Grove
"Suppl Cmt Matl" is supplementary cementitious material; "AA" is Class AA mixture; "A" is Class A mixture; "MM" is Martin Marietta; "V" is Vulcan; "N" is natural; "FA" is fly ash; "SF" is silica fume. The terms "Large Subset" and "Small Subset" refer to groups of fine aggregates used for various tests.
Table 5.3 Gradation Effects (All Class AA Mixtures)
Gradation Fine Aggregate Fines (150 µm; #200)Well x Uniformly Graded Pomona
Salem Stone6%
Well x Uniformly Graded Pomona 12%As-Received gradation w/Added Fines
Pomona Smith Grove
Increased (7%)Reduced (3%)
5 - 16

Table 5.4a Schedule of Specimens, Mixing, and Vibration for Small Subset of Aggregates
Number Size (in) Vibration Mixing Test33
2
22
4 x 84 x 8
4 x 8
3 x 4 x 163 x 4 x 16
Standard RoutineRoutine
Extended
RoutineExtended
Compressive strength; 14 daysCompressive strength; 28 days
Compressive strength; 28 days
Flexural strength; 14 daysFlexural strength; 14 days
2
2
4 x 8
4 x 8
Extended Routine 1 cylinder (each set) sawed longitudinally for visual examination
1 cylinder (each set) sawed transversely into 1" thick disks for dynamic modulus, unit weight, and air permeability
2 9 x 8 x 3 Standard Routine Frost durability (C 672)
"Extended mixing" - cast 45 minutes after cement and water are first mixed, kept at agitate speed after initial mixing; "Routine mixing" - cast within 10 minutes after cement and water are first mixed; "Standard vibration" is 30 seconds; "Extended vibration" is 60 seconds.
Table 5.4b Schedule of Specimens, Mixing, and Vibration for Large Subset of Aggregates
Number Size (in) Vibration Mixing Test2
3
4 x 8
4 x 8
Standard Routine Compressive strength; 14 days
Compressive strength; 28 days1
1
4 x 8
4 x 8
Standard
Extended
Routine Cylinders sawed transversely into 1" thick disks for dynamic modulus, unit wt, and air permeability
2 9 x 8 x 3 Standard Routine Deicer Salt Scaling (Frost) Resistance (C 672)
"Extended mixing" - cast 45 minutes after cement and water are first mixed, kept at agitate speed after initial mixing; "Routine mixing" - cast within 10 minutes after cement and water are first mixed; "Standard vibration" is 30 seconds; "Extended vibration" is 60 seconds. The table also applies to modified fines mixtures.
5 - 17

Table 5.5a Miscellaneous Tests - Composition: Total Aggregate Gradation, and Shrinkage
Test AggregatesShrinkage Pomona
Salem StoneGradation: 8-18Gradation: near 8-18
Lillington + #78M and #57 (Garner)
Alt Frost Durability Test Belgrade (AA); Castle Hayne (AA); Clark (AA); Jamestown (AA); Lillington (AA, A, AA w/ FA); New Bern (AA); Pomona (AA, A, AA w/ 7% stone dust); Rocky Point (AA); Salem Stone (AA, A); Smith Grove (AA, A, AA w/ 3% stone dust); Woodleaf (AA)
Table 5.5b Miscellaneous Test Specimen Schedule
Number Size (in) Test4
3
4 x 8
3 x 4 x 16
Compressive strength; 28 days
Flexural strength; 14 days2
2
4 x 8
4 x 8
Both cylinders (each set) sawed transversely into 1" thick disks for dynamic modulus, unit weight, and air permeability
3 4 x 1 Alternate Salt Scaling Test
All specimens cast after "Routine mixing" and standard consolidation.
5.6 STATISTICAL ANALYSIS
Statistical analysis was conducted to identify the dominant effects contributing to frost
durability and other factors of interest such as water demand in the concrete mixtures examined
in this study, and to determine the relative strength of those factors. The general approach was to
conduct a conventional, stepwise, backward linear regression process. In this process, the
maximum number of independent parameters are used in a linear regression to model the
dependent variable of interest. The least significant parameter is then eliminated from the
5 - 18

independent variable set and a new regression is conducted with the new, reduced parameter
model. The reduction in the independent variable set is continued until all the remaining
independent variables are statistically significant, or the model is shown to be poor, that is, the
regression coefficient (r2) is too small.
This technique must be used with caution. This technique assumes a linear combination
of variables although the variables themselves can be non-linear or they can be transformed. In
this study, all variables were used without being transformed. The sufficiency of this approach
was verified by plotting each significant independent variable against the dependent variable and
confirming at least an approximate linear dependence. This check also provided an opportunity
to overcome another concern.
Backward stepwise regression by itself does not guarantee the best model. For example,
there is no theoretical guarantee that the first variable eliminated would not eventually become
statistically significant if left in. As a practical matter, the technique does result in the best model
possible out of the initial set of independent variables in the vast majority of trials, but a number
of checks must be used to verify the model. A simple check is to plot each independent variable
against the dependent variable. Those variables that indicate a strong dependence should show
up in the final, regressed model. Another check requires that once a final, or base model has
been obtained, an additional regression is conducted using the base model plus each of the non-
included independent variables, added one at a time. If the variables remain significant, a new
best model has been developed which must then be checked again. If the model is not improved,
the previous model may be assumed to be the best given the available variables. In this study,
5 - 19

the models examined which were obtained from stepwise backward regression were all checked
using both techniques.
Another limitation with this technique can be the degrees of freedom available compared
with the number of independent variables of interest. The regression must have at least one
degree of freedom mathematically. Models with very small degrees of freedom provide
unrealistically high correlations and are unreliable. Compounding this limitation is the
possibility of interactions between different parameters. When an interaction term is necessary,
an additional variable, the product of two independent variables, is added to the model, further
reducing the degrees of freedom.
Due to the large number of potential parameters and the limited degrees of freedom, these
potential problems were mitigated by selecting characteristic parameters from each class of
potential predictor variables and by conducting only minimal testing for interaction effects
outside a rational selection of parameters based on physical models. It was important to include
as many potential independent variables as possible in this analysis but to also eliminate
parameters which were clearly less promising. Additional research would improve the ability to
identify and characterize possible interaction effects. This issue is discussed in more detail in
subsequent sections.
5 - 20

CHAPTER 6FRESH AND MECHANICAL PROPERTIES OF CONCRETE
The fresh and hardened concrete characteristics, and the relationships between those
characteristics, are reviewed in this chapter before examining frost resistance since at least some
of these characteristics were expected to affect frost resistance, a priori.
6.1 FRESH CONCRETE PROPERTIES
6.1.1 Overview
Fresh concrete properties are summarized in Tables 6.1. Although the water demand was
higher for concrete mixtures containing manufactured sand than for those with natural sand,
workability acceptable for paving and surface course applications was obtained for all mixtures
by using appropriate quantities of water reducing admixtures. The required total air content
could be produced and maintained with routine effort. The effects of prolonged mixing were
similar to those for other paving mixtures without manufactured sand. In summary, no evidence
was found to cause concern with the use of manufactured sand in NCDOT concrete mixtures,
based on the properties of the fresh concrete.
6 - 1
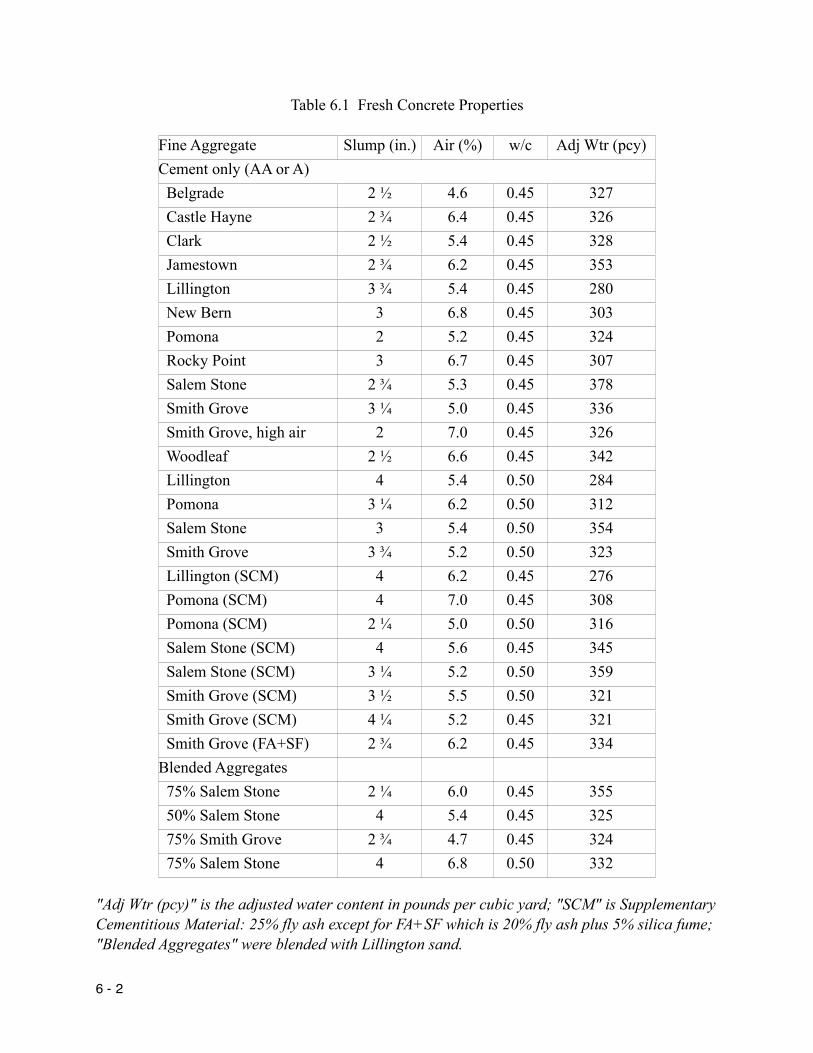
Table 6.1 Fresh Concrete Properties
Fine Aggregate Slump (in.) Air (%) w/c Adj Wtr (pcy)Cement only (AA or A) Belgrade 2 ½ 4.6 0.45 327 Castle Hayne 2 ¾ 6.4 0.45 326 Clark 2 ½ 5.4 0.45 328 Jamestown 2 ¾ 6.2 0.45 353 Lillington 3 ¾ 5.4 0.45 280 New Bern 3 6.8 0.45 303 Pomona 2 5.2 0.45 324 Rocky Point 3 6.7 0.45 307 Salem Stone 2 ¾ 5.3 0.45 378 Smith Grove 3 ¼ 5.0 0.45 336 Smith Grove, high air 2 7.0 0.45 326 Woodleaf 2 ½ 6.6 0.45 342 Lillington 4 5.4 0.50 284 Pomona 3 ¼ 6.2 0.50 312 Salem Stone 3 5.4 0.50 354 Smith Grove 3 ¾ 5.2 0.50 323 Lillington (SCM) 4 6.2 0.45 276 Pomona (SCM) 4 7.0 0.45 308 Pomona (SCM) 2 ¼ 5.0 0.50 316 Salem Stone (SCM) 4 5.6 0.45 345 Salem Stone (SCM) 3 ¼ 5.2 0.50 359 Smith Grove (SCM) 3 ½ 5.5 0.50 321 Smith Grove (SCM) 4 ¼ 5.2 0.45 321 Smith Grove (FA+SF) 2 ¾ 6.2 0.45 334Blended Aggregates 75% Salem Stone 2 ¼ 6.0 0.45 355 50% Salem Stone 4 5.4 0.45 325 75% Smith Grove 2 ¾ 4.7 0.45 324 75% Salem Stone 4 6.8 0.50 332
"Adj Wtr (pcy)" is the adjusted water content in pounds per cubic yard; "SCM" is Supplementary Cementitious Material: 25% fly ash except for FA+SF which is 20% fly ash plus 5% silica fume; "Blended Aggregates" were blended with Lillington sand.
6 - 2
6.1.2 Results and Discussion of the Adjusted Water Demand Model
The effects of manufactured sand on water demand as measured by slump were analyzed
using conventional statistical techniques and engineering insight. The water demand was
adjusted using relatively crude, but commonly used heuristics (see Chapter 5) to account for
slight differences in slump, air content and water reducing, retarding admixtures. The purpose of
this analysis was not to develop a predictor of behavior, but to develop a model providing insight
into the effects of different sand characteristics, especially those that might affect frost resistance.
The adjusted water demand model for 17, Class AA mixtures is given below. The analysis was
limited to these mixtures to eliminate any possible effects of blending and supplementary
cementitious materials, which are discussed separately, below.
Two mixtures with adjusted fines content were also included. The quantity of material
passing the 75 µm (#200) sieve ("rock dust") was manually modified for two sands. The rock
dust in the Smith Grove sand was reduced to 3% from 5.5% of the as-received gradation while
the rock dust in the Pomona was increased to 7% from the 3.1% in the as-received gradation.
AWD (pcy) = -149 + 8.16V(A) + -18.5FM + 0.364D Eq. 6.1
where AWD is Adjusted Water Demand in (kg/m3) (r2 = 0.92),
Vs is the standard (Method A) Void content (%) (std err = 1.01),
FM is the Fineness Modulus (std err = 8.31), and
D is the material passing the 75 µm (#200) sieve (kg/m3) (std err = 0.121).
The standard error (std err) of the intercept is 65.5.
6 - 3
The void content using Method A (Standard Gradation) was a significant parameter in all
the statistical water demand models examined. The gradation for this method does not contain
any material finer than the 150 µm (#100) sieve and so is a bulk measure of angularity of coarser
sand particles. It was initially anticipated that using the voids in the sand at the as-received
gradation (Method C) might combine both effects, but the void content determined using Method
C was not found to be an effective predictor of water demand.
The statistically developed model strongly suggest that for practical gradations, and the
fines contents and gradations permitted by NCDOT 2 MS Specification, the primary effects on
water demand are angularity and to a lesser extent, fineness of the sand as represented by
Fineness Modulus and quantity of material passing the 75µm (#200) sieve per unit volume. The
FM contribution was not expected to be as strong as was found. These findings contributed to
the investigation of gradation effects discussed later.
The model and the adjusted water demand are shown in Figure 6.1. As is evident in the
figure, the relatively high r2 value is due in part to the effects of natural sand on the results. Even
excluding the natural sand, there is still a strong, apparently linear, relationship, but with
considerable scatter. The scatter may be related at least in part to the approximations used to
adjust for differences in air, slump and water reducing admixture.
Method C voids normalized for angularity by dividing with Method A voids, and the
slope of the cumulative percent passing gradation curve of the sand also failed to be a significant
predictive variable. Similarly to mortar test results, gradation and packing characteristics of the
fine aggregate did not significantly affect the water demand of concrete. The void content
determined using Method A was a significant parameter in the water demand model. The
6 - 4

gradation for Method A sample does not contain any material finer than the 150 µm (#100) sieve
and is therefore a bulk measure of angularity of coarser sand particles. This implies that
angularity of the coarser sand particles is the dominant effect on water demand in these mixtures.
160
170
180
190
200
210
220
160 180 200 220Water Demand (adjusted)
Wat
er D
eman
d (e
stim
ated
)
Lillington
Figure 6.1 Adjusted Water Demand
Fineness modulus is calculated using sieve sizes larger than 150 µm (#100); a higher FM
is a coarser material. Fineness modulus was near the limit of being statistically significant and
provided differentiation between the distribution of sand particles larger than 150 µm (#100).
The slope of the FM term in the regression model indicated that particle distributions that were
finer would have a higher water demand compared to sands with a coarser particle distribution.
6 - 5
The quantity of fine particles smaller than 75 µm (#200) in the mixture was also found to be
statistically significant but was a secondary contributor to water demand. The quantity of fines
influences water demand due to the high surface area, which is consistent with the findings of the
mortar testing phase of this study.
Blending low angularity natural sand reduced high water demand of manufactured sands.
Blending sands will yield a weighted average effect on gradation, fines content, and void
content; the intermediate water demand of blended sand mixtures was consistent with
expectations and the model. Regardless of sand source and class of concrete, the effects of
blending on water demand were roughly proportional to the quantities and water demands of the
blended sands, although, very importantly, the water demand of the blend was better (lower) than
expected on a strictly proportional basis. Not only did blending improve the water demand more
than expected, the improvement was disproportionately better with higher water demand sand.
These findings suggest that for practical gradations, and the fines contents permitted in
the 2MS specification, the primary effects on water demand are angularity as measured by the
standard void content and, to a lesser extent, the fines content, particularly the stone dust
fraction. No statistically significant interaction term was found between fines and voids with
these mixtures. This suggests that the limit on stone dust specified for 2MS sands can be
adjusted based on water demand alone, and that other factors do not necessarily have to be
included in any adjustment. This issue is discussed in more detail after review of the frost
durability data.
6 - 6

6.1.3 Discussion of Other Contributing Factors
6.1.3.1 Effects of Cement Content on Water Demand - Water demand is insensitive to the
w/c ratio for most commercial grades of concrete, that is, when the w/c ratio is not less than
about 0.40 - 0.45. Lower water cement ratios can cause an increase in water demand due to the
large quantity of cement required to meet the low w/c. Differences in water demand of pairs of
mixtures with a w/c ratio of 0.45 (Class AA) and a w/c ratio of 0.50 (Class A), produced using
selected sands (Lillington, Pomona, Salem Stone and Smith Grove), without blending or the use
of supplementary cementitious material, were examined.
The pair of mixtures with Lillington sand, which has a relatively low water demand, had
identical adjusted water demands at both w/c ratios. For the sets of pairs with higher water
demand, the adjusted water demand increased for the Class AA mixtures. In addition, the higher
the adjusted water demand for the "Class A" type mixture, the greater the increase in water
demand for the "Class AA" type mixtures. Manufactured sands in this study had high water
demands compared to the natural sand and were observed to be very sticky mixtures especially at
high water contents and, therefore high cement contents. The Salem Stone and Pomona mixtures
exhibited a slight increase in water demand from 0.50 to 0.45 w/c. The water demand of the
Smith Grove mixtures increased considerably for the lower w/c ratio. These findings are
consistent with the greater surface area associated with an increase in cement content. These
problems can be overcome in practice by using higher dosages of water reducing admixtures.
6.1.3.2 Effects of Fly Ash on Water Demand - Fly ash replacement increases the volume
of cementitious material per unit volume, especially when used in a replacement ratio of 1.2 to
1.3 (mass of ash to mass of portland cement) due to the lower specific gravity of the fly ash but
6 - 7
the surface area may not be as great as the same volume of cement. Fly ash also has a less
chemically active surface than portland cement while the concrete is fresh. Fly ash can
sometimes be used to reduce the water demand of high strength concretes with a very low w/c
ratio by substituting for a portion of the portland cement.
Fly ash was found to have no effect on the water demand of mixtures with low to
moderate water demands. The use of fly ash was found to reduce water demand in mixtures with
very high cement contents, however. For the Salem Stone and Smith Grove Class AA mixtures
the fly ash improved the workability both as measured by slump for a given water demand and
visually. The inclusion of a relatively small quantity of silica fume increased the water demand
somewhat. These findings are consistent with numerous previous studies.
6.1.4 Factors with Marginal Effects
6.1.4.1 Alternative Test Methods - Interestingly, the mortar flow tests, which were
anticipated to be good predictors of concrete water demand failed to be statistically significant.
This finding is probably related to two factors. First, both mortar flow and mini-slump are
strongly affected by, and therefore strongly correlated with, sand angularity. The sand angularity
dominated the adjusted water demand for the concrete; the mortar tests provide little additional
information. Effects which are correlations of primary factors generally have much less power
than the original factor in a statistically based model. Since mortar tests are relatively well
correlated with angularity, which is the primary contributor to adjusted water demand, these tests
can be used as general indicators of water demand as preliminary screening tools, however.
6 - 8
The other possible contributing factor is that the mortar flow is a semi-dynamic test
necessarily conducted on relatively fluid materials. The concretes evaluated in this study all had
lower slumps consistent with paving mixtures where particle interaction is more important than
paste fluidity. The other semi-dynamic test method, DIN flow, was found to provide little, if any
additional information regarding the workability of the mixtures tested. This may also be due, at
least in part, to the relatively low slumps of the mixtures used in this study, which were typical to
slightly higher than those of mixtures commonly used for paving and bridge surface courses.
6.1.4.2 Comparison of Angularity Measures - The bulk angularity measure, % voids, was
a better predictor variable than the individual particle angularity measures and the angularity
term was stronger than the fines term in the regression equation (Eq. 6.1). The relationship
between individual and bulk angularity measures of manufactured sands has already been
discussed. In order to gain additional insight into the possible effects of different aspects of
angularity, a closer comparison of the effects of bulk and particle based angularity measures
alone on water demand was conducted, however. Table 6.2 shows the correlation matrix for
various particle based and bulk measures of sand with adjusted water demand for the 0.45 w/c
ratio mixtures.
6 - 9
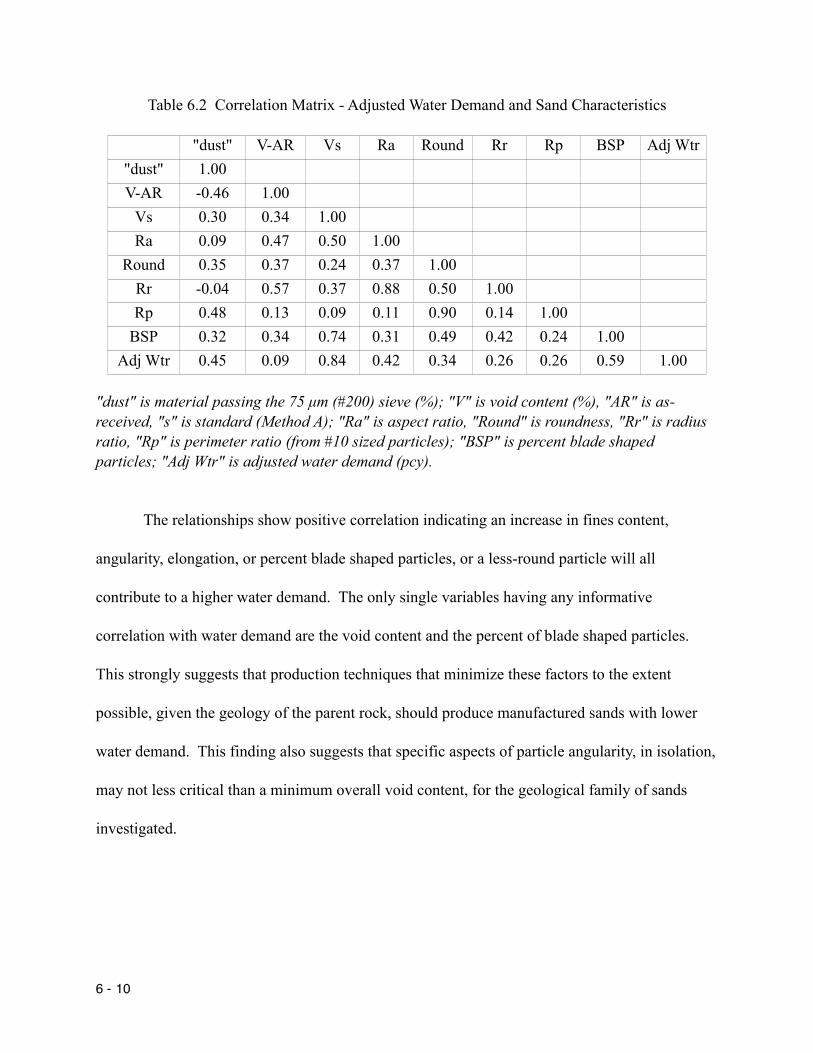
Table 6.2 Correlation Matrix - Adjusted Water Demand and Sand Characteristics
"dust" V-AR Vs Ra Round Rr Rp BSP Adj Wtr"dust" 1.00V-AR -0.46 1.00
Vs 0.30 0.34 1.00Ra 0.09 0.47 0.50 1.00
Round 0.35 0.37 0.24 0.37 1.00Rr -0.04 0.57 0.37 0.88 0.50 1.00Rp 0.48 0.13 0.09 0.11 0.90 0.14 1.00
BSP 0.32 0.34 0.74 0.31 0.49 0.42 0.24 1.00Adj Wtr 0.45 0.09 0.84 0.42 0.34 0.26 0.26 0.59 1.00
"dust" is material passing the 75 µm (#200) sieve (%); "V" is void content (%), "AR" is as-received, "s" is standard (Method A); "Ra" is aspect ratio, "Round" is roundness, "Rr" is radius ratio, "Rp" is perimeter ratio (from #10 sized particles); "BSP" is percent blade shaped particles; "Adj Wtr" is adjusted water demand (pcy).
The relationships show positive correlation indicating an increase in fines content,
angularity, elongation, or percent blade shaped particles, or a less-round particle will all
contribute to a higher water demand. The only single variables having any informative
correlation with water demand are the void content and the percent of blade shaped particles.
This strongly suggests that production techniques that minimize these factors to the extent
possible, given the geology of the parent rock, should produce manufactured sands with lower
water demand. This finding also suggests that specific aspects of particle angularity, in isolation,
may not less critical than a minimum overall void content, for the geological family of sands
investigated.
6 - 10
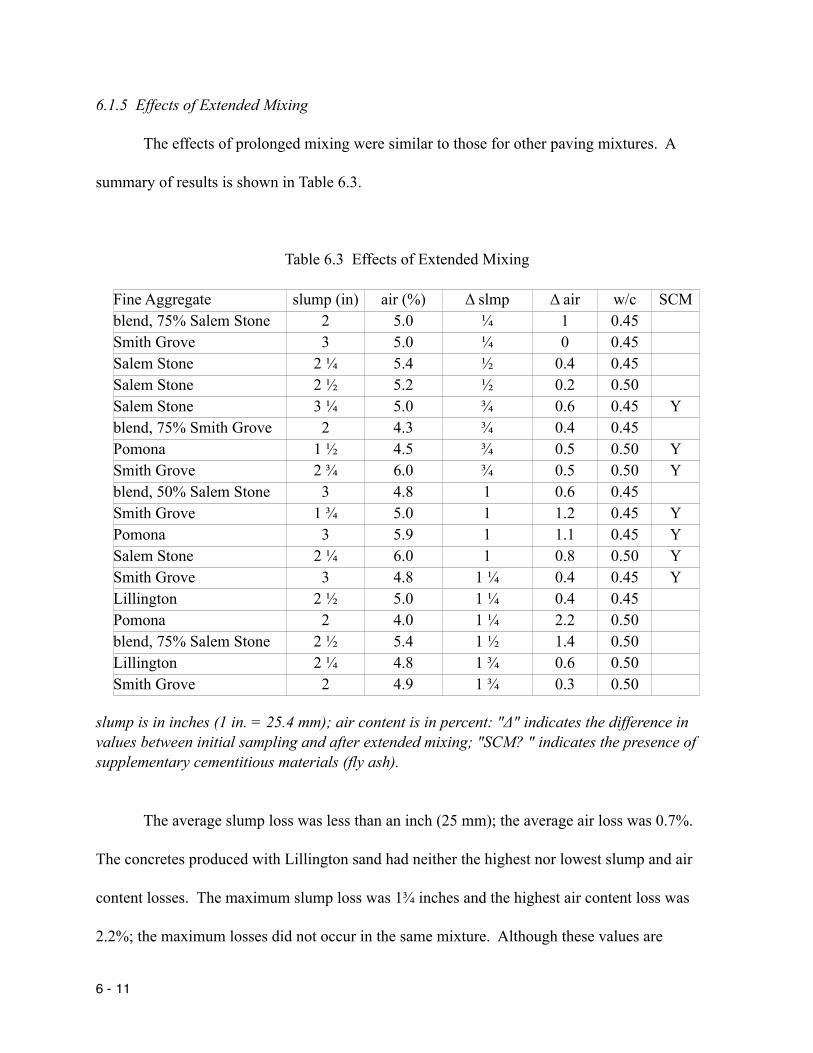
6.1.5 Effects of Extended Mixing
The effects of prolonged mixing were similar to those for other paving mixtures. A
summary of results is shown in Table 6.3.
Table 6.3 Effects of Extended Mixing
Fine Aggregate slump (in) air (%) Δ slmp Δ air w/c SCMblend, 75% Salem Stone 2 5.0 ¼ 1 0.45Smith Grove 3 5.0 ¼ 0 0.45Salem Stone 2 ¼ 5.4 ½ 0.4 0.45Salem Stone 2 ½ 5.2 ½ 0.2 0.50Salem Stone 3 ¼ 5.0 ¾ 0.6 0.45 Yblend, 75% Smith Grove 2 4.3 ¾ 0.4 0.45Pomona 1 ½ 4.5 ¾ 0.5 0.50 YSmith Grove 2 ¾ 6.0 ¾ 0.5 0.50 Yblend, 50% Salem Stone 3 4.8 1 0.6 0.45Smith Grove 1 ¾ 5.0 1 1.2 0.45 YPomona 3 5.9 1 1.1 0.45 YSalem Stone 2 ¼ 6.0 1 0.8 0.50 YSmith Grove 3 4.8 1 ¼ 0.4 0.45 YLillington 2 ½ 5.0 1 ¼ 0.4 0.45Pomona 2 4.0 1 ¼ 2.2 0.50blend, 75% Salem Stone 2 ½ 5.4 1 ½ 1.4 0.50Lillington 2 ¼ 4.8 1 ¾ 0.6 0.50Smith Grove 2 4.9 1 ¾ 0.3 0.50
slump is in inches (1 in. = 25.4 mm); air content is in percent: "Δ" indicates the difference in values between initial sampling and after extended mixing; "SCM? " indicates the presence of supplementary cementitious materials (fly ash).
The average slump loss was less than an inch (25 mm); the average air loss was 0.7%.
The concretes produced with Lillington sand had neither the highest nor lowest slump and air
content losses. The maximum slump loss was 1¾ inches and the highest air content loss was
2.2%; the maximum losses did not occur in the same mixture. Although these values are
6 - 11

somewhat high, (1) the extended mixing regime was severe, (2) a slump loss of 1 inch or less
occurred in two-thirds of the mixtures, and (3) a loss of 1% or less occurred in over three-
quarters of the mixtures. The values for all mixtures was consistent with expectations for
conventional concrete.
Analysis found that the slump loss tended to be slightly higher with higher w/c, but the
relationship was statistically very weak. The slump and air losses were not related to either
initial slump or initial air content. Kosmatka and Panarese [1990] report that fine aggregates
with a low fines content and a more uniform particle distribution will typically have a less stable
air void system. No correlation was found between slump loss and air loss, and no correlation
was found between slump loss or air loss and either the void content of the sand or the percent
passing the 75 µm (#200) sieve, however.
6.2 MECHANICAL PROPERTIES OF MANUFACTURED SAND CONCRETE
The mechanical properties of concrete mixtures in this study are summarized in Tables 6.4a,
6.4b, and 6.4c (tables are duplicated to shown SI and Us customary units separately). In general,
mechanical properties indicated the concrete mixtures could be used successfully by the North
Carolina Department of Transportation. The relationships between compressive strength, elastic
modulus, and modulus of rupture were comparable to those found with other concrete mixtures
produced with the Garner coarse aggregate. Differences in mechanical properties due to
extended mixing time were similar to those for comparable mixtures made with natural sands.
6 - 12
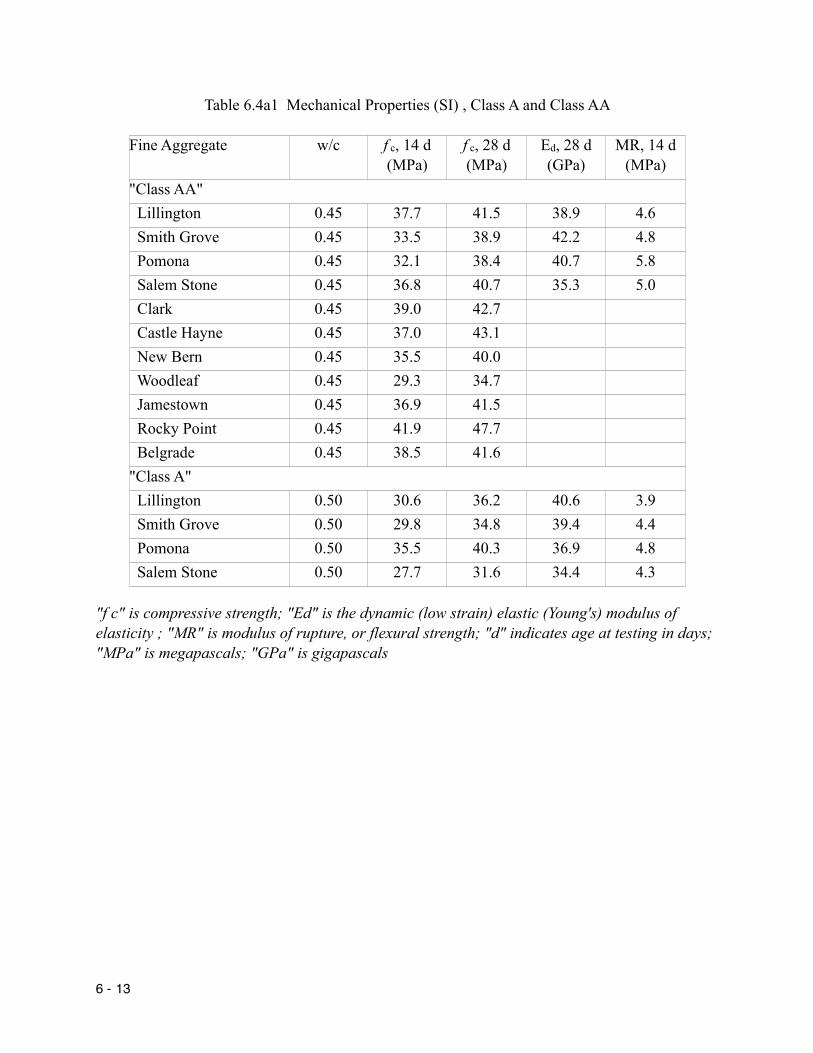
Table 6.4a1 Mechanical Properties (SI) , Class A and Class AA
Fine Aggregate w/c f c, 14 d (MPa)
f c, 28 d (MPa)
Ed, 28 d (GPa)
MR, 14 d (MPa)
"Class AA" Lillington 0.45 37.7 41.5 38.9 4.6 Smith Grove 0.45 33.5 38.9 42.2 4.8 Pomona 0.45 32.1 38.4 40.7 5.8 Salem Stone 0.45 36.8 40.7 35.3 5.0 Clark 0.45 39.0 42.7 Castle Hayne 0.45 37.0 43.1 New Bern 0.45 35.5 40.0 Woodleaf 0.45 29.3 34.7 Jamestown 0.45 36.9 41.5 Rocky Point 0.45 41.9 47.7 Belgrade 0.45 38.5 41.6"Class A" Lillington 0.50 30.6 36.2 40.6 3.9 Smith Grove 0.50 29.8 34.8 39.4 4.4 Pomona 0.50 35.5 40.3 36.9 4.8 Salem Stone 0.50 27.7 31.6 34.4 4.3
"f c" is compressive strength; "Ed" is the dynamic (low strain) elastic (Young's) modulus of elasticity ; "MR" is modulus of rupture, or flexural strength; "d" indicates age at testing in days; "MPa" is megapascals; "GPa" is gigapascals
6 - 13

Table 6.4a2 Mechanical Properties (US), Class A and Class AA
Fine Aggregate w/c f c, 14 d (psi)
f c, 28 d (psi)
Ed, 28 d (Mpsi)
MR, 14 d (psi)
"Class AA" Lillington 0.45 5470 6020 5.64 670 Smith Grove 0.45 4860 5640 6.12 690 Pomona 0.45 4660 5570 5.90 840 Salem Stone 0.45 5340 5900 5.12 720 Clark 0.45 5660 6190 Castle Hayne 0.45 5370 6250 New Bern 0.45 5150 5800 Woodleaf 0.45 4250 5030 Jamestown 0.45 5350 6020 Rocky Point 0.45 6080 6920 Belgrade 0.45 5580 6030"Class A" Lillington 0.50 4440 5250 5.89 570 Smith Grove 0.50 4320 5050 5.72 640 Pomona 0.50 5150 5840 5.35 690 Salem Stone 0.50 4020 4580 4.99 620
"f c" is compressive strength; "Ed" is the dynamic (low strain) elastic (Young's) modulus of elasticity ; "MR" is modulus of rupture, or flexural strength; "d" indicates age at testing in days; "psi" is pounds per square inch; "Mpsi" is million pounds per square inch
6 - 14
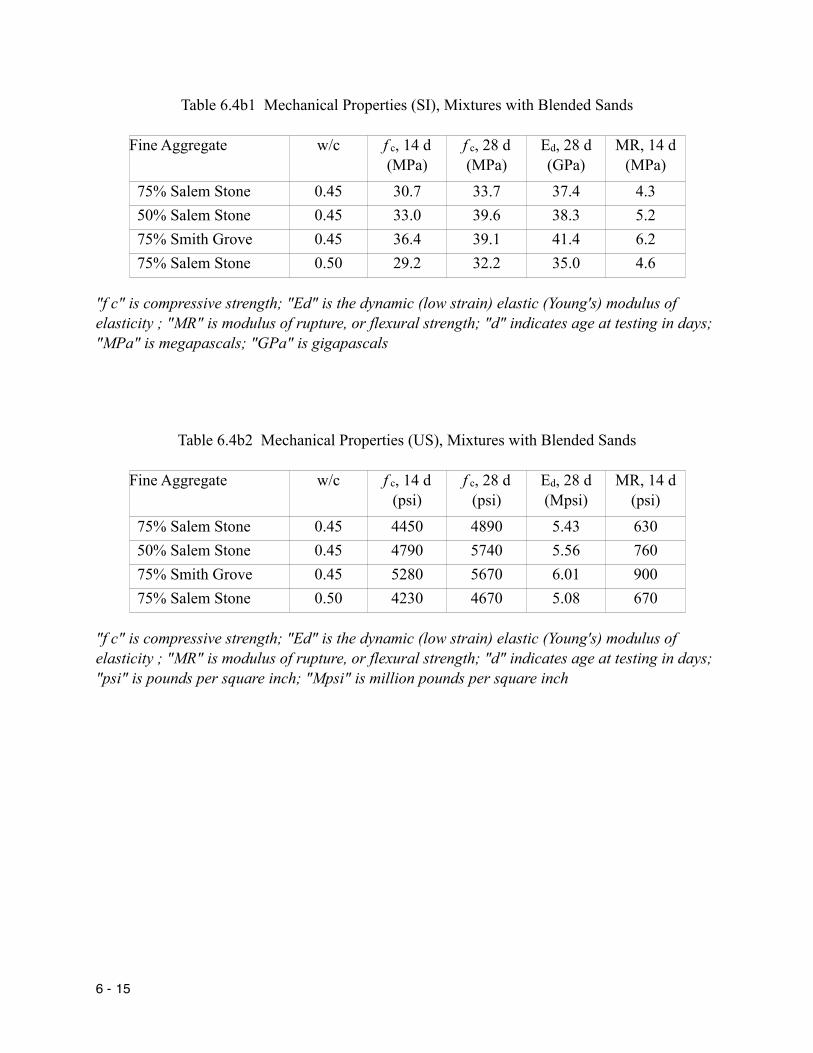
Table 6.4b1 Mechanical Properties (SI), Mixtures with Blended Sands
Fine Aggregate w/c f c, 14 d (MPa)
f c, 28 d (MPa)
Ed, 28 d (GPa)
MR, 14 d (MPa)
75% Salem Stone 0.45 30.7 33.7 37.4 4.3 50% Salem Stone 0.45 33.0 39.6 38.3 5.2 75% Smith Grove 0.45 36.4 39.1 41.4 6.2 75% Salem Stone 0.50 29.2 32.2 35.0 4.6
"f c" is compressive strength; "Ed" is the dynamic (low strain) elastic (Young's) modulus of elasticity ; "MR" is modulus of rupture, or flexural strength; "d" indicates age at testing in days; "MPa" is megapascals; "GPa" is gigapascals
Table 6.4b2 Mechanical Properties (US), Mixtures with Blended Sands
Fine Aggregate w/c f c, 14 d (psi)
f c, 28 d (psi)
Ed, 28 d (Mpsi)
MR, 14 d (psi)
75% Salem Stone 0.45 4450 4890 5.43 630 50% Salem Stone 0.45 4790 5740 5.56 760 75% Smith Grove 0.45 5280 5670 6.01 900 75% Salem Stone 0.50 4230 4670 5.08 670
"f c" is compressive strength; "Ed" is the dynamic (low strain) elastic (Young's) modulus of elasticity ; "MR" is modulus of rupture, or flexural strength; "d" indicates age at testing in days; "psi" is pounds per square inch; "Mpsi" is million pounds per square inch
6 - 15
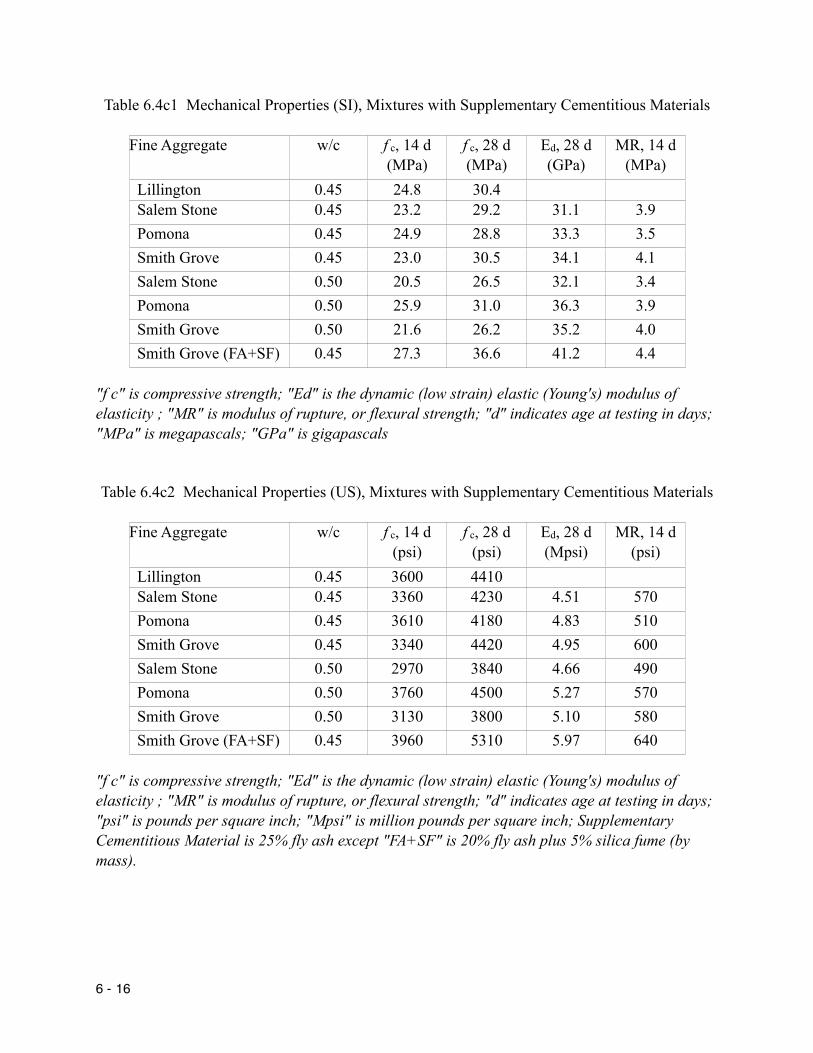
Table 6.4c1 Mechanical Properties (SI), Mixtures with Supplementary Cementitious Materials
Fine Aggregate w/c f c, 14 d (MPa)
f c, 28 d (MPa)
Ed, 28 d (GPa)
MR, 14 d (MPa)
Lillington 0.45 24.8 30.4 Salem Stone 0.45 23.2 29.2 31.1 3.9 Pomona 0.45 24.9 28.8 33.3 3.5 Smith Grove 0.45 23.0 30.5 34.1 4.1 Salem Stone 0.50 20.5 26.5 32.1 3.4 Pomona 0.50 25.9 31.0 36.3 3.9 Smith Grove 0.50 21.6 26.2 35.2 4.0 Smith Grove (FA+SF) 0.45 27.3 36.6 41.2 4.4
"f c" is compressive strength; "Ed" is the dynamic (low strain) elastic (Young's) modulus of elasticity ; "MR" is modulus of rupture, or flexural strength; "d" indicates age at testing in days; "MPa" is megapascals; "GPa" is gigapascals
Table 6.4c2 Mechanical Properties (US), Mixtures with Supplementary Cementitious Materials
Fine Aggregate w/c f c, 14 d (psi)
f c, 28 d (psi)
Ed, 28 d (Mpsi)
MR, 14 d (psi)
Lillington 0.45 3600 4410 Salem Stone 0.45 3360 4230 4.51 570 Pomona 0.45 3610 4180 4.83 510 Smith Grove 0.45 3340 4420 4.95 600 Salem Stone 0.50 2970 3840 4.66 490 Pomona 0.50 3760 4500 5.27 570 Smith Grove 0.50 3130 3800 5.10 580 Smith Grove (FA+SF) 0.45 3960 5310 5.97 640
"f c" is compressive strength; "Ed" is the dynamic (low strain) elastic (Young's) modulus of elasticity ; "MR" is modulus of rupture, or flexural strength; "d" indicates age at testing in days; "psi" is pounds per square inch; "Mpsi" is million pounds per square inch; Supplementary Cementitious Material is 25% fly ash except "FA+SF" is 20% fly ash plus 5% silica fume (by mass).
6 - 16

6.2.1 Relationships Between Mechanical Properties
The mechanical properties and the relationships between compressive strengths at 14 and
28 days, elastic modulus and compressive strength, both at 28 days, and modulus of rupture and
compressive strength, both at 14 days, were consistent with and comparable to those found with
other concrete mixtures produced with the Garner coarse aggregate.
The compressive strength at 28 days is greater for cement only mixtures than mixtures
containing 25% fly ash at a one-to-one replacement rate, as expected. Fly ash is normally added
at a 1.2 to 1.3 replacement rate, or greater, for comparable 28 day strengths. The average
strength gain between 14 and 28 days was 700 psi (4.8 MPa) for the mixtures without
supplementary cementitious materials and 800 psi (5.5 MPa) for the mixtures containing SCM;
standard deviations were 190 psi and 170 psi (1.3 MPa and 1.2 MPa), respectively. The strength
gain was originally anticipated to be somewhat higher for mixtures with SCM compared to
mixtures without SCM, but is within the range normally found.
The ratio of elastic modulus to square root of compressive strength is often assumed to be
57,000 in US customary units for purposes of estimating deflection or moment distribution. The
average ratio found for these mixtures was about 76,200, slightly more than 30% greater than the
assumed average. Part of this higher average is due to the difference between the dynamic, or
low strain, modulus (Ed) and the static modulus (Ec). Ed is normally about 15% greater than Ec
due to the range of concrete stresses used and the duration of the test. The ratio of 76,200 is
consistent with the results of other studies of the dynamic modulus of concretes produced with
the Garner coarse aggregate.
6 - 17
The ratio of modulus of rupture and the square root of compressive strength is often in
the range of 9 to 11 for conventional paving mixtures. The average ratio in this study, for
concretes at an age of 14 days, was found to be 10, with a standard deviation of 1.0, which is
consistent with expectations, although a slightly higher ratio was originally anticipated due to the
higher modulus of rupture normally found with smaller specimens.
6.2.2 Effects of Water Demand
Compressive strengths at 28 days were found to be a function of water content for similar
mixtures. With both Class A and Class AA mixtures, the higher water content causes a reduction
in strength at the same water cement ratio. This is a well established phenomenon. The
additional water reduces the strength at the transition zone and the higher cement content
required to maintain the w/c leads to more rapid strength development which will typically
reduce long term strengths, all else being equal, due to formation of a less dense matrix. The
correlation between water content and strength is numerically low due to the scatter, but the
trend is clear. Water demand showed a similar relationship with compressive strength at 14 days,
which was linearly related to compressive strength at 28 days. Adjusting compressive strengths
for air content by assuming a 5% strength for every additional 1% of air difference from 6%
provided no significant improvement in correlation or difference in conclusions.
Although higher dust contents and void contents resulted in a decrease in strength, these
effects are artifacts of the water demand. Since the water demand and sand characteristics are
correlated and there were limited degrees of freedom, multiple regression models would serve no
purpose. The relationship between other mechanical properties and water demand is similar, as
6 - 18

would be expected due to the general relationships between modulus of rupture and elastic
modulus with compressive strength, but there is substantial scatter.
6.2.3 Effects of Extended Mixing
The effects of extended mixing on selected mechanical properties was also examined for
18 different mixtures including those produced with blended sands, supplementary cementitious
materials and at both 0.45 and 0.50 w/c ratios. The average difference in compressive strength
(extended mixing minus routine mixing) at 28 days was negligible (60 psi, 0.4 MPa); the range
was from +540 psi (3.7 MPa) to -300 psi (2.1 MPa) with a standard deviation of 280 psi (1.9
MPa). The average difference in elastic modulus at 28 days was also negligible (0.12 Mpsi, 0.83
GPa), with differences ranging from 0.46 to 0.57 Mpsi (0.32 to 0.39 GPa) and a standard
deviation of 0.26 Mpsi (0.18 GPa). The average difference in modulus of rupture was 30 psi (0.2
MPa), with differences ranging from +100 psi (0.7 MPa) to -60 psi (0.4 MPa), and a standard
deviation of 50 psi (0.3 MPa). Effects were confounded somewhat by differences in air content.
Although the average difference was positive for all mechanical properties, indicating
extended mixing tended to produce slightly higher strengths, the values of the differences are
very small and are within normal variation, except possibly the 540 psi (3.7 MPa) difference in
compressive strength and 100 psi (0.7 MPa) difference in modulus of rupture. These maximum
differences occurred on the same mixture, which contained both fly ash and silica fume. It is not
known if the extended mixing provided more complete shearing and distribution of the silica
fume, if this was simply a random effect, or some other phenomenon affected the results; the
differences are statistically meaningful at the 95% confidence level but not 99%. Other
6 - 19

differences were not statistically meaningful. Extended mixing was found to have little if any
practical effect on the mechanical properties of the concrete mixtures in this study.
6.3 SHRINKAGE
A limited shrinkage study was conducted on Class AA mixtures produced using Pomona
and Salem Stone sands. At one year, the mixture produced using Pomona sand had a total
shrinkage strain of 520 microstrain (10-6 in./in. or m/m). The concrete mixture produced with
Salem Stone sand, which had a relatively high water demand, exhibited the highest shrinkage at
590 microstrain. The shrinkage data for Lillington natural sand from a previous study for North
Carolina Department of Transportation indicated a 1 year shrinkage strain of 530 microstrain.
These values are not meaningfully different. As expected, shrinkage increased as water demand
increased however the rate of increase of shrinkage per pound of mix water was lower than that
reported by Neville [1991].
No important difference in shrinkage characteristics of concretes produced with the
manufactured sands used in this study was found when water demand, and therefore paste
content, was effectively controlled by water reducing admixtures. Creep and shrinkage are
strongly related for classes of concrete produced with the same coarse aggregate, so it is
reasonable to concluded that no important difference in creep characteristics of concretes
produced with the manufactured sand used in this study, as long as water demand is controlled.
6 - 20

6.4 BLEEDING AND SEGREGATION
The movement of water to the surface of concrete is termed bleeding. Some bleeding is
beneficial if it reduces or eliminates plastic shrinkage cracking. Excessive bleeding can cause a
higher w/c ratio and greater permeability with a reduction in durability in the near surface region.
Segregation is a related phenomenon. Segregation results from the settlement of larger coarse
aggregate particles during placement. Deleterious segregation is rare in a properly proportioned
and placed mixture, particularly one with a low slump. Excessive vibration, however, can result
in movement of mortar to the top of a slab with a consequent downward movement of coarse
aggregate. The formation of a relatively thin mortar layer creates a slab, bridge deck or
pavement which is less durable to abrasion and to freezing and thawing in service. This layer
can also create delamination in the presence of moisture or thermal gradients.
Since the water demand of mixtures containing manufactured sand is relatively high,
there was concern that bleeding and segregation of these mixtures might be excessive,
particularly in the presence of heavy vibration that occurs in many slip form paving operations.
This possibility created two concerns. First it was necessary to determine the extent of additional
bleeding and segregation, if any, due to the high water demand of concrete mixtures produced
with manufactured sand, although that extra water demand was largely offset by admixtures.
Second, if a significant difference was found between manufactured and natural sand concretes,
it would be necessary to determine the contribution of bleeding and segregation to performance,
especially frost durability.
6 - 21

6.4.1 Results of the Preliminary Study
A preliminary study was conducted to determine if there were likely to be meaningful
differences in bleeding and segregation of concrete mixtures due to difference in angularity or
water demand, to establish a range of likely responses, and to help refine test methodology and
evaluation techniques appropriate for the study. In the preliminary study, extremely powerful
vibration was used to magnify any differences between the concretes. Due to the severity of the
vibration in the preliminary test, results in the field would not be expected to be comparable to
those obtained in this portion of the study. In subsequent testing, strong but reasonable
compaction effects were applied by using a vibrating table, which should simulate slip-form
paving compaction much more closely than rodding. Additional research conducted to establish
a relationship between field and laboratory results would be useful, however.
6.4.1.1 Bleeding and Segregation Test Procedures, Preliminary Study - Two sand
samples were created using angular particles from the Clarks manufactured sand or rounded
particles from the Lillington natural sand. Different sized fractions were blended to match the
mid-point value for each standard sieve size. Differences in void content, water demand,
bleeding, and segregation would be due to the particle angularity by using identical gradations.
The sands had void contents of 48.2 % (Clarks source) and 42.3 % (Lillington source).
Concrete mixtures were produced with either the angular or the rounded fine aggregate at
three different coarse aggregate contents. The water contents for the angular and rounded fine
aggregate mixtures were the same at each coarse aggregate content. Since the water content was
the same, the rounded sand mixtures had higher slumps. The mixtures with angular sands had
low to very low slumps consistent with use in a slipform paver for bridge deck or pavement
6 - 22
construction. The coarse aggregate contents were within the range typically found in practice but
were either a high (1840 pcy, 1092 kg/m3), low (1620 pcy, 961 kg/m3) or medium (1760 pcy,
1044 kg/m3) aggregate content. Entrained air was not used and the fines content was kept low, in
accordance with the more restrictive requirements of NCDOT specifications for natural sand, so
that differences in bleeding would be more pronounced.
Specimens were cast in 4 inch diameter by 8 inch high (nominal 100 mm by 200 mm)
cylindrical molds. The differences in segregation and bleeding were compared after
conventional or severe vibration. Conventional vibration consisted of rodding or internal
vibration for very low slump mixtures. Severe vibration consisted of initial consolidation
rodding followed by five minutes of vertically shaking the cylinders by securing them to a screen
on a mechanical coarse aggregate sieve shaker (a GilsonTM sieve shaker).
Bleeding and segregation were evaluated using several techniques. The quantity of
bleed-water over time determined in accordance with AASHTO T158 was obtained using a 4 in.
by 8 in. (nominal 100 mm by 200 mm) cylinder. Since this technique is notorious for high
variability and difficulty in interpreting results even with moderate w/c ratio concretes, other
methods were also used.
One cylinder from each batch was sawed in half longitudinally after hardening for at least
24 hours. Evidence of segregation was assessed by measuring the depth of the mortar layer at
the surface and by visual examination of the distribution of the coarse aggregate along the length
of the cylinder. Quantitative evaluation of bleeding and segregation was conducted by
determining changes in the dynamic modulus of the concrete through the cylinder. Specimens
were obtained by sawing approximately 1 inch (25 mm) thick concrete disks transversely along
6 - 23

the depth of the cylinders. Since the quantity of coarse aggregate has a significant effect on both
the density and elastic modulus of concrete, the unit weight and dynamic modulus of each disk
was used to establish the presence and extent of segregation.
6.4.1.2 Results of the Preliminary Bleeding and Segregation Study - Even with the large
differences in slump, direct measurement of bleed water using AASHTO T158 was inconclusive,
and no meaningful differences were found. Differences were detected in the depth of the mortar
layer and segregation was observed visually for cylinders which had been vibrated severely,
however. At all coarse aggregate contents, the mortar layer at the surface was deeper in concrete
mixtures with rounded sands than with angular sands in cylinders after severe vibration. The
differences in depth of mortar layer were relatively small and uniform in conventionally
consolidated specimens.
Quantitative assessment was consistent with visual observation. The dynamic modulus
was different only in those mixtures which had low coarse aggregate content and large
differences in slump exposed to severe vibration. The results of the preliminary testing implied
that (1) differences in bleeding and segregation were minimal except when mixtures with a high
slump were exposed to severe vibration and (2) concretes produced with manufactured sands
appear to be more resistant to segregation, particularly when used in low slump, paving mixtures
with high rock contents. Although these findings indicated that bleeding and segregation
differences are minimal for the manufactured sands in this study, used in otherwise similar
mixtures containing natural or more well rounded sands, additional testing was conducted.
6 - 24
6.4.2 Bleeding and Segregation Tests; Secondary Testing
Analysis of differences in bleeding and segregation was conducted for mixtures with
similar fresh properties, using slightly different techniques to evaluate practical concrete
mixtures under more realistic conditions. The preliminary study had found that the dynamic
elastic modulus could be used to evaluate segregation, so three each, 1 in. (25 mm) disks sawed
from the top of a single cylinder from separate batches were tested to identify possible gradients
in dynamic modulus and air permeability index with depth.
Separate sets of cylinders from cement only, Class AA mixtures produced using seven
different sands, were consolidated on a vibrating table for 30 seconds and for 60 seconds. Since
the consolidation effort did not include extreme vibration as in the preliminary segregation study,
the results and conclusions are more consistent with effects found in practice.
6.4.2.1 Results of the Bleeding and Segregation Study - Although no statistically
meaningful model was developed using step-wise backward linear regression, several
relationships were found to be informative. The dynamic modulus of the top inch (25 mm)
decreased after extended vibration in all cases, confirming well established principles of
construction prohibiting excessive consolidation.
Differences in dynamic elastic modulus were more pronounced between the top and
second inch (0 to 25 mm and 25 to 50 mm) layers compared to differences between the top and
the third inches (50 to 75 mm), indicating the difference between the first and second inches was
a stronger indicator of the extent of segregation. Therefore, this easy to assess measure of the
gradient was used in this and subsequent analysis, including the frost resistance testing.
6 - 25
The difference in dynamic modulus between the top and the second inch (0 to 25 mm and
25 to 50 mm) layers generally decreases with water demand, although there was considerable
scatter in the data. At the same level of workability, segregation was reduced slightly in mixtures
with more angular sands. Visual observation of split cylinders did not detect any differences in
segregation between angular and rounded sands for the low slump mixtures in this study. No
relationship was found between fines content and gradation and dynamic modulus gradient.
6.4.2.2 Conclusions, Bleeding and Segregation - No significant difference in segregation
or bleeding was found, based on elastic modulus, between low slump concretes produced with
either the manufactured or natural sand used in this study, in the absence of extreme vibration.
This finding, combined with the findings of the preliminary study, may also imply that the
increase in water demand for workability and the increased resistance to flow by angular
particles offset any potential for segregation and excessive bleeding. The current NCDOT
specifications for slump for pavements and bridge decks are useful help minimize problems
related to segregation for conventional concrete mixtures.
6.5 CONCLUSIONS - FRESH AND MECHANICAL PROPERTIES OF CONCRETE
1. The water demand was higher for concrete produced with manufactured sands than
with the natural sand, but the workability was acceptable for paving and surface course
applications for all mixtures; higher water demands were successfully mitigated with admixtures
for the sands used in this study.
2. The water demand varied based on void content and, to a lesser but still important
extent, on the fines content of the sands used.
6 - 26
3. Air and slump losses due to extended mixing were within expectations and sand
characteristics had little, if any, effect. The air content after extended mixing was also within
expectations for all mixtures.
4. Fly ash helped reduce water demand only when the cement content was very high.
5. Blending sands produced a concrete with a water demand approximately proportional
to the quantity and the water demand of the sands used, but the reduction in water demand by
blending was disproportionately better when higher water demand sands were used.
6. The relationships between compressive strength, elastic modulus, and modulus of
rupture were comparable to those found with other concrete mixtures produced with the Garner
coarse aggregate.
7. As expected, a higher water content, and therefore higher cement content, was found
to reduce strength at the same water cement ratio.
8. Little if any practical differences were found in mechanical properties due to extended
mixing time. The only mixture indicating a possible effect was the one containing both fly ash
and silica fume; additional mixing was found to be beneficial with this mixture.
9. The effect of sand characteristics on shrinkage appears to be relatively minor, although
data are limited. The effect of sand characteristics on creep is also likely to be relatively minor.
10. Bleeding and segregation were observed when concrete mixtures were exposed to
heavy vibration and to extreme vibration. The effects on changes in the elastic modulus with
depth after exposure to heavy vibration for concrete mixtures containing manufactured sand
appear to be similar to those for concrete mixtures containing natural sand.
6 - 27
CHAPTER 7 INFLUENCE OF MANUFACTURED SANDS
ON DEICER SALT SCALING DURABILITY AND PERMEABILITY
7.0 OVERVIEW
Aspects of durability of concrete mixtures produced with manufactured sands are
examined in this chapter. Durability was assessed using ASTM C 672, "Standard Test Method
for Scaling Resistance of Concrete Surfaces Exposed to Deicing Chemicals," to evaluate the
scaling resistance of concrete subjected to slow freezing and thawing cycles in the presence of a
deicing salt solution. The extent of deterioration is determined by visual observation of surface
scaling. The permeability of these concrete mixtures was also determined, both for intrinsic
value in assessing possible durability related deterioration associated with permeability and
possible relationships between scaling and permeability.
The evaluation technique described in ASTM C 672 requires a somewhat subjective
visual determination of the extent of deterioration. ASTM C 672 notes that the numerical values
obtained must be used with caution in numerically based analysis. The subjectivity of the
evaluation is reduced somewhat by using the rank order, that is, best to worst of the specimens
instead. This technique is also limited, however. The difference between, for example, the 4th
best and the 6th best can be significantly different that the difference between the 6th best and the
8th best. Therefore, alternative quantitative evaluation techniques were examined in this study.
The dynamic elastic modulus was determined from thin disks sawed from cores taken from the
slab specimens after exposure and compared to dynamic modulus before exposure. In addition,
concrete disks were used as test specimens in C 672 temperature exposures; visual analysis and
dynamic modulus of the disks were determined before and after only 15 cycles.
7 - 1
Permeability is an important concrete characteristic that influences long term durability in
a variety of exposures. A simple indicator of permeability, the air permeability index (API)
[Schonlin and Hilsdorf 1988] can be conducted on the same, relatively thin disk specimens used
to determine the dynamic elastic modulus. A larger API indicates a more permeable concrete.
The air permeability index was used to investigate differences in frost deterioration between
various concrete mixtures as well as to directly compare the effects of manufactured sands on
concrete permeability.
Significant differences were found in performance of concrete mixtures with different
sand sources. These differences were largely related to angularity and fines contents of the
sands, and to the effects on water demand associated with these sand characteristics.
7.1 AIR PERMEABILITY
The Air Permeability Index (API) of the concrete mixtures was determined using
concrete disks sawed from 4 in. diameter by 8 in. high (nominal 100 mm by 200 mm) concrete
cylinders. The dynamic elastic modulus was also determined on these disks. The API of the disk
from the top of the cylinder was determined to provide insight into both bleeding effects and
frost durability. Table 7.1 shows API values for mixtures tested; compressive strength is given
for comparison.
Figure 7.1 shows the general and perhaps non-linear relationship between increasing
permeability and increasing water content at the same w/c ratio for AA mixtures. Class A
mixtures show a similar relationship, but with more scatter. These findings are consistent with
the influence of water on mechanical properties discussed previously.
7 - 2

Table 7.1 Air Permeability Index (API)
Fine Aggregate w/c f c (MPa) API (m2/s)Cement only Lillington 0.45 41.5 0.25 Smith Grove 0.45 38.9 0.81 Pomona 0.45 38.4 0.54 Salem Stone 0.45 40.7 0.47 Clark 0.45 42.7 0.47 Castle Hayne 0.45 43.1 0.49 New Bern 0.45 40.0 0.61 Woodleaf 0.45 34.7 0.41 Jamestown 0.45 41.5 0.37 Rocky Point 0.45 47.7 0.39 Belgrade 0.45 41.6 0.75 Lillington 0.50 36.2 0.80 Smith Grove 0.50 34.8 0.56 Pomona 0.50 40.3 0.67 Salem Stone 0.50 31.6 0.51Blended Sands (with Lillington sand) 75% Salem Stone 0.45 33.7 0.92 50% Salem Stone 0.45 39.6 0.56 75% Smith Grove 0.45 39.1 0.65 75% Salem Stone 0.50 32.2 1.17Mixtures with Supplementary Cementitious Material Lillington 0.45 30.4 0.40 Salem Stone 0.45 29.2 0.38 Pomona 0.45 28.8 0.40 Smith Grove 0.45 30.5 0.63 Salem Stone 0.50 26.5 0.72 Pomona 0.50 31.0 0.46 Smith Grove 0.50 26.2 0.54 Smith Grove (FA+SF) 0.45 36.6 0.61
"f c" is compressive strength at 28 days; "MPa" is megapascals; "m2/s is meter2 per second
7 - 3
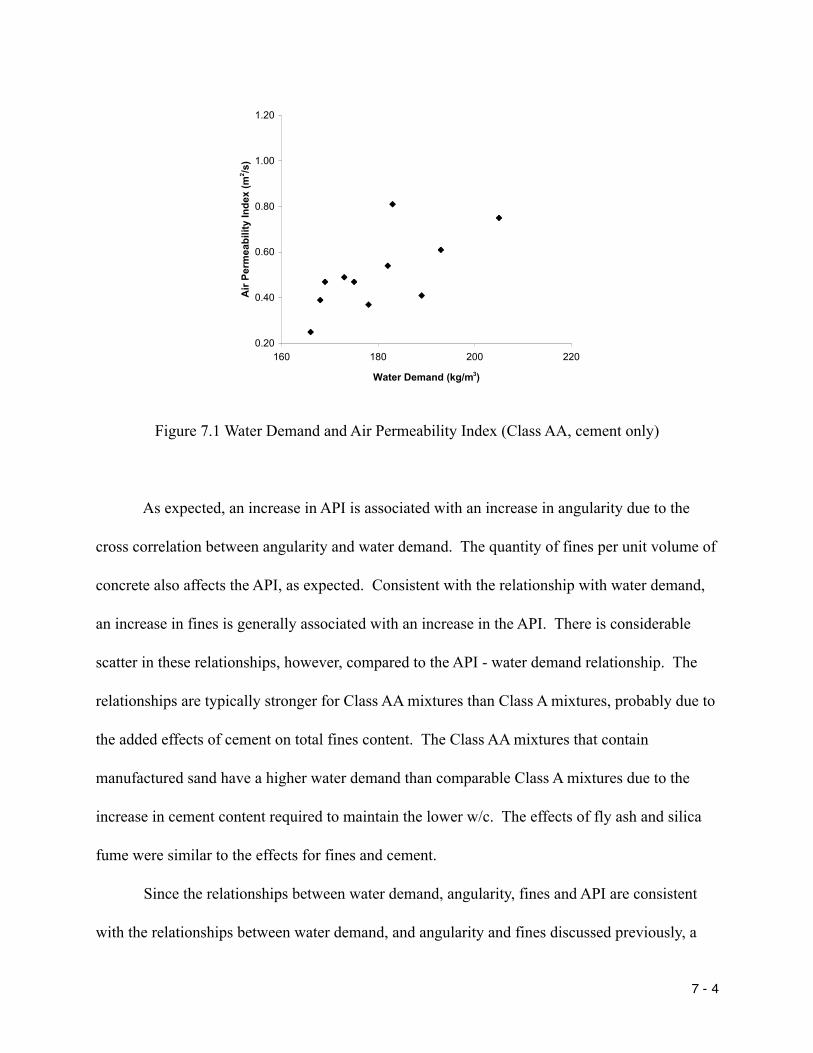
0.20
0.40
0.60
0.80
1.00
1.20
160 180 200 220
Water Demand (kg/m3)
Air
Perm
eabi
lity
Inde
x (m
2 /s)
Figure 7.1 Water Demand and Air Permeability Index (Class AA, cement only)
As expected, an increase in API is associated with an increase in angularity due to the
cross correlation between angularity and water demand. The quantity of fines per unit volume of
concrete also affects the API, as expected. Consistent with the relationship with water demand,
an increase in fines is generally associated with an increase in the API. There is considerable
scatter in these relationships, however, compared to the API - water demand relationship. The
relationships are typically stronger for Class AA mixtures than Class A mixtures, probably due to
the added effects of cement on total fines content. The Class AA mixtures that contain
manufactured sand have a higher water demand than comparable Class A mixtures due to the
increase in cement content required to maintain the lower w/c. The effects of fly ash and silica
fume were similar to the effects for fines and cement.
Since the relationships between water demand, angularity, fines and API are consistent
with the relationships between water demand, and angularity and fines discussed previously, a
7 - 4
linear regression between API and angularity, as measured by voids content, and the fines
content as the independent variables, was examined with cement only, Class AA mixtures to
eliminate the effects of w/c ratio and SCM. Equation 7.1 provides a statistically valid
relationship even though the correlation coefficient (r2) is not particularly strong; the standard
errors of the estimates of the independent variables are small compared to the coefficients
themselves and the 95% confidence intervals do not include zero. For AA mixtures (in
customary US units),
API = -1.35 + 0.0347 Vs + 0.0052 D Eq. 7.1
where API is the Air Permeability Index in m2/sec (r2=0.63),
Vs is the Void content (Method A) (%) (std err = 0.0155) , and
D is the material passing the 75 µm (#200) sieve (pcy) (std err = 0.00115).
This equation has little practical value except to statistically confirm the relationships just
discussed and perhaps contribute to better understanding of how sand characteristics affect
permeability by affecting water demand. Increases in angularity and fines both increase
permeability.
In general, incorporation of fly ash improved permeability at the same w/c ratio even at
only a one-to-one replacement, as expected. In addition, fly ash appears to have significantly
mitigated the effects of additional water content. This suggests that the use of fly ash may offset
the negative effects of angularity as far as permeability is concerned.
Due to the lower w/c ratio requirement it was expected that Class AA mixtures would
have a lower permeability than Class A mixtures. Even though this holds true for most cases,
there were some instances where a Class A mixture was less permeable than a Class AA mixture
7 - 5
with comparable ingredients. Differences in cement and water between comparable Class AA
and Class A mixtures were examined similarly to the study with mechanical properties. An
increase in water content between a Class A and a Class AA mixture leads to an increase in air
permeability even though water cement ratio is reduced. Both positive and negative differences
in air permeability between Class AA and Class A mixtures are clearly associated with
differences in water demand.
7.2 DEICER SALT SCALING RESISTANCE
The deicer salt scaling performance of the concrete mixtures tested in this study are
provided in Tables 7.2a, 7.2b, and 7.3c. Rank is from best to worst. The visual rating conforms
to ASTM C 672 categories. Although these ratings must be used with caution, in the opinion of
the investigators, they may be used to classify mixtures according to likely behavior in service in
North Carolina. Mixtures with ratings of 1 or 2 will likely provide good salt scaling resistance in
practice in pavements or bridge decks with significant road salting. Mixtures with ratings of 3
will likely provide acceptable, but ranging from fair to marginal, salt scaling resistance in
practice in pavements or bridge decks with significant road salting. Those mixtures with ratings
of 4 will likely provide marginal or poor salt scaling resistance in practice in pavements or bridge
decks with significant road salting; these mixtures will likely have acceptable frost resistance in
other applications as long as the entrained air system and content are acceptable. Mixtures listed
at or near the top of a classification will likely have better performance in service than those
ranked lower in order, but with the same classification. No mixtures were worse than a 4.
7 - 6
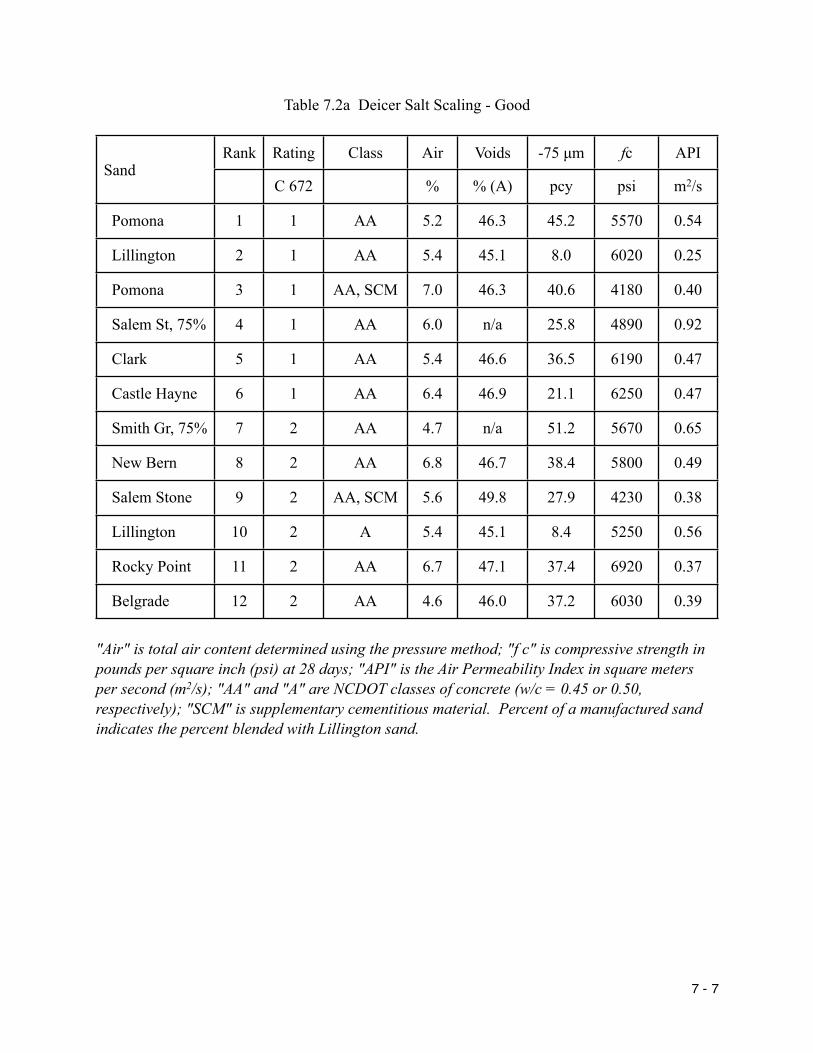
Table 7.2a Deicer Salt Scaling - Good
SandRank Rating Class Air Voids -75 µm fc API
C 672 % % (A) pcy psi m2/s
Pomona 1 1 AA 5.2 46.3 45.2 5570 0.54
Lillington 2 1 AA 5.4 45.1 8.0 6020 0.25
Pomona 3 1 AA, SCM 7.0 46.3 40.6 4180 0.40
Salem St, 75% 4 1 AA 6.0 n/a 25.8 4890 0.92
Clark 5 1 AA 5.4 46.6 36.5 6190 0.47
Castle Hayne 6 1 AA 6.4 46.9 21.1 6250 0.47
Smith Gr, 75% 7 2 AA 4.7 n/a 51.2 5670 0.65
New Bern 8 2 AA 6.8 46.7 38.4 5800 0.49
Salem Stone 9 2 AA, SCM 5.6 49.8 27.9 4230 0.38
Lillington 10 2 A 5.4 45.1 8.4 5250 0.56
Rocky Point 11 2 AA 6.7 47.1 37.4 6920 0.37
Belgrade 12 2 AA 4.6 46.0 37.2 6030 0.39
"Air" is total air content determined using the pressure method; "f c" is compressive strength in pounds per square inch (psi) at 28 days; "API" is the Air Permeability Index in square meters per second (m2/s); "AA" and "A" are NCDOT classes of concrete (w/c = 0.45 or 0.50, respectively); "SCM" is supplementary cementitious material. Percent of a manufactured sand indicates the percent blended with Lillington sand.
7 - 7

Table 7.2b Deicer Salt Scaling - Acceptable (Fair)
SandRank Rating Class Air Voids -75 µm fc API
C 672 % % (A) pcy psi m2/s
Smith Grove 13 3 A 5.2 45.8 65.5 5050 0.67
Salem St, 75% 14 3 A 6.8 n/a 25.8 4670 1.17
Salem Stone 15 3 A 5.4 49.8 30.7 4580 0.80
Salem St, 50% 16 3 AA 5.4 n/a 20.5 5740 0.56
Lillington 17 3 AA, SCM 6.2 45.1 7.9 4410 0.40
Smith Grove 18 3 AA, SCM 6.2 45.8 57.2 5310 0.61
Jamestown 19 3 AA 6.2 49.1 29.3 6020 0.41
Pomona, mod 20 3 AA 5.0 81.2 6310 0.79
Pomona 21 3 A 6.2 46.3 44.5 5840 0.51
Smith Gr, mod 22 3 AA 6.2 37.5 6960 0.55
"Air" is total air content determined using the pressure method; "f c" is compressive strength in pounds per square inch (psi) at 28 days; "API" is the Air Permeability Index in square meters per second (m2/s); "AA" and "A" are NCDOT classes of concrete (w/c = 0.45 or 0.50, respectively); "SCM" is supplementary cementitious material. Percent of a manufactured sand indicates the percent blended with Lillington sand; "mod" indicates a mixture with modified content of material passing the 75 µm (#200) sieve.
7 - 8

Table 7.2c Deicer Salt Scaling - Poor
SandRank Rating Class Air Voids -75 µm fc API
C 672 % % (A) pcy psi m2/s
Woodleaf 23 4 AA 6.6 47.5 62.2 5030 0.61
Smith Grove 24 4 AA 5.0 45.8 64.9 5640 0.81
Salem Stone 25 4 AA 5.0 49.8 29.8 5900 0.75
Pomona 26 4 A, SCM 5.0 46.3 46.0 4500 0.46
Smith Grove 27 4 A, SCM 5.5 45.8 64.4 3800 0.54
Smith Grove 28 4 AA, SCM 5.2 45.8 59.4 4420 0.63
Salem Stone 29 4 A, SCM 5.2 49.8 29.5 3840 0.72
"Air" is total air content determined using the pressure method; "f c" is compressive strength in pounds per square inch (psi) at 28 days; "API" is the Air Permeability Index in square meters per second (m2/s); "AA" and "A" are NCDOT classes of concrete (w/c = 0.45 or 0.50, respectively); "SCM" is supplementary cementitious material. Percent of a manufactured sand indicates the percent blended with Lillington sand.
7.2.1 Effects of SCM on Scaling Resistance in a Deicer Salt Exposure
The effects of fly ash on deicer salt scaling were complex and mixed. When fly ash was
used in mixtures containing sands with good deicer salt scaling resistance, only minor additional
deterioration typically resulted. In other words, concrete mixtures that were frost resistant
remained frost resistant when fly ash was used. The use of fly ash caused additional
deterioration when used in concrete mixtures which were either not salt scaling resistant or were
only marginally frost resistant.
Mixtures containing cement only had better deicer salt scaling behavior than similar
concrete mixtures in which fly ash was substituted on an equal mass basis. Recalling that the fly
7 - 9
ash was added at a 25% rate, that replacement was one-to-one, that curing for specimens exposed
to deicer salt scaling was stopped at 14 days, that is, prior to much hydration of the fly ash, and
that this is a severe test, it is not surprising that a reduction in scaling resistance was found with
the substitution of fly ash. These findings are in general agreement with previous studies
examining the effects of fly ash on deicer salt scaling resistance. Fly ash mixtures also tended to
exhibit more pitting. Additional study on the deicer salt scaling of fly ash mixtures would be
useful to confirm or identify practical limits on addition rates.
The effect of silica fume in combination with fly ash on scaling was also investigated
with a Class AA mixture containing Smith Grove sand with 20% fly ash and 5% silica fume was
tested. This aggregate was selected for evaluating possible benefits with using silica fume since
the Class AA, cement only mixture containing this sand exhibited poor scaling resistance. The
5% silica fume provided a slight improvement in scaling durability; the scaling rating improved
from "poor" to "average."
7.2.2 Effects of Increased Entrained Air Content on Deicer Salt Scaling Resistance
One Class AA concrete mixture with 7% total air content containing the Smith Grove
manufactured sand was also examined (not listed in the table). Smith Grove sand was used
because a scaling response was extremely likely and any improvement in scaling should be
readily apparent. Very slight improvement in scaling resistance was observed, but the concrete
mixture still had poor salt scaling resistance indicating that concrete containing these types of
sand cannot be usefully improved by simply increasing the air content.
7 - 10
7.2.3 Effects of Strength, API, and Water Content on Deicer Salt Scaling Resistance
For concrete mixtures with the same sand, a Class AA mixture typically had better
scaling resistance than a Class A mixture. Departures from this relationship only occurred when
both had very poor scaling performance and differences in deterioration were minor. This
finding is consistent with national specifications for a maximum 0.45 w/c ratio for concrete
exposed to severe freezing and thawing such as found in pavements exposed to deicing salts.
These test results should not be misinterpreted. Properly air entrained Class A concrete can be
exposed to frost in service in many applications, but should not be used in pavements or decks.
Although deicer salt scaling resistance appeared to be strongly related to strength, this is
primarily an artifact of fly ash use coupled with the w/c ratio. Low strengths were associated
with the one-to-one substitution of fly ash in combination with the reducing curing time. Except
for the severe deterioration associated with some fly ash mixtures with lower strengths,
correlation with strength and scaling resistance was poor. Scaling was not sensitive to strength,
at least for the strength ranges attained in this study, with similar, cement only mixtures. Class A
mixtures with fly ash remained unsuited for use in pavements or bridge decks.
The scaling rank of cement only mixtures also had a marginal positive correlation with
API. The very general nature of the correlation, at least with cement only mixtures, may be
related to the scatter in the data based on subjective visual evaluation as well as the relatively
limited range in API of these mixtures.
The complex interrelationship between salt gradients, permeability and scaling can also
affect simple correlations. Less permeable concrete can result in steeper salt gradients,
exacerbating layer (EI) response to thermal gradients. The use of fly ash generally provided a
7 - 11
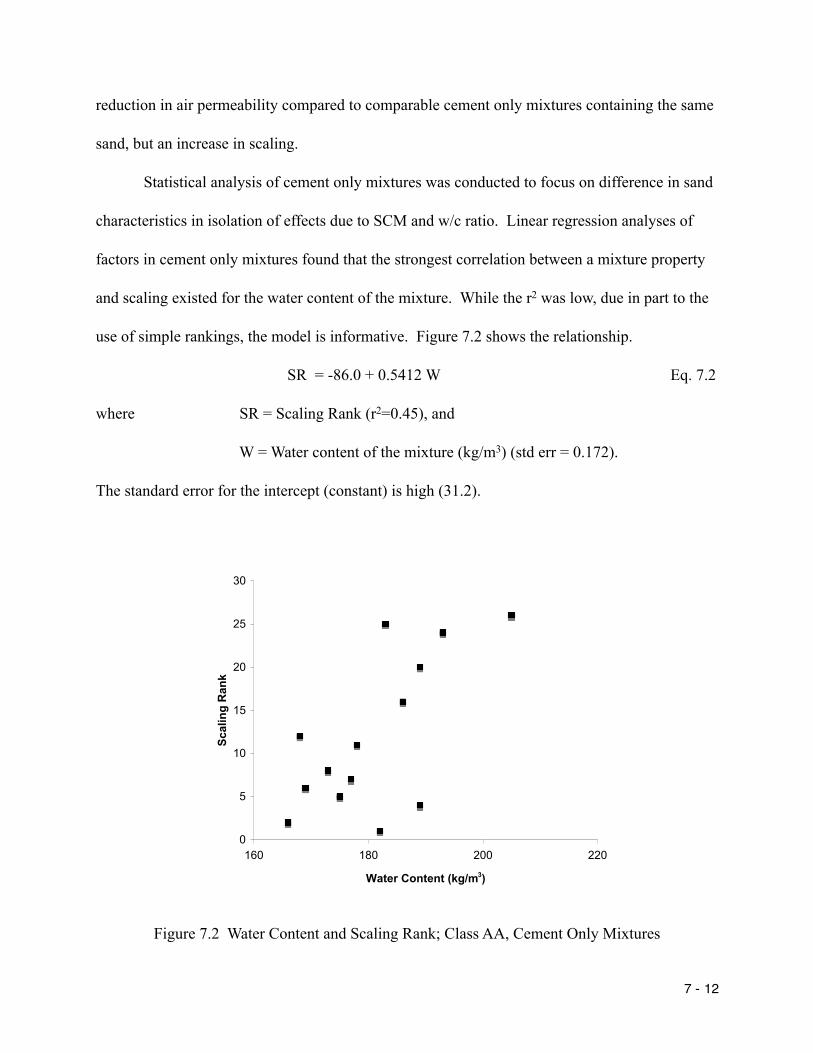
reduction in air permeability compared to comparable cement only mixtures containing the same
sand, but an increase in scaling.
Statistical analysis of cement only mixtures was conducted to focus on difference in sand
characteristics in isolation of effects due to SCM and w/c ratio. Linear regression analyses of
factors in cement only mixtures found that the strongest correlation between a mixture property
and scaling existed for the water content of the mixture. While the r2 was low, due in part to the
use of simple rankings, the model is informative. Figure 7.2 shows the relationship.
SR = -86.0 + 0.5412 W Eq. 7.2
where SR = Scaling Rank (r2=0.45), and
W = Water content of the mixture (kg/m3) (std err = 0.172).
The standard error for the intercept (constant) is high (31.2).
0
5
10
15
20
25
30
160 180 200 220
Water Content (kg/m3)
Scal
ing
Ran
k
Figure 7.2 Water Content and Scaling Rank; Class AA, Cement Only Mixtures
7 - 12
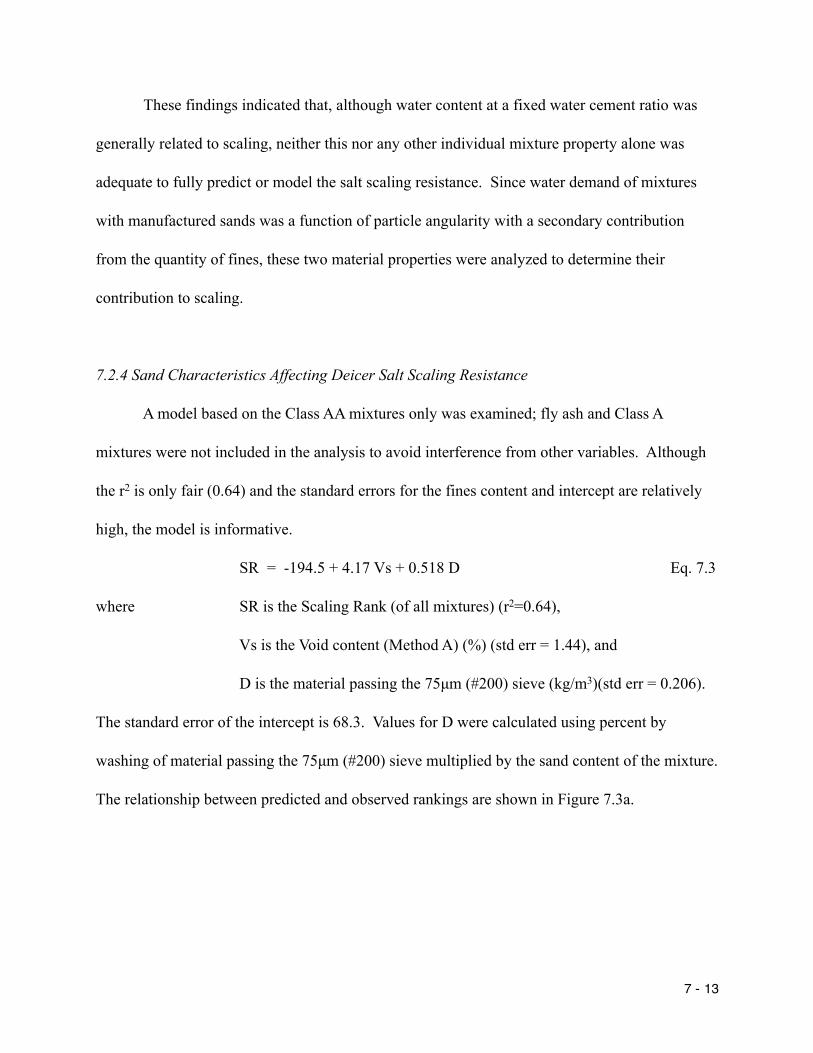
These findings indicated that, although water content at a fixed water cement ratio was
generally related to scaling, neither this nor any other individual mixture property alone was
adequate to fully predict or model the salt scaling resistance. Since water demand of mixtures
with manufactured sands was a function of particle angularity with a secondary contribution
from the quantity of fines, these two material properties were analyzed to determine their
contribution to scaling.
7.2.4 Sand Characteristics Affecting Deicer Salt Scaling Resistance
A model based on the Class AA mixtures only was examined; fly ash and Class A
mixtures were not included in the analysis to avoid interference from other variables. Although
the r2 is only fair (0.64) and the standard errors for the fines content and intercept are relatively
high, the model is informative.
SR = -194.5 + 4.17 Vs + 0.518 D Eq. 7.3
where SR is the Scaling Rank (of all mixtures) (r2=0.64),
Vs is the Void content (Method A) (%) (std err = 1.44), and
D is the material passing the 75µm (#200) sieve (kg/m3)(std err = 0.206).
The standard error of the intercept is 68.3. Values for D were calculated using percent by
washing of material passing the 75µm (#200) sieve multiplied by the sand content of the mixture.
The relationship between predicted and observed rankings are shown in Figure 7.3a.
7 - 13
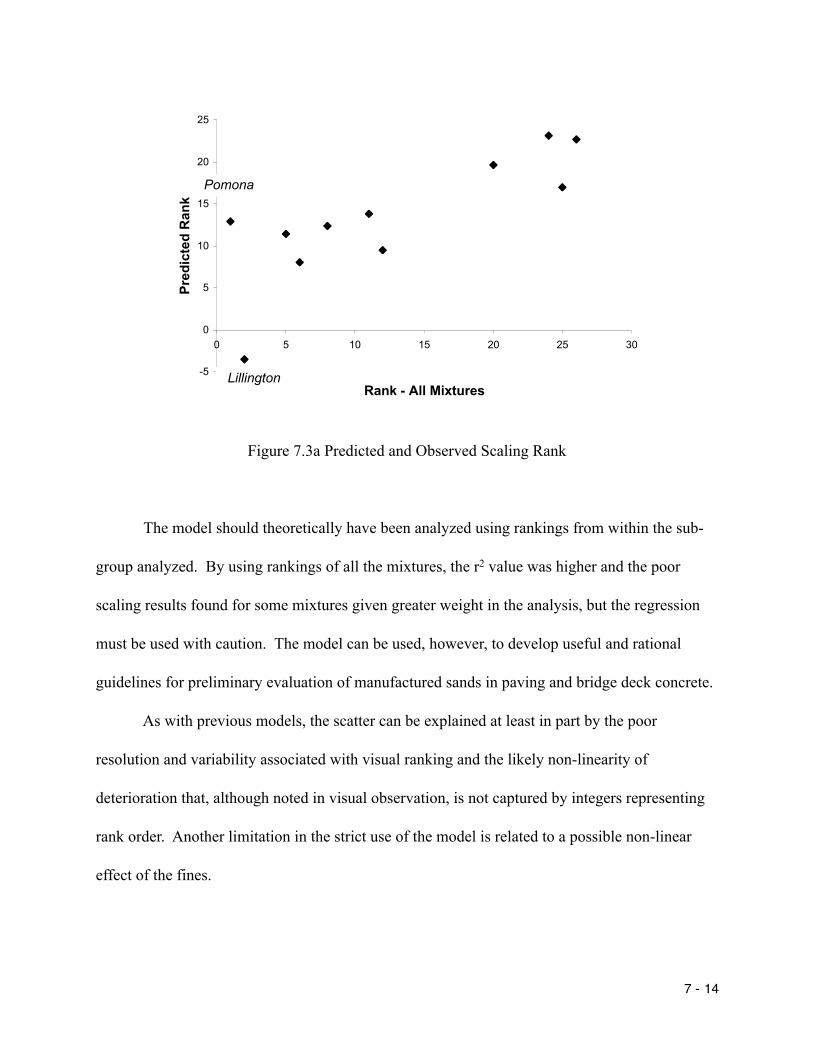
-5
0
5
10
15
20
25
0 5 10 15 20 25 30
Rank - All Mixtures
Pred
icte
d R
ank
Lillington
Pomona
Figure 7.3a Predicted and Observed Scaling Rank
The model should theoretically have been analyzed using rankings from within the sub-
group analyzed. By using rankings of all the mixtures, the r2 value was higher and the poor
scaling results found for some mixtures given greater weight in the analysis, but the regression
must be used with caution. The model can be used, however, to develop useful and rational
guidelines for preliminary evaluation of manufactured sands in paving and bridge deck concrete.
As with previous models, the scatter can be explained at least in part by the poor
resolution and variability associated with visual ranking and the likely non-linearity of
deterioration that, although noted in visual observation, is not captured by integers representing
rank order. Another limitation in the strict use of the model is related to a possible non-linear
effect of the fines.
7 - 14

Examination of Figure 7.3a shows two data points, Pomona and Lillington, that appear to
have other contributing factors not captured by Eq. 7.3. The Lillington sand is the natural sand
and the nature of the fines is expected to be different from the rock dust that predominates in the
manufactured sand fines; Eq. 7.3 is not likely to be appropriate for concretes produced with
natural sand. The Pomona sand had much better deicer salt scaling resistance than would be
predicted on the basis of fines and void content using Eq. 7.3. Clearly the linear model did not
capture at least one important aspect of manufactured sand characteristics. Inclusion of other
factors did not improve the regression, but these factors were reexamined for incorporation as
identifiers or discriminants in classifying manufactured sands.
Examining the specific angularity measures of the sands used in image analysis,
roundness and percent of blade shaped particles are better for the Lillington and Pomona sands
(see Table 7.3). Scaling resistance of concrete was improved when using sands with better
roundness and fewer blade shaped particles. These factors were not statistically significant when
added to the model. This finding suggests using a classification system based at least partially
on establishing threshold values for certain characteristics, however.
Figure 7.3a shows what can be interpreted as clustering of results into two groups. These
groups were used to identify sands with acceptable or fair resistance to deicer salt scaling and
those with poor resistance. The clustering and the improvement in salt scaling resistance with
better roundness and reduced blade shaped particles suggest a simple but preliminary and
imprecise classification methods for manufactured sands is possible to minimize salt scaling.
7 - 15

Table 7.3 Selected Particle Angularity Measures of Sands and Scaling Rank
Scaling Rank
Sand Roundness %BSP
1 Pomona 1.35 10
2 Lillington 1.37 6
5 Clark 1.51 19
6 Castle Hayne 1.44 20
8 New Bern 1.44 19
11 Rocky Point 1.52 28
12 Belgrade 1.44 21
20 Jamestown 1.42 38
24 Woodleaf 1.44 12
25 Smith Grove 1.57 21
26 Salem Stone 1.53 30
"%BSP" is percent of blade shaped particles (by count)
Fig. 7.3a indicates that sands with acceptable or fair resistance to deicer salt scaling had a
predicted scaling rank less than 12; sands with a predicted scaling rank greater than 15 had poor
resistance. A preliminary classification of sands for potential resistance to deicer salt scaling in
NCDOT Class AA mixtures is possible by reformulating Eq 7.3 as shown below:
Manufactured sands are likely to have good to fair resistance to deicer salt scaling if:
-194.5 + 4.17 Vs + 0.518 D < 12 Eq. 7.4a
Manufactured sands are likely to have poor resistance to deicer salt scaling if:
-194.5 + 4.17 Vs + 0.518 D ≥ 15 Eq. 7.4b
7 - 16
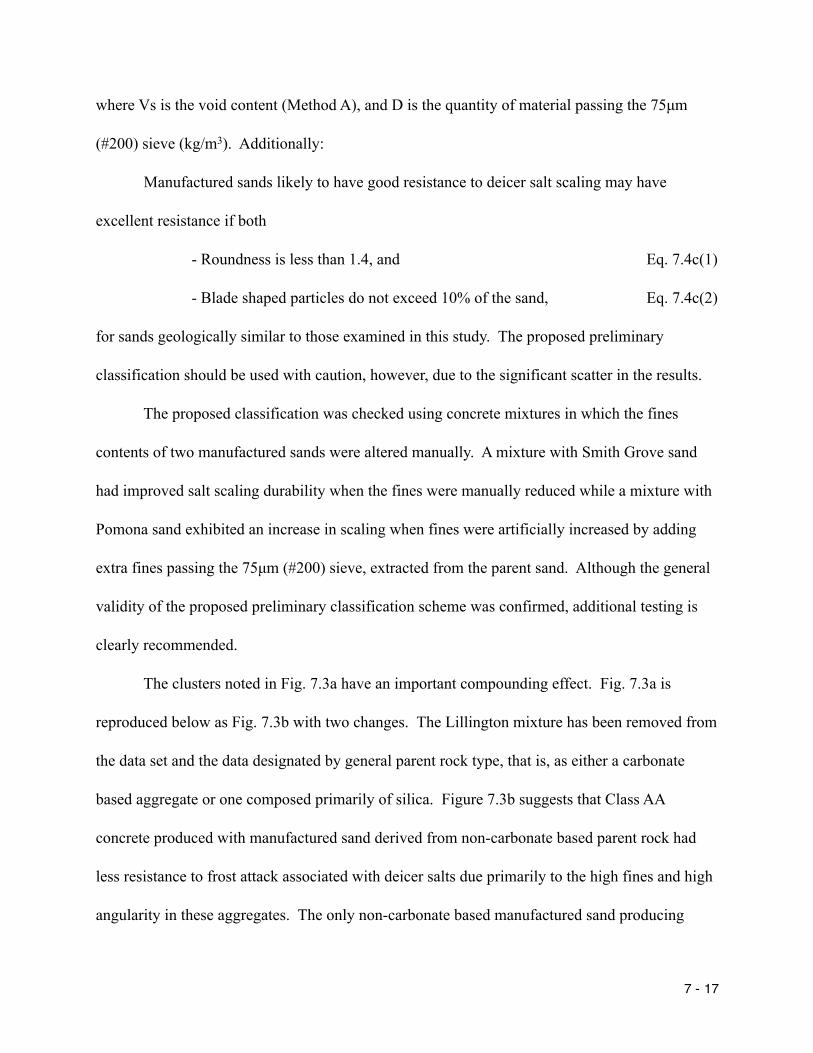
where Vs is the void content (Method A), and D is the quantity of material passing the 75µm
(#200) sieve (kg/m3). Additionally:
Manufactured sands likely to have good resistance to deicer salt scaling may have
excellent resistance if both
- Roundness is less than 1.4, and Eq. 7.4c(1)
- Blade shaped particles do not exceed 10% of the sand, Eq. 7.4c(2)
for sands geologically similar to those examined in this study. The proposed preliminary
classification should be used with caution, however, due to the significant scatter in the results.
The proposed classification was checked using concrete mixtures in which the fines
contents of two manufactured sands were altered manually. A mixture with Smith Grove sand
had improved salt scaling durability when the fines were manually reduced while a mixture with
Pomona sand exhibited an increase in scaling when fines were artificially increased by adding
extra fines passing the 75µm (#200) sieve, extracted from the parent sand. Although the general
validity of the proposed preliminary classification scheme was confirmed, additional testing is
clearly recommended.
The clusters noted in Fig. 7.3a have an important compounding effect. Fig. 7.3a is
reproduced below as Fig. 7.3b with two changes. The Lillington mixture has been removed from
the data set and the data designated by general parent rock type, that is, as either a carbonate
based aggregate or one composed primarily of silica. Figure 7.3b suggests that Class AA
concrete produced with manufactured sand derived from non-carbonate based parent rock had
less resistance to frost attack associated with deicer salts due primarily to the high fines and high
angularity in these aggregates. The only non-carbonate based manufactured sand producing
7 - 17
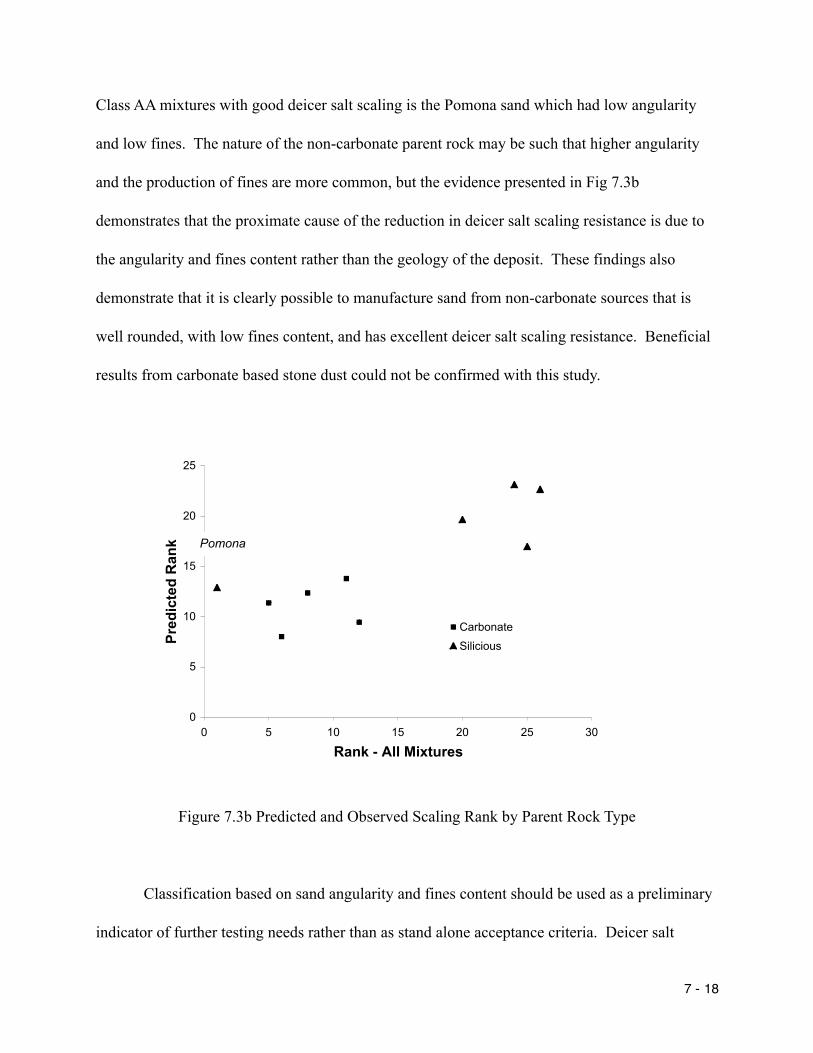
Class AA mixtures with good deicer salt scaling is the Pomona sand which had low angularity
and low fines. The nature of the non-carbonate parent rock may be such that higher angularity
and the production of fines are more common, but the evidence presented in Fig 7.3b
demonstrates that the proximate cause of the reduction in deicer salt scaling resistance is due to
the angularity and fines content rather than the geology of the deposit. These findings also
demonstrate that it is clearly possible to manufacture sand from non-carbonate sources that is
well rounded, with low fines content, and has excellent deicer salt scaling resistance. Beneficial
results from carbonate based stone dust could not be confirmed with this study.
0
5
10
15
20
25
0 5 10 15 20 25 30
Rank - All Mixtures
Pred
icte
d R
ank
Carbonate
Silicious
Pomona
Figure 7.3b Predicted and Observed Scaling Rank by Parent Rock Type
Classification based on sand angularity and fines content should be used as a preliminary
indicator of further testing needs rather than as stand alone acceptance criteria. Deicer salt
7 - 18
scaling tests of specific proposed mixtures is recommended for sands that do not meet the
proposed criteria, and that will be used in applications and districts expected to be heavily salted.
The results with the high fines content Pomona sand implies that angularity and fines
content together may be more critical than roundness in affecting salt scaling resistance. The
interaction effects with water content may be significant, however. Additional testing is needed
to further quantify these findings.
7.2.5 Conclusions - ASTM C 672 Testing
1. Preliminary classification of manufactured sands for potential resistance to deicer salt
scaling in Class AA mixtures is possible based on bulk angularity and stone dust content:
Manufactured sands are likely to have good to fair resistance to deicer salt scaling if:
-194.5 + 4.17 Vs + 0.518 D < 12 Eq. 7.4a
Manufactured sands are likely to have poor resistance to deicer salt scaling if:
-194.5 + 4.17 Vs + 0.518 D ≥ 15 Eq. 7.4b
where Vs is the void content (Method A), and D is the quantity of material passing the 75µm
(#200) sieve (kg/m3).
2. Manufactured sands likely to have good resistance to deicer salt scaling may have
excellent resistance if both
- Roundness is less than 1.4, and Eq. 7.4c(1)
- Blade shaped particles do not exceed 10% of the sand, Eq. 7.4c(2)
for sands geologically similar to those examined in this study. The proposed preliminary
classification should be used with caution, however, due to the significant scatter in the results.
7 - 19

3. Geology of the parent rock alone was found to have no effect on the deicer salt scaling
of Class AA mixtures produced with manufactured sand.
4. Class A mixtures are inherently unsuited for use in pavements and bridge decks that
will be exposed to substantial deicer salt exposure. Class A mixtures were included in this study
to improve resolution of salt scaling resistance, if needed, and confirm current specification
requirements for pavement and deck mixtures.
5. The use of 25% fly ash, in a one-to-one replacement of portland cement, contributed
to a reduction in deicer salt scaling resistance. The effect was not significant in those mixtures
with acceptable deicer salt scaling resistance without fly ash, however.
6. Manufactured sands may be blended with natural sands to improve deicer salt scaling
resistance. Characteristics of these mixtures will largely be the weighted averages of the
characteristics of mixtures with either sand.
7.3 QUANTIFICATION OF FROST DAMAGE USING MECHANICAL PROPERTIES
Assessment of frost damage using subjective, visually based techniques is imprecise.
Frost deterioration is assessed quantitatively by ASTM C 666 using the dynamic elastic modulus.
In an effort to quantitatively assess deicer salt scaling damage, cores were taken from slabs after
the completion of 50 cycles of freezing and thawing for additional investigation based on the
dynamic elastic modulus.
An easier, alternate test method using disks subjected to ASTM C 672 exposure was
conducted roughly in parallel to the study of slabs. Evaluation of the disks included dynamic
7 - 20

elastic modulus tests, mass loss, and visual assessment. Neither approach provided suitable
quantitative tools, but several important findings were obtained.
7.3.1 Dynamic Modulus Loss in Cores
The dynamic modulus of a disk removed from the test slab after the freezing exposure of
ASTM C 672 was compared to the dynamic modulus of the top 25 mm (1 in.) of cylinders before
freezing. Cores were removed from the slabs with a hollow core, water cooled, diamond bit drill
with a 3.75 inch inside diameter. Since scaling is a surface phenomenon, only relatively thin
disks from the top of the core were tested. Disks ranged from 15 mm (0.6 in.) up to about 25
mm (1 in.) in thickness.
The loss in dynamic modulus was generally correlated with strength, however, this
relationship is an artifact of the effect of fly ash both on strength and frost damage. Analysis
conducted with cement only mixtures found no effective relationship indicating that the
reduction in the elastic dynamic modulus before and after freezing is not related to the strength
of the concrete, except as affected by the fly ash content. This finding confirms the earlier
findings of this study.
Dynamic modulus loss was not found to be associated with manufactured sand
characteristics such as angularity or fines. Backwards stepwise regression analysis did not yield
any usable model for loss of dynamic modulus.
No useful relationship was found between dynamic elastic modulus and scaling
categories or scaling rank. There are several possible contributing factors for the lack of
correlation. Visually based indices are qualitative and subjective so a poor correlation is not
7 - 21

necessarily surprising. Also, dynamic modulus values were not from the same specimen so the
specimen to specimen variability could be obscuring valid relationships.
One critical factor in the lack of a useful relationship between the dynamic elastic
modulus or change in the dynamic elastic modulus is that scaling results in loss of the damaged
layer. The dynamic modulus of the remaining portion of the disk appear to be essentially
undamaged.
The dynamic elastic modulus is determined based on resonant frequency of the specimen.
The measured (apparent) dynamic elastic modulus of a composite material with a stiff, relatively
thick layer and a much thinner, less stiff layer will be dominated by the properties of the thick,
stiff layer. Therefore, since the dynamic elastic modulus is adjusted for mass, development of
any thin, weakened layer, or the loss of material will not necessarily be identified by changes in
the dynamic elastic modulus.
7.3.2 Alternative Deicer Salt Scaling Test Method
The results of the disk based salt scaling test are provided in Table 7.4. Rankings from
the previous visual assessment of disks for resistance to deicer salt scaling are included. Mass
loss is the mass of scaling debris recovered from the specimen in grams. Dynamic modulus
change is for float finished disks only, that is from disks taken from the top of the cylinder;
results from sawed disks, those taken from the middle of the cylinder, are discussed below. A
loss in dynamic modulus was found in some cases and an increase in others.
7 - 22
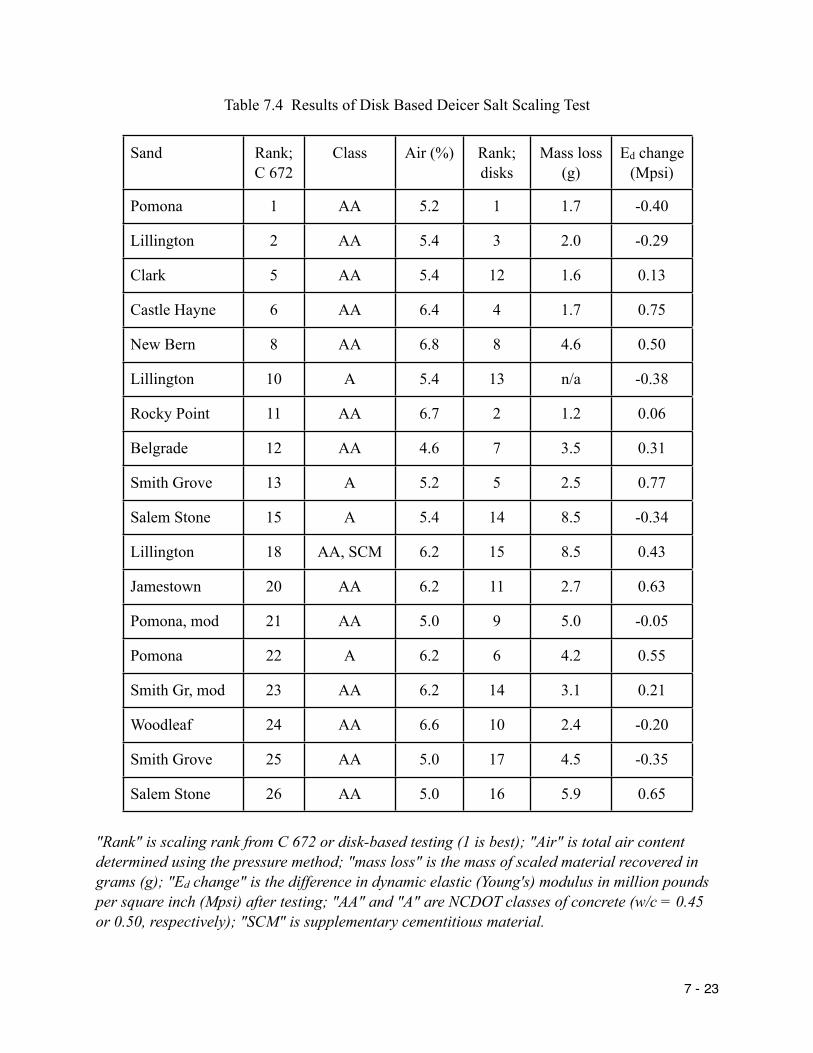
Table 7.4 Results of Disk Based Deicer Salt Scaling Test
Sand Rank; C 672
Class Air (%) Rank; disks
Mass loss (g)
Ed change (Mpsi)
Pomona 1 AA 5.2 1 1.7 -0.40
Lillington 2 AA 5.4 3 2.0 -0.29
Clark 5 AA 5.4 12 1.6 0.13
Castle Hayne 6 AA 6.4 4 1.7 0.75
New Bern 8 AA 6.8 8 4.6 0.50
Lillington 10 A 5.4 13 n/a -0.38
Rocky Point 11 AA 6.7 2 1.2 0.06
Belgrade 12 AA 4.6 7 3.5 0.31
Smith Grove 13 A 5.2 5 2.5 0.77
Salem Stone 15 A 5.4 14 8.5 -0.34
Lillington 18 AA, SCM 6.2 15 8.5 0.43
Jamestown 20 AA 6.2 11 2.7 0.63
Pomona, mod 21 AA 5.0 9 5.0 -0.05
Pomona 22 A 6.2 6 4.2 0.55
Smith Gr, mod 23 AA 6.2 14 3.1 0.21
Woodleaf 24 AA 6.6 10 2.4 -0.20
Smith Grove 25 AA 5.0 17 4.5 -0.35
Salem Stone 26 AA 5.0 16 5.9 0.65
"Rank" is scaling rank from C 672 or disk-based testing (1 is best); "Air" is total air content determined using the pressure method; "mass loss" is the mass of scaled material recovered in grams (g); "Ed change" is the difference in dynamic elastic (Young's) modulus in million pounds per square inch (Mpsi) after testing; "AA" and "A" are NCDOT classes of concrete (w/c = 0.45 or 0.50, respectively); "SCM" is supplementary cementitious material.
7 - 23
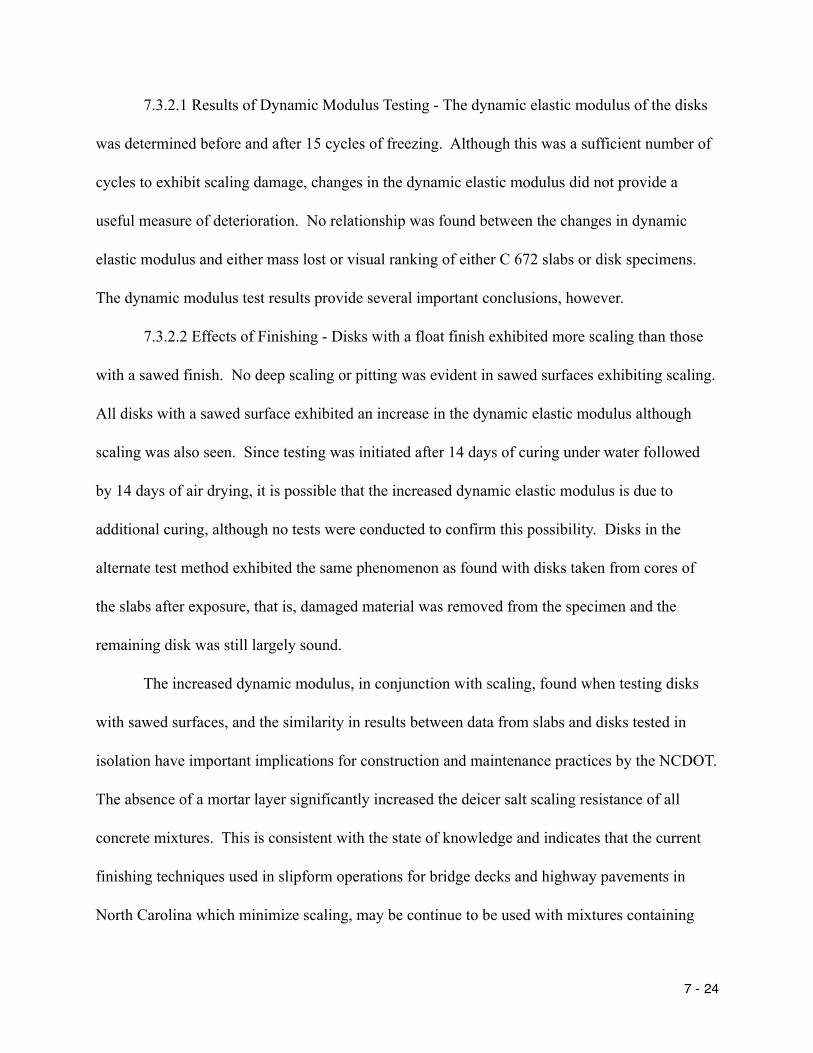
7.3.2.1 Results of Dynamic Modulus Testing - The dynamic elastic modulus of the disks
was determined before and after 15 cycles of freezing. Although this was a sufficient number of
cycles to exhibit scaling damage, changes in the dynamic elastic modulus did not provide a
useful measure of deterioration. No relationship was found between the changes in dynamic
elastic modulus and either mass lost or visual ranking of either C 672 slabs or disk specimens.
The dynamic modulus test results provide several important conclusions, however.
7.3.2.2 Effects of Finishing - Disks with a float finish exhibited more scaling than those
with a sawed finish. No deep scaling or pitting was evident in sawed surfaces exhibiting scaling.
All disks with a sawed surface exhibited an increase in the dynamic elastic modulus although
scaling was also seen. Since testing was initiated after 14 days of curing under water followed
by 14 days of air drying, it is possible that the increased dynamic elastic modulus is due to
additional curing, although no tests were conducted to confirm this possibility. Disks in the
alternate test method exhibited the same phenomenon as found with disks taken from cores of
the slabs after exposure, that is, damaged material was removed from the specimen and the
remaining disk was still largely sound.
The increased dynamic modulus, in conjunction with scaling, found when testing disks
with sawed surfaces, and the similarity in results between data from slabs and disks tested in
isolation have important implications for construction and maintenance practices by the NCDOT.
The absence of a mortar layer significantly increased the deicer salt scaling resistance of all
concrete mixtures. This is consistent with the state of knowledge and indicates that the current
finishing techniques used in slipform operations for bridge decks and highway pavements in
North Carolina which minimize scaling, may be continue to be used with mixtures containing
7 - 24

manufactured sand. These findings also indicate that, since deicer salt scaling is largely a surface
phenomenon, the serviceability of pavements and bridge decks showing signs of scaling may be
successfully improved by grinding.
Another conclusion is that an increased test duration will not likely show significant
improvement or differences in dynamic modulus of disks using the alternate salt scaling test.
Since salt scaling resistance, at least for air entrained concretes suitable for paving applications,
is essentially a surface phenomenon, visual assessment remains a suitable, if less than optimal
evaluation method.
7.3.2.3 Results of Visual Rankings and Mass Lost - While the rankings were similar to
those from testing the ASTM C 672 slabs, results were significantly different in several cases.
Since rankings were based on visual assessment in both test methods, this may indicate that
additional disks or larger disks (150 mm (6 in.), for example) or both should be used to increase
the area for visual comparison. Loss of a relatively thin, but wide area on any single disk could
skew the visual rankings. Alternately, additional cycles may be needed in the disk based test to
attain equivalent results with ASTM C 672, which uses 50 cycles compared to the 15 used in the
alternate test method. Figure 7.4 shows the rankings based on the two methods used.
7 - 25
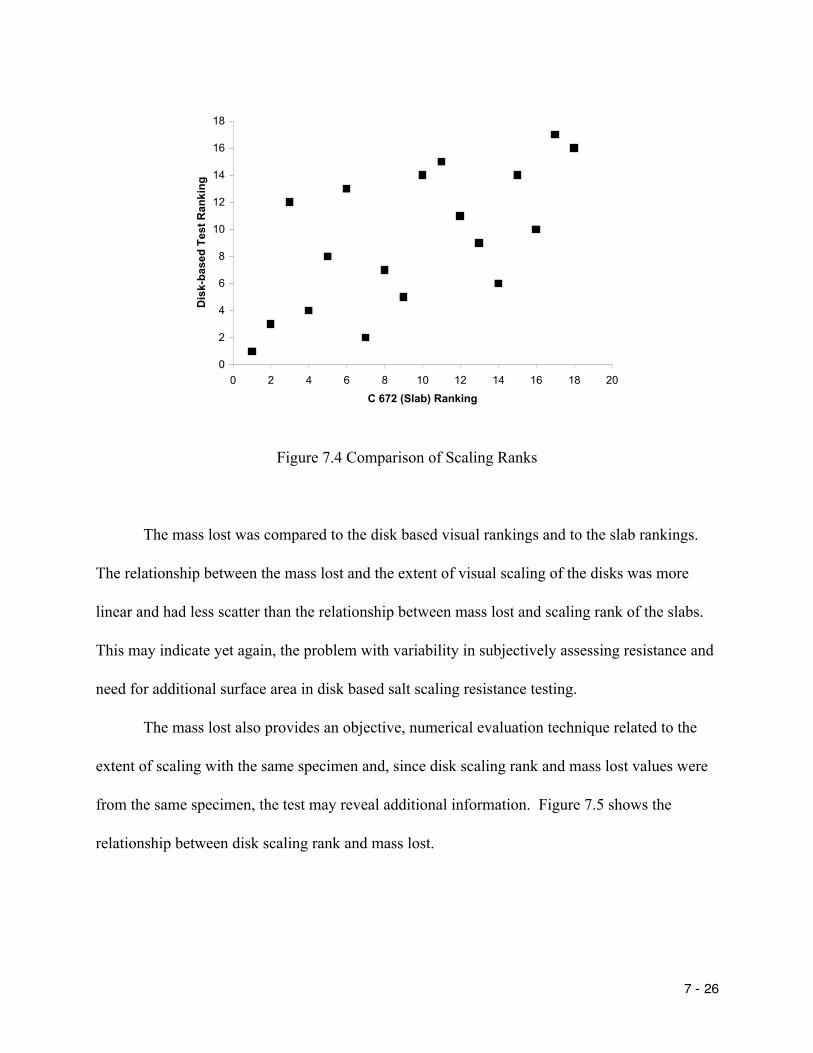
0
2
4
6
8
10
12
14
16
18
0 2 4 6 8 10 12 14 16 18 20
C 672 (Slab) Ranking
Dis
k-ba
sed
Test
Ran
king
Figure 7.4 Comparison of Scaling Ranks
The mass lost was compared to the disk based visual rankings and to the slab rankings.
The relationship between the mass lost and the extent of visual scaling of the disks was more
linear and had less scatter than the relationship between mass lost and scaling rank of the slabs.
This may indicate yet again, the problem with variability in subjectively assessing resistance and
need for additional surface area in disk based salt scaling resistance testing.
The mass lost also provides an objective, numerical evaluation technique related to the
extent of scaling with the same specimen and, since disk scaling rank and mass lost values were
from the same specimen, the test may reveal additional information. Figure 7.5 shows the
relationship between disk scaling rank and mass lost.
7 - 26

0
2
4
6
8
10
12
14
16
18
0.0 2.0 4.0 6.0 8.0 10.0
Mass Lost (g)
Scal
ing
Ran
k
Figure 7.5 Mass Loss and Visual Scaling Rank of Disks
The data points shown as diamonds appear to indicate a clear relationship between
scaling and mass lost, which was intuitively expected. The data points shown as grayed squares
(mixtures containing Clark, Jamestown, Salem Stone, Woodleaf, Smith Grove, or Smith Grove
with reduced fines) also appear to show a roughly linear relationship between mass lost and
scaling, but with a different relationship than appears to exist with the other mixtures.
These data in Fig. 7.5 include results with both Class AA and Class A mixtures, and one
mixture with SCM. All of the data represented by grayed squares were Class AA mixtures. As
previously, additional analysis was based on results from Class AA mixtures only. Table 7.5
shows the mass lost and both scaling ranks for all Class AA mixtures without SCM.
7 - 27

Table 7.5 Comparison of Disk and Slab Scaling with Mass Loss; Class AA Mixtures
Sand Mass lost (g) Scaling Rank, Disks
Scaling Rating, C 672
Scaling Rank, C 672
Pomona 1.7 1 1 1
Lillington 2.0 3 1 2
Castle Hayne 1.7 4 1 6
New Bern 4.6 8 2 8
Rocky Point 1.2 2 2 11
Belgrade 3.5 7 2 12
Clark 1.6 12 1 5
Jamestown 2.7 11 3 20
Woodleaf 2.4 10 4 24
Smith Grove 4.5 17 4 25
Salem Stone 5.9 16 4 26
Sources of sand shown in italics are those represented by grayed squares in Fig. 7.5
All of those mixtures represented by grayed squares, except the mixture containing the
Clark sand, had scaling ratings of 3 or 4 when tested in accordance with ASTM C672, indicating
significant deicer salt scaling. If two clusters of mixtures exist in the data, as suggested by
Figure 7.5, those clusters appear to represent those mixtures more susceptible to deicer salt
scaling (grayed squares) and those less susceptible (diamonds), except for the mixture containing
Clark sand. The anomalous behavior of the mixture containing Clark sand could not be
explained definitively, but may be related to issues of specimen area or number of freezing and
thawing cycles discussed above. The geology of the Clark manufactured sand was different from
7 - 28
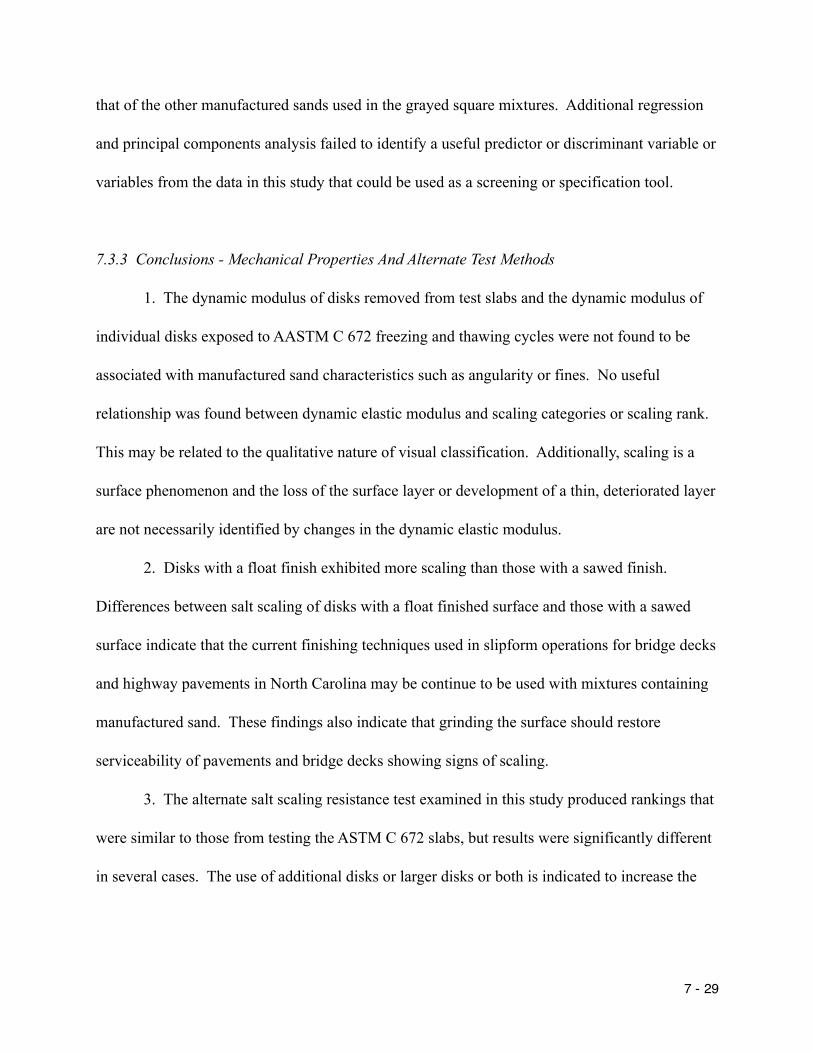
that of the other manufactured sands used in the grayed square mixtures. Additional regression
and principal components analysis failed to identify a useful predictor or discriminant variable or
variables from the data in this study that could be used as a screening or specification tool.
7.3.3 Conclusions - Mechanical Properties And Alternate Test Methods
1. The dynamic modulus of disks removed from test slabs and the dynamic modulus of
individual disks exposed to AASTM C 672 freezing and thawing cycles were not found to be
associated with manufactured sand characteristics such as angularity or fines. No useful
relationship was found between dynamic elastic modulus and scaling categories or scaling rank.
This may be related to the qualitative nature of visual classification. Additionally, scaling is a
surface phenomenon and the loss of the surface layer or development of a thin, deteriorated layer
are not necessarily identified by changes in the dynamic elastic modulus.
2. Disks with a float finish exhibited more scaling than those with a sawed finish.
Differences between salt scaling of disks with a float finished surface and those with a sawed
surface indicate that the current finishing techniques used in slipform operations for bridge decks
and highway pavements in North Carolina may be continue to be used with mixtures containing
manufactured sand. These findings also indicate that grinding the surface should restore
serviceability of pavements and bridge decks showing signs of scaling.
3. The alternate salt scaling resistance test examined in this study produced rankings that
were similar to those from testing the ASTM C 672 slabs, but results were significantly different
in several cases. The use of additional disks or larger disks or both is indicated to increase the
7 - 29

area for visual comparison. Additional cycles may also be needed in the disk based test to attain
equivalent results with ASTM C 672.
4. The mass lost and the extent of visual scaling of individual disks are clearly related,
and two possible groups or clusters of data were observed. The groups had different, but roughly
linear relationships between scaling and mass lost. The characteristics of mixtures in the clusters
were not consistent with findings based on slabs alone, differences in geology, or other sand or
mixture characteristics.
5. While the alternate test method appears promising, additional study is recommended
to develop this simpler and easier alternate to ASTM C 672.
7.4 POSSIBLE USE OF A NON-LINEAR FACTOR PRODUCT
A simple non-linear analysis provided interesting results. Void content, stone dust
content, and, to a limited extent, roundness and percent blade shaped particles had been found to
be contributing factors to deicer salt scaling when assessed visually. Assuming that the more
"flawed" these sand characteristics, the lower the salt scaling resistance might be, a product of
those factors was calculated and compared to the several measures of deterioration found in this
study. Table 7.6 shows the values used to calculate the factor product (∏f) and the scaling rank
based on C 672 slabs. In this case, the scaling rank is that of the subgroup only; the relationships
were similar when comparing ∏f to scaling rank including all mixtures. Figure 7.6 shows the
relationship between the ∏f and the scaling rank. The value of ∏f is calculated as the product of
roundness, %BSP, void content (Method A; %), and the quantity of material passing the 75 µm
(#200) sieve divided by 1,000 to keep values numerically more manageable. The sands are listed
7 - 30
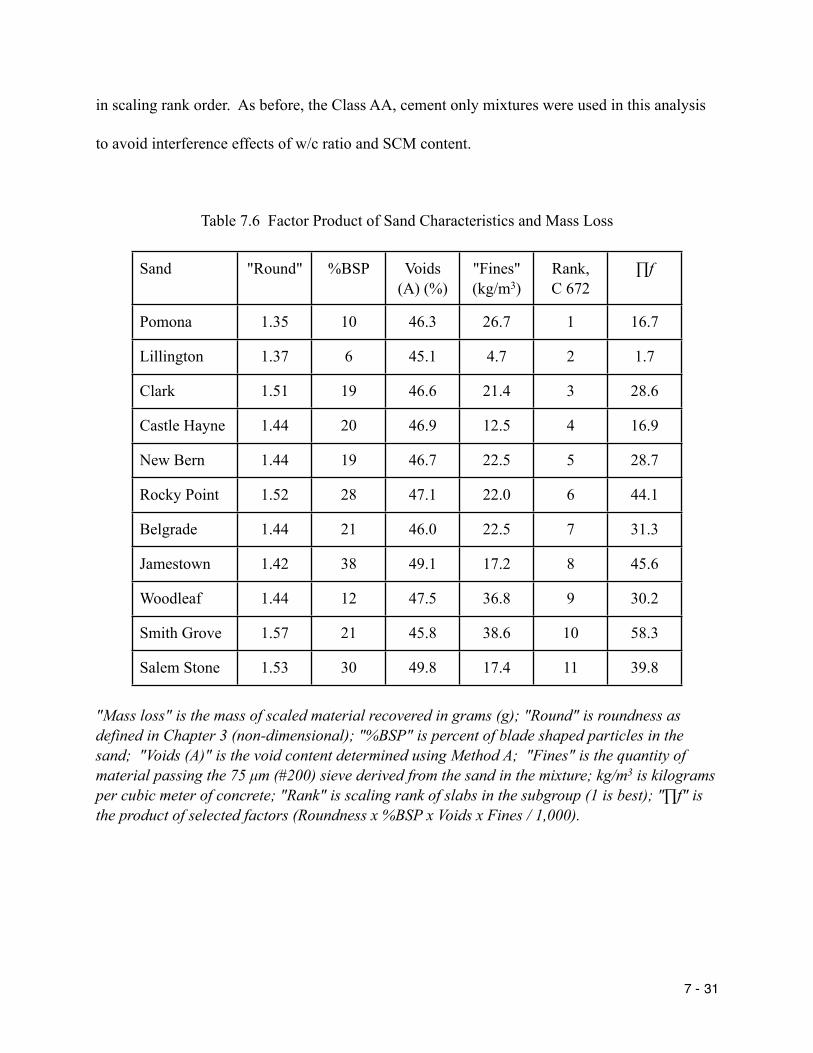
in scaling rank order. As before, the Class AA, cement only mixtures were used in this analysis
to avoid interference effects of w/c ratio and SCM content.
Table 7.6 Factor Product of Sand Characteristics and Mass Loss
Sand "Round" %BSP Voids (A) (%)
"Fines" (kg/m3)
Rank, C 672
∏f
Pomona 1.35 10 46.3 26.7 1 16.7
Lillington 1.37 6 45.1 4.7 2 1.7
Clark 1.51 19 46.6 21.4 3 28.6
Castle Hayne 1.44 20 46.9 12.5 4 16.9
New Bern 1.44 19 46.7 22.5 5 28.7
Rocky Point 1.52 28 47.1 22.0 6 44.1
Belgrade 1.44 21 46.0 22.5 7 31.3
Jamestown 1.42 38 49.1 17.2 8 45.6
Woodleaf 1.44 12 47.5 36.8 9 30.2
Smith Grove 1.57 21 45.8 38.6 10 58.3
Salem Stone 1.53 30 49.8 17.4 11 39.8
"Mass loss" is the mass of scaled material recovered in grams (g); "Round" is roundness as defined in Chapter 3 (non-dimensional); "%BSP" is percent of blade shaped particles in the sand; "Voids (A)" is the void content determined using Method A; "Fines" is the quantity of material passing the 75 µm (#200) sieve derived from the sand in the mixture; kg/m3 is kilograms per cubic meter of concrete; "Rank" is scaling rank of slabs in the subgroup (1 is best); "∏f" is the product of selected factors (Roundness x %BSP x Voids x Fines / 1,000).
7 - 31

0
2
4
6
8
10
12
0 10 20 30 40 50 60 70Factor Product
Scal
ing
Ran
k, C
672
(sub
grou
p)
Figure 7.6 Scaling Rank of Slabs and Factor Product
Figure 7.6 shows that deicer salt scaling is reduced as the sand becomes more angular,
less round, and more blade-shaped, and as the fines content, presumably with similar
characteristics, increases. This finding is important in understanding the effects of sand
characteristics and is logical, but the use of the factor product has very limited practical value.
Determining roundness and percent of blade shape particles in sands cannot be accomplished in
most labs currently. Using the void content and fines content alone, which are easily determined
in field labs, to help classify and identify changes in manufactured sands is more practical and
useful. The difficulty noted previously with using a rank order based on visual assessment limits
the use to preliminary classification and general guidelines. No important relationships were
found between the factor product and the alternate test method data.
7 - 32

7.4 DISCUSSION AND CONCLUSIONS - DEICER SALT SCALING RESISTANCE
Due to the difficulties with objective measures, the effects of manufactured sand on
deicer salt scaling is largely limited to qualitative findings. While the results are believed to be
valid, they cannot be used at this time to conclusively establish numerically based specifications.
In all of the models reviewed in this chapter, the angularity term, as measured by voids content,
was the more powerful independent variable. The fines content, that is, the quantity of stone dust
or material passing the 75 µm (#200) sieve, in the mixture was also found to be important. Both
of these sand characteristics affected water demand and frost resistance, which were cross-
correlated.
Limitations on these combined factors were suggested (Eq. 7.4a and 7.4b), but these must
be used with caution due to the variability in the relationship resulting from the use of subjective
evaluation in rankings and the non-linear nature of an integer ranking system. The study also
found that low fines content sands that contained more rounded particles and had fewer blade
shaped particles on the intermediate sieves were likely to have excellent deicer salt scaling
resistance. Further research is suggested to validate the models based on angularity and fines
developed in this study and to develop alternate test methods to simplify C 672 techniques.
7 - 33

CHAPTER 8EFFECTS OF MODIFIED AGGREGATE GRADATION ON DEICER SALT SCALING
8.1 BACKGROUND
NCDOT specifications for fine and coarse aggregates permits a relatively wide variation
in grading for both. Aggregates can be termed "well-graded," when neither too few nor too
many particles are found on any one sieve, "uniformly graded," when particles are concentrated
on one or two adjacent sieves, or "gap-graded," when a deficiency is found in particles on one or
two adjacent, typically midsized sieves.
Concrete mixtures are normally proportioned using fine and coarse aggregates separately
meeting the NCDOT specifications, which often results in a deficit of certain particle sizes,
typically those in the 9.5 mm (3/8 in.) to 2.36 mm (#8) sized fractions, of the combined
aggregate system. Tighter gradation requirements, intended to provide a more well-graded
overall, or total, aggregate grading, have been proposed to reduce the likelihood of using either
more gap-graded or more uniformly graded combined aggregate systems in concrete mixtures.
A more well-graded combined aggregate gradation is claimed to improve water demand and
workability, and require less cement and paste by reducing the voids in the aggregate mass, a
fundamental concept commonly used in asphalt concrete mixtures.
Various methods have been proposed to achieve a more well-graded aggregate by
requiring more tightly controlled aggregate gradations than those in NCDOT specifications or by
specifying total aggregate gradations to include the combined fine and coarse fractions. ACI
Committee 301 [2002] included the combined fineness modulus, the coarseness factor chart, the
0.45 power chart, and the "8-to-18" gradation guideline as proportioning methods. In the "8-
8 - 1
to-18" gradation approach, the mass of particles on each specified sieve must be between 8% and
18%, inclusive, of the total mass of the sample.
Findings in the literature are both mixed and few in number. Concrete mixtures
containing a well-graded combined aggregate system, and therefore, fewer voids to be filled with
paste, are claimed to have improved workability and reduced water demand, and to require less
cement than concrete mixtures with uniform or gap-graded aggregates [Cramer, Hall, and Parry
1995, Shilstone 1989, Shilstone 1990, Shilstone 1991, Shilstone and Shilstone 1993]. Nichols
[1982], however, stated that changes in gradation have little effect on water demand for a given
manufactured sand. Information on frost durability as a function of the aggregate gradations is
very limited with past studies focused on the effects of gradation on water demand, cement
economy and strength. No reports were found examining the effect of overall aggregate grading
or fine aggregate grading alone on frost durability with manufactured sands.
Improvements in gradation have been claimed to reduce water demand and, since water
demand was found to be important in deicer salt scaling resistance of concretes produced with
manufactured sand, a limited examination of the effects of aggregate grading was conducted.
Two studies were conducted, one examining the effects of different overall aggregate gradings
and the other examining the effects of different manufactured sand gradings, including the
possible compounding effects of fines content.
8 - 2

8.2 OVERALL AGGREGATE GRADING
8.2.1 Aggregates
In the first phase, the effects of the "8-to-18" combined aggregate gradation guideline
were examined. Three concrete mixtures were tested. Two mixtures contained aggregate
fractions based on the "8-to-18" gradation specification, one of which met the specification, the
other of which was similar but could be obtained relatively easily in practice by blending only
three commercially available aggregates. The third mixture was proportioned in accordance with
ACI 211 recommendations. This mixture was the control.
Lillington sand and Garner crushed stone coarse aggregate were used to ensure that any
effects found were due solely to the effects of aggregate grading. The Lillington sand also
exacerbated any effects due to gap-grading of the composite aggregate system since it is
naturally deficient in 4.75 mm (#4) material, and has a large amount of material retained on a
single sieve, the 300 µm (#30). The coarse aggregate also has a dominant sieve size with a large
percentage of the material retained on the 12.5 mm (1/2 in.) sieve. Using these two aggregates in
a conventionally proportioned concrete mixture would produce a mixture with a deficit of mid-
sized material in the combined aggregate system.
A third aggregate was used in one mixture to compare effects of a "nearly 8-to-18"
combined aggregate system. This aggregate conformed to the NCDOT #78 M specification with
almost all of the material retained on the 4.75 mm (#4) sieve. Table 8.1 provides the gradations
of the individual, as-received aggregates, and the gradations of the combined aggregate blends of
the three mixtures investigated in this phase.
8 - 3
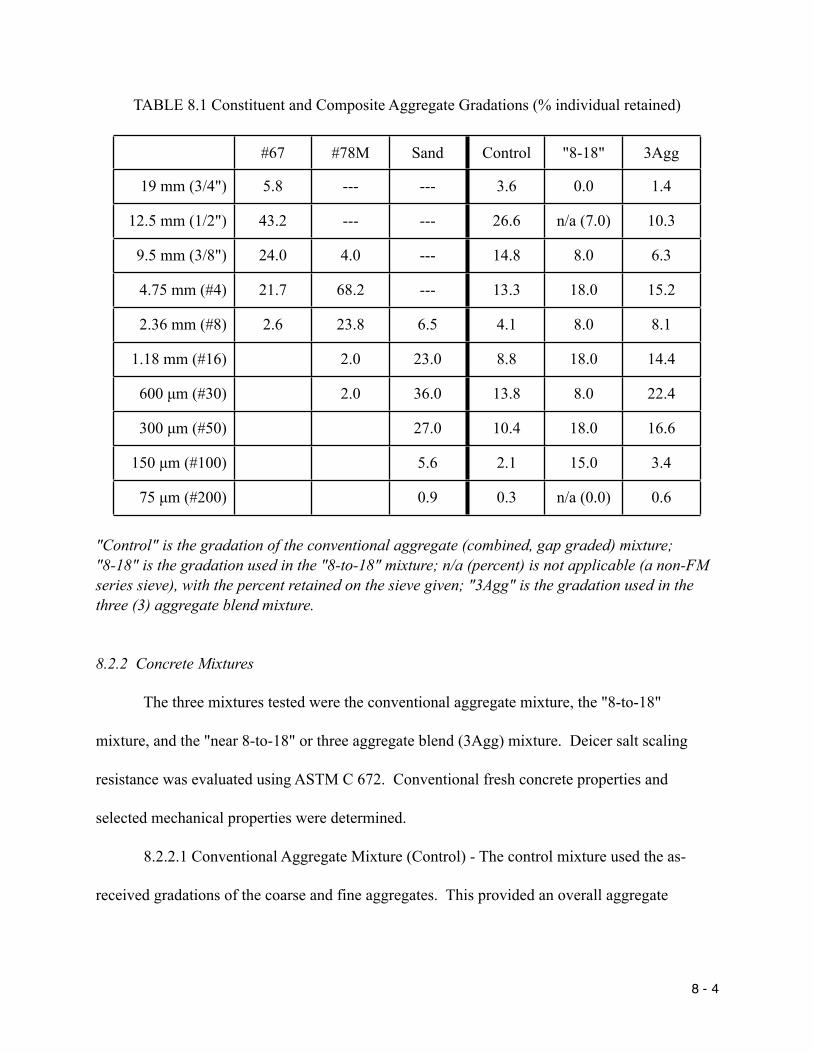
TABLE 8.1 Constituent and Composite Aggregate Gradations (% individual retained)
#67 #78M Sand Control "8-18" 3Agg
19 mm (3/4") 5.8 --- --- 3.6 0.0 1.4
12.5 mm (1/2") 43.2 --- --- 26.6 n/a (7.0) 10.3
9.5 mm (3/8") 24.0 4.0 --- 14.8 8.0 6.3
4.75 mm (#4) 21.7 68.2 --- 13.3 18.0 15.2
2.36 mm (#8) 2.6 23.8 6.5 4.1 8.0 8.1
1.18 mm (#16) 2.0 23.0 8.8 18.0 14.4
600 µm (#30) 2.0 36.0 13.8 8.0 22.4
300 µm (#50) 27.0 10.4 18.0 16.6
150 µm (#100) 5.6 2.1 15.0 3.4
75 µm (#200) 0.9 0.3 n/a (0.0) 0.6
"Control" is the gradation of the conventional aggregate (combined, gap graded) mixture; "8-18" is the gradation used in the "8-to-18" mixture; n/a (percent) is not applicable (a non-FM series sieve), with the percent retained on the sieve given; "3Agg" is the gradation used in the three (3) aggregate blend mixture.
8.2.2 Concrete Mixtures
The three mixtures tested were the conventional aggregate mixture, the "8-to-18"
mixture, and the "near 8-to-18" or three aggregate blend (3Agg) mixture. Deicer salt scaling
resistance was evaluated using ASTM C 672. Conventional fresh concrete properties and
selected mechanical properties were determined.
8.2.2.1 Conventional Aggregate Mixture (Control) - The control mixture used the as-
received gradations of the coarse and fine aggregates. This provided an overall aggregate
8 - 4

gradation that is deficient in the mid-sized particles, resulting in a mixture with a "gap-graded"
total aggregate system.
8.2.2.2 "8-to-18" Aggregate Mixture - This mixture was produced using aggregate
meeting the "8-to-18" gradation. Both fine and coarse aggregate samples were separated into
specific sieve fractions which were then blended to produce a composite aggregate system
meeting the "8-to-18" guideline.
An "8-to-18" gradation can be considered as a 13% specification with a +/- 5% tolerance
for material retained on the prescribed sieves. Estimates of precision in ASTM C 136 vary by
size fraction and, although based on the percent material passing rather than individual percent
retained, the acceptable range between two tests at different labs will be from about 2% to 3% to
5% or greater for testing alone for meeting the "8-to-18" guidelines. This suggests that a 5%
tolerance in delivered material, considering variation in production as well as testing, could be a
relatively strict requirement in many locations. For this study, the materials were blended such
that the material retained on each sieve was either 8% or 18% so that results could be assessed
under realistic, rather than ideal conditions. In addition, the gradation was established such that
if the material retained on one sieve was 8%, the material retained on the subsequent sieve was
18%, again, not an ideal situation but one within the stated tolerances, to help assess if the "8-
to-18" philosophy was robust and technically sound in all cases.
8.2.2.3 Three Aggregate Blend Mixture (3Agg) - Since obtaining a combined aggregate
gradation meeting the "8-to-18" requirements may not be practical or economically feasible in all
areas, an alternate approach was used to obtain a gradation close to the "8-to-18" requirements
using three different aggregates without changing the as-received gradation. The natural sand
8 - 5
and crushed #67 stone were combined with the #78M crushed stone to provide a combined
gradation matching the "8-to-18" specification as closely as possible without modifying the
individual aggregate gradations. This is both a practical option for commercial use and also
permitted some assessment of sensitivity of the concrete mixture to deviations from the "8-to-18"
target. The #78M material compensated for the deficit in midsized aggregates found with the
combined, as-received coarse and fine aggregates.
The 3Agg combined gradation was obtained by using a 1:0.389:0.239 sand:#67:#78M
ratio, equivalent to nominal proportions of 386 kg/m3 (650 pcy) of #67 plus 237 kg/m3 (400 pcy)
of #78M plus 992 kg/m3 (1672 pcy) of natural sand. These proportions were selected to closely
simulate the manually blended 8-to-18 gradation by using the three aggregates as-received.
8.2.2.4 Composition and Properties - The mixtures were proportioned to have a
maximum w/c ratio of 0.45 with a target slump of 75 +/- 40 mm (3 +/ 1.5 inches) and an air
content of 6 +/ 1%. All mixtures contained a water-reducing and retarding admixture
conforming to ASTM C 494, Type D. The water demand varied considerably and obtaining the
desired slump and air content of the "8-to-18" and 3AB mixtures was difficult, even with
multiple trial batches. The tolerances on slump and air were relaxed somewhat, but the results
are conservative in that the control mixture had the highest slump and the lowest air content.
Table 8.2 summarizes the concrete mixture composition and the properties of the fresh and
hardened concrete in this phase.
8 - 6
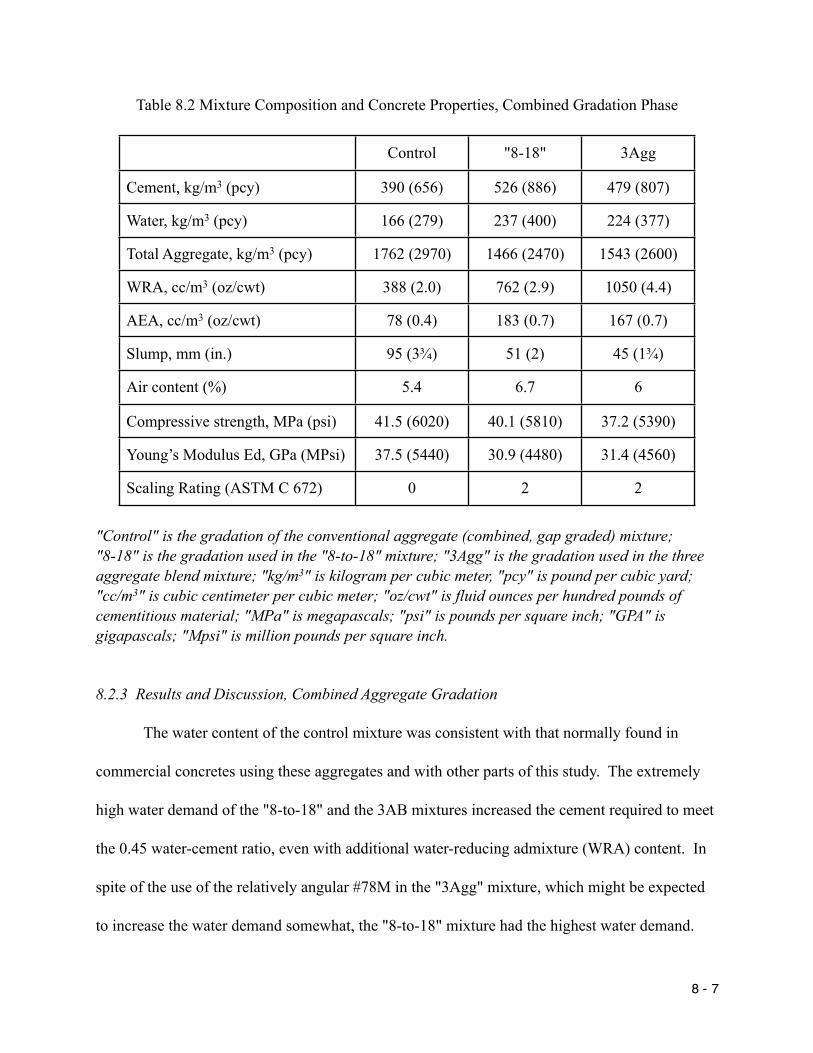
Table 8.2 Mixture Composition and Concrete Properties, Combined Gradation Phase
Control "8-18" 3Agg
Cement, kg/m3 (pcy) 390 (656) 526 (886) 479 (807)
Water, kg/m3 (pcy) 166 (279) 237 (400) 224 (377)
Total Aggregate, kg/m3 (pcy) 1762 (2970) 1466 (2470) 1543 (2600)
WRA, cc/m3 (oz/cwt) 388 (2.0) 762 (2.9) 1050 (4.4)
AEA, cc/m3 (oz/cwt) 78 (0.4) 183 (0.7) 167 (0.7)
Slump, mm (in.) 95 (3¾) 51 (2) 45 (1¾)
Air content (%) 5.4 6.7 6
Compressive strength, MPa (psi) 41.5 (6020) 40.1 (5810) 37.2 (5390)
Young’s Modulus Ed, GPa (MPsi) 37.5 (5440) 30.9 (4480) 31.4 (4560)
Scaling Rating (ASTM C 672) 0 2 2
"Control" is the gradation of the conventional aggregate (combined, gap graded) mixture; "8-18" is the gradation used in the "8-to-18" mixture; "3Agg" is the gradation used in the three aggregate blend mixture; "kg/m3" is kilogram per cubic meter, "pcy" is pound per cubic yard; "cc/m3" is cubic centimeter per cubic meter; "oz/cwt" is fluid ounces per hundred pounds of cementitious material; "MPa" is megapascals; "psi" is pounds per square inch; "GPA" is gigapascals; "Mpsi" is million pounds per square inch.
8.2.3 Results and Discussion, Combined Aggregate Gradation
The water content of the control mixture was consistent with that normally found in
commercial concretes using these aggregates and with other parts of this study. The extremely
high water demand of the "8-to-18" and the 3AB mixtures increased the cement required to meet
the 0.45 water-cement ratio, even with additional water-reducing admixture (WRA) content. In
spite of the use of the relatively angular #78M in the "3Agg" mixture, which might be expected
to increase the water demand somewhat, the "8-to-18" mixture had the highest water demand.
8 - 7
The higher paste content resulting from the excessive water demand reduced the effective
aggregate content per unit volume of the "8-to-18" mixture and the "3Agg" mixture (the
approximate "8-to-18"). Both the "8-to-18" and the 3Agg mixtures were over-sanded when
fresh, even with less total aggregate per volume, due to the relatively high content of fine
material, and were sticky, likely due in part to the high cement content. The control mix was
workable and presented no difficulties in finishing.
For the same water-cement ratio of 0.45, the compressive strength and dynamic elastic
modulus were lower for the "8-to-18" and 3Agg mixtures. This reduction in strength is
consistent with the high cement and water and associated high paste contents. The reduction in
dynamic elastic modulus is consistent with the lower measured strengths and may also be
affected by the lower aggregate content per unit volume.
Both the "8-to-18" and the 3Agg mixtures exhibited "moderate" scaling at the end of 50
freeze thaw cycles. The rating classification was at the borderline between a rating of "2" and a
"3". Compared to the "no to minimal scaling” rating of the control mixture, produced with a
conventional, gap graded aggregate system, the deicer salt scaling resistance of both the "8-
to-18" and 3Agg mixtures was significantly compromised. Microscopic analysis of the air void
system was not conducted, however, observation with a hand lens of sawed faces of concrete
specimens did not identify any unusual features and indicated the air void system was adequate.
Measured air contents were higher for the “8-to-18" and 3Agg mixtures than the control mix.
Since the air content was well above the minimum required, especially considering the
relatively high strengths of these mixtures, and all materials and w/c ratios were otherwise
similar, it must be concluded that the particular "8-to-18" aggregate grading tested deleteriously
8 - 8

affected the deicer salt scaling resistance, as well as the water demand, for concretes produced
with the Lillington natural sand and Garner #67 crushed stone.
The use of the "8-to-18" gradation control technique has been reported to be useful with
at least some materials. This study found that the use of "8-to-18" gradation was injurious to
concrete performance, including deicer salt scaling, using materials with excellent service
records. It is therefore suggested that laboratory tests be conducted to confirm the performance
of concrete produced with the specific aggregates and gradation to be used, when non-standard
aggregate gradings are proposed and a history of satisfactory service is not available with that
particular combination of aggregate grading and set of materials.
8.3 EFFECTS OF FINE AGGREGATE GRADATION
When the limitations of the combined aggregate gradation approach using these materials
became apparent, additional testing was conducted to investigate the effects of fine aggregate
grading only. Fine aggregate is commonly regarded to have a greater effect than coarse
aggregate in influencing water demand of concrete. Two fundamentally different gradings, both
conforming to the NCDOT 2 MS16 specification for manufactured sands, were obtained by
manually recombining size fractions from two different manufactured sands, Salem Stone and
Pomona, that had different levels of angularity as measured by void content using Method A
(49.8% and 46.3%, respectively). Using these two sands was also intended to produce a range of
salt scaling resistance from good to poor.
8 - 9

8.3.1 Sand Gradations
Two gradations of a fundamentally different nature were used, a well-graded blend, and a
uniformly graded; both conformed to the NCDOT 2MS specification. The gradations were also
selected such that the fineness modulus (FM) values were nearly identical and therefore the
mixtures would be proportioned similarly in practice. Table 8.3 gives the gradings used and a
grading matching the 0.45 power curve, for comparison. The material passing 150 µm (#100)
was limited to 6% in the gradations used in the full scale concrete mixtures. This value is at the
lower end of the 20 to 0.5% bracket allowed in the 2MS specification. This would provide
sufficient fines for finishability or closing the surface, while maintaining a low enough fines
content to minimize the potential for fines contributions to salt scaling found earlier.
Since interaction effects with grading were possible, the effects of fines were examined
with two additional gradations. Samples were prepared with material passing the 150 µm (#100)
increased to 12% for the low angularity Pomona sand to produce both a well graded and a
uniformly graded sand . The mixtures were designated "U" for uniformly graded, "W" for well-
graded, and "UF" and "WF" for the uniformly and well-graded samples with higher fines
content, respectively. The Salem Stone sand, with higher angularity, was designated "H" and the
Pomona designated "L."
8.3.2 Testing
A more severe freezing exposure was used which was intended to yield greater
differences in performance. This was not done to evaluate scaling resistance itself but to provide
better resolution in results between the different aggregate gradings by exacerbating salt scaling
8 - 10
effects. The method followed was that outlined in ASTM C 672, except that the rate of
temperature change in both the freezing and thawing cycles was approximately 50% faster than
that permitted in the standard. This resulted in much greater scaling than in the other study and
provided useful resolution between samples, allowing more definite conclusions regarding the
effects of gradation.
The mixture proportions were adjusted such that the L mixtures had approximately the
same water content as the natural sand mixture in the total aggregate gradation phase. The water
contents of the remaining mixtures with manufactured sand were adjusted to have approximately
the same slump as the L-W manufactured sand mixture. As in the previous phases of this study,
adjustment of water, WRA, and air entraining agent was challenging. Water-reducing admixture
dosage was much higher to help offset the effect of the higher angularity manufactured sand and
increased fines combinations. The cement content of both of the mixtures with high angularity
sand was kept the same. Due to the higher water demand of the H-W mixture, the cement
content was considerably higher for both of these mixtures.
8.3.3 Results and Discussion - Fresh Concrete
The are proportions and properties of the mixtures are shown in Table 8.4a (SI units) and
Tables 8.4b (US customary units).
8 - 11
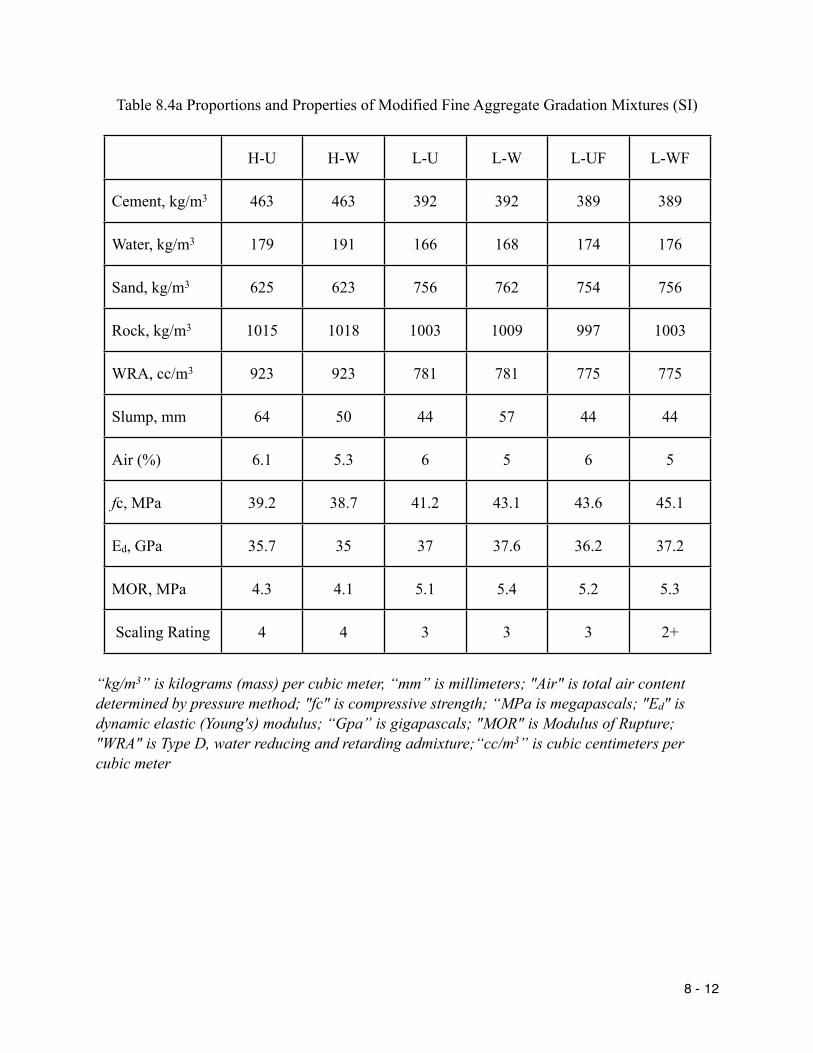
Table 8.4a Proportions and Properties of Modified Fine Aggregate Gradation Mixtures (SI)
H-U H-W L-U L-W L-UF L-WF
Cement, kg/m3 463 463 392 392 389 389
Water, kg/m3 179 191 166 168 174 176
Sand, kg/m3 625 623 756 762 754 756
Rock, kg/m3 1015 1018 1003 1009 997 1003
WRA, cc/m3 923 923 781 781 775 775
Slump, mm 64 50 44 57 44 44
Air (%) 6.1 5.3 6 5 6 5
fc, MPa 39.2 38.7 41.2 43.1 43.6 45.1
Ed, GPa 35.7 35 37 37.6 36.2 37.2
MOR, MPa 4.3 4.1 5.1 5.4 5.2 5.3
Scaling Rating 4 4 3 3 3 2+
“kg/m3” is kilograms (mass) per cubic meter, “mm” is millimeters; "Air" is total air content determined by pressure method; "fc" is compressive strength; “MPa is megapascals; "Ed" is dynamic elastic (Young's) modulus; “Gpa” is gigapascals; "MOR" is Modulus of Rupture; "WRA" is Type D, water reducing and retarding admixture;“cc/m3” is cubic centimeters per cubic meter
8 - 12

Table 8.4b Proportions and Properties of Modified Fine Aggregate Gradation Mixtures (US)
H-U H-W L-U L-W L-UF L-WF
Cement, pcy 780 780 660 660 655 655
Water, pcy 301 322 280 283 294 296
Sand, pcy 1053 1050 1275 1285 1270 1275
Rock, pcy 1710 1715 1690 1700 1680 1690
WRA, oz/cwt 5 5 4 4 4 4
Slump, in 2½ 2 1¾ 2¼ 1¾ 1¾
Air (%) 6.1 5.3 6 5 6 5
fc, psi 5690 5620 5970 6250 6320 6540
Ed, Mpsi 5.18 5.08 5.36 5.45 5.25 5.4
MOR, psi 620 600 740 790 750 770
Scaling Rating 4 4 3 3 3 2+
"pcy" is pounds (mass) per cubic yard; "in." is inches; "Air" is total air content determined by pressure method; "fc" is compressive strength; "psi" is pounds per square inch; "Ed" is dynamic elastic (Young's) modulus; "Mpsi" is million pounds per square inch; "MOR" is Modulus of Rupture; "WRA" is Type D, water reducing and retarding admixture; "oz/cwt" is fluid ounces per hundred pounds of cement
8.3.3.1 Fresh Concrete - Finishability of all of the mixtures was acceptable. The quantity
of fines in these relatively cement rich mixtures provided a surface that could be finished
appropriately.
8 - 13

Consistent with previous findings, the adjusted water demand of mixtures with the H
sand (Salem Stone) was greater than that of the mixtures with the L sand (Pomona), regardless of
the fine aggregate grading. The differences in water content were also affected by the quantity of
material passing the 150 µm (#100), as expected. The water demand for the L-UF and L-WF
were similar but higher than the water demand for the L-U and L-W concretes. Differences in
adjusted water demand due to differences in gradation were so small as to be meaningless
between the L-U and L-W mixtures and between the L-UF and L-WF mixtures.
Slight differences due to grading were found for the mixtures containing more angular
sand. Contrary to initial expectations about using well-graded sand, the H mixture with well-
graded sand had a greater water demand than the H mixture with uniformly graded sand. This
finding also suggests interaction between angularity and gradation, at least at higher levels of
angularity and with a cement rich mixtures. Since only a few gradations were used and the
effects of void content and fines content were studied on a limited basis, additional studies may
be beneficial, especially to examine possible grading interactions with higher void content
manufactured sands.
8.3.3.2 Hardened Concrete - In general, differences in fine aggregate grading had little
effect on mechanical properties compared to the effects due to void content (angularity) and fines
content. The higher water demand associated with higher void content sand again resulted in a
reduction in mechanical properties even at a constant w/c ratio.
No meaningful difference in deicer salt scaling resistance was found due to differences
in aggregate grading or to differences in fines content within the ranges used in this study,
although the fines content in the mixtures was relatively low. Differences in the void content,
8 - 14

again, resulted in clear differences in scaling resistance. Concrete produced with a manufactured
sand which was more angular had less resistance to deicer salt scaling.
8.3.4 Effects of Differences in Fine Aggregate Grading - Conclusions
In general, no meaningful difference or benefit was found in using a well graded or a
uniformly graded manufactured sand that met the NCDOT specifications. It is possible to
optimize fine aggregate gradation for a single source, but, based on the findings of this study, no
additional restrictions on grading by the NCDOT appear to be warranted for manufactured sands,
other than those discussed in Chapter 7. Water demand, strength, and deicer salt scaling
resistance were much more strongly affected by angularity and fines content than by specific
particle size distributions. It was not possible to use gradation alone to manage water demand.
8.4 CONCLUSIONS
1. This part of the study found no benefit associated with maintaining a combined
aggregate gradation conforming to the "8-to-18" requirement. In fact, water demand and deicer
salt scaling were compromised with the two mixtures proportioned in general accordance with
the “8-to-18” guideline, compared to the performance of the conventionally proportioned,
control concrete mixture. Since the "8-to-18" gradation has been reported to be successful with
some aggregates, it is strongly recommended that laboratory tests be conducted to confirm the
performance of concrete produced with the specific aggregates and grading to be used when a
history of satisfactory service is not available with that specific combination of materials and
non-standard gradings.
8 - 15

2. Little, if any, benefit was found in using one particular fine aggregate grading to
achieve a lower water demand in concrete for the manufactured sands studied.
3. No meaningful difference in the deicer salt scaling resistance was observed between
otherwise similar concretes which contained well-graded or uniformly graded manufactured
sands. Differences were consistent with the findings discussed in Chapter 7 regarding the effects
of void content and fines content.
The results of this study are limited to the materials examined. Additional testing with
additional mixtures including a wider variation in material properties such as fines contents,
gradations and void contents may be beneficial.
8 - 16

Chapter 9CONCLUSIONS AND RECOMMENDATIONS
9.1 SAND CHARACTERISTICS
9.1.1. Time of flow of dry sand grains was found to be generally correlated with void
content of sands, however the relationship is non-linear. Sands with high angularities can be
better differentiated on the basis of void content.
9.1.2. Measurements of shape characteristics required the development of image analysis
techniques that could quickly and easily determine the two dimensional shape characteristics of
individual sand grains, and the development or extension of geometrically based measures of
particle shape. The image analysis techniques and shape characteristics developed in this study
appear to be appropriate for the types and ranges of particle shapes of the sands investigated in
this study.
9.1.3. This study demonstrated that particle shape of fine aggregate plays an important
role in determining void content.
9.1.4. Void content was found to increase with decreasing grain size. Changes in the
void content and the grain size are approximately parallel for manufactured sands, therefore
results using a single grain size could be used to develop models of behavior based on angularity.
9.1.5. Although differences in surface texture could be detected with particle based
image analysis techniques, measures which were more sensitive to the surface roughness or
micro-texture of the particles, such as roundness and the perimeter ratio, were not strongly
related to void content.
9 - 1

9.1.6. The coarse sand particles in this study that were long relative to their height when
viewed from the side, that is, the smaller dimension, are more elongated and have distinct surface
irregularities when viewed from the top (or bottom).
9.1.7. No single parameter model based on the shape characteristics used in this study
provided a useful way to predict void content of sand particles. It was necessary to develop
derivative particle shape characteristics or indices based on physically meaningful relationships
between basic shape characteristics.
9.1.8. The regression model developed in this study demonstrated that larger sized sand
particles with highly irregular profiles have higher void contents. Similarly, the model
demonstrated that larger sized sands with more cubically shaped particles have lower void
contents. The numerical relationship found may provide producers with a tool to help select
crushing equipment and techniques to minimize void content.
9.1.9. The recommended model for predicting the effects of larger sized fine aggregate
particle shape on void content is V = 40.8 PMT - 0.589 PC, where V is void content, PMT is
Particle Macro-Texture Index, defined as the radius ratio divided by the aspect ratio (Rr / Ra),
and PC is the Particle Cubicity Index, defined as the ratio of area of the particle to the area of an
enclosing rectangle and the fraction of blade shaped particles (RAR / BSP).
9.1.10. The findings of this study provide guidance on the relative effects of particle
shape on void content of coarse sand particles. Further investigation is needed using a number of
natural and manufactured sands with a wider range of angularity characteristics and geologic
source or parent aggregate. Additional studies are needed to examine the effects of shape
9 - 2

characteristics of different sized particles on void content and possible cross correlations between
the effects of size and shape on void content of sand.
9.2 MORTAR TESTING
9.2.1. The flow table values and the “mini slump” tests are related to void content,
whether measured using the as-received or standardized gradation.
9.2.2. The results of mortar testing confirmed that flow of mortars decreases with
increasing angularity regardless of the test method used. This was true with both blends and
individual sieve sizes.
9.2.3. As particle size decreased, flow values became insensitive to angularity, even with
large differences in angularity. The surface area effect apparently dominated the angularity
effect. The quantity of fines is a critical factor and may be as or more important than the
angularity of fines on water demand. Additional testing required to extend these results to
concrete is discussed in Chapter 6.
9.3 FRESH AND MECHANICAL PROPERTIES OF CONCRETE
9.3.1. The water demand was higher for concrete produced with manufactured sand than
with the natural sand, but the workability was acceptable for paving and surface course
applications for all mixtures; higher water demands were successfully mitigated with admixtures
for the sands used in this study.
9.3.2. The water demand varied based on void content and, to a lesser, but still important
extent, on the fines content of the sands used. The results of water demand based on mortar
9 - 3
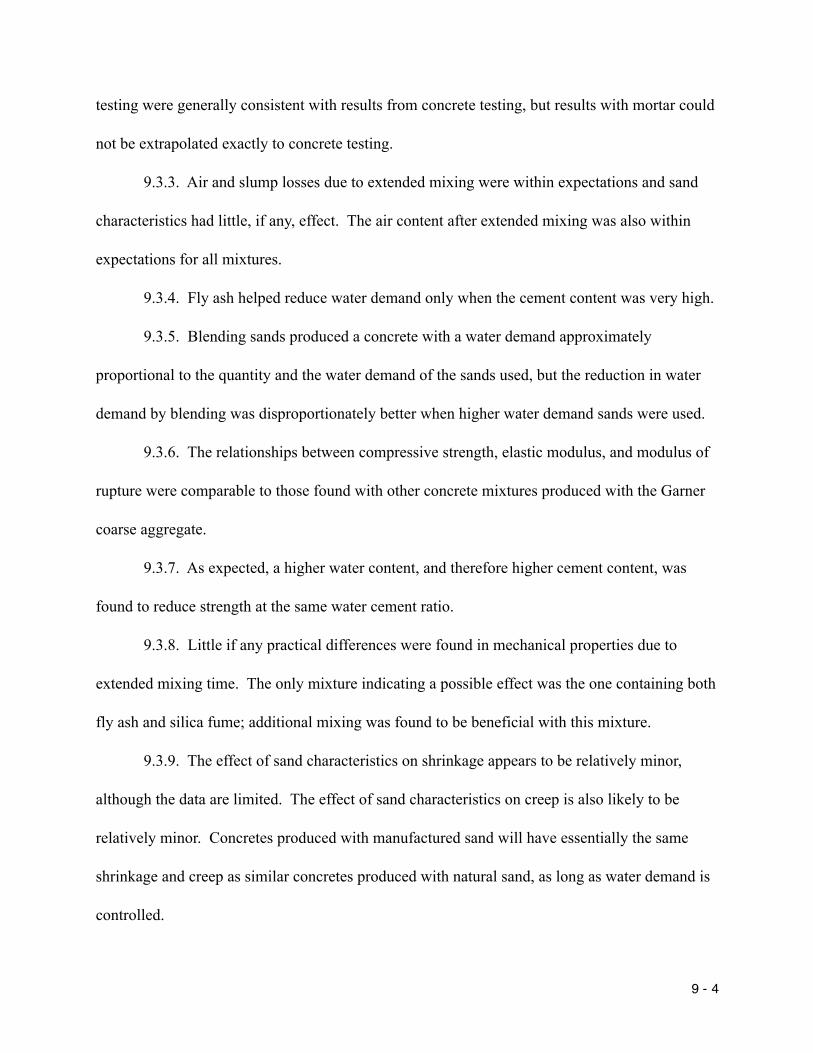
testing were generally consistent with results from concrete testing, but results with mortar could
not be extrapolated exactly to concrete testing.
9.3.3. Air and slump losses due to extended mixing were within expectations and sand
characteristics had little, if any, effect. The air content after extended mixing was also within
expectations for all mixtures.
9.3.4. Fly ash helped reduce water demand only when the cement content was very high.
9.3.5. Blending sands produced a concrete with a water demand approximately
proportional to the quantity and the water demand of the sands used, but the reduction in water
demand by blending was disproportionately better when higher water demand sands were used.
9.3.6. The relationships between compressive strength, elastic modulus, and modulus of
rupture were comparable to those found with other concrete mixtures produced with the Garner
coarse aggregate.
9.3.7. As expected, a higher water content, and therefore higher cement content, was
found to reduce strength at the same water cement ratio.
9.3.8. Little if any practical differences were found in mechanical properties due to
extended mixing time. The only mixture indicating a possible effect was the one containing both
fly ash and silica fume; additional mixing was found to be beneficial with this mixture.
9.3.9. The effect of sand characteristics on shrinkage appears to be relatively minor,
although the data are limited. The effect of sand characteristics on creep is also likely to be
relatively minor. Concretes produced with manufactured sand will have essentially the same
shrinkage and creep as similar concretes produced with natural sand, as long as water demand is
controlled.
9 - 4
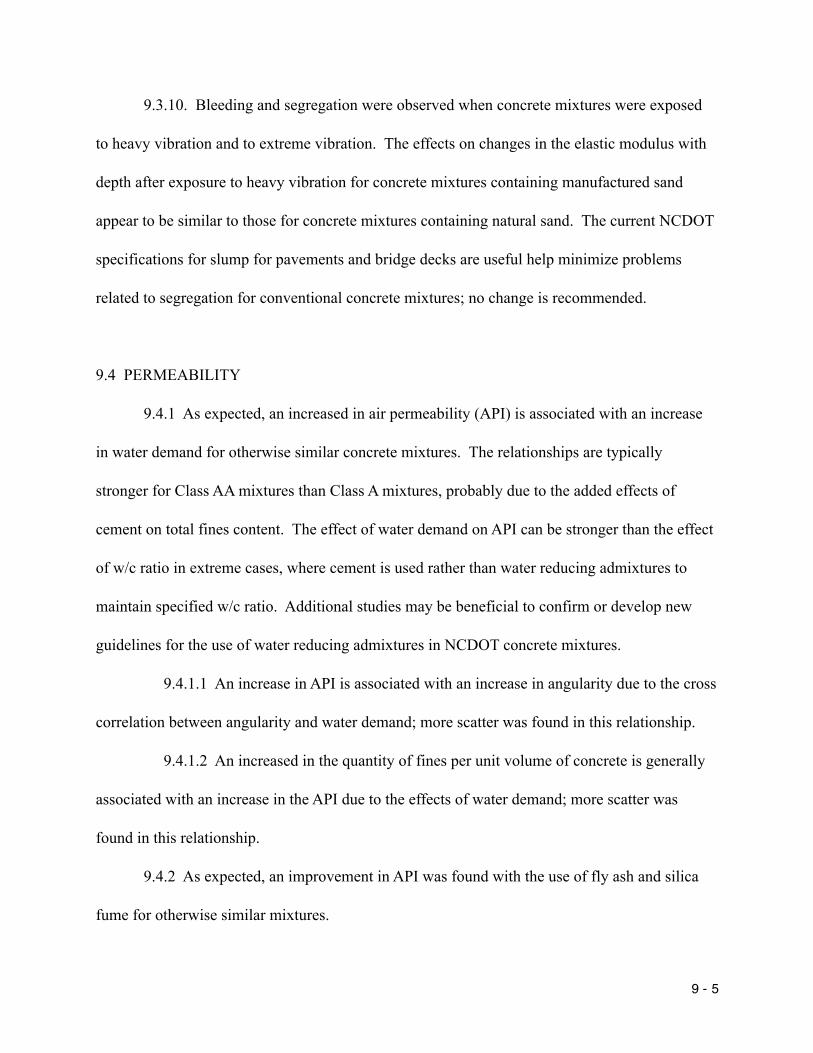
9.3.10. Bleeding and segregation were observed when concrete mixtures were exposed
to heavy vibration and to extreme vibration. The effects on changes in the elastic modulus with
depth after exposure to heavy vibration for concrete mixtures containing manufactured sand
appear to be similar to those for concrete mixtures containing natural sand. The current NCDOT
specifications for slump for pavements and bridge decks are useful help minimize problems
related to segregation for conventional concrete mixtures; no change is recommended.
9.4 PERMEABILITY
9.4.1 As expected, an increased in air permeability (API) is associated with an increase
in water demand for otherwise similar concrete mixtures. The relationships are typically
stronger for Class AA mixtures than Class A mixtures, probably due to the added effects of
cement on total fines content. The effect of water demand on API can be stronger than the effect
of w/c ratio in extreme cases, where cement is used rather than water reducing admixtures to
maintain specified w/c ratio. Additional studies may be beneficial to confirm or develop new
guidelines for the use of water reducing admixtures in NCDOT concrete mixtures.
9.4.1.1 An increase in API is associated with an increase in angularity due to the cross
correlation between angularity and water demand; more scatter was found in this relationship.
9.4.1.2 An increased in the quantity of fines per unit volume of concrete is generally
associated with an increase in the API due to the effects of water demand; more scatter was
found in this relationship.
9.4.2 As expected, an improvement in API was found with the use of fly ash and silica
fume for otherwise similar mixtures.
9 - 5

9.4.3 A linear regression (Eq. 7.1) was found between API and angularity, as measured
by voids content, and the fines content as the independent variables, for cement only, Class AA
mixtures; the regression has little practical value except to statistically confirm the relationships
in 9.4.1.1 and 9.4.1.2, above.
9.5 DEICER SALT SCALING (FROST) RESISTANCE
9.5.1. Preliminary classification of manufactured sands for potential resistance to deicer
salt scaling in Class AA mixtures is possible based on bulk angularity and stone dust content:
Manufactured sands are likely to have good to fair resistance to deicer salt scaling if:
-194.5 + 4.17 Vs + 0.518 D < 12 Eq. 7.4a
Manufactured sands are likely to have poor resistance to deicer salt scaling if:
-194.5 + 4.17 Vs + 0.518 D ≥ 15 Eq. 7.4b
where Vs is the void content (Method A), and D is the quantity of material passing the 75µm
(#200) sieve (kg/m3). This relationship appears to be valid for manufactured sands regardless of
the geology of the parent rock; it is likely not appropriate for natural sands due to differences in
the nature of the fines.
9.5.2. Manufactured sands likely to have good resistance to deicer salt scaling may have
excellent resistance if both
- Roundness is less than 1.4, and Eq. 7.4c(1)
- Blade shaped particles do not exceed 10% of the sand, Eq. 7.4c(2)
for sands geologically similar to those examined in this study. The proposed preliminary
classification should be used with caution, however, due to the significant scatter in the results.
9 - 6

9.5.3. Geology of the parent rock alone was found to have no effect on the deicer salt
scaling of Class AA mixtures produced with manufactured sand.
9.5.4. Class A mixtures are inherently unsuited for use in pavements and bridge decks
that will be exposed to substantial deicer salt exposure.
9.5.5. The use of 25% fly ash, in a one-to-one replacement of portland cement,
contributed to a reduction in deicer salt scaling resistance. The effect was not significant in those
mixtures with acceptable deicer salt scaling resistance without fly ash, however.
9.5.6. Manufactured sands may be blended with natural sands to improve deicer salt
scaling resistance. Characteristics of these mixtures will largely be the weighted averages of the
characteristics of mixtures with either sand.
9.6 DEICER SALT SCALING ASSESSMENT USING CORES FROM ASTM C 672 SLABS
9.6.1. The dynamic modulus of disks removed from test slabs and the dynamic modulus
of individual disks exposed to AASTM C 672 freezing and thawing cycles were not found to be
associated with manufactured sand characteristics such as angularity or fines.
9.6.2 No useful relationship was found between dynamic elastic modulus and scaling
categories or scaling rank. This may be related to the qualitative nature of visual classification.
Additionally, scaling is a surface phenomenon and the loss of the surface layer or development of
a thin, deteriorated layer are not necessarily identified by changes in the dynamic elastic
modulus.
9 - 7

9.7 ALTERNATE DEICER SALT SCALING TEST METHOD - FINDINGS AND
ASSESSMENT
9.7.1. Disks with a float finish exhibited more scaling than those with a sawed finish.
Differences between salt scaling of disks with a float finished surface and those with a sawed
surface indicate that the current finishing techniques used in slipform operations for bridge decks
and highway pavements in North Carolina may be continue to be used with mixtures containing
manufactured sand. These findings also indicate that grinding the surface should restore
serviceability of pavements and bridge decks showing signs of scaling.
9.7.2. The alternate salt scaling resistance test examined in this study produced rankings
that were similar to those from testing the ASTM C 672 slabs, but results were significantly
different in several cases. The use of additional disks or larger disks or both is indicated to
increase the area for visual comparison. Additional cycles may also be needed in the disk based
test to attain equivalent results with ASTM C 672.
9.7.3. The mass lost and the extent of visual scaling of individual disks are clearly
related, and two possible groups or clusters of data were observed. The groups had different, but
roughly linear relationships between scaling and mass lost. The characteristics of mixtures in the
clusters were not consistent with findings based on slabs alone, differences in geology, or other
sand or mixture characteristics.
9.7.4. While the alternate test method appears promising, additional study is
recommended to develop this simpler and easier alternate to ASTM C 672.
9 - 8
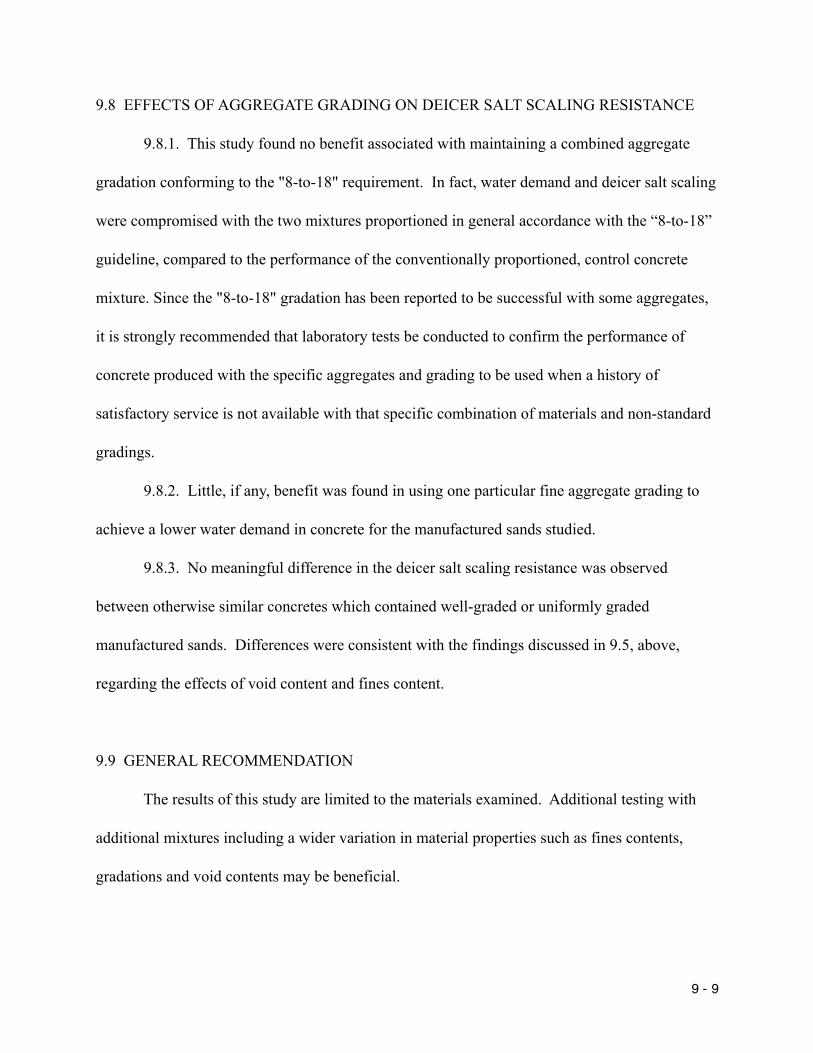
9.8 EFFECTS OF AGGREGATE GRADING ON DEICER SALT SCALING RESISTANCE
9.8.1. This study found no benefit associated with maintaining a combined aggregate
gradation conforming to the "8-to-18" requirement. In fact, water demand and deicer salt scaling
were compromised with the two mixtures proportioned in general accordance with the “8-to-18”
guideline, compared to the performance of the conventionally proportioned, control concrete
mixture. Since the "8-to-18" gradation has been reported to be successful with some aggregates,
it is strongly recommended that laboratory tests be conducted to confirm the performance of
concrete produced with the specific aggregates and grading to be used when a history of
satisfactory service is not available with that specific combination of materials and non-standard
gradings.
9.8.2. Little, if any, benefit was found in using one particular fine aggregate grading to
achieve a lower water demand in concrete for the manufactured sands studied.
9.8.3. No meaningful difference in the deicer salt scaling resistance was observed
between otherwise similar concretes which contained well-graded or uniformly graded
manufactured sands. Differences were consistent with the findings discussed in 9.5, above,
regarding the effects of void content and fines content.
9.9 GENERAL RECOMMENDATION
The results of this study are limited to the materials examined. Additional testing with
additional mixtures including a wider variation in material properties such as fines contents,
gradations and void contents may be beneficial.
9 - 9
REFERENCES
ACI Committee 211, "Standard Practice for Selecting Proportions for Normal Heavyweight and Mass Concrete," Materials and General Properties of Concrete, American Concrete Institute Manual for Concrete Practice, Part 1, ACI 211.1, Farmington Hills, MI
ACI Committee 301, "Specifications for Structural Concrete," Materials and General Properties of Concrete, American Concrete Institute, ACI 301, Farmington Hills, MI
ACI Committee 318, "Building Code Requirements for Structural Concrete and Commentary," American Concrete Institute, ACI 318, Farmington Hills, MI
Ahmed, A. E., A. A. El-Kourd, Properties of Concrete Incorporating Natural and Crushed Stone Very Fine Sand, ACI Materials Journal, July-August 1989, pp. 417-440
ASTM, "Standard Specification for Concrete Aggregates," C33, Annual Book of American Society for Testing and Materials (ASTM) Standards, Vol. 04.02
ASTM, "Standard Test Method for Compressive Strength of Cylindrical Concrete Specimens," ASTM C39/C39M, Annual Book of American Society for Testing and Materials (ASTM) Standards, Vol. 04.02
ASTM, "Standard Test Method for Fundamental Transverse, Longitudinal, and Torsional Frequencies of Concrete Specimens," ASTM C215, Annual Book of American Society for Testing and Materials (ASTM) Standards, Vol. 04.02
ASTM, "Standard Test Method for Flexural Strength of Concrete (Using Simple Beam with Third-Point Loading)," ASTM C78, Annual Book of American Society for Testing and Materials (ASTM) Standards, Vol. 04.02
ASTM, "Standard Test Method for Resistance of Concrete to Rapid Freezing and Thawing," ASTM C666, Annual Book of American Society of Testing and Materials (ASTM) Standards, Vol. 04.02
ASTM, "Standard Test Method for Scaling Resistance of Concrete Surfaces Exposed to Deicing Chemicals," ASTM C672/C672, Annual Book of American Society for Testing and Materials (ASTM) Standards, Vol. 04.02
ASTM, "Standard Test Method for Sieve Analysis of Fine and Coarse Aggregates," ASTM C136, Annual Book of American Society for Testing and Materials (ASTM) Standards, Vol. 04.02
ASTM, "Standard Specification for Chemical Admixtures for Concrete," C494/C494M, Annual Book of American Society for Testing and Materials (ASTM) Standards, Vol. 04.02

ASTM, "Standard Test Methods for Uncompacted Void Content of Fine Aggregate," ASTM C1252, Annual Book of American Society for Testing and Materials (ASTM) Standards, Vol. 04.02
Bloem, D. L., R. G. Gaynor, Effects of Aggregate Properties on Strength of Concrete, Journal of American Concrete Institute, October 1963, pp. 1429-1455
Celik, T., K. Marar, Effects of Crushed Stone Dust on Some Properties of Concrete, Cement and Concrete Research, Vol. 26, No 7, 1996, pp. 1121-1130
Cramer, S. M., Hall, M., Parry, J., Effect of Optimized Total Aggregate Gradation on Portland Cement Concrete for Wisconsin Pavements, Transportation Research Record 1478, Transportation Research Board, National Research Council, Washington D.C., 1995
Cross, S. A., Smith, B. J., Clowers, K. A., Evaluation of Fine Aggregate Angularity Using National Aggregate Association Flow Test, Transportation Research Record 1437, Transportation Research Board, National Research Council, Washington D.C., 1994, pp. 43-50
Gaynor, R. D., R. C. Meininger, Evaluating Concrete Sands, Concrete International, December 1983, pp. 53-60
Huang, E. Y., A Test for Evaluating the Geometric Characteristics of Coarse Aggregate Particles, Proceedings of the American Society for Testing and Materials, Volume 62, 1962, pp. 1223 –1442
Hudson, B. P., Effect of Manufactured Aggregate and Sand Shape on Concrete Production and Placement, Svedala Barmac Technical Publication, Svedala New Zealand Ltd., Matamata, New Zealand, August 1995, 9 p.
Hudson, B. P., Manufactured Sand for Concrete, The Indian Concrete Journal, May 1997, pp. 237-240
Hudson, B. P., Effect of Manufactured Aggregate and Sand Shape on Concrete Production and Placement, Svedala Barmac New Zealand Limited, Report, August, 1995
Forster, S. W., Soundness, Deleterious Substances, and Coatings, in Significance of Tests and Properties of Concrete and Concrete-Making Materials, ASTM Special Technical Publication 169 C, Philadelphia, PA, 1994, pp. 411-420
Galloway, J. E., Grading, Shape and Surface Properties, Significance of Tests and Properties of Concrete and Concrete-Making Materials, ASTM Special Technical Publication 169 C, Philadelphia, PA, 1994, pp. 401-410.
Malhotra, V. M., C. G. Carette, Performance of Concrete Incorporating Limestone Dust as a Partial Replacement of Sand, ACI Journal, May-June 1985, pp. 363-371.
Malhotra, V. M., Technical Note: Correlation Between Particle Shape and Surface Texture of Fine Aggregate and Their Water Requirement, Materials Research and Standards, December 1964, pp. 656-658.
Mather, B., Shape, Surface Texture, and Coatings, Significance of Tests and Properties of Concrete and Concrete-Making Materials, ASTM Special Technical Publication 169 A, Phildapelhia, PA, 1955, pp. 284-296.
McKeagney, R. B., Stone Sand, Are Specifications Appropriate?, Pit and Quarry, June 1985, pp. 57-60
Mitchell, J. F., Leming, M. L., Quantity of Alkali Silica Gel and its Effect on Concrete Properties, Journal of Materials In Civil Engineering, Vol. 10, No.2, American Society of Civil Engineers, NY, May, 1998, pp. 106-111.
Nagaraj, T. S., Z. Banu, Efficient Utilization of Rock Dust and Pebbles as Aggregate, The Indian Concrete Journal, January 1996, pp. 53-56
Nichols, F. P. Jr., Manufactured Sand and Crushed Stone in Portland Cement Concrete, Concrete International, pp. 56-63, August 1982
Ozol, M. A., Shape, Surface Texture, Surface Area and Coatings, Significance of Tests and Properties of Concrete and Concrete-Making Materials, ASTM Special Technical Publication 169 B, Philadelphia, PA, 1978, pp. 584-628
Pigeon, M., Pleau, R., Durability of Concrete in Cold Climates, Modern Concrete Technology Series, Vol. 4, E & FN SPON, London, 1995.
Rex, H. M., Peck, R. A., A Laboratory Test to Evaluate the Shape and Surface Texture of Fine Aggregate Particles, Public Roads, Vol. 29, No 5, December, 1956,
Saunders, C. H. Jr., Manufactured Sand Usage in North Carolina, Third Annual Symposium Proceedings, Center for Aggregate Research, TX, 1995
Schonlin, K. and H.K. Hilsdorf, Permeability as a Measure of Potential Durability of Concrete Development of a Suitable Test Apparatus, Permeability of Concrete, ACI SP-108, D. Whiting and A. Walitt, Ed., American Concrete Institute, Detroit, MI, 1988, pp. 99-115.

Shilstone, J. M, Concrete Mixture Optimization, Concrete International, Design and Construction, Volume 12, No 6, pp. 3339, June 1990
Shilstone, J. M, A Hard Look at Concrete, Civil Engineering, ASCE, 4749, January 1989
Shilstone, J. M, Performance Specifications for Concrete Pavements, Concrete International, Design and Construction, December 1991, pp. 28-34
Shilstone, J. M. Sr., and Shilstone, J. M. Jr, High Performance Concrete Mixtures for Durability, ACI SP 140, High Performance Concrete in Severe Environments, 1993
Willis, M. H. Jr., How Aggregate Particle Shape Influences Concrete Mixing Water Requirement, Journal of Materials, Vol. 2, No 4, December 1967, pp. 843-865