Effects of hypoxia and organic enrichment on the coastal marine environment · MARINE ECOLOGY...
31
MARINE ECOLOGY PROGRESS SERIES Mar Ecol Prog Ser Vol. 238: 249–279, 2002 Published August 9 INTRODUCTION The Group of Experts on Scientific Aspects of Marine Pollution (GESAMP), in their review of the State of the Marine Environment (GESAMP 1990) concluded that marine eutrophication was ‘one of the major causes of immediate concern in the marine environment’. The GESAMP report stresses that the scale of the problem © Inter-Research 2002 · www.int-res.com *Present address: Department of Biology, University of Oslo, Pb 1064 Blindern, 0316 Oslo, Norway. E-mail: [email protected] REVIEW Effects of hypoxia and organic enrichment on the coastal marine environment John S. Gray*, Rudolf Shiu-sun Wu, Ying Ying Or Department of Biology and Chemistry, City University, Tat Chee Avenue, Kowloon, Hong Kong ABSTRACT: Eutrophication is one of the most severe and widespread forms of disturbance affecting coastal marine systems. Whilst there are general models of effects on benthos, such as the Pearson- Rosenberg (P-R) model, the models are descriptive rather than predictive. Here we first review the process of increased organic matter production and the ensuing sedimentation to the seafloor. It is shown that there is no simple relationship between nutrient inputs and the vertical flux of particulate organic matter (POM). In particular, episodic hydrographic events are thought to be the key factor leading to high rates of sedimentation and accompanying hypoxia. We extend an earlier review of effects of hypoxia to include organisms living in the water column. In general, fishes are more sensi- tive to hypoxia than crustaceans and echinoderms, which in turn are more sensitive than annelids, whilst molluscs are the least sensitive. Growth is affected at oxygen concentrations between 6.0 and 4.5 mg O 2 l –1 , other aspects of metabolism are affected at between 4 and 2 mg O 2 l –1 and mortality occurs where concentrations are below 2.0 to 0.5 mg O 2 l –1 . Field studies, however, show that complex behavioural changes also occur as hypoxia increases, and these are described herein. The areas where hypoxia occurs are frequently areas that are stagnant or with poor water exchange. Thus again, hydrographic factors are key processes determining whether or not hypoxia and eutrophica- tion occur. Tolerance to ammonia and hydrogen sulphide is also reviewed, as these substances are found at near zero concentrations of oxygen and are highly toxic to most organisms. However, the effects of interactions between oxygen, ammonia and hydrogen sulphide only occur below oxygen concentrations of ca. 0.5 mg O 2 l –1 , since only below this concentration are hydrogen sulphide and oxygen released into the water. Models of eutrophication and the generation of hypoxia are dis- cussed, and in particular the P-R model is analysed. Although agreement with the model is widely reported the actual predictions of the model have rarely been tested. Our review suggests that the major effects on benthic fauna result from hypoxia rather than organic enrichment per se and sug- gests that the P-R model is descriptive rather than predictive. Finally, a managerial tool is proposed, based on the stages of effects of hypoxia and organic enrichment suggested by the P-R model and on an earlier study. The proposed strategy involves rapid assessment tools and indicates where more detailed surveys are needed. Managers are advised that remedial action will not produce rapid results and that recovery from eutrophication will probably take decades. Thus it is essential to detect potential hypoxia and eutrophication effects at early stages of development. KEY WORDS: Eutrophication · Hypoxia · Hydrogen sulphide · Ammonia · Effects on fauna Resale or republication not permitted without written consent of the publisher
Transcript of Effects of hypoxia and organic enrichment on the coastal marine environment · MARINE ECOLOGY...
MARINE ECOLOGY PROGRESS SERIESMar Ecol Prog Ser
Vol. 238: 249–279, 2002 Published August 9
INTRODUCTION
The Group of Experts on Scientific Aspects of MarinePollution (GESAMP), in their review of the State of theMarine Environment (GESAMP 1990) concluded thatmarine eutrophication was ‘one of the major causes of
immediate concern in the marine environment’. TheGESAMP report stresses that the scale of the problem
© Inter-Research 2002 · www.int-res.com
*Present address: Department of Biology, University of Oslo,Pb 1064 Blindern, 0316 Oslo, Norway.E-mail: [email protected]
REVIEW
Effects of hypoxia and organic enrichment on thecoastal marine environment
John S. Gray*, Rudolf Shiu-sun Wu, Ying Ying Or
Department of Biology and Chemistry, City University, Tat Chee Avenue, Kowloon, Hong Kong
ABSTRACT: Eutrophication is one of the most severe and widespread forms of disturbance affectingcoastal marine systems. Whilst there are general models of effects on benthos, such as the Pearson-Rosenberg (P-R) model, the models are descriptive rather than predictive. Here we first review theprocess of increased organic matter production and the ensuing sedimentation to the seafloor. It isshown that there is no simple relationship between nutrient inputs and the vertical flux of particulateorganic matter (POM). In particular, episodic hydrographic events are thought to be the key factorleading to high rates of sedimentation and accompanying hypoxia. We extend an earlier review ofeffects of hypoxia to include organisms living in the water column. In general, fishes are more sensi-tive to hypoxia than crustaceans and echinoderms, which in turn are more sensitive than annelids,whilst molluscs are the least sensitive. Growth is affected at oxygen concentrations between 6.0 and4.5 mg O2 l–1, other aspects of metabolism are affected at between 4 and 2 mg O2 l–1 and mortalityoccurs where concentrations are below 2.0 to 0.5 mg O2 l–1. Field studies, however, show that complexbehavioural changes also occur as hypoxia increases, and these are described herein. The areaswhere hypoxia occurs are frequently areas that are stagnant or with poor water exchange. Thusagain, hydrographic factors are key processes determining whether or not hypoxia and eutrophica-tion occur. Tolerance to ammonia and hydrogen sulphide is also reviewed, as these substances arefound at near zero concentrations of oxygen and are highly toxic to most organisms. However, theeffects of interactions between oxygen, ammonia and hydrogen sulphide only occur below oxygenconcentrations of ca. 0.5 mg O2 l–1, since only below this concentration are hydrogen sulphide andoxygen released into the water. Models of eutrophication and the generation of hypoxia are dis-cussed, and in particular the P-R model is analysed. Although agreement with the model is widelyreported the actual predictions of the model have rarely been tested. Our review suggests that themajor effects on benthic fauna result from hypoxia rather than organic enrichment per se and sug-gests that the P-R model is descriptive rather than predictive. Finally, a managerial tool is proposed,based on the stages of effects of hypoxia and organic enrichment suggested by the P-R model and onan earlier study. The proposed strategy involves rapid assessment tools and indicates where moredetailed surveys are needed. Managers are advised that remedial action will not produce rapidresults and that recovery from eutrophication will probably take decades. Thus it is essential to detectpotential hypoxia and eutrophication effects at early stages of development.
KEY WORDS: Eutrophication · Hypoxia · Hydrogen sulphide · Ammonia · Effects on fauna
Resale or republication not permitted without written consent of the publisher
Mar Ecol Prog Ser 238: 249–279, 2002
varies from region to region, but emphasizes that theprimary causal effect is discharge of nitrate and phos-phate to coastal waters. In the latest report (GESAMP2001), eutrophication is still recorded as one of themost severe problems affecting the oceans.
Eutrophication arises from an increase in nutrientand dissolved organic matter (DOM) concentrationsover natural levels, which in turn leads to a greaterproduction of particulate organic matter (POM) in thewater column or on the sea-bed, (Dugdale & Goering1967, Cadée & Hegeman 1974, Cadée 1984, Smith1984). The organic matter usually originates frombacteria, phytoplankton and zooplankton in the watercolumn, and from surface-living bacteria and diatomson sediments or/and production by algae and epi-phytes on hard substrata (Chapman & Craigie 1977,Hillebrand & Sommer 1999). The amounts of organicmatter produced are often too large to be grazed andsink to the seabed along with faeces and other particu-late organic matter. The sedimenting organic matter isdegraded largely in the water column, a process thatuses up oxygen. If oxygen is not supplied by advectiveand vertical mixing then decreases in oxygen concen-trations lead to hypoxia and, in extreme cases, toanoxia.
The major external sources of nutrients andDOM/POM to coastal waters are domestic sewage andagricultural fertilizers input, largely via rivers (Ryther& Dunstan 1971, Taslakian & Hardy 1976, Nixon &Pilsom 1983, Borum & Sand-Jensen 1996). Nixon(1990) pointed out that the dramatic growth of humanpopulations in the coastal zones, the increased agri-cultural production through of the use of fertilizers,deforestation and the increased release of nitrogenoxides into the atmosphere have made the problemmore acute. He noted that eutrophication is a problemaround the rim of the Mediterranean, and in anincreasing numbers of bays and estuaries along thecoastlines of North and South America, Africa, India,Southeast Asia, Australia, China and Japan. Yet thereare areas that naturally have high nutrient content andlow oxygen content in the water, such as upwellingareas off Peru, Walvis Bay in SW Africa and the Hornof Africa. Fjords (in Canada, Chile, New Zealand, Scot-land, Norway, and Sweden) also have natural periodi-cally low oxygen concentrations.
The 3 key elements of the eutrophication processtherefore are (1) increased nutrient levels leading to(2) production of particulate and dissolved organicmatter and (3) degradation of the organic matter lead-ing to lowered oxygen concentrations.
In their classic paper Pearson & Rosenberg (1978)described a general model for 1 of these processes—the effects of organic enrichment on sediment-livingorganisms. Since their paper was published it has been
cited many hundreds of times and the model has beenshown to be valid for many coastal regions of theworld. The model describes the changes in patterns ofnumbers of species, abundances and biomass along a‘gradient’ from a normal assemblage to an assemblagein sediment containing very high amounts of organicmatter with accompanying anerobiosis. However, theordinate merely represents ‘increasing organic enrich-ment’ and is not quantitative. Pearson & Rosenbergpointed out that a number of other trends accompanychanges in organic enrichment, namely changes in theoxygen concentration in the water column that maylead to changes independent of those arising fromincreased organic matter, and physical changes thatoccur in the sediment which usually becomes finergrained. Since over 20 yr have elapsed since theirmodel was devised, it is time to re-examine the modelin the light of more recent data. Since the P-R modelwas produced there have been a number of recentgeneral reviews of eutrophication (Pearson 1982, Car-penter & Capone 1983, Walsh 1988, Gray 1992, Heip1995, Nixon 1995, Jørgensen & Richardson 1996). Inparticular, the recent review by Cloern (2001) has cov-ered, in an excellent way, the process of eutrophicationand the development of conceptual models. We willnot attempt to repeat this study, but instead movetowards a goal that Cloern set (Cloern 2001, p. 241):‘the evolution of our conceptual model should producea set of tools, reflecting a more mechanistic under-standing of the problems, that can be used to guidestrategies of coastal ecosystem management, rehabili-tation or protection.’ Here we examine the develop-ment of hypoxia and its effects on the benthos in rela-tion to tools for management.
PRIMARY PRODUCTION AND SEDIMENTATION OF ORGANIC MATTER
Sedimentation
One assumption often made is that under normalconditions the amount of organic material generated inthe water column is in equilibrium with grazing anddegradation processes (Graneli et al. 1990). Grazingpressure is usually a major factor influencing phyto-plankton abundance. Studies show that in the en-riched plume of the New York Bight 28 to 53% of thedaily production can be consumed (Dagg & Turner1982), whereas on the open coast at George’s Bank,Gulf of Maine, USA, only 5 to 10% of the summer pro-duction is consumed. This is due to the continual inputof recycled nutrients on the Bank from tidal stirring. Inshelf systems of the Mid-Atlantic Bight, Gulf of Mexicoand Bering Sea around 50% of the phytoplankton bio-
250
Gray et al.: Hypoxia and organic enrichment in coastal environment
mass is consumed by grazers (Walsh 1988). Undereutrophic conditions, an excess of organic matter isproduced which sediments out of the surface layers asexported production.
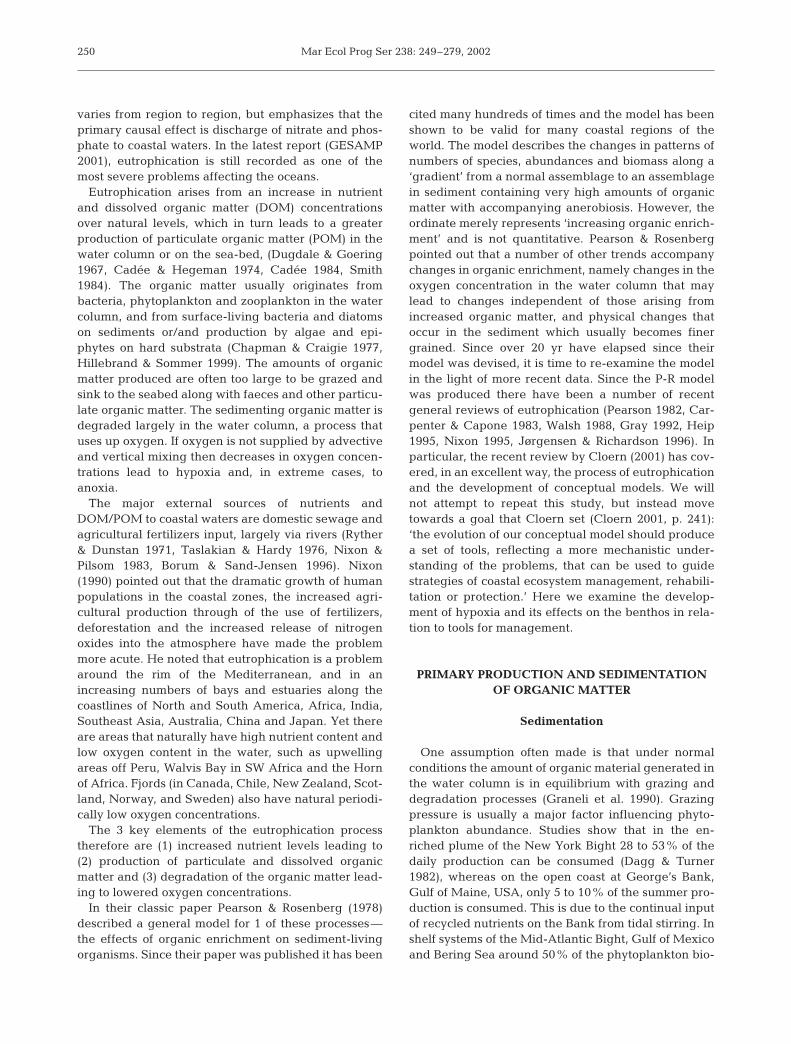
Wassmann (1990) reviewed the data and suggesteda model of export production as a function of totalprimary production (Fig. 1). The model requires thatreliable data are available for total annual primary pro-duction, which is not the case for many areas. In tem-perate areas, sedimentation rates are strongly sea-sonal, with 2 main periods of heavy sedimentationduring the spring and autumn plankton blooms, andrelatively little sedimentation during times of stratifica-tion. For tropical and sub-tropical areas, production isgenerally low and more uniform due to the oligo-trophic nature of surface waters and sedimentationrates are extremely low. However, many tropical andsub-tropical areas are influenced by seasonal mon-soons, when surface-water salinity drops and highamounts of organic matter enter the coastal system. Itis usually following such conditions that harmful algalbloom (HAB) outbreaks occur (e.g. in Hong Kong thesouth-west monsoon occurs in July-August and HABoutbreaks occur in late August and September). Stud-ies in areas subject to heavy wave action, e.g. mostshallow areas, have shown that sedimentation ratesincrease with increasing depth (Steele & Baird 1972,Ansell 1974, Hargrave & Taguchi 1978, Smetacek 1980,Sand-Jensen et al. 1994). However, in a study of 2fjords in Norway, which are sheltered and have littlewave action, Wassmann (1985) found that sedimen-tation rate decreased with increasing depth. This isin keeping with data on the benthos for the outerOslofjord which indicates that biomass decreases withincreasing depth (J.S.G. unpubl. data).
Wassmann’s model shows that in oligotrophic areasonly 25 to 30% of the produced organic matter isexported, whereas in mesotrophic areas with primaryproduction of 200 gC m–2 yr–1, 45% of the primary pro-duction is exported. His model predicts that undereutrophic conditions where total production is between300 and 500 gC m–2 yr–1 (Nixon 1995), 50% of the carbonwill be exported; Borum (1996) suggested that there is amaximum rate of around 500 gC m–2 yr–1 irrespective ofthe amounts of nutrient inputs for most coastal areas.Measured values are in agreement with this model. Forshelf areas (Mid-Atlantic Bight, the Gulf of Mexico andBering Sea), Walsh (1988) found that 50% of primaryproduction was exported. In the upwelling area off Peruwhere nutrient input levels were high before changes tothe system caused by El Niño and overfishing, again50% of the primary production was exported. (It shouldbe kept in mind that dead and decaying phytoplanktoncontribute DOM to the water column that is rapidlyutilised by algae and micro-organisms: Otsuki & Hanya1972). Cloern (1982) showed that in parts of San Fran-cisco Bay the benthos controlled phytoplankton biomassand this may well be a widespread phenomenon.
A major contributor of POM and DOM to coastalareas is discharge of sewage. In the past, dumping ofraw sewage was practised in many areas, notably offthe Thames estuary in UK and in New York Bight. Theraw sewage dumped added much particulate and dis-solved organic carbon directly to the water column.Walsh (1988) simulated a 10-fold increase in carbonand nitrogen loading to the New York Bight. He foundthat near the sewage dump site 1% light penetrationdepth occurred at 2–3 m, with a sharp increase to7–8 m near the Hudson River plume and to 25–40 m atthe outer apex. This high turbidity led to a 60–70%reduction of primary production within the HudsonRiver plume whereas beyond the influence of the estu-ary production increased slightly. Where sewage istreated, the amounts of POM are much reduced com-pared with raw sewage disposal, but neverthelesssewage effluents are a major source of particulatematerial in coastal areas. Oviatt et al. (1986, 1987,1989) studied effects of added sewage in a mesocosmsystem and found that sludge particulate inputs inexcess of 1 gC m–2 d–1 caused hypoxic events.
Other forms of POM added to coastal waters arepaper and pulp mill effluents (Pearson & Rosenberg1978). The POM increases turbidity, which leads toreduced primary production and reduced growth ofmacroalgae (Kautsky et al. 1986), and more impor-tantly, as the organic matter is oxidised, decreases theoxygen content of the water column. Fortunately, mostsewage dumping has been phased out and sewageentering coastal waters in developed countries is nowtreated, but the input of nutrients from this treated
251
Fig. 1. Wassmann’s model of export production (PE) againsttotal production (PT) in gC m–2, for the boreal zone of the N.Atlantic (from Wassmann 1990). Fitted regression of Export
Production PE = 9.390.012PT

Mar Ecol Prog Ser 238: 249–279, 2002
sewage is a major factor influencing the state of hy-poxia in coastal systems.
In estuarine and coastal areas organic matter (partic-ulate and dissolved) can also be derived from macro-phyte tissues (dead leaves, seagrasses, kelp and otheralgae, mangroves and terrestrial plant material: Fenchel& Blackburn 1979), but this is not thought to be a largesource compared with the planktonic components.Othersources of sedimenting organic matter are faeces fromzooplankton, pseudofaeces from bivalves and other en-crusting species, and particulate matter where sewagesludge is dumped or paper and pulp mill waste dis-charged.
Wassmann’s model is based on data for annual pri-mary productivity and sedimentation, yet sedimentationis highly seasonal. In Kiel Bay diatoms in the springbloom settle over a few days (Graf et al. 1982). This ma-terial has a high nutritional value (C:N ratio of ca. 6 to 8)and is utilised rapidly by the bacteria and micro-organ-isms in the sediment (Graf et al. 1982, Aubert 1990); ithas also been found in mesocosm experiments in Nor-way (Skeie 1987). In temperate waters, sedimentation ofPOM occurs mainly in spring when grazing pressure bymesozooplankton is low (for an overview of pro-cesses in open oceanic water [Pacific Ocean] see Thomas1971a,b, Knauer et al. 1979), yet the amounts that settlevary greatly from year to year (Santos & Simon 1980,Smetacek 1980, Christensen & Kanneworff 1985) de-pending primarily on physical conditions. It is the hy-drodynamic control of ‘new’ inorganic nutrients fromoutside the system that controls the spatial and temporalvariability in primary production rates.
Kiørboe et al. (1996) have recently reviewed materialfluxes in the water column. They suggest that wheresmall-sized organisms dominate the production, themicrobial loop operates and sedimentation is un-important as the particles are remineralized by micro-organisms within the surface layers. In such systemsgrazing control is highly efficient and the system is rarelyfood-limited. Light limitation however, is often impor-tant. In the Kattegat (and in most fjords) during the strat-ified summer period there are high concentrations ofautotrophic flagellates at the pycnocline (ca. 30% of theannual primary production in the Kattegat: Kiørboe et al.1996). Sedimentation is proportional to the amounts ofnew nutrients entrained across the pycnocline. Whilsteutrophication may enhance the vertical flux of POMand potentially lead to hypoxia and anoxia below thepycnocline, the magnitude of the oxygen deficit is notrelated to nutrient input in a simple manner (Kiørboe1996). With a steady input of nutrients remineralisationof the POM usually occurs within the water columnand there is no flux to the seabed. If the input isepisodic, however, there is considerable sedimentationand oxygen deficits can occur in deeper waters
During sedimentation (and after resuspension from theseabed) bacteria degrade POM and DOM. A key factorin the degradation process is the C:N ratio of the organicmaterial. Phytoplankton has a C:N ratio of 6 to 7,whereas large brown algae have values of 16 to 68, sea-grasses 17 to 70, rhodophytes 20 and terrestrial plantleaves including mangroves 100 to 300 (Fenchel &Blackburn 1979). Degradation and nutrient mineralisa-tion take place when the C:N ratio, is under 10, whereasabove this value net immobilization of dissolved nitrogenoccurs. Thus, under eutrophic conditions with high in-puts of settling dead phytoplankton cells with a low C:Nratio, mineralisation will proceed rapidly, releasing morenutrients into the water column and exacerbating eu-trophication. For the Eastern seaboard of the US, Walshet al. (1981) used C:N ratios in sediments as an indicatorof the quality of material arriving at the sediment sur-face. Valderhaug & Gray (1984) showed that C:N ratiosvaried seasonally at 35 m depth in the Oslofjord, Nor-way, with values similar to those for plankton (8 to 10) inspring, rising to 18 in summer and winter, with a slightincrease following the autumnal plankton bloom andsubsequent sedimentation. Lateral advection of organicmaterial is also highly important (Heip 1995). Manysuspension-feeders utilise this material.
From the data and discussion presented here it isclear that trying to link amounts of sedimentingorganic material to primary production is a difficulttask (Josefson 1987, Rosenberg et al. 1987) since sedi-mentation rates vary with production, grazing, miner-alisation, stratification and advective processes. In ad-dition the separation of true sedimentation rates fromthose effected by resuspension cannot be achievedsuccessfully with present techniques, (Dymond et al.1981). This is an important problem as most eutrophi-cation problems occur in shallow waters, where resus-pension from wave and current action is a dominatingprocess. Thus measurement of the amounts of organicmaterial exported from the upper water column as aresult of higher rates of production is difficult. Richard-son (1996) suggests that measurements directly at thebottom of the pycnocline would resolve the problem ofresuspension. In fact remarkably few studies of sedi-mentation rates have considered eutrophication.
Oxygen concentrations in the water column give agood indication of the state of eutrophication. Forexample, changes in oxygen saturation or concentra-tions over time have been used to show that in theinner Oslofjord conditions have worsened since theturn of the century (Mirza & Gray 1983), and in theKattegat the average annual concentration duringAugust, September and October decreased linearlybetween 1965 and 1995 (Richardson 1996).
Hydrographic conditions are extremely important inrelation to whether or not hypoxia occurs. During calm
252

Gray et al.: Hypoxia and organic enrichment in coastal environment
periods, with no high inputs of nutrients and no cor-respondingly high primary production, hypoxia canbuild up in summer (Richardson 1996). Conversely,even with a high nutrient input, unusually high ex-change rates can also remove nutrients before produc-tion can increase, thereby preventing hypoxia condi-tions from evolving. Thus, the hydrography of a systemis perhaps the most critical element determiningwhether or not hypoxia will occur, and may overridethe input of new inorganic nutrients; see ‘Hypoxia:Areas where hypoxia has been recorded’.
Sedimenting organic matter is usually in particulateform. Under normal conditions (50 to 300 gC m–2 yr–1),it is utilised by the benthos (Graf et al. 1982). Grebmeieret al. (1988), Grebmeier & McRoy (1989), Grebmeier etal. (1989) studied 2 different water masses in the Beringand Chukchi Seas off Alaska, USA, and found thatin open waters where productivity was high (250 to300 gC m–2 yr–1) C:N ratios were low (5.8 to 7.6). Incoastal waters with lower productivity (ca. 50 gC m–2
yr–1) C:N ratios were higher (7.7 to 14.0). The 2 types ofbenthic communities utilising this material differed,with open waters having highly productive, low (familylevel) diversity systems dominated by deposit-suspen-sion-feeding amphipods, whereas inshore areas hadless productive, high diversity systems. Grebmeier etal. (1989) suggested that in low productivity systemsfood is limiting and determines benthic diversitywhereas in high-productivity systems it is largely sedi-ment heterogeneity that determines diversity, with lowdiversity occurring in homogeneous sediments such assilt-clay. Such findings are highly relevant to eutrophi-cation as primary production is often in the range of250 to 500 gC m–2 yr–1 (Borum & Sand-Jensen 1996).Under highly productive conditions the proportion ofsilt-clay may be correlated with faunal species rich-ness provided that other factors such as hypoxia andhydrogen sulphide production play no role.
Sedimenting organic matter may also have anothereffect, as it can smother benthic organisms that areunable to adapt to the amounts sedimenting. Gray(1982) suggested that one of the primary effects ofeutrophication was that many organisms were smoth-ered by the sedimenting organic matter and could notsurvive heavy sedimentation (see also Main & Nelson1988). The result of such effects is that species thatare able continuously to colonise the newly availablesediment will dominate. Examples are the polychaetesCapitella capitata complex and spionids such as Poly-dora spp. Gray listed a number of opportunistic spe-cies that probably had similar characteristics. Colonis-ing ability may therefore be as important as toleranceof low oxygen concentrations in determining whichspecies are found in the most heavily organically en-riched sediments.
Hypoxia
Since sedimentation rates are difficult to obtain andare difficult to relate to nutrient inputs the simplestindication of eutrophication that can be measured islikely to be the hypoxia resulting from degradation ofsedimenting POM.
Whereas under eutrophic conditions, air-sea inter-actions keep the surface waters above the pycnoclineoxygen-saturated, increased phytoplankton productionarising from increased nutrient levels often leads to su-per-saturation in surface waters (e.g. in the northernAdriatic: Justic 1987, Justic et al. 1987, 1988). Waterabove the pycnocline in the New York Bight has aslightly higher gross photosynthetic input than lossesdue to respiration (Walsh 1988), including losses fromsewage sludge and dissolved organic carbon. Belowthe pycnocline, respiration losses from sedimentingphytoplankton (75%), water column (19%), faecal pel-lets (4%) and the benthos (5%) exceeded the oxygenavailable in the water column. As there was no increasein oxygen production from photosynthesis, oxygen sat-uration of surface water in the Hudson River plumedropped to 60 to 65% oxygen and that of bottom waterto only <1 ml O2 l–1 (<1.4 mg O2 l–1), ca. 17% saturation.Walsh suggested that increases in carbon loading of ca.50 to 100 gC m–2 will lead to anoxia. He calculated thatwith low vertical diffusive inputs anoxia will developwithin ~30 d whereas with high diffusive input anoxiawill take >600 d to develop. Thus, in addition to nutri-ent input, hydrographic factors largely determine thedegree of hypoxia and anoxia. In the Baltic Sea,Matthäus (1998, 1999) correlated river runoff with deepwater oxygen concentration. However, the influence ofinfluxes of Atlantic water is also of major significance indetermining the oxygen content of the deep basins inthe Baltic (Nehring 1979). Rosenberg (1990) showed along-term decrease in the bottom water of West coastfjords in Sweden, and relates the changes primarily tonutrient inputs from agricultural runoff. The enclosedNorthern Adriatic Sea also has low oxygen concentra-tions in bottom water and high mortality of benthicspecies (Justic et al. 1987).
Effects of hypoxia
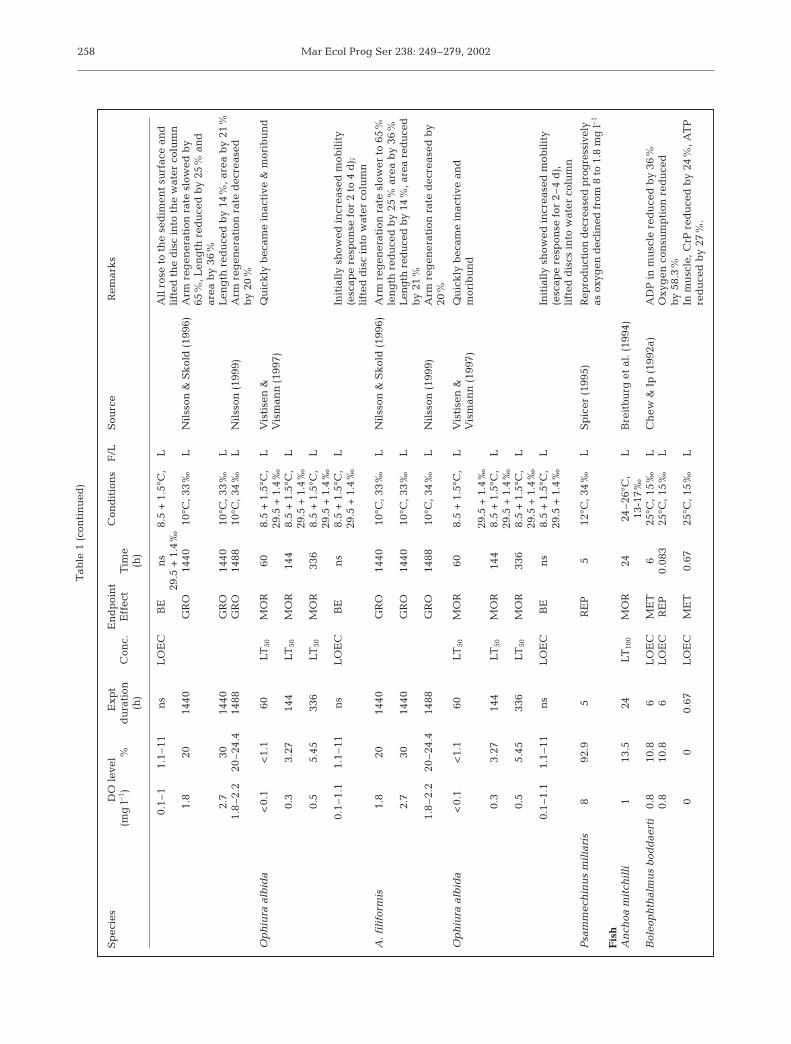
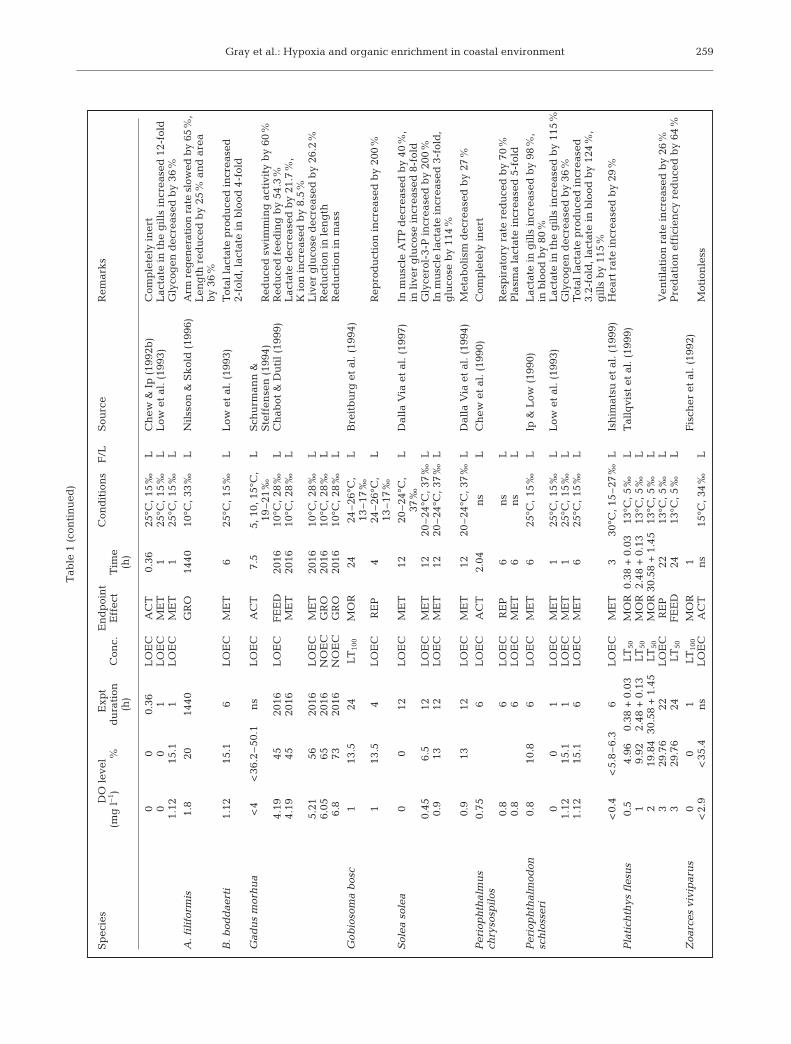
Diaz & Rosenberg (1995) reviewed the effects ofhypoxia on benthic organisms. Here we have extendedtheir review to cover species living in the water col-umn. The data are maintained as a database availableat: www.cityu.edu.hk/bch. Table 1 shows the data.
The data have obvious limitations in that often theaim was not to determine the lowest oxygen concen-tration that affects a species, but rather to conduct an
253

Mar Ecol Prog Ser 238: 249–279, 2002254
Sp
ecie
sD
O l
evel
Exp
t E
nd
poi
nt
Con
dit
ion
sF
/LS
ourc
eR
emar
ks
(mg
l–
1 )%
du
rati
onC
onc.
Eff
ect
Tim
e(h
)(h
)
Alg
aeG
raci
lari
a ti
kva
hia
l1
14.1
1L
OE
CR
EP
121
–25°
C,
LP
eck
ol &
Riv
ers
(199
5)R
edu
ced
to
23.6
%30
‰S
ipu
ncu
lid
aP
has
colo
som
a ar
cuat
um
00
48L
OE
CM
ET
48n
sL
Lim
& I
p (
1991
a)E
nzy
mat
ic a
ctiv
itie
s (P
EK
) in
crea
sed
00
48L
OE
CM
ET
1225
°C,
LL
im &
Ip
(19
91b
)S
ucc
inat
e in
crea
sed
fro
m 0
to
3.62
µM
,15
‰al
anin
e b
y 46
.7%
00
48L
OE
CM
ET
2425
°C,
Lp
H d
ecre
ased
by
4.72
% i
n c
oelo
mic
15
‰p
lasm
a, C
O2
incr
ease
d b
y 53
.8%
00
48L
OE
CM
ET
3625
°C,
LA
spar
ate
dec
reas
ed b
y 46
.38
%
15‰
in b
ody
wal
l
00
48L
OE
CM
ET
4825
°C,
LIp
et
al. (
1992
)T
otal
fre
e am
ino
acid
con
ten
t 15
‰d
ecre
ased
by
14%
, asp
arta
te b
y 50
%,
cyst
ine
incr
ease
d 3
.7-f
old
Oli
go
chae
tes
Het
eroc
hae
ta c
osta
ta0.
032
0.36
72N
OE
CM
OR
7216
°C,
LG
amen
ick
et
al. (
1996
)14
‰
Par
anai
s li
tora
lis
0.03
20.
3648
NO
EC
MO
R48
16°C
, L
14‰
Po
lych
aete
sA
ren
icol
a m
arin
a<
0.2
5L
OE
CM
ET
510
°C, n
sL
Ab
ele-
Oes
chg
er &
Hae
mog
lob
in a
uto
xid
atio
n i
ncr
ease
d
Oes
chg
er (
1995
)b
y 16
5%
, met
hae
mog
lob
on b
y 16
0%
Cap
itel
la c
apit
ata
1.12
–1.2
6n
sLT
50M
OR
312
ns
Ros
enb
erg
(19
72)
0.06
–2.1
0.8
–17.
3n
sG
RR
GR
O0.
83–1
.25*
22°C
, L
For
bes
& L
opez
(19
90)
28‰
Hed
iste
div
ersi
colo
r0.
032
0.36
14LT
50M
OR
1416
°C,
LG
amen
ick
et
al. (
1996
)P
ostl
arva
l st
age
14‰
0.03
20.
3610
5LT
50M
OR
105
16°C
, L
Juve
nil
e14
‰
Loi
mia
med
usa
0.98
13.5
9n
sLT
100
MO
R33
6n
sL
lan
só &
Dia
z (1
994)
<1
<13
.87
348
LO
EC
FE
ED
<20
26°C
,L
Red
uce
d t
o 0
%17
‰
0.5
6.93
348
LO
EC
AC
T34
826
°C,
LR
edu
ced
ove
rall
act
ivit
ies
17‰
Pol
yph
ysia
cra
ssa
1.12
–1.2
6n
sLT
50M
OR
192
ns
Ros
enb
erg
(19
72)
Tab
le 1
. L
iter
atu
re r
evie
w o
f h
ypox
ia e
ffec
ts o
n m
arin
e or
gan
ism
s. A
ll d
ata
con
vert
ed t
o m
g l
–1
and
oxy
gen
sat
ura
tion
bas
ed o
n g
iven
sal
init
y an
d t
emp
erat
ure
dat
a.L
OE
C:
low
est
obse
rvab
le e
ffec
t co
nce
ntr
atio
n;
NO
EC
: n
o ob
serv
able
eff
ect
con
cen
trat
ion
; L
C:
leth
al c
once
ntr
atio
n (
50,
50%
mor
tati
lity
); L
T:
leth
al t
hre
shol
d (
50,
50%
mor
tali
ty;
100,
100
% m
orta
lity
) G
RR
: g
row
th r
ate
red
uct
ion
; A
CT
: ac
tivi
ty;
BE
: b
ehav
iou
ral
effe
ct;
FE
ED
: fe
edin
g;
GR
O:
gro
wth
; M
ET
: m
etab
olis
m;
MO
R:
mor
tali
ty;
Not
: n
o ti
me
lim
it;
RA
:re
spir
ator
y ac
tivi
ty;
RE
P:
rep
rod
uct
ion
; F
: fi
eld
; L
: la
bor
ator
y; C
AT
: ch
lora
mp
hen
icol
ace
tyl
tran
sfer
ase;
GA
: g
luco
se r
edu
ctas
e, P
EK
: p
rote
in
kin
ase;
SO
D:
sup
er-o
xid
e d
ism
uta
se;
ns:
not
sp
ecif
ied

Gray et al.: Hypoxia and organic enrichment in coastal environment 255
Sp
ecie
sD
O l
evel
Exp
t E
nd
poi
nt
Con
dit
ion
sF
/LS
ourc
eR
emar
ks
(mg
l–
1 )%
du
rati
onC
onc.
Eff
ect
Tim
e(h
)(h
)
Rif
tia
pac
hyp
tila
0n
sL
OE
CM
ET
615
°C, n
sL
Arn
dt
et a
l. (
1998
)S
ucc
inat
e le
vel
in b
ody
flu
id
incr
ease
d b
y 24
3%
0n
sL
OE
CM
ET
6015
°C, n
sL
Su
ccin
ate
leve
l in
tis
sue
incr
ease
d
by
443
%
0n
sL
OE
CM
ET
6–
4815
°C, n
sL
Su
ccin
ate
leve
l in
plu
me
tiss
ue
incr
ease
d b
y 13
3%
0n
sL
OE
CM
ET
615
°C, n
sL
Mal
ate
dec
reas
ed b
y 90
% i
n b
lood
, 50
% i
n t
issu
e, 6
0%
in
bod
y
0n
sL
OE
CM
ET
4815
°C, n
sL
Gly
cog
en i
n t
rop
hos
ome
red
uce
d
by
60%
, glu
tam
ate
red
uce
d b
y 70
%
0n
sL
OE
CM
ET
6015
°C, n
sL
Gly
cog
en r
edu
ced
by
60%
in
bod
y w
all,
50
% i
n t
issu
e
Str
eblo
spio
ben
edic
ti0
056
LT50
MO
R43
Lla
nso
(19
91)
0–
0.56
336
–N
otLT
100
MO
R55
–33
6
Mo
llu
scs
Hyd
rob
ia v
entr
osa
0.03
20.
3616
8LT
50M
OR
168
16°C
, 14
‰L
Gam
enic
k e
t al
. (19
96)
Str
amon
ita
hae
mas
tom
a0
052
8LT
100
MO
R52
8D
as &
Sti
ckle
(19
93)
00
672
LT0
MO
R20
, 27,
10°C
, 10,
LS
tick
le e
t al
. (19
89)
20,
20, 3
0‰
00
672
LT0
MO
R18
, 19,
20°C
, 10,
L
2020
, 30
‰
00
672
LT0
MO
R>
28,1
0,30
°C, 1
0,15
20, 3
0‰
Arc
tica
isl
and
ica
00
240
LO
EC
ME
T24
0 9.
5 +
0.5
°C,
LO
esch
ger
& S
tore
y (1
993)
Tot
al g
lyco
gen
ph
osp
hor
ylas
e in
22
‰ad
du
ctor
dec
reas
ed b
y 34
%, i
n
foot
by
27%
, in
man
tle
by
30%
Ast
arte
bor
eali
s<
0.2
48L
OE
CM
ET
4810
°C, n
sL
Ab
ele-
Oes
chg
er &
G
R i
n g
ills
in
crea
sed
by
500
%O
esch
ger
(19
95)
<0.
224
0L
OE
CM
ET
240
10°C
, ns
LM
eth
aem
oglo
bin
incr
ease
d b
y 26
0%
,C
AT
in
gil
ls d
ecre
ased
by
70%
Cra
ssos
trea
vir
gin
ica
00
672
LT50
MO
R>
28,>
28,
10°C
, 10,
L
Sti
ckle
et
al. (
1989
)>
2820
, 30
‰
00
672
LT50
MO
R20
, 18,
20°C
, 10,
L20
20, 3
0‰
00
672
LT50
MO
R8,
4, 3
30°C
, 10,
L
20, 3
0‰
0–1
.50
–20
336-
Not
LT
50M
OR
84–
336
Bak
er &
Man
n (
1994
)
<0.
07<
124
LT10
0M
OR
2425
°C,
LP
ost-
sett
lem
ent
ph
ase
21‰
<0.
07<
124
LT10
0M
OR
2425
°C,
LD
isso
con
ch p
ost-
larv
ae21
‰
1.5
2096
LO
EC
GR
O96
25°C
, 21
‰L
Red
uce
d f
rom
40
to 2
2%
Tab
le 1
(co
nti
nu
ed)
(Table continued on next page)

Mar Ecol Prog Ser 238: 249–279, 2002256
Sp
ecie
sD
O l
evel
Exp
t E
nd
poi
nt
Con
dit
ion
sF
/LS
ourc
eR
emar
ks
(mg
l–
1 )%
du
rati
onC
onc.
Eff
ect
Tim
e(h
)(h
)
Mac
oma
bal
thic
a0
0n
sLT
50M
OR
432
Hen
rik
sson
(19
90)
Myt
ilu
s ed
uli
s0.
616.
7>
96LT
100
MO
R60
10°C
, 31
‰L
Wan
g &
Wid
dow
s (1
991)
0.61
6.7
96G
RO
9610
°C, 3
1‰
LF
erti
lize
d e
gg
s ca
n d
evel
op t
og
astr
ula
sta
ge
only
0.6
7.3
ns
–G
RO
ns
15°C
, 31
‰L
Eye
-sp
ot d
evel
opm
ent
del
ayed
by
<6
d1.
315
.760
–G
RO
6015
°C, 3
1‰
LD
elay
ed d
evel
opm
ent
from
em
bry
os t
o p
rod
isso
con
ch s
tag
e1.
315
.7n
s–
GR
On
s15
°C, 3
1‰
LE
ye-s
pot
dev
elop
men
t d
elay
ed b
y 2
d2.
429
.1n
s–
GR
On
s15
°C, 3
1‰
LE
ye-s
pot
dev
elop
men
t d
elay
ed b
y 1
d
Per
na
per
na
1–
720
LT50
MO
R15
6M
arsh
all &
Mcq
uai
d (1
993)
Sca
rph
area
in
aeq
ual
is0
0n
sL
C50
MO
R46
820
°C, 3
6.4
‰L
de
Zw
aan
et
al. (
1993
)T
oler
ance
exp
erim
ents
:
Ven
us
gal
lin
a0
0n
sL
C50
MO
R12
520
°C, 3
6.4
‰L
par
t of
a m
etab
olic
stu
dy
Myt
ilu
s g
allo
pro
vin
cial
is0
0n
sL
C50
MO
R36
020
°C, 3
6.4
‰L
Cru
stac
ean
sA
cart
ia t
onsa
0.06
–28
8LT
50M
OR
288
ns
Mar
cus
& L
utz
(19
94)
Cen
trop
ages
ham
atu
s0.
06–
288
LT50
MO
R28
8n
s
Lab
idoe
ra a
esti
va0.
06–
288
LT50
MO
R76
8n
s
Cyp
rid
eis
toro
sa0.
032
0.36
660
LT50
MO
R66
016
°C, 1
4‰
LG
amen
ick
et
al. (
1996
)
Mon
opor
eia
affi
nis
433
24L
OE
CR
A20
5°C
, 6.5
‰L
Joh
anss
on (
1997
)
Pon
top
orei
a fe
mor
ata
0.5
4.2
24L
OE
CR
A24
5°C
, 6.5
‰L
55%
am
ph
ipod
s ly
ing
on
th
e se
dim
ent
Cor
oph
ium
vol
uta
tor
0.03
20.
364
LT50
MO
R4
16°C
, 14
‰L
Gam
enic
k e
t al
. (19
96)
Idot
ea b
alti
ca0
0n
sLT
50M
OR
1.5
15°C
, 32
‰L
Vet
ter
et a
l. (
1999
)M
anca
s (s
tag
e b
efor
e ju
ven
ile)
0
0n
sLT
50M
OR
1.9
15°C
, 32
‰L
Juve
nil
e0
0n
sLT
50M
OR
3.8
15°C
, 32
‰L
Ad
ult
fem
ale
00
ns
LT50
MO
R6.
215
°C, 3
2‰
LA
du
lt m
ale
Idot
ea e
mar
gin
ata
00
ns
LT50
MO
R1.
915
°C, 3
2‰
LM
anca
s0
0n
sLT
50M
OR
2.6
15°C
, 32
‰L
Juve
nil
e0
0n
sLT
50M
OR
6.8
15°C
, 32
‰L
Ad
ult
fem
ale
00
ns
LT50
MO
R9.
715
°C, 3
2‰
LA
du
lt m
ale
Sad
uri
a en
tom
on0.
044
0.43
8LT
50R
EP
811
°C, 1
0‰
LV
ism
ann
&
Nor
mal
res
pir
atio
n r
ate
re-e
stab
lish
edH
ager
man
(19
96)
afte
r 8h
0.04
40.
438
LO
EC
ME
T8
11°C
, 10
‰L
Met
abol
ism
red
uce
d b
y 70
%, o
xyg
en
deb
t w
as 0
.57
mg
O2
l–1
18.
324
LO
EC
RA
245°
C, 6
.5‰
LJo
han
sson
(19
97)
Rem
ain
ed i
mm
obil
e on
th
e se
dim
ent
Cra
ng
on c
ran
gon
0.04
40.
572.
5LT
50M
OR
2.5
18°C
, 30
‰L
Hag
erm
an &
0.
455.
7930
LT50
MO
R30
18°C
, 30
‰L
Vis
man
n (
1995
)0.
9111
.71
ns
–B
En
s18
°C, 3
0‰
LO
nly
ver
y sp
orad
ic m
ovem
ent
occu
rred
Cal
ocar
is m
acan
dre
ae0.
7n
sLT
50M
OR
43n
sA
nd
erso
n e
t al
. (19
94)
Tab
le 1
(co
nti
nu
ed)

Gray et al.: Hypoxia and organic enrichment in coastal environment 257
(Table continued on next page)
Sp
ecie
sD
O l
evel
Exp
t E
nd
poi
nt
Con
dit
ion
sF
/LS
ourc
eR
emar
ks
(mg
l–
1 )%
du
rati
onC
onc.
Eff
ect
Tim
e(h
)(h
)
Pen
aeu
s se
tife
rus
228
.314
40–
ME
T14
4028
°C, 1
5‰
LR
osas
et a
l. (
1999
)U
nfe
d, a
mm
onia
exc
reti
on r
edu
ced
by
76.9
%2
28.3
1440
ME
T14
4028
°C, 1
5‰
LF
ed, a
mm
onia
exc
reti
on r
edu
ced
by
51.1
%2
28.3
1440
RE
P14
4028
°C, 1
5‰
LU
nfe
d, o
xgen
up
tak
e re
du
ced
by
80.4
%2
28.3
1440
–R
EP
1440
28°C
, 15
‰L
Fed
, oxy
gen
up
tak
e re
du
ced
by
50.3
%2
31.7
1440
–R
EP
1440
28°C
, 35
‰L
Un
fed
, oxy
gen
up
tak
e re
du
ced
b
y 71
.8%
342
.414
40–
RE
P14
4028
°C, 1
5‰
LU
nfe
d, o
xyg
en u
pta
ke
red
uce
db
y 58
.7%
347
.614
40–
RE
P14
4028
°C, 3
5‰
LU
nfe
d, o
xyg
en u
pta
ke
red
uce
d
by
47.2
%3
47.6
1440
–R
EP
1440
28°C
, 35
‰L
Fed
, oxy
gen
up
tak
e re
du
ced
by
35.5
%3
47.6
1440
–M
ET
1440
28°C
, 35
‰L
Met
abol
ic s
ub
stra
te c
han
ged
fro
mp
rote
ins
+ l
ipid
s to
pro
tein
s
00
672
LT50
MO
R<
1, <
1,20
°C, 2
0, 3
0‰
LS
tick
le e
t al
. (19
89)
Cri
tica
l le
vel
of D
O: 3
.4 +
0.4
8 m
g l
–1
Pal
aem
on a
dsp
ersu
s3.
438
.9n
sR
EP
ns
24°C
, 14
‰L
Nie
lsen
&
Cri
tica
l le
vel
of D
O: 2
.89+
0.26
mg
l–
1
Pal
aem
onet
es v
aria
ns
2.89
33n
sR
EP
ns
24°C
, 14
‰L
Hag
erm
an (
1998
)
P. p
ug
io0
067
2LT
50M
OR
130
°C, 1
0‰
LS
tick
le e
t al
. (19
89)
Cal
lin
ecte
s sa
pid
us
00
144
LT10
0M
OR
144
24°C
, 30
‰L
Das
& S
tick
le (
1993
)0
067
2LT
50M
OR
<1,
<1,
20°C
, 10,
L
Sti
ckle
et
al. (
1989
)<
120
, 30
‰0
067
2LT
50M
OR
<1,
<1,
30°C
, 10,
L<
120
, 30
‰
C. s
imil
is2.
2232
672
LO
EC
FE
ED
672
24°C
, 30
‰L
Das
& S
tick
le (
1993
)F
eed
ing
red
uce
d b
y 20
%
Car
cin
us
mae
nas
00
12L
OE
CM
ET
1210
°C, 3
0‰
LH
ill
et a
l. (
1991
)M
etab
olis
m r
edu
ced
to
<20
%
C. m
aen
as0.
040.
48
LO
EC
ME
T8
11°C
, 10
‰L
Vis
man
n &
M
etab
olis
m r
edu
ced
by
30%
Hag
erm
an (
1996
)
Eu
ryp
anp
opeu
s d
epre
ssu
s0
067
2LT
50M
OR
130
°C, 1
0‰
LS
ick
le e
t al
. (19
89)
–
Rh
ith
rop
anop
eus
har
risi
i0
067
2LT
50M
OR
<1
30°C
, 10
‰L
–
Hom
aru
s g
amm
aru
s0.
88n
sLT
100
MO
R98
4R
osen
ber
g e
t al
. (19
91)
–
Nep
hro
ps
nor
veg
icu
s<
2.8
<30
504
LO
EC
FE
ED
504
8–1
0°C
, L
Bad
en e
t al
. (19
90)
Mor
tali
tiy
red
uce
d t
o 0
%32
–34
‰2.
530
.5n
sA
CT
115
°C, 3
4‰
LE
rik
sson
& B
aden
(19
97)
Act
ivit
y re
du
ced
to
0%
<2
ns
ME
T1
ns
FE
rik
sson
et
al. (
1998
)M
ang
anes
e co
nce
ntr
atio
n i
n g
ill
incr
ease
d o
ver
20-f
old
Ech
ino
der
ms
Am
ph
iura
fil
ifor
mis
<0.
1<
1.1
168
LT50
MO
R16
88.
5 +
1.5
°C,
LV
isti
sen
& V
ism
ann
(19
97)
29.5
+ 1
.4‰
0.3
3.27
348
LT50
MO
R34
88.
5 +
1.5
°C,
L29
.5 +
1.4
‰0.
55.
4578
0LT
50M
OR
780
8.5
+ 1
.5°C
, L
29.5
+ 1
.4‰
Tab
le 1
(co
nti
nu
ed)
Mar Ecol Prog Ser 238: 249–279, 2002258
Sp
ecie
sD
O l
evel
Exp
t E
nd
poi
nt
Con
dit
ion
sF
/LS
ourc
eR
emar
ks
(mg
l–
1 )%
du
rati
onC
onc.
Eff
ect
Tim
e(h
)(h
)
0.1
–11.
1–1
1n
sL
OE
CB
En
s8.
5 +
1.5
°C,
LA
ll r
ose
to t
he
sed
imen
t su
rfac
e an
d
29.5
+ 1
.4‰
lift
ed t
he
dis
c in
to t
he
wat
er c
olu
mn
1.8
2014
40G
RO
1440
10°C
, 33
‰L
Nil
sson
& S
kol
d (
1996
)A
rm r
egen
erat
ion
rat
e sl
owed
by
65%
, Len
gth
red
uce
d b
y 25
% a
nd
ar
ea b
y 36
%2.
730
1440
GR
O14
4010
°C, 3
3‰
LL
eng
th r
edu
ced
by
14%
, are
a b
y 21
%1.
8–2
.220
–24.
414
88G
RO
1488
10°C
, 34
‰L
Nil
sson
(19
99)
Arm
reg
ener
atio
n r
ate
dec
reas
ed
by
20%
Op
hiu
ra a
lbid
a<
0.1
<1.
160
LT50
MO
R60
8.5
+ 1
.5°C
, L
Vis
tise
n &
Qu
ick
ly b
ecam
e in
acti
ve &
mor
ibu
nd
29.5
+ 1
.4‰
Vis
man
n(1
997)
0.3
3.27
144
LT50
MO
R14
48.
5 +
1.5
°C,
L29
.5 +
1.4
‰0.
55.
4533
6LT
50M
OR
336
8.5
+ 1
.5°C
, L
29.5
+ 1
.4‰
0.1
–1.1
1.1
–11
ns
LO
EC
BE
ns
8.5
+ 1
.5°C
, L
Init
iall
y sh
owed
in
crea
sed
mob
ilit
y29
.5 +
1.4
‰(e
scap
e re
spon
se f
or 2
to
4 d
);
lift
ed d
isc
into
wat
er c
olu
mn
A. f
ilif
orm
is1.
820
1440
GR
O14
4010
°C, 3
3‰
LN
ilss
on &
Sk
old
(19
96)
Arm
reg
ener
atio
n r
ate
slow
er t
o 65
%le
ng
th r
edu
ced
by
25%
are
a b
y 36
%2.
730
1440
GR
O14
4010
°C, 3
3‰
LL
eng
th r
edu
ced
by
14%
, are
a re
du
ced
b
y 21
%1.
8–2
.220
–24.
414
88G
RO
1488
10°C
, 34
‰L
Nil
sson
(19
99)
Arm
reg
ener
atio
n r
ate
dec
reas
ed b
y 20
%
Op
hiu
ra a
lbid
a<
0.1
<1.
160
LT50
MO
R60
8.5
+ 1
.5°C
, L
Vis
tise
n &
Q
uic
kly
bec
ame
inac
tive
an
d
Vis
man
n (
1997
)m
orib
un
d29
.5 +
1.4
‰0.
33.
2714
4LT
50M
OR
144
8.5
+ 1
.5°C
, L
29.5
+ 1
.4‰
0.5
5.45
336
LT50
MO
R33
68.
5 +
1.5
°C,
L29
.5 +
1.4
‰0.
1–1
.11.
1–1
1n
sL
OE
CB
En
s8.
5 +
1.5
°C,
LIn
itia
lly
show
ed i
ncr
ease
d m
obil
ity
29.5
+ 1
.4‰
(esc
ape
resp
onse
for
2–
4 d
),
lift
ed d
iscs
in
to w
ater
col
um
n
Psa
mm
ech
inu
s m
ilia
ris
892
.95
RE
P5
12°C
, 34
‰L
Sp
icer
(19
95)
Rep
rod
uct
ion
dec
reas
ed p
rog
ress
ivel
yas
oxy
gen
dec
lined
fro
m 8
to
1.8
mg
l–1
Fis
hA
nch
oa m
itch
illi
113
.524
LT10
0M
OR
2424
–26°
C,
LB
reit
bu
rg e
t al
. (19
94)
13-1
7‰
Bol
eop
hth
alm
us
bod
dae
rti
0.8
10.8
6L
OE
CM
ET
625
°C, 1
5‰
LC
hew
& I
p (
1992
a)A
DP
in
mu
scle
red
uce
d b
y 36
%0.
810
.86
LO
EC
RE
P0.
083
25°C
, 15
‰L
Oxy
gen
con
sum
pti
on r
edu
ced
b
y 58
.3%
00
0.67
LO
EC
ME
T0.
6725
°C, 1
5‰
LIn
mu
scle
, CrP
red
uce
d b
y 24
%, A
TP
re
du
ced
by
27%
.
Tab
le 1
(co
nti
nu
ed)
Gray et al.: Hypoxia and organic enrichment in coastal environment 259
Sp
ecie
sD
O l
evel
Exp
t E
nd
poi
nt
Con
dit
ion
sF
/LS
ourc
eR
emar
ks
(mg
l–
1 )%
du
rati
onC
onc.
Eff
ect
Tim
e(h
)(h
)
00
0.36
LO
EC
AC
T0.
3625
°C, 1
5‰
LC
hew
& I
p (
1992
b)
Com
ple
tely
in
ert
00
1L
OE
CM
ET
125
°C, 1
5‰
LL
ow e
t al
. (19
93)
Lac
tate
in
th
e g
ills
in
crea
sed
12-
fold
1.12
15.1
1L
OE
CM
ET
125
°C, 1
5‰
LG
lyco
gen
dec
reas
ed b
y 36
%
A. f
ilif
orm
is1.
820
1440
GR
O14
4010
°C, 3
3‰
LN
ilss
on &
Sk
old
(19
96)
Arm
reg
ener
atio
n r
ate
slow
ed b
y 65
%,
Len
gth
red
uce
d b
y 25
% a
nd
are
a b
y 36
%
B. b
odd
aert
i1.
1215
.16
LO
EC
ME
T6
25°C
, 15
‰L
Low
et
al. (
1993
)T
otal
lac
tate
pro
du
ced
in
crea
sed
2-
fold
, lac
tate
in
blo
od 4
-fol
d
Gad
us
mor
hu
a<
4<
36.2
–50
.1n
sL
OE
CA
CT
7.5
5, 1
0, 1
5°C
, L
Sch
urm
ann
&
19–2
1‰
Ste
ffen
sen
(19
94)
Red
uce
d s
wim
min
g a
ctiv
ity
by
60%
4.19
4520
16L
OE
CF
EE
D20
1610
°C, 2
8‰
LC
hab
ot &
Du
til
(199
9)R
edu
ced
fee
din
g b
y 54
.3%
4.19
4520
16M
ET
2016
10°C
, 28
‰L
Lac
tate
dec
reas
ed b
y 21
.7%
,K
ion
in
crea
sed
by
8.5
%5.
2156
2016
LO
EC
ME
T20
1610
°C, 2
8‰
LL
iver
glu
cose
dec
reas
ed b
y 26
.2%
6.05
6520
16N
OE
CG
RO
2016
10°C
, 28
‰L
Red
uct
ion
in
len
gth
6.8
7320
16N
OE
CG
RO
2016
10°C
, 28
‰L
Red
uct
ion
in
mas
s
Gob
ioso
ma
bos
c1
13.5
24LT
100
MO
R24
24–2
6°C
, L
Bre
itb
urg
et
al. (
1994
) 13
–17
‰1
13.5
4L
OE
CR
EP
424
–26°
C,
LR
epro
du
ctio
n i
ncr
ease
d b
y 20
0%
13–1
7‰
Sol
ea s
olea
00
12L
OE
CM
ET
1220
–24°
C,
LD
alla
Via
et
al. (
1997
)In
mu
scle
AT
P d
ecre
ased
by
40%
, 37
‰in
liv
er g
luco
se i
ncr
ease
d 8
-fol
d0.
456.
512
LO
EC
ME
T12
20–2
4°C
, 37
‰L
Gly
cero
l-3-
P i
ncr
ease
d b
y 20
0%
0.9
1312
LO
EC
ME
T12
20–2
4°C
, 37
‰L
In m
usc
le l
acta
te i
ncr
ease
d 3
-fol
d,
glu
cose
by
114
%
0.9
1312
LO
EC
ME
T12
20–2
4°C
, 37
‰L
Dal
la V
ia e
t al
. (19
94)
Met
abol
ism
dec
reas
ed b
y 27
%
Per
iop
hth
alm
us
0.75
6L
OE
CA
CT
2.04
ns
LC
hew
et
al. (
1990
)C
omp
lete
ly i
ner
tch
ryso
spil
os0.
86
LO
EC
RE
P6
ns
LR
esp
irat
ory
rate
red
uce
d b
y 70
%0.
86
LO
EC
ME
T6
ns
LP
lasm
a la
ctat
e in
crea
sed
5-f
old
Per
iop
hth
alm
odon
0.8
10.8
6L
OE
CM
ET
625
°C, 1
5‰
LIp
& L
ow (
1990
)L
acta
te i
n g
ills
in
crea
sed
by
98%
,sc
hlo
sser
iin
blo
od b
y 80
%0
01
LO
EC
ME
T1
25°C
, 15
‰L
Low
et
al. (
1993
)L
acta
te i
n t
he
gil
ls i
ncr
ease
d b
y 11
5%
1.12
15.1
1L
OE
CM
ET
125
°C, 1
5‰
LG
lyco
gen
dec
reas
ed b
y 36
%1.
1215
.16
LO
EC
ME
T6
25°C
, 15
‰L
Tot
al l
acta
te p
rod
uce
d i
ncr
ease
d
3.2-
fold
, lac
tate
in
blo
od b
y 12
4%
,g
ills
by
115
%<
0.4
<5.
8–
6.3
6L
OE
CM
ET
330
°C, 1
5–2
7‰
LIs
him
atsu
et
al. (
1999
)H
eart
rat
e in
crea
sed
by
29%
Pla
tich
thys
fle
sus
0.5
4.96
0.38
+ 0
.03
LT50
MO
R0.
38 +
0.0
313
°C, 5
‰L
Tal
lqvi
st e
t al
. (19
99)
19.
922.
48 +
0.1
3LT
50M
OR
2.48
+ 0
.13
13°C
, 5‰
L2
19.8
430
.58
+ 1
.45
LT50
MO
R30
.58
+ 1
.45
13°C
, 5‰
L3
29.7
622
LO
EC
RE
P22
13°C
, 5‰
LV
enti
lati
on r
ate
incr
ease
d b
y 26
%3
29.7
624
LT50
FE
ED
2413
°C, 5
‰L
Pre
dat
ion
eff
icie
ncy
red
uce
d b
y 64
%
Zoa
rces
viv
ipar
us
00
1LT
100
MO
R1
Fis
cher
et
al. (
1992
)<
2.9
<35
.4n
sL
OE
CA
CT
ns
15°C
, 34
‰L
Mot
ion
less
Tab
le 1
(co
nti
nu
ed)

Mar Ecol Prog Ser 238: 249–279, 2002
experiment at a specific concentration and exposuretime. For example there are many studies on mortalityrates at 0 mgO2 l–1. This concentration does lead tomortalities, but there may well be stronger effects athigher concentrations that have not been studied.Thus, in the present study more significance is givento non-lethal effects such as effects on growth, feedingand metabolic rates rather than mortality.
Diaz & Rosenberg (1995) defined hypoxia as begin-ning at 2.0 mlO2 l–1 and reaching the point of anoxia at0.0 ml l–1. (At 20 psu, 1 mlO2 l–1 is equivalent to 1.4 mgl–1, or 4.3% O2 and 14% saturation.) In general, pro-longed exposure to 4 mgO2 l–1 causes acute mortalityin many invertebrates and non-salmonid fish embryos;while 3 mgO2 l–1 causes acute mortality in most non-salmonid fishes (USEPA 1986, 1989). It is also generallyaccepted that larval fishes and crustaceans are moresensitive than the adults (Miller et al. 1995).
The literature data show that fishes are more sensi-tive to reduced oxygen concentrations than crusta-ceans, followed by annelids, and that bivalves are themost tolerant (Rosenberg et al. 1992, Nilsson & Rosen-berg 1994, Reish 1970). There are few studies of growthreductions caused by reduced oxygen concentrations,but see Strzyewska (1978), Strzyewska & Popiel (1974)and Wrezinski (1983) for indirect evidence. Severeproduction impairment of early-life non-salmonid spe-cies occurred when oxygen falls below 4.5 mg l–1
(USEPA 1986). An oxygen concentration of 4.7 mg l–1
impairs larval growth (Miller et al. 1995), and adultfishes reduce food intake and growth when oxygenfalls to 60–70% of saturation (Jobling 1993, Pichavantet al. 1999). The relatively active cod Gadus morhuashows reductions in growth at 6.5 mgO2 l–1, a high oxy-gen concentration. Whereas metabolic effects appearin G. morhua at concentrations of 4.5 mgO2 l–1 mud-skippers (Boleophthalmus boddaerti, Periophthalmuschrysoplios, P. schlosseri), which inhabit burrows infine muddy sediments in tropical and sub-tropicalareas, show metabolic effects only at concentrations ofaround 1 mgO2 l–1. The boreal Solea solea, a bottom-living flatfish shows levels of metabolic responsesimilar to those of Mudskippers. Keckeis et al. (1996)showed that reduced oxygen (10% air saturation)increased mortality and decreased hatching success innase Chondrostoma nasus. Most fishes show mortalityat oxygen concentrations between 1 and 2 mgO2 l–1,but mudskippers are not affected until values fall toaround 0.5 mgO2 l–1. Thus the behavioural habits of aspecies are a good indication of its probable hypoxictolerance level.
In crustaceans, the blue crab Callinectes sapidus, theNorway lobster Nephrops norvegicus and the shrimpsPenaeus setiferus and Palaemon adspersus and P. var-ians show hypoxic effects on feeding at between 2 and
3 mgO2 l–1. A decrease in growth rates at oxygen con-centrations below 3.5 mgO2 l–1 has been shown for themarine amphipod Melitta longidactyla (Y.Y.O. unpubl.data). Abundances are reduced and mortalities occurbelow 1 mgO2 l–1 in the sediment-living isopod Saduriaentomon. For M. longidactyla the 48 h LC50 value is1.6 mgO2 l–1.
Reductions in growth occur in the ophiuroid echino-derm Amphiura filiformis between 2.7 and 1.8 mgO2
1–1 and in the bivalve molluscs Crassostrea virginicaand Mytilus edulis between 1.5 and 0.6 mgO2 l–1 oxy-gen, whereas the opportunistic polychaete Capitellacapitata shows growth reductions between 2.1 and0.06 mgO2 l–1, but can survive for >24 d at 2.1 mgO2 l–1
(Rosenberg 1972). In tolerance experiments conducted without sedi-
ments, Dries & Theede (1974) found that at 17 psu,10°C and <0.15 mlO2 l–1 the bivalves Astarte borealis,A. elliptica, A monatgui, Arctica islandica and Mytilusedulis survived more than 1000 h, whereas the poly-chaetes Nepthys ciliata and Nereis diversicolor sur-vived for ca. 200 h and the crustaceans Carcinusmaenas, Gammarus oceanicus, Idotea balthica andCrangon crangon survived for less than 100 h. Simi-larly, Henriksson (1969) reported the ranking of anoxictolerance from greatest to least as: bivalves Macomabalthica > Cardium lamarkii > polychaetes N. diversi-color > Scoloplos armiger > Ampharete grubei > Tere-bellides stroemi. De Zwaan et al. (1993) found thatbivalves from the Medierranean were highly tolerantof anoxia, with Scarpharea inaequalis surviving 48 h ofanoxia. Table 2 summarises these effects. Crustaceansshow the least tolerance (Theede 1973, Dries & Theede1974). Although growth and metabolic effects occur atconcentrations above 2 mgO2 l–1 below this value mor-tality will occur if the organisms cannot escape fromhypoxic conditions. Whilst fishes and some crusta-ceans may be able to move away from the areasaffected, most benthic organisms suffer mortality. Thiswill occur first in crustaceans and echinoids followed
260
Type of organism Effect Conc. (mg l–1)
Actively swimming fish Growth 6Actively swimming fish Metabolism 4.5Bottom-living fish Metabolism 4Most fishes Mortality 2Crabs, shrimps, lobsters, Growth 2–3.5isopodsBottom-living isopods Mortality 1–1.6Bivalve molluscs Growth 1–1.5Annelids Growth 1–2Mudskippers Mortality 1
Table 2. Summary of effects of reduced oxygen concentra-tions on marine organisms

Gray et al.: Hypoxia and organic enrichment in coastal environment
by the more sensitive annelids and finally the bivalvemolluscs.
The present review clearly reveals that the sec-ondary effects of eutrophication on benthos and fishesare largely the result of reduced oxygen saturationcaused by the decay and sedimentation of organicmaterial. Some field studies illustrate that there arebehavioural responses in addition to effects on growthand metabolism (Renaud 1986). The Kattegat hasundergone regular seasonal hypoxic events for manydecades (Jørgensen & Richardson 1996, Richardson &Heilmann 1995). During these events, biomass reduc-tions in benthic assemblages were recorded at stationsthat were subject to lowered oxygen concentrations(Pearson et al. 1985). Pihl (1989), Pihl et al. (1992, 1994)and Baden et al. (1990) reported changes in the behav-iour of benthic species, whereby fishes such as cod andwhiting left the area at oxygen saturation levels below25%, whereas dabs and flounders were more resistant,leaving the area only when oxygen saturation droppedbelow 15%. In hypoxic water, some fish species movedto the surface and ventilated their gills in the topoxygenated layer (Val et al. 1998). One of the moreunusual aspects of hypoxic events is increased catchesof fishes. Fishes migrate away from areas with lowoxygen saturation and concentrated in shallower areaswhere catches increase (Hildén et al. 1982, Pihl 1989,Hagström et al. 1989, Baden et al. 1990, Hansson &Rudstam 1990). Dyer et al. (1983) caught much highernumbers of benthic animals in trawls off the Danishcoast in an area of low bottom-water oxygen concen-trations; however, when low oxygen concentrationspersisted, the catches of fishes were reduced. Thedecapod Nephrops norvegicus left its burrow andappeared on the sediment surface at oxygen saturationbelow 15%. Of the organisms commonly found insand–mud bottoms, the bivalve Abra sp. and the bur-rowing urchins Echinocardium spp. are particularlysensitive to reduced oxygen concentration (Baden etal. 1990). In the Gullmarfjord, Sweden, Josefson &Widbom (1988) found that at oxygen concentrationsbelow 1.4 mg l–1 all the macrofauna was eliminated,but that no meiofaunal taxa showed significantdeclines in abundance. (See also Gowen & Bradbury1987, Hargrave 1994 and Hevia et al. 1996, who exam-ined the effects of direct organic matter input from fishfarms on the benthos.) Levin & Gage (1998) found thatdepth and organic matter, rather than oxygen concen-tration, limited faunal richness and biomass.
A consequence of these behavioural changes is thatpredator-prey dynamics can also be altered. Althoughthere are few studies on the effects of hypoxia onpredator-prey relationships, Sandberg (1994) showedthat the predatory isopod Saduria entomon was inhib-ited in its predatory activities on the Baltic Sea benthos
by low hypoxia. In laboratory experiments Taylor &Eggleston (2000) showed, that the blue crab Call-inectes sapidus altered its predatory behaviour inresponse to hypoxia. Low oxygen concentrationsinhibited the crab from foraging, but increased prey(the clam Mya arenaria) vulnerability by altering thesiphon extension and depth distribution within thesediment (see also Breitburg et al. 1994, Nestlerode &Diaz 1998).
Under conditions of extreme amounts of nutrientinput, mass growth occurs in opportunistic algae suchas Ulva sp. in the Lagoon of Venice (Sfriso et al. 1987,1988) and Cladophora sp. in Laholm Bay, Sweden(Baden et al. 1990). These species form huge mats andsmother the sediment, which becomes anaerobic as aconsequence. Large phytoplankton blooms resultingfrom excess nutrient addition may be toxic, the so-called ‘red tides’. Examples of such toxic blooms aretoo numerous to mention but see Smayda (1990) forrecent references.
Areas where hypoxia has been recorded
In their review Diaz & Rosenberg (1995) provide acomprehensive list of areas where hypoxia hasoccurred. Here we take a slightly different approachand classify the types of hypoxia and areas in whichhypoxia/anoxia have been recorded (see Table 3).Upwelling areas are not included since although suchareas do experience hypoxic events (e.g. the coast ofPeru, Walvis Bay, South Africa and the Horn of SouthArabia) these are not usually driven by anthropogenicactivities, but man-induced climate change may in-fluence these systems. Additional anoxic events notrecorded in the Diaz & Rosenberg (1995) review are: incoastal waters in New South Wales (Rainer & Fitzhard-inghe 1981), Northern Adriatic (Degobbis et al. 1979),Tokyo Bay (Tsuji et al. 1973), Mobile Bay (May 1973),Bay of Vilaine (Rossignol-Stick 1985) and ChesapeakeBay Seliger et al. (1985). Additional references to theNew York Bight incident are found in Falkowski et al.(1980).
Table 3 shows that hypoxia occurs most commonly asa seasonal phenomenon in many areas, notably fjords,estuaries, coastal embayments, and occurs on the shelfadjacent to the Mississippi River and the anoxic basinin the central Black Sea. Hydrographic and climaticforcing processes drive these seasonal events. Forexample exchange of the deep (often anoxic) water inthe inner Oslofjord is driven primarily by northerlywinds, which move less-saline surface waters out ofthe fjord to be replaced by more-saline deep waterfrom the Skagerrak. This water sinks when it flowsover the 2 major sills and the anoxic water, which is
261

Mar Ecol Prog Ser 238: 249–279, 2002
less saline, is lifted and disperses and moves out ofthe fjord. Whilst such events are natural and haveoccurred over long periods of time, there is no doubtthat their extent in time and space has increased inrecent years with the addition of nutrients and/ororganic matter from anthropogenic sources. The innerOslofjord, Norway (Mirza & Gray 1983, Paasche &Erga 1988), Swedish fjords and coasts (Söderström1971, Rosenberg 1977, Svane & Gröndal 1988, Diaz &Rosenberg 1995), the Kattegat (Jørgensen 1980, An-dersson & Rydberg 1988, Rydberg et al. 1990, Steffen-sen 1990), the Baltic Sea (Wulff et al. 1986, 1990, Ro-senberg et al. 1990), Dutch and German coastal waters(Bennekom et al. 1975, Cadée 1984, Beukema & Cadée1986, Reise et al. 1989), the German Bight (Rachor1990), Kiel Bay (Rumohr 1986), Black Sea (Zaitsev1992) and Chesapeake Bay (Cooper & Brush 1991) aregood examples. There are only 2 examples of periodic,but non-seasonal hypoxia, both from rivers enteringChesapeake Bay. These events last from days to weeksand occur irregularly throughout a year. In the YorkRiver, tidal mixing controls the periodicity, whereas inthe Rapahannock River a combination of tidal mixingand proximity to the hypoxic waters of ChesapeakeBay (Kuo & Neilson 1987) plays the key role.
Irregular events are also usually driven by unusualhydrographic and/or climatic factors. For example theNew York Bight event in 1981 has been particularlywell studied. Whilst this event was initially attributed
to increased anthropogenic carbon input (mainly se-wage) simulation models showed that the event wasmost probably the result of unusual climatic condi-tions. These were: a warm winter with large terrestrialrunoff; a low frequency of spring storm events result-ing in a deep spring thermocline; persistent southerlysummer winds; a large autochthonous carbon load ofthe dinoflagellate Ceratium triops; and low grazingpressure (Walsh 1988 gives a full account of this event).A simulation study (Stoddard & Walsh 1986) showedthat the anoxic event would have occurred without anyallochthonous input of organic carbon from anthro-pogenic sources. What is clear from that study is thatclimatic conditions were extremely important in trig-gering the event. The anoxic event off the Danish-German coasts in September 1981 (Dyer et al. 1983)was also probably caused by unusual hydrographicconditions.
The areas with permanent anoxia (Idefjord, Byfjord,Fosa da Cariaco, Gulf of Finland and the central areasof the Baltic, Black and Caspian Seas) are all areaswith extremely limited water exchange so that replen-ishment of the oxygen in the deep basins is not pos-sible. However, in all these areas there is little doubtthat conditions have worsened during this century as aresult of anthropogenic inputs of nutrients.
A common factor concerning all the examplesshown in Table 3 is that hypoxia and anoxia occur inareas that have poor water exchange. Yet these
262
Fjords Estuaries Bays Shelf Enclosed seas
Saanich Inlet, Port Hacking, Chesapeake Bay (1) Lousiana shelf (1) Seto Inland Sea, Canada (1) Australia (1) Japan (1)Inner Oslofjord, Pamlico River, USA (1) Tome Cove, Japan (1) Black Sea shelf (1) Bornholm Basin, Norway (1) Baltic Sea(1)Gullmarsfjord, 46% of US estuaries (1) Laholm Bay, Sweden (1) Texas Shelf (3) Kattegat, Denmark (1)Sweden (1)Swedish west (1) Rappahannock R Kiel Bay, Germany (1) German Bight (3) Northern Adriatic (3)coast fjords USA (2)Limfjord, York River, USA (2) Hillsborourgh Bay, New York Bight (3) Central Black Sea (4)Denmark (1) Florida (1)Lough Ine, Gulf of Trieste, Adriatic (1) Danish-German Central Baltic Sea (4)Ireland (1) coast (3)Sullom Voe, Elefsis Bay, Aegean Sea (1) New South Wales (3) Central Caspian Sea (4)Scotland (1)Byfjord, Aarhus Bay, Denmark (1)Sweden (4)Idefjord, Tolo Harbour, Hong Kong (1)Sweden-Norway (4) Bay of Vilaine, France (3)
Somm(1) Bay, France (3) German Bight, North Sea (3) Mobile Bay, USA (3)Tokyo Bay, Japan (3)Fosa da Cariaco, Venezuela (4)Gulf of Finland (4)
Table 3. Marine areas subjected to hypoxia. 1: seasonal; 2: periodic; 3: irregular; 4: permanent

Gray et al.: Hypoxia and organic enrichment in coastal environment
marine coastal environments encompass a wide vari-ety of systems: from stratified and non-stratified estu-aries, fjords with and without sills, areas with tempo-rary and permanent frontal systems, gyres whichentrain nutrients and production, areas that are con-stantly mixed and areas that are periodically strati-fied. No simple model will encompass all these formsof variability, and it is probable that each area willhave to be considered per se. Waves, tides and cur-rents are also of great significance to the large areasof intertidal and shallow subtidal zones in the marineenvironment. Physical factors such as wave action canlimit biomass despite a rich supply of nutrients.Hypoxia in freshwater lakes has been controlledusing a simple relationship established by Vollen-weider (1976). If one knows the phosphorus input andoutput, the area and the average depth of the lake,and its mean phosphorus concentration, one can pre-dict by how much nutrient input needs to be reducedto restore the lake to oxic conditions. Vollenweider’smodel has been applied successfully to many lakes.However, no simple relationship of the Vollenweidertype (Vollenweider 1975, 1976) is likely to apply tocoastal marine areas subjected to high nutrient load-ings. Vollenweider (1992) acknowledged this by com-menting on coastal eutrophication that ‘…difficultiesrest not only with the assessment of load and nutrientbudgets, but with the interpretation of such figur-es…their trophodynamic significance…unless furthermorphometric, hydrological and other parameters ofthe system are also taken into consideration.’
Examination of the areas where eutrophication ef-fects have been observed reveals that hypoxia is thecritical factor affecting marine life and where anoxicevents occur these are most often associated with un-usual climatic conditions. Likewise, high organic mat-ter content in the sediment will not lead to negative ef-fects if the material is difficult to breakdown (high C:Nratios) and does not enhance aerobic microbial activityand lead to hypoxia. However, where the material is ofhigh quality (C:N < 10) and oxygen is present, micro-bial action will lead to mineralisation of the organicmatter and lowering of the oxygen concentration andmay lead to hypoxia. Thus it is important that coastalzone managers realise that discharges of nutrients ei-ther directly as sewage or indirectly from agriculturaland forestry runoff will lead to problems in areas thatare stagnant or that have limited water exchange.
Ammonia
Ammonia is acutely toxic to fishes and marine organ-isms at low concentrations, and unionized ammonia isconsidered the major toxic form in the aquatic environ-
ment. In the environment, ammonia is in equilibriumwith ammonium. The threshold concentration of totalammonia ([NH3] + [NH4
+]) resulting in unacceptablebiological effects promulgated by the USEPA (1989)was 3.48 mg N l–1 at pH 6.5 and 0.25 mg N l–1 at pH 9.0.The updated criteria (USEPA 1989) sets the acute-chronic ratio at (14.4 mg N l–1, pH 8) and (1.27 mg N l–1,pH 11.3). Most of our knowledge on ammonia toxicityin the aquatic environment is based on freshwater ani-mals, and there is a paucity of data on marine animals(Handy & Poxton 1993).
Table 4 shows the effects of unionized ammonia onmarine organisms. Here the mortality studies wereaimed at determining the LC50 values. For the flounderParalichthys orbignyanus, adults showed effects atbetween 50 and 66 mg NH3 l–1 whereas 1 d old larvaewere affected at concentrations of only 0.27 mg NH3 l–1
and 23 d old larvae at 1.02 mgNH3 l–1 (Kim et al. 1997).Penaeid shrimps varied in their LC50 response, from11.5 mgNH3 l–1 in P. penicillatus to ca. 50 mgNH3 l–1
in P. chinensis. The burrowing amphipod Ampeliscaabdita had a LC50 of ca. 50 mgNH3 l–1.
The LC50 responses to unionised ammonia are re-markably uniform across species with the minnowCyprinodon variegatus, the turbot Scophthalmus max-imus and the lobster Homarus americanus being mostsensitive at 2.1 to 3.8 mgNH3 l–1, whereas nearly allother species studied ranging from mysids, shrimps,bivalves and fish (seabass, seabream, inland silverside,planehead pipefish, winter flounder) were affected atconcentrations of <2 mgNH3 l–1.
Hydrogen sulphide
There are considerable data on the effects of hydrogensulphide (H2S) on freshwater fish species, but relativelylittle on marine species (Tables 5 & 6). Again thereappears to be a marked difference between mortalityeffects in active fishes (e.g. pike Esox lucius) with arange of 16 to 76 µgH2S l–1 (geometric mean 35) andthose in benthic species (e.g. lake whitefish Coregonusclupeaformis), with a range of 2 to 13 (geometric mean4.14) µgH2S l–1. Crayfish (Cambarus diogenes and Pro-cambarus clarki) were far more tolerant with LC50 valuesof 146 and 115 µgH2S l–1 respectively.
Of the marine species for which there are data theshrimp Palaemon pugio had an LC50 of 114 and marinebottom-living foraminiferans an LC50 between 200 and400 µgH2S l–1 .
The polychaete Capitella capitata, which occurs inhigh numbers in organically highly rich sediments, hasa requirement for hydrogen sulphide as a settlementclue (Cuomo 1985) and thus newly settled larvae arefound in hydrogen sulphide-rich sediments.
263

Mar Ecol Prog Ser 238: 249–279, 2002
Once anaerobic conditions ensue and H2S is present,mass mortalities of nearly all organisms occur (Stacho-witsch 1984). In the innermost Oslofjord (Bunnenfjord)at dephts greater than 50 m, H2S is found in the watercolumn and no macrobenthic fauna exists (J.S.G.unpubl.). Such conditions occur naturally under thethermocline in upwelling areas off Peru, where matsof the bacterium Thioplaca sp. can attain wet weightbiomass of 2 kg m–2 (Rosenberg et al. 1983, Tarazonaet al. 1986).
Interactions among factors
The data on reduced oxygen concentrations, ammo-nia and hydrogen sulphide show that there are somegeneral responses. In general, the sensitivity of majormarine taxa is: fish > echinoderms and crustaceans >annelids > molluscs. However, within each taxon thereis considerable variability, dependent on the habits ofthe species considered. Actively swimming fishes aremore sensitive than bottom-living fishes, which in turn
264
Species LC50 conc. Expt Temp. Salinity pH Source(mg NH3 l–1) duration (h) (°C) (‰)
CrustaceansEucalamus elongatus 0.87 24–48 20.3 34 8 USEPA (1989)
E. pileatus 0.79 24–48 20.5 34 8.2
Latreutes fucorum 0.77 24–48 23.4 28 8.07
Metapenaeus ensis 0.87–1.76 48–96 25 25 7.7 Nan & Chen (1991)
Mysidopsis bahia 0.50 96 25 31 7 Miller et al. (1990)1.70 96 25 31 82.87 96 25 31 90.048 672 25 31 ns0.163 672 25 31 ns0.331 672 25 31 ns1.02 24–48 23.2 21.4 6.8–9.2 USEPA (1989)
Palamonetes pugio 1.65 24–48 19.9 19.2 8
Homarus americanus 2.21 24–48 21.9 33.4 8.1
Penaeus chinensis 1.53–2.10 48–96 26 33 7.94 Chen et al. (1990 )3.88 24 25 30 8.12 Chen & Lin (1992)
MolluscsCrassostrea virginica 19.10 24–48 20 27 7.7–8.0 USEPA (1989)
Mercenaria mercenaria 5.36 24–48 20 27 7.7–8.2
Placopecten magellanicus 1.80 96 4 ns ns Abraham et al. (1996)1.00 96 10 ns ns
FishesCyprinodon variegatus 2.10 96 13 30–32.5 8.05 Miller et al. (1990)
2.80 96 25 30–32.5 7.253.51 96 32.5 30–32.5 7.75
Dicentrarchus labrax 1.70 96 17.5 34 8.15 Person et al. (1995)
Menidia beryllina 0.98 96 18 30–32.5 8 Miller et al. (1990)1.77 96 25 30–32.5 81.70 96 32.5 30–32.5 8
0.93–0.97 96 25 30–32.5 70.75 96 25 30–32.5 90.074 672 23.5–25 30–33 ns0.38 672 23.5–25 30–33 ns
Monocanthus hispidus 0.83 24–48 23.4 28 8.07 USEPA (1989)
Pseudopleuronectes amercicanus 0.49 24–48 7.5 31 8
Sciaenops ocellatus 0.55 24–48 25.5 29 8.1
Scophthalmus maximus 2.96 24–48 17.9 34.3 8.152.55 96 17.5 34 8.15 Person et al. (1995 )
Sparus aurata 1.93 24–48 27 40.5 8.1 Wajsbrot et al. 1991)2.55 96 17.5 34 8.15 Person le Ruyet et al. (1995)
Table 4. Effects of unionised ammonia (as LC50 values) on marine organisms under various environmental conditions. ns: not specified

Gray et al.: Hypoxia and organic enrichment in coastal environment 265
Species LC50 conc. Expt Source(µg l–1) duration (h)
CrustaceansAsellus militaris 1070.00 96 Mance et al. (1988)Cambarus diogenes 105.00 96
205.00 96Geometric mean 146.71
Crangonyx 840.00 96richmondensis laurenGammarus 21.00 96pseudolimnaeus 59.00 96
32.00 96Geometric mean 34.10 96
Procambarus clarki 370.00 96121.00 96271.00 96
75.00 96147.00 96
58.00 9634.00 96
Geometric mean 114.86
Baetis vagans 20.00 96 Mance et al. (1988)Ephemera simulans 316.00 96Hexagenia limbata 111.00 96Palaemonetes pugio 114.00 96
FishCoregonus 2.00 48 Fung & Bewick (1980)clupeaformis 5.00 48
2.00 723.00 725.00 723.00 96
12.00 962.00 964.00 96
12.00 96Geometric mean 4.15
Esox lucius 46.00 48 Mance et al. (1988)16.00 4847.00 4876.00 4826.00 96 Smith & Oseid (1974)37.00 9637.00 96 Mance et al. (1988)34.00 96 Smith & Oseid 197226.00 96 Mance et al. (1988)
Geometric mean 35.19
Ictalurus punctatus 1400.00 96 Mance et al.(1988)Lepomis 32.00 72 Smith & Oseid (1974)macrochirus 30.00 72
9.00 7219.00 72 Mance et al. (1988)16.00 72 Smith & Oseid (1974)44.80 96 Mance et al. (1988)
8.00 9613.10 9630.00 9628.00 4832.00 4847.80 48
Geometric mean 22.39
Micropterus 81 48 Fung & Bewick (1980)salmoides 30 48
76 4811 4865 7259 7211 7230 7259 9630 96
Table 5. Effects of hydrogen sulphide (as LC50 values) on freshwater organisms
Species LC50 conc. Expt Source(µg l–1) duration (h)
11 9663 96
Geometric mean 34.8
Oncorhynchus mykiss 26 48 Fung & Bewick (1980)12 4843 4852 4824 4825 4855 72 Smith & Oseid (1972)80 7225 72 Fung & Bewick (1980)55 72 Smith & Oseid (1970)43 72 Fung & Bewick (1980)21 7220 72 Smith & Oseid (1972)47 72 Fung & Bewick (1980)
7 7223 7212 7220 72 Smith & Oseid (1970)49 9613 9623 96 Fung & Bewick (1980)
7 9643 9647 9619 9617 96 Smith & Oseid (1974)49 9612 96 Fung & Bewick (1980)49 96 Smith & Oseid (1972)25 96 Fung & Bewick (1980)49 96 Smith & Oseid (1970)
Geometric mean 26.8
Perca flavescens 10 48 Fung & Bewick (1980)64 4831 4810 4810 7239 7215 7236 96
8 9610 96
Geometric mean 17.9
Pimephales promelas 14 96 Mance et al. (1988)26 9649 96
7 9610 9653 96
546 96Geometric mean 32.6
Salmo trutta 7.0 96 Reynolds & Haines (1980)
Salvelinus fontinalis 17 96 Mance et al. (1988)54 96 Smith & Oseid (1974)17 9622 9625 96 Mance et al. (1988)31 96 Smith & Oseid (1974)
Geometric mean 25.4
Stizostedion vitreum 7 96 Smith & Oseid (1974)52 9652 9620 9618 96 Mance et al. (1988)
Geometric mean 23.3

Mar Ecol Prog Ser 238: 249–279, 2002266
Sp
ecie
sD
O l
evel
H2S
lev
elE
xpt
En
dp
oin
t C
ond
itio
ns
pH
Sou
rce
Rem
ark
s(m
g l
–1 )
(µg
l–
1 )d
ura
tion
Con
c.E
ffec
tT
ime
(h)
(h)
An
nel
ids
Are
nic
ola
mar
ina
<0.
20
5L
OE
C
ME
T5
10°C
Ab
ele-
Oes
chg
er &
H
aem
oglo
bin
au
toox
idat
ion
in
crea
sed
O
esch
ger
(19
95)
by
165
%, m
eth
aem
oglo
bin
by
160
%;
CA
T i
n c
hlo
rag
ogen
dec
reas
ed
by
40%
, GR
in
ch
lora
gog
en b
y 50
%<
0.2
200
µM
5L
OE
C
ME
T5
10°C
Hae
mog
lob
in a
uto
xid
atio
n i
ncr
ease
d
by
165
%, m
eth
aem
oglo
bin
by
90%
,h
ydro
gen
per
oxid
e b
y 70
%. C
AT
in c
hlo
rag
ogen
dec
reas
ed b
y 70
%H
edis
te d
iver
sico
lor
1 µ
mol
–l
980
µm
ol–
l60
LT50
MO
RT
6016
°C, 1
4‰
7.8
Gam
enic
k e
t al
. (19
96)
1 µ
mol
–l
010
5LT
50M
OR
T10
516
°C, 1
4‰
7.8
Juve
nil
e1
µm
ol–
l1
mm
ol–
l72
LT50
MO
RT
72
Juve
nil
e1
µm
ol–
l0
14LT
50M
OR
T14
16°C
, 14
‰7.
8 P
ostl
arva
l st
age
1 µ
mol
–l
270
µm
ol–
l10
LT50
MO
RT
10
Pos
tlar
val
stag
eH
eter
och
aeta
cos
tata
1 µ
mol
–l
072
NO
EC
MO
RT
72
16°C
, 14
‰7.
81
µm
ol–
l1.
96 m
mol
–l
360
LT50
MO
RT
360
16°C
, 14
‰1
µm
ol–
l55
0 µ
mol
–l
54LT
50M
OR
T54
16
°C, 1
4‰
Par
anai
s li
tora
lis
1 µ
mol
–l
048
NO
EC
MO
RT
4816
°C, 1
4‰
7.8
1 µ
mol
–l
50 µ
mol
–l
7LT
50M
OR
T7
Tu
bif
icoi
des
ben
edii
0.05
200
µM
24L
OE
CM
ET
12
Du
bil
ier
et a
l. (
1997
)S
ucc
inat
e in
crea
sed
3-f
old
Hyd
rob
ia v
entr
osa
1 µ
mol
–l
016
8LT
50M
OR
T16
816
°C, 1
4‰
7.8
Gam
enic
k e
t al
. (19
96)
1 µ
mol
–l
570
µm
ol–
l75
LT50
MO
RT
75
Cru
stac
ean
sC
ypri
dei
s to
rosa
1 µ
mol
–l
066
0LT
50M
OR
T66
016
°C, 1
4‰
7.8
Gam
enic
k e
t al
. (19
96)
1 µ
mol
–l
1.8
mm
ol–
l52
8LT
50M
OR
T52
8 S
adu
ria
ento
mon
0.04
40
8L
OE
CR
EP
8 11
°C, 1
0‰
Vis
man
n &
Hag
erm
an (
1996
)N
orm
al r
esp
irat
ion
rat
e re
-est
abli
shed
afte
r 8
h r
ecov
ery
0.30
841
µM
8L
OE
CR
EP
8 11
°C, 1
0‰
Nor
mal
res
pir
atio
n r
ate
re-e
stab
lish
edaf
ter
28 h
rec
over
y0.
040
8L
OE
CM
ET
8 11
°C, 1
0‰
Met
abol
ism
red
uce
d b
y 70
%, o
xyg
en
deb
t w
as 0
.57
mg
O2
g–
1
0.30
841
µM
8L
OE
CM
ET
8 11
°C, 1
0‰
Met
abol
ism
red
uce
d b
y 38
%, o
xyg
end
ebt
was
2.7
4 m
gO
2g
–1
Cor
oph
ium
vol
uta
tor
1 µ
mol
–l
04
LT50
MO
RT
416
°C, 1
4‰
7.8
Gam
enic
k e
t al
. (19
96)
1 µ
mol
–l
90 µ
mol
–l
2N
OE
CM
OR
T2
Cra
ng
on c
ran
gon
0.04
40
2.5
LT50
MO
RT
2.5
18°C
, 30
‰H
ager
man
& V
ism
ann
(19
95)
0.45
030
LT50
MO
RT
30
0.91
0n
sn
sB
En
s18
°C, 3
0‰
On
ly v
ery
spor
adic
mov
emen
ts
occu
rred
, act
ivit
y d
ecre
ased
as
oxyg
en
dec
reas
ed0.
450
1.33
LO
EC
ME
T1.
33
18°C
, 30
‰L
acta
te i
ncr
ease
d b
y 4.
6–
7-fo
ld1.
825
µM
1.33
LO
EC
ME
T1.
33
18°C
, 30
‰L
acta
te i
ncr
ease
d b
y 16
–25-
fold
Mo
llu
scs
Arc
tica
isl
and
ica
00
240
LO
EC
ME
T24
0 9.
5 +
0.5
°C,
7.6
Oes
chg
er &
Sto
rey
(199
3)T
otal
gly
cog
en p
hos
ph
oryl
ase
in a
dd
uc-
22‰
tor
dec
reas
ed b
y 34
%, i
n f
oot
by
27%
020
0 µ
M24
0L
OE
CM
ET
240
9.5
+ 0
.5°C
,7.
6T
otal
gly
cog
en p
hos
ph
oryl
ase
in a
dd
uc-
22‰
tor
dec
reas
ed b
y 30
.3%
, in
foo
t b
y 15
.9%
Tab
le 6
. Eff
ects
of
hyd
rog
en s
ulp
hid
e on
mar
ine
org
anis
ms
un
der
var
yin
g e
nvi
ron
men
tal
con
dit
ion
s. T
erm
s as
in
Tab
le 1
; TS
: tot
al s
ulp
hid
e.

Gray et al.: Hypoxia and organic enrichment in coastal environment 267
Sp
ecie
sD
O l
evel
H2S
lev
elE
xpt
En
dp
oin
t C
ond
itio
ns
pH
Sou
rce
Rem
ark
s(m
g l
–1 )
(µg
l–
1 )d
ura
tion
Con
c.E
ffec
tT
ime
(h)
(h)
Ast
arte
bor
eali
s<
0.2
048
LO
EC
ME
T48
10°C
Ab
ele-
Oes
chg
er &
G
R i
n g
ills
in
crea
sed
by
500
%O
esch
ger
(19
95)
<0.
220
0 µ
M48
LO
EC
ME
T48
10
°CH
ydro
gen
per
oxid
e in
crea
sed
by
200
%
<0.
20
240
LO
EC
ME
T24
010
°CM
eth
aem
oglo
bin
in
crea
sed
by
260
%.
CA
T i
n g
ills
dec
reas
ed b
y 70
%<
0.2
200
µM
240
LO
EC
ME
T24
0 10
°CC
AT
in
gil
ls d
ecre
ased
by
40%
SO
D i
ncr
ease
d b
y 50
% a
nd
GR
in
crea
sed
by
860
%
Ech
ino
der
ms
Am
ph
iura
fil
ifor
mis
<0.
10
168
LT50
MO
RT
8.5
+ 1
.5°C
,16
8V
isti
sen
& V
ism
ann
(19
97)
29.5
+ 1
.4‰
0.3
034
8LT
50M
OR
T8.
5 +
1.5
°C,
348
29.5
+ 1
.4‰
0.5
078
0LT
50M
OR
T8.
5 +
1.5
°C,
780
29.5
+ 1
.4‰
0.1
–10
ns
LO
EC
BE
8.5
+ 1
.5°C
,n
sA
ll r
ose
to s
edim
ent
surf
ace,
lif
ted
29
.5 +
1.4
‰d
isc
into
th
e w
ater
col
um
n, a
nd
su
rviv
ed a
t su
rfac
e fo
r se
vera
l d
ays
<0.
10
180
LT50
MO
RT
8.5
+ 1
.5°C
,18
029
.5 +
1.4
‰<
0.1
2 µ
M12
9.6
LT50
MO
RT
8.5
+ 1
.5°C
,12
9.6
93%
cam
e to
sed
imen
t su
rfac
e w
ith
in29
.5 +
1.4
‰2
to 5
d, q
uic
kly
bec
ame
inac
tive
an
d
chan
ged
fro
m p
ale
red
to
wh
ite
<0.
120
µM
74.4
LT50
MO
RT
8.5
+ 1
.5°C
,74
.484
% c
ame
to s
edim
ent
surf
ace
wit
hin
29.5
+ 1
.4‰
2
to 5
d, q
uic
kly
bec
ame
inac
tive
and
ch
ang
ed f
rom
pal
e re
d t
o w
hit
e<
0.1
200
µM
40
.8L
OE
CB
E8.
5 +
1.5
°C,
40.8
51%
cam
e to
sed
imen
t su
rfac
e w
ith
in(T
S)
29.5
+ 1
.4‰
2 to
5 d
, qu
ick
ly b
ecam
e in
acti
vean
d c
han
ged
fro
m p
ale
red
to
wh
ite
Op
hiu
ra a
lbid
a<
0.1
060
LT50
MO
RT
8.5
+ 1
.5°C
,60
Qu
ick
ly b
ecam
e in
acti
ve
29.5
+ 1
.4‰
and
mor
ibu
nd
0.3
014
4LT
50M
OR
T8.
5 +
1.5
°C,
144
29.5
+ 1
.4‰
0.5
033
6LT
50M
OR
T8.
5 +
1.5
°C,
336
29.5
+ 1
.4‰
0.1
–10
ns
LO
EC
BE
8.5
+ 1
.5°C
,n
sIn
itia
lly
show
ed i
ncr
ease
d m
obil
ity
29.5
+ 1
.4‰
(esc
ape
resp
onse
) fo
r 2
to 4
d, t
hen
ca
me
to r
est
wit
h d
isc
rais
ed i
nto
wat
erco
lum
n<
0.1
060
LT50
MO
RT
8.5
+ 1
.5°C
,60
29.5
+ 1
.4‰
<0.
12
µM
43.2
LT50
MO
RT
8.5
+ 1
.5°C
,43
.2In
itia
lly
lift
ed d
isc
into
wat
er c
olu
mn
,29
.5 +
1.4
‰th
en b
ecam
e p
aral
ysed
<0.
120
µM
18LT
50M
OR
T8.
5 +
1.5
°C,
1829
.5 +
1.4
‰B
ecam
e p
aral
ysed
<0.
120
0 µ
M
8L
OE
CB
E8.
5 +
1.5
°C,
8B
ecam
e p
aral
ysed
(TS
)29
.5 +
1.4
‰
Tab
le 6
(co
nti
nu
ed)

Mar Ecol Prog Ser 238: 249–279, 2002
are more sensitive than burrowing species such asmudskippers. Similar trends occur within the othertaxa, with species that inhabit sediments being themost tolerant to low oxygen and high ammonia andhydrogen sulphide concentrations.
Interactions between hypoxia, ammonia and hydro-gen sulphide are poorly known. Reduced oxygen lev-els increase ammonia toxicity in the marine fish Sparusauratus and the prawn Penaeus semisulcatus (Wajs-brot et al. 1990, 1991). Ammonia toxicity to the prawnwas doubled when dissolved oxygen decreased from55 to 27% saturation (Wajsbrot et al. 1990). Thurstonet al. (1983), however, found no correlation betweenoxygen level and ammonia toxicity to fathead minnowsPimephales promelas. Hiroki (1978) demonstrated thathypoxic tolerance in 3 species of marine gastropods(Littorina ziczac, Neritina vorginea and Olivella ver-reuxii) decreased in the presence of H2S. Similarly,Kang et al. (1993) showed that H2S decreased the hy-poxic tolerance of the crab Portunus trituberculatus.The ispopod Saduria entomon is able to synthesizehaemocyanin to enhance oxygen uptake duringhypoxia (1.8 to 2.9 mgO2 l–1), but haemocyanin synthe-sis is inhibited when the isopod is exposed to hypoxiain the presence of H2S (150 µM l–1) (Hagerman & Vis-man 1993). Magaud et al. (1997) found that mortalityof the rainbow trout Oncorhynchus mykiss exposedsimultaneously to 0.5 mgNH3 l–1 un-ionized ammoniaand hypoxia (1.7 mgO2 l–1) was significantly higherthan that of trout Salmo trutta exposed to ammonia orhypoxia alone, suggesting a synergistic effect.
Yet to what extent do interactions among oxygen,hydrogen sulphide and ammonia affect the fauna?Hydrogen sulphide is readily oxidised in the presenceof oxygen. Only in sulphide-rich coastal sediments orsalt marshes overlaid by shallow water can sulphideescape to the atmosphere (Fenchel & Blackburn 1979).In marine sediments sulphate reduction is the domi-nant microbiological process, and results in ammoniaaccumulation within anoxic sediments and a con-centration gradient towards the sediment surface. Ifthe water above the sediment surface is anoxic thenammonia can be released, otherwise the ammonia israpidly oxidised. Thus it is only under extremely poorconditions with almost no oxygen that high amountsof ammonia and hydrogen sulphide occur in bottomwaters. From these considerations it is clear thathypoxia is the main contributor to faunal changes.Field studies showed that in southeastern USA allspecies tested (fishes and shrimp) could detect andavoid 1 mg l–1 oxygen (Wannamaker & Rice 2000). Thefinal extreme stages of eutrophication occur when theconcentration drops below 0.5 mg l–1 and hydrogensulphide and ammonia are released into the water. Inan interesting study of deep-sea fauna, Levin & Gage
(1998) found that depth and organic matter ratherthan oxygen concentration limited faunal richness andbiomass.
From the foregoing it is clear that the effects that areproduced are not caused by a single factor but are theinteraction of a number of different factors. It is not just‘organic enrichment’ that leads to the effects, but theinteraction of sedimenting organic matter with reducedoxygen concentrations, and the presence of hydrogensulphide and possibly ammonia.
The role of modelling
Visser & Kamp-Nielsen (1996) state that empiricalmodeling of coastal eutrophication is rare, largely dueto the fact that coastal systems have complex dynam-ics. Walsh (1988) pointed out that the major advance inplankton modeling in the 1970s was the developmentof models that took into account physical variablessuch as the spatial resolution of velocity fields andturbulence. These models produce predictions of thespatio-temporal distribution of primary production.
Walsh (1975) made an early attempt to model thephytoplankton-nutrient-oxygen system. Using a 2-layered system model he then analysed the causes ofthe 1976 anoxic event in the New York Bight (Walsh1988). As state variables the model included dissolvednitrogen (ammonium and nitrate), dissolved silicon,and dissolved and particulate organic carbon (DOCand POC) phytoplankton (nanoplankton and Ceratiumtripos) and zooplankton (copepods and chaetognaths)above and below the pycnocline. The sources of am-monium included microbial remineralization of organicnitrogen and macrobenthic regeneration of ammo-nium, waste inputs and zooplankton excretion. Ureais also important (Lomstein et al. 1989). Sources ofPOC included photosynthetic excretion and waste dis-charges. Loss terms of nitrogen included nitrificationand nutrient uptake by the 2 groups of phytoplankton.Sinks of DOC and POC included consumption by bac-terial decomposition and settling POC. The forcingfunctions were water temperature, solar radiation andphotoperiod, pycnocline depth, seasonal stratification,advection and eddy dispersion both horizontally andvertically. The model was able to produce spatial pre-dictions of oxygen concentrations, which gave reason-able approximations of the 1976 event. Walsh wasfurther able to simulate the effects of a 10-fold increasein carbon and nitrogen loading. This led to anoxiabelow the pycnocline. Further he was able to show thatan increase of 50 to 100 gC m–2 would induce ananoxia event.
Gowen et al. (1988, 1994) using a similar modellingapproach to that of Vollenweider (1968, 1976) applied
268

Gray et al.: Hypoxia and organic enrichment in coastal environment
to fjords (specifically 21 Scottish sea lochs) were able toestimate the yield of chlorophyll from nitrate. How-ever, this was not an ecosystem model. Such modelshave been developed by Tett et al. (1986), Aksnes &Lie (1990) and Ross et al. (1993, 1994). Ross et al.’smodel is discussed in some detail by Visser & Kamp-Nielsen (1996). The model showed that the key nutri-ent loading came not from riverine inputs but from theopen sea and internal cycling was relatively unimpor-tant. However, the size of the spring bloom was con-trolled entirely by grazing so that nutrients were neverlimiting for phytoplankton growth. Silvert (1994) andDoering et al. (1989) have modelled effects of organicenrichment on benthos. (See also GESAMP [1991] foran overview of general models for coastal systems.)
In reviewing the different types of models appro-priate for managing coastal eutrophication, Visser &Kamp-Nielsen (1996) stated that ‘fully interactivephysical and biological models of such coastal systemsare as yet not forthcoming’. Thus we are not at thestage where we have predictive models for coastaleutrophication. This is mainly because most marinesystems are unbounded (Visser & Kamp-Nielsen 1996)and describing the sources and cycling of nutrients andhow turbulence and mixing control production, sedi-mentation and oxygen concentrations is a majorchallenge (Mann 1982, Platt et al. 1989) and a factacknowledged by Vollenweider (1992). Visser & Kamp-Nielsen (1996) concluded by giving the sound advicethat in the development of coastal eutrophicationmodels managers should carefully define the questionsbeing posed of scientists, establish adequate monitor-ing programs, and apply risk assessments to establishmodel validation criteria a priori.
Pearson-Rosenberg (P-R) model of organicenrichment
As mentioned in the ‘Introduction’ the P-R model isone of the most cited marine papers (over 400 citationsin the Institute for Scientific Information’s list 2000).The P-R model predicts the numbers of species, thetotal abundance of all species, and the biomass of allspecies along a gradient of increasing organic enrich-ment of the sediment. Fig. 2 shows the model. Themodel suggests that the total biomass of organismsinitially inceases gradually as organic matter loadincreases above background levels, and then risessharply to a maximum. The biomass then falls, andoften shows a secondary peak near to, but lower than,that of maximal abundance. The maximum number ofspecies coincides with the biomass peak. Abundanceon the other hand rises slowly at first but then in-creases rapidly to a maximum (the ‘peak of oppor-
tunists’), before falling sharply as oxygen concentra-tion drops.
Pearson & Rosenberg (1978) pointed out that thereare considerable difficulties in comparing biomassbetween studies and between areas, and thus that thesuggested double peak needs to be studied in moredetail. In fact, due to the difficulties of defining the bio-mass of, for example, an echinoderm or a bivalve (com-pared that of a polychaete), biomass is not often mea-sured (but see Cedrwall & Elmgren 1980). Pearson &Rosenberg (1978) suggested that the secondary peakin biomass occurs when there are large amounts oforganic matter but oxygen concentrations have not yetstarted to decrease. They documented the generalityof the model by showing stylised figures (but with noquantitative axes) compiled from data from Sweden(Rosenberg 1976), Scotland (Pearson & Stanley 1979),Canada, France and Germany (Anger 1975).
Most papers that cite the model claim that their data‘agree’ with the model. But what does ‘agreement’mean? At the most extreme ends of the scale an areawith low organic matter input has fairly high speciesnumbers, low abundance and moderate biomass,whereas an area with high organic matter has low orno oxygen content in the overlying water and almostno species and low biomass and abundance. Betweenthese extremes abundance, species number and bio-mass are usually higher. Thus almost any gradient ofdisturbance will show a similar pattern, in accord withthe intermediate disturbance hypothesis (Connell &Slatyer 1977). In most cases where the P-R model iscited there are usually no tests as to whether or not thedouble peak of biomass, the slight increase in species
269
Fig. 2. The Pearson-Rosenberg model showing Species (S),Abundance (A) and Biomass (B) – SAB curves of the effects oforganic enrichment on sediment-living organisms. In theoriginal model Pearson and Rosenberg have on the ordinate apoint source of organic enrichment and a decreasing gradientfrom the source. We prefer an increasing gradient fromthe origon and so have reversed the ordinate scale to one of
increasing organic enrichment from left to right

Mar Ecol Prog Ser 238: 249–279, 2002
number with slight enrichment, and the ‘peak ofopportunists’ at late stages of enrichment occurs.
In fact there are remarkable few actual tests of themodel compared with studies claiming that their datafit the model. The P-R model is highly descriptive anddescribes the stages of change as ‘organic enrichment’increases. But what is meant by ‘organic enrichment’?How much organic input/deposition is required toelicit biological changes? Does this refer to organicenrichment in the sediment or is it the general processof organic enrichment that occurs in the water-column?Or are the effects that are observed in fact due to otherfactors such as hypoxia?
In a limited test of the P-R model, Weston (1990)examined the benthic fauna under and at distances upto 450 m from a fish farm and did not find the ‘peak ofopportunists’, predicted by the model. Heip’s (1995)review likewise questions the generality of the re-sponse of opportunist species to organic enrichmentand urges caution, as data on food quality and quantityand requirements is often lacking for most species. Ina more extensive study, Maurer et al. (1993) tested theP-R model in an open-shelf environment off the coastof California and found that the fast long-shore cur-rents from mixed and semi-diurnal tides and stormsled to high flushing rates of organic material. Thus,although input rates of organic matter were high, thecharacteristic P-R model did not hold for the benthicassemblages if dispersion was good and POM did notsettle on the bottom.
The P-R model was developed from studies in fjords(Saltkällefjord, Sweden, Loch Creran, Scotland), theFraser River Estuary, Canada, and enclosed embay-ments off Marseille and Kiel Bay (Pearson & Rosenberg1978). All these areas are characterised by limitedwater exchanges in their bottom waters and withpredominantly silt-clay sediments, typical of sedi-mentation basins. Maurer et al. (1993) concluded thatthe model accurately predicts effects only in semi-enclosed waters with reduced flushing rates and netincrease in sedimentation compared with open shelfareas. From the results presented by Maurer et al.(1993) and in the present analysis, it is obvious thathigh amounts of organic material can be produced inthe water column, but if the dispersive characteristicslead to a lack of accumulation of organic matter in thesediment, then one cannot expect effects on the sedi-ment-living fauna. Thus ‘increased organic input’ isprobably only a very indirect measure of the effectson the benthic fauna.
The analysis presented here shows that organicenrichment and hypoxia lead to a wide range ofchanges in the water column and in sediments.Increased turbidity can cause changes in depth dis-tributions of algae and lead to changes in species com-
position (Ramus et al. 1976a,b). The process of sedi-mentation itself may lead to direct effects on the ben-thos. The intermediate disturbance hypothesis predictsthat any disturbance of a system will initially lead to anincrease in the number of species. If the disturbancepersists or increases, then the species number falls.Sedimentation alone may lead to an increase, whetherthis is accompanied by an increase in organic matterloading to the sediment or not. The P-R model does notseparate disturbance from organic enrichment. Pear-son & Rosenberg (1978) suggested that there is a sec-ondary peak of increased biomass, where there arelarge amounts of organic matter but where oxygenconcentrations have not started to fall. Whether such apeak occurs or not has rarely been tested. Followingthe initial ‘disturbance effect’, if organic enrichmentproceeds then reduced oxygen concentrations (be-tween 4 and 2 mg l–1) can cause changes in tropho-dynamics, which in turn alter the species compositionand the abundance of benthic organisms. We suggestthat the main effects are caused by hypoxia in thewater column rather than effects of organic matter onthe benthos. When oxygen falls to below 0.5 mgO2 l–1
sediments often become anoxic with the redox-discon-tinuity layer near the surface. Ammonia and hydrogensulphide can be released from the sediments, andwould add to the effects of hypoxia and lead to cata-strophic effects on the fauna in the water column andsediment. Thus, the P-R model does not properly re-flect the causes of the changes observed, and thereforecannot be used as a predictive tool.
Detecting effects of hypoxia and organic enrichment
Gray’s (1992) review presents a series of steps thatindicate the progress of eutrophication. Here we com-bine data on physico-chemical variables, such as C:Nratios of POM, and oxygen concentrations, to derive ageneral scheme for coastal zone managers to evaluatethe presence of or state of eutrophication in a givenarea. In this approach we include the P-R model (Pear-son & Rosenberg 1978) for benthic assemblages, as themodel is perhaps best used in the context of assessingthe stages of eutrophication rather than as a predictivetool.
The assessment process begins with observations thatmay indicate eutrophication. These are discolouredwater, changed species composition in the phytoplank-ton (McCormick & Quinn 1975, Kimor 1992) andzooplankton (Regner 1991), bottom-living algae, sea-grasses or salt marshes covered in epiphytes (Patriquin& Knowles 1972, McRoy & Goering 1974, Valiela et al.1978, Valiela 1984), or tidal flats with large patches ofUlva, Enteromorpha or Cladophora. Discoloured water
270

Gray et al.: Hypoxia and organic enrichment in coastal environment
from algal blooms may be a perfectly natural phenom-enon so at this stage eutrophication is just 1 possiblehypothesis for the observation. Often, however, earlysigns of eutrophication are changes in fish-catchesduring bottom trawling e.g. suddenly increased catchesresulting from hypoxia in the bottom water-masses(Aneer 1985). Another often extremely sensitive sign ischanges in species composition and/or biomass of thebenthic fauna. Benthic assemblages are so sensitivebecause often up to 50 or more species of macrofauna(retained on a 1 mm pore-diameter sieve) occur per1 m2 seabed. Some of these species will respond tochanges in food supply, and/or sedimentation ratesand/or lowered oxygen concentrations. Changes in thebenthos may arise from factors other than eutrophica-tion, such as altered fishing intensity or methods, andfurther evidence is needed before eutrophication canbe confirmed. Fig. 3 shows the assessment scheme.
Following the detection of unusual events the oxy-gen content of the bottom water should be investi-gated. If this is above 4 mg l–1, it is unlikely thateutrophication effects will be observed in the area.Further monitoring is recommended to ensure that theconcentration remains above 4. If it falls below 4 thenassessment of the degree of eutrophication and itsspatial extent should be made. Here 2 strategies arerecommended, a rapid assessment or a more detailedstudy, with the use of multivariate statistics (see below).The rapid assessment builds on the P-R model andits modification using Sediment Profiling Imaging (SPI)cameras (Rhoads & Germano 1982, 1986, Rumohr &Schomann 1992, Nilsson & Rosenberg 2000).
Pearson & Rosenberg (1998) suggested 4 major stagesof change in response to organic enrichment of thebenthos: normal, transitory, polluted and grossly pol-luted, along a gradient of organic enrichment (or, aswe have argued, more probably a gradient of hypoxia).In reality there is a smooth transition from one stage tothe next and classification into 4 stages is simply aconvenient abstraction of the data. These stages can beused to assess the state of eutrophication in benthicsystems, and are based on the species compositiondetermined from grab samples and species identifica-tions: (1) Normal: characterised by the presence oflarge, deep-burrowing species such as decapods andechinoids, with a deep redox-potential discontinu-ity (RPD) layer. (2) Transitory: characterised by thepresence of smaller organisms usually deposit-feedingbivalves, which replace the large deep-burrowing spe-cies. The RPD level is shallower than in (1). (3) Pol-luted: characterised by a very shallow RPD layer anddominance of small tube-building polychaetes; indi-cates severe eutrophication. (4) Grossly Polluted: char-acterised by sulphide patches at the sediment surfaceand no macrofauna, only nematodes survive. It should
be noted that the latter are marked changes, so in theRPD layer values in the range of –100 to –150 mV indi-cate long term, heavy organic pollution (Pearson &Stanley 1979).
Nilsson & Rosenberg (2000) have recently quantified4 stages in a ‘Benthic Habitat Quality (BHQ) index’classifying the normal conditions as Stage 3, transitoryas Stage 2, polluted as Stage 1 and grossly polluted asStage 0. They used a series of observations made withan SPI camera system. From our experience, it is quitepossible to make similar observations using transpar-ent core samples of the sediment. The scheme in ourFig. 3 is based on Nilsson & Rosenberg’s BHQ index,but we have not calculated the index, as its utility hasnot been tested in many areas. In both a rapid and afull assessment, it is important that samples are takenover a large area including undisturbed control sedi-ments and their assemblages. A pilot study is recom-mended to give a rough overview, followed by moredetailed sampling to assess the extent and degree ofeutrophication, if any.
We believe that a full assessment is preferable,rather than classification into subjective classes (eventhe P-R model shows a continuum of change). In a full-assessment approach samples should be taken with agrab or multicorer covering the area where eutrophi-cation is suspected. Data should be collected on bothfauna and sediment properties (grain size variables,redox measurements, C:N at 1 cm intervals down to10 cm, observations on tubes and tube size). Multivari-ate statistical methods should then be applied to bothfauna and sediments separately, since such methodshave been shown to be highly sensitive (Gray et al.1990). The PRIMER package (Clarke & Warwick 1994)and the CANOCO package (ter Braak 1987) have beenwidely used with data from such surveys and bothhave the advantage over other methods that they canrelate sediment properties to fauna. Both these pack-ages are able to integrate the physico-chemical mea-surements with the biological measurements to pro-vide a correlative explanation for possible causes ofchanges observed in the funa. Multivariate techniqueshave been shown to be highly sensitive in detectingthe changes in species composition that are the earliestsigns of eutrophication (Gray et al. 1990).
The emphasis here is on the detection of the earli-est signs of eutrophication so that action may betaken to mitigate more severe effects. One reviewerof this paper suggested that ‘as unpolluted controlcoasts are rarely available nearby, the only way is toanalyse long-term or historical data sets’. We rejectthis suggestion on 2 accounts. Firstly, the schemedoes not rely on there being pristine conditions, asfew coastal environments anywhere in the world cantoday be called prisitine. It is based on observations
271

Mar Ecol Prog Ser 238: 249–279, 2002272
Fig. 3. Assessment scheme for suspected eutrophication

Gray et al.: Hypoxia and organic enrichment in coastal environment
of changes occurring along gradients in systems thatare being monitored. In areas with natural periodicanoxia, managers may be interested in monitoringthe development of anoxia and the extent of theeffects, and the proposed scheme will provide a basisfor monitoring of areas covered by such effects. Sec-ondly, analyzing historical data is fraught with theenormous problem of detecting the eutrophicationsignal from the noise of natural change. It is now wellknown that marine systems respond to large-scaleoceanographic signals such as the North AtlanticOscillation or ENSO, whose time span varies overmany years if not decades. Testing for effects againstsuch signals is not cost-effective, as it may take a de-cade to detect that an unwanted effect has occurred.It is far better, and statistically more sound, to moni-tor multiple sites along a gradient (or gradients) of asuspected effect.
Should eutrophication be diagnosed, then the man-agers of the coastal zone are faced with problems ofremedial action. This will involve analysis of historicaldata for the area, preparations of mass balance bud-gets for nitrogen and phosphorus, analyses of climaticconditions over the period of the event, assessment ofhydrographic conditions, and development of realisticdynamical models that take into account the key phys-ical, chemical and biological processes covered in thisreview. Cloern (2001) discussed these aspects in somedetail. From such analyses it should be possible todevise cost-effective treatments to mitigate and hope-fully remediate the system. In this context managers ofcoastal zones should read Richardson’s (1996) analysesof the time perspective over which remedial action islikely to have an effect. For the Kattegat, a statisticallysignificant detectable improvement in oxygen condi-tions, given the variability present in the system, willtake 18 yr. Eutrophication is a problem of globalsignificance which, once it has occurred, is extremelydifficult to reverse.
LITERATURE CITED
Abele-Oeschger D, Oeschger R (1995) Hypoxia-inducedautoxidation of haemoglobin in the benthic invertebratesArenicola marina (Polychaeta) and Astarte borealis(Bivalvia) and the possible effects of sulphide. J Exp MarBiol Ecol 187:63–80
Abraham A, Couturier C, Parsons JA (1996) Toxicity of un-ionized ammonia to juvenile giant scallops, Placopectenmagellanicus. Bull Aquac Assoc Can 96-103:68–70
Aksnes DL, Lie U (1990) A coupled physical biological pelagicmodel of a shallow sill fjord. Estuar Coast Shelf Sci 31:459–486
Anderson SJ, Taylor AC, Atkinson RJA (1994) Anaerobicmetabolism during anoxia in the burrowing shrimp Calo-caris macandreae Bell (Crustacea: Thalassinidea). CompBiochem Physiol Part A 108:515–522
Andersson L, Rydberg L (1988) Trends in nutrient and oxygenconditions within the Kattegat: effects of local nutrientsupply. Estuar Coast Shelf Sci 26:559–579
Aneer G (1985) Some speculations about the Baltic herring(Clupea harengus membras) in connection with theeutrophication of the Baltic Sea. Can J Fish Aquat Sci 42(Suppl 1):83–90
Anger K (1975) On the influence of sewage pollution oninshore benthic communities in the South of Kiel Bay.Helgol Wiss Meeresunters 27:408–438
Ansell AD (1974) Sedimentation of organic detritus in LochEtive and Creran, Argyll, Scotland. Mar Biol 27:263–273
Arndt C, Schiedek D, Felbeck H (1998) Metabolic responsesof the hydrothermal vent tube worm Riftia pachyptila tosevere hypoxia. Mar Ecol Prog Ser 174:151–158
Aubert M (1990) Mediators of microbiological origin andeutrophication phenomena. Mar Pollut Bull 21:24–29
Baden SP, Loo LO, Pihl L, Rosenberg R (1990) Effects ofeutrophication on benthic communities including fish:Swedish west coast. Ambio 19:113–122
Baker MS, Mann R, (1992) Effects of hypoxia and anoxia onlarval settlement, juvenile growth and juvenile survival ofthe oyster Crassostrea virginica. Biol Bull 182:256–269
Baker MS, Mann R (1994) Description of metamorphic phasesin the oyster Crassostrea virginica and effects of hypoxiaon metamorphosis. Mar Ecol Prog Ser 104:91–99
Bennekom AJ van, Gieskes WWC, Tijssen SB (1975) Eutroph-ication of Dutch coastal waters. Proc R Soc Lond Ser B BiolSci 189:359–437
Beukema JJ, Cadée GC (1986) Zoobenthos responses toeutrophication of the Dutch Wadden Sea. Ophelia 26:55–64
Borum J (1996) Shallow waters and land/sea boundaries. In:Jørgensen BB, Richardson K (eds) Eutrophication in coastalmarine ecosystems. American Geophysical Union, Wash-ington, DC, p 179–203
Borum J, Sand-Jensen K (1996) Is total primary production inshallow coastal marine waters stimulated by nitrogenloading? Oikos 76:406–410
Breitburg DL, Steinburg N, DuBeau S, Cooksey C, Houde ED(1994) Effects of low dissolved oxygen on predation onestuarine fish larvae. Mar Ecol Prog Ser 104:235–246
Cadée GC (1984) Has input of organic matter into the westernpart of the Dutch Wadden Sea increased during the lastdecades. Neth Inst Sea Res Publ 10:71–82
Cadée GC, Hegeman J (1974) Primary production of phyto-plankton in the Dutch Wadden Sea. Neth J Sea Res 8:240–259
Carpenter EJ, Capone DG (eds) (1983) Nitrogen in the marineenvironment. Academic Press, New York
Chabot D, Dutil J (1999) Reduced growth of Atlantic cod innon-lethal hypoxic conditions. J Fish Biol 55:472–491
Chapman ARO, Craigie JS (1977) Seasonal growth in Laminarialongicruris: relations with dissolved inorganic nutrients andinternal reserves of nitrogen. Mar Biol 40:197–205
Chen JC, Lin JN (1992) Effects of ammonia on growthPenaeus penicillatus juveniles. Comp Biochem PhysiolPart C 101:443–447
Chen JC, Ting YY, Lin JN, Lin MN (1990) Lethal effects ofammonia and nitrate on Penaeus chinensis juveniles. MarBiol 107:427–431
Chew SF, Ip YK (1992a) Biochemical adaptations of the mud-skipper Boleophthalmus boddaerti to a lack of oxygen.Mar Biol 112:567–571
Chew SF, Ip YK (1992b) Tolerance of the mudskipper,Boleophthalmus boddaerti, to a lack of oxygen. Zool Sci9:227–230
273

Mar Ecol Prog Ser 238: 249–279, 2002
Chew SF, Lim ALL, Low WP, Lee CGL, Chan KM, Ip YK(1990) Can the mudskipper, Periophthalmus chrysospilos,tolerate acute environmental hypoxic exposure? FishPhysiol Biochem 8:221–227
Christensen H, Kanneworff E (1985) Sedimenting phyto-plankton as major food source for suspension and depositfeeders in the Øresund. Ophelia 24:223–244
Clarke KR, Warwick RM (1994) Change in marine communi-ties: an approach to statistical analyses and interpretation.Plymouth Marine Laboratory, Plymouth
Cloern JE (1982) Does the benthos control phytoplanktonbiomass in South San Francisco Bay? Mar Ecol Prog Ser9:191–202
Cloern JE (2001) Our evolving conceptual model of thecoastal eutrophication problem. Mar Ecol Prog Ser 210:223–253
Connell JH, Slatyer RA (1977) Mechanisms of succession innatural communities and their role in community stabilityand organisation. Am Nat 111:119–144
Cooper SR, Brush GS (1991) Long-term history of ChespeakeBay anoxia. Science 254:992–996
Cuomo MC (1985) Sulphide as a larval settlement cue forCapitella sp. I. Biogeochemistry 1:169–181
Dagg MJ, Turner JT (1982) The impact of copepod grazing onthe phytoplankton of George’s Bank and the New YorkBight. Can J Fish Aquat Sci 39:979–990
Dalla Via J, Van den Thillart G, Cattani O, Zwaan A de (1994)Influence of long-tem hypoxia exposure on the energymetabolism of Solea solea. II. Intermediary metabolism inblood, liver and muscle. Mar Ecol Prog Ser 111:17–27
Dalla Via J, Van den Thillart G, Cattani O, Cortesi P (1997)Environmental versus functional hypoxia/anoxia in soleSolea solea: the lactate paradox revisited. Mar Ecol ProgSer 154:79–90
Das T, Stickle WB (1993) Sensitivity of crabs Callinectessapidus and C. similis and the gastropod Stramonitahaemostoma to hypoxia and anoxia. Mar Ecol Prog Ser98:263–274
Das T, Stickle WB (1994) Detection and avoidance of hypoxicwater by juvenile Callinectes sapidus and C. similis. MarBiol 120:593–560
Degobbis D, Smodlaka L, Pojed L, Skrivanic L, Precali R(1979) Increased eutrophication of the northern AdriaticSea. Mar Pollut Bull 10:298–301
de Zwaan A, Cortesi P, van den Thillart G, Brooks S and 5 oth-ers (1992) Energy metaobolism of bivalves at reduced oxy-gen tensions. In: Vollenweider RA, Marchetti R, Viviani R(eds) Marine coastal eutrophication. Elsevier Science,Amsterdam, p 1029–1039
Diaz RJ, Rosenberg R (1995) Marine benthic hypoxia: a reviewof its ecological effects and the behavioural responses ofbenthic macrofauna. Oceanogr Mar Biol Annu Rev 33:245–303
Doering PH, Oviatt CA, Beatty LL, Banzon VF, Rice R, KellySP, Sullivan BK, Frithsen JB (1989) Structure and functionin a model coastal ecosystem; silicon, the benthos andeutrophication. Mar Ecol Prog Ser 52:287–299
Dries RR, Theede H (1974) Sauerstoffmangelresistenz marinerBodenvertebraten aus der westlichen Ostsee. Mar Biol25:327–333
Dubilier N, Windoffer R, Grieshaber MK, Giere O (1997)Ultrastructure and anaerobic metabolism of mitochrondriain the marine oligochaete Tubificoides benedii: effects ofhypoxia and sulfide. Mar Biol 127:637–645
Dugdale RC, Goering JJ (1967) Uptake of new and regener-ated forms of nitrogen in primary productivity. LimnolOceanogr 12:196–206
Dyer MF, Pope JG, Fry PD, Law RJ, Portmann JE (1983)Changes in fish and benthos catches off the Danish coastin September 1981. J Mar Biol Assoc UK 63:767–775
Dymond J, Fischer K, Clauson M, Cobler R, Gardner W,Richardson MJ, Berger W, Soutar A, Dunbar R (1981)A sediment trap inter-comparison study in the Santa Bar-bara Basin. Earth Planet Sci Lett 53:409–418
Eriksson SP, Baden SP (1997) Behaviour and tolerance tohypoxia in juvenile Norway lobster (Nephrops norvegi-cus) of different ages. Mar Biol 128:49–54
Eriksson SP, Weeks JM (1994) Effects of copper and hypoxiaon two populations of the benthic amphipod Corophiumvolutator (Pallas). Aquat Toxicol 29:73–81
Eriksson SP, Baden SP, Baden S, Pihl L, Stromberg JO, SvaneI, Rosenberg R, Tiselius P (1998) Manganese in the hae-molymph and tissues of the Norway lobster, Nephropsnorvegicus (L.), along the Swedish west coast, 1993–1995.Hydrobiol 375/376:255–264
Falkowski PG, Hopkins TS, Walsh JJ (1980) An analysis offactors affecting oxygen depletion in the New York Bight.J Mar Res 38:479–506
Fenchel T, Blackburn TH (1979) Bacteria and mineral cycling.Academic Press, London
Fischer P, Rademacher K, Kils U (1992) In situ investigationson the respiration and behaviour of the eelpout Zoarcesviviparus under short-term hypoxia. Mar Ecol Prog Ser 88:181–184
Forbes TL, Lopez GR (1990) The effect of food concentration,body size, and environmental oxygen tension on thegrowth of the deposit-feeding polychaete, Capitella spe-cies 1. Limnol Oceanogr 35:1535–1544
Fung K, Bewick PH (1980) Short-term toxicity of aqueoushydrogen sulfide to representative fish species of LakeHuron. In: Eaton JG, Parrish PR Hendricks AC (eds).Aquatic Toxicology and Hazard Assessment. STP 707.ASTM, Philadelphia, PA, p 377–396
Gamenick I, Jahn A, Vopel K, Giere O (1996) Hypoxia andsulphide as structuring factor in a macrozoobenthic com-munity on the Baltic Sea shore: Colonisation studies andtolerance experiments. Mar Ecol Prog Ser 144:73–85
GESAMP(IMO/FAO/UNESCO/WMO/IAEA/UN/UNEP) JointGroup of Experts on the Scientific Aspects of Marine envi-ronmental Protection (1990) The state of the marine envi-ronment. United Nations Environment Programme. UNEPRegional Seas Rep Stud 115:1–111
GESAMP (1991) Coastal modelling. GESAMP Rep Stud 43:1–192
GESAMP (2001) A sea of troubles. GESAMP Rep Stud 70:1–35
Gowen RJ, Bradbury N (1987) The ecological impacts ofsalmonid farming in coastal waters: a review. OceanogrMar Biol Annu Rev 24:563–575
Gowen RJ, Brown JR, Bradbury NB, McClusky DS (1988)Investigations into benthic enrichment, hypernutrificationand eutrophication associated with mariculture in Scottishcoastal waters (1984–1988). Report to the Highlands andIslands Development Board, Crown Estate Commission-ers, Nature Conservancy Council, Countryside Commis-sion for Scotland, Scottish Salmon Growers Association,Perth 1– 289
Gowen RJ, Smyth D, Silvert W (1994) Modelling the spatialdistribution and loading of organic fish farm waste to theseabed. Can Tech Rep Fish Aquat Sci:19–30
Graf G, Bengtsson W, Diesner W, Schulz R, Theede H (1982)Benthic response to sedimentation of a spring phytoplank-ton bloom: process and budget. Mar Biol 67:201–208
Graneli E, Wallström K, Larsson U, Graneli W, Elmgren R
274
Gray et al.: Hypoxia and organic enrichment in coastal environment
(1990) Nutrient limitation of primary production in theBaltic Sea area. Ambio 19:142–151
Gray JS (1982) Pollution effects on marine ecosystems. Neth JSea Res 16:424–443
Gray JS (1992) Eutrophication in the sea. In: Columbo G, FerrariI, Ceccherelli VU, Rossi R (eds) Marine eutrophication andpopulation dynamics. Olsen & Olsen, Fredensborg, p 3–15
Gray JS, Clarke KR, Warwick RM, Hobbs G (1990) Detectionof initial effects of pollution on marine benthos: an exam-ple from the Ekofisk and Eldfisk oilfields, North Sea. MarEcol Prog Ser 66:285–299
Grebmeier JM, McRoy CP (1989) Pelagic-benthic coupling onthe shelf of the northern Bering and Chukchi Seas. 3. Ben-thic food-supply and carbon cycling. Mar Ecol Prog Ser53:79–91
Grebmeier JM, McRoy CP, Feder HM (1988) Pelagic-benthiccoupling on the shelf of the northern Bering and ChukchiSeas. I. Food supply source and benthic biomass. Mar EcolProg Ser 48:57–67
Grebmeier JM, Feder HM, McRoy CP (1989) Pelagic-benthiccoupling on the shelf of the northern Bering and ChukchiSeas 2. Benthic community structure. Mar Ecol Prog Ser51:253–268
Hagerman L, Vismann B (1995) Anaerobic metabolism in theshrimp Crangon crangon exposed to hypoxia, anoxia andhydrogen sulfide. Mar Biol 123:235–240
Hagström O, Palmén LE, Håkansson N, Kästner D, Bremer-Robart H, Grygiel W, Wyszynski M (1989) Acoustic esti-mates of the herring and sprat stocks in the Baltic properOctober 1988. ICES CM J:1989/J p 26
Handy RD, Poxton MG (1993) Nitrogen pollution in maricul-ture: toxicity and excretion of nitrogenous compounds bymarine fish. Rev Fish Biol Fish 3:205–241
Hansson S, Rudstam LG (1990) Eutrophication and Baltic fishcommunities. Ambio 19:123–125
Hargrave BT (1994) A benthic enrichment index. Can TechRep Fish Aquat Sci 1949:79–91
Hargrave BT, Taguchi S (1978) Origin of deposited materialsedimented in a marine bay. J Fish Res Board Can 35:1604–1613
Harper DE, McKinney LD, Nance JM, Salzer RB (1991)Recovery responses of two benthic assemblages followingan acute hypoxic event on the Texas continental shelf,northwestern Gulf of Mexico. In: Tyson RV, Pearson TH(eds) Modern and ancient continental shelf anoxia. GeolSoc Lond Spec Publ 58:49–64
Heip C (1995) Eutrophication and zoobenthos dynamics.Ophelia 41:113–136
Henriksson R (1969) Influence of pollution on the bottomfauna of the Sound (Öresund). Oikos 20:507–523
Hevia M, Rosenthal H, Gowen RJ (1996) Modelling benthicdeposition under fish cages. J Appl Ichthyol 12:71–74
Hildén M, Hudd R, Lehtonen H (1982) The effects of environ-mental changes on the fisheries and fish stocks in theArchipelago Sea and the Finnish part of the Gulf of Both-nia. Aqua Fenn 12:47–58
Hill AD, Taylor AC, Strang RHC (1991) Physiological andmetabolic responses of the shore crab Carcinus maenas(L.) during environmental anoxia and subsequent recov-ery. J Exp Mar Biol Ecol 150:31–50
Hillebrand H, Sommer U (1999) The nutrient stoichiometryof benthic microalgal growth: Redfield proportions areoptimal. Limnol Oceanogr 44:440–446
Hiroki K (1978) Resistance of marine gastropods to oxygendeficiency and hydrogen sulphide. Biol Fisio Anim SaoPaulo 2:33–42
Howell P, Simpson D (1994) Abundance of marine resources
in relation to dissolved oxygen in Long Island Sound.Estuaries 17:394–402
Ip YK, Low WP (1990) Rapid communication. Lactate produc-tion in the gills of the mudskipper Periophthalmondonschlosseri exposed to hypoxia. J Exp Zool 253:99–101
Ip YK, Chew SF, Peng KW, Lim RWL (1992) Effects of envi-ronmental anoxia on concentrations of free amino acidsand kinetic properties of glutamate dehydrogenase inthree body parts of Phascolosoma arcuatum (Sipuncula).J Exp Mar Biol Ecol 165:125–132
Ip YK, Chew SF, Lee CY, Wong WP, Lim DH, Murphy DH(1993) Effects of anoxia on the activities of pyruvate kinaseand phosphoenolpyruvate carboxykinase, and the pro-duction of lactate and succinate in the intertidal pul-monate Onchidium tumidium. Mar Biol 116:103–107
Ip YK, Chew SF, Randall DJ (2001) Ammonia toxicity, toler-ance and excretion. In: Hoar WS, Randall DJ, Farrell AP(eds) Fish Physiol 20:109–148
Ishimatsu A, Aguilar NM, Ogawa J, Kougi A (1999) Arterialblood gas levels and cardiovascular function during vary-ing environmental conditions in a mudskipper, Perioph-thalmodon schlosseri. J Exp Biol 202:1753–1762
Jobling M (1993) Bioenergetics: feed intake and energy parti-tioning. In: Rankin JC, Jensen FB (eds) Fish ecophysio-logy. Chapman and Hall, London
Johansson B (1997) Behavioural response to gradually de-clining oxygen concentration by Baltic Sea macrobenthiccrustaceans. Mar Biol 129:71–78
Jørgensen BB (1980) Seasonal oxygen depletion in the bottomwaters of a Danish fjord and its effect on the benthic com-munities. Oikos 34:68–76
Jørgensen BB, Richardson K (eds) (1996) Eutrophication incoastal marine ecosystems. American Geophysical Union,Washington, DC
Josefson AB (1987) Large-scale patterns of dynamics in sub-tidal macrozoobenthic assemblages in the Skagerrak:effects of a production-related factor? Mar Ecol Prog Ser38:13–23
Josefson AB, Jensen JN (1992) Effects of hypoxia on soft-sediment macrobenthos in southern Kattegat. In: ColumboG, Ferrari I, Ceccherelli VU, Rossi R (eds) Marine eutroph-ication and population dynamics. Olsen & Olsen, Fredens-borg, p 21–28
Josefson AB, Widbom B (1998) Differential response of ben-thic macrofauna and meiofauna to hypoxia in the GullmarFjord basin. Mar Biol 100:31–40
Justic D (1987) Long-term eutrophication of the northernAdriatic Sea. Mar Pollut Bull 18:281–284
Justic D (1988) Trend in the transparency of the northernAdriatic Sea 1911–1982. Mar Pollut Bull 19:32–35
Justic D, Legovic T, Rottini-Sandrini L (1987) Trends in oxy-gen content 1911-1984 and occurrence of benthic mor-tality in the Northern Adriatic Sea. Estuar Coast Shelf Sci25:435–445
Kang J, Matsuda O, Yamamoto T (1993) Effects of low dis-solved oxygen and hydrogen sulfide on ealrly develop-mental stages of blue crab, Portuns trituberculatus inHiroshima Bay, Japan. J Fac Appl Biol Sci HiroshimaUniv 32:61–70
Kautsky N, Kautsky H, Kautsky U, Waren M (1986) De-creased depth penetration of Fucus vesiculosus (L.) sincethe 1940s indicates eutrophication of the Baltic Sea. MarEcol Prog Ser 28:1–8
Keckeis H, Bauer-Nemeschkal E, Kamler E (1996). Effects ofreduced oxygen level on the mortality and hatching rate ofChondrostoma nasua embryos. J Fish Biol 49:430–440
Kim HS, Kim HY, Chin P (1997) Effects of ammonia on sur-
275

Mar Ecol Prog Ser 238: 249–279, 2002
vival and growth of the flounder larva, Paralichthys oli-vaceus. J Korean Fish Soc 30:488–495
Kimor B (1992) Impact of eutrophication on phytoplanktoncomposition. In: Vollenweider RA, Marchetti R, Viviani R(eds) Marine coastal eutrophication: the response ofmarine transitional systems to human impact: problemsand perspectives for restoration. Proc Int Conf, Bologna,Italy, 21–24 March 1990. Sci Tot Env Suppl 1992:871–878
Kiørboe T, Hansen JLS, Alldredge AL (1996) Sedimentation ofphytoplankton during a diatom bloom: rates and mecha-nisms. J Mar Res 54:1123–1148
Knauer GA, Martin JA, Bruland KW (1979) Fluxes of particu-late carbon, nitrogen and phosphorus in the upper watercolumn of the northeast Pacific. Deep-Sea Res 26:97–108
Kuo AY, Nielson BJ (1987) Hypoxia and salinity in Virginiaestuaries. Estuaries 10:277–283
Larsson U, Elmgren R, Wulff F (1985) Eutrophication in theBaltic Sea: causes and consequences. Ambio 14:9–14
Levin LA, Gage JD (1998) Relationships between oxygen,organic matter and the diversity of bathyal macrofauna.Deep-Sea Res Part II 45:129–163
Lim RWL, Ip YK (1991a) Alternation of kinetic properties ofpyruvate kinase in Phascolosoma arcuatum (Sipuncula)exposed to environmental anoxia. J Exp Mar Biol Ecol 152:123–133
Lim RWL, Ip YK (1991b) The involvement of phosphoenol-pyruvate carboxykinase in succinate formation in Phas-colosoma arcuatum (Sipuncula) exposed to environmentalanoxia. Zool Sci 8:673–679
Lin HP, Charmantier G, Thuet P, Trilles JP (1992) Effectsof turbidity on survival, osmoregulation and gill Na+-K+
ATPase in juvenile shrimp Penaeus japonicus. Mar EcolProg Ser 90:31–37
Lin HP, Thuet P, Trilles JP, Mounet Guillaume R, CharmantierG (1993) Effects of ammonia on survival and osmoregula-tion of various development stages of the shrimp Penaeusjaponicus. Mar Biol 117:591–598
Llansó RJ (1991) Tolerance of low dissolved oxygen andhydrogen sulfide by the polychaete Streblospio benedicti(Webster). J Exp Mar Biol Ecol 153:165–178
Llansó RJ, Diaz RJ (1994) Tolerance to low dissolved oxygenby the tubicolous polychaete Loimia Medusa. J Mar BiolAssoc UK 74:143–148
Lomstein BA, Blackburn TH, Henriksen K (1989) Aspects ofnitrogen and carbon cycling in the northern Bering Shelf.Sediment: 1. The significance of urea turnover in the min-eralization NH4
+. Mar Ecol Prog Ser 57:237–247Low WP, Peng KW, Phuan SK, Lee CY, Ip YK (1993) A com-
parative study on the responses of the gills of two mud-skippers to hypoxia and anoxia. J Comp Physiol B 163:487–494
Magaud H, Migeon B, Morfin P, Garric J, Vindimian E (1997)Modeling fish mortality due to urban storm run-off: inter-acting effects of hypoxia and un-ionized ammonia. WaterRes 31:211–218
Main MB, Nelson WG (1988) Tolerance of the sabellariidpolychaete Phtagmatopoma lapidosa Kinberg to burialturbidity and hydrogen sulfide. Mar Env Res 26:39–55
Mance G, O’Donnell AR, Campbell JA (1988) Proposed envi-ronmental quality standards for List 11 substances inwater: sulphide. Environmental Strategy Standards andLegislation Unit 8. Standing Committee on Analysis,Sulphide in waters and effluents. Water Research Centre,Medmenham, UK. Her Majesty’s Stationery Office,London
Mann K (1982) Ecology of coastal waters. A systems approach.Stud Ecol 8:1–322
Marcus NH, Lutz RV (1994) Effects of anoxia on the viabilityof subitaneous eggs of planktonic copepods. Mar Biol 121:83–87
Marshall DJ Mcquaid CD (1993) Differential physiologicaland behavioural responses of the intertidal mussels,Choromytilus meridionalis (Kr.) and Perna perna L., toexposure to hypoxia and air: a basis for spatial separation.J Exp Mar Biol Ecol 171:225–237
Matthäus W (1998) On the causes of major Baltic inflows-ananalysis of long time series. Cont Shelf Res 18:67–97
Matthäus W (1999) The influence of river runoff on deepwater conditions of the Baltic Sea. Hydrobiologia 393:1–10
Maurer D, Robertson J, Gerlinger T (1993) San Pedro ShelfCalifornia: testing the Pearson-Rosenberg model (PRM)Mar Environ Res 35:304–321
May EB (1973) Extensive oxygen depletion in Mobile Bay,Alabama. Limnol Oceanogr 18:353–366
McCormick JM, Quinn PT (1975) Phytoplankton diversityand chlorophyll-a in a polluted estuary. Mar Pollut Bull 6:105–106
McRoy CP, Goering JJ (1974) Nutrient transfer between theseagrass Zostera marina and its epiphytes. Nature 248:173–174
Mee LD (1992) The Black Sea in crisis: a need for concertedinternational action. Ambio 21:278–286
Miller DC, Poucher S, Cardin JA, Hansen D (1990) The acuteand chronic toxicity of ammonia to marine fish and amysid. Arch Env Contam Toxicol 10:40–48
Miller DC, Poucher SL, Coiro L, Rego S, Munns W (1995)Effects of hypoxia on growth and survival of crustaceansand fishes of Long Island Sound. In: McElroy A, Zeidner J(eds) Proceedings of the Long Island Sound Research Con-ference: is the Sound getting better or worse. New YorkSea Grant Institute, Stony Brook, NY, p 1–92
Mirza FB, Gray JS (1978) The fauna of benthic sedimentsfrom the organically enriched Oslofjord, Norway. J ExpMar Biol Ecol 54:181–207
Nan JC, Chen FH (1991) Lethal effect of nitrite on Metape-naeus ensis larvae. J World Aquac Soc 22:51–56
Nehring D (1979) Relationships between salinity and increas-ing nutrient concentration in the mixed winter surfacelayer of the Baltic from 1969 to 1978. ICES CM/C 24:1–8
Nestlerode JA, Diaz RJ (1998) Effects of periodic environmen-tal hypoxia on predation of a tethered polychaete Glyceraamericana: implications for trophic dynamics. Mar EcolProg Ser 172:185–195
Nielsen A, Hagerman L (1998) Effects of short-term hypoxiaon metabolism and haemocyanin oxygen transport in theprawns Palaemon adspersus and Palaemonetes varians.Mar Ecol Prog Ser 167:177–183
Niermann U, Bauerfeind E, Hickel W, von Westernhagen H(1990) The recovery of benthos following the impact oflow oxygen content in the German Bight. Neth J Sea Res25:215–226
Nilsson HC (1999) Effects of hypoxia and organic enrichmenton growth of the brittle stars Amphiura filiformis (O. F.Mueller) and Amphiura chiajei Forbes. J Exp Mar BiolEcol 237:11–30
Nilsson HC, Rosenberg R (1994) Hypoxic response of two marinebenthic communities. Mar Ecol Prog Ser 115: 209–217
Nilsson HC, Rosenberg R (2000) Succession in marine benthichabitats and fauna in response to oxygen deficiency:analysed by sediment profile-imaging and by grab sam-ples. Mar Ecol Prog Ser 197:139–149
Nilsson HC, Skold M (1996) Arm regeneration and spawningin the brittle star Amphira filiformis (O. F. Muller) duringhypoxia. J Exp Mar Biol Ecol 199:193–206
276

Gray et al.: Hypoxia and organic enrichment in coastal environment
Nixon SW (1990) Marine eutrophication: a growing interna-tional problem. Ambio 19:101
Nixon SW (1995) Coastal marine eutrophication: a definition,social causes, and future concerns. Ophelia 41:199–220
Nixon SW, Pilson MEQ (1983) Nitrogen in estuarine andcoastal marine ecosystems. In: Carpenter EJ, Capone DG(eds) Nitrogen in the Marine Environment. AcademicPress, New York, p 565–648
Oeschger R, Storey KB (1993) Impact of anoxia and hydrogensulphide on the metabolism of Arctica islandica L.(Bivalvia). J Exp Mar Biol Ecol 170:213–226
Otsuki A, Hanya T (1972) Production of dissolved organicmatter from dead green algal cells. II. Anaerobic microbialdecomposition. Limnol Oceanogr 17:248–257
Oviatt CA, Keller A, Sampou P, Laffin-Beatty L (1986) Pat-terns of productivity during eutrophication: a mesocosmexperiment. Mar Ecol Prog Ser 28:69–80
Oviatt CA, Quinn JG, Maughan JT and 6 others (1987) Fateand effects of sewage sludge in the coastal marine envi-ronment: a mesocosm experiment. Mar Ecol Prog Ser 41:187–203
Oviatt CA, Lane P, French F III, Donaghay P (1989) Phyto-plankton species and abundance in response to eutroph-ication in coastal marine mesocosms. J Plankton Res 11:1223–1244
Paasche E, Erga SR (1988) Phosphorus and nitrogen limitationof phytoplankton in the inner Oslofjord (Norway). Sarsia73:229–243
Patriquin DG, Knowles R (1972) Nitrogen fixation in the rhizo-sphere of marine angiosperms. Mar Biol 16:49–58
Pearson TH (1982) The Loch Eil project: assessment and syn-thesis with a discussion of certain biological questionsarising from a study of the organic pollution of sediments.J Exp Mar Biol 57:93–124
Pearson TH, Rosenberg R (1978) Macrobenthic succession inrelation to organic enrichment and pollution of the marineenvironment. Oceanogr Mar Biol Annu Rev 16:229–311
Pearson TH, Stanley SO (1979) Comparative measurementof the redox potential of marine sediment as a rapid meansof assessing the effects of organic pollution. Mar Biol 53:371–379
Pearson TH, Josefson AB, Rosenberg R (1985) Petersen’s sta-tions revisited. I. Is the Kattegat becoming eutrophic?J Exp Mar Biol Ecol 92:157–206
Peckol P, Rivers JS (1995) Physiological responses of theopportunistic macroalgae Cladophora vagabunda (L.) vanden Hoek and Gracilaria tikvahiae (McLachlan) to envi-ronmental disturbances associated with eutrophication.J Exp Mar Biol Ecol 190:1–16
Person le Ruyet J, Chartois H, Quemener L (1995) Compara-tive acute ammonia toxicity in marine fish and plasmaammonia response. Aquaculture 136:181–194
Pichavant K, Person le Ruyet J, Le Bayon N, Severe A and 5others (2001) Effects of hypoxia on metabolism and growthin juvenile turbot. Aquaculture 188:103–114
Pihl L (1989) Effects of oxygen depletion on demersal fish incoastal areas of the southeast Kattegat. In: Ryland JS,Tyler PA (eds) Reproduction, genetics and distributions ofmarine organisms. Olsen & Olsen, Fredensborg, p 431–439
Pihl L, Baden SP, Diaz RJ (1992) Effects of periodic hypoxia ondistribution of demersal fish and crustaceans. Mar Biol108:349–360
Pihl L, Baden SP, Diaz RJ, Schaffher LC (1994) Hypoxia-induced structural changes in the diet of bottom-feedingfish and crustacea. Mar Biol 112:349–361
Platt T, Lewis WG, Lewis MR, Li WKW, Sathyendranath S,Smith RE, Vezina AF (1989) Biological production of the
oceans: the case for a consensus. Mar Ecol Prog Ser 52:77–88
Rachor E (1990) Changes in the sublittoral zoobenthos in theGerman Bight with regard to eutrophication. Neth J SeaRes 25:209–214
Rainer SF, Fitzhardinghe RC (1981) Benthic communities inan estuary with periodic deoxygenation. Aust J MarFreshw Res 32:227–241
Ramus J, Beale AI, Mauzerall D (1976) Correlation of changesin pigment content with photosynthetic capacity of sea-weeds as a function of water depth. Mar Biol 37:231–238
Ramus J, Beale AI, Mauzerall D, Howard KL (1976) Changesin the photosynthetic pigment concentration in seaweedsas a function of water depth. Mar Biol 37:223–229
Regner D (1991) The progressive changes of the copepodcommunity from the eastern Adriatic coast caused byeutrophication. Toxicol Environ Chem 31-32:433–439
Reise K, Herre E, Sturm M (1989) Historical changes in thebenthos of the Wadden Sea around the island of Sylt in theNorth Sea. Helgol Wiss Meeresunters 43:417–433
Reish DJ (1970) The effects of varying nutrients, chlorinityand dissolved oxygen on polychaetous annelids. WaterRes 4:721–735
Renaud ML (1986) Detecting and avoiding oxygen deficienctsea water by brown shrimp Penauus aztecus (Ives) and P.setosa (L.). J Exp Mar Biol Ecol 98:283–292
Reynolds FA, Haines TA (1980) Effects of chronic exposure tohydrogen sulphide on newly hatched brown trout Salmotrutta L. Environ Pollut 22:1–13
Rhoads DC, Germano JD (1982) Characterization of organ-ism-sediment relations using sediment profile imaging: anefficient method of remote ecological monitoring of theseafloor. Mar Ecol Prog Ser 8:115–128
Rhoads DC, Germano JD (1986) Interpreting long-termchanges in benthic community structure: a new protocol.Hydrobiologia 142:291–308
Richardson K (1996) Conclusions, research and eutrophica-tion control. In: Jørgensen BB, Richardson K (eds) Eu-trophication in coastal marine ecosystems. American Geo-physical Union, Washington, DC, p 243–267
Richardson K, Heilmann J (1995) Primary production in theKattegat: past and present. Ophelia 41:317–328
Ritter C, Montagna PA (1999) Seasonal hypoxia and models ofbenthic response in a Texas bay. Estuaries 22:7–20
Rosas C, Martinez E, Gaxiola G, Brito R, Sanchez A, Soto LA(1999) The effect of dissolved oxygen and salinity on oxy-gen consumption, ammonia excretion and osmotic pres-sure of Penaeus setiferus (Linnaeus) juveniles. J Exp MarBiol Ecol 234:41–57
Rosenberg R (1972) Benthic faunal recovery in a Swedishfjord following the closure of a sulphite pulp mill. Oikos23:92–108
Rosenberg R (1976) Benthic faunal dynamics during succes-sion following pollution abatement in a Swedish estuary.Oikos 27:414–427
Rosenberg R (1977) Benthic macrofaunal dynamics, produc-tion, and dispersion in an oxygen-deficient estuary of westSweden. J Exp Mar Biol Ecol 26:107–133
Rosenberg R (1990) Negative oxygen trends in Swedishcoastal bottom waters. Mar Pollut Bull 21:335–339
Rosenberg R, Loo LO (1988) Marine eutrophication inducedoxygen deficiency: effects on soft bottom fauna, westernSweden. Ophelia 29:213–225
Rosenberg R, Arntz W, de Flores EC, Flores LA, Carbajal G,Finger I, Tarazona J (1983) Benthos biomass and oxygendeficiency in the upwelling system off Peru. J Mar Res 41:263–279
277

Mar Ecol Prog Ser 238: 249–279, 2002
Rosenberg R, Gray JS, Josefson AB, Pearson TH (1987)Petersen’s benthic stations revisited. II. Is the Oslofjordand eastern Skagerrak enriched? J Exp Mar Biol Ecol105:219–251
Rosenberg R, Elmgren R, Fleischer S, Jonsson P, Persson G,Dahlin H (1990) Introduction—marine eutrophication inSweden. Ambio 19:102–108
Rosenberg R, Hellman B, Johansson B (1991) Hypoxic toler-ance of marine benthic fauna. Mar Ecol Prog Ser 79:127–131
Ross AH, Gurney WSC, Heath MR, Hay SJ, Henderson EW(1993) A strategic simulation model of a fjord ecosystem.Limnol Oceanogr 38:128–153
Ross AH, Gurney WSC, Heath MR (1994) A comparativestudy of the ecosystem dynamics of four fjords. LimnolOceanogr 39:318–343
Rossignol-Strick M (1985) A marine anoxic event on the Brit-tany coast, July 1982. J Coast Res 1:11–20
Rumohr H (1986) Historische Indizien für Eutrophierungser-scheinungen (1875–1939) in der Kieler Bucht (westlicheOstsee). Meeresforschung 31:115–123
Rumohr H, Schomann H (1992) REMOTS sediment profilesaround exploratory drilling rig in the southern North Sea.Mar Ecol Prog Ser 91:303–311
Rydberg L, Edler L, Floderus S, Granéli W (1990) Interactionbetween supply of nutrients, primary production, sedi-mentation and oxygen consumption in SE Kattegat.Ambio 19:134–141
Ryther JH, Dunstan WM (1971) Nitrogen, phosphorus andeutrophication in the coastal marine environment. Science171:1008–1013
Sandberg E (1994) Does short-term oxygen depletion affectpredator-prey relationships in zoobenthos? Experimentswith the isopod Saduria entomon. Mar Ecol Prog Ser 103:73–80
Sand-Jensen K, Borum J, Geertz-Hansen O, Jensen JN, Josef-son AB, Riemann B (1994) Resuspension and biologicalinteractions in Roskilde Fjord. Havforskning fra Miljø-styrelsen 51. Danish Environment Protection Agency,Copenhagen (in Danish)
Santos SL, Simon JL (1980) Response of a soft-bottom benthosto annual catastrophic disturbance in a South Florida estu-ary. Mar Ecol Prog Ser 3:347–355
Schurmann H, Steffensen JF (1994) Spontaneous swimmingactivity of Atlantic cod Gadus morhua exposed to gradedhypoxia at three temperatures. J Exp Biol 197:129–142
Seliger H, Boggs JA, Biggley WH (1985) Catastrophic anoxiain the Chesapeake Bay in 1984. Science 228:70–73
Sfriso A, Marcomini A, Pavoni B (1987) Relationships be-tween macroalgal biomass and nutrient concentrations ina hypertrophic area of the Venice Lagoon. Mar EnvironRes 22:297–312
Sfriso A, Pavoni B, Marcomini A, Orio AA (1988) Annual vari-ations of nutrients in the Lagoon of Venice. Mar Pollut Bull19:54–60
Silvert W (1994) Modelling the benthic impacts of organicmatter loading. Can Tech Rep Fish Aqua Sci 1949:1–18
Skeie GM (1987) Heterotrof bakteriell produksjon i sedi-mentet fra Oslofjorden. MSc thesis, University of Oslo (inNorwegian)
Smayda T (1990) Novel and nuisance phytoplankton bloomsin the sea: evidence for a global epidemic. In: Granéli E,Sundström B, Edler L (eds) Toxic marine phytoplankton.Elsevier, New York, p 29–40
Smetacek V (1980) Annual cycle of sedimentation in relationto plankton ecology in the western Kiel Bight. Ophelia(Suppl) 1:65–76
Smith SV (1984) Phosphorus versus nitrogen limitation in themarine environment. Limnol Oceanogr 29:1149–1169
Smith LL, Oseid DM (1974) Effects of hydrogen sulphide ondevelopment and survival of eight freshwater species. In:Blaxter JHS (ed) The early life history of fish. Springer-Verlag, New York, p 417–430
Söderström J (1971) The capacity of coastal waters to usenutrients in Bohuslän, Sweden. Bot Mar 14:39–52
Spicer JI (1995) Oxygen and acid-base status of the sea urchinPsammechinus miliaris during environmental hypoxia.Mar Biol 124:71–76
Stachowitsch M (1984) Mass mortality in the Gulf of Trieste:the course of community destruction. PSZN I: Mar Ecol5:243–264
Steele JH Baird I (1972) Sedimentation of organic matter in aScottish sea loch. Mem Ist Ital Idrobiol 29 Dott MarcoMarchi (Suppl):73–88
Steffensen JF (1990) Ilt i vand, og hvor lidt fisk kan tåle. VandMiljø 7:243–246
Stickle WB, Kapper MA, Liu LL, Gnaiger E, Wang SY (1989)Metabolic adaptations of several species of crustaceansand molluscs to hypoxia: tolerance and microcalorimetricstudies. Biol Bull 177:303–312
Stoddard A, Walsh JJ (1986) Modelling oxygen depletion inthe New York Bight: the water quality impact of a poten-tial increase of waste inputs. In: Wolfe DA, O’Connor TP(eds) Urban Wastes in Coastal Marine Environments,Krieger Publishing Company, Malabar, FL 5:92–102
Strzyewska K (1978) Baltic herring-catches, biology, re-sources. In: Manowski W (ed) Produktwynosc ekosystemumorza Baltyckiego. Studia i Materialy OceanologiczneKomitet Badan Morza, Polska Akad Nauk, Wroclaw,p 163–191
Strzyewska K, Popiel J (1974) Changes in the growth of her-ring in the southern Baltic. Ber Dtsch Wiss Komm Meeres-forsch 23:268–272
Svane I, Gröndahl F (1988) Epibiosis of Gullmarsfjorden: anunderwater stereographical transect analysis in com-parison with the investigations of Gislén in 1926–1929.Ophelia 28:95–110
Tallqvist M, Sandberg KE, Bonsdorff E (1999) Juvenile floun-der, Platichthys flesus (L.), under hypoxia: effects on toler-ance, ventilation rate and predation efficiency. J Exp MarBiol Ecol 242:75–93
Tarazona J, Paredes C, Igreda M (1986) Estructura del macro-bentos en las playas arenosas de la zona de Lima, Perú.Rev Cienc Universidad Nacional Mayor de San Marcos(U.N.M.S.M.) 74:103–116
Taslakian MJ, Hardy JT (1976) Sewage nutrient enrichmentand phytoplankton ecology along the central coast ofLebanon. Mar Biol 38:315–325
Taylor DL, Eggelstone DB (2000) Effects of hypoxia on anestuarine predator-prey interaction: foraging behaviourand mutual interference in the blue crab Callinectessapidus and the infaunal clam prey Mya arenaria. MarEcol Prog Ser 196:221–237
ter Braak CJF (1987) CANOCO—a FORTRAN program forcanonical community ordination by (partial) (detrended)(canonical) correspondence analysis, principal componentanalysis and redundancy analysis (version 2.1). Agricul-tural Mathematics Group, Wageningen
Tett P, Edwards A, Jones K (1986) A model for the growth ofshelf sea phytoplankton in summer. Estuar Coast Shelf Sci23:641–672
Theede H (1973) Comparative studies on the influence of oxy-gen deficiency and hydrogen sulphide on marine bottominvertebrates. Neth J Sea Res 7:244–252
278

Gray et al.: Hypoxia and organic enrichment in coastal environment
Thomas WH (1971a) On nitrogen deficiency in tropical Pacificoceanic phytoplankton: photosynthetic parameters in poorand rich water. Limnol Oceanogr 15:380–385
Thomas WH (1971b) Effect of ammonium and nitrate concen-tration on chlorophyll increases in natural tropical Pacificphytoplankton populations. Limnol Oceanogr 15:386–394
Thurston RVMS, Russo RC, Phillips G (1983) Acute toxicity ofammonia to rainbow trout and fathead minnows. TransAm Fish Soc 112:705–711
Tsuji T, Seki H, Hattori A (1973) Results of red tide formationin Tokyo Bay. J Water Pollut Control Fed 46:165–172
USEPA (United States Environmental Protection Agency) (1986)Quality criteria for water—1986. (EPA 440/5-86-001).USEPA, Washington, DC
USEPA (United States Environmental Protection Agency) (1989)Ambient water quality criteria for ammonia (saltwater).Misc Rep Ser, USEPA, Washington, DC
Val AL, Silva MNP, Almeida-Val VMF (1998) Hypoxia adap-tation in fish of the Amazon: a never-ending task. S Afr JZool 33:107–114
Valderhaug VA, Gray JS (1984) Constant structure of amacrofaunal community despite a fluctuating food supplyin subtidal sediments of Oslofjord, Norway. Mar Biol82:307–322
Valiela I (1984) Marine ecological processes. Springer-Verlag,New York
Valiela I, Teal JM, Volkmann S, Shafer D, Carpenter EC(1978) Nutrient and particulate fluxes in a salt marshecosystem: tidal exchanges and inputs by precipitationand groundwater. Limnol Oceanogr 23:798–812
Vetter RAH, Franke HD, Buchholz F (1999) Habitat-relateddifferences in the response to oxygen deficiencies inIdotea baltic and Idotea emarginata (Isopoda, Crustacea).J Exp Mar Biol Ecol 239:259–272
Vismann B, Hagerman L (1996) Recovery from hypoxia withand without sulfide in Saduria entoman: oxygen debt,reduced sulfur and anaerobic metabolites. Mar Ecol ProgSer 143:131–139
Visser AW, Kamp Nielsen L (1996) The use of models ineutrophication studies. Coast Estuar Stud 52:221–242
Vistisen B, Vismann B (1997) Tolerance to low oxygen andsulphide in Amphiura filiformis and Ophiura albida(Echinodermata: Ophiuroidea). Mar Biol 128:241–246
Vollenweider RA (1968) Water Management Research.DAS/CSI, 68.27. OECD, Paris
Vollenweider RA (1975) Input-output models. With specialreference to the phosphorus loading concept in limnology.Schweiz Z Hydrol 37:53–84
Vollenweider RA (1976) Advances in defining critical loadinglevels for phosphorus in lake eutrophication. Mem Ist ItalIdrobiol Dott Marco Marchi 33:53–83
Vollenweider RA, Rinaldi R, Montanari G (1992) Eutrophica-tion, structure and dynamics of a marine coastal system:Results of ten-year monitoring along the Emilia-Romagnacoast (Northwest Adriatic Sea). In: Vollenweider RA, Mar-
chetti R, Viviani R (eds) Marine coastal eutrophication: theresponse of marine transitional systems to human impact:problems and perspectives for restoration. Proc Int Conf,Bologna, Italy, 21–24 March 1990. Sci Tot Env Suppl 1992:63–106
Wajsbrot N, Gasith A, Krom MD, Samocha TM (1990) Effectof dissolved oxygen and the molt stage on the acute toxic-ity of ammonia to juvenile green tiger prawn Penaeussemisulcatus. Environ Toxicol Chem 9:497–504
Wajsbrot N, Gasith A, Krom MD, Popper DM (1991) Acutetoxicity of ammonia to juvenile gilthead seabream Sparusaurata under reduce oxygen levels. Aquaculture 92:277–288
Walsh JJ (1975) Utility of systems models: A consideration ofsome possible feedback loops of the Peruvian upwellingecosystem. Estuarine Research, Vol. 1: Chemistry, biology,and the estuarine system. Academic Press, New York, NY
Walsh JJ (1988) On the nature of continental shelves. Acade-mic Press, San Francisco
Walsh JJ, Prmuzic ET, Whitledge TE (1981) Fate of nutrientenrichment on continental shelves as indicated by the C:Nof bottom sediments. In: Nihoul JCJ (ed) Ecohydrody-namics. Elsevier, Amsterdam, p 13–50
Wang WX, Widdows J (1991) Physiological responses of mus-sel larvae Mytilus edulis to environmental hypoxia andanoxia. Mar Ecol Prog Ser 70:223–236
Wannamaker CM, Rice JA (2000) Effects of hypoxia andbehaviour of selected estuarine organisms form the south-eastern United States. J Exp Mar Biol Ecol 249:145–163
Wassmann P (1985) Sedimentation of particulate material inNordåsvannet, a hypertrophic, land-locked fjord in west-ern Norway. Mar Ecol Prog Ser 22:259–271
Wassmann P (1990) Relationship between primary and exportproduction in the boreal coastal zone of the North Atlantic.Limnol Oceanogr 35:464–471
Weigelt M (1991) Short- and long-term changes in the benthiccommunity of the deeper parts of Kiel Bay (Western Baltic)due to oxygen depletion and eutrophication. Meeres-forschung 33:197–224
Weston DP (1990) Quantitative examination of macrobenthiccommunity changes along an organic enrichment gradi-ent. Mar Ecol Prog Ser 61:233–244
Wrezinski O (1983) Changes in the growth rate of the herringcoastal spring spawners in the Gulf of Gdansk. Int CouncExplor Sea Comm Meet J 1–12
Wu RSS (1982) Periodic defaunation and recovery in a sub-tropical epibenthic community, in relation to organic pol-lution. J Exp Mar Biol Ecol 64:253–269
Wulff F, Ærtebjerg G, Nicolaus G, Niemi Å, Ciszevski P,Schulz S, Kaiser W (1986) The changing pelagic ecosys-tem of the Baltic Sea. Ophelia (Suppl)4:299–319
Wulff F, Stigebrandt A, Rahm L (1990) Nutrient dynamics ofthe Baltic Sea. Ambio 19:126–133
Zaitsev YP (1992) Recent changes in the tropic structure of theBlack Sea. Fish Oceanogr 1:180–189
279
Editorial responsibility: Otto Kinne (Editor), Oldendorf/Luhe, Germany
Submitted: July 27, 2001, Accepted: November 27, 2001Proofs received from author(s): July 9, 2002