Effects of Hormonal Changes Throughout the Menstrual Cycle ...
131
Old Dominion University ODU Digital Commons Human Movement Sciences eses & Dissertations Human Movement Sciences Summer 2001 Effects of Hormonal Changes roughout the Menstrual Cycle on Joint Laxity in Females John C. Roberts Old Dominion University Follow this and additional works at: hps://digitalcommons.odu.edu/hms_etds Part of the Obstetrics and Gynecology Commons , and the Public Health Commons is esis is brought to you for free and open access by the Human Movement Sciences at ODU Digital Commons. It has been accepted for inclusion in Human Movement Sciences eses & Dissertations by an authorized administrator of ODU Digital Commons. For more information, please contact [email protected]. Recommended Citation Roberts, John C.. "Effects of Hormonal Changes roughout the Menstrual Cycle on Joint Laxity in Females" (2001). Master of Science in Education (MSEd), thesis, Human Movement Sciences, Old Dominion University, DOI: 10.25777/3a39-ze84 hps://digitalcommons.odu.edu/hms_etds/41
Transcript of Effects of Hormonal Changes Throughout the Menstrual Cycle ...

Old Dominion UniversityODU Digital Commons
Human Movement Sciences Theses & Dissertations Human Movement Sciences
Summer 2001
Effects of Hormonal Changes Throughout theMenstrual Cycle on Joint Laxity in FemalesJohn C. RobertsOld Dominion University
Follow this and additional works at: https://digitalcommons.odu.edu/hms_etds
Part of the Obstetrics and Gynecology Commons, and the Public Health Commons
This Thesis is brought to you for free and open access by the Human Movement Sciences at ODU Digital Commons. It has been accepted for inclusionin Human Movement Sciences Theses & Dissertations by an authorized administrator of ODU Digital Commons. For more information, pleasecontact [email protected].
Recommended CitationRoberts, John C.. "Effects of Hormonal Changes Throughout the Menstrual Cycle on Joint Laxity in Females" (2001). Master ofScience in Education (MSEd), thesis, Human Movement Sciences, Old Dominion University, DOI: 10.25777/3a39-ze84https://digitalcommons.odu.edu/hms_etds/41
EFFECTS OF HORMONAL CHANGES THROUGHOUT THE
MENSTRUAL CYCLE ON JOINT LAXITY IN FEMALES
John C. RobertsB.S. June 1998, James Madison University
A Thesis Submitted to the Faculty of Old Dominion University in Partial Fulfillment of the
Requirement for the Degree of
MASTER OF SCIENCE IN EDUCATION WITH EMPHASIS IN ATHLETIC TRAINING
DEPARTMENT OF HEALTH, PHYSICAL EDUCATION AND RECREATIONOLD DOMINION UNIVERSITY
August 2001
by
lOnnie L. VanLunen (Director)
•avid Branch'(Member)
Reproduced with permission of the copyright owner. Further reproduction prohibited without permission.

ABSTRACT
EFFECTS OF HORMONAL CHANGES THROUGHOUT THE MENSTRUAL CYCLE ON JOINT LAXITY IN FEMALES
John C. Roberts Old Dominion University, 2001
Director: Dr. Bonnie L. VanLunen
The objective of this study was to examine the levels of estrogens,
progesterone, LH, FSH, estradiol and testosterone and their relation to ACL laxity
throughout the menstrual cycle. Twelve females (xage = 24.25 + 4.94) presented
with a dominant right leg free of injury. They were mild to moderately active and
had a 12-month history of normal menstrual cycles (28-35 days) that were not due
to the use of hormonal therapy. Subjects were tested at the onset of menses, the
first day of ovulation (days 8-17) and day 23 at the mid-luteal phase. At each
session, 14 ml of blood was drawn from the antecubital vein in the forearm. All
blood samples were analyzed via radioimmunoassay to determine the
concentration of each hormone. Immediately following the blood collection,
subjects were tested for ACL laxity using the MEDmetric KT-2000 in
conjunction with simultaneous radiographs. A Pearson Product Moment
Correlation Coefficient revealed that there were no statistically significant
relationships between laxity measurements, of the KT-2000 or radiographic
comparisons, and elevated concentrations of any of the hormones. LH was
observed in the follicular phase, at the onset of menses, to have a negative
correlation with only the radiographic reading (r = -.628, p = .029). A 2-way
repeated measures ANOVA was used to determine if there were any statistically
Reproduced with permission of the copyright owner. Further reproduction prohibited without permission.

significant changes in the KT-2000 or radiographic comparisons over time.
Values obtained by reading the KT-2000 graphs from the X-Y plotter showed no
statistically significant changes throughout the menstrual cycle (F2,22 = .709, p =
.503). There were no significant changes in laxity over the duration of the
menstrual cycle as determined by radiographic comparisons (F2,22 = 1.095, p =
.352). We concluded that there was no relationship between concentrations of
estrogens, progesterone, LH, FSH, estradiol or testosterone and ACL laxity. Both
the KT-2000 and radiographic measurements have high intra-method reliabilities,
but inter-method reliability is low.
Reproduced with permission of the copyright owner. Further reproduction prohibited without permission.

Copyright, 2001, Old Dominion University, All Rights Reserved
Reproduced with permission of the copyright owner. Further reproduction prohibited without permission.

V
I would like to dedicate this paper
to my parents, Jack and Bemita.
Whose love and guidance
have been the one constant
throughout my entire educational career
and life.
And to Pam, for showing me
unconditional love and support.
Always and Forever.
I love you.
Reproduced with permission of the copyright owner. Further reproduction prohibited without permission.
vi
ACKNOWLEDGMENTS
There are a great deal of people and organizations whose assistance,
support and dedication made this project not only a possibility, but a reality.
Thank you all for your efforts and hard work.
Thank you to my thesis committee members, Dr. Bonnie VanLunen, Dr.
Elizabeth Dowling and Dr. J. David Branch, for guiding me along the way.
Specifically, to Dr. VanLunen for countless advising sessions, to Dr. Dowling for
assisting with the venipuncture and to Dr. Branch for assistance and guidance
with the venipuncture, hormonal analysis and statistical work.
Thank you to Andy Altman, ATC, PT and Brian Hoke, PT of Atlantic
Physical Therapy in Virginia Beach, VA for the use of the KT-2000 knee
arthrometer for testing and to Wayne McMasters of Tidewater Physical Therapy
in Hampton, VA for the use of the KT-1000 knee arthrometer for the pilot study
and recruiting subjects.
Thank you to Sue Nagle, MT, ASCP of the Old Dominion University
Student Health Center for helping with the venipuncture procedures.
Thank you to Chan V. Nguyen, MD of Medical Center Radiologists and
Norfolk Sentara General Hospital of Norfolk, VA and to all the radiology
technicians of Norfolk Sentara for their assistance and the use of the radiology
lab.
Thank you to Dave Halla, of Gray’s Pharmacy in Norfolk, VA, for
providing the ovulation kits at a discounted, research price.
Reproduced with permission of the copyright owner. Further reproduction prohibited without permission.

Thank you to Ryan Baumert, ATC, Simon Rosenblum, ATC and Jill
Souza, ATC for helping with the pilot study to assure that the research would run
smoothly.
Thank you to Jon Cohen, ATC, Simon Rosenblum, ATC, Jill Souza, ATC
and Teresa Saucier, ATC for helping at work so that I was able to conduct my
pilot study and research.
Thank you to the Mid-Atlantic Athletic Trainers’ Association for the grant
to fund this costly research.
Thank you to Pam and the entire Williams family, Jim, Denise, Meghan
and Kelsey, for being patient and giving me a place to work and live so that I may
complete my research. You gave me hope when it was needed and provided me
with shelter when I was without.
Finally, thank you to all of the women who volunteered their time to
participate as subjects, without whom none have this would have been possible.
As well as, all the men and women who were unable to participate in the study
but volunteered for the procedures for measuring tester reliability for the use of
the KT-2000.
Thank you all for your help. None of you were required to do what you
did. You gave of yourselves so that I may succeed. There is truly no greater gift.
I wish you all nothing but the best in life.
Reproduced with permission of the copyright owner. Further reproduction prohibited without permission.

TABLE OF CONTENTS
Page
ABSTRACT..................................................................................................... ii
COPYRIGHT................................................................................................... iv
DEDICATION................................................................................................. v
ACKNOWLEDGMENTS............................................................................... vi
TABLE OF CONTENTS.................................................................................viii
LIST OF TABLES........................................................................................... x
LIST OF FIGURES..........................................................................................xii
CHAPTER I: INTRODUCTION........................................................1STATEMENT OF THE PROBLEM...........................1RESEARCH HYPOTHESIS.......................................2NULL HYPOTHESIS................................................. 2INDEPENDENT VARIABLES..................................2DEPENDENT VARIABLES...................................... 2SIGNIFICANCE OF THE STUDY........................... 5DELIMITATIONS...................................................... 5LIMITATIONS............................................................ 6ASSUMPTIONS..........................................................7OPERATIONAL DEFINITIONS...............................7
CHAPTER H: RE VIEW OF LITERATURE...................................... 9ANATOMY..................................................................9ETIOLOGY.................................................................. 15EPIDEMIOLOGY........................................................18KNEE LAXITY ASSESSMENT................................22THE MENSTRUAL CYCLE...................................... 34
FOLLICULAR PHASE...................................34OVULATION..................................................40LUTEAL PHASE............................................ 42
HORMONAL CHARACTERISTICS........................46ESTROGENS..................................................46PROGESTERONE..........................................47LUTEINIZING HORMONE..........................47FOLLICLE-STIMULATING HORMONE... 48ESTRADIOL................................................... 48TESTOSTERONE.......................................... 49
Reproduced with permission of the copyright owner. Further reproduction prohibited without permission.

PHLEBOTOMY.......................................................... 49LIGAMENTOUS LAXITY AND MENSTRUAL CYCLE ASSOCIATIONS...................................... 51
CHAPTER ID: METHODOLOGY........................................................ 57SUBJECTS................................................................... 57INSTRUMENTATION............................................... 60EXPERIMENTAL DESIGN....................................... 62STATISTICS................................................................68
CHAPTER IV: RESULTS...................................................................... 70SUBJECT ATTRIBUTES...........................................70HORMONE CONCENTRATIONS........................... 73LAXITY READINGS................................................. 72
CHAPTER V: DISCUSSION................................................................79HORMONAL CONCENTRATIONS ANDLAXITY READINGS................................................. 79CONCLUSIONS..........................................................84RECCOMENDATIONS..............................................85
APPENDICES:A. QUESTIONNAIRE................................................................... 89B. CONSENT FORM.....................................................................90C. TABLE 6.................................................................................... 96D. TABLE 7.................................................................................... 97E. TABLES 8 a -8 e ........................................................................98F. FIGURES 1 4 a-1 4 f.................................................................. 103G. TABLE 9.....................................................................................109H. TABLE 10.................................................................................. 110I. TABLE 11...................................................................................I l lJ. TABLE 12...................................................................................112K. TABLE 13...................................................................................113
REFERENCES...................................................................................................114
Reproduced with permission of the copyright owner. Further reproduction prohibited without permission.

X
LIST OF TABLES
Page
Table 1. Ratio of Female to Male Knee Injuriesat New Jersey Colleges and High Schools.............................. 20
Table 2. Subject Demographics.............................................................71
Table 3. Time Intervals for Testing Sessions and PercentVolume Changes in Hematocrit and Hemoglobin................72
Table 4. Hormonal Descriptive Statistics for the Meanand Standard Deviation at Each Phase................................... 74
Table 5. Hormone and Laxity Correlations.......................................... 75
Table 6. Raw Data for Individual Subjects’ Demographics................. 96
Table 7. Raw Data for Individual Subjects’ Time Intervalsfor Testing Sessions and Percent Volume Changes in Hematocrit and Hemoglobin...............................................97
Table 8a. Individual Subjects’ Raw Data for Hematocrit,Hemoglobin, Hormonal Concentrations andLaxity Readings at Menses.................................................... 98
Table 8b. Individual Subjects’ Raw Data for Hematocrit,Hemoglobin, Hormonal Concentrations andLaxity Readings at Ovulation................................................. 99
Table 8c. Individual Subjects’ Raw Data for Hematocrit,Hemoglobin, Hormonal Concentrations andLaxity Readings at the Mid-Luteal Stage.............................. 100
Table 8d. Individual Subjects’ Raw Data for HormonalConcentrations at Day 23.......................................................101
Table 8e. Individual Subjects’ Raw Data for Laxity Readings.............. 102
Table 9. Raw Data for KT-2000 Intratester Reliability for PrimaryExaminer................................................................................. 109
Table 10. Raw Data for KT-2000 Intratester Reliability for PrimaryExaminer................................................................................. 110
Reproduced with permission of the copyright owner. Further reproduction prohibited without permission.
xi
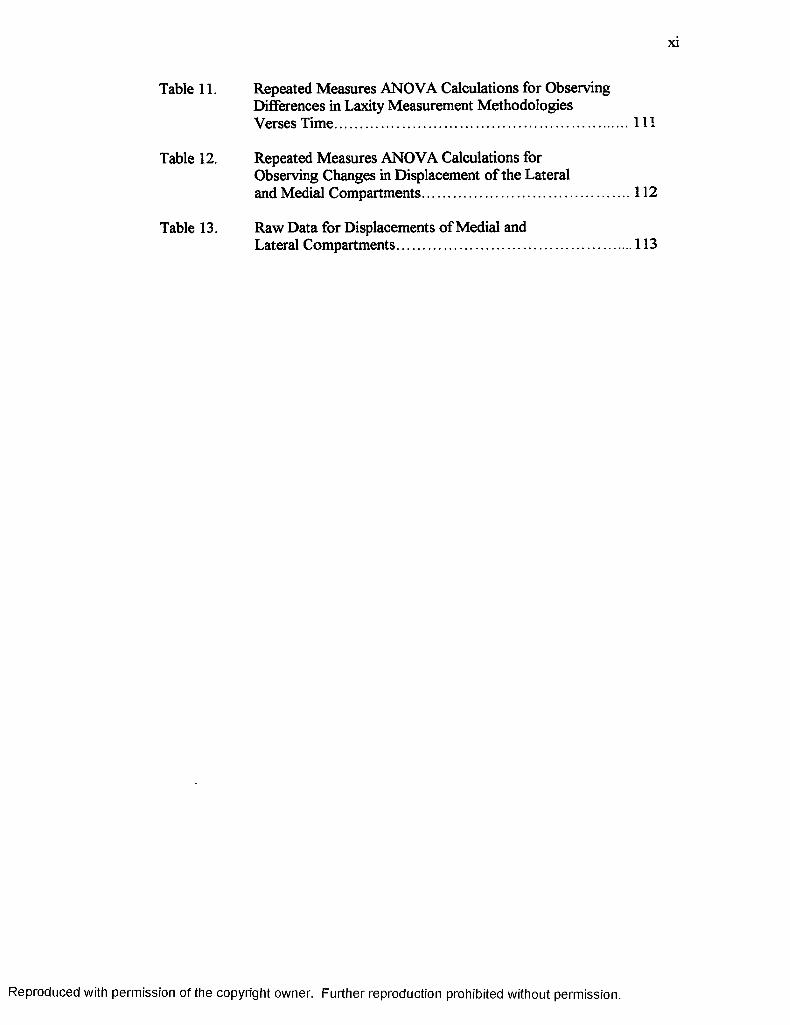
Table 11. Repeated Measures ANOVA Calculations for ObservingDifferences in Laxity Measurement Methodologies Verses Time.............................................................................. I l l
Table 12. Repeated Measures ANOVA Calculations forObserving Changes in Displacement of the Lateraland Medial Compartments....................................................... 112
Table 13. Raw Data for Displacements of Medial andLateral Compartments.............................................................. 113
Reproduced with permission of the copyright owner. Further reproduction prohibited without permission.

LIST OF FIGURES
Page
Figure 1. KT-1000, KT-2000................................................................... 3
Figure 2. Radiographic assessment.......................................................... 4
Figure 3. A) ACL B) PCL C) Synovium D) Joint Capsule.................... 12
Figure 4. Anterior drawer test for ACL instability.................................. 23
Figure 5. Lachman test for instability of the ACL...................................24
Figure 6. Pivot shift test............................................................................26
Figure 7. X-Y plotter attachment for the KT-2000................................. 29
Figure 8. KT-2000 knee ligament arthrometer patientevaluation form........................................................................ 30
Figure 9. Hormonal concentrations throughout themenstrual cycle.........................................................................37
Figure 10. Hormonal effects and reactions of FSH, LH and estradiol.... 38
Figure 11. Hormonal concentrations throughout a pregnancy.................45
Figure 12. Q-angle measurement using the ASIS,midpoint of the patella and tibial tubercle..............................59
Figure 13. Comparisons o f laxity measuring methodologyat each phase o f the menstrual cycle...................................... 77
Figure 14a. Standard curve for estrogens.....................................................103
Figure 14b. Standard curve for progesterone.............................................. 104
Figure 14c. Standard curve for LH.............................................................. 105
Figure 14d. Standard curve for FSH............................................................106
Figure 14e. Standard curve for estradiol......................................................107
Figure 14f. Standard curve for testosterone.................................................108
Reproduced with permission of the copyright owner. Further reproduction prohibited without permission.
1
CHAPTER I
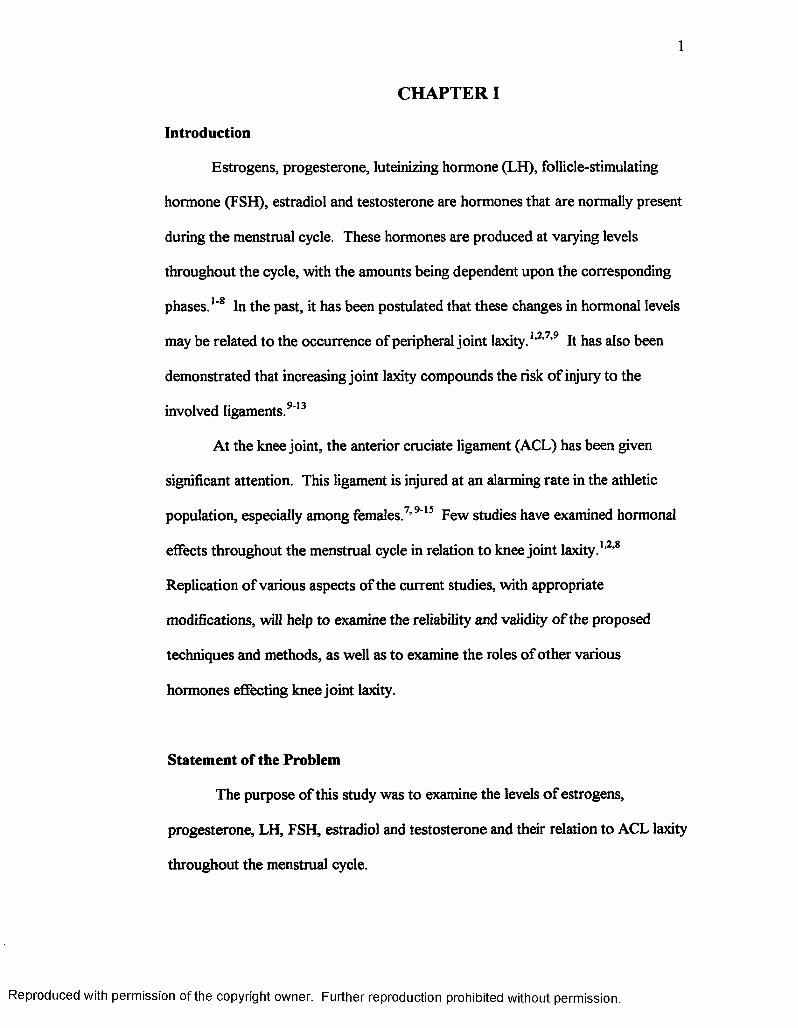
Introduction
Estrogens, progesterone, luteinizing hormone (LH), follicle-stimulating
hormone (FSH), estradiol and testosterone are hormones that are normally present
during the menstrual cycle. These hormones are produced at varying levels
throughout the cycle, with the amounts being dependent upon the corresponding
phases.1'8 In the past, it has been postulated that these changes in hormonal levels
may be related to the occurrence of peripheral joint laxity.1’2,7,9 It has also been
demonstrated that increasing joint laxity compounds the risk o f injury to the
involved ligaments.9'13
At the knee joint, the anterior cruciate ligament (ACL) has been given
significant attention. This ligament is injured at an alarming rate in the athletic
population, especially among females.7’9'15 Few studies have examined hormonal
effects throughout the menstrual cycle in relation to knee joint laxity.1,2,8
Replication of various aspects of the current studies, with appropriate
modifications, will help to examine the reliability and validity o f the proposed
techniques and methods, as well as to examine the roles o f other various
hormones effecting knee joint laxity.
Statement of the Problem
The purpose of this study was to examine the levels o f estrogens,
progesterone, LH, FSH, estradiol and testosterone and their relation to ACL laxity
throughout the menstrual cycle.
Reproduced with permission of the copyright owner. Further reproduction prohibited without permission.

2
Research Hypothesis
There was to be a statistically significant increase in the amount of
anterior tibial translation corresponding with elevated levels of estrogens,
progesterone and estradiol at the mid-luteal phase therefore inferring an increase
in ACL laxity and a higher potential for injury.
Null Hypothesis
There was to be no statistically significant change in the amount of ACL
laxity as estrogens, progesterone, LH, FSH, estradiol and testosterone levels
fluctuate throughout the menstrual cycle.
Independent Variables
1) Menstrual cycle phase with the following levels: Follicular, Ovulatory,
Luteal.
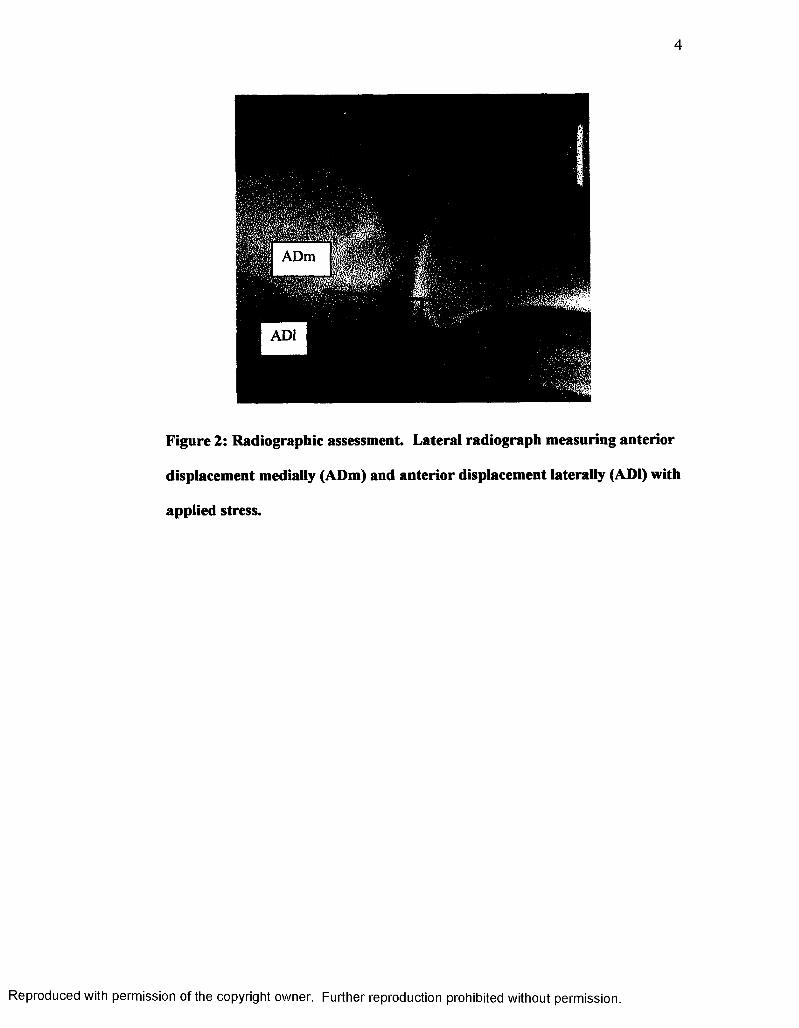
2) Method of tibial displacement with the following levels: KT-2000 (Figure
1), Radiographic Comparison (Figure 2).
Dependent Variables
1) Hormonal levels of estrogens, progesterone, LH, FSH, estradiol and
testosterone.
2) Anterior tibial translation measured in millimeters at 133 N. (30 lbs.) of
force.
Reproduced with permission of the copyright owner. Further reproduction prohibited without permission.
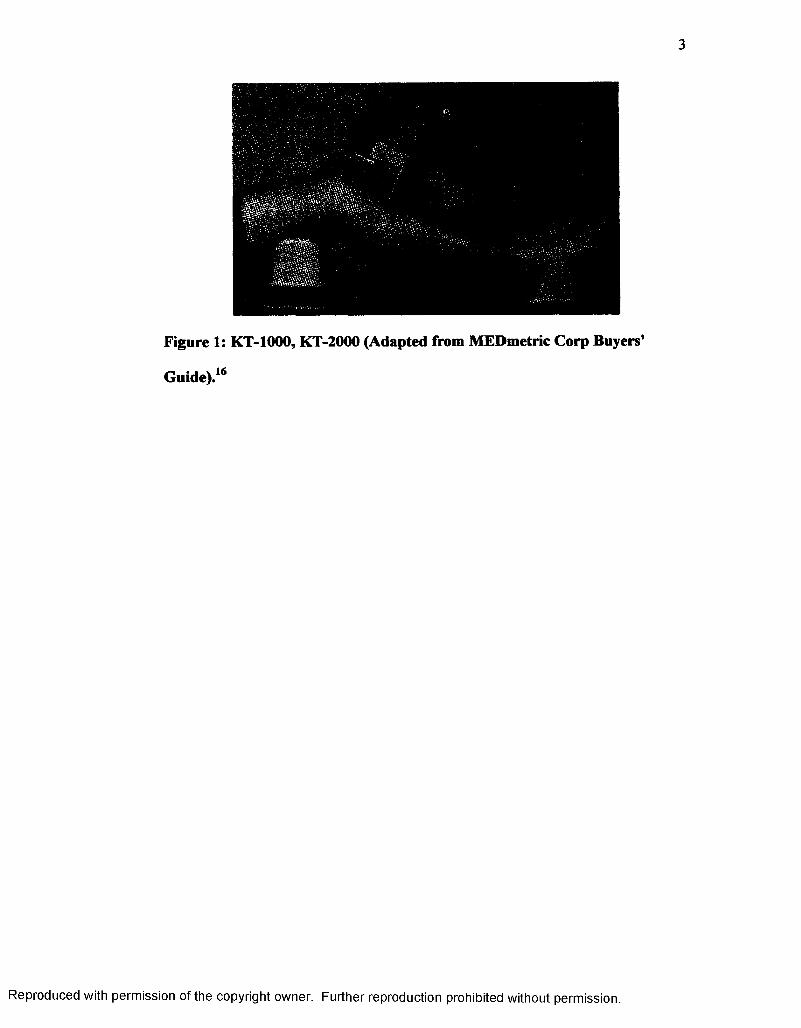
Figure 1: KT-1000, KT-2000 (Adapted from MEDmetric Corp Buyers1
Guide).16
Reproduced with permission of the copyright owner. Further reproduction prohibited without permission.
4
ADm II
Figure 2: Radiographic assessment. Lateral radiograph measuring anterior
displacement medially (ADm) and anterior displacement laterally (ADI) with
applied stress.
Reproduced with permission of the copyright owner. Further reproduction prohibited without permission.

Significance of the Study
There has been relatively little information published on ACL laxity and
its relation to hormone levels.1,2,8 No literature could be found that discussed
knee laxity regarding varying levels of LH, FSH, estradiol or testosterone. The
intent of this study was to support or refute former findings regarding estrogens
and progesterone and provide further information on the relationship of LH, FSH,
estradiol and testosterone to ACL laxity.
The objectives of this proposed study were to. 1) measure the levels of
estrogens, progesterone, LH, FSH, estradiol, and testosterone in the blood on a
specified day from each phase of the menstrual cycle, 2) measure the amount of
laxity in the ACL on the same days hormonal levels were evaluated, 3) compare
the two findings, 4) discuss possible relationships between individual and/or
collective hormonal releases and ACL laxity to injury and 5) compare the results
between the KT-2000 assessment and the radiograph assessment to determine the
accuracy and effectiveness of both methods.
Delimitations
1) Subjects consisted of 12 college-aged, females not participating in varsity
athletics.
2) Subjects presented with the right knee as dominant and free of any past or
current pathological conditions, including, but not limited to ACL deficiency,
meniscal injury, tendinitis, chondromalacia and ligamentous sprains.
Reproduced with permission of the copyright owner. Further reproduction prohibited without permission.

6
3) There was no use of hormonal therapy or supplementation (ie. birth control)
for 3 months prior to the first testing session or during the study.
4) There was minimal risk o f subjects becoming pregnant during the course of
the study.
5) Subjects had experienced eumenorrhea for the year immediately prior to the
start of the study (10 or more menstrual cycles in a 12 month time period).
6) The average length each subject’s menstrual cycle was in a range o f 28-35
days, which is considered medically normal.
7) The length of each subject’s dominant tibia was not less than 34 cm. (Smaller
lengths would require a smaller arthrometer).
08) Each subject’s quadriceps angle (Q-angle) was less than 15 .
Limitations
1) There was no control for the release of estrogens, progesterone, LH, FSH,
estradiol or testosterone for each individual. Hormonal levels will always
vary per individual, per hormone and per menstrual cycle.
2) The size of ACL (ie. width and thickness) and the tensile strength of the
ligament could not be compensated for within the scope of this study.
3) Pre-existing notch stenosis could have resulted in deterioration of the ligament
from excessive amounts of friction.
4) Muscular tension of the hamstrings may have affected the amount of anterior
displacement if the subjects were not completely relaxed.
Reproduced with permission of the copyright owner. Further reproduction prohibited without permission.

7
Assumptions
1) The KT-2000 remained calibrated throughout all testing sessions.
2) Blood sampling instruments and storage units were in proper working
condition.
3) Subjects promptly and accurately reported the first day of their menstrual
cycle and the first day of ovulation.
4) Ovulation kits were used correctly by each subject.
5) Radioimmunoassay procedures were conducted correctly.
6) The correct statistical analysis formulas were chosen and used properly.
Operational Definitions
1) KT-2000 laxity measurements: The KT-2000 knee arthrometer measures the
amount of ACL laxity by anteriorly displacing the tibia at known loads. An
X-Y plotting graph is printed to determine the exact amount of displacement,
in millimeters, at a specific applied force, in Newtons or pounds. For the
purposes of this study, the load observed was 133 N or 30 lbs.
2) Radiographic laxity measurements: Two lateral radiographs were taken of the
knee. The first was in a resting position with the knee in 20-30° of flexion.
The second was taken while a constant force o f 133 N was applied anteriorly
using the KT-2000. Anterior displacement of the medial (ADm) and lateral
(ADI) compartments o f the knee were compared relative to tangent lines
drawn parallel to the posterior tibial cortex. Displacements o f the 2
compartments were averaged for both films individually ([ADm+ADl]/2).
Reproduced with permission of the copyright owner. Further reproduction prohibited without permission.

The number obtained by the first film was subtracted from the number
obtained by the second film to provide the amount of anterior tibial
displacement in millimeters.17
3) Normal menstrual cycle: Twenty-eight to 35 days in length.
4) Follicular phase: Days 1 to 9, approximately, of the menstrual cycle.
5) Ovulatory phase (Menstrual phase): Days 10 to 14, approximately, of the
menstrual cycle.
6) Luteal phase: Approximately day 15 through the end of the menstrual cycle.
7) Hormonal levels: The concentration of each hormone in the blood from
samples taken at the antecubital vein in the forearm. This study used the
method of radioimmunoassay to measure serum concentrations of estrogens
(pg/ml), progesterone (ng/ml), FSH (mlU/ml), LH (mlU/ml), estradiol (pg/ml)
and testosterone (ng/ml).
Reproduced with permission of the copyright owner. Further reproduction prohibited without permission.

9
CHAPTER II
REVIEW OF LITERATURE
To fully understand the presentation of the effects that estrogen,
progesterone, FSH, LH, estradiol and testosterone can have on ACL laxity, it is
best to have a good understanding of the structures and concepts involved. The
following review of literature addresses several general topics: 1) anatomy of the
ACL, 2) etiology, 3) epidemiology, 4) assessment of ACL laxity, 5) the menstrual
cycle, 6) hormonal functions and characteristics and 7) the relationship of ACL
laxity to the menstrual cycle.
Anatomy
The knee is composed of three joints, which include the patellofemoral
joint, the superior tibiofibular joint and the tibiofemoral joint. The patellofemoral
joint acts in a modified sagittal plane within the trochlear groove of the femur.18
O
The patella enhances the efficiency of knee extension from 0 to 30 , since it
ensures that the quadriceps tendon remains away from the axis of movement.19
The articulation of the tibia and fibular head is a synovial joint in which a gliding
motion occurs when there is activity at the foot.19 The tibiofemoral joint is the
primary joint involved in the etiology of ACL injuries. The primary actions that
occur at the tibiofemoral joint are knee flexion and extension. There are also
moderate amounts of internal and external rotation of the tibia on the femur
ranging from approximately 10-20° in either of the two directions, and is therefore
classified as a modified hinge, or ginglymus joint.18 It is held together, almost
Reproduced with permission of the copyright owner. Further reproduction prohibited without permission.

10
entirely, by four ligaments: 1) medial collateral ligament (MCL), 2) lateral
collateral ligament (LCL), 3) posterior cruciate ligament (PCL) and 4) ACL. The
MCL lies slightly posterior on the medial aspect of the knee and is composed of a
superficial and a deep layer. The superficial layer has a strong, broad, triangular
shaped band that begins distal to the adductor tubercle of the femur and runs to
the medial surface of the tibia approximately 6 cm below the joint line. It is
separated from the capsule by a bursa. The deep layer is simply a thickening of
the joint capsule and blends together with the medial meniscus. The MCL is taut
throughout the range of motion (ROM) of the knee, with the anterior fibers tighter
in flexion, the posterior fibers tighter in midrange and the entire ligament being
taut in full extension. The LCL is more of a round cord, approximately one half
to 1 cm in width, lying under the biceps femoris tendon. It also lies slightly
posterior, but on the lateral side, and is separated from the lateral meniscus and
joint capsule by a small fat pad.18,20
The PCL courses anteriorly, superiorly and medially from the posterior
aspect of the tibial crest to the lateral aspect of the medial femoral condyle. The
ACL attaches to the anteromedial surface of the tibial crest and runs superiorly,
posteriorly and laterally to insert on the posteromedial surface of the lateral
femoral condyle. The knee joint is surrounded by an extensive synovium that
communicates with the bursae and pouches of the knee. Although the synovial
membrane covers the entire knee, its arrangement is such that the cruciate
ligaments are extrasynovial, because they are pinched within the articular folds.
Reproduced with permission of the copyright owner. Further reproduction prohibited without permission.
11
Even though the cruciate ligaments are considered extrasynovial, they are
conversely considered as being intracapsular19 (Figure 3).
The ACL can be described in two manners regarding its separation into
bundles. The first separates the structure into two bundles of fibers. The
anteromedial bundle is taut in flexion and extension, but serves its main function
when the knee is flexed. The posterolateral fibers are tight in extension.19 There
is also the suggestion of a third intermediate bundle.20,21 The bundles are
interwoven with and twist around one another. The presence of the third bundle
would increase the amount o f torsion placed on the ACL. It could cause an
increased amount of friction and decreased amount of blood supply due to a
“wringing out” effect.20 Norwood and Cross21 observed a separation of the ACL
into three bundles. They found the anteromedial bundle to be the longest and that
it aids in resisting anteromedial and anterolateral rotary instability. The
intermediate bundle has its greatest effects on straight anterior instability. The
posterolateral bundle is the shortest of the three and it prevents posterolateral
rotary instability. Each of the three bundles aid in the prevention of
hyperextension of the knee. The ACL has, as a single unit, the least amount of
stress placed upon it between 30-60° of flexion. While the tibia is internally
rotated the ACL becomes taut again, as opposed to the release o f pressure
produced by externally rotating the tibia on the femur.19 The midsection of the
ACL is mainly viscoelastic, which provides for resistance to deformation at low
and moderate applied forces. The ends of the ligament are more neural in nature
and receive more strain during higher loads.22
Reproduced with permission of the copyright owner. Further reproduction prohibited without permission.

12
Figure 3: A) ACL B) PCL C) Synovium D) Joint Capsule (Adapted from
Netter 1994).23
Reproduced with permission of the copyright owner. Further reproduction prohibited without permission.
13
The anterior cruciate ligament’s vascularization primarily derives from the
middle genicular artery and the surrounding synovium. After it separates from
the popliteal artery, the middle genicular artery moves along the dorsal aspect of
the ACL to provide arterial branches to the ligament itself. These branches form
a vast network that is interwoven to run transversely across the ACL and form an
anastomosis with longitudinally oriented intraligamentous vessels. These
transverse branches are connected to the intraligamentous vessels at the proximal
and distal ends of the ACL, with the proximal insertions being slightly larger.
The middle genicular artery also supplies the femoral epiphysis and proximal
tibial epiphysis and then bifurcates to the right and left to supply their respective
tibial condyles. The inferior medial and lateral genicular arteries also supply
blood to the ACL. They branch from the posterior surface o f the popliteal artery
and course anteriorly. The inferior medial genicular artery passes inferior to the
medial tibial condyle and deep to the MCL. The inferior lateral genicular artery
passes proximal to the fibular head and deep to the LCL. It also brings a supply
of blood to the periphery of the lateral meniscus. Both arteries come to an
anastomosis at the infrapatellar fat pad on the posterior surface o f the patellar
ligament. Terminal branches of the inferior genicular arteries supply portions of
the ACL directly.24
Kennedy et al25 described two groups of afferent nerves that supply the
knee: 1) a posterior group of the posterior articular and obturator nerves and 2) an
anterior group o f branches from the femoral, common peroneal and saphenous
nerves. The posterior articular nerve is the major contributor, supplying
Reproduced with permission of the copyright owner. Further reproduction prohibited without permission.

14
everything from the posterior capsule to the infrapatellar fat pad, including the
menisci and cruciate ligaments. The other nerves each supply various aspects of
the joint capsule, synovium, collateral ligaments, surrounding muscles, bursae and
fat pads.
The ACL has a mechanoreceptor system that is able to respond to the
tension o f the ligament that is generated by the motion of the joint. Schutte et al26
identified three types of mechanoreceptors and free-nerve endings, including: 1)
two types of Ruffini end-organs, 2) Pacinian corpuscles and 3) free nerve-
endings. Several of the mechanoreceptors have been found to be similar to Golgi
tendon organs.23’25'27 The ACL has an extensive intraligamentous neural network.
Few receptors, however, have been reported in the deep fibrosis substance of
ligaments or menisci25 Neural fibers enter the ligament by an unmyelinated axon
through connective tissue and terminate within various receptors 26,27 The
mechanoreceptors function as transducers, in that they are able to convert physical
stimulus of tension into a specific neural signal. They provide information on
kinesthesia, or position, motion and acceleration, but not pain. Most
mechanoreceptors have been found to be closer to the insertion to the tibia and the
synovial coverings.25,26 Conversely, Schultz et al27 reported finding receptors at
both ACL insertions, with more being present at the femoral attachment. The
discovery of neural concentrations at the ACL bony attachments, along with EMG
readings, has led Solomonow et al22 to speculate that during high applied forces,
the ACL signals the hamstrings to contribute in the prevention of anterior tibial
displacement.
Reproduced with permission of the copyright owner. Further reproduction prohibited without permission.
15
The Ruffini endings are slow adapting mechanoreceptors with a low
threshold (high sensitivity) that respond to tensile changes within the ligament.
Their function is to signal when the joint is near its terminal ends of flexion and
extension. There is also a Ruffini mechanoreceptor that is similar to the pilo-
Ruffini complex associated with hair, whose function is not certain. Rapidly
adapting Pacinian corpuscles are activated by joint movement in any degree of
movement, as opposed to only the terminal ranges. They also have a low
threshold and seem to be sensitive to the speed of movement. The sensory input
to the ACL is provided by specialized receptors and free nerve-endings in the
ligament, which only make up 1% of the area of the ACL. Free nerve-endings
were identified within the collagenous fibers and are responsible for pain.26 Since
a relatively small number have been identified, this could be why the ACL is
almost insensitive to pain with isolated tears.
Etiology
The primary purpose of the ACL is to prevent anterior tibial translation of
the tibia on the femur. It also prevents hyperextension, acts as rotary stabilizer
and provides for the “screw home” mechanism in which the tibia slightly
externally rotates as the knee achieves terminal extension.19,20’28 Injuries to the
ACL can be the result of various mechanisms, such as an anterior blow to the
knee causing hyperextension on a weight bearing leg, noncontact hyperextension,
noncontact deceleration, hyperflexion and noncontact deceleration with tibial
internal rotation or femoral external rotation on a fixed tibia.19,20 The majority of
Reproduced with permission of the copyright owner. Further reproduction prohibited without permission.

16
noncontact ACL injuries involve a history of landing from a jump and planting
the foot while cutting or pivoting.10 Contact and noncontact ACL injuries
generally involve foot fixation resulting in a closed chain type of activity.
There are several other structures that aid the ACL in its preventive tasks.
The hamstrings help prevent hyperextension of the knee, while the quadriceps
muscle group aids in resisting hyperflexion. Resistance against internal rotation is
assisted by the biceps femoris muscle and via the combined effort from the tensor
fasciae latae and the iliotibial band. The menisci, the medial meniscus in
particular, aid in the reduction of anterior translation of the tibia.
There are many possible etiological factors to consider when discussing
injuries to the ACL. These are generally classified as intrinsic, extrinsic and
partially controllable. Intrinsic factors, which are not controllable, include
hormonal changes, malalignments, structural content of the ACL and other
structures in the knee. Extrinsic factors, which may be controllable, are skill and
coaching levels, experience, equipment and physical conditioning. Partially
controllable factors involve a combination of intrinsic and extrinsic measures.
They include neuromuscular actions and acquired skills.
Different authors and researchers focus on a wide variety of etiological
aspects. Gray et al,9 after conducting a survey of 76 female basketball related
injuries, postulated that position being played, prior laxity of the ligament, weak
quadriceps mechanism and hormonal fluctuations could all predispose an
individual to an ACL injury. Saunders11 also focused intrinsically on the effect of
estrogens on the cellular matrix of the ACL, the effect of the menstrual, cycle and
Reproduced with permission of the copyright owner. Further reproduction prohibited without permission.
17
the width o f the femoral intercondylar notch. Estrogens have been found to
inhibit the proliferation of human ACL fibroblasts and Type I procollagen
synthesis. Narrow femoral intercondylar notches may be disruptive, because the
smaller space may cause an increased amount of friction on the ACL causing
excessive microtears within its outer fibers. Other intrinsic factors include
alignment, hyperextension, physiologic rotary instability, ACL size, notch width
and shape, hormonal levels and inherited skill and coordination. Lower extremity
malalignments and conditions that may contribute to ACL related injuries are
excessive foot pronation, genu recurvatum, external tibial torsion effecting rotary
alignment, a quadriceps angle (Q-angle) in excess o f 15° and poor dynamic
stabilization assistance for the quadriceps and hamstrings.10,29’30 Rosene and
Fogarty31 examined differences in anterior tibial translation among the categories
o f sports, sex and leg dominance. They found females with healthy knees to have
an overall greater amount of anterior tibial translation then their male counterparts
and that there was a significant interaction between sex and forces applied
through a KT-1000 (Fu,64.93 = 8.08, P < .05). Bonci29 reported that most etiological
factors, when studied, provide inconclusive and conflicting results. It is difficult
to isolate one specific factor in multiple subjects because all other factors,
intrinsically and extrinsically, must be accounted for and equal for each subject.
Decoster et al30 found, contrary to common belief, that hypermobility did not play
a role in the predisposition of knee injuries. This contradiction to the norm
substantiates Bond’s29 statement of conflicting and inconclusive results.
Reproduced with permission of the copyright owner. Further reproduction prohibited without permission.
18
Female athletes of the past have had lower skill levels, less experience and
a lower faculty of coaching compared to their male counterparts. These
differences may, in part, account for the greater risk of injury to the female ACL.
In recent years, however, this gap regarding these extrinsic factors has narrowed.
Ireland12 examined conditions that may be a partially controllable. Strength,
conditioning, footwear, and motivation are all extrinsically controlled, while
proprioception, neuromuscular recruitment and firing patterns and acquired skills
are only partially controllable. In Ireland’s12 review, a position o f no return was
described, which relates to positioning o f the body from the back through the foot.
The back is forward flexed and rotated to the opposite side. The hips are
adducted and internally rotated while the knee is near or in full extension with a
valgus force. The tibia is externally rotated and a valgus pressure is placed on the
ankle when the medial aspect of the foot is in contact with the ground. This
position places every joint and body part, between the back and the ground, in a
manner that maximal tension on the ACL is reached and surpassed causing certain
injury.
Epidemiology
Sports where most injuries to the ACL are seen within female populations
are basketball, soccer, volleyball and cheerleading, respectively.9' 13 Gray et al7
found that 73% (n=55) of 76 basketball related injuries in women involved the
knee and 35% (n=19) of these were ruptures to the ACL. Ireland12 has taken into
consideration gender and level of play and reported on the incidents of knee
Reproduced with permission of the copyright owner. Further reproduction prohibited without permission.

19
injuries, ACL injuries, injuries requiring surgery and season ending injuries.
Overall, women experience a greater number of injuries to the knee, and more
specifically, to the ACL, when compared to men. They also seem to have more
general injuries, as well as injuries requiring surgery and season ending
injuries.9'13,32 Gwinn et al15 evaluated the relative risk of injuries to the ACL in
female and male midshipmen at the United States Naval Academy. In an
overview of varsity basketball, soccer, and rugby, coed soccer, basketball, softball
and volleyball and military training, women had a relative risk injury of 2.44
compared to men. The relative risk in women to men was 1.40 in coed sports and
9.74 during military training. Ireland’s12 studies from 1985-1993 found that
females playing basketball received almost 3 times as many injuries to the ACL
than their male counterparts and 2.3 times as many injuries in soccer. Between
1988 and 1990 in 29 schools from the Atlantic Coast, Big Ten and Pacific Ten
basketball conferences, women received over 6 times as many ACL injuries as
men. In considering 14 colleges in New Jersey and a random sampling of high
schools, the ratios for female to male were significantly higher regarding knee
injuries (Table 1). It also seems to be that females lose fewer days to knee
injuries, but more days to overall injuries. At the 1988 Olympic trials, women
had over three times as many combined knee injuries, surgeries and ACL
reconstructions, with only 2/3 of the number of participants.12
The National Collegiate Athletic Association (NCAA) noted an overall
increase in female participation of 9% from 1989 to 1992. This increase varied
for each activity. The number of soccer programs increased from 308 to 455
Reproduced with permission of the copyright owner. Further reproduction prohibited without permission.

Table 1: Ratio of Female to Male Knee Injuries at New Jersey Colleges and
High Schools (Adapted from Ireland 1999).
LEVEL/INJURY Knee ACL Surgery Season-ending ACL & season-endingNJ colleges 2.21:1 6.23:1 7.61:1 5.07:1 n/aHigh school 2.1:1 n/a n/a n/a 3.52:1
Reproduced with permission of the copyright owner. Further reproduction prohibited without permission.

(48%) between 1990 and 1995. The NCAA Injury Surveillance System (NCAA-
ISS) has shown a higher rate of ACL injuries for female basketball and soccer
athletes than in males. Non-contact mechanisms are also the primary cause of
injuries to the ACL in females. The most common histories were straight knee
landing from a jump, cutting, pivoting and sudden deceleration with a one-step
stop causing hyperextension. Untrained females have increased chance (3.7:1) of
injury during activity than trained females.12 It has been noted that proper
neuromuscular training appears to decrease the risk of injury in basketball, soccer
and volleyball. Following training modifications, there was an 89% decrease in
the rate of injury to the ACL in basketball at two Division I schools in Kansas.
Adjustments involved improving techniques with accelerated and rounded turns
off the inside leg, flexed knee landings when jumping and 3-step stops with flexed
knees.10,12 In addition to the aforementioned training modification, eccentric
hamstring strengthening has also aided in preventing ACL injuries. This allows
for a more controlled deceleration and a better counteraction to the anterior force
of the quadriceps on the tibia.10
Karageanes et al8 found there to be a significantly greater amount of ACL
laxity in the left knee than the right knee (p < .05), without regard to leg
dominance, in the follicular (.47 mm ) ovulatory (.81 mm) and luteal phases (.47
mm). They also noted that age (p > .404) and sports played (. 164 < p < .631) had
insignificant roles in the amount of ACL laxity.
Reproduced with permission of the copyright owner. Further reproduction prohibited without permission.

22
Knee Laxity Assessment
Precision and accuracy are a necessity in research when determining the
amount of laxity presented in a ligament. There are several manual ligamentous
tests that are good for on-field and clinical evaluations, as well as several means
to mechanically manipulate the ACL to determine objective measurements. The
most common manual tests for anterior laxity are the anterior drawer test,
Lachman’s test and the pivot shift test.
The drawer test (Figure 4) is conducted with the patient lying supine while
O O
the knee flexed to 90 and the hip to 45 . The examiner sits on the patient’s foot
while it is in neutral rotation, to stabilize it on the examination table. The
examiner’s hands are placed behind the gastrocnemious muscle belly and around
the tibia just below the knee joint to ensure that the hamstrings are relaxed.18,19’28
A force is applied in an anterior direction to the tibia with counter pressure
applied by the thumbs to the femoral condyles and the amount of displacement is
compared bilaterally. Anderson and Lipscomb33 found the anterior drawer test to
be effective in 20% of acute and 60% of chronic ACL injuries preoperatively
(n=50).
The Lachman test (Figure 5) also measures one-plane anterior laxity, but
is considered to be more reliable than the anterior drawer test because other
stabilizing structures o f the knee are less taut at 30°of knee flexion, which allows
for more anterior tibial translation when damage has occurred to the ACL. The
patient lies supine with the knee flexed to 30°. The examiner places the
stabilizing hand around the lower thigh just above the patella while the other hand
Reproduced with permission of the copyright owner. Further reproduction prohibited without permission.

Figure 4: Anterior drawer test for ACL instability.
Reproduced with permission of the copyright owner. Further reproduction prohibited without permission.

24
Figure 5: Lachman test for instability of the ACL.
Reproduced with permission of the copyright owner. Further reproduction prohibited without permission.

25
grasps the proximal aspect o f the tibia. An anterior force is applied to the tibiaI O I Q A O
and again the amount of displacement is compared bilaterally. ’ ’ Anderson
and Lipscomb33 found the Lachman to be effective in 91% of acute and 100% of
chronic ACL injuries preoperatively (n=50).
The pivot shift test (Figure 6), also known as the lateral pivot shift test,
assesses anterolateral instability. The patient is supine with the examiner gripping
the heel. The other hand is placed on the lateral aspect o f the tibia with the thumb
behind the fibular head. The knee is passively brought into slight flexion with the
tibia being internally rotated. At the same time the examiner pushes the proximal
tibia anteriorly while lifting the head of the fibula with the thumb. In a positive
test the lateral tibial plateau will sublux anteriorly from under the femoral
condyle. The tibia will conversely reduce when the examiner applies valgus
stress with the distal hand in a more flexed position, which is the second
indication of a positive test.18-20 There are modifications of all three manual tests
that have been developed to compensate for incompatible size ratios of examiner
to patient and poor patient positioning.
Although clinical assessments are the most common form of identifying
ACL deficiencies, subtle changes that may not be detectable by manual tests must
be noted when considering intrinsic fluctuations in laxity. There are several
mechanical devices that are capable of this task while also providing for more
objective results. This is not only helpful when conducting research, but also aids
in monitoring rehabilitation progress after surgical intervention. Some of these
include the Stryker (Stryker Corp., Kalamazoo, MI), KT-1000 and KT-2000
Reproduced with permission of the copyright owner. Further reproduction prohibited without permission.

Figure 6: Pivot shift test A) tibia subluxes in slight flexion and B) reduces as
Ovalgus stress is applied and the knee reaches 20-40 of flexion.
Reproduced with permission of the copyright owner. Further reproduction prohibited without permission.
27
(MEDmetric, San Diego, CA), Genucom Knee Analysis System (FARO Medical
Technologies Inc. Montreal, Canada) and the Knee Signature System (KSS,
Acufex, Boston, MA). All of these instruments can measure both anterior and
posterior translation of the tibia on the femur, in millimeters, with repeatable
loads applied through a spring gauge at varying degrees of flexion at the knee and
hip. It is up to the clinician to decide which one best suits the needs at hand,
based on clinician experience, device reliability and portable verses stationary
devices.
The Stryker unit consists of a bar that is applied to the anterior aspect o f
the tibia with elastic straps and rods that maintain a distance of 4 cm between the
leg and the machine. A piston at the proximal end contains a plunger, which is
attached to the patella. This portion is at a right angle to the long axis of the leg.
It is preloaded against the patella so the amount o f pressure remains the same.
Along the shaft of the device, which is in the line with the tibial tuberosity, are
“stick/slip pointers” to measure the millimeters of displacement, which remain in
position after maximal force is applied in anterior and posterior directions. This
device measures pure anterior and posterior motions and does not compensate for
the difference in anterior translation of the lateral verses the medial tibial plateaus.
Movement of the lateral tibial plateau is significantly increased, in comparison to
the medial tibial plateau, in the absence of an intact ACL. This causes the medial
portion to almost act as a fixed axis of rotation causing a value that is less than the
true reading. Single patient, bilateral variations of 2 mm or more can be observed
when considering one examiner over time (22.2%), multiple examiners (21.5%),
Reproduced with permission of the copyright owner. Further reproduction prohibited without permission.

28
between positioning at 30° and 90° (41.5 % and 35% respectively) and between 10
and 20 lbs. or 44.5 N and 89 N (14% showed greater motion at 44.5 N).34 The
Stryker unit has been shown to incorrectly diagnose ACL tears and present false
positives (+) in 10% of normal knees and correctly identify 72% of knees with
isolated ACL tears.33
The KT-1000 and KT-2000 (Figure 1) knee arthrometers are applied to the
anterior aspect of the tibia, while the patient is supine, so they are parallel to the
line of the tibial tuberosity. Two straps are applied at the proximal and distal ends
of the tibia at points to allow for alignment with the tibiofemoral joint line as
indicated on the devices and so that the patellar sensor remains in a position over
the patella. A thigh support is placed under the distal femur, to cause the resulting
position of the knee to be at 20-30° of flexion. Tibial rotation is at a neutral
position and controlled for with a foot support and a third strap being placed
around the thighs. Pressure is applied to the patellar sensor pad and maintained at
a constant level throughout the use of the device. Force is given in either an
anterior or a posterior direction with applied forces equaling 15,20 and 30 lbs. or
67, 89 and 133 N, respectively. This is indicated by audible tones at each level.
The KT-2000 also produces tones when these forces are produced anteriorly, but
because it also contains an X-Y plotter (Figure 7), displacement can be measured
at any amount o f force since the readings are recorded on the Patient Evaluation
Form (Figure 8). This added characteristic also increases the amount of accuracy
and reliability because it allows for a more exact comparison of the millimeters of
Reproduced with permission of the copyright owner. Further reproduction prohibited without permission.

Figure 7: X-Y plotter attachment for the KT-2000 (Adapted from
MEDmetric Buyers’ Guide 1995).16
Reproduced with permission of the copyright owner. Further reproduction prohibited without permission.

KT2000™ Knee Ligament ARTHROMEITER11 Patient Evaluation Form
a 35DC
l ^25
20
15
Q 10
£ 05
10
5 15
§ 20
25
LEFTKNEE
- T 1 , 1 "I
__i__1 '1' T 1‘ ' "T T i _r “T T * I ” 1; i1
; |-
- i -
- z E■ ( -
** -
I i ; -
T J
_ : i _
, 1 4. .1. 1 1 1 1 |-
- I . ’1 i l r t * r n —y T - p *+ r r
-
- j ■ i (z
ri
= E ii z
z■
- j -
-j j
5 E !t
i ”r>nrt>TC *+■ PM w rt I a ■Mem*eMam■ m l
i -L j i 4_ J t J MnMkMraronylunM J - _L. i t i j ltotflUMnuntneta»n«MILUMETERSOFDtSPLACBMENT mGHrKNEE
Figure 8: KT-2000 knee ligament arthrometer patient evaluation form
(MEDmetric Corporation).
Reproduced with permission of the copyright owner. Further reproduction prohibited without permission.

31
displacement to the pounds of force applied. Reliability of both devices has been
found to be dependent on experience in using the device, knee positioning,
relaxation of the hamstrings and proper application. It is also recommended that
repeated measures be taken during each use to confirm intratester reliability.35,36
Tibial rotation will adversely affect readings produced by this arthrometer.
Fiebert et til37 found significant a difference (p < .0001) to exist between internal
rotation (3.415 ± 1.827 mm) and both a neutral position (4.607 ± 2.124 mm) and
external rotation (4.548 + 2.269 mm) o f the tibia. They also found intratester
reliability of high (r = .90) for tester 1 and good (r = .86) for tester 2. Intertester
reliability between the two was poor (r = .64). Intertester reliability was reduced
with less amounts of experience in using these machines. The KT-1000 has been
found to be reliable in that it allows for the production of consistent measures
(mean error = .13 + .12 mm).35 Intratester reliability ranges average from .87 to
.97, with reliability between males and females, regardless of experience level,
ranging from .77 to .88. Examiner experience reliability levels range from .12 to
.78, with measurement errors between 1 mm and 2.2 mm, indicating poor
intertester reliability.36 The KT-1000 has been found to correctly identify all
normal ACLs and 76% of those with an isolated tear.33 The KT-2000 has
demonstrated small estimates of absolute reliability (95% confidence intervals),
indicating little variability (high reliability) among multiple testing sessions.38
The correlation coefficient between the KT-2000 readings and the direct
transducer readings has been reported as .97 ± .44 mm.
Reproduced with permission of the copyright owner. Further reproduction prohibited without permission.

32
The Genucom Knee Analysis System combines a computer, a
biomechanical digitizer, an electrogoniometer, a dynamometer and an inkjet
printer. It allows for testing analysis of total knee stability, including: anterior-
posterior, valgus-varus, pivot shift and recurvatum.40 No literature could be found
on the set up or application of this device, although the manufacturers do offer a
testing certification program. Several studies reported on its overall effectiveness,
including Anderson and Lipscomb33 who found that for anterior displacement it
misdiagnosed 10% of normal knees as having ACL tears and correctly diagnosed
72% of those with isolated tears to have the same specificity and sensitivity,
respectively, as the Stryker unit, but only found an average laxity o f 2 mm, as
opposed to the KT-1000 and Stryker unit, which produced 4.4 mm and 4.6 mm of
displacement, respectively, all at 20 lbs of force. Conversely, Highgenboten et
al,40 found the Genucom (93.45 N) to produce laxity values significantly higher
than the Stryker (89 N) and KT-1000 (89 N). Steiner et al41 also found the
Genucom to produce higher displacement values at 89 and 133 N of force than the
Stryker, KT-1000 and Acufex and also noted that the Genucom did not allow for
reproducible measurements.
The Acufex KSS can be used in conjunction with a Hall effect transducer,
which is implanted arthroscopically within the knee itself. An electrogoniometer
provides a constant measure o f flexion/extension and internal/external rotation of
the knee. Anterior-posterior loads are used and monitored by a load sensor that is
located on a T-bar attached to the distal aspect of the tibia. Information from a
Hall effect transducer, electrogoniometer, anterior-posterior load and extension-
Reproduced with permission of the copyright owner. Further reproduction prohibited without permission.
33
flexion load sensors can be used in compliment to transfer the physical results to a
data acquisition board (Tecmar, Cleveland, OH) to be converted to a digital
frequency of 20 Hz.42 Steiner et al41 found the Acufex could be used to identify
80% to 90% of normal and ACL deficient knees and could give reproducible
measures.
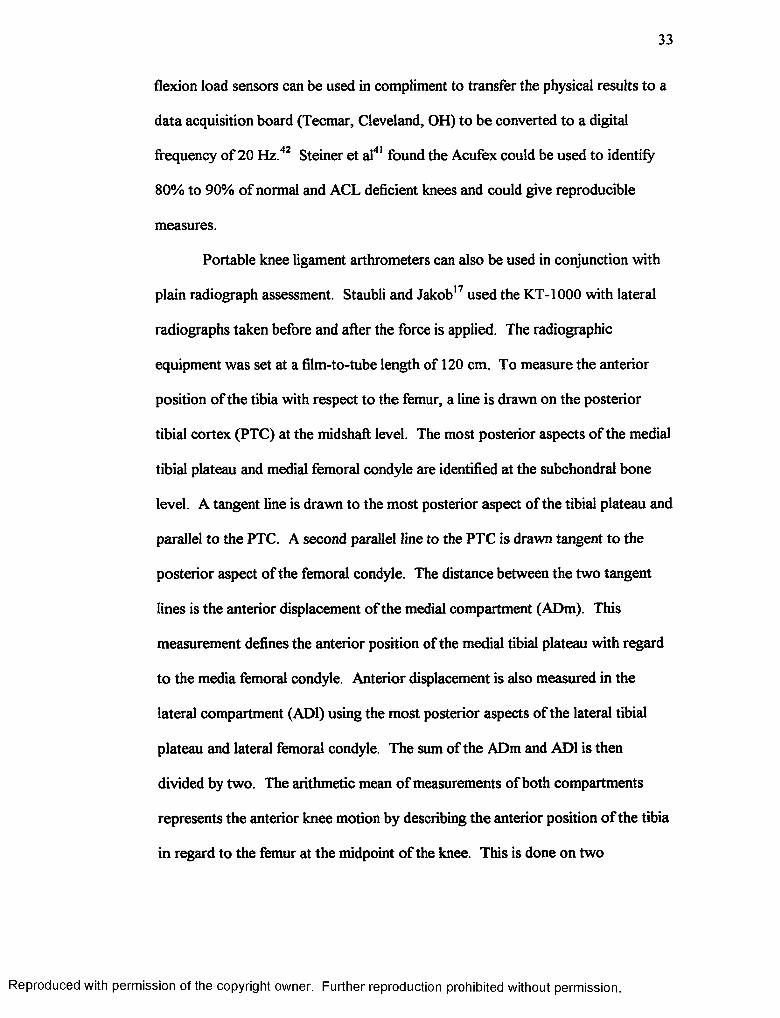
Portable knee ligament arthrometers can also be used in conjunction with
plain radiograph assessment. Staubli and Jakob17 used the KT-1000 with lateral
radiographs taken before and after the force is applied. The radiographic
equipment was set at a film-to-tube length of 120 cm. To measure the anterior
position of the tibia with respect to the femur, a line is drawn on the posterior
tibial cortex (PTC) at the midshaft level. The most posterior aspects of the medial
tibial plateau and medial femoral condyle are identified at the subchondral bone
level. A tangent line is drawn to the most posterior aspect of the tibial plateau and
parallel to the PTC. A second parallel line to the PTC is drawn tangent to the
posterior aspect of the femoral condyle. The distance between the two tangent
lines is the anterior displacement of the medial compartment (ADm). This
measurement defines the anterior position of the medial tibial plateau with regard
to the media femoral condyle. Anterior displacement is also measured in the
lateral compartment (ADI) using the most posterior aspects of the lateral tibial
plateau and lateral femoral condyle. The sum of the ADm and ADI is then
divided by two. The arithmetic mean of measurements of both compartments
represents the anterior knee motion by describing the anterior position of the tibia
in regard to the femur at the midpoint o f the knee. This is done on two
Reproduced with permission of the copyright owner. Further reproduction prohibited without permission.
34
radiographs. Then the amount of displacement for a film with no applied force is
subtracted from the amount of displacement for a film with the known load being
applied to obtain a reading for the actual millimeters of displacement (Figure 2).
This technique is only possible if the knee arthrometer being used is portable. It
should not be used to monitor rehabilitation progress due to the amount of
radiation exposure, but is an excellent means of tracking laxity over time.
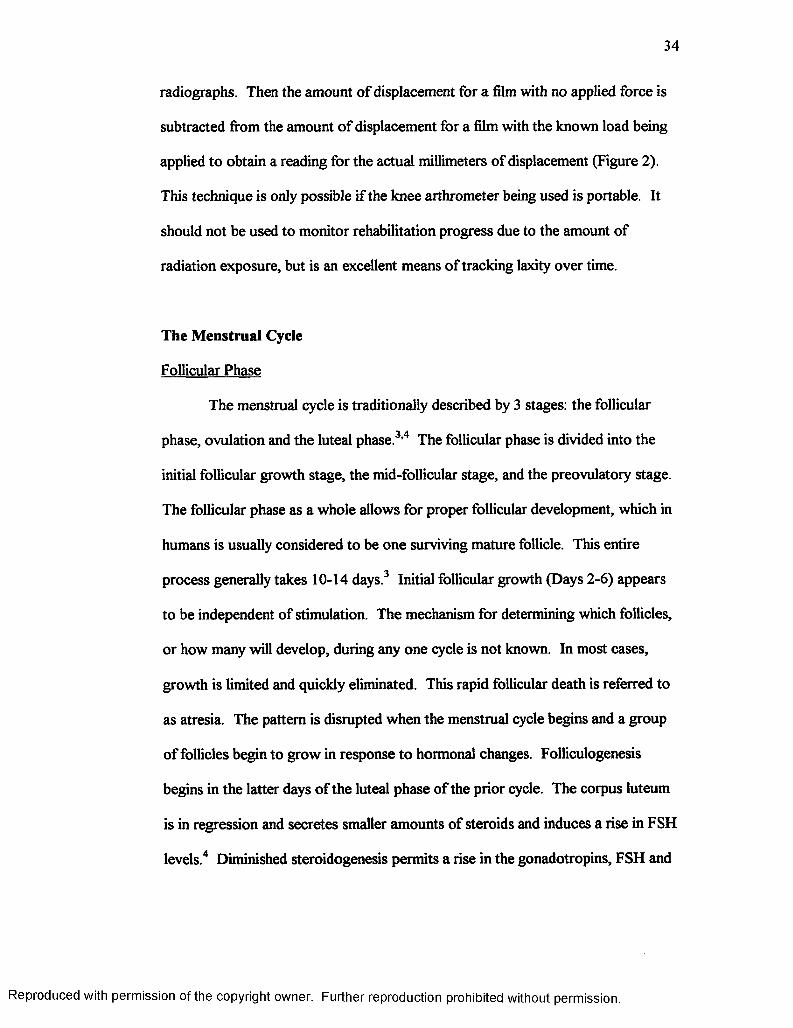
The Menstrual Cycle
Follicular Phase
The menstrual cycle is traditionally described by 3 stages: the follicular
phase, ovulation and the luteal phase.3,4 The follicular phase is divided into the
initial follicular growth stage, the mid-follicular stage, and the preovulatory stage.
The follicular phase as a whole allows for proper follicular development, which in
humans is usually considered to be one surviving mature follicle. This entire
process generally takes 10-14 days.3 Initial follicular growth (Days 2-6) appears
to be independent of stimulation. The mechanism for determining which follicles,
or how many will develop, during any one cycle is not known. In most cases,
growth is limited and quickly eliminated. This rapid follicular death is referred to
as atresia. The pattern is disrupted when the menstrual cycle begins and a group
of follicles begin to grow in response to hormonal changes. Folliculogenesis
begins in the latter days of the luteal phase of the prior cycle. The corpus luteum
is in regression and secretes smaller amounts of steroids and induces a rise in FSH
levels 4 Diminished steroidogenesis permits a rise in the gonadotropins, FSH and
Reproduced with permission of the copyright owner. Further reproduction prohibited without permission.

35
LH. Initially, only FSH is found in the fluid of smaller follicles. It is simpler to
think of FSH as the gonadotropin responsible for growth, while LH stimulates
steroidogenesis. FSH receptors are limited to the granulosa cells of the ovary
where FSH may contribute to steroidogenesis by stimulation of the aromatizing
system within the cells. However, growth and steroidogenesis depend upon the
cooperation of FSH, LH and estradiol. In terms of steroidogenesis, the role of
FSH is to increase the activity and number of LH receptors. During this stage,
there is almost no detectable change in plasma levels o f gonadal hormones. A
rise in LH occurs, but its only function at this point is to maintain smaller amounts
of steroidogenesis.3 The eventual targets for LH are thecal, stromal, luteal and
granulosa cells.4 Initial follicular growth ends when an increase in plasma
estrogen first becomes detectable 7-8 days before the preovulatory surge of LH
that signifies ovulation.3
In the mid-follicular stage (Days 7-10), estradiol, and FSH itself, enhance
the number of FSH receptors. This increase in the number of gonadotropin
receptors is the result of continued follicular maturation and increased estradiol
levels. This continued growth is the result of an increased use of gonadotropins.
This is not because more FSH is being produced, rather there is an increased
ability to respond. There are now more FSH receptors available, because the
granulosa cells they are attached to are in more abundance.4 Estradiol increases
may stimulate granulosa cell proliferation by increasing the ovarian uptake of
FSH. This increased action of estradiol and FSH also allows them to act together
to prepare follicles to react to LH surges during ovulation and luteinization. This
Reproduced with permission of the copyright owner. Further reproduction prohibited without permission.

36
sequence has 5 steps that are important: 1) initial follicular growth, 2) FSH
stimulation into the mid-follicular stage, 3) estradiol production, increasing the
sensitivity to FSH by enhancing FSH action, 4) FSH induction of LH receptors
that is enhanced by estradiol and 5) thecal cell differentiation causing even greater
amount of estradiol to be produced.3
Estradiol interacts with both FSH and LH. As estradiol levels increase LH
is initially suppressed, but as estradiol levels continue to rise FSH becomes
inhibited. Estradiol levels still rise, but now the secretion o f LH is promoted
(Figure 9). These hormonal fluctuations are essentially feedback mechanisms.
FSH reacts negatively to estrogens, yet estradiol increases the number of FSH
receptors. LH has a negative response to low levels of estrogen, but as estrogens
increase, so do the levels of LH. This positive interaction is seen during the
follicular and ovulatory phases. LH is suppressed during the luteal phase by
progesterone. The positive feedback is dependent on the concentration of
estradiol and the duration of time for which its levels are elevated. The negative
feedback mechanism consists o f 2 components: 1) a system within the
hypothalamus involving the tonic center and 2) a modulating system controlling
the response of the pituitary to GriRH 3,4 Rapid increases in estradiol inhibit the
pituitary’s response to GnRH, but moderate elevation of estradiol enhances its
response (Figure 10)3
In the preovulatory phase (Days 10-14), or the late follicular phase,
estrogens rise moderately and then spike quickly just before ovulation. At the
same time, there is a decrease in FSH, but LH also rises slowly at first and quickly
Reproduced with permission of the copyright owner. Further reproduction prohibited without permission.
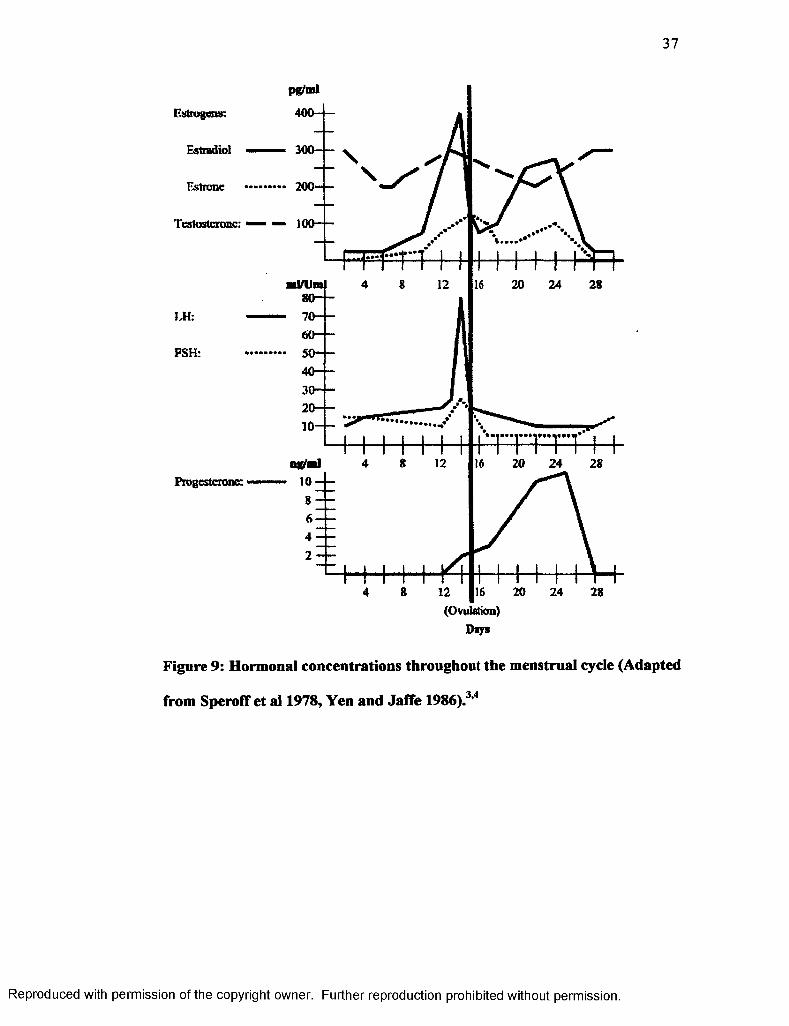
37
300----
200~ —Estrone
100— —Testosterone:
LH:
FSH:
Progesterone:
24
Days
Figure 9: Hormonal concentrations throughout the menstrual cycle (Adapted
from SperofT et al 1978, Yen and Jaffe 1986).3’4
Reproduced with permission of the copyright owner. Further reproduction prohibited without permission.
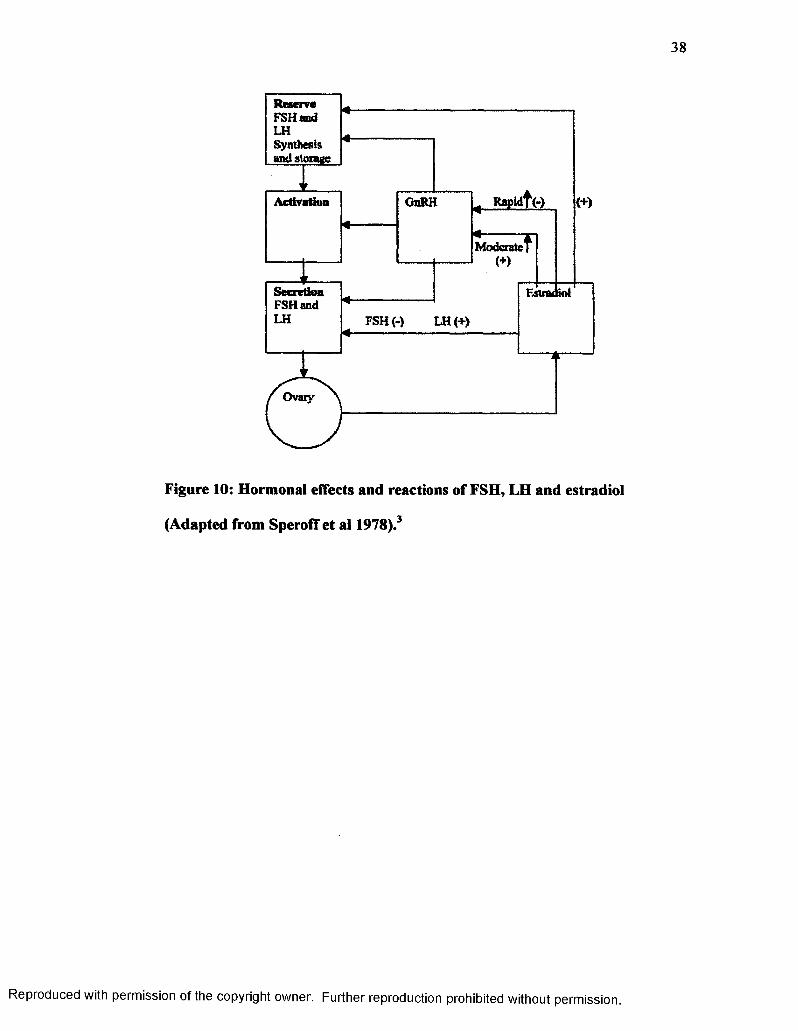
38
FSH (-) LH (+)
Ovary
Figure 10: Hormonal effects and reactions of FSH, LH and estradiol
(Adapted from SperofT et al 1978).3
Reproduced with permission of the copyright owner. Further reproduction prohibited without permission.

39
peaks at midcycle, immediately after the estrogens peak (Figure 9). The follicle
grows rapidly now as FSH levels are still diminished. This indicates that as the
follicle matures, it becomes increasingly sensitive to FSH. The follicle is able to
protect itself from premature atresia by producing its own hormones of highly
localized estradiol concentrations, which increases the follicles sensitivity to FSH,
encouraging follicular binding to FSH. The FSH concentration remains high in
the follicles where estradiol still has concentrations of 5000 pg/ml, but the
circulating levels of FSH still decrease due to the overall negative feedback from
estradiol. This is the reason that a mass of atresia is seen as estrogen levels rise.
Luteinizing hormone is not detectable in follicular fluid until luteinization begins
in the granulosa cells 24-36 hours before peak LH levels. Luteinization is the
process in which the granulosa-thecal cell complex is transformed into luteal
cells. These luteal cells have an increased number of LH receptors and the
capacity for progesterone biosynthesis.4 This increase in the number of LH
receptors is a response caused by FSH and estradiol. The overall result is a high
concentration of progesterone in preovulatory follicles. While follicular growth is
occurring, stromal cells are organized into a thecal layer where LH will bind to
promote steroidogenesis. The stromal cells are the primary source of estradiol
before ovulation. Most estradiol at midcycle is produced by the follicle that is
going to ovulate. Mass atresia will occur when all o f the other follicles fail to
reach full maturity. This is accompanied by a decrease in the number of receptors
for FSH, LH and estradiol. At this time, thecal cells return as a component of
stromal tissue, but keep the ability to react to LH for steroid production. Principal
Reproduced with permission of the copyright owner. Further reproduction prohibited without permission.

40
stromal products are androgens rather than estrogens, namely androstenedione
and testosterone. This redistribution into the stromal tissue during the late
follicular phase is accompanied by a rise in androgen levels in the peripheral
plasma, specifically the 20% increase of testosterone levels. The production of
androgen enhances the process of atresia and stimulates the libido. Androgens
within the ovary regulate the number follicles that reach ovulation by accelerating
granulosa death and follicle atresia.3
Ovulation
The rise in estradiol in the late follicular phase is most likely the reason for
the surge of the gonadotropic hormone LH. The hypothalamus responds by
releasing GnRH. Androgens are thought to prevent this when at elevated levels
by suppressing the function of the cyclic center that produces GnRH. There are
two requirements for an LH surge at midcycle: 1) a minimal estradiol
concentration o f 2 0 0 pg/ml and 2 ) an exposure of the cyclic center to estradiol for
approximately 50 hours.3 Luteinizing hormone levels will surge prior to the
withdrawal of estrogens. At this time, there is a simultaneous incline in the FSH
due to the release of GnRH (Figure 10). Follicle-stimulating hormone may be
required for the production of a normal corpus luteum, because FSH induces LH
receptors, which in turn allow LH to begin the process of ovulation and
luteinization in the corpus luteum.3,4 At midcycle there are high levels o f
estradiol and slightly elevated levels of progesterone that are responsible for the
surge of LH. The hypothalamus and pituitary gland must both respond to GnRH
for the release of FSH and LH. There is also a small increase in progesterone
Reproduced with permission of the copyright owner. Further reproduction prohibited without permission.

41
levels during the ovulatory period that is probably due to a small rise in LH and
luteinization. Progesterone then has a positive feedback in that it will enhance the
release of gonadotropins. LH specifically, however, seems to be inhibited at the
hypothalamus by the combination of progesterone and estrogens. The elevated
levels of LH last about 24 hours and decrease during the luteal phase (Figure 9).
Release of gonadotropins is not consistent. It is an episodic release by the
pituitary, mostly of LH. There is no known mechanism for what then shuts down
the surge of LH, but within hours there is a decrease in plasma estrogens. This is
thought to be secondary to the luteinization of the follicle. This change is said to
be associated with a shift o f estrogens secreting thecal dominance to a dominance
of progesterone secreting granulosa cells. The rapid decline in LH may represent
a lack of its content in the pituitary gland, which demonstrates a negative
feedback upon the hypothalamus. The LH surge, however, does not guarantee
ovulation. This is dependant on the maturity level of the follicle itself. These two
events, however, do coincide since the gonadotropins are regulated at this point
by estradiol. After 24 hours from the time LH has peaked, the follicle, which is
most likely single, will rupture. Degenerative changes in the collagen of the
follicular wall occur, due to passive stretching prior to ovulation, allowing the
ovum to escape. The increased blood flow that goes along with vascularization of
the granulosa layer in response to LH causes an increase in the clearance of blood
constituents from the capillary walls and passage into the antrum. Elasticity
reaches minimal levels so there is no change in pressure when ovulation occurs.
Reproduced with permission of the copyright owner. Further reproduction prohibited without permission.

42
The follicular wall will rupture, because of the increase in the volume o f the
antrum.3
Luteal Phase
Once the follicle has ruptured and the ovum is released, the granulosa cells
will increase in size for three days after ovulation and develop characteristics of
lutein. This is the process of luteinization and the formation of the corpus luteum.
Capillaries penetrate the granulosa layer and fill the central cavity with blood.
Peak vascularization is reached 8-9 days after ovulation and is accompanied by
peak levels o f estradiol and progesterone. The corpus luteum is able to synthesize
all three classes of sex steroids: androgens, estrogens and progestins. A plasma
level of at least 3 ng/ml is a reliable determinant of ovulation. Ten to 12 days
following ovulation, the corpus luteum begins to regress. This is seen through a
gradual decrease o f blood in the capillaries followed by a decrease in the amount
of progesterone that is secreted. Large follicles begin to appear in the ovary
again. Their presence is most likely because of the surge in FSH at midcycle, but
there is no growth at this time since levels are still diminished. Fourteen days is
the normal time frame between the midcycle surge of LH and menses, but varies
among individuals. LH and FSH fall to their lowest levels during the luteal phase
when estradiol and progesterone are at maximal levels, due to the negative
feedback mechanisms of these steroids when they are combined (Figure 9). A
normal corpus luteum requires the constant presence o f minimal LH to function
properly, confirming that steroidogenesis is impossible without LH. The corpus
Reproduced with permission of the copyright owner. Further reproduction prohibited without permission.

43
luteum abruptly declines 9-11 days after ovulation, and is termed luteolysis, but
the reason for this occurrence is not known. The 3-4 days before the onset of
menses a decline in estrogen and progesterone will accompany the sudden demise
of the corpus luteum causing another increase in FSH and LH concentrations.4
This degeneration is unavoidable unless the individual becomes pregnant. A short
luteal phase has been considered the possible cause for infertility. The short luteal
phase has certain characteristics: low secretion of progesterone, early regression
of the corpus luteum, with menses occurring 6-9 days after peak LH levels and
increased circulating aldosterone.3
SperofF et al3 identified five characteristics that are key points to a normal
menstrual cycle. These include 1) the beginning of the cycle is initiated by a rise
in FSH which occurs in response to the decline in estradiol in the preceding luteal
phase, 2) estradiol maintains follicular sensitivity to FSH by inducing FSH
receptors, 3) estradiol enhances follicular response to LH by working
synergistically with FSH to induce LH receptors, 4) ovulation is triggered by the
rapid rise in estradiol and LH at midcycle and 5) regression of the corpus luteum
may depend on its own production of estradiol and a local luteolytic effect.
There are significant differences regarding hormonal releases and
concentrations during a pregnancy. Instead of tracking a general sequence of
changes over a 4-5 week menstrual cycle, a hormonal fluctuation pattern is now
monitored throughout the duration of the approximate 9 months of pregnancy. At
the onset o f menstruation, most of the endometrium of the uterus moves away
from the uterine wall and is expelled. If this were to happen after an ovum had
Reproduced with permission of the copyright owner. Further reproduction prohibited without permission.
44
implanted itself the pregnancy would be terminated. This is prevented by the
secretion of human chorionic gonadotropin (HCG). This increased secretion of
HCG begins 8-9 days after ovulation and continues until it peaks between 10-12
weeks. At weeks 16-20, the level of secretion decreases and maintains a level that
is slightly elevated from the period before the initial increase. It remains at this
concentration throughout the duration of the rest of the pregnancy (Figure 11).
HCG is similar to LH in structure. It prevents the normal usage of the
corpus luteum at the end o f the cycle. It also causes increased secretion of
estrogens and progesterone. This increase in estrogens and progesterone prevents
menstruation and causes the endometrium to continue to grow and store nutrients.
HCG also exerts an interstitial cell-stimulating effect on the testes resulting in the
production of testosterone in males up until the point of childbirth. This small
production of testosterone is what causes the growth on male sex organs and not
female sex organs. It also causes the testes to descend into the scrotum near the
end of the pregnancy.
During pregnancy, the placenta secretes estrogens and progesterone.
Daily production of placental estrogens increases by 30 times the normal amount
by the end of pregnancy. Most of the estrogens released in this manner is estriol.
During pregnancy, estrogens cause 1) enlargement of the uterus, 2) enlargement
of the breasts and growth of the ductal structure and 3) enlargement of the
external genitalia. Estrogens also relax the pelvic ligaments so the sacroiliac
joints and symphysis pubis become more elastic in nature. The rate of production
for progesterone production increases 1 0 times above normal by the end of
Reproduced with permission of the copyright owner. Further reproduction prohibited without permission.

45
HCG(lu/ml)
Estrogens _ _ _(mg/24 hr Progesterone estradiol (mg/24 hr)
120
100
• / “ %
40
20
WeeksOvulation
300
200
100
Figure 11: Hormonal concentrations throughout a pregnancy. (Adapted
from Guyton and Hall, 1996).'43
Reproduced with permission of the copyright owner. Further reproduction prohibited without permission.
46
pregnancy. During pregnancy, progesterone 1) causes decidual cells to develop
which provide nutrition to the embryo, 2 ) decreases the contractility of the uterus
to prevent contractions from causing a spontaneous abortion, 3) increases the
secretion from the fallopian tubes to provide appropriate nutrition and 4) helps
estrogens to prepare the breasts for lactation. LH and FSH are almost completely
suppressed by the increased levels of estrogens and progesterone produced by the
placenta. This prevents the preovulatory surge of LH throughout the pregnancy
that would occur during a normal menstrual cycle.43
Hormonal Characteristics
Estrogens
Estrogens are composed of a group of sex steroids secreted by the ovaries,
adrenal cortex and fetoplacental unit in women. They are responsible for the
development of several female sex characteristics and for normal menstruation.
During the menstrual cycle, estrogens allow the female genital tract to become
more suitable for fertilization, implantation and nutrition of the early embryo.44 It
has a negative effect on FSH in that when estrogens’ levels are elevated, FSH
production becomes diminished. The average concentration in the blood stream
during each phase of a normal menstrual cycle are: 1 ) 1 - 1 0 days range from 60-
400 pg/ml, 2) 11-20 days range from 120-440 pg/ml and 3) 21-30 days range
from 150-350 pg/ml.3’4’43’44
Reproduced with permission of the copyright owner. Further reproduction prohibited without permission.
47
Progesterone
Progesterone is essential for the female reproductive system to function
properly. It is produced at various times and locations. During the second half of
the menstrual cycle it is produced in the ovaries, as opposed to the placenta during
pregnancy. Smaller amounts also come from the adrenal glands. After
ovulation, an increase in progesterone levels has been noted to cause a thickening
of the uterine lining in order to prepare for the implantation of a fertilized egg. If
this does not occur then progesterone and estrogens levels decrease and the
uterine lining is shed.44 The combined effect of progesterone and estrogens is the
inhibition of FSH and LH production. The standard range for progesterone is
0.15-80 ng/ml with ranges of 0.2 - 0.9 during the follicular phase and 3-35 ng/ml
during the luteal phase. 3,4,43,44
Luteinizing Hormone
Luteinizing hormone is produced by the pituitary gland in response to
FSH and estradiol in various amounts throughout the menstrual cycle. In females,
LH acts with FSH to stimulate the follicle growing within the ovary to secrete
estrogens. High levels of estrogens in turn cause a surge in LH to stimulate
ovulation. LH then induces the ruptured follicle to development into the corpus
luteum. The corpus luteum then secretes estrogens and progesterone.44 The
standard range for LH is 2.5-200 mlU/ml with levels normally between 2-20
mlU/ml, and elevating to 30-200 mlU/ml at midcycle. 3’4’43>44
Reproduced with permission of the copyright owner. Further reproduction prohibited without permission.
48
Follicle-Stimulating Hormone
Follicle-stimulating hormone is a gonadotropin that stimulates the growth
and development of the follicles in the ovary. It is secreted by the anterior
pituitary gland. The hypothalamus, however, controls the release of FSH by
regulating the amount of FSH-releasing factor that is produced. FSH, along with
estradiol increases the availability of FSH receptors and LH concentrations prior
to ovulation. Increased amounts of FSH are released at the end of the luteal phase
of the menstrual cycle, which causes an immature follicle to develop into a mature
grafian follicle that in turn produces estrogen at higher levels before ovulation
begins. This surge of estrogens will suppress FSH until the mid-luteal phase
when follicles begin to develop for the following cycle.44 The concentration for
FSH varies from 2.5-200 mlU/ml. Average levels throughout the menstrual cycle
include: 1) the follicular phase from 2.5-15 mlU/ml, 2) the midcycle from 12-50
mlU/ml, 3) the luteal phase from 2.5-15 mlU/ml. 3’4’43 44
Estradiol
The menstrual cycle is mainly dependent upon critical adjustments of
estradiol at specific points in time. It is the most potent naturally occurring
estrogen in the human body. Its key roles include: 1) declining in levels during
the luteal phase to allow for elevated FSH concentration in the following cycle, 2)
maintaining follicular sensitivity to FSH by inducing FSH receptors, 3) enhancing
follicular response to LH by working synergistically with FSH to induce LH
receptors, 4) increased levels at midcycle to induce ovulation and 5) regression of
the corpus luteum through its own production of estradiol.3 The standard
Reproduced with permission of the copyright owner. Further reproduction prohibited without permission.

49
concentration ranges from 10-3000 pg/ml. In ovulating females, this ranges from
40-500 pg/ml in the follicular phase, 200-600 pg/ml at midcycle and 120-350
pg/ml in the luteal phase. 3,4,43,44
Testosterone
Testosterone is the most important of the male sex hormones, but it is still
present in the female endocrine system. It is responsible for stimulating bone and
muscle growth and sexual development. It is an androgen produced in small
amounts by the ovaries. If overproduction o f testosterone occurs in a female,
masculinization symptoms, which include amenorrhea, voice deepening, and
excessive growth of body hair, will occur.44 During the redistribution of the
stromal tissue in the late follicular phase, a rise in testosterone levels in the
peripheral plasma occurs. The production of the androgen enhances the process
of follicular atresia and stimulates the libido. Androgens within the ovary
regulate the number follicles that reach ovulation by accelerating granulosa death
and follicle atresia.3 The average concentrations for testosterone during the
follicular and luteal phases are 0.2 - 0.8 ng/ml. The range may be higher at
midcycle. 3,4,43,44
Phlebotomy
Phlebotomy is the act of drawing or removing blood from the circulatory
system through a cut (incision) or puncture in order to obtain a sample for
analysis and diagnosis. It can also be done as part o f a patient’s treatment for
certain blood disorders 45 The entire process requires little equipment: a vacuum-
Reproduced with permission of the copyright owner. Further reproduction prohibited without permission.

50
tube adapter and needle with protective device, alcohol and povidine-iodine
swabs, tourniquet, gloves, gauze pads and an adhesive bandage.46 Blood is
usually drawn from a vein on the back of the hand or at the anterior aspect of the
elbow. Other blood tests require samples from an artery. The skin over the
injection site is wiped with an antiseptic and an elastic band is tied around the arm
proximal to the site. The band acts as a tourniquet to slow the blood flow to the
arm and increase the visibility of the veins. The patient makes a fist in order to
again increase the visibility o f the veins and allow the phlebotomist to select an
appropriate site. The needle is inserted into the chosen vein and the elastic band
is removed. Once the appropriate amount of blood is drawn the needle is
removed.45 The patient should always be in a seated position when conducting
the procedure.46
When testing requires a smaller amount of blood, the technician can use a
finger stick instead. A small needle, or lance, is used to break the skin o f the
surface of the fingertip. The finger can be squeezed to obtain a slightly larger
sample.45
Patients are usually instructed to cease the use of medication or avoid
eating for a designated length of time prior to the sample being draw. Exercise
and physical activity may also affect the results of blood tests. After the blood
has been drawn, pressure is applied to the site to stop the bleeding and a bandage
is applied. Side effects may include dizziness or nausea, which is why it is
important to be seated during the procedure. To avoid this occurrence, patients
are instructed to rest for a short period o f time following the procedure and to
Reproduced with permission of the copyright owner. Further reproduction prohibited without permission.

51
drink plenty of fluids and eat regularly for the following 24 hours to replenish the
blood volume. A small bruise and mild soreness are also possible for several
days. Infection is a risk as with any invasive procedure, but can be minimized
through the use of sterile equipment and proper cleansing of the sample site.
Ligamentous Laxity and Menstrual Cycle Associations
Many studies in the past have suggested the further investigation of the
possible relevance of hormonal fluctuations to peripheral ligamentous laxity and
more specifically ACL injuries. 1,2,8,47 Given that the elevated levels of relaxin,
produced with pregnancy and labor, allow for increased ligamentous laxity of the
pelvis to permit a large enough birth canal for a newborn child,8,43,47 leads to the
hypothesis that there may be other hormones capable of the same laxity inducing
characteristics in peripheral locations. Serum relaxin levels have been found to
have no peripheral effects on laxity during pregnancy. There have been
demonstrated statistically significant changes in knee joint laxity over time (p =
.0001). There have also been statistically significant elevations of relaxin levels
over time (p < .0001). However, there has been no statistically significant
correlation reported between joint laxity and relaxin.47 Since there is no
correlation between these two characteristics, there may be a correlation involving
one or more other hormonal variations, which could explain the changes that have
been observed in knee laxity.
Wojtys et al1 conducted a survey reporting on the occurrence of ACL
injuries in correspondence with the phases of the menstrual cycle. They found
Reproduced with permission of the copyright owner. Further reproduction prohibited without permission.
52
more injuries were reported as happening in the ovulatory phase, from days 1 0 to
14, than were expected and less injuries than expected occurred during the
follicular phase, days 1-9. This is about the same time that estrogens, LH, FSH
and estradiol reach peak levels and progesterone and testosterone levels begin to
rise slightly. According to McShane et al,48 this finding was not statistically
significant, but Wojyts49still observed that there was at least a trend that had
occurred to suggest further investigation.
Heitz et al2 reported the menstrual cycle as being divided into three
phases: 1) menstrual phase (days 1-5), 2) follicular phase (days 6-13) and 3) luteal
phase (day 15 to end of cycle). The menstrual phase is the approximate five days
of menses caused by a reduction in estrogens and progesterone. The follicular
phase is responsible for the developing follicle so it can secrete increased amounts
of estrogens, which are the dominant ovarian hormones throughout this phase.
The luteal phase is the time from ovulation to the next menses. LH is secreted
after ovulation to stimulate the developing corpus luteum, which in turn secretes
increased amounts of estrogens, progesterone and relaxin. The greatest amount of
ACL laxity was noted, and had a significant difference (Fi,6 = 13.41, p =.006),
during the luteal phase, between days 20 and 23, with an increased amount of
progesterone. A significant difference (Fi,6 = 3.56, p = .048) was also observed
with peak levels of estrogens during days 1 0 through 13 of the follicular phase.2
Karageanes et al8 tracked ACL laxity during the menstrual cycle for both
knees in adolescent female athletes. Their findings suggested that there is no
specific “time of the month” when females are more likely to sustain an injury to
Reproduced with permission of the copyright owner. Further reproduction prohibited without permission.

53
the ACL due to changes in laxity. The findings over the course of all 3 phases
showed insignificant differences in ACL laxity for the right (p = .7977) and left
knees (p = .9).
Estrogens and progesterone receptors have been reported as being present
in normal connective tissue.50 In rat studies, estrogens have been shown to
decrease the total collagen content in tendon and fascia and the amount of
collagen synthesis. For this reason, there is the assumption that estrogens may
affect the collagen production of fibroblasts and the tensile strength of the ACL. 50
Guyton and Hall43 report that, in women, relaxin serves to soften the cervix at the
time of delivery. They also stated that relaxin has been shown to play a role in
relaxing the ligament of the symphysis pubis in estrous rats and guinea pigs, but
has a poor effect in women. In human females, the relaxing effects are more
likely to be from the release of estrogens 43 A study, using the ACL of rabbits,
found collagen levels to be significantly decreased when local estradiol levels
were elevated (p < .001). Collagen synthesis decreased by more than 40%.
Fibroblast proliferation was also reduced as estradiol increased (p = .023).
Collagen, produced by fibroblasts, provides for the majority of the ACL’s load-
bearing function. Changes in the metabolism of the fibroblasts can have an effect
on the quantity, type and stability o f collagen in the ACL. These changes may be
caused by local stimuli, growth factors, mechanical strain or hormones. 50 Lui et
al50 also reported, that while there are several studies that have investigated the
effects estrogens may have on collagen metabolism in various tissues, ligaments
themselves have not been the source of investigation. Comprehensive or quick
Reproduced with permission of the copyright owner. Further reproduction prohibited without permission.

54
fluctuations in serum estrogens may result in structural or compositional changes
in the ACL, causing decreased ligamentous strength and stability, which would
predispose an individual to injury. The ability to perform motor skills may also
be affected by the fluctuation of hormones.50'53 Clapp et a l 51 found that sustained
exercise produces increased levels o f estradiol. This increase is intensity
dependant and most likely reflects decreased hepatic clearance caused by a fall in
splanchnic blood flow.
According to survey, female athletes have reported feeling a decrease in
overall physical performance during the preovulatory stage of the follicular phase.
This is when estrogens, progesterone and LH levels are elevated. 1 Conversely,
Lebrun52 found that there was no effect produced by the follicular or luteal phases
on performance levels, but did suggest a slight influence on aerobic capacity.
Wojyts et al1 could not categorized these differences for those individuals using
birth control, because the number o f respondents involved in the study using birth
control was too little to extrapolate any significant information. In a review of
literature, Lebrun53 found that estrogens and progesterone have direct and indirect
effects on athletic performance. The review noted that estrogens, particularly
when used with oral contraceptives, have detrimental effects on the
cardiovascular system, such as alterations in plasma fibrinolytic activity and
platelet aggregation with a corresponding increase in thrombosis. Estrogens also
cause retention of sodium and chloride, which leads to subsequent edema and
weight gain. Metabolically, estradiol affects lipid availability and utilization.
Metabolism is centered toward the use of free fatty acids due to the increased lipid
Reproduced with permission of the copyright owner. Further reproduction prohibited without permission.

55
synthesis and enhanced lipolysis in muscle and adipose tissue. Progesterone in
the luteal phase is at increased levels and increases the core body temperature and
basal metabolic rate. Other effects that were noted by progesterone include a shift
in substrate metabolism to more dependence on fat, lower respiratory exchange
ratios, lower blood lactate levels at submaximal exercise and higher circulating
free fatty acids.53 Moller-Nielson and Hammar14 found that women soccer were
more prone to traumatic injuries in the premenstrual and menstrual stages as
compared to the rest o f the cycle (p < .05), especially for those women who
experienced premenstrual symptoms, such as irritability/irascibility,
swelling/discomfort in the breasts and swelling/congestion in the abdomen. They
also found that women soccer players using oral contraceptives had a lower rate
of traumatic injuries (p < .05) compared to those not using them. A review, by
Hewett, 54 stated that oral contraceptives significantly affect endurance activities
by decreasing VO2 max. The article also suggested that hormone stabilization
through the use of oral contraceptives could possibly aid in maintaining dynamic
stability in a female’s knee. The study found that female athletes using oral
contraceptives had lower impact forces and decreased valgus and varus forces at
the knee, increased hamstring to quadriceps strength ratios, increased unilateral
stability and decreased knee laxity on average in comparison to those not using
oral contraceptives. Dennison et al55 reported no significant correlation between
the use of birth control and ligamentous laxity (p > .05).
When compiling the facts together, it is difficult to disregard the possible
relationship of hormones and ACL injuries. Six details are important to consider
Reproduced with permission of the copyright owner. Further reproduction prohibited without permission.
56
when making such an extrapolation: 1) the majority of ACL injuries in females
appear to occur at a time when hormones are peaking, near peak levels or just
beginning to increase in concentration, 2 ) estrogens and progesterone receptors
have been located within the structural composition of the ACL, 3) the greatest
amount of ACL laxity corresponds with the peak levels of estrogens and
progesterone, 4) hormonal concentrations are interdependent upon one another
and a variation of one hormonal concentration will cause a chain reaction of
variations among others, 5) females have greater fluctuations in hormonal
concentrations than males and 6 ) females have shown to receive the vast majority
of ACL injuries, even though there are fewer female participants overall.
These differences in peripheral laxity, athletic performance and reports of
the occurrence of ACL injury provide reasonable evidence to conduct this
investigation and future studies. Due to the interaction and interdependence of
one hormone to another, all aspects of the menstrual cycle should be evaluated. It
is possible that estrogens, progesterone, FSH, LH, estradiol and testosterone may
have direct or indirect effects, individually or in combination with one another, on
ACL laxity.
Reproduced with permission of the copyright owner. Further reproduction prohibited without permission.

57
CHAPTER III
METHODOLOGY
Subjects
Subjects consisted of twelve college-aged (xage = 24.25 ± 4.94 years, Xheight
= 166.16 ± 5.75 cm) female volunteers who replied to advertisements through
Health, Physical Education and Recreation classes at Old Dominion University.
Criterion for approval of subject participation was limited by several factors.
Qualifying conditions included: 1) the right leg to be dominant with no
pathologies of that knee, 2) minimal risk of injury during the testing period 3) no
use of hormonal therapy or supplementation for the prior 3 months, 4) minimal
risk of becoming pregnant during the course o f the study, 5) a history of
eumenorrhea for the year immediately prior to the beginning of testing, 6 ) the
average length o f the individuals’ menstrual cycles were between 28 to 35 days,
O
7) a dominant tibia could not be less than 34 cm and 8 ) a Q-angle less than 15 .
All participants had an apparently healthy right, dominant knee to be assessed
during the testing sessions. If the dominant knee had an injury that may have
caused a change in structural composition, such as the formation of scar tissue
after a ligamentous sprain, tendinosis or ACL deficiency, the potential participant
was excused from the study. Any subjects receiving an injury to the knee being
tested were removed from the study. Subjects were asked to refrain from exercise
during the 24 hours prior to each testing session. Subjects were removed from the
study if any hormonal supplementation, or therapy, was taken during the testing
period. This included, but was not limited to, birth control and was abstained
Reproduced with permission of the copyright owner. Further reproduction prohibited without permission.

58
from for at least three months prior to the start of testing. If a subject was to have
become pregnant before or between testing sessions she would have been
removed from the study due to the fact that pregnancy would have affected the
normal changes in hormonal levels for that individual. All of the subjects were
eumenorrheac for one year prior to the beginning of testing. Each of them had a
history o f 1 0 or more menstrual cycles within a time frame of one year prior to
data collection. All subjects had histories of normal menstrual cycles (28-35
days) prior to and during the testing to ensure that hormonal levels were relatively
normal and consistent from subject to subject. The length of the each subject’s
dominant tibia was 34 cm or longer due to the fact that shorter legs would require
a smaller knee arthrometer. The Q-angle (Figure 12) was measured at the time of
subjects’ consideration for the study. This was defined as the angle between the
rectus femoris muscle and the patellar tendon. This was done while the potential
subject was standing with the knee and hip fully extended and in neutral rotation.
The angle was determined by drawing a line from the anterior superior iliac spine
(ASIS) through the midpoint of the patella and from the tibial tubercle, again,
through the tibial tubercle. The angle formed was measured using a goniometer. 19
Once subjects were chosen, according to the responses made on the
questionnaire (Appendix A), the protocols were explained. After a verbal
agreement to participate in the testing, all subjects were required to sign a consent
form (Appendix B), which explained all testing protocols again and provided a
written list of all requirements and limitations placed on each individual
Reproduced with permission of the copyright owner. Further reproduction prohibited without permission.
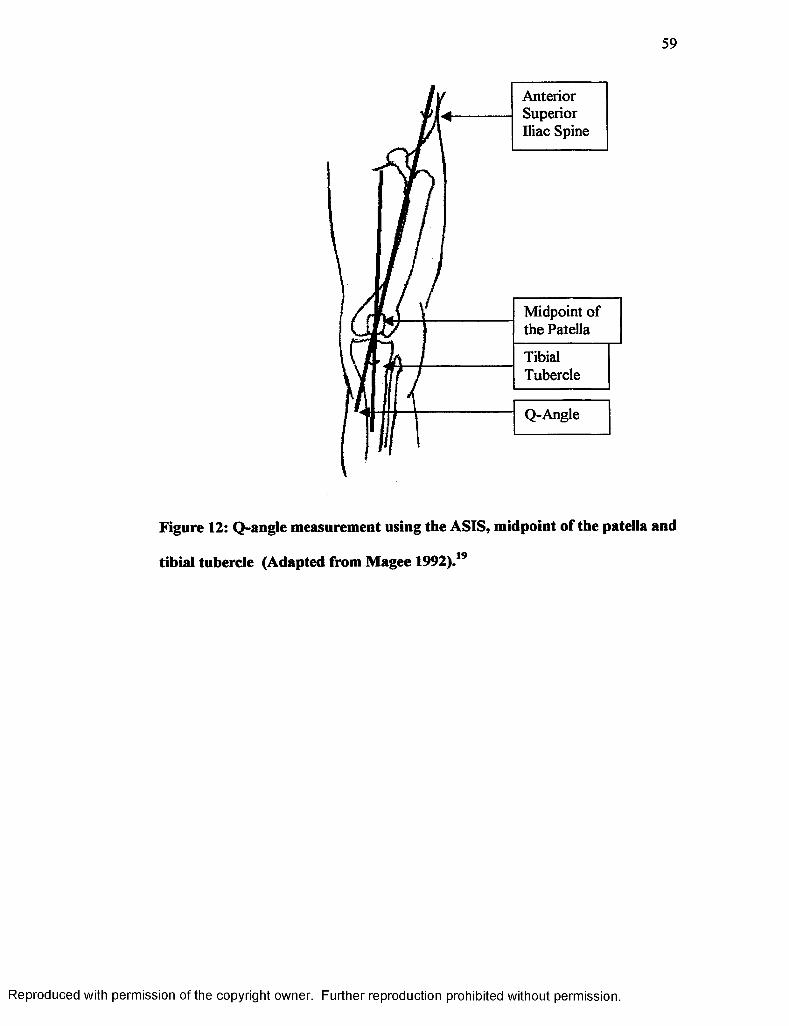
59
Anterior Superior Iliac Spine
Midpoint of the Patella
TibialTubercle
Q-Angle
Figure 12: Q-angle measurement using the ASIS, midpoint of the patella and
tibial tubercle (Adapted from Magee 1992).19
Reproduced with permission of the copyright owner. Further reproduction prohibited without permission.

60
throughout the testing period. The Old Dominion University Human Subjects
Review Board approved the consent form.
Instrumentation
All blood samples were drawn at Old Dominion University by one of three
testers, who were all trained in phlebotomy. Fourteen milliliters (14 ml) of blood
was obtained from the antecubital vein of the forearm in two 7 ml K3EDTA tubes
on three separate occasions, for a total o f 42 ml per subject for the entire study.
Whole blood was taken from one 7 ml tube to measure hemoglobin and
hematocrit. Samples were placed in a centrifuge at 1500 RPM for 10 minutes to
extract the plasma. The extracted plasma was then immediately frozen and stored
at -60°C until it was ready to be analyzed. Upon completion of all testing sessions
for every subject, samples were analyzed via radioimmunoassay at Old Dominion
University Human in the Life Science Building to determine hormonal
concentrations of estrogens (pg/ml), progesterone (ng/ml), LH (mlU/ml), FSH
(mlU/ml), estradiol (pg/ml) and testosterone (ng/ml).
ACL laxity was assessed using the KT-2000 knee arthrometer
(MEDmetric, San Diego, CA) (Figures 1,7 and 8 ) and plain radiographic films
(Figure 2). The KT-2000 was used to displace the tibia anteriorly to allow for a
measurement to be taken to establish objective readings for laxity at 30 lbs. or 133
N of force. One of two examiners, who had established good intratester
reliabilities, took measures for the KT-2000. The initial examiner, who tested the
first two subjects, became pregnant and could not test the remaining subjects due
Reproduced with permission of the copyright owner. Further reproduction prohibited without permission.
61
to the radiation exposure. Each subject was tested completely by only one of the
testers to avoid differences that may occur regarding intertester reliability.
Although intertester reliability was examined and proved to be within a
satisfactory range it would have had little effect on the outcome of the sessions
since the subjects were monitored over time and not compared to one another.
Data was initially analyzed using only the ten subjects tested by the second
examiner, who was the primary tester. There was no change in significance levels
with the addition of the two subject tested by the first examiner. The plain
radiographs were taken at Seritara Norfolk General Hospital (Norfolk, VA) by
trained radiology technicians. This method of laxity measurement permitted a
more precise and accurate reading by comparing two films taken, respectively,
before and after the force was applied. Both methods were measured in
millimeters.
An over-the-counter (OTC) Answer Quick and Simple One Step at home
ovulation test kit (Gray’s Pharmacy, Norfolk, VA) was issued to the subjects so
they could monitor themselves for a surge in the LH concentration, which
signifies the onset o f ovulation. Each subject began monitoring for this
occurrence on day 9 of the cycle. This was later changed to day five due to the
loss of several subjects. Each kit contained five days worth of testing materials.
Each day’s supply included one thin plastic strip with a thumb grip, urine
collection pad and result window.
Reproduced with permission of the copyright owner. Further reproduction prohibited without permission.
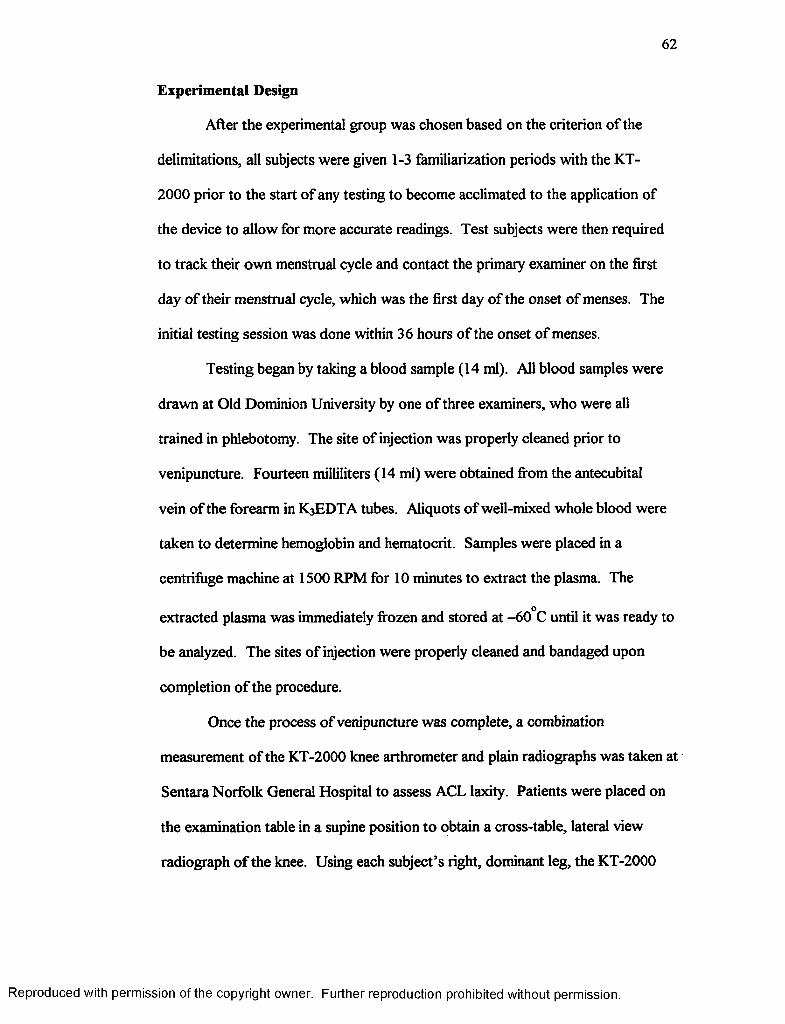
62
Experimental Design
After the experimental group was chosen based on the criterion of the
delimitations, all subjects were given 1-3 familiarization periods with the KT-
2 0 0 0 prior to the start of any testing to become acclimated to the application of
the device to allow for more accurate readings. Test subjects were then required
to track their own menstrual cycle and contact the primary examiner on the first
day of their menstrual cycle, which was the first day of the onset of menses. The
initial testing session was done within 36 hours of the onset of menses.
Testing began by taking a blood sample (14 ml). All blood samples were
drawn at Old Dominion University by one of three examiners, who were all
trained in phlebotomy. The site of injection was properly cleaned prior to
venipuncture. Fourteen milliliters (14 ml) were obtained from the antecubital
vein of the forearm in K3EDTA tubes. Aliquots of well-mixed whole blood were
taken to determine hemoglobin and hematocrit. Samples were placed in a
centrifuge machine at 1500 RPM for 10 minutes to extract the plasma. The
O
extracted plasma was immediately frozen and stored at -60 C until it was ready to
be analyzed. The sites of injection were properly cleaned and bandaged upon
completion o f the procedure.
Once the process of venipuncture was complete, a combination
measurement of the KT-2000 knee arthrometer and plain radiographs was taken at
Sentara Norfolk General Hospital to assess ACL laxity. Patients were placed on
the examination table in a supine position to obtain a cross-table, lateral view
radiograph o f the knee. Using each subject’s right, dominant leg, the KT-2000
Reproduced with permission of the copyright owner. Further reproduction prohibited without permission.

63
was applied to the anterior aspect o f the tibia, so that it was parallel to the line of
the tibial tuberosity as specified by the manufacturer. Velcro straps were applied
at the proximal and distal ends of the tibia at points that allowed for alignment
with the tibiofemoral joint line as indicated on the device and so the patellar
sensor remained in a position over the patella. A third strap was placed around
both thighs to maintain a position of neutral hip rotation. The thigh support was
placed under the distal femur, causing the resulting position of the knee to be at
20 to 30° of flexion. The thigh support was also placed so that it was only under
the right leg to allow the placement o f the radiographic film cartridge between the
subjects’ knees. Tibial rotation was in a neutral position and controlled for with a
foot support to reduce external rotation and a towel to block internal rotation.
Once in position, the first radiographic picture was taken with no force being
exerted upon the knee. Pressure was applied to the patellar sensor pad and
maintained at a constant level throughout the use of the device. Force was
exerted in an anterior direction with the applied force equaling 133 N. This was
indicated by the presence of an audible tone produced by the unit and a point on
the X-Y plotter that was attached to the device.
When the 133 N. of force was applied, the radiologists were instructed to
take a second film of the patient’s knee. To prevent radiation exposure to the
examiners’ hands, the pressure for the patellar sensor pad was applied to the top
of the handle rather than the pad itself. The two films were compared, according
to Staubli and Jakob’s17 protocol, to determine the amount of tibial displacement
Reproduced with permission of the copyright owner. Further reproduction prohibited without permission.

64
in millimeters. Each film taken was a lateral radiograph in the anterior position
with the radiographic equipment set at a fiim-to-tube distance o f 1 2 0 cm.
To measure the anterior position of the tibia with respect to the femur, a
line was drawn on the PTC at the midshaft level. The most posterior aspects of
the medial tibial plateau and medial femoral condyle were identified at the
subchondral bone level. A tangent line was drawn to the most posterior aspect of
the tibial plateau and parallel to the PTC. A second parallel line to the PTC was
drawn tangent to the posterior aspect o f the femoral condyle. The distance
between the two tangent lines was considered the anterior displacement of the
medial compartment (ADm). This measurement defined the anterior position of
the medial tibial plateau with regard to the medial femoral condyle. Anterior
displacement was also measured in the lateral compartment (ADI) using the most
posterior aspects of the lateral tibial plateau and lateral femoral condyle. Then the
sum of the ADm and ADI was divided by two. The arithmetic mean of the
measurements for both compartments represented the anterior knee motion by
describing the anterior position of the tibia in regard to the femur at the midpoint
of the knee (Figure 2). The amount of displacement was determined by
subtracting the amount o f tibial translation according to the radiograph with no
exerted force from the radiograph taken during the application of 133 N.
After the first testing session, the subjects were given an OTC Answer
Quick and Simple One-Step at home ovulation test kit (99% accurate). Its
purpose was to detect the LH surge in the urine, which normally occurs 24-36
hours before ovulation. Each subject followed the instructions indicated on the
Reproduced with permission of the copyright owner. Further reproduction prohibited without permission.
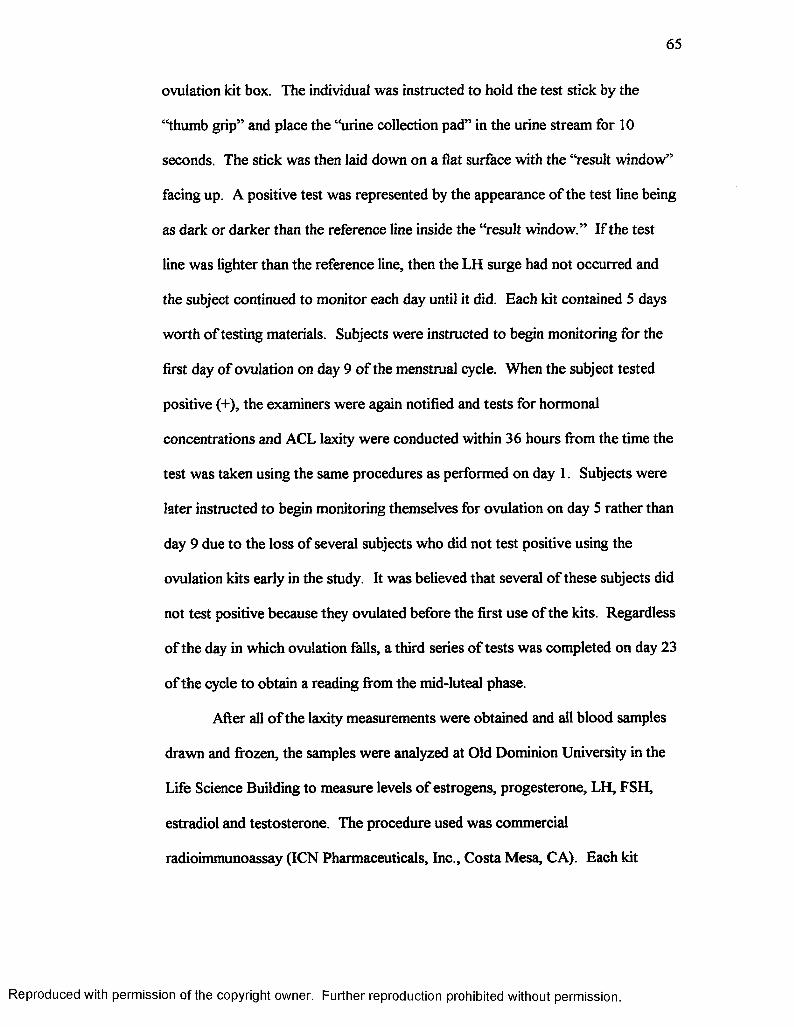
65
ovulation kit box. The individual was instructed to hold the test stick by the
“thumb grip” and place the “urine collection pad” in the urine stream for 1 0
seconds. The stick was then laid down on a flat surface with the “result window”
facing up. A positive test was represented by the appearance of the test line being
as dark or darker than the reference line inside the “result window.” If the test
line was lighter than the reference line, then the LH surge had not occurred and
the subject continued to monitor each day until it did. Each kit contained 5 days
worth of testing materials. Subjects were instructed to begin monitoring for the
first day of ovulation on day 9 o f the menstrual cycle. When the subject tested
positive (+), the examiners were again notified and tests for hormonal
concentrations and ACL laxity were conducted within 36 hours ffom the time the
test was taken using the same procedures as performed on day 1. Subjects were
later instructed to begin monitoring themselves for ovulation on day 5 rather than
day 9 due to the loss of several subjects who did not test positive using the
ovulation kits early in the study. It was believed that several of these subjects did
not test positive because they ovulated before the first use of the kits. Regardless
of the day in which ovulation falls, a third series of tests was completed on day 23
of the cycle to obtain a reading from the mid-luteal phase.
After all o f the laxity measurements were obtained and all blood samples
drawn and frozen, the samples were analyzed at Old Dominion University in the
Life Science Building to measure levels of estrogens, progesterone, LH, FSH,
estradiol and testosterone. The procedure used was commercial
radioimmunoassay (ICN Pharmaceuticals, Inc., Costa Mesa, CA). Each kit
Reproduced with permission of the copyright owner. Further reproduction prohibited without permission.

contained standards of known concentrations, allowing for the construction of
standard curves from which the hormonal concentrations of our unknown samples
were drawn. For estrogens, this began by adding . 1 ml of plasma and 6 ml o f a
ethyl acetate: hexane mixture (3:2 ratio) being shaken for 60 seconds. Then 5 ml
were withdrawn from the organic phase (top phase) and allowed to evaporate.
The sample residue was reconstituted with 2.5 ml of diluent buffer and incubated
at room temperature for 30 minutes. Then .5 ml of extracted serum, .1 ml of anti-
125total estrogen and . I ml o f I ITP estradiol being placed in a tube and incubated
at room temperature for 90 minutes. Then. 1 ml of second antibody was added,
incubated for 1 hr. at room temperature and placed in the centrifuge for 15
minutes at 1000 x g. After the tubes were aspirated, they were counted in a
125gamma counter calibrated for I. Standard curves were then plotted on semi-log
paper based on known concentration provided with the kit. The total amount o f
estrogens was determined according to the value that was inversely proportional
to the amount of radioactivity.
Evaluating progesterone consisted of 100 pi of the extracted serum and 1
O
ml of progesterone being placed in a tube and incubated for 2 hours at 37 C.
After the tubes were aspirated, they were counted in a gamma counter calibrated
125for I. Standard curves were then plotted on semi-log paper based on known
concentration provided with the kit. The amount of progesterone was determined
graphically from the curve obtained from the results of the progesterone
standards.
Reproduced with permission of the copyright owner. Further reproduction prohibited without permission.

67
Analyzing LH consisted of 100 pi of the extracted serum and 200 pi assay
buffer being incubated at 37° C for 45 minutes. The tubes were then aspirated and
125washed and 300 pi of I anti-LH is added. The tubes were incubated again at
37° C for 45 minutes. After the tubes were aspirated and washed a second time,
125they were counted in a gamma counter calibrated for I, which constructed a
standard curve to determine LH concentrations.
Determining FSH levels consisted o f 100 pi of the extracted serum and
0200 pi of assay dilution being incubated 45 minutes at 37 C. The tubes were then
125aspirated and washed and 300 pi of I anti-FSH was added. The tubes were
incubated again at 37° C for 45 minutes. After the tubes were aspirated and
125washed a second time, they were counted in a gamma counter calibrated for I,
which constructed a standard curve to determine FSH concentrations.
125For estradiol, 100 pi of the extracted serum and 1 ml of I estradiol were
placed in a tube and incubated for 90 minutes at 37° C. Then 500 ml of a second
antibody/PEG mixture was added and placed in the centrifuge for 15 minutes at
1000 x g. After the tubes were aspirated, they were counted in a gamma counter
125calibrated for I. Standard curves were then plotted on semi-log paper based on
known concentration provided with the kit. The total amount o f estradiol was the
value that was inversely proportional to the amount of radioactivity.
125For testosterone, 25 pi of the extracted serum and 1 ml of I testosterone
were placed in a tube and incubated at 37° C for 2 hours. After the tubes were
125aspirated, they were counted in a gamma counter calibrated for I. Standard
Reproduced with permission of the copyright owner. Further reproduction prohibited without permission.

68
curves were then plotted on semi-log paper based on known concentration
provided with the kit. The total amount of testosterone was inversely proportional
to the amount of radioactivity.
Hematocrit and hemoglobin levels were measured to assess plasma
volume. Due to changes in fluid retention throughout the menstrual cycle, it was
important to estimate plasma volume changes in order to compensate for an
accurate reading of relative hormonal levels. Hematocrit levels were simply
observed after removal from the centrifuge by comparing the ratio of red blood
cells to total blood cells and plasma in order to obtain a percentage of RBCs in the
blood. Determining hemoglobin (Hb) required the preparation of Drabkin’s
reagent. Sodium bicarbonate (1 g), potassium cyanide (.05 g) and potassium
ferricyanide (.29 g) were combined in a brown bottle with distilled water so the
total contents was equal to 1000ml, forming a clear, yellowish solution. Using the
Drabkin’s reagent, stock cyanmethemoglobin and Hb with a spectrophotometer
allowed for a reading to be taken to determine the mean absorbance of each
sample. Hematocrit and hemoglobin were evaluated after each testing sessions
using whole blood.
Statistics
Statistical analysis was conducted using SPSS Windows 9 to discuss the
significance of the findings. A Pearson Product Moment Correlation Coefficient
was used to measure the relationship of ACL laxity to hormonal levels throughout
the three phases of the menstrual cycle. A Repeated Measures ANOVA was used
Reproduced with permission of the copyright owner. Further reproduction prohibited without permission.

as a post hoc test to determine the relationship for the KT-2000 and radiographic
measures o f laxity. All ANOVA values were based on the Spericity Assumed
values from the within-subjects effects. An a level of .05 was the criterion for
statistical significance. An Intraclass Correlation Coefficient (2,1) was used to
evaluate intratester reliability for the KT-2000 and radiographic readings.
Reproduced with permission of the copyright owner. Further reproduction prohibited without permission.

70
CHAPTER IV
RESULTS
Subject Attributes
All subjects fell within categories that provided relatively similar
demographics (Table 2). Subjects were between the ages of 18 and 34 years old.
Height ranged from 156.21 to 176.53 cm and Q-angles were between 5 and 15°.
Tibial length had a minimum o f 34.5 cm and a maximum of 43 cm. All subjects’
weight means for all three sessions ranged from 53.52 to 91.63 kg and showed no
significant differences over time (p = .3614). Data for individual subjects are
located in Appendix C.
The first testing session was conducted between 16 and 34 hours of the
onset of menses. The amount of time from the onset o f menses to the positive
ovulation tests ranged from 182 to 390 hours with the second testing sessions
occurring between 9.75 and 34 hours o f the positive ovulation tests. Mean times
and standard deviations are summarized in Table 3.
The change in percent volume for hematocrit and hemoglobin of each
subject was between -18.86 and 7.7% (p = .012) for the time period between the
onset of menses to ovulation. The change in percent volume between the onset of
menses and the mid-luteal phase ranged from -32.29 to 4.98% (p = .091). Mean
changes in percent volume and standard deviations are included in Table 3. Data
for individual subjects are located in Appendix D.
Reproduced with permission of the copyright owner. Further reproduction prohibited without permission.

71
Table 2: Subject Demographics
Attributes Mean Standard Deviation
Age (years) 24.25 ±4.94
Height (cm) 166.16 ±5.75
Q-Angle (degrees) 9.75 ±3.57
Tibial Length (cm) 37.92 ±2.84
Weight Menses (kg) 64.86 ±11.14
Weight Ovulation (kg) 65.09 ± 11.03
Weight Mid-luteal (kg) 65.03 ± 11.10
Reproduced with permission of the copyright owner. Further reproduction prohibited without permission.
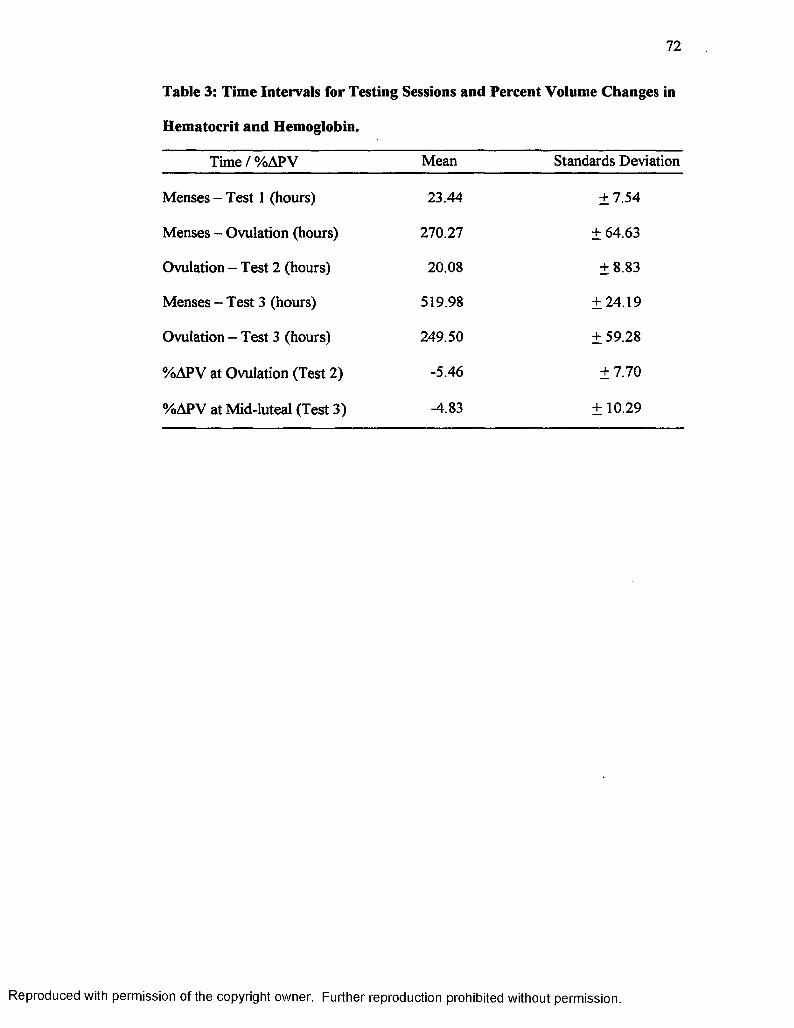
72
Table 3: Time Intervals for Testing Sessions and Percent Volume Changes in
Hematocrit and Hemoglobin.
Time / %APV Mean Standards Deviation
Menses - Test 1 (hours) 23.44 ±7.54
Menses - Ovulation (hours) 270.27 ± 64.63
Ovulation - Test 2 (hours) 20.08 ±8.83
Menses - Test 3 (hours) 519.98 ±24.19
Ovulation - Test 3 (hours) 249.50 ± 59.28
%APV at Ovulation (Test 2) -5.46 ±7.70
%APV at Mid-luteal (Test 3) -4.83 ± 10.29
Reproduced with permission of the copyright owner. Further reproduction prohibited without permission.

Hormone Concentrations
Descriptive statistics for total estrogens, progesterone, LH, FSH, estradiol
and testosterone are summarized in Table 4. A Pearson Product Moment
Correlation Coefficient revealed that there were no statistically significant
relationships between laxity measurements, of the KT-2000 or radiographic
comparisons, and elevated concentrations of hormones. LH was observed in the
follicular phase, at the onset of menses, to have a negative correlation of r = -.628
(p = .029) to the radiographic readings. This was not observed in the coinciding
reading from the KT-2000. All other values ranged from significance levels of p
= .076 to .953 (Table 5). Individual subjects’ raw data for hematocrit,
hemoglobin, hormonal concentrations and laxity readings at menses, ovulation
and the mid-luteal stage are summarized in Appendix E. All hormonal values
were obtained from standard curves (Appendix F) based on known standard
concentrations provided with each assay kit in order to maintain consistency
regarding the half-life of each assay kit.
Laxity Readings
An ICC (2,1) was used to determine the intratester reliability for the KT-
2000. The primary tester proved to be reliable over time with an ICC of .9211
(Fl2,12 = 12.6677, p = .0001). Raw data and descriptive statistics are located in
Appendix G. The second tester proved to be reliable in a prior study.
Radiographs were read a second time to obtain values to assess intratester
Reproduced with permission of the copyright owner. Further reproduction prohibited without permission.
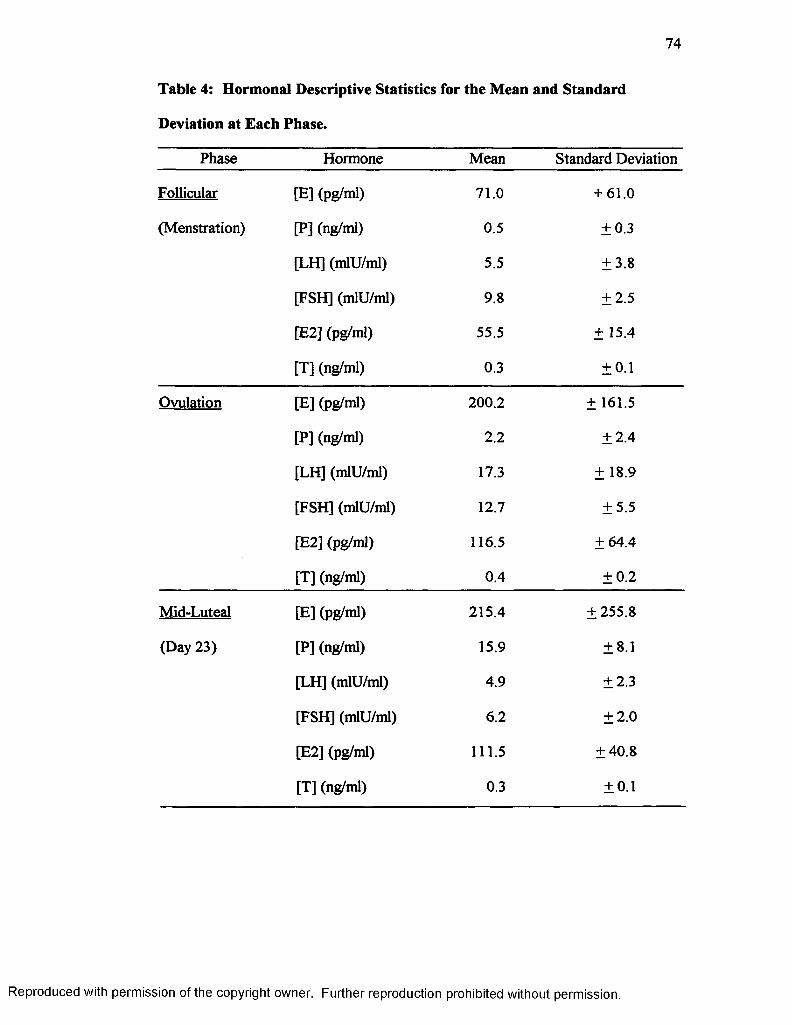
74
Table 4: Hormonal Descriptive Statistics for the Mean and Standard
Deviation at Each Phase.
Phase Hormone Mean Standard Deviation
Follicular [E] (pg/ml) 71.0 + 61.0
(Menstration) [P] (ng/ml) 0.5 ±0.3
[LH] (mlU/ml) 5.5 ±3.8
[FSH] (mlU/ml) 9.8 ±2.5
[E2] (pg/ml) 55.5 ± 15.4
[T] (ng/ml) 0.3 ±0.1
Ovulation [E] (pg/ml) 200.2 ± 161.5
[P] (ng/ml) 2.2 ±2.4
[LH] (mlU/ml) 17.3 ± 18.9
[FSH] (mlU/ml) 12.7 ±5.5
[E2] (pg/ml) 116.5 ±64.4
[T] (ng/ml) 0.4 ±0.2
Mid-Luteal [E] (pg/ml) 215.4 ±255.8
(Day 23) [P] (ng/ml) 15.9 ±8.1
[LH] (mlU/ml) 4.9 ±2.3
[FSH] (mlU/ml) 6.2 ±2.0
[E2] (pg/ml) 111.5 ±40.8
[T] (ng/ml) 0.3 ±0.1
Reproduced with permission of the copyright owner. Further reproduction prohibited without permission.
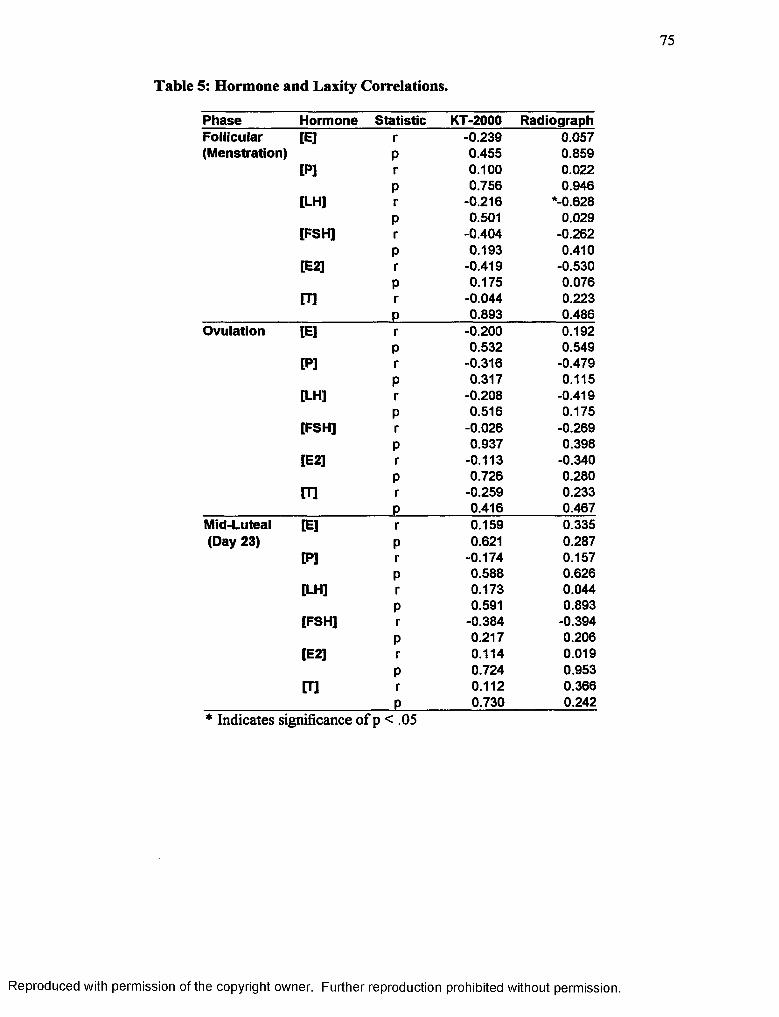
75
Table 5: Hormone and Laxity Correlations.
Phase Hormone Statistic KT-2000 RadiographFollicular [E] r -0.239 0.057(Menstration) P 0.455 0.859
[P] r 0.100 0.022P 0.756 0.946
[LH] r -0.216 *-0.628P 0.501 0.029
[FSH] r -0.404 -0.262P 0.193 0.410
[E2] r -0.419 -0.530P 0.175 0.076
m r -0.044 0.223P 0.893 0.486
Ovulation [E] r -0.200 0.192P 0.532 0.549
[PI r -0.316 -0.479P 0.317 0.115
[LH] r -0.208 -0.419P 0.516 0.175
[FSH] r -0.026 -0.269P 0.937 0.398
[E2] r -0.113 -0.340P 0.726 0.280
m r -0.259 0.233P 0.416 0.467
Mid-Luteal [E] r 0.159 0.335(Day 23) P 0.621 0.287
[P] r -0.174 0.157P 0.588 0.626
[LH] r 0.173 0.044P 0.591 0.893
[FSH] r -0.384 -0.394P 0.217 0.206
[E2] r 0.114 0.019P 0.724 0.953
[T] r 0.112 0.366P 0.730 0.242
* Indicates significance of p < .05
Reproduced with permission of the copyright owner. Further reproduction prohibited without permission.

76
reliability for the radiographic comparisons. An ICC (2,1) showed a reliability of
.8079 (F34.34 = 5.2057, p <.0000). Raw data appears in Appendix H.
A repeated measures ANOVA was used to determine if there were any
statistically significant differences in the KT-2000 or radiographic comparisons
over time. There were, however, minute decreases throughout the cycle, as seen
in Figure 13. Contrary to the arthrometric readings, radiographic comparisons,
although not statistically significant, revealed a slight increase in laxity over time
(Figure 13). There was a main effect for testing methodology (p < .0001, Fi,n =
74.667) with an observed power of 100%. There was no main effect over time
(F2,22 = 470, p = .631). The observed power was 5%. There was no interaction
testing methodology over time regardless of menstrual phase (F2,22 = 1.201, p =
.320) with an observed power of 22% (Appendix I). A Pearson Product Moment
Correlation Coefficient was used to measure the relationship of the KT-2000 and
radiographs over time. There were no statistically significant relationships
between the KT-2000 and radiographic interpretation at menstruation (r = .461
and p = .131), ovulation (r = .02 and p = .951) or the mid-luteal phase (r = .236
and p = .461).
Several radiographic readings showed that rotation had occurred when
force was applied with the KT-2000. A Repeated Measures ANOVA showed no
main effect between lateral and medial displacements of the tibia (Fi.n = .005, p =
.948). There was no main effect over time (F2,22 = 471, p = .631). There was
also no interaction while comparing lateral versus medial displacements over time
Reproduced with permission of the copyright owner. Further reproduction prohibited without permission.

77
Laxity M ean s C o m p a riso n
EE.COc<80)2&'33
12
10
8
6
4
2
•KT-2000-X-Ray
Menstruation Ovulation Mid-Luteal
Phase of Menstrual Cycle
Figure 13: Comparisons of laxity measuring methodology at each phase of
the menstrual cycle.
Reproduced with permission of the copyright owner. Further reproduction prohibited without permission.
78
regardless of menstrual phase (F2,22 = • 1 -407, p = .266), (Appendix J). Raw data
are contained in Appendix K.
Reproduced with permission of the copyright owner. Further reproduction prohibited without permission.

79
CHAPTER V
DISCUSSION
The purpose of this study was to examine the levels of estrogens,
progesterone, LH, FSH, estradiol and testosterone and their relation to ACL laxity
throughout the menstrual cycle. Total estrogens and progesterone have both been
previously evaluated in regard to ACL laxity.2 ACL laxity has also been tracked
throughout the menstrual cycle in adolescent females.8 We could not find any
literature regarding knee laxity and a possible relationship with fluctuating
concentrations of LH, FSH, estradiol or testosterone. Several authors have
recommended the further study of these potential associations.1’2,8’9,47’50'52 The
intent of this study was to support or refute former findings regarding estrogens
and progesterone and to provide further information on the relationship of LH,
FSH, estradiol and testosterone to ACL laxity.
Hormone Concentrations and Laxity Readings
The research hypothesis stated that there was to be a statistically
significant increase in anterior tibial translation corresponding with elevated
concentrations of estrogens, progesterone and estradiol at the mid-luteal phase
therefore inferring an increase in ACL laxity and a higher potential for injury.
Contrary to this, the null hypothesis appears to be true according to the collected
data. There were no statistically significant changes in the amount of anterior
tibial translation as estrogens, progesterone, LH, FSH, estradiol and testosterone
levels fluctuated throughout the menstrual cycle.
Reproduced with permission of the copyright owner. Further reproduction prohibited without permission.

80
A retrospective survey (n = 28) by Wojyts et a l1 reported that 13% of
ACL injuries occurred between days 1 and 9, 29% occurred from days 10 to 14.
The remaining 58% of ACL injuries were received between day 15 and the end of
the menstrual cycle. These results were later found to be statistically
insignificant48, but do seem to at least show a trend occurring that contradicts
what would be expected to occur in a randomized dispersion 31,18 and 50%,49.
Heitz et al2 found a significant difference (Fi,6 = 3.56, p = 0.048) in ACL laxity
occurring in conjunction with the approximate time of ovulation and pre
ovulation (days 10-13). This increase in ACL laxity coincided with increased
estrogens in comparison to baseline levels of estrogens at the onset of menses to
days 10 through 13. They also noted a significant difference (Fi,6 = 13.41, p =
0.006) in laxity occurring from days 20 to 23 of the mid-luteal stage. This is
approximately the same time when estrogens and progesterone peak in
comparison to baseline levels at the onset of menses. Karageanes et al8 found no
significant differences in ACL laxity for the left (p = .9) or right knee (p = .7977)
during the course of the menstrual cycle in adolescent female athletes. They did
not monitor hormonal fluctuations due to complications regarding obtaining
parental consent. To estimate the time of ovulation the examiners counted 14
days back from the onset of menses. Three days were added prior to this time to
include an estimated preovulatory phase. To minimize error in this methodology
all subjects selected had menstrual cycles lasting 26 to 30 days and menses lasting
4 to 7 days. Heitz et al2 conducted their second series of tests from days 10
through 13, the approximate time of ovulation. Our study found subjects to begin
Reproduced with permission of the copyright owner. Further reproduction prohibited without permission.

81
ovulating between days 8 and 17. To avoid the possibility of missing ovulation,
subjects were asked to use an Answer Quick and Simple At-Home Ovulation Kit
beginning on day 5 on their menstrual cycle. A familiarization period was also
done with each subject to allow for more accurate readings at the time of testing.
This practice session allowed the subjects to become acquainted with the protocol
for administering a KT-2000 test before data was collected in order to decrease
the amount of apprehension they may have.
Hormone concentrations within this study followed what are considered
normal fluctuation patterns for women with regular menstrual cycles (Table 4,
Appendix E).1'5 It is assumed that hormone concentrations for days of the
menstrual cycle that were not observed also fell within normal ranges and
fluctuations.
The data collected in this study supports the findings of Karageanes et al8,
but refutes Heitz et al2 in that there were no statistically significant changes found
in the amount of anterior tibial translation, as estrogens and progesterone levels
rose in the mid-luteal stage. While no statistical differences were observed over
time for the use of the KT-2000 or radiographic comparisons, their means show
minute changes that contradict one another. The KT-2000’s means, although they
are not significant, decreased over time. The means observed by the radiographs
showed a slight increase in ACL laxity over time, however these were not
significant either (Figure 13). This could be the result of tibial rotation or soft
tissue mimicking straight anterior tibial translation.
Reproduced with permission of the copyright owner. Further reproduction prohibited without permission.

82
Past research has examined ACL laxity through the use of the KT-10008
or KT-2000 by itself.2 Our methodology used the KT-2000 along with
simultaneous radiographs for more objective results. The addition o f the X-Y
plotter allows the KT-2000 an increase in reproducibility as opposed to the KT-
1000. Myrer et al38 found within tester correlation ranging from .92 to .95 for the
KT-2000 and Highenboten et al40 found a test-retest correlation of .87 for the KT-
1000. One reason for the increase may be due to the fact that the examiner does
not have to rely completely on the arthrometer’s internal tibiofemoral
anterior/posterior internal measuring instrument for a laxity reading. More
attention may be given to the force being applied and the direction of the tibial
translation since the data for the laxity measure can be read after the test from the
graph produced by the X-Y plotter. This study added another precision in that a
radiograph was taken as the predetermined 133 N of force was applied. This
radiograph was compared to another film taken immediately prior while no force
was exerted. Using tibial and femoral landmarks, according to the procedure by
Staubli and Jakob,17 allowed for more accuracy regarding total tibial translation
rather than permitting possible tibial rotation or soft tissue interference to give an
exaggerated amount of laxity.
There was no relationship between the KT-2000 and radiographic values.
The X-Y plotter provided laxity readings from all 36 testing sessions that were
greater than those obtained by reading the radiographs, with the exception of only
one. Staubli and Jakob17 found no significant correlation between the use of the
KT-1000 and radiographic measures for determining the amount o f laxity in ACL
Reproduced with permission of the copyright owner. Further reproduction prohibited without permission.

83
intact knees. Their study (n = 16) reported a mean radiographic measure of 4.9 ±
1.6 mm and a mean of 6.2 + 2.5 mm for the use of the KT-1000. In order to
match their study to ours, all laxity measurements were averaged together to
obtain an overall mean (n = 36). The present study found a greater difference
between the two means (radiographs: 4.23 ± 1.68 mm, KT-2000: 8.08 ± 2.08 mm)
with less of a standard deviation in the use of a KT-2000 in comparison to a KT-
1000. An independent t-test found there to be reasonable agreement between the
data provided the radiographic measures of both studies (t = -2.83, p > .05). A
comparison of the data obtained by the KT-1000 and KT-2000, respectively,
found no significant agreement between the studies (t = 1.21, p < .05). While
interpreting the radiographs in our study, it was noted that there was an occasional
degree of tibial rotation that occurred when force was applied using the KT-2000.
This rotational error is difficult to compensate for manually since a millimeter is
such a small unit of measurement. This may also partially explain the fact that the
means from the KT-2000 were larger than those seen in the radiographs. It is
possible that the arthrometer and X-Y plotter could have been displaying the
anterior displacement of one compartment while the other remained in a position
of less translation. In cases of internal rotation of the tibia, anterior tibial
translation will be decreased in comparison to positions of neutral and external
rotation.37 Another explanation may be the amount of soft tissue between the
upper strap of the arthrometer and the tibia. The Velcro strap may be secured
tightly below the knee, but with certain individuals larger amounts of soft tissue
will compress between the strap and the tibia more when an anterior force is
Reproduced with permission of the copyright owner. Further reproduction prohibited without permission.
84
applied imitating tibial translation. Regardless of the proper application of the
Velcro thigh strap and foot support or examiner experience there is still a large
amount of room for human error, since the arthrometer measures laxity
externally8 and the measurement taken is to the nearest .25 of a millimeter. This
information justifies the importance for the development of a device that has the
ability to measure tibial rotation or control for it when manually applying forces
to observe ACL laxity. MEDmetric states in their Buyers’ Guide16 that a KT-
3000 is being studied that will measure coupled motions of rotation and anterior
and posterior displacements.
Several authors, while not all describing the KT-2000 or radiographic
measures, all agree that there are a variety of valid manual and arthrometric
methods for measuring ACL laxity.33,40’41 All have varying degrees of reliability
and accuracy. While some are more comparable to others, all of these authors are
in agreement that each is most reliable within itself. When monitoring laxity over
time it is important to use the same testing method and that examiner experience
is the factor that most affects reliability. This also appears to be true for the two
methodologies used in our study.
Karageanes et al8 used the KT-1000 to monitor adolescent females (n =
26: 52 knees). The means for the right knee were 4.98 mm in the follicular phase,
5.24 mm in the ovulatory phase and 5.09 mm in the luteal phase. Means for the
left knee were 4.51 mm in the follicular phase, 4.43 mm in the ovulatory phase
and 4.62 mm in the luteal phase. Standard deviations were not reported, but the
right knee presented with significantly more laxity (p < .05). While the right to
Reproduced with permission of the copyright owner. Further reproduction prohibited without permission.

85
left comparison itself is not relevant to our study, it is still noted that there were
no significant differences in laxity for either knee throughout the menstrual cycle.
Heitz et al2 used the KT-2000 to record ACL laxity in females (n = 7) using
readings obtained at menstruation as a baseline (5.6 ± 1.34 mm). Laxity readings
were collected on days 10 through 13 (6.4 + 1.64 mm), a time that ovulation
generally occurs, and days 20 through 23 (7.0 ± 1.66) of the luteal phase. While
our study found higher laxity readings using the KT-2000, we also observed
higher standard deviations. It is also noted that their readings from the X-Y
plotter obtained later in methodology are closer to our overall mean of 8.08 ±
2.08. The smaller standard deviations may be attributed to the fact that a smaller
random sample was used by Heitz et al2 and that each subject was measured four
times for both ovulation and the luteal phase providing multiple readings from the
same ACL and the ability to compensate for outliers. Tester experience may also
provide a reason for the smaller standard deviation. While both examiners in our
study using the KT-2000 proved to have sufficient intratester reliabilities, our
primary tester had a limited period of one month to become proficient in its
application and execution.
Conclusions
This study showed that there were no significant differences in laxity
measurements over time. Both methodologies revealed mean differences of less
than 1 mm throughout the menstrual cycle. Therefore no relation between
hormonal concentration and ACL laxity could be determined.
Reproduced with permission of the copyright owner. Further reproduction prohibited without permission.

86
This study supports the fact that both the KT-2000 and radiographic
measurements are reliable over time if measured within themselves. It is
important to note that when monitoring ACL laxity there are different
complications with each device. The radiographic comparisons deliver an amount
of radiation exposure that limits its repetitive use. The KT-2000 has a large
opportunity for human error regardless of tester experience and it is difficult to
compensate for soft tissue displacement in larger individuals and for the minute
changes in rotation that may occur. These are situations that would appear to only
present complications in a research setting. Clinically, these should not cause
difficulties in comparing a potentially injured ACL to that o f the contralateral
side.
Further research is warranted on this topic, with this study producing
results that are in accord with Karageanes et al8 showing no significant changes in
ACL laxity but contradict Heitz et al,2 who found a potential relationship between
increased laxity and elevated concentrations of estrogens and progesterone. This
is the first known study to examine the possible relationship of LH, FSH, estradiol
and testosterone to ligament laxity. The results show there is no relationship
involving any of theses hormones.
Recommendations
The following are recommendations proposed for further research to both
improve and expand upon this study. A larger sample group would be a better
representation of the total female population. Our search for subjects was greatly
Reproduced with permission of the copyright owner. Further reproduction prohibited without permission.
87
restricted by two features. First the use of birth control was an exclusionary
criteria due to the fact that it not only alters hormonal levels in comparison to
what may be considered normal for an individual but it completely inhibits
ovulation. This use of hormonal therapy calls for further investigation as well to
determine the effects of such medications as birth control. Second was that
testing sessions occurring at the onset of the menstrual cycle and at ovulation
were difficult to schedule with the subjects given such short notification.
More testing sessions per subject would provide more accurate results as
to what changes are actually occurring over time. In the case of this study,
radiation exposure from the radiographs became the limiting factor. It is also
advisable to track women over time to note when ACL or other ligamentous
injuries are occurring within the menstrual cycle. The examination of other
ligamentous structures could also be a source of research in regards to the
possible associations with the menstrual cycle. It would be prudent to evaluate
those ligaments containing specific hormone receptors.
Monitoring for ovulation should occur at an earlier time frame than what
most ovulation kits suggest and what this study initially implemented. The loss of
subjects due to the fact that ovulation had occurred before they began to monitor
themselves was another factor limiting the progress of the study. This was
compensated for midway through the study by changing the day to begin
monitoring for ovulation from day 9 to day 5.
The final recommendation regards the development of a better and more
valid arthrometric device. While studies have shown the KT-2000 to be reliable
Reproduced with permission of the copyright owner. Further reproduction prohibited without permission.

88
over time, there are still many chances for human error with its use. This includes
alignment and positioning of the feet, hips and thigh support and placement of the
KT-2000 itself. It would also be beneficial to develop a device that could detect
more minute changes in displacement. Clinically and practically, a millimeter
may be a sufficient measurement and the KT-2000 has proven to be effective in
that setting. But scientifically, noting more precise changes may be advised. The
more objective the device, the more reliable the data. Further research is
warranted to determine what degree o f laxity difference will affect an individual’s
proneness to injury. Compensation for tibial rotation is also advisable due to the
fact that readings taken from the X-Y plotter for the KT-2000 more closely
resembled displacements of lateral or medial compartments while the opposite
side showed smaller values or even a decrease in laxity.
Reproduced with permission of the copyright owner. Further reproduction prohibited without permission.
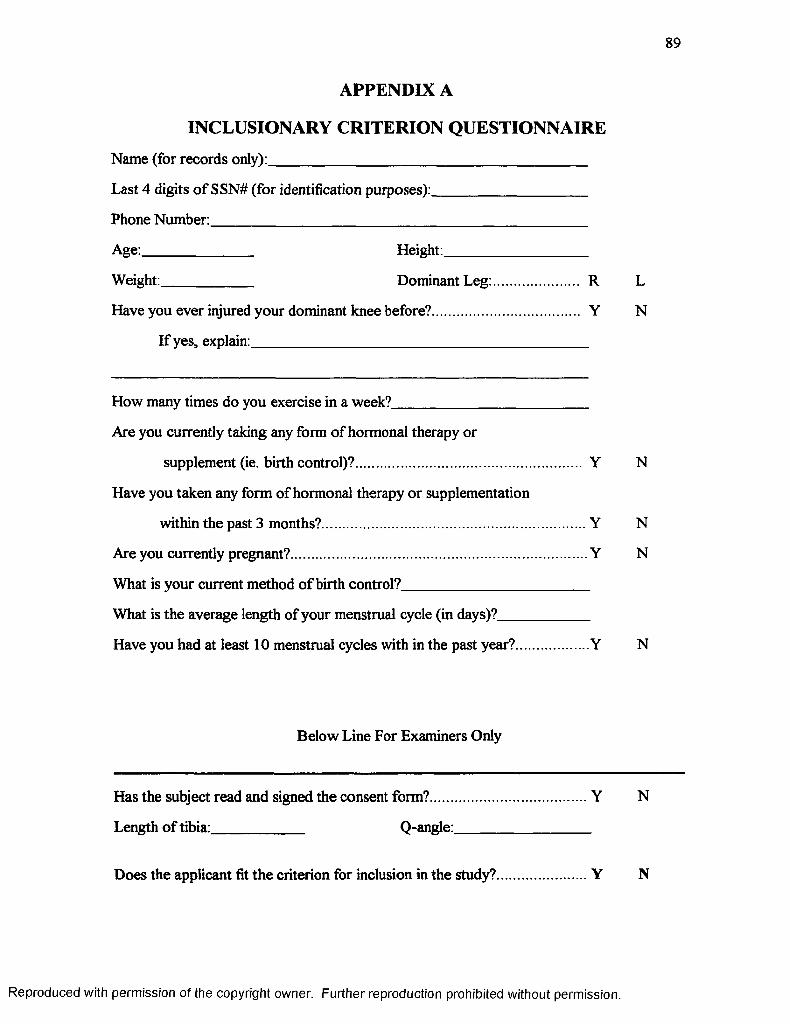
89
APPENDIX A
INCLUSIONARY CRITERION QUESTIONNAIRE
Name (for records only):_________________________________________
Last 4 digits of SSN# (for identification purposes):____________________
Phone Number:_________________________________________________
Age:______________ Height:__________________
Weight:____________ Dominant Leg: R L
Have you ever injured your dominant knee before? Y N
If yes, explain:____________________________________________
How many times do you exercise in a week?_________________________
Are you currently taking any form of hormonal therapy or
supplement (ie. birth control)? Y N
Have you taken any form of hormonal therapy or supplementation
within the past 3 months?........................................................................Y N
Are you currently pregnant?................................................................................Y N
What is your current method o f birth control?________________________
What is the average length of your menstrual cycle (in days)?____________
Have you had at least 10 menstrual cycles with in the past year?.................... Y N
Below Line For Examiners Only
Has the subject read and signed the consent form?........................................... Y N
Length of tibia:____________ Q-angle:__________________
Does the applicant fit the criterion for inclusion in the study?......................... Y N
Reproduced with permission of the copyright owner. Further reproduction prohibited without permission.
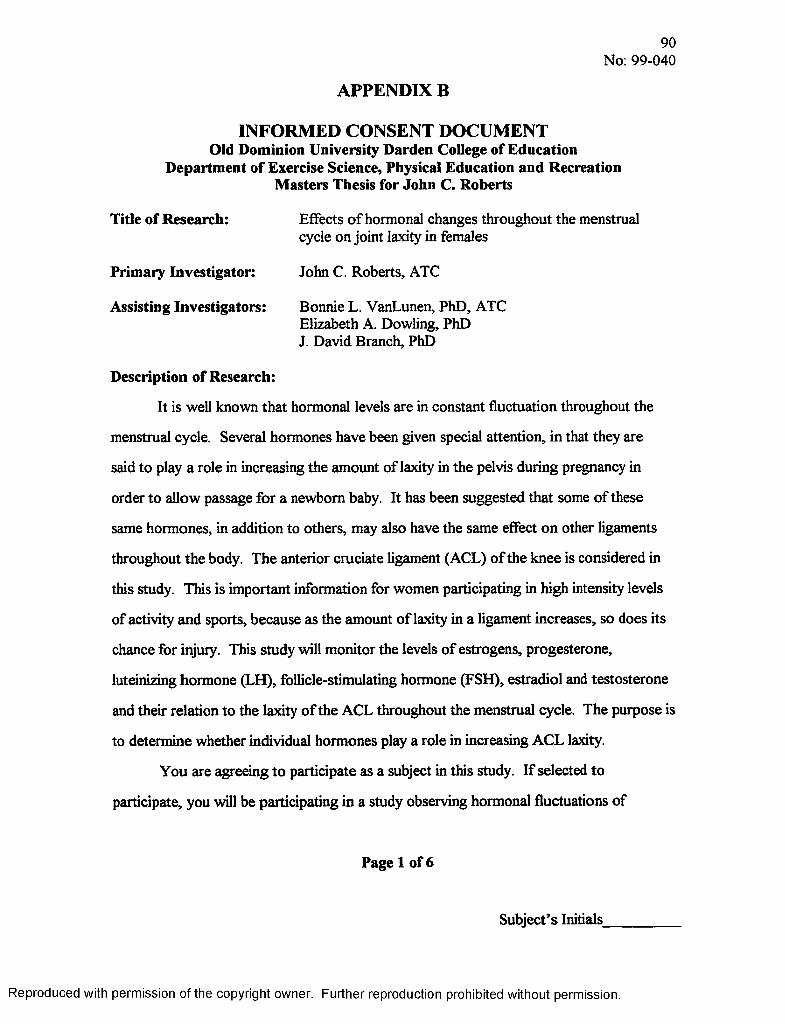
APPENDIX B
90No: 99-040
INFORMED CONSENT DOCUMENT Old Dominion University Darden College of Education
Department of Exercise Science, Physical Education and Recreation Masters Thesis for John C. Roberts
Title of Research: Effects of hormonal changes throughout the menstrualcycle on joint laxity in females
Primary Investigator: John C. Roberts, ATC
Assisting Investigators: Bonnie L. VanLunen, PhD, ATCElizabeth A. Dowling, PhD J. David Branch, PhD
Description of Research:
It is well known that hormonal levels are in constant fluctuation throughout the
menstrual cycle. Several hormones have been given special attention, in that they are
said to play a role in increasing the amount of laxity in the pelvis during pregnancy in
order to allow passage for a newborn baby. It has been suggested that some of these
same hormones, in addition to others, may also have the same effect on other ligaments
throughout the body. The anterior cruciate ligament (ACL) of the knee is considered in
this study. This is important information for women participating in high intensity levels
of activity and sports, because as the amount of laxity in a ligament increases, so does its
chance for injury. This study will monitor the levels of estrogens, progesterone,
luteinizing hormone (LH), follicle-stimulating hormone (FSH), estradiol and testosterone
and their relation to the laxity of the ACL throughout the menstrual cycle. The purpose is
to determine whether individual hormones play a role in increasing ACL laxity.
You are agreeing to participate as a subject in this study. If selected to
participate, you will be participating in a study observing hormonal fluctuations of
Page 1 of 6
Subject’s Initials_________
Reproduced with permission of the copyright owner. Further reproduction prohibited without permission.
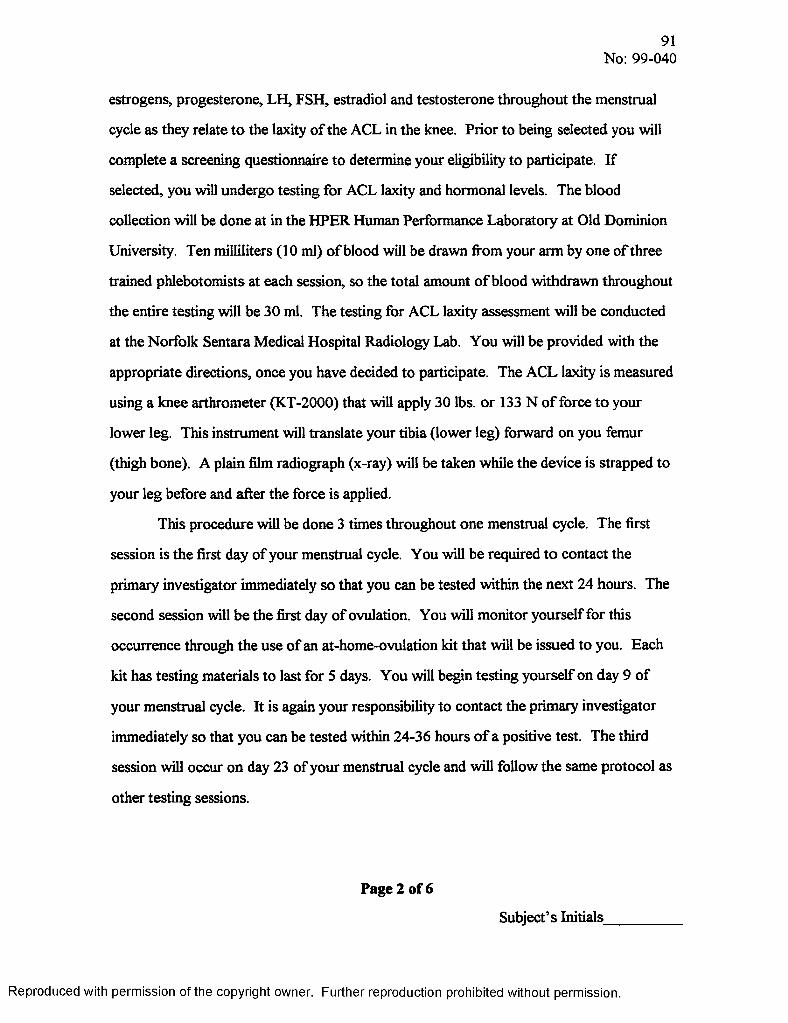
91No: 99-040
estrogens, progesterone, LH, FSH, estradiol and testosterone throughout the menstrual
cycle as they relate to the laxity of the ACL in the knee. Prior to being selected you will
complete a screening questionnaire to determine your eligibility to participate. If
selected, you will undergo testing for ACL laxity and hormonal levels. The blood
collection will be done at in the HPER Human Performance Laboratory at Old Dominion
University. Ten milliliters (10 ml) o f blood will be drawn from your arm by one of three
trained phlebotomists at each session, so the total amount of blood withdrawn throughout
the entire testing will be 30 ml. The testing for ACL laxity assessment will be conducted
at the Norfolk Sentara Medical Hospital Radiology Lab. You will be provided with the
appropriate directions, once you have decided to participate. The ACL laxity is measured
using a knee arthrometer (KT-2000) that will apply 30 lbs. or 133 N o f force to your
lower leg. This instrument will translate your tibia (lower leg) forward on you femur
(thigh bone). A plain film radiograph (x-ray) will be taken while the device is strapped to
your leg before and after the force is applied.
This procedure will be done 3 times throughout one menstrual cycle. The first
session is the first day of your menstrual cycle. You will be required to contact the
primary investigator immediately so that you can be tested within the next 24 hours. The
second session will be the first day of ovulation. You will monitor yourself for this
occurrence through the use of an at-home-ovulation kit that will be issued to you. Each
kit has testing materials to last for 5 days. You will begin testing yourself on day 9 of
your menstrual cycle. It is again your responsibility to contact the primary investigator
immediately so that you can be tested within 24-36 hours of a positive test. The third
session will occur on day 23 of your menstrual cycle and will follow the same protocol as
other testing sessions.
Page 2 of 6
Subject’s Initials_
Reproduced with permission of the copyright owner. Further reproduction prohibited without permission.

92No: 99-040
Exclusionary Criteria:
You must be college-aged (18-35 years o f age) and not currently participating in
any form o f competitive athletics. To the best o f your knowledge you cannot present
with knee pathologies of your dominant leg, and that being your right. You cannot
currently be using hormonal therapy or supplementation (ie. birth control) and have
minimal risk of becoming pregnant during the course of the study. You must have had 3
consecutive normal menstrual cycles immediately prior to the start of the study that are
not due to hormonal therapy or supplementation and at least 10 within the past year. The
length of your tibia cannot be less than 34 cm., because that would require a smaller
arthrometric device. You cannot have a quadriceps angle (Q-angle) greater than 15°.
Risks and Benefits
When taking radiographs there is a slightly increased amount of radiation
exposure. This total amount of background exposure is considered to be equal to living
in Norfolk for 9 months. The precise risk from such exposure is not known, but is
thought to be small. There is the possibility of bruising and/or soreness due to the
collection o f blood. There is the possibility of infection. Collection of samples, by
trained phlebotomists, will be done under aseptic conditions to minimize these risks.
The benefit to you is that you will each know your own respective amount of
laxity within your knees. This serves as a general predictor as to the chance of injury to
your anterior cruciate ligament.
Cost and Payments:
Your efforts in this study are voluntary. Any information obtained during the
course of this testing will provided to you upon your request based on your willingness to
comply and complete the entire study.
Page 3 of 6
Subject’s Initials_________
Reproduced with permission of the copyright owner. Further reproduction prohibited without permission.

93No: 99-040
Confidentiality:
Any information obtained from this study, including questionnaires, medical
history and laboratory findings, will be kept confidential. Only the primary investigator
and the assistant investigators will have access to your files, in which you will be
assigned a random identification number. The data derived in this study could be used in
reports, presentations and publications, but you will not be referred to by more than your
identification number. However, your records may be subpoenaed by court order or may
be inspected by federal regulatory authorities.
Withdrawal Privilege:
You are free to refuse to participate in this study or to withdraw at any time.
Should you choose to withdraw, your decision will not adversely affect your relationship
with this institution or cause a loss of benefits to which you may be otherwise entitled. If
you decide to withdraw, you agree to undergo all trial evaluations necessary for your
safety and well being as determined by the investigators. The investigators reserve the
right to withdraw your participation at any time throughout this investigation if they
observe any contraindication to your participation.
Compensation for Illness or Injury:
In the event of illness or injury resulting from the research protocol, no monetary
compensation will be made, but immediate emergency medical treatment, including first
aid by the investigators, will be made available to you. If any injury should result from
your participation in this study, Old Dominion University does not provide insurance
coverage, free medical care or any other compensation. If you suffer injury as a result of
your participation in this study, contact the primary investigator, John C. Roberts, ATC,
(xxx-xxxx), who will review the matter with you.
Page 4 of 6
Subject’s Initials_________
Reproduced with permission of the copyright owner. Further reproduction prohibited without permission.

94No: 99-040
Voluntary Consent:
I certify that I have read the preceding sections of this document, or it has been
read to me; that I understand the contents; and that any questions I have pertaining to the
research have been, or will be answered by John C. Roberts, ATC (xxx-xxxx). If I have
any concerns I can express them to Patricia Pleban, Chairperson of the Old Dominion
University Institutional Review Board (xxx-xxxx). A copy of this informed consent form
has been given to me. My signature below indicates that I have freely agreed to
participate in this investigation.
Subject’s Printed Name
Subject’s Signature Date
Witness’s Signature Date
Page S of 6
Subject’s Initials__
Reproduced with permission of the copyright owner. Further reproduction prohibited without permission.

95No: 99-040
Investigator’s Statement:
I certify that I have explained, to the subject whose signature appears on the
previous page, the nature and purpose and the potential benefits and possible risks
associated with participation in this study. I have answered any questions that have been
raised by the subject and have encouraged her to ask additional questions at any time
during the course of this study.
John C. Roberts, ATC
Investigator’s Signature Date
Page 6 of 6
Subject’s Initials__
Reproduced with permission of the copyright owner. Further reproduction prohibited without permission.

0) > o <CD
<5toCD
toco to U)
O) cn p>bi o>
t n c o M m c n c n w c n c o w c n o )c c c c c c c c c c c cs s s s s s s s s s s sC D C D < D < D C D C D C D < D C D C D C D CD*a a a s a s a s a a a s-‘ -‘ -‘ c o a o r o o i - u w M - i to ->• o
C O t O I O I O I O - ^ I O I O t O I O C O l OU W ' J W M M - i M O I O A U
c o <oc n ^ - o c n
co to -Clbo co
O) Ol CD >1 >1 O) O) >1 M CD Ol W IO M O lO )tO >IN )00>loaic n c n -»■ c n —i a > c n — o s a O O U t O^ O O OO DA o to to ->■
f f l c n c n o - ^ c n - ^ c n w c D c n o
£3.CTCCD(/>
><nCD
s?s*
XCDCO*
g - DCD i <Q >
COCOCOCOO) cn CJI COCOo p© o cn cn o o o
CO CO ■si 4*. CO CO 00 ■*.cn cn o cn cn
O) o> cn cnio o> 00COCO COo> ■s| o ■si
0)cnmo>NiooO)(oo i ^cnb)bobob)^0 ) U 1 | V 3 0 ^ n 1 C O O
o> O) cn cn o> o> cncn VOo> COIOo ■sio o b> o VOCOCOCOo IOIOo> COCO
COsi 00 O) (Oocn ^ o> ro 0 0 ) 0 1 ^ 0
o> o> cn cn—* cn to o> CO© ro roo COo> cn VO
O) cn cn o> o> 00 o> COO0)
o> COCO roio io cn b CO*o>b> COcn COo COSj COCO«-s.to
CDCD < 2 . 0 ) CD
g*o-SL3 £
cS
3 5CO CD
5 a^ 8- ko
O
! io" lo 3 “ E?CO
Has2STOs • •
£©asas
so.<■
c/>cs:nn
©CD3oera“!as•anco
►*0*ew2!OMXo
NOON
Reproduced with permission of the copyright owner. Further reproduction prohibited without permission.

97
APPENDIX D
Table 7: Raw Data for Individual Subjects’ Time Intervals for Testing Sessions and Percent Volume Changes in Hematocrit and Hemoglobin.
Menses-Test Menses - Ovulation - Menses - Day Ovulation - %APV - %APV - DayTime/%APV (hrs) Ovulation (hrs) Test (hrs) 23 (hrs) Day 23 (hrs) Ovulation 23Subject 1 19.50 225.50 10.50 523.25 297.25 -1.63 4.98Subject 2 16.00 390.00 9.75 544.50 154.50 -2.91 -1.62Subject 3 20.00 201.00 15.00 523.00 322.00 0.64 2.39Subject 4 17.00 221.00 34.00 519.00 298.00 -6.73 -2.52Subject 5 16.50 182.00 26.00 518.00 336.00 -18.86 -4.89Subject 6 26.25 216.00 16.00 506.00 290.00 -16.70 -14.81Subject 7 35.00 329.75 29.25 541.00 211.25 -4.56 2.83Subject 8 17.00 353.00 34.00 531.00 178.00 0.64 -8.07Subject 9 35.50 296.00 13.50 538.25 242.25 -3.08 -6.33Subject 10 24.50 262.00 21.50 451.50 189.50 1.41 -0.22Subject 11 20.00 293.00 19.50 525.25 230.25 3.71 2.56Subject 12 34.00 274.00 12.00 519.00 245.00 -13.64 -32.29Average 23.44 270.27 20.08 519.98 249.50 -5.46 -4.83SD 7.54 64.63 8.83 24.19 59.28 7.70 10.29
Rep
rodu
ced
with
pe
rmis
sion
of
the
copy
right
ow
ner.
Furth
er
repr
oduc
tion
proh
ibite
d w
ithou
t pe
rmis
sion
.

CO > CO CO CO CO CO CO CO CO CO CO CO COD < e C c c c c c c c c c c:CDjy & S & S S 5* jyS S’3 cd’ CD* CD* CD* cd’ CD CD* CD’ cd’ CD* CD cd’COCD a a a a a a a a a a a a
_a CD 00-si 03cn 4a CO roro o
CO ro CO CO CO CO CO CO CO CO CO CO CO4*> <J1_a -si ro o> CD 03-sj 03<0 oo 00oo<0 CO b>CO 1a io CD o CO b 1a b 1a cn-ft CJ» o o o o © o O o O o O o
_* o o o o o CO o o o ob 00o b 1a b b b b b b4* 00o o 0000CO o 03CO o o
% x » v-A IO CD -A -A -A ro -A IO —A ro to CO COio b io 1_A ’o> cn o CD <n4A 4x b4̂ 4a o> CD cn o> cn cn cn 00A
o o o o o o o o o Ao004a b o b io cn io b 4A 1ao 4*o -s| ro -si CD CD 4a 00
CO CO CO CO CO CO CO 4a. 4a 4a CO CO COCO 00ro a> cn 00 00 03CO O A 4a CD pio b io CD b b b cn b b ■sj b cn
o o CO P o v o -A oCD 1a 1a cn b io b b b004a ro 0000O 4a ro -s|
—Aro CO o -A -A ro -A CO CO ro CO CO COCO io b io b b 4A b io b io b bCO -s| cn O) 00 o> -s| CO CD o ro CD
o ro ro A o o o ro oCO 4a io io ‘co b o ’o 1a 1a bro cn © o> cn cn 03o CD 4a CO 03
CO CO CO CO CO 4a CO 4a CO CO CO COro 00 IO 00 -sj CD O cn to 03O CO CD -siCO at o b b ’oo b b -A
o o o o o o IO ro ob io 1a CO b 4* b cn CD b b 1acn 00CD O) CD o CD o 03ro
-A -A —A _ A - A .A — A mAro « A o o CO o CO ro ro ro p pb 1a *s| b > b b 4a CD 1a cn o 1a ioCD -n | cn -si -s| CD o cn IO o CD 03
o a o o - A o ro o cn oo CO b io b CO b o b cno 00o 03CD cn 00-si o cn
2 X| a(A * 3 CD O'* (/> w
S XCD O 3 i W r\ CD </> <
3 I (/) CT CD (/>
i 1© tp-58 OS <
E. ao> ■rs
9 xef. O o <3o<E. X g <=ro’3
< X £ 7* g oo ’ <3
s i>< ^ io ^ oaa x.04 o h< ito Q 0 4 <
O04 -r -K 5io0 4
P 1.04 o'Xro Q0 4 <
HOS2SToo09
sa<'als2L(/>e«En
931
s?S's**1B»309en■7
B«3eH©a*5*
>*0wZoMXm
*o00
Reproduced with permission of the copyright owner. Further reproduction prohibited without permission.

CDO ,O -<S -ccdc/a3
T3CDC/3CD3
ETOC/3CD
c ro<CD
c rO3
CD
3co"OCDOr-t-< ’CDOcr03d 'rto.»S3aa .033.oc5fD
CO >a <CD03
CQCD
cn ~4
0) CO CO CO CO CO CO CO CO CO CO COc e e c c c c: c e c e c£ T ,CT & S s & & S s *5! S *cd* CD* cd* CD* CD* CD* CD* CD* CD* CD CD CD*a a a a a a a a a a a a
—k _k CO 00 •■o o> CJI CO ro _kfO o
toIO tO ho o o ro aJh IO ■si —*c n CJI CO CJI o CO o o> o CO o o
to COo —* o CO ro to o ■pk o -s ib 0 0 CO b 00 CJI b CO *o
o oCO CJI
0 0 ^ 0 0 0 0 0 0 0 0 0 03 03:--*-'cocri^.Kscrik)cnkjN3
o CO CO o IO o -A o o o*■* 's i CO CO ■s| b b to 4k 4k CO
CO CJl cn CO 4 k o> CJI ro CO A 4k •s j CJI00 CJi 4k io 4k b 4 k b b
_k coro CO o 4k ro o CO ro o roCO "■si *co o (J l 4k b CJl ‘o CO o b
ro CO to CJl -s i ro o> 00 p 00 o> —k oCJI 00 o b cn o o b b b b
CO ro o> •pk CO o o> CJl 4 kb b CO *cob b b b b b
cn O) CJl a ■sj o> CO CO 4k CJl o> 00 CJlCJl o> cn o © CO CJl o> o to to
ro CO o o o CO o 4k to CJlo io CO 's i b b> 4k b b b io b
o o o o o o e O O o o o o oCO io io *4k 00 io io io io io b 4k b
o o o o o o 00 O oio b b b b o o io Lk
m§
mIo<
3KQ
o<X?cs'
XI0 <ncoX1 c 3ncoXIo<mro
8
m
o<
CQ3
7 *O<
Ha2aoecr
a5 'ae&VisS .8
*
0&S3
s*«r
PC©n3os5LnesaaS«■
3
esM
2fDS
<DC/3
VOVO
Reproduced with permission of the copyright owner. Further reproduction prohibited without permission.
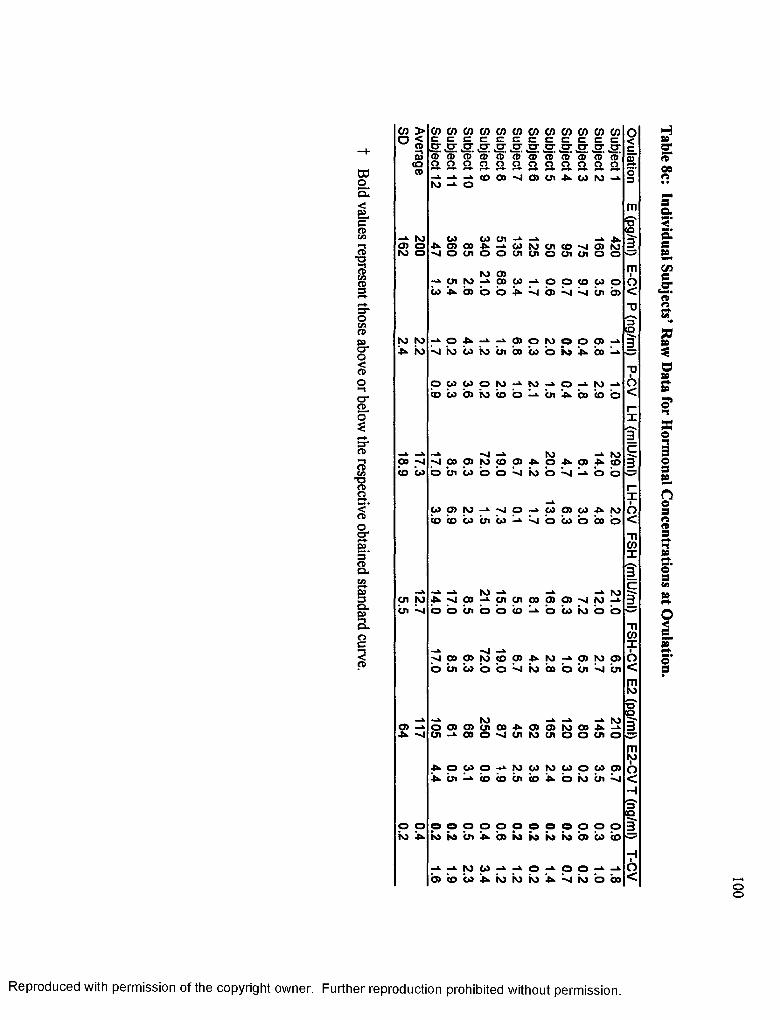
00
<3Ca>w* 1
3C/3CDP
O cn CD
CJ*o<cd
o*CLo*
g*3cnTJCD
3<CDocrp4s3*Q-P93C l3<-ia .oc3cd
co > o <CD
2(OCD
—*■ r o0 5 Oro o
r o r o ^ t o
oo -o co w
c o c o c o c o c o c o c o c o c o c o c o c oc c c c c c c c c c c cCO CD CDo a Of***- aro o
CD CD o oCOOO'nICDOi AUNJ-^
03 os cn —̂ ^.oooojv-^Gorocnco-oajro - o o c n o o c n c n o c n c n o oro oo —*■ cn to —*• co co
co ^ b> 'o o co co o 05 *n| cn 05
- ‘ O A - ‘ - * f f l O W O O
s 'ro c o r o o i c o c o 'o n a
o>bo
o c o c o o r o - ‘- to - ‘ 0 ->-ro-».< o u b ) i o ( o b ^ u i ^ c o ( o b
-»• - J -»■ t o-O 00 05 to co 05 -U- O -Uo bi io b o o io o "
->■ r o05 4>- COs ^ o o
w p m s | o - » CO 0 5 c o r o b b i o a i t o ^ s b u b b o b
-A. A .A to -A tocn ro 4k 00 cn cn CO 0) CD -o to abi b b bi b b b b bo io b b
A -n|>1 00 o> to CO o> 4k to —k o> to o>b bi b> o o io b o bi bi
ro A roO) o o> o> CJl 00 4k a> o> to 00 4kUl 00 o ■̂i cn to cn o o cn o
4k o oo o A to oo to oo o oo CDbi CD b bi b 4k o io bi
o o o o o o o o o O o o o oto io io bi b to io io io b> 00 b
to 00 a o _k o ob> CO bo io io io 4k 4̂ io o bo
mroCQ
0 <ncox1 c§■
- ncoxio<mr o
[S'I Q
mo<H31ko
O<
Has«rS'00o
sa<’asSLczjccE»rs
aa*0as»3snno"13o3&no3«CD
aso '3cn
o<c_o ’«■o '
oo
Reproduced with permission of the copyright owner. Further reproduction prohibited without permission.

DOo£<p_ccdcn—iCD*o3cnCD
3*OcnCD
O'O<CD
O'cd
OZf+cra3C/3•oroS<oa*B.3CDCl .
3Cu5?
Oc3CD
CD >a <CDa><aCD
ro io cn -»■ cn cn
cncocococococococococncoc c c c c c c c c c c cS S S S S S S S S S S SCD CD CD CD CD CD CD CD CD* CD* CD* CD*a a a a a s s s s a s s- k - k - ‘ C O O O ' J O O l A W M - i ro -»■ o
ro ro 00 ro00 CJI ro o> o O) CDro COto ro 001* CDo o b b o b bo b b b
ro a o o ro o ro00 bo io b b a> io a> io
I O . 3
W CD
IO CJ)o io
ro
o o !». to
cn co 03 co 03 cn oo oro ro
U CD > 1 O > 1 A A 03 o o o o cn cn
_ cn rop A A O W ^ O Q ^ C D ^ W0 3 0 3 a 3 c 3 - ' 4 :~j'obo'r'ocn'oo
cn
co o
N) 0)^N) -<J |0>0) N) b)a ' 4cocD^cnro(3co4».coboi3o<3
ro^ » O l S - ‘ M M O l p O O O O-oio ' co^^- iotobsoco 'oo^-
p co cn cn cn cnO ^ 03 A CO ^ D>
-3 cn 3 —*■ 03io ^ co o o
p - ^ c n c n i o r o o o c n 0 3 c o 0 )( o b i r o i w u b u i b s i o b b
IO _k _v0 - j O )C JO vIOJ'J<DO3O-D.o o c n c o c n o c n o o c n o o o c n o
l o w o i r j o i o o M r o M - i Ab>b>^ :-sib>c3i3cob>^cocn
p o p o o o o p p o o oiob3k»io^>ioioiotob>co^
O O l k U l - ' ^ U l O - ' O U O■^ibs^bscocncniobs-^^co
O03<IOCO
m£|mio<
X
1c3
XI0 <ncoX
1 c 3
ncoXIo<mIO
$3
mroIO<
to3
712
H3garOSa
a2*a
CfleCDrt
£*oSB
S's*■n«©**3o
nes«CD3•l3
cn3«•e•51a
Reproduced with permission of the copyright owner. Further reproduction prohibited without permission.

CD >a <CD03COCD
0) CO CO CO CO CO CO CO CO CO CO COc C £ £ c e c e £ c £ c2 2 2 & 2 ! S ’ *2* 2 5 * 5*2
CD- CD CD* CD* CD* CD CD* CD* CD* CD* CD* CD*a a a a a a a a a a a a«At o
aO
CO 00 -sj o> O l CO ro
CO to CO ro ro CO CO o>4* Ol oCO 00 K) o ro a io *00b _A coOl Ol -si ro Ol o Ol cn IOOl -4 o ro -0COo cncno o o o Ol o Ol o Ol cn
V V
IO00 O l O) o O l 00O ) - A ro4̂ ro bi o io bi io kio CO o o O l O l O l o O l O lCO IO o o o o o o o o
> J s j Oo o o o o o
-*• O l CO ro p O l ro O ) c n IO 0 3CO o b> 1a b i 1a io b> o b> o- s | O l o O l ro IO o ro cn ro o ro oCO 00o o o O l O l o O l o O l o O l o
IO00 00O) O) -4 CO : i oo 0000Ol ooio io o io b i b i io o ro b io b b io -4 o Ol Ol o o Ol o cno Ol o oCO —*■o o o o o o o o o o o o
4*p 0303p Ol O) p P ro Olb>bi 03 io o 1a 00bob b 03 io b bCO o -4 Ol o ro •-4 -si IO ro -sj Ol o roo>o 00o o Ol Ol Ol Ol Ol Ol o o Ol
- s i 03COp 00 - s i - s i 00o 03 -si ob b b b i b b i b i b i b i b i -si bCO00Ol o o o Ol o o o o o Ol o0 3 00o o o o o o o o o o o o
*s,CD= S£t/1 «■—. CD 3w i
33
9 8£ 03 — *< 0) ^
I I
1 3s 3 o 3
* g £
h< »< N) 3 03 =3
3
oto
Reproduced with permission of the copyright owner. Further reproduction prohibited without permission.
Table 8e:
Individual Subjects’ Raw Data
for Laxity R
eadings

Figure 14a:
Standard curve
for estrogens (03/08/01).
[Total Estrogens] (pg-mr )
ooooo
Im(0»*■3(Qo3(A
CD00
toO lb>
coCOO l
O lIOCO
cn
00
00
00p
oo
Reproduced with permission of the copyright owner. Further reproduction prohibited without permission.
10000
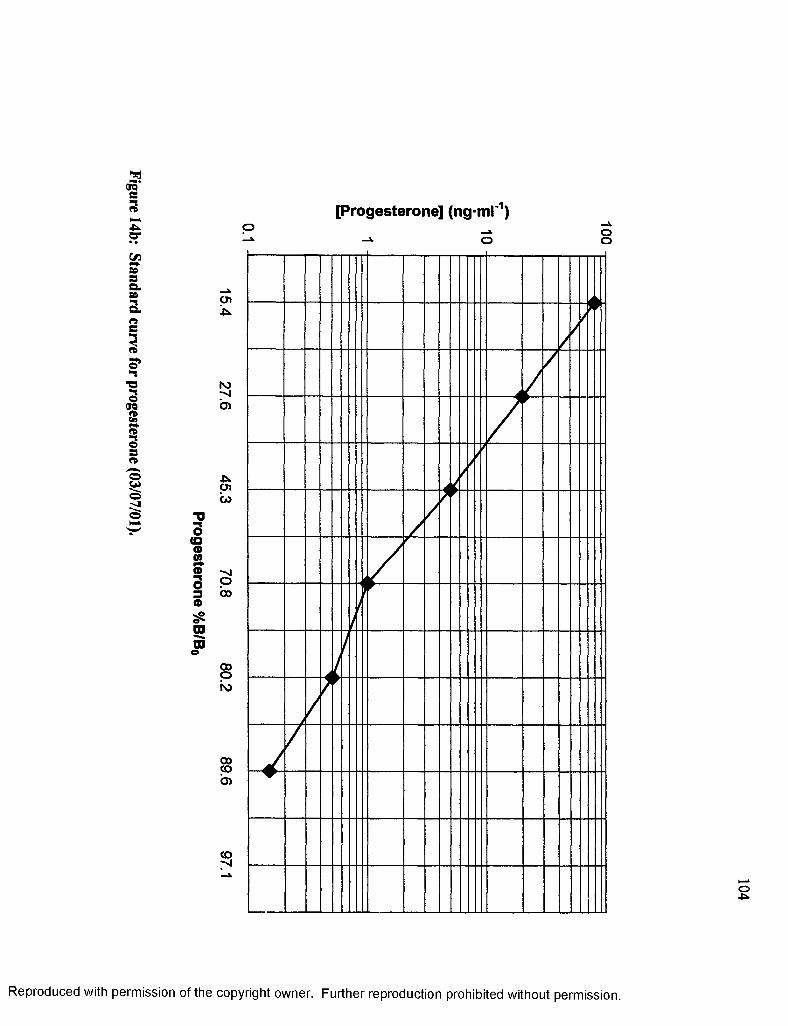
Figure 14b:
Standard curve
for progesterone
(03/07/01).
[Progesterone] (ng-ml'1)
o(Q©0)©s3«raCD
o
45kCJl03
00oKj
00CO'a
o-p>.
Reproduced with permission of the copyright owner. Further reproduction prohibited without permission.
100
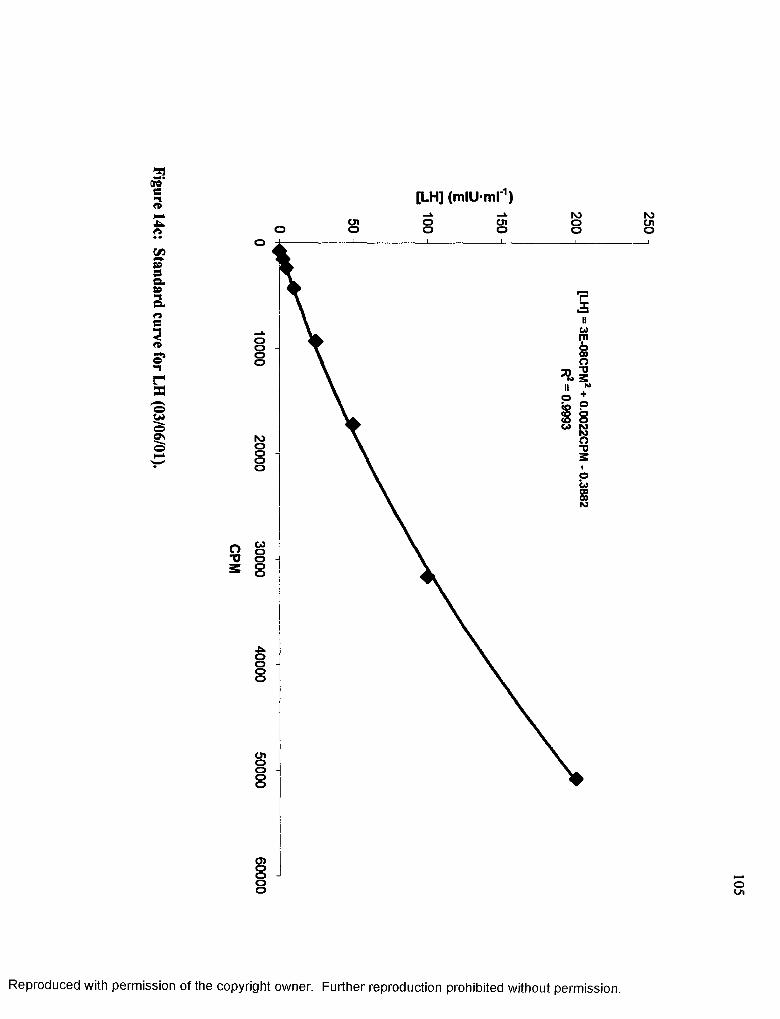
Figure 14c:
Standard curve
for LH (03/06/01).
[LH] (mlU-ml'1)Olo oo Olo ooo
o
oooo
NJooooCO
COoooo
-Uoooo
Oloooo
o>oo
Reproduced with permission of the copyright owner. Further reproduction prohibited without permission.
250

Figure 14d:
Standard curve
for FSH (03/06/01).
[FSH] (rnlU-mr1)cno oo cno oo
o
u
McnOoo
<0toOStn
OOOO
to
o cn TO o3 ° “ o
tooooo
rocnooo
coooo
Reproduced with permission of the copyright owner. Further reproduction prohibited without permission.
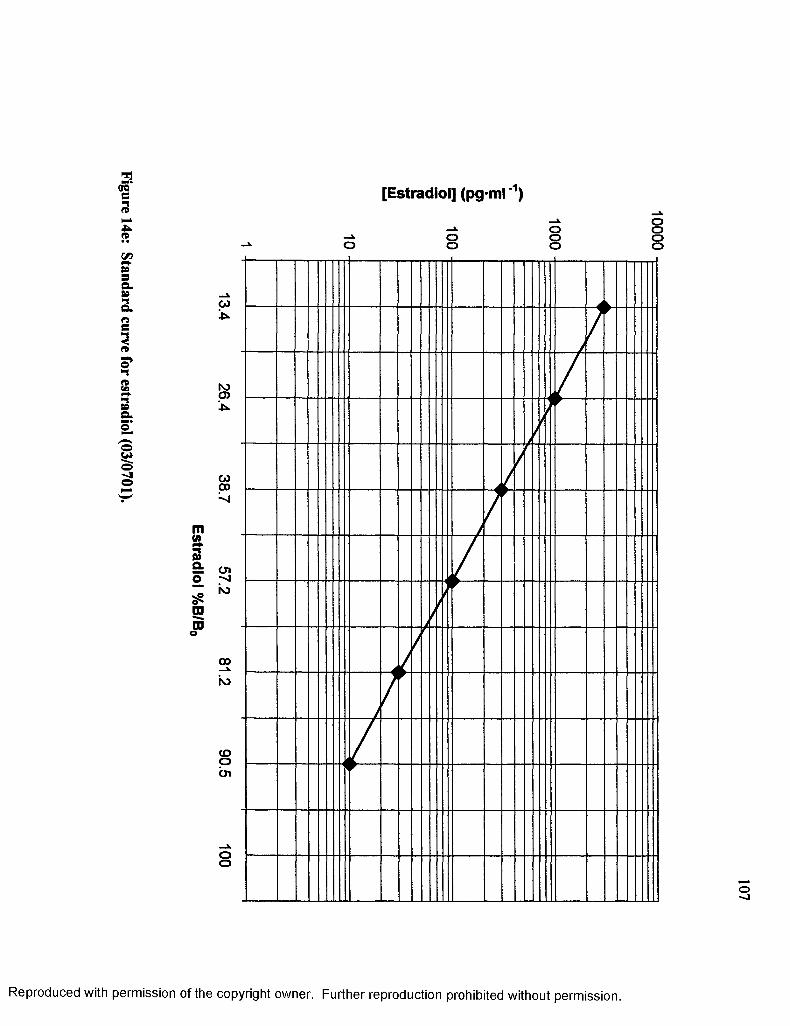
Figure 14e:
Standard curve
for estradiol (03/0701).
[Estradiol] (pg-ml'1)
-»• oo oo o
roo>■fc.
00oo
01-v |io
oo
cooCJl
oo
Reproduced with permission of the copyright owner. Further reproduction prohibited without permission.
10000
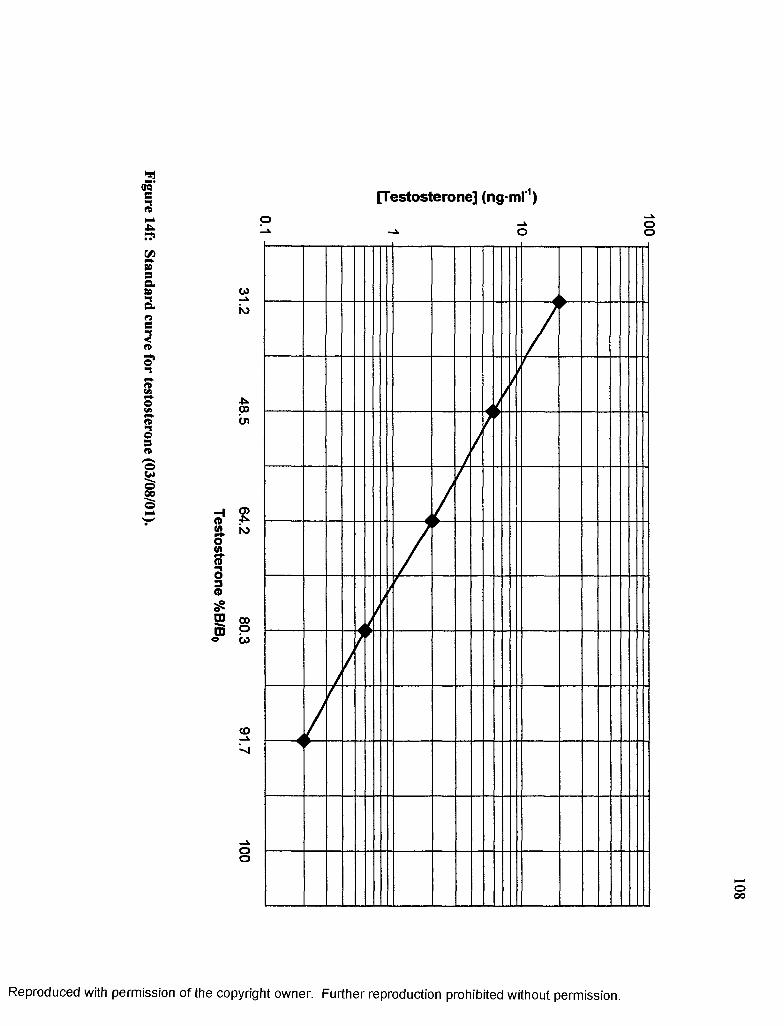
Figure 14f:
Standard curve
for testosterone
(03/08/01).
[Testosterone] (ng-ml'1)o ooo
CO
ro
o>•T*N)
CO_i
oo
Reproduced with permission of the copyright owner. Further reproduction prohibited without permission.
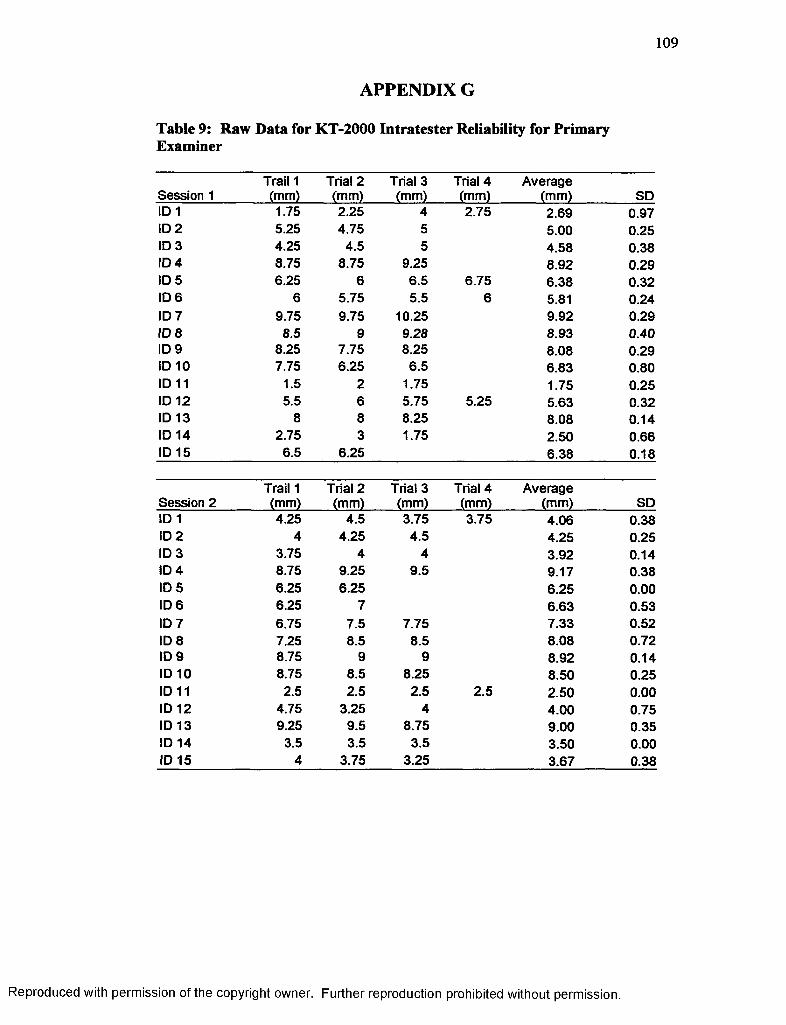
109
APPENDIX G
Table 9: Raw Data for KT-2000 Intratester Reliability for Primary Examiner
Session 1Trail 1 (mm)
Trial 2 (mm)
Trial 3 (mm)
Trial 4 (mm)
Average(mm) SD
ID 1 1.75 2.25 4 2.75 2.69 0.97ID 2 5.25 4.75 5 5.00 0.25ID 3 4.25 4.5 5 4.58 0.38ID 4 8.75 8.75 9.25 8.92 0.29ID 5 6.25 6 6.5 6.75 6.38 0.32ID 6 6 5.75 5.5 6 5.81 0.24ID 7 9.75 9.75 10.25 9.92 0.29ID 8 8.5 9 9.28 8.93 0.40ID 9 8.25 7.75 8.25 8.08 0.29ID 10 7.75 6.25 6.5 6.83 0.80ID 11 1.5 2 1.75 1.75 0.25ID 12 5.5 6 5.75 5.25 5.63 0.32ID 13 8 8 8.25 8.08 0.14ID 14 2.75 3 1.75 2.50 0.66ID 15 6.5 6.25 6.38 0.18
Trail 1 Trial 2 Trial 3 Trial 4 AverageSession 2 (mm) (mm) (mm) (mm) (mm) SDID 1 4.25 4.5 3.75 3.75 4.06 0.38ID 2 4 4.25 4.5 4.25 0.25ID 3 3.75 4 4 3.92 0.14ID 4 8.75 9.25 9.5 9.17 0.38ID 5 6.25 6.25 6.25 0.00ID 6 6.25 7 6.63 0.53ID 7 6.75 7.5 7.75 7.33 0.52ID 8 7.25 8.5 8.5 8.08 0.72ID 9 8.75 9 9 8.92 0.14ID 10 8.75 8.5 8.25 8.50 0.25ID 11 2.5 2.5 2.5 2.5 2.50 0.00ID 12 4.75 3.25 4 4.00 0.75ID 13 9.25 9.5 8.75 9.00 0.35ID 14 3.5 3.5 3.5 3.50 0.00ID 15 4 3.75 3.25 3.67 0.38
Reproduced with permission of the copyright owner. Further reproduction prohibited without permission.

1 1 0
APPENDIX H
Table 10: Raw Data for KT-2000 Intratester Reliability for Primary Examiner
ID # First Reading (mm)
Second Reading (mm)
Average(mm)
StandardDeviations
1 7.38 9.25 8.32 1.322 .13 2.50 1.32 1.683 5.00 3.38 4.19 1.154 4.88 6.00 5.44 0.795 6.25 6.00 6.13 0.186 3.13 4.63 3.88 1.067 3.75 3.50 3.63 0.188 2.25 6.63 4.44 3.109 2.00 2.38 2.19 0.2710 3.25 2.00 2.63 0.8811 4.13 4.38 4.26 0.1812 2.88 1.75 2.32 0.8013 6.00 8.13 7.07 1.5114 2.63 2.48 2.56 0.1115 5.00 5.38 5.19 0.2716 6.63 6.38 6.51 0.1817 2.25 2.13 2.19 0.0818 5.13 5.75 5.44 0.4419 4.50 3.13 3.82 0.9720 5.13 5.13 5.13 0.0021 2.63 2.63 2.63 0.0022 3.75 3.00 3.38 0.5323 5.00 5.13 5.07 0.0924 4.75 5.25 5.00 0.3525 5.63 5.75 5.69 0.0826 2.00 3.00 2.50 0.7127 6.25 2.25 4.25 2.8328 3.38 3.88 3.63 0.3529 4.63 4.00 4.32 0.4530 3.63 6.00 4.82 1.6831 1.88 1.00 1.44 0.6232 3.13 2.75 2.94 0.2733 6.00 6.13 6.07 0.0934 3.25 3.38 3.32 0.0935 5.38 4.88 5.13 0.35Average 4.10 4.28 4.19 0.13
Reproduced with permission of the copyright owner. Further reproduction prohibited without permission.

I l l
APPENDIX I
Table 11: Repeated Measures ANOVA Calculations for Observing Differences in Laxity Measurement Methodologies Verses Time.
SourceSum of Squares df
MeanSquare F-value P-value
Main Effect for Methodology 266.890 1 266.890 74.654 <0001
Error(Methodology) 39.325 11 3.575
Main Effect Over Time 1.523 2 .762 .470 .631
Error (Time) 35.647 22 1.620
Interaction for Methodology Over Time
5.510 2 2.755 1.201 .320
Error (Methodology vs Time)
50.450 22 2.293
Reproduced with permission of the copyright owner. Further reproduction prohibited without permission.

112
APPENDIX J
Table 12: Repeated Measures ANOVA Calculations for Observing Changes in Displacement of the Lateral and Medial Compartments.
SourceSum ofSquares df
MeanSquare F-value P-value
Main Effect for Compartment .014 1 .014 .001 .976
Error(Compartment) 541.924 35 15.484
Reproduced with permission of the copyright owner. Further reproduction prohibited without permission.

APPENDIX K
Table 13: Raw Data for Displacements of Medial and Lateral Compartments.
ID # MedialDisplacement
(mm)
LateralDisplacement
(mm)1 6.50 8.252 3.25 3.503 3.00 7.004 2.00 11.505 11.00 1.506 1.75 8.007 1.50 6.008 8.75 -4.259 1.50 2.5010 1.00 5.5011 6.25 2.0012 .75 4.0013 4.00 8.0014 4.25 1.5015 2.25 7.7516 3.00 10.2517 10.00 5.5018 5.75 4.5019 1.75 7.2520 9.75 .5021 3.75 1.5022 7.00 .5023 4.75 5.2524 5.00 4.5025 1.25 10.0026 .75 3.2527 3.50 9.0028 2.75 4.0029 8.25 1.0030 2.5 3.7531 1.00 2.7532 10.00 1.7533 5.00 1.2534 9.75 2.2535 3.75 2.7536 4.5 6.25
Reproduced with permission of the copyright owner. Further reproduction prohibited without permission.

114
REFERENCES
1. Wojyts, EM, Huston, LJ, Lindenfeld, TN, Hewett, TE, Greenfield,MLVH. Association between the menstrual cycle and anterior cruciate ligament injuries in female athletes. Am J Sports Med. 1998;26(5):614- 619.
2. Heitz, NA, Eisenman, PA, Beck, CL, Walker, JA. Hormonal changes throughout the menstrual cycle and increased anterior cruciate ligament laxity in females. JA th l Train. 1999;34(2): 144-149.
3. SperofF, L, Glass, RH, Kase, NG. Clinical Gynecologic Endocrinology and Infertility. 2nd ed. Baltimore, MD: Williams & Wilkins Co; 1978:38-39, 49-60.
4. Yen, SSC, Jaffe, RB. Reproductive Endocrinology: Physiology, Pathophysiology and Clinical Management. 2nd ed. Philadelphia, PA: WB Saunders Co; 1986:201-230.
5. Owen, JA. Physiology of the menstrual cycle. Am J Clin Nutrition. 1975;26:333-338.
6. Hadley, ME. Endocrinology. 2nd ed. Englewood Cliffs, NJ: Prentice Hall; 1992:481-485.
7. Moller-Nielson, J, Hammer, M. Sports injuries and oral contraceptive use: is there a relationship? Sports Med. 1991;12(3): 152-160.
8. Karageanes, SJ, Blackburn, K, Vangelos, ZA. The association o f the menstrual cycle with the laxity o f the anterior cruciate ligament in adolescent female athletes. Clin J Sport Med. 2000;10(3): 162-168.
9. Gray, J, Taunton, JE, McKenzie, DC, Clement, DB, McConkey, JP, Davidson, RG. A survey if injuries to the anterior cruciate ligament of the knee in female basketball players. Int J Sports Med. 1985;6:314-316.
10. Arendt, E, Dick, R. Knee injury patterns among men and women in collegiate basketball and soccer: NCAA data and review of literature. Am J Sports Med. 1995;23(6):694-701.
11. Saunders, CS. The active women special health concerns. Patient Care. 32(12): 184-185.
12. Ireland, ML. Anterior cruciate ligament injury in female athletes: epidemiology. J A th Train. 1999;34(2): 150-154.
Reproduced with permission of the copyright owner. Further reproduction prohibited without permission.

115
13. Arendt, EA, Agel, J, Dick, R. Anterior cruciate ligament injury patterns among collegiate men and women. J Ath Train. 1999;34(2):86-92.
14. Moller-Nielson, J, Hammer, M. Women’s soccer injuries in relation to the menstrual cycle and oral contraceptive use. M ed Sci Sports Exerc. 1988;21(2): 126-129.
15. Gwinn, DE, Wilckens, JH, McDevitt, ER, Ross, G, Kao, TC. The relative incedence of anterior cruciate ligament injury in men and women at the United States Naval Academy. Am J Sports Med. 2000;28( 1):98-104.
16. Knee Ligament Arthrometer Buyers' Guide. San Diego, C A: MEDmetric Corp; 1995.
17. Staubli, HU, Jakob, RP. Anterior knee motion analysis: measurement and simultaneous radiography. Am J Sports Med. 1991; 19(2): 172-177.
18. Athletic Training and Sports Medicine. Rosemont, EL. American Academy of Orthopaedic Surgeons. 1991:317-323, 329-338.
19. Magee, DJ. Orthopedic Physical Assessment. 2nd ed. Philadelphia, PA: WB Saunders; 1992:372-374, 392-406.
20. Amheim, DD, Prentice, WE. Principles o f Athletic Training. 9th ed. Madison, WI: Brown & Benchmark, Publishers; 1997:470-476,482-494.
21. Norwood, LA, Cross, MJ. Anterior cruciate ligament: functional anatomy of its bundles in rotary instabilities. Am J Sports Med. 1979;7(l):23-26.
22. Solomonow, M, Baratta, R, Zhou, BH, Shoji, H, Bose, W, Beck, C,D’Ambrosia, R. The synergistic action of the anterior cruciate ligament and thigh muscles in maintaining joint stability. Am J Sports M ed 1987;15(3):207-213.
23. Netter, FH. Atlas o f Human Anatomy. Summit, NJ: Ciba-Geigy Corp; 1994:478.
24. Joy, BJ, Yeasting, RA, Morse, DE, McCann, P. Arterial supply to the human anterior cruciate ligament. J Ath Train. 1995;30(2): 149-152.
25. Kennedy, JC, Alexander, IJ, Hayes, KC. Nerve supply of the human knee and its functional importance. Am J Sports M ed 1982;10(6):329-335.
26. Schutte, MJ, Dabezies, EJ, Zimny, ML, Happel, LT. Neural anatomy of the anterior cruciate ligament. JBone and Joint Surg. 1987;69(2):243- 247.
Reproduced with permission of the copyright owner. Further reproduction prohibited without permission.

116
27. Schultz, RA, Miller, DC, Kerr, KS, Micheli, L. Mechanoreceptors in human cruciate ligaments. JBone and Joint Surg. 1984;66(7). 1072-1076.
28. Hoppenfeld, S. Physical Examination o f the Spine and Extremities. Norwalk, Conn: Appleton and Lange; 1976:173-187.
29. Bonci, CM. Assessment and evaluation of predisposing factors to anterior cruciate ligament injury. J Ath Train. 1999;34(2): 155-164.
30. Decoster, LC, Bernier, JN, Linsay, RH, Vailas, JC. Generalized joint hypermobility and its relationship to injury patterns among NCAA lacrosse players. J Ath Train. 1999;34(2):99-105.
31. Rosene, JM, Fogarty, TD. Anterior tibial translation in collegiate athletes with normal anterior crutiate ligament integrity. J Ath Train.1999;34(2): 93-98.
32. Bjordal, JM, Amoy, F, Hannestad, B, Strand, T. Epidemiology of anterior cruciate ligament injuries in soccer. Am J Sports Med. 1997;25(3): 3 51 - 345.
33. Anderson, AF, Lipscomb, AB. Preoperative instrumented testing of anterior and posterior knee laxity. Am J Sports Med. 1989;17(3):387-392.
34. King, JB, Kumar, SJ. The Stryker knee arthrometer in clinical practice.Am J Sports M ed 1989;17(5):649-650.
35. Kowalk, DL, Wojtys, EM, Didher, J, Loubert, P. Quantitative analysis of the measuring capabilities of the KT-1000. Am J Sports M ed1993;21 (5): 744-747.
36. Ballantyne, BT, Fench, AK, Heimsoth, SL, Kachingwe, AF, Lee, JB, Soderberg, GL. Influence of examiner experience and gender in interrater reliability o f KT-1000 arthrometer measurements. Physical Therapy.1995;75(10): 898-906.
37. Fiebert, I, Gresley, J, Hoffman, S, Kunkle, K. Comparative measurements o f anterior tibial translation using the KT-1000 knee arthrometer with the leg in neutral, internal rotation and external rotation. J Orthop Sports PhysTher. 1994;19(6):331-334.
38. Myrer, JW, Schulthies, SS, Fellingham, GW. Relative and absolute reliability o f the KT-2000 arthrometer for uninjured knees: testing at 67, 89, 134, and 178 N and manual maximal forces. Am J Sports M ed 1996;24(1): 104-108.
Reproduced with permission of the copyright owner. Further reproduction prohibited without permission.
117
39. Daniel, DM, Malcom, LL, Losse, G, Stone, ML, Sachs, R, Burks, R. Instrumented measurement of anterior laxity o f the knee. J Bone and Joint Surg. 1985;67(5):720-726.
40. Highgenboten, CL, Jackson, A, Meske, NB. Genucom, KT-1000, and Stryker knee laxity measuring device comparisons: device reproducibility and interdevice comparison in asymptomatic subjects. Am J Sports Med. 1989; 17(6): 743-746.
41. Steiner, ME, Brown, C, Zarins, B, Brownsstein, B, Koval, PS, Stone, P. Measurement of anterior-posterior displacement o f the knee. J Bone and Joint Surg. 1990;72(9): 1307-1315.
42. Beynnon, BD, Fleming, BC, Johnson, RJ, Nichols, CE, Renstrom, PA, Pope, MH. Anterior cruciate ligament strain behavior during rehabilitation exercises in vivo. Am J Sports Med. 1995;23(l):24-34.
43. Guyton, AC, Hall, JE. Textbook o f Medical Physiology. 9th ed. WB Saunders Co. 1996:1037-1039.
44. M osby’s Medical, Nursing, and Allied Health Dictionary. 5th ed. Mosby- YearBook, Inc. 1998:3, 31, 51, 647, 3755.
45. Ford-Martin, PA. Phlebotomy. Gale Encyclopedia o f Medicine, lsted. Gale Research, Inc. 1999:2239.
46. Emst, DJ. Collecting blood culture and specimens. Nursing.1999;29(7): 56-58.
47. Schauberger, CW, Rooney, BL, Goldsmith, L, Shenton, DS, Silva, PD, Schaper, A. Peripheral joint laxity increases in pregnancy but does not correlate with serum relaxin levels. Am J Obstet Gynecol.1996; 174(2):667-671.
48. McShane, JM, Balsbaugh, T, Simpson, Z, Diamond, JJ, Bryan, ST, Velez,J. Letters to the editor. Am J Sports M ed 2000;28(1):131.
49. Wojyts, EM. J. Letters to the editor: author’s response. Am J Sports Med. 2000;28(1):131.
50. Liu, SH, Shaikh, ARA, Panossian, V, Finerman, GAM, Lane, JM. Estrogen affects the cellular metabolism of the anterior cruciate ligament: a potential explanation for female athletic injury. Am J Sports M ed1997;25(5):704-709.
Reproduced with permission of the copyright owner. Further reproduction prohibited without permission.

118
51. Clapp, JF, Capeless, EL, Little KD. The effect of sustained exercise on follicular phase levels of 17|3-estradiol in recreational athletes. Am J Obstet Gynecol. 1993;168:581-584.
52. JAMA. 1995;274(19):1492D(1). Lebrun, CM. Effects of menstrual cycle phase on athletic performance. M ed Sci Sports Exerc. 1995;27:437-444 (Abstract).
53. Lebrun, CM. Effects of menstrual cycle phase on athletic performance. Clinic in Sport Med. 1994;13(2):419-441.
54. Hewett, TE. Neuromuscular and hormonal factors associated with knee injuries in female athletes: strategies for intervention. Sports Med. 2000;29(5): 113-327.
55. Dennison, EA, Pokomy, MJ, Scahill, SA, Smith, TD. Oral contraceptive use appears to have no effect on peripheral joint laxity. Physical Therapy. 1999;79(5):S84.
Reproduced with permission of the copyright owner. Further reproduction prohibited without permission.