Effects of feldspar and salinity on the mineral...
13
ORIGINAL ARTICLE Effects of feldspar and salinity on the mineral sequestration capacity of CO 2 in high-salinity aquifers Qi Fang 1 • Yilian Li 2 • Guojian Peng 3 • Peng Cheng 4 • Junwen Lv 1 Received: 29 October 2015 / Accepted: 6 September 2016 / Published online: 16 September 2016 Ó Springer-Verlag Berlin Heidelberg 2016 Abstract Mineral sequestration of CO 2 is considered to be the safest mechanism in the long-term storage of CO 2 in deep saline aquifers. This study aims to investigate the effect of feldspar and salinity on the mineral sequestration capacity of CO 2 in deep high-salinity brine aquifers by taking Jiangling Depression of Jianghan Basin for instance. Numerical simulation on the long-term geochemical reac- tion and transport was performed by taking TOUGH- REACT as the simulation tool. Simulation results indicate that the effect of feldspar on the mineral trapping capacity of CO 2 does not depend on the total content of feldspar, but depends on feldspar type and relative content. With Mg- rich minerals such as chlorite or dolomite present, the mineral composition abundant in K-feldspar is less favor- able for the mineral sequestration capacity of CO 2 for the reason that a large amount of illite precipitates, consuming a lot of Al 3? in the aqueous solution, thereby limiting the precipitation of dawsonite, especially for the high-tem- perature sedimentary environment. In addition, the effect of salinity on the mineral sequestration capacity of CO 2 represents two aspects: one for the longer migration dis- tance due to the lower solubility of higher salinity and the other for CO 2 mineral trapping capacity per 1 m 3 medium which is not in simple decreased with salinity, depending on K-feldspar present or not. For the mineral composition with K-feldspar present, CO 2 mineral trapping capacity decreases with salinity, while with albite instead of K-feldspar, it increases with salinity owing to more pre- cipitation of dawsonite. Keywords CO 2 geological storage Mineral sequestration capacity Feldspar Salinity High-salinity aquifers Introduction Geologic CO 2 sequestration (GCS) in deep geological formations is increasingly regarded as a promising means of reducing the release of greenhouse gas while still using fossil fuels and existing or emerging energy infrastructures (Gale 2004; IPCC 2005; Holloway 2005; Benson and Cole 2008; Scha ¨fer et al. 2012; Fang and Li 2014; Rathnaweera et al. 2015). Suitable geological formations include depleted oil and gas reservoirs and deep saline formations. GCS combined with enhanced oil recovery (EOR) and enhanced coalbed methane recovery (ECBM) may be financially advantageous (Ku ¨hn et al. 2012; Silva et al. 2012; Michael et al. 2013; Tao and Clarens 2013). Deep saline formations are estimated to be the most promising option for CGS owning to the advantages of large storage capacity and widespread availability (Fang and Li 2014; Rathnaweera et al. 2016). Geologic CO 2 sequestration in deep saline formations mainly relies on three trapping mechanisms (Xu et al. 2004; Bachu et al. 2007). First, CO 2 can be trapped as supercritical fluid under a low-perme- ability caprock, referred as hydrodynamic trapping, which is the most important form of retention in the short term. Second, CO 2 can dissolve into the formation water to be & Qi Fang [email protected] 1 School of Environmental Protection and Safety Engineering, University of South China, Hengyang 421001, China 2 School of Environmental Studies, China University of Geosciences, Wuhan 430074, China 3 School of Computer Science and Technology, University of South China, Hengyang 421001, China 4 Team 217 of Hunan Nonferrous Geological Exploration Bureau, Hengyang 421001, China 123 Environ Earth Sci (2016) 75:1265 DOI 10.1007/s12665-016-6054-y
Transcript of Effects of feldspar and salinity on the mineral...
ORIGINAL ARTICLE
Effects of feldspar and salinity on the mineral sequestrationcapacity of CO2 in high-salinity aquifers
Qi Fang1 • Yilian Li2 • Guojian Peng3 • Peng Cheng4 • Junwen Lv1
Received: 29 October 2015 / Accepted: 6 September 2016 / Published online: 16 September 2016
� Springer-Verlag Berlin Heidelberg 2016
Abstract Mineral sequestration of CO2 is considered to be
the safest mechanism in the long-term storage of CO2 in
deep saline aquifers. This study aims to investigate the
effect of feldspar and salinity on the mineral sequestration
capacity of CO2 in deep high-salinity brine aquifers by
taking Jiangling Depression of Jianghan Basin for instance.
Numerical simulation on the long-term geochemical reac-
tion and transport was performed by taking TOUGH-
REACT as the simulation tool. Simulation results indicate
that the effect of feldspar on the mineral trapping capacity
of CO2 does not depend on the total content of feldspar, but
depends on feldspar type and relative content. With Mg-
rich minerals such as chlorite or dolomite present, the
mineral composition abundant in K-feldspar is less favor-
able for the mineral sequestration capacity of CO2 for the
reason that a large amount of illite precipitates, consuming
a lot of Al3? in the aqueous solution, thereby limiting the
precipitation of dawsonite, especially for the high-tem-
perature sedimentary environment. In addition, the effect
of salinity on the mineral sequestration capacity of CO2
represents two aspects: one for the longer migration dis-
tance due to the lower solubility of higher salinity and the
other for CO2 mineral trapping capacity per 1 m3 medium
which is not in simple decreased with salinity, depending
on K-feldspar present or not. For the mineral composition
with K-feldspar present, CO2 mineral trapping capacity
decreases with salinity, while with albite instead of
K-feldspar, it increases with salinity owing to more pre-
cipitation of dawsonite.
Keywords CO2 geological storage � Mineral sequestration
capacity � Feldspar � Salinity � High-salinity aquifers
Introduction
Geologic CO2 sequestration (GCS) in deep geological
formations is increasingly regarded as a promising means
of reducing the release of greenhouse gas while still using
fossil fuels and existing or emerging energy infrastructures
(Gale 2004; IPCC 2005; Holloway 2005; Benson and Cole
2008; Schafer et al. 2012; Fang and Li 2014; Rathnaweera
et al. 2015). Suitable geological formations include
depleted oil and gas reservoirs and deep saline formations.
GCS combined with enhanced oil recovery (EOR) and
enhanced coalbed methane recovery (ECBM) may be
financially advantageous (Kuhn et al. 2012; Silva et al.
2012; Michael et al. 2013; Tao and Clarens 2013). Deep
saline formations are estimated to be the most promising
option for CGS owning to the advantages of large storage
capacity and widespread availability (Fang and Li 2014;
Rathnaweera et al. 2016). Geologic CO2 sequestration in
deep saline formations mainly relies on three trapping
mechanisms (Xu et al. 2004; Bachu et al. 2007). First, CO2
can be trapped as supercritical fluid under a low-perme-
ability caprock, referred as hydrodynamic trapping, which
is the most important form of retention in the short term.
Second, CO2 can dissolve into the formation water to be
& Qi Fang
1 School of Environmental Protection and Safety Engineering,
University of South China, Hengyang 421001, China
2 School of Environmental Studies, China University of
Geosciences, Wuhan 430074, China
3 School of Computer Science and Technology, University of
South China, Hengyang 421001, China
4 Team 217 of Hunan Nonferrous Geological Exploration
Bureau, Hengyang 421001, China
123
Environ Earth Sci (2016) 75:1265
DOI 10.1007/s12665-016-6054-y

sequestered in forms of bicarbonate ions, referred as sol-
ubility trapping. Third, CO2 can react with minerals to be
immobilized by secondary carbonate minerals, called as
mineral trapping, which is the most effective CO2
sequestration method. Xu et al. (2004) evaluated three host
rock types for long-term CO2 storage in deep aquifers and
concluded that the mineral trapping capacity depends sig-
nificantly on mineral composition. Zhang et al. (2009)
investigated the long-term fate of CO2 sequestration in
Songliao Basin of China and obtained that CO2 mineral
trapping capacity ranges from 10 to 35 kg/m3 medium.
Thibeau et al. (2009) assessed the CO2 mineral sequestra-
tion capacity of Rousse depleted gas reservoir and con-
cluded that the amount of CO2 sequestered by the
dissolution of chlorite accounts for 70 % of the total
injected CO2. Tambach et al. (2011) evaluated the CO2
sequestration potential of sandstone reservoir in the
Netherlands and found that dawsonite is the predominant
mineral to sequester CO2 in solid phase. Some studies
(Moore et al. 2005; Worden 2006; Hellevang et al.
2010, 2011) investigated the long-term stability of daw-
sonite at elevated CO2 partial pressure. Rathnaweera et al.
(2015, 2016) conducted a long-term combined experiment
related to mineralogical rock alteration and reached the
conclusion that long-term reaction with CO2 causes a sig-
nificant pH drop in the pore fluid and significant dissolution
of calcite, siderite, barite and kaolinite.
Jianghan Basin is one of the largest basins in South
China covering an area of 36.350 km2 (Fig. 1). It is a
typical salt-lake sedimentary basin with the salinity
ranging from 100,000 to 350,000 mg/L with depth. The
deposition thickness from Late Cretaceous to Quaternary
is up to 10 km. The interbedded sandstone, mudstone
and gypsum-salt rock in Shashi Formation (Es), Xin-
guizui Formation (Ex), Jingsha Formation (Ej) and
Qijiang Formation (Eq) may provide suitable reservoir
and caprock pairs for CO2 sequestration, especially the
excellent sealing ability of the thick gypsum-salt rock. In
addition, Jiangling Depression and Qianjiang Depression
are the concentration areas of highly mineralized
potassium-rich brine. Figure 2 shows the variation of
porosity, permeability and mineral composition of
sandstone with depth from ES-4 drilling in Jiangling
Depression. The porosity of Jingsha Formation ranges
from 10.91 to 13.26 % and permeability ranges from
2.76 to 6.43 mD, belonging to low-permeability reser-
voir (Fang et al. 2014). With regard to the mineral
composition of sandstone, there is no big change with
depth. The clastic constituent consists of a large amount
of quartz accounting for 80–90 % and a small quantity
of feldspar and lithic fragment with the average content
\10 %. The interstitial material in the sandstone reser-
voir accounts for 10–30 % dominated by calcite with
subordinate siliceous and ferruginous cement, gypsum
Fig. 1 Location, geological units and stratum histogram of Jianghan Basin
1265 Page 2 of 13 Environ Earth Sci (2016) 75:1265
123

and clay minerals. Brine production combined with CO2
geological storage may be a win–win method to the
investors as it will not only enhance brine production
efficiency but also improve CO2 injectivity and storage
security (Fang and Li 2014; Liu et al. 2015). Therefore,
Jianghan Basin is very likely to be a promising candidate
for CO2 geological storage. Li et al. (2012) found out
that salinity has a significant impact on the mineral
sequestration of CO2, but the influencing mechanism is
not well understood. Since the mineral sequestration
capacity of CO2 largely determines the long-term secu-
rity of CO2 storage, it is important to figure out the
mineral sequestration capacity of CO2 in high-salinity
aquifers. In this work, we aim to investigate the effect of
salinity and feldspar on the mineral sequestration
capacity of CO2 in high-salinity aquifers by taking Jin-
gling Depression of Jianghan Basin for instance.
Methodology
Model setup
The target reservoir is modeled as a homogeneous sand-
stone aquifer represented by a concentric cylindrical
geometry centered around a vertical injection well. The
maximum radial extent of the study area is set as 10 km
(far enough to avoid the disturbance to the boundary due to
CO2 injection), composed of 366 co-centered cell ele-
ments. In this study, we focus on the mineral sequestration
capacity of CO2 in per unit volume medium; therefore, the
model we built considers only one layer with a thickness of
20 m (see Fig. 3). CO2 is injected with constant rate of
1 kg/s for 30 years. The flow and geochemical transport
simulation was run for 10,000 years. The simulation was
performed using TOUGHREACT which is a numerical
simulation program for chemically reactive non-isothermal
flows of multiphase fluids in porous and fractured media
(Xu et al. 2006, 2011).
Initial and boundary conditions
The boundary condition applied to our simulations is a
Dirichlet boundary condition, which was implemented by
assigning a large volume such as 1040 to the boundary grid
element. Consequently, any influence from the influx
becomes negligible compared to the large volume of the
formation brine. The aqueous chemical composition and
thermodynamic conditions, such as temperature and pres-
sure, do not change from the original formation brine. The
sandstone layer is initially saturated with water with water
saturation equal to 1.
Hydrogeochemical conditions
The petrophysical properties used in the simulation were
taken from Jingsha Formation with depth ranging from
2244 to 2247 m. The porosity is 12 % and the permeability
is 3.81 mD. The hydrogeological parameters used in the
simulation are listed in Table 1. For lack of data, the rel-
ative permeability and capillary pressure model was taken
from previous literature (Xu et al. 2004, 2006; Zhang et al.
2009). As for the mineral composition, it mainly consists of
quartz, feldspar, calcite, anhydrite, illite, chlorite and
hematite. Because of uncertain in the composition of
feldspar and a significant impact of mineral composition on
Fig. 2 Variation in porosity, permeability (a) and mineral composition (b) with depth from ES-4 drilling
Fig. 3 Schematic diagram of the model used in this study
Environ Earth Sci (2016) 75:1265 Page 3 of 13 1265
123

the mineral trapping capacity of CO2, we looked at three
different cases corresponding to three different mineral
compositions in the geologic formation, respectively,
called as case I, case II and case III as given in Table 2.
Due to the limited amount of feldspar, we here regard it
as K-feldspar in case I, as albite in case II and both
coexist in case III. Then, in order to identify the effect
of salinity on the mineral sequestration capacity of CO2,
we considered four different initial aqueous NaCl con-
centrations, corresponding to four different salinity val-
ues (1, 2, 3 and 4 mol/L), referring to them as case Ia,
case Ib, case Ic and case Id. In addition, in order to
identify the effect of the initial feldspar content on the
mineral sequestration of CO2, the initial volume fraction
of feldspar in case I and case II is, respectively,
increased from 2 to 5 %, referring as to case I2, case I5,
case II2 and case II5. Thus, overall, we ran a total of 14
TOUGHREACT simulations. Batch geochemical mod-
eling of water–rock interaction was performed to obtain
nearly equilibrated water chemistry prior to the reactive
transport simulation by keeping pH at a fixed value, and
part of the initial concentrations of formation water is
listed in Table 3.
Kinetics of mineral dissolution and precipitation
The general kinetic rate expression used in TOUGH-
REACT is shown as follows:
rm ¼ �k Tð ÞmAm 1 � Qm
Km
� �h�����
�����g
ð1Þ
where m denotes kinetic mineral index, rm is the dissolu-
tion/precipitation rate (positive values indicate dissolution;
negative values indicate precipitation), k(T)m is the rate
constant depending on the temperature (mol/m2 s), T is the
absolute temperature, Am is the specific reactive surface
area per kg water, Km is the equilibrium constant for the
mineral–water reaction written for the destruction of 1 mol
of mineral m and Qm is the corresponding ion activity
product. The parameters h and g are two positive numbers
determined by experiments; usually, but not always, they
are taken to be equal to 1.
For many minerals, the kinetic rate constant k(T) can be
summed from three mechanisms:
k Tð Þ ¼ knu25 exp
�Enua
R
1
T� 1
298:15
� �� �
þ kH25 exp
�EHa
R
1
T� 1
298:15
� �� �anH
H
þ kOH25 exp
�EOHa
R
1
T� 1
298:15
� �� �anOH
OH
ð2Þ
where superscripts and subscripts nu, H and OH indicate
neutral, acid and base mechanisms, respectively, Ea is the
activation energy, k25 is the rate constant at 25 �C, R is the
gas constant (8.31 J/mol K), T is the absolute temperature,
a is the activity of the species and n is a power term
(constant). For all minerals, it is assumed that the precip-
itation rate equals the dissolution rate. Parameters for cal-
culating kinetic rate of minerals given in Table 4 were
taking from relative literature (Xu et al. 2006; Zhang et al.
2009). Calcite and anhydrite were assumed to react with
aqueous species at local equilibrium because their reaction
rates are typically quite rapid.
Results and discussion
Effect of feldspar on the mineral sequestration
capacity of CO2
In order to compare CO2 mineral trapping capacity and
better understand the major mineral changes, we chose a
block of 500 m away from CO2 injection well as reference.
As shown in Fig. 4, feldspar has a significant effect on the
mineral sequestration capacity of CO2, depending on not
the total content but the feldspar type and relative content
of K-feldspar. For case I with K-feldspar present, as shown
in Fig. 4a, the maximum mineral trapping capacity of CO2
reaches about 0.20 mol/L medium, corresponding to
8.8 kg/1 m3 medium after 5000 years. A significant
Table 1 Hydrogeological parameters used in the simulations
Parameters Geological formation
Porosity 0.12
Permeability (m2) 3.81 9 10-15
Pore compressibility (Pa-1) 4.5 9 10-10
Rock grain density (kg/m3) 2600
Formation heat conductivity (W/m �C) 2.51
Rock grain specific heat (J/kg �C) 920
Temperature (�C) 90
Pressure (bar) 225
Relative permeability model:
krg ¼ 1 � S� �2
1 � S2� �
S ¼ Sl � Slrð Þ
Sl � Slr � Sgr
� �
krl ¼ffiffiffiffiffiS�
p1 � 1 � S�½ �1=m
� �mn o2
S� ¼ Sl � Slrð Þ= 1 � Slrð Þ
Capillary pressure model (Van Genuchten):
Pcap ¼ �P0 S�½ ��1=m�1� �1�m
S� ¼ Sl � Slrð Þ= 1 � Slrð Þ
Slr: residual water saturation 0.05
Slr: residual water saturation 0.30
P0: strength coefficient P0 = 19.61 kPa
m: exponent 0.457
1265 Page 4 of 13 Environ Earth Sci (2016) 75:1265
123
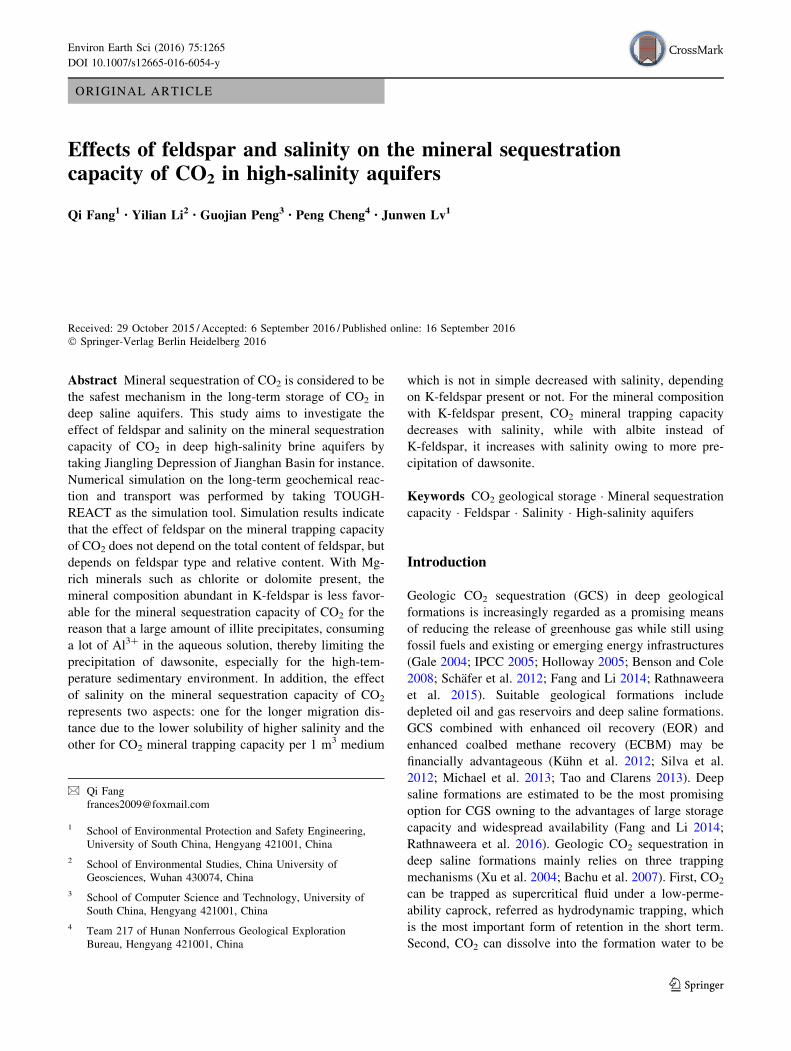
amount of ankerite (CaMg0.3Fe0.7(CO3)2) and small
amount of magnesite (MgCO3) precipitate to sequester
CO2 in the solid phase. As for the formed clay minerals,
only illite precipitates and no kaolinite is present. In Wang
et al.’s (2016) experiment at the temperature of 180�, after
reaction with CO2 brine, the contents of quartz, plagio-
clase, illite and chlorite increased considerably, whereas
the contents of illite/smectite, biotite and kaolinite
decreased more or less. In Rathnaweera et al.’s (2015,
2016) long-term experiment, kaolinite dissolution happens
at the temperature of 40 �C. In Bolourinejad et al. (2014)
geochemical modeling, a large amount of illite also pre-
cipitates, increasing by 66 %. Therefore, it is reasonable to
generate illite in the aqueous solution abundant in K?,
Mg2? and Al3?, and the reaction increases with tempera-
ture and sediment depth. Increasing the initial volume of
K-feldspar from 2 to 5 % has little improvement on the
mineral sequestration capacity of CO2 due to the higher pH
value neutralized by more dissolution of K-feldspar
reducing the dissolution of calcite.
For case II with albite present, the maximum mineral
trapping capacity of CO2 reaches about 0.31 mol/L med-
ium, corresponding to 13.5 kg/1 m3 medium. With regard
to CO2-sequestered carbonate minerals, a significant
amount of ankerite and dawsonite and small amount of
magnesite precipitate (Fig. 4b). A certain amount of Na-
smectite and Ca-smectite precipitates. Increasing the initial
volume of albite from 2 to 5 %, the maximum mineral
trapping capacity of CO2 can rise from 13.5 to 21.3 kg/
1 m3 medium after 5000 years. The precipitation amount
of Na-smectite increases from 0.075 to 0.109 mol/L med-
ium. The precipitation amount of dawsonite increases from
0.12024 to 0.32715 mol/L medium, indicating that increase
in the volume of albite can significantly improve the
mineral sequestration capacity of CO2 since the acid
environment is not favorable for the precipitation of
smectite.
For case III with K-feldspar and albite coexist, in spite
of improving both of their initial volume to 5 %, the
maximum mineral trapping capacity of CO2 reaches about
0.32 mol/L medium corresponding to 14.1 kg/1 m3 med-
ium after 5000 years, slightly higher than that of case II2
(Fig. 4c). However, the precipitation of dawsonite only
accounts for 20 % of that in case II5 and 43 % of that in
case II. It is to be noted that a large amount of illite pre-
cipitates in this case, increased by 96 % compared with
that in case I5, indicating that most of Al3? provided by the
dissolution of albite are consumed by the precipitation of
illite, thereby leading to the decrease of dawsonite and
magnesite. Actually, it is the significant decrease in the
dissolved amount of calcite resulting from the higher pH
buffered by more dissolution of K-feldspar and albite to
keep CO2 mineral trapping capacity slightly higher than
that of case II2.
In conclusion, illite has a significant restriction on the
mineral sequestration capacity of CO2 since its
Table 2 Initial mineral volume
fractions and possible secondary
mineral phases in the
simulations
Minerals Chemical composition Volume fraction
Case I Case II Case III
Case I2 Case I5 Case II2 Case II5
Quartz SiO2 0.70 0.67 0.70 0.67 0.62
K-feldspar KAlSi3O8 0.02 0.05 0.00 0.00 0.05
Albite NaAlSi3O8 0.00 0.00 0.02 0.05 0.05
Calcite CaCO3 0.20 0.20 0.20 0.20 0.20
Anhydrite CaSO4 0.03 0.03 0.03 0.03 0.03
Chlorite Mg2.5Fe2.5Al2Si3O10(OH)8 0.01 0.01 0.01 0.01 0.01
Illite K0.6Mg0.25Al1.8(Al0.5Si3.5O10)(OH)2 0.03 0.03 0.03 0.03 0.03
Hematite Fe2O3 0.01 0.01 0.01 0.01 0.01
Kaolinite Al2Si2O5(OH) 0 0 0 0 0
Ca-smectite Ca0.145Mg0.26Al1.77Si3.97O10(OH)2 0 0 0 0 0
Na-smectite Na0.290Mg0.26Al1.77Si3.97O10(OH)2 0 0 0 0 0
Ankerite CaMg0.3Fe0.7(CO3)2 0 0 0 0 0
Dawsonite NaAlCO3(OH)2 0 0 0 0 0
Dolomite CaMg(CO3)2 0 0 0 0 0
Magnesite MgCO3 0 0 0 0 0
Siderite FeCO3 0 0 0 0 0
Pyrite FeS2 0 0 0 0 0
Environ Earth Sci (2016) 75:1265 Page 5 of 13 1265
123

precipitation preferentially consumes a lot of Al3?. K?,
Mg2? and Al3? are the three important ions to generate
illite. Chlorite is one of the most common Mg-rich min-
erals in the sedimentary rocks. Comparing the stoichio-
metric coefficient of Mg in chlorite
(Mg2.5Fe2.5Al2Si3O10(OH)8) to illite (K0.6Mg0.25Al1.8
(Al0.5Si3.5O10(OH)2), we can see that Mg stoichiometric
coefficient of chlorite is 10 times of illite, indicating that
chlorite usually could provide sufficient Mg2? to support
the precipitation of illite. For example, in this study, the
complete dissolution of 1 % volume, corresponding to
0.04185 mol/dm3 medium of chlorite, could generate
0.4185 mol/dm3 medium illite; and this quantity needs
0.2511 mol/L K? and 0.9626 mol/L Al3?. K? only
comes from the dissolution of K-feldspar (KAlSi3O8),
and Al3? is mainly from the dissolution of K-feldspar
and albite ((NaAlSi3O8). As given in Table 5, the pre-
cipitation of magnesite (MgCO3) indicates that Mg2? is
sufficient. Such K? and Al3? become the key ions to
restrain the formation of illite. One mole formation of
illite needs 0.6 mol of K? and 2.3 mol of Al3?. For case
I2 and case I5, both of the ratios of K-feldspar disso-
lution to illite precipitation are larger than 0.6, indicat-
ing that K? is sufficient; the ratio of the dissolution of
K-feldspar and albite to the precipitation of illite is
\2.3, indicating that Al3? is the limiting factor. As for
case III, the ratio of the dissolution of K-feldspar and
albite to the precipitation of illite is larger than 2.3,
indicating that Al3? is sufficient. Though the ratios of
K-feldspar dissolution to illite precipitation are 0.62,
slightly larger than 0.6, K? are still deficient for the
reason that some K? dissolve into the aqueous solution.
Compared with case II2, Al3? released from 3 % albite
is consumed by the precipitation of illite. Therefore,
with a small amount of Mg-rich minerals such as
chlorite, the mineral composition abundant in K-feldspar
is less favorable for the mineral sequestration capacity
of CO2 attributing to a significant amount of illite pre-
cipitate and consumes a large amount of Al3?, thereby
limiting the precipitation of dawsonite. In Zhang et al.
(2009), the mineral trapping capacity of CO2 only
reaches 8 kg/m3 medium after 10,000 years for the
mineral composition of 41.5 % albite, 23.3 % feldspar,
2.8 % chlorite and 3 % calcite, once again proving the
above viewpoint. In Bolourinejad et al. (2014) studies,
with the mineral composition of 1.64 % albite, 2.43 %
K-feldspar, 2.02 % dolomite and 5.14 % kaolinite, the
major modeled reactions are the formation of illite and
calcite from K-feldspar, dolomite, kaolinite and albite as
shown in reaction (3) and (4). These reactions demon-
strate that nearly 100 % of Al is conserved in the
feldspar–kaolinite–albite–illite system, in line with ear-
lier studies (Hellevang et al. 2011).Table
3In
itia
lco
nce
ntr
atio
ns
of
form
atio
nw
ater
atre
serv
oir
con
dit
ion
so
f9
0�C
and
22
5b
ars
Ele
men
tsC
on
cen
trat
ion
(mo
l/L
NaC
l):
Cas
eI
Co
nce
ntr
atio
n(m
ol/
L):
Cas
eII
Cas
eIa
:1
mo
l/L
Cas
eIb
:2
mo
l/L
Cas
eIc
:3
mo
l/L
Cas
eId
:4
mo
l/L
Cas
eII
a:1
mo
l/L
Cas
eII
b:
2m
ol/
LC
ase
IIc:
3m
ol/
LC
ase
IId
:4
mo
l/L
pH
6.9
6.9
6.9
6.9
6.9
6.9
6.9
6.9
Ca
6.8
959
10-
02
4.5
849
10-
02
5.5
459
10-
02
6.3
529
10-
02
3.2
069
10-
02
6.7
749
10-
02
6.1
939
10-
02
6.3
509
10-
02
Mg
6.8
979
10-
05
1.1
219
10-
04
1.3
409
10-
04
4.9
799
10-
04
1.2
369
10-
04
4.5
599
10-
04
1.0
369
10-
04
4.5
679
10-
04
Na
9.8
939
10-
01
1.9
979
10?
00
2.9
959
10?
00
3.9
959
10?
00
9.9
889
10-
01
1.9
939
10?
00
3.0
009
10?
00
4.0
029
10?
00
K3
.47
09
10-
02
3.6
289
10-
02
3.6
479
10-
02
4.1
569
10-
02
3.7
659
10-
04
2.7
669
10-
03
2.6
609
10-
02
3.4
399
10-
02
Fe
1.1
179
10-
06
1.4
839
10-
06
2.3
369
10-
06
1.1
459
10-
06
2.8
749
10-
07
2.3
449
10-
07
2.0
879
10-
06
1.4
779
10-
06
SiO
2(a
q)
9.1
009
10-
04
9.5
029
10-
04
9.8
509
10-
04
1.0
269
10-
03
9.0
959
10-
04
9.4
989
10-
04
9.9
529
10-
04
1.0
169
10-
03
C3
.35
19
10-
04
6.6
679
10-
04
6.8
269
10-
04
6.5
799
10-
04
6.8
369
10-
04
4.6
399
10-
04
5.6
809
10-
04
7.0
139
10-
04
S1
.60
09
10-
02
4.4
869
10-
02
5.4
689
10-
02
6.2
779
10-
02
3.1
479
10-
02
3.0
219
10-
02
4.8
919
10-
02
6.2
739
10-
02
Al
1.6
449
10-
08
1.7
569
10-
08
1.8
579
10-
08
1.7
079
10-
08
5.0
979
10-
08
2.9
159
10-
08
2.1
329
10-
08
1.7
689
10-
08
Cl
1.0
009
10?
00
2.0
009
10?
00
3.0
009
10?
00
4.0
009
10?
00
1.0
009
10?
00
2.0
009
10?
00
3.0
009
10?
00
4.0
009
10?
00
O2
(aq
)1
.74
99
10-
57
2.5
479
10-
57
2.5
449
10-
57
2.4
939
10-
55
3.9
619
10-
55
4.3
529
10-
54
2.2
149
10-
57
1.4
479
10-
55
1265 Page 6 of 13 Environ Earth Sci (2016) 75:1265
123

Table
4P
aram
eter
sfo
rca
lcu
lati
ng
kin
etic
rate
con
stan
tso
fm
iner
als
Min
eral
sS
urf
ace
area
(cm
2/g
)
Par
amet
ers
for
kin
etic
rate
law
Neu
tral
mec
han
ism
Aci
dm
ech
anis
mB
ase
mec
han
ism
k 25
(mo
l/m
2s)
Ea
(kJ/
mo
l)k 2
5Ea
n(H
?)
k 25
Ea
n(H
?)
Cal
cite
–E
qu
ilib
riu
m–
An
hy
dri
te–
Eq
uil
ibri
um
–
Qu
artz
9.8
1.2
50
0e-
14
87
.7
Kao
lin
ite
15
1.6
6.9
18
3e-
14
22
.24
.89
78
e-1
26
5.9
0.7
77
8.9
12
5e-
18
17
.9-
0.4
72
Illi
te1
51
.61
.65
96
e-1
33
5.0
1.0
47
1e-
11
23
.60
.34
3.0
20
0e-
17
58
.9-
0.4
0
Ch
lori
te9
.83
.02
00
e-1
38
8.0
7.7
62
4e-
12
88
.00
.5
Alb
ite*
low
9.8
2.7
54
2e-
13
69
.86
.91
83
e-1
16
5.0
0.4
57
2.5
11
9e-
16
71
.0-
0.5
72
K-f
eld
spar
9.8
3.8
90
5e-
13
38
.08
.70
96
e-1
15
1.7
0.5
6.3
09
6e-
22
94
.1-
0.8
23
Mag
nes
ite
9.8
4.5
70
9e-
10
23
.54
.16
87
e-0
71
4.4
1.0
Do
lom
ite
9.8
2.9
51
2e-
08
52
.26
.45
65
e-0
43
6.1
0.5
Sid
erit
e9
.81
.25
98
e-0
96
2.7
66
.45
65
e-0
43
6.1
0.5
Daw
son
ite
9.8
1.2
59
8e-
09
62
.76
6.4
56
5e-
04
36
.10
.5
An
ker
ite
9.8
1.2
59
8e-
09
62
.76
6.4
56
5e-
04
36
.10
.5
Na-
smec
tite
15
1.6
1.6
59
6e-
13
35
.01
.04
71
e-1
12
3.6
0.3
43
.02
00
e-1
75
8.9
-0
.40
Ca-
smec
tite
15
1.6
1.6
59
6e-
13
35
.01
.04
71
e-1
12
3.6
0.3
43
.02
00
e-1
75
8.9
-0
.40
Hem
atit
e1
2.8
72
.51
19
e-1
56
6.2
4.0
73
8e-
10
66
.21
.0
Py
rite
12
.87
k 25=
2.8
18
4e-
5Ea=
56
.9
n(O
2(a
q))=
0.6
k 25=
3.0
24
e-8Ea=
56
.9
n(H
?)=
-0
.5,n
(Fe3
?)=
0.5
(1)
All
rate
con
stan
tsar
eli
sted
for
dis
solu
tio
n;
(2)
Ais
spec
ific
surf
ace
area
,k
25
isth
ek
inet
icco
nst
ant
at2
5�C
,E
isth
eac
tiv
atio
nen
erg
y,
andn
isth
ep
ow
erte
rm;
(3)
the
po
wer
term
sn
for
bo
thac
idan
db
ase
mec
han
ism
sar
ew
ith
resp
ect
toH?
;an
d(4
)fo
rp
yri
te,
the
neu
tral
mec
han
ism
has
nw
ith
resp
ect
toO
2(a
q)
and
the
acid
mec
han
ism
has
two
spec
ies
inv
olv
ed:
on
en
wit
h
resp
ect
toH?
and
ano
ther
nw
ith
resp
ect
toF
e3?
Environ Earth Sci (2016) 75:1265 Page 7 of 13 1265
123

0:6KAlSi3O8 þ 0:85Al2Si2O5 OHð Þ4þ0:25CaMg CO3ð Þ2
! K0:6Mg0:25Al1:8 Si3:5Al0:5O10ð Þ OHð Þ2þ0:25CaCO3
þ 0:45H2O þ 0:25HCO�3 þ 0:25Hþ ð3Þ
0:6KAlSi3O8þ1:7NaAlSi3O8þ0:25CaMg CO3ð Þ2
þ0:4H2Oþ1:45Hþ!K0:6Mg0:25Al1:8 Si3:5Al0:5O10ð Þ OHð Þ2
þ0:25CaCO3þ1:7Naþþ3:4SiO2þ0:25HCO�3 ð4Þ
Fig. 4 Mineral dissolution (-)
and precipitation (?) for case I
with K-feldspar of 2 % (case I2)
and 5 % (case I5), case II with
albite of 2 % (case II2) and 5 %
(case II5), case III with
K-feldspar (5 %) and albite
(5 %) co-present after
5000 years
Table 5 Ratio of the dissolution of K-feldspar and albite to the precipitation of illite
Case Abundance of mineral dissolution or precipitation (mol/L) Ratio
n (Magnesite) n (K-feldspar) n (Albite) n (Illite) n (K-feldspar):n (Illite) n (K-feldspar ? Albite):n (Illite)
Case I2 0.04108 0.07577 0 0.06890 1.10 1.10
Case I5 0.03580 0.12501 0 0.09076 1.38 1.38
Case III 0.00447 0.11013 0.33893 0.17763 0.62 2.53
1265 Page 8 of 13 Environ Earth Sci (2016) 75:1265
123
Effect of salinity on the mineral sequestration
capacity of CO2
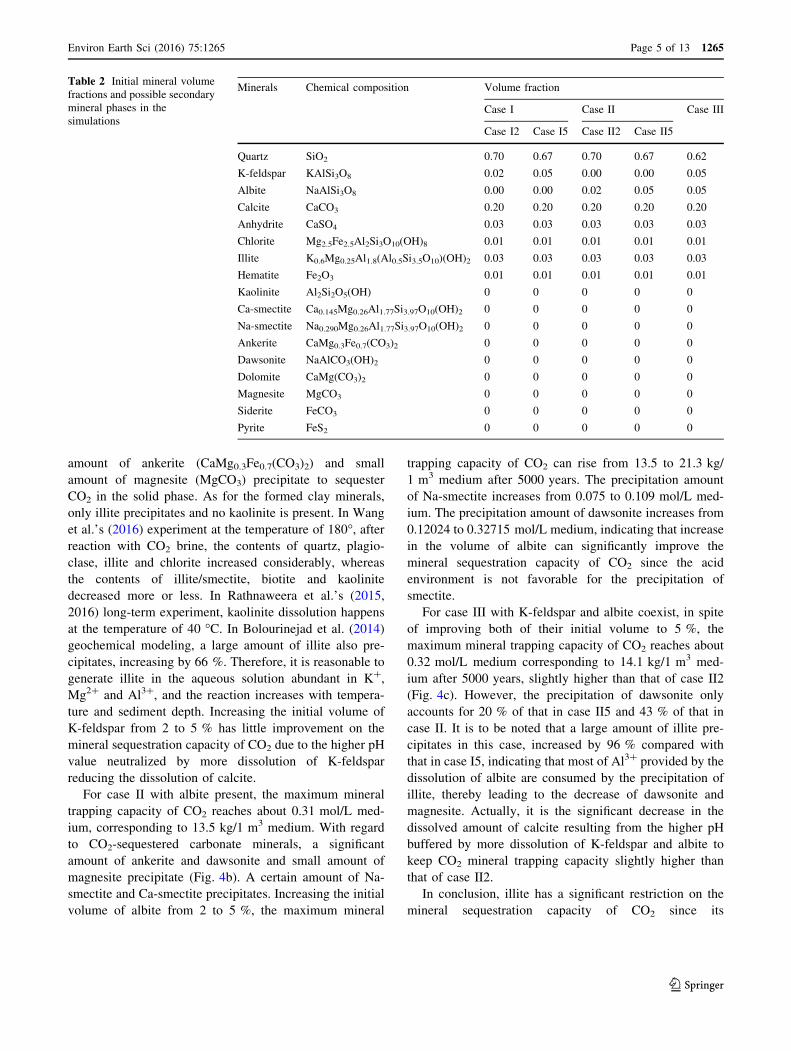
As shown in Fig. 5, the effect of salinity on the mineral
sequestration capacity of CO2 represents in two aspects: one
for the longer migration distance derived from the lower sol-
ubility with higher salinity of formation water and the other for
CO2 mineral trapping capacity per 1 m3 medium which is not
in simple decreased with salinity, depending on K-feldspar
present or not. For case I and case III with K-feldspar present
in the mineral composition, CO2 mineral trapping capacity
decreases with salinity. For case II without K-feldspar, CO2
mineral trapping capacity increases with salinity, especially
for salinity of 4 mol/L with the maximum mineral trapping
capacity of CO2 up to 15 kg/m3 medium after 5000 years.
Increasing the salinity (concentration of NaCl) will
delay or reduce the dissolution of albite, consequently
leading to the lower pH value of formation water. For case
I with no albite present, salinity has little effect on CO2
trapping capacity except for slightly higher dissolution of
K-feldspar leading to higher precipitation of illite. In spite
of abundance of Na? in the aqueous solution, no dawsonite
Fig. 5 Radial distribution of
the amount of CO2 sequestered
in solid phase (mol/L medium)
for salinity of 1, 2, 3 and 4 mol/
L of cases I, II and III
Environ Earth Sci (2016) 75:1265 Page 9 of 13 1265
123

precipitates, indicating that all the Al3? released by the
dissolution of chlorite and K-feldspar are totally consumed
by the precipitation of illite. Just as shown in Fig. 6,
dawsonite experiences a process from precipitation to
dissolution during 100–1000 years when there is no
sufficient K? in the aqueous solution to support the pre-
cipitation of illite.
For case II, salinity has little impact on the precipitation
of ankerite except for slightly longer migration distance of
CO2 plume. However, salinity has a significant effect on
Fig. 6 Time evolution of
mineral change of chlorite,
K-feldspar, illite and dawsonite
(case Ic). Chlorite and
K-feldspar dissolve; illite and
dawsonite precipitate
Fig. 7 Radial distribution of
CO2-sequestered mineral
changes in volume fraction after
5000 years for salinity of 1, 2, 3
and 4 mol/L of case II
1265 Page 10 of 13 Environ Earth Sci (2016) 75:1265
123

the precipitation of dawsonite and magnesite, manifesting
not just in the extension of radial migration, but also in the
precipitation volume per 1 m3 medium (Fig. 7). Actually,
as shown in Fig. 8, improving the initial salinity (NaCl
concentration) of aqueous solution from 1 to 3 mol/L, the
higher concentration of Na? delays the dissolution of albite
and consequently leads to the lower pH value. Low pH
environment will reduce the precipitation amount of
smectite (including Na-smectite and Ca-smectite) and
therefore increase the precipitation amount of dawsonite
and magnesite.
As for case III with K-feldspar and albite co-present in
the mineral composition, the mineral trapping of CO2
decreases significantly with salinity, from 14 kg/1 m3
medium of 1 mol/L salinity down to 11 kg/1 m3 medium
of 3 mol/L salinity. As shown in Fig. 9, improving the
initial salinity of aqueous solution from 1 to 3 mol/L
results in a large decrease in the dissolution amount of
albite, thereby leading to lower pH condition. That lower
pH condition significantly increases the dissolution amount
of calcite is the main reason accounting for the decrease in
CO2 mineral trapping capacity with salinity.
Fig. 8 Time evolution of
mineral changes of chlorite,
albite, dawsonite and Na-
smectite for salinity of 1 (case
IIa) and 3 mol/L (case IIc)
Fig. 9 Mineral dissolution (-)
and precipitation (?) for case III
with the salinity of 1 (case IIIa)
and 3 mol/L (case IIIc)
Environ Earth Sci (2016) 75:1265 Page 11 of 13 1265
123

Conclusions
The purpose of this paper is to investigate the effect of
feldspar and salinity on the mineral sequestration capacity
of CO2 in deep high-salinity brine aquifers by taking
Jiangling Depression of Jianghan Basin for instance.
Numerical simulation on long-term geochemical reaction
and transport was performed by taking TOUGHREACT as
the simulation tool. Major findings and conclusions are
summarized as follows:
1. The mineral trapping capacity of CO2 for Jiangling
Depression sandstone of Jianghan Basin ranges from
8 to 21 kg/1 m3 medium. The effect of feldspar on
the mineral trapping capacity of CO2 does not depend
on the total content of feldspar, but depends on
feldspar type and relative content. With Mg-rich
minerals such as chlorite or dolomite present, the
mineral composition abundant in K-feldspar is less
favorable for the mineral sequestration capacity of
CO2 for the reason that a large amount of illite
precipitates, consuming a lot of Al3? in the aqueous
solution, thereby limiting the precipitation of daw-
sonite, especially for the high-temperature sedimen-
tary environment.
2. The effect of salinity on the mineral sequestration
capacity of CO2 represents two aspects: one for the
longer migration distance due to the lower solubility of
higher salinity and the other for CO2 mineral trapping
capacity per m3 medium which is not in simple
decreased with salinity, depending on K-feldspar
present or not. For the mineral composition with
K-feldspar present, CO2 mineral trapping capacity
decreases with salinity, while with albite instead of
K-feldspar, it increases with salinity owing to more
dawsonite precipitates.
Acknowledgments This work was supported by National Science
Foundation of China (No. 11545016) and Science and Technology
Bureau of Hengyang City (2015KS05) as well as Doctoral Scientific
Fund of University of South China (2014XQD12). We would like to
thank the anonymous reviewers for their constructive comments and
suggestions on this manuscript.
References
Bachu S, Bonijoly D, Bradshaw J, Burruss R, Holloway S,
Christenson NP (2007) CO2 storage capacity estimation:
methodology and gas. Int J Greenh Gas Control 1(07):430–443
Benson SM, Cole DR (2008) CO2 sequestration in deep sedimentary
formations. Elements 4(5):325–331
Bolourinejad P, Herber R, Omrani PS (2014) Effect of reactive
surface area of minerals on mineralization due to CO2 injection
in a depleted gas reservoir. Fourth eage CO2 geological storage
workshop
Fang Q, Li Y (2014) Exhaustive brine production and complete CO2
storage in Jianghan Basin of China. Environ Earth Sci
72(5):1541–1553
Fang Q, Li Y, Cheng P, Yu Y, Liu D, Song S (2014) Enhancing CO2
injectivity in high-salinity and low-permeability aquifers: a case
study of Jianghan Basin, China. Earth Sci J China Univ Geosci
29(11):1675–1863 (in Chinese with English abstract)Gale J (2004) Geological storage of CO2: what we know, where are
the gaps, and what more needs to be done. Energy Convers
Manag 29(9–10):1329–1338
Hellevang H, Declercq J, Kvamme B, Aagaard P (2010) The
dissolution rates of dawsonite at pH 0.9 to 5 and temperatures of
22, 60 and 77�C. Appl Geochem 25(10):1575–1586
Hellevang H, Declercq J, Aagaard P (2011) Why is dawsonite absent
in CO2 charged reservoirs? Oil Gas Sci Technol Revue d’IFP
Energies nouvelles 66:119–135
Holloway S (2005) Underground sequestration of carbon dioxide: a
viable greenhouse gas mitigation option. Energy 30:2318–2333
IPCC (intergovernmental Panel on Climate Change) (2005) Special
report on carbon dioxide capture and storage. In: Davidson O, de
Coninck HC, Loos M, Mayer LA (eds) Metz B. Cambridge
University Press, Cambridge and New York
Kuhn M, Gorke U-J, Birkholzer JT, Kolditz O (2012) The CLEAN
project in the context of CO2 storage and enhanced gas recovery.
Environ Earth Sci 67:307–310
Li Y, Fang Q, Ke Y, Dong J, Yang G, Ma X (2012) Effect of high
salinity on CO2 geological storage: a case study of Qianjiang
Depression in Jianghan Basin. Earth Sci-J China Uni of Geosci
37(2):283–288 (in Chinese with English abstract)Liu H, Hou Z, Were P, Sun X, Gou Y (2015) Numerical studies on
CO2 injection–brine extraction process in a low-medium
temperature reservoir system. Environ Earth Sci 73(11):221–225
Michael LG, Kuuskraa VA, Phil D (2013) Opportunities for using
anthropogenic CO2 for enhanced oil recovery and CO2 storage.
Energy Fuels 27:4183–4189
Moore J, Adams M, Allis R, Lutz S, Rauzi S (2005) Mineralogical
and geochemical consequences of the long-term presence of CO2
in natural reservoirs: an example from the Springerville-St.
Johns Field, Arizona, and New Mexico, USA. Chem Geol
217:365–385
Rathnaweera TD, Ranjith PG, Perera MSA, Haque A, Lashin A, Arifi
NA, Chandrasekharam D, Yang SQ, Xu T, Wang SH, Yasar E
(2015) CO2-induced mechanical behaviour of Hawkesbury
sandstone in the Gosford basin: an experimental study. Mater
Sci Eng, A 641:123–137
Rathnaweera TD, Ranjith PG, Perera MSA (2016) Experimental
investigation of geochemical and mineralogical effects of CO2
sequestration on flow characteristics of reservoir rock in deep
saline aquifers. Scientific Reports, 2016, 6
Schafer F, Walter L, Class H, Mular C (2012) The regional pressure
impact of CO2 storage: a showcase study from the North German
Basin. Environ Earth Sci 65:2037–2049
Silva PNKD, Ranjith PG, Choi SK (2012) A study of methodologies
for CO2 storage capacity estimation of coal. Fuel 91(1):1–15
Tambach T, Koenen M, Bergen F (2011) Geochemical evaluation of
CO2 injection into storage reservoirs based on case-studies in the
Netherlands. Energy Proced 4:4747–4753
Tao Z, Clarens A (2013) Estimating the carbon sequestration capacity
of shale formations using methane production rates. Environ Sci
Technol 47:11318–11325
Thibeau S, Chiquet P, Mouronval G (2009) Geochemical assessment
of the injection of CO2 into Rousse depleted gas reservoir.
Energy Proced 1:3383–3390
Wang K, Xu T, Wang F, Tian H (2016) Experimental study of CO2-
brine-rock interaction during CO2 sequestration in deep coal
seams. Int J Coal Geol 154–155:265–274
1265 Page 12 of 13 Environ Earth Sci (2016) 75:1265
123

Worden RH (2006) Dawsonite cement in the Triassic Lam Formation,
Shabwa Basin, Yemen: a natural analogue for a potential mineral
product of subsurface CO2 storage for greenhouse gas reduction.
Mar Pet Geol 23:61–77
Xu T, Sonnenthal E, Spycher N, Pruess K (2004) Numerical
simulation of CO2 disposal by mineral trapping in deep aquifers.
Appl Geochem 19(6):917–936
Xu T, Sonnenthal E, Spycher N et al (2006) TOUGHREACT: a
simulation program for non-isothermal multiphase reactive
geochemical transport in variably saturated geologic media—
applications to geothermal injectivity and CO2 geological
sequestration. Comput Geosci 32:145–165
Xu T, Spycher N, Sonnnenthal E, Zhang G, Zheng L, Pruess K (2011)
TOUGHREACT Version 2.0: a simulator for subsurface reactive
transport under non-isothermal multiphase flow conditions.
Comput Geosci 37:763–774
Zhang W, Li Y, Xu T, Cheng H, Zheng Y, Xiong P (2009) Long-term
variations of CO2 trapped in different mechanisms in deep saline
formations: a case study of the Songliao Basin, China. Int J
Greenh Gas Control 3(2):161–180
Environ Earth Sci (2016) 75:1265 Page 13 of 13 1265
123