effects of feeding a fermented product on the faecal microflora and ...
166
EFFECTS OF FEEDING A FERMENTED PRODUCT ON THE FAECAL MICROFLORA AND EGG COMPOSITION IN LAYING HENS ELIZABETH LAW FANG LIN MASTER OF SCIENCE UNIVERSITI PUTRA MALASIA 2006
Transcript of effects of feeding a fermented product on the faecal microflora and ...

EFFECTS OF FEEDING A FERMENTED PRODUCT ON THE FAECAL
MICROFLORA AND EGG COMPOSITION IN LAYING HENS
ELIZABETH LAW FANG LIN
MASTER OF SCIENCE
UNIVERSITI PUTRA MALASIA
2006

ii
EFFECTS OF FEEDING A FERMENTED PRODUCT ON THE FAECAL
MICROFLORA AND EGG COMPOSITION IN LAYING HENS
By
ELIZABETH LAW FANG LIN
Thesis Submitted to the School of Graduate Studies, Universiti Putra Malaysia,
in Fulfilment of the Requirement for the Degree of Master of Science
January 2006

iii
Dedicated to
My late mother Mdm. Goh Choo Moi who is my inspiration forever
ii

iv
Abstract of thesis presented to the Senate of Universiti Putra Malaysia in
fulfilment of the requirement for the degree of Master of Science
EFFECTS OF FEEDING A FERMENTED PRODUCT ON THE FAECAL
MICROFLORA AND EGG COMPOSITION IN LAYING HENS
By
ELIZABETH LAW FANG LIN
January 2006
Chairman: Associate Professor Loh Teck Chwen, PhD
Faculty: Agriculture
The thesis studied the characteristics of a fermented product (FP) and the effects
of the FP on layers. Two experiments were conducted to achieve the objectives
above. Experiment I (Chapter IV) was conducted to evaluate the composition
and consistency of the finished fermented product (FP). The nutritive value and
chemical compositions of the product were evaluated after the process of
fermentation. In parallel, microbiological analyses, including lactic acid bacteria
(LAB) and Enterobacteriaceae counts were also performed. The fermentation
process was repeated three times under the same running conditions and using
the same amounts of raw materials. The physical, chemical and microbiological
properties of FP obtained in this study showed that FP had consistent chemical
and microbiological characteristics. The presence of essential fatty acids
(linoleic acid 24%, linolenic acid 1.1%, eicosapentaenoic acid 3.6%,
docosapentaenoic acid 0.7%, docosahexaenoic acid 2.0%) and a lime-flavored
aroma represent additional value-added attributes to the product.
iii

v
Experiment II (Chapter V) was carried out to investigate the effects of feeding
FP to layers (Babcock B380) on faecal microflora, essential fatty acid and
cholesterol levels in eggs and plasma. A total of 96, 13-week-old Babcock B380
pullets were used in this study. They were randomly assigned to four
numerically equal groups with eight replicates per treatments, three birds per
replicates. All the birds were housed in individual cages. Diet I (Cont), had no
FP, Diet II (FP3) contained 3% (w/w) FP (30g FP/kg diet), Diet III (FP6)
contained 6% (w/w) FP (60g FP/kg diet) and Diet IV (FP9) contained 9% (w/w)
FP (90g FP/kg diet). The study lasted 16 weeks inclusive of two weeks of
adjustment period and a 14-week experimental period. Weekly feed intake and
egg production were recorded. Fresh faecal droppings were collected
immediately and cultured for LAB and Enterobacteriaceae and pH and VFA
production were also measured. Blood plasma cholesterol and fatty acid profiles
were assayed at the end of the experiment. Results obtained from this study
showed that FP reduced (P<0.05) the faecal Enterobacteriaceae and faecal pH.
Higher (P<0.05) counts of faecal LAB in layers fed with FP were observed.
However, FP did not enhance (P>0.05) the egg production and egg mass but
(P<0.05) decreased the egg weight slightly. Feed intake and feed conversion
ratio (FCR, feed intake/egg mass) were not affected (P>0.05). However, egg
yolk cholesterol and plasma cholesterol concentrations were reduced (P<0.05) in
the FP fed laying hens compared to the control laying hens. The n-6: n-3 ratio in
the egg yolk (control=7.9, FP9=6.1) and plasma (control=10.46, FP9=6.54) from
the FP fed laying hens were decreased compared to the control laying hens.
Moreover, FP was able to increase (P<0.05) the polyunsaturated fatty acid
(PUFA): saturated fatty acid (SFA) ratio, total n-3 PUFA and DHA
iv

vi
concentrations in egg yolk and plasma. In summary, the results of the dietary
manipulation demonstrated the effectiveness of FP in shifting the microflora
composition of the avian GIT towards a beneficial balance. In addition, it has
the ability to increase the unsaturated fatty acid (UFA) content to a more healthy
proportion in eggs.
v

vii
Abstrak tesis yang dikemukakan kepada Senat Universiti Putra Malaysia sebagai
memenuhi keperluan ijazah Master Sains
KESAN PEMBERIAN PRODUK HASIL FERMENTASI KE ATAS
MIKROORGANISMA TINJA DAN PENILAIAN KOMPOSISI TELUR
DALAM AYAM PENELUR
Oleh
ELIZABETH LAW FANG LIN
Januari 2006
Pengerusi: Profesor Madya Loh Teck Chwen, PhD
Fakulti: Pertanian
Tujuan utama kajian ini dijalankan adalah untuk mengkaji ciri-ciri produk hasil
fermentasi dan kesan pemberiannya ke atas ayam penelur. Sebanyak dua
eksperimen dilaksanakan untuk mencapai objektif di atas. Eksperimen I (Bab
IV) memberi tumpuan terhadap komposisi dan keseragaman produk hasil
fermentasi (FP). Nilai pemakanan dan kandungan kimia FP telah ditentukan.
Sejajar dengan tujuan ini, analisis mikrob termasuk penentuan bakteria asid
laktik (LAB) dan Enterobacteriaceae turut dijalankan. Proses fermentasi telah
diulang sebanyak tiga kali dengan menetapkan keadaan operasi dan kuantiti
bahan mentah yang sama. Kajian ini menunjukkan FP mempunyai ciri-ciri
fizikal, kimia dan mikrobiologi yang konsisten. Kewujudan asid lemak perlu
seperti asid linoleik (24%), asid linolenik (1.1%), asid eikosapentaenoik (EPA,
3.6%), asid dokosapentaenoik (DPA, 0.7%) dan asid dokosahexaenoik (DHA,
2.0%) dengan haruman limau nipis merupakan nilai tambahan produk.
vi

viii
Eksperimen II (Bab V) telah dijalankan untuk mengkaji kesan pemberian FP ke
atas ayam penelur terhadap mikroflora tinja, tahap asid lemak perlu dan
kolesterol di dalam telur dan plasma darah. Sebanyak 96 ekor ayam penelur
Babcock B380 yang berumur 13 minggu telah digunakan dalam kajian ini.
Kesemua ayam ditempatkan di dalam sangkar berasingan. Ayam-ayam ini
dibahagikan kepada empat kumpulan rawatan, setiap kumpulan mengandungi
lapan replikasi di dalam manakala setiap replikasi menggunakan tiga ekor. Diet
yang diberi adalah seperti berikut: Diet kawalan, FP3 (30g PHF/kg diet), FP6
(60g PHF/kg diet) dan FP9 (90g PHF/kg diet). Eksperimen II dijalankan selama
16 minggu, dua minggu pertama adalah minggu penyesuaian dan 14 minggu
berikutnya sebagai tempoh eksperimen sebenar. Pengambilan makanan dan hasil
pengeluaran telur direkodkan setiap minggu. Tinja dipungut untuk pengkulturan
LAB dan Enterobacteriaceae, penilaian pH dan penghasilan asid lemak meruap.
Pada akhir ekperimen, pengambilan darah dijalankan untuk menentukan
kandungan kolesterol plasma darah dan asid-asid lemak. Keputusan yang
didapati menunjukkan FP ini dapat mengurangkan populasi (P<0.05)
Enterobacteriaceae tinja dan merendahkan (P<0.05) pHnya. Pengkulturan tinja
menunjukkan kumpulan yang menerima diet FP mempunyai mikroorganisma
LAB yang lebih banyak (P<0.05) jika dibandingkan dengan kumpulan kawalan.
Walau bagaimanapun, ayam penelur yang menerima diet FP didapati tidak
berupaya (P>0.05) meningkatkan pengeluaran telur dan jisim telur, malahan
meyusutkan berat telur. Pengambilan makanan dan kadar penukaran makanan
juga didapati tidak menunjukkan perbezaan (P>0.05) bagi keempat-empat
kumpulan. Tetapi, penurunan terhadap tahap kolesterol di dalam kuning telur
dan plasma kolesterol dikesan (P<0.05) hasil daripada pemberian FP. Ayam
vii

ix
yang diberi FP menghasilkan telur (kawalan=7.9, FP9=6.1) dan plasma
(kawalan=10.46, FP9=6.54) dengan nisbah asid lemak n-6:n-3 yang lebih
rendah jika dibandingkan dengan kumpulan kawalan. FP dapat
mempertingkatkan nisbah antara asid lemak politaktepu (PUFA) dengan asid
lemak tepu, kandungan asid lemak politaktepu n-3 dan kandungan DHA di
dalam kuning telur. Secara keseluruhannya, keputusan menunjukkan FP
berkesan dalam meningkatkan prestasi ayam penelur. Sebagai kesimpulan,
kaedah manipulasi pemakanan yang dipraktikkan dalam ujian ini dapat
mengubah mikroorganisma dalam salur makanan ke aras keseimbangan yang
lebih baik. Tambahan pula, FP dapat meninggikan kandungan asid lemak tak
tepu pada telur ke tahap yang boleh memanfaatkan kesihatan pengguna.
viii

x
ACKNOWLEDGEMENTS
I would like to express my deep appreciation and sincere gratitude to my
supervisor Associate Professor Dr. Loh Teck Chwen, co-supervisors Professor
Dr. Zulkifli Idrus and Dr. Goh Yong Meng for their constructive criticism and
comments, invaluable guidance, friendship and unceasing patience in discussing
my project.
My sincere gratitude to Mr. Chan (the owner of the layer farm at Rawang)
where the experiment was conducted. To Mr Goh Jooi Yee, thanks for providing
all the raw materials and the bioreactor for the fermentation process. Thanks are
also due to Mr Ryan for his assistance in carrying out the farm work. Many
thanks are also extended to the technical staffs of the Nutrition laboratory,
Faculty of Agriculture and the Physiology laboratory, Faculty of Veterinary
Medicine. To Associate Professor Dr. Foo Hooi Ling, thanks for allowing me to
use the laboratory facilities at the Faculty of Biotechnology and Biomolecular
Science.
My special love and thanks to my beloved Mr. Cheng Joo Wah and his family
for their love, understanding and moral support throughout all these years. To
my dearest brother Raymond Law, thank you for your financial and moral
support. Last but not least, I would like to thank my friends, Mdm. Nwe Nwe
Htin, Mr. Bodee Khamseekiew, Mdm. Devika Saddul, Mr. Imad for their
friendships and encouragement during the study.
ix

xi
I certify that an Examination Committee has met on, 17th
January 2006 to
conduct the final examination of Elizabeth Law Fang Lin on her Master of
Science thesis entitled “Effects of Feeding a Fermented Product on the Faecal
Microflora and Egg Composition in Laying Hens” in accordance with Universiti
Pertanian Malaysia (Higher Degree) Act 1980 and Universiti Pertanian Malaysia
(Higher Degree) Regulations 1981. The Committee recommends that the
candidate be awarded the relevant degree. Members of the Examination
Committee are as follows:
Azhar Kasim, PhD
Associate Professor
Faculty of Agriculture
Universiti Putra Malaysia
(Chairman)
Rajion Ali, PhD
Professor
Faculty of Veterinary Medicine
Univerisiti Putra Malaysia
(Internal Examiner)
Abdul Razak bin Alimon, PhD
Associate Professor
Faculty of Agriculture
Universiti Putra Malaysia
(Internal Examiner)
Wan Zahari Mohamed, PhD
Principle Research Officer
Strategies Livestock Research Centre
Mardi, Serdang
(External Examiner)
ZAKARIAH ABDUL RASHID ALI, PhD
Professor/Deputy Dean
School of Graduate Studies
Universiti Putra Malaysia
Date:
x

xii
This thesis submitted to the Senate of Universiti Putra Malaysia and has been
accepted as fulfilment of the requirement for the degree of Master of Science.
The members of the Supervisory Committee are as follows:
Loh Teck Chwen, PhD
Associate Professor
Faculty of Agriculture
Universiti Putra Malaysia
(Chairman)
Zulkifli Idrus, PhD
Professor
Faculty of Agriculture
Universiti Putra Malaysia
(Member)
Goh Yong Meng, PhD
Lecturer
Faculty of Veterinary Medicine
Universiti Putra Malaysia
(Member)
AINI IDERIS, PhD
Professor/Dean
School of Graduate Studies
Universiti Putra Malaysia
Date:
xi

xiii
DECLARATION
I hereby declare that the thesis is based on my original work except for
quotations and citations which have been duly acknowledged. I also declare that
it has not been previously or concurrently submitted for any other degree at
UPM or other institutions.
ELIZABETH LAW FANG LIN
Date:
xii

xiv
TABLE OF CONTENTS
Page
DEDICATION ii
ABSTRACT iii
ABSTRAK vi
ACKNOWLEDGEMENTS ix
APPROVAL x
DECLARATION xii
LIST OF TABLES xvi
LIST OF FIGURES xviii
LIST OF ABBREVIATIONS xix
CHAPTER
1 GENERAL INTRODUCTION
2 LITERATURE REVIEW
2.1 Probiotics
2.1.1 Definition and characteristics
2.2 The environmental friendly probiotic-Lactic acid bacteria
2.2.1 Definition and characteristics
2.2.2 Lactobacilli
2.3 Fermented product (FP)
2.3.1 Introduction of fermented foods
2.3.2 LAB as starter cultures in fermented food industries
2.3.3 Lactic acid bacterial fermentation
2.3.4 Fermentation end products
2.3.5 Application of fermented products in animal feed
2.4 Gut microflora and probiotics
2.4.1 Microbial population and the gut ecosystem
2.4.2 Functions of the intestinal flora
2.4.3 Factors modulating the avian gut microflora
2.4.4 Role of VFA on the cecal microflora
2.5 The nutrient composition of eggs
2.5.1 Fatty acid composition and cholesterol content of eggs
2.5.2 Effects of dietary manipulation on nutritional content
of eggs
2.6 The digestion and absorption of fatty acids in monogastrics
2.7 Literature summary
1
3
7
8
9
12
16
21
26
27
28
29
30
31
32
32
33
36
38
xiii

xv
3 GENERAL APPROACH OF THE STUDY AND
EXPERIMENTAL PROCEDURE
3.0 General research approach
3.1 The production of fermented product (FP)
3.2 Proximate analyses
3.1.1 Dry matter
3.1.2 Ash
3.1.3 Crude protein
3.1.4 Crude fiber
3.1.5 Ether extract
3.1.6 Gross energy content
3.3 pH determination
3.4 Bacteriological analyses
3.5 Fatty acid profile determination
3.5.1 Total lipid extraction
3.5.2 Preparation of fatty acid methyl esters (FAME)
3.5.3 Gas liquid chromatography
3.6 Total cholesterol determination
3.7 Volatile fatty acid (VFA) determination
3.8 Plasma total cholesterol
4 THE MICROBIAL PROPERTIES AND CHEMICAL
COMPOSITIONS OF THE FERMENTED PRODUCT
4.1 Introduction
4.2 Materials and methods
4.2.1 Preparation of FP
4.2.2 Chemical and microbiological
4.2.3 Statistical analyses
4.3 Results
4.3.1 Microflora counts of the FP
4.3.2 Physico-chemical characteristic of the FP
4.4 Discussion
4.4.1 Microflora of the FP
4.4.2 Physico-chemical characteristics of the FP
4.5 Conclusions
5 EFFECTS OF FEEDING THE FERMENTED PRODUCT
TO LAYERS ON FAECAL MICROFLORA, ESSENTIAL
FATTY ACID AND CHOLESTEROL LEVELS IN EGGS
AND PLASMA 5.1 Introduction
5.2 Materials and Methods
5.2.1 Experimental birds
5.2.2 Diets
5.2.3 Sample collection and chemical analyses
5.2.4 Statistical analyses
39
40
41
42
42
43
45
46
48
48
49
50
51
52
53
54
56
59
59
59
60
61
64
65
67
68
70
70
73
74
xiv

xvi
5.3 Results
5.3.1 Faecal Enterobacteriaceae counts
5.3.2 Faecal LAB counts
5.3.3 Faecal pH
5.3.4 Faecal volatile fatty acid concentrations
5.3.5 Egg yolk fatty acid profiles
5.3.6 Egg yolk cholesterol concentrations
5.3.7 Plasma fatty acid profile
5.3.8 Plasma cholesterol
5.3.9 Layer performance
5.4 Discussion
5.4.1 Faecal characteristics
5.4.2 Egg nutritive value
5.4.3 Plasma fatty acid profile
5.4.4 Plasma cholesterol
5.4.5 Layer performance
5.5 Conclusions
6 GENERAL DISCUSSION AND CONCLUSIONS
6.1 General discussion
6.2 Conclusions
6.3 Recommendations
BIBLIOGRAPHY
APPENDICES
BIODATA OF THE AUTHOR
75
76
77
78
80
82
83
85
86
89
92
94
95
96
97
98
103
104
105
125
142
xv

xvii
LISTS OF TABLES
Table
Page
2.1
2.2
2.3
2.4
2.5
2.6
2.7
4.1
4.2
4.3
5.1
5.2
5.3
5.4
5.5
5.6
5.7
5.8
Desirable characteristics of probiotics
Microorganisms used in probiotics for farm animals
Fermented foods, beverages and their associated LAB
Homo- and heterofermentative LAB
Microflora population of the GIT and faeces in chickens
Reported values for saturated, monosaturated and
polysaturated fatty acid content of egg yolk as a result of
dietary interventions
Reported values for cholesterol content of egg yolk as a
result of dietary interventions
Total lactobacilli and Enterobacteriaceae counts in raw
materials and finished FP
Physico-chemical characteristics of FP
Fatty acid concentration in FP of different batches
Composition of pullet diets (from 13-18 weeks of age)
Composition of layer diets (from 19 weeks to 29 weeks of
age)
Effects of treatment diets on faecal Enterobacteriaceae
counts
Effects of treatment diets on faecal LAB counts
Effects of treatment diets on faecal pH
Effects of treatment diets on faecal VFA
Effects of treatment diets on egg yolk fatty acid compositions
(average from 25 to 29 weeks of age)
Effects of treatment diets on egg yolk cholesterol
concentrations in birds from 25 to 29 weeks of age
5
6
15
20
28
34
35
60
61
63
71
72
75
76
77
79
81
82
xvi

xviii
Table
Page
5.09
5.10
5.11
Effects of treatment diets on plasma fatty acid compositions
of birds at 29 weeks of age
Effects of treatment diets on egg mass
Effects of treatment diets on egg weight
84
87
88
xvii

xix
LISTS OF FIGURES
Figure
Page
2.1
2.2
2.3
5.1
5.2
5.3
5.4
Simplified major pathways of glucose fermentation in LAB
The general metabolic pathway for the generation of
diacetyl by LAB
Simplified schematics showing the digestion, assimilation
and transport of fatty acids in monogastrics
Effects of treatment diets on plasma cholesterol
concentrations
Effects of treatment diets on daily feed intake
Effects of treatment diets on egg production
Effects of treatment diets on feed conversion ratios
18
26
37
85
86
87
88
xviii

xx
LIST OF ABBREVIATIONS
ANOVA analysis of variance
AOAC Association of Official Analytical Chemists
atm atmosphere
BW body weight
C12:0 lauric acid
C14:0 myristic acid
C15:0 pentadecanoic acid
C16:0 palmitic acid
C16:1 n-9 palmitoleic acid
C17:0 heptadecanoic acid
C17:1 heptadecenoic acid
C18:0 stearic acid
C18:1 n-9 oleic acid
C18:2 n-6 alpha-linoleic acid
C18:3 n-3 linolenic acid
C20:0 arachidic Acid
C20:1 n-9 eicosenoic acid
C20:2 n-6 eicosadienoic acid
C20:4 n-6 arachidonic acid
C20:5 n-3 eicosapentaenoic acid
C22:0 behenic acid
C22:5 n-3 docosapentaenoic acid
C22:6 n-3 docosahexaenoic acid
xix

xxi
C24:0 lignoceric acid
CF crude fibre
CFU colony forming unit
CH3 methane
cm centimetre
CO2 carbon dioxide
CP crude protein
oC degree Celsius
DHA docosahexaenoic acid
DM dry matter
DPA docosapentaenoic acid
EDTA ethylenediamino tetraacetic acid
EE ether extract
EMB eosin-methylene-blue
EPA eicosapentaenoic acid
FAME fatty acid methyl ester
FCR feed conversion ratio
FP fermented product
g gram
g/b/d gram per bird per day
GE gross energy
GIT gastrointestinal tract
GLC gas liquid chromatography
GRAS generally regarded as safe
H2O2 hydrogen peroxide
xx

xxii
HPLC high performance liquid chromatography
H2SO4 sulphuric acid
Kcal kilocalories
KOH potassium hydroxide
LAB lactic acid bacteria
LDL low-density lipoprotein
µl microlitre
µg microgram
mg milligram
ml milliliter
min minute
mM millimole
MUFA monounsaturated fatty acids
MRS DE Man, ROGOSA and SHAPE
N nitrogen
n-3 Omega-3
n-6 Omega-6
NaCl sodium chloride
Na2CO3 sodium carbonate
NaOH sodium hydroxide
NH3 ammonia
PUFA polyunsaturated fatty acids
URT upper respiratory tract
SAS statistical analysis system
SE standard error
xxi

xxiii
SEM standard error of mean
SFA saturated fatty acids
Sig. Significant
spp. species
Subsp Subspecies
UFA unsaturated fatty acids
VFA volatile fatty acids
v/w volume per weight
VLDL very low-density lipoprotein
v/v volume per volume
W. Weisella
w/v weight per volume
w/w weight per weight
xxii

xxiv
CHAPTER I
GENERAL INTRODUCTION
Over the last two decades, antibiotics are popularly used as growth enhancers
especially in intensive animal production. Antibiotic-based growth promoters
have undoubtly improved animal performance and health status. However, the
excessive use of antibiotics may cause pathogenic bacteria in food animals to
develop antibiotic resistance. Excessive use of antibiotics may also result in
antibiotic residue accumulation in animal products, which can be harmful to
consumers (Mikkelsen and Jensen, 2000; Demecková et al., 2002; Loh et al.,
2003b). Furthermore, cross-resistance to therapeutic antibiotics often occurs if
the therapeutic antibiotic and the growth-promoting antibiotics belong to the
same class of drugs. This in turn reduces the possibility of treatment in diseased
animals and human populations. As a consequence, the usage of antibiotics as
growth enhancers is prohibited in many countries (Kawashima, 2004).
Therefore, there is a need to replace or partially replace the usage of antibiotic to
sustain the growth and health of the animal in animal production.
At present, the improvement in biotechnology has led to a development of new
range of natural feed additives. These additives included probiotics, prebiotics,
enzymes, specific carbohydrates, organic acids, and recently fermented products
(FP). Lactic acid bacteria (LAB) is the commonly used starter culture in food
and feed fermentation (Leroy and de Vuyst, 2004; Chapter II). It has been
suggested that the LAB in the FP played an important role in preventing the

xxv
adherence, establishment, replication and virulence of enteropathogens (Daly et
al., 1993; Jin et al., 1998a,b; Patterson and Burkholfer, 2003) through the
production of antimicrobial metabolites such as organic acids, bacteriocin and
hydrogen peroxide (Leroy and Vuyst, 2004).
Direct feeding of FP has been shown to have beneficial effects in animal studies
(Loh et al., 2003a,b). The pathogenic Enterobacteriaceae in faeces was
decreased in conjunction with an increase in the beneficial faecal LAB among
FP fed animals. Similar results on the bactericidal effects of fermented feed on
the faecal pathogenic microflora such as Salmonella and Escherichia coli have
also been reported by other studies (Urlings et al., 1993; Mikkelsen and Jensen,
2000; van Winsen et al., 2001, 2002; Beal et al., 2002; Demecková et al., 2002;
Brooks, 2003; Canibe and Jensen, 2003; Brooks et al., 2003; Heres et al.,
2003a,b). However, the characteristic of the FP with a high fish content used in
this study has not been previously reported. Moreover, the use of this FP in the
diet of layers has not been documented. Therefore, the general objective of this
study was to study the characteristics of the FP fermentation and the effects of
feeding on layers. Two experiments were conducted to achieve the above
objective:
i. The microbial properties and chemical compositions of the FP.
ii. Effects of feeding the FP on faecal microflora, essential fatty acid and
cholesterol levels in eggs and plasma in laying hens.
2

xxvi
CHAPTER II
LITERATURE REVIEW
2.1 Probiotics
2.1.1 Definition and characteristics
The term “Probiotic” refers to substances produced by one microorganism that
are able to stimulate the growth of other microorganism(s), aptly described by
its Greek meaning of “pro live” (Ouwehand et al., 1999; Naidu et al., 1999). The
term “substances” is imprecise and would include even antibiotics. Therefore,
Fuller (1989) defined probiotics as mono- or mixed cultures of live
microorganisms which, when applied to animal or man, affect the host
beneficially by improving the properties of the indigenous microflora
(Shimakawa et al., 2003; Coeuret et al., 2004). This definition stressed the
importance of live microorganisms that improved the health status of either man
or animal (Havenaar and Huis in’t veld, 1992). Therefore the term ‘probiotics’ is
restricted to products which contain live microorganisms such as freeze-dried
cells or in a FP, improve the health status of man or animals (which can include
growth promotion of animals) and can have its effect in the mouth or
gastrointestinal tract (GIT), the upper respiratory tract (URT) or in the urogenital
tract (Havenaar and Huis in’t veld, 1992).
In 2001, the joint Food and Agriculture Organization of the United
Nations/World Health Organization (FAO/WHO) expert consultation on heath
3

xxvii
and nutritional properties of powder milk with live LAB, redefined probiotics as
“live microorganisms which, when administered in adequate amounts (as part of
food), confer a health benefit on the host”. This again highlighted the
importance of microbe viability in this most recent definition. The FAO/WHO
recognized that probiotics should be capable of exerting health benefits on the
host through growth and/or activity in the body (FAO/WHO, 2001). In order to
exert positive health effects, the microorganisms need to be viable, active and
abundant in the concentration of at least 106 cfu/g of bacteria on expiry. This is
because at least 108-10
9 cells should always be available as the minimum
therapeutic dose per day (Shimakawa et al., 2003; Coeuret et al., 2004).
Ideally, a microorganism should meet a number of predefined criteria in order to
be considered as a probiotic (Collins et al., 1998). The desirable characteristics
of probiotics are shown in Table 2.1. Table 2.2 shows the common
microorganisms used in probiotic products. Adherent probiotics strains are
desirable because they have a greater ability to establish themselves and survive
in the GIT environment, thus colonizing the intestine to enhance their probiotic
effects (Lee and Salminen, 1995; Kheadr et al., 2004). Furthermore, it should be
technologically suitable for their incorporation into food products from a
common dairy processing, fermentation technology or pharmaceutical
manufacturing protocols. Furthermore, it must be able to survive in industrial
applications (on a commercial scale) at high numbers in the product until the
end of shelf life, through and following consumption (Rogelj, 1994; Stanton et
al., 1998; Catherine et al., 2003).
4

xxviii
Table 2.1: Desirable characteristics of probiotics
• Of human origins
• Generally regarded as safe (GRAS) status
• Desirable metabolic activity
• Production of antagonistic antibacterial profiles
• Proliferation and/or colonization on the location where it is active
• No pathogenic, toxic, allergic, mutagenic or carcinogenic reaction by the probiotics itself, its fermentation products or its cell components
• Genetically stable, no plasmid transfer
• Easy and reproducible production
• Viable during processing and storage
• Potential vehicle for the delivery of recombinant proteins and peptides in
a site-specific fashion to the human GIT
Source: Havenaar and Huis in’t Veld (1992); Collins et al., (1998).
5

Table2.2: Microorganisms used in probiotics for farm
animals
Lactobacillus
spec
ies
Bifid
obacter
ium
spec
ies
Oth
er L
AB
Non-l
acti
cs
Lactobacillus acidophilus
Lactobacillus ca
sei
Lactobacillus cr
ispatu
s
Lactobacillus gallin
aru
m
Lactobacillus gass
eri
Lactobacillus jo
hnso
nii
Lactobacillus pla
nta
rum
Lactobacillus re
uteri
Lactobacillus rh
amnosu
s
Lactobacillus delbru
eckii
Lactobacillus ferm
entu
m
Lactobacillus bre
vis
Lactobacillus helve
ticu
s
Bifid
obacter
ium adolesc
entis
Bifid
obacter
ium anim
alis
Bifid
obacter
ium bre
vis
Bifid
obacter
ium infa
ntis
Bifid
obacter
ium lactis
Bifid
obacter
ium longum
Bifid
obacter
ium bifid
um
Bifid
obacter
ium
pse
udolo
ngum
Entroco
ccus fa
ecalis
Entroco
ccus fa
eciu
m
Lactoco
ccus la
ctis
Leu
conostoc mes
entero
ides
Ped
ioco
ccus acidilactici
Ped
ioco
ccus pen
tosa
ceus
Sporo
lactobacillus in
ulinus
Strep
toco
ccus th
ermophilus
Bacillus ce
reus
Bacillus su
btilis
Bacillus to
yoi
Bacillus mes
entericu
s
Bacillus lich
eniform
is
Bacillus natto
Sacc
haro
myc
es cer
evisia
e
Asp
ergillu
s ory
zae
Candid
a pin
tolo
pes
ii
Pro
pio
nib
acter
ium
freu
den
reichii
Sourc
e: F
ull
er (
1999);
Holz
apfe
l, (
1997).
6

7
2.2 The environmental-friendly probiotics: Lactic acid bacteria
2.2.1 Definition and characteristics
Lactic acid bacteria (LAB) is a group of bacteria commonly used as probiotics
(Schillinger, 1999; Fooks and Gibson, 2002). They are bacteria that ferment sugar,
such as glucose, predominantly to lactic acid (lactate) as the major end product
(Liu, 2003). They are gram-positive, non-sporing, non-motile, catalase-negative and
non-aerobic organisms (Wessels et al., 2004). The LAB stains are generally
mesophilic but can grow at temperatures as low as 5oC or as high as 45
oC. The
majority of strains grow well at pH 4-4.5. Some are active at pH 9.6 and others at
pH 3.2. They can tolerate a lower intracellular pH than many other bacteria, thus
they are more resistant to acidic conditions (Adams and Nicolaides, 1997). The
LAB strains are generally weak proteolytic and lipolytic. They require preformed
amino acids, purine and pyrimidine bases and B vitamins for growth (Caplice and
Fitzgerald, 1999).
The main genera of LAB includes Lactobacillus, Lactococcus, Streptococcus,
Pediococcus, Enterococcus, Leuconostoc, Aerococcus, Carnobacterium,
Tetragenococcus, Oenococcus, Weissella and Vagococcus (Adams and Nicolaides,
1997; Stiles and Holzapfel, 1997; Wessels et al., 2004). They play an essential role
in foods, feeds, silages and beverage fermentations given that a wide variety of
strains are routinely employed as starter cultures in the manufacture of dairy, wine,
7

8
meat, fish, silage and vegetable products (Lindgren and Dobrogosz, 1990; Liu,
2003; Schnürer and Magnusson, 2005). They have traditionally been used as natural
biopreservatives of foods and feeds. In fact, they are present naturally in food as
long as people have eaten fermented foods (Rolfe, 2000). The LAB contributes to
the flavour and texture changes in food and feed fermentation. It also had a
preservative effect resulting in an increase in the shelf life of the transformed
product apart from eliminating the pathogenic microorganisms (Wessels et al.,
2004; Schnürer and Magnusson, 2005).
2.2.2 Lactobacilli
The genus Lactobacillus comprises about 50 species. They are facultative
anaerobic, gram-positive bacteria; catalase negative, chemo-organotropic, typically
non-motile, non-sporulating and non-pigmented mesophilic, but some species
showed slightly yellow pigmentation in caryophanon (Kandler and Weiss, 1986).
They tolerate temperature ranges between 2ºC to 53ºC, with the optimum for most
strains at about 30 to 40ºC. The optimal sustenance pH for growth is usually 5.5-6.2
and growth generally occurs at five or less. The growth rate is often reduced at
neutral pH or alkaline conditions.
The genus Lactobacillus is one of the largest groups of lactic acid bacteria used in
the food fermentation process and is therefore of great economical importance. It is
normally found in the dairy products, meat and fish products, water, sewage, beer,
8

9
wine, fruits and fruit juices, pickled vegetables, sauerkraut, silage, sour dough, and
mash (Lindgren and Dobrogosz, 1990; Hansen, 2002; Liu, 2003; Schnürer and
Magnusson, 2005). Lactobacilli strains vary in their fermentation process, hydrogen
peroxide (H2O2) and bacteriocin production. It is important because these different
features make them a versatile group suitable for growing in different conditions
(Mombelli and Gismondo, 2000). Lactobacilli also constitute a significant portion
of the human intestinal microflora, and their association with the general state of
human health is a subject of intensive investigation (Sharpe 1981; Salminen et al.,
1996).
2.3 Fermented product
2.3.1 Introduction of fermented product (FP)
Fermentation has been performed, as an art, for many centuries and it is an
important part of the microbiology-based industry. It is one of the oldest
technologies used for food preservation (Motarjemi, 2002; Prajapati and Nair,
2003). Moreover, production of modified foods and beverages involving
fermentations has been practiced for approximately 10, 000 years before the
existence of microorganisms was recognized. Through the ages, fermentation has
had a major impact on nutritional habits and traditions, on culture and on the
commercial distribution and storage of foods (Holzapfel, 2002), where refrigeration
is not available for the safe keeping of foods.
9

10
Fermentation is a desirable process dependent on the biochemical changes through
the action of enzymes elaborated by microorganisms for the production of a range
of metabolites (Nout and Motarjemi, 1997; Jay, 2000). Metabolites suppress the
growth and survival of undesirable microflora in the feedstuff. Biochemically,
fermentation is the metabolic process in which carbohydrates as well as some non-
digestible poly- and oligosaccharides are partially oxidized with the release of the
energy in the absence of any external electron acceptors. In broad terms,
fermentation involves the use of microorganisms to carry out enzyme-catalyzed
transformations of organic matter contributing to the development of characteristic
properties in taste, aroma, texture, visual appearance, shelf life and safety (Nout and
Motarjemi, 1997; Holzapfel, 2002). Enzymes indigenous to the raw materials may
play an important role in enhancing these characteristics (Hammes, 1990a,b).
Through trial and error, traditional skill gradually evolved and techniques were
developed to control the technical parameters during fermentation processes.
Experience has also shown that back-sloping, or the inoculation of raw materials
with a residue from a previous batch, accelerates the initial phase of fermentation
and results in the promotion of desirable changes during the fermentation process
(Holzapfel, 2002).
Recent developments in biotechnology in developing countries has led to a variety
of FP, which included beverages (alcoholic and non-alcoholic), fermented meat,
fish, vegetables, dairy products and condiments which are produced from both
edible and inedible raw materials (Motarjemi, 2002; Rolle and Satin, 2002). This
10

11
has led to a better standardized FP with desirable characteristics such as improved
texture and flavour production, better storage properties, and enhanced nutritional
value.
The fermented feeds have been used successfully as animal feed in developed
countries. Their application has been extensively reported (Beal, et al., 2002; van
Winsen et al., 2001, 2002; Demecková, et al., 2002, Heres et al., 2003a,b, 2004).
The FP is a value added products that have been anaerobically fermented and whose
physical, chemical and biological characteristics have been modified by the activity
of microorganisms. They are generally appreciated for attributes such as pleasant
flavour, aroma and texture (Holzapfel, 2002). It contains high numbers of LAB and
yeast, a low pH and high concentration of lactic acid (Geary et al., 1996; Mikkelsen
and Jensen, 1997; Brooks et al., 2001). It is known to contain specific microbial
metabolites such as alcohol; lactic acid, propionic acid, acetic acid, carbon dioxide
(CO2), H2O2 and bacteriocins (Holzapfel, 2002). These derived products, which
could be named “tertiary metabolites”, can play a significant role in the biological
activities of FP.
Food ingredients chosen for fermentation could be of animal or plant origins
contained not only a variety of nutrients for animal feeding but also for the
microbial growth and metabolism during fermentation (Nout, 2001). The action of
microorganisms during the preparation of cultured foods has been shown to
improve the quality, availability and digestibility of some dietary nutrients (Alm,
11

12
1982). In general, biochemical activity may result in the desirable effect of
microbial activity in the FP. Microbial enzymes can improve food digestion in the
animal’s GIT, and thus increase nutrient uptake by breaking down carbohydrates,
lipids, proteins, and other food components (Nout, 2001).
2.3.2 LAB as starter cultures in fermented food industries
The general name “lactic acid bacteria” (LAB) has been given to bacteria, which
formed at least 50% of lactic acid at the end of carbohydrate catabolism, by
conversion of carbon source (Klander, 1983; Condon, 1987). A starter culture may
be defined as a preparation or material containing large numbers of variable
microorganisms. They accelerate the fermentation process. Being adapted to the
substrate, a typical starter culture facilitates improved control of a fermentation
process and predictability of its products (Holzapfel, 1997). In addition, starter
cultures facilitate control over the initial phase of a fermentation process. Modern
starter cultures comprised of either single or multiple strains of LAB, specifically
for their adaptation to a substrate or raw material. Those best adapted to the food
substrate and to technical control parameters, eventually dominate the process and
initiate rapid acidification of the raw material through the production of organic
acids. The production of antimicrobial substances, acetic acid, ethanol, aroma
compounds, bacteriocins, exopolysacharides, and several enzymes are crucial to the
antimicrobial properties of LAB derived FP (Leroy and Vuyst, 2004). Furthermore,
selected strains may enhance the general benefits of spontaneous fermentation such
12

13
as improved protein digestibility and micronutrient bioavailability, and contribute
more specifically to biological enrichment through the biosynthesis of vitamins and
essential amino acids (Nout and Mortarjemi, 1997; Holzapfel, 2002).
The LAB, which include the genera Lactococcus, Streptococcus, Lactobacillus,
Pediococcus, Leuconostoc, Enterococcus, and Propionibacterium (Nettles and
Barefoot, 1993; Holley and Blaszyk, 1998), played an essential role in food
fermentations. The LAB as well as Micrococcaceae strains are important
microorganism used as starter cultures in meat fermentation (Papamanoli et al.,
2003). Several LAB spp. are associated with meat and fish fermentations (Lücke,
2000; Ross et al., 2002). Lactobacillus sakei, Lactobacillus curvatus and
Lactobacillus plantarum (Hammes and Hertel, 1998; Holley and Blaszyk, 1998;
Hugas et al., 2003) have been determined to be superior starter cultures for meat
fermentations. Leuconostoc mesenteroides frequently dominates the early stage of
most spontaneous fermentations. Thermophilic LAB such as Lactobacillus
bulgaricus, Lactococcus lactis, and/or Lactobacillus Helveticus and the coccus-
shaped bacterium Streptococcus thermophilus with an optimum temperature around
40oC, is used in the manufacturing of fermented foods and milk (Thunell and
Sandine, 1985; Caplice and Fitzgerald, 1999). Plant materials containing
fermentable sugar provide suitable substrates for the yeast species such as
Saccharomyces, Candida, Torula, and Hansenula. Although the growth rate of
these yeasts is lower than that of bacteria, such as Lactobacillus mesenteroides,
13

14
strain of Saccharomyces cerevisiae eventually dominates most spontaneous
alcoholic fermentations as in the production of beer and wine (Holzapfel, 2002).
The LAB are well known for their acidification of the FP (Hammes et al, 1990).
They improve safety, shelf life and stability of the product and inhibit the growth of
spoilage and pathogenic bacteria (Lucke, 2000; Holley and Blaszyk, 1998; Caplice
and Fitzgerald, 1999) through the competition for nutrients and the presence of
inhibitors including organic acids, H2O2 and bacteriocins (Ray, 1992). For example,
Daly et al. (1993) demonstrated the inhibition of the food bone pathogens
Pseudomonas fluorescens, Streptococcus aureus and Clostridium perfringens by
inoculation with the starter Streptococcus diacetylactis. Most of these genera have
one thing in common: they produce lactic acid during their growth in the food
products (Propionibacteria is the exception). The result is that most cultured foods
taste sour (Gilliland, 1985a). The common starter cultures used in the fermented
product are summarized in Table 2.3.
14

15
Table 2.3: Fermented foods, beverages and their associated
LAB
Types of
fermented products
Types of LAB
Dairy product
-Cheese
-Yoghurt
-Fermented milk
Fermented meats
-Fermented sausage
-Fermented fish products
-Fermented pork products
Fermented vegetables
-Sauerkraut
-Pickles
-Kimchi
-Fermented olive
-Fermented vegetables
Fermented cereals
-Sourdough
Alcoholic beverages
-Wine
-Rice wine
Lactococcus lactis, Lactobacillus delbruekii,
Lactobacillus helveticus, Lactobacillus casei,
streptococcus thermophilus
Lactobacillus delbruekii, streptococcus thermophillus
Lactobacillus casei, Lactobacillus acidophilus,
Lactobacillus rhamnosus, Lactobacillus johnsonii
Lactobacillus sakei, Lactobacillus curvatus,
Lactobacillus alimentarius, Pediococcus pentosaceus
L. alimentarius, Carnobacterium piscicola
Pediococcus cerevisiae, Lactobacillus plantarum,
Lactobacillus brevis, Lactobacillus salivarius,
Pediococcus pentosaccus
Leucnostoc mesenteroides, Lactobacillus plantarum,
Lactobacillus brevis, Pediococcus acidilactici
Leuconostoc mesenteroides, Pediococcus cerevisiae,
Lactobacillus brevis, Lactobacillus plantarum
Leuconostoc mesenteroides, Lactobacillus plantarum,
Lactobacillus brevis
Leuconostoc mesenteroides, Lactobacillus pentosus,
Lactobacillus plantarum
Pediococcus acidilactici, Pediococcus pentosaceus,
Lactobacillus plantarum, Lactobacillus fermentum
Lactobacillus sanfransiscensis, Lactobacillus
farciminis, Lactobacillus fermentum, Lactobacillus
brevis, Lactobacillus plantarum, Lactobacillus
amylovorus, Lactobacillus reuteri, Lactobacillus
pontis, Lactobacillus panis, Lactobacillus
alimentarius, Weisella cibaria
Oenococcus oeni
Lactobacillus sakei
Source: Leroy and de Vuyst, (2004).
15
16
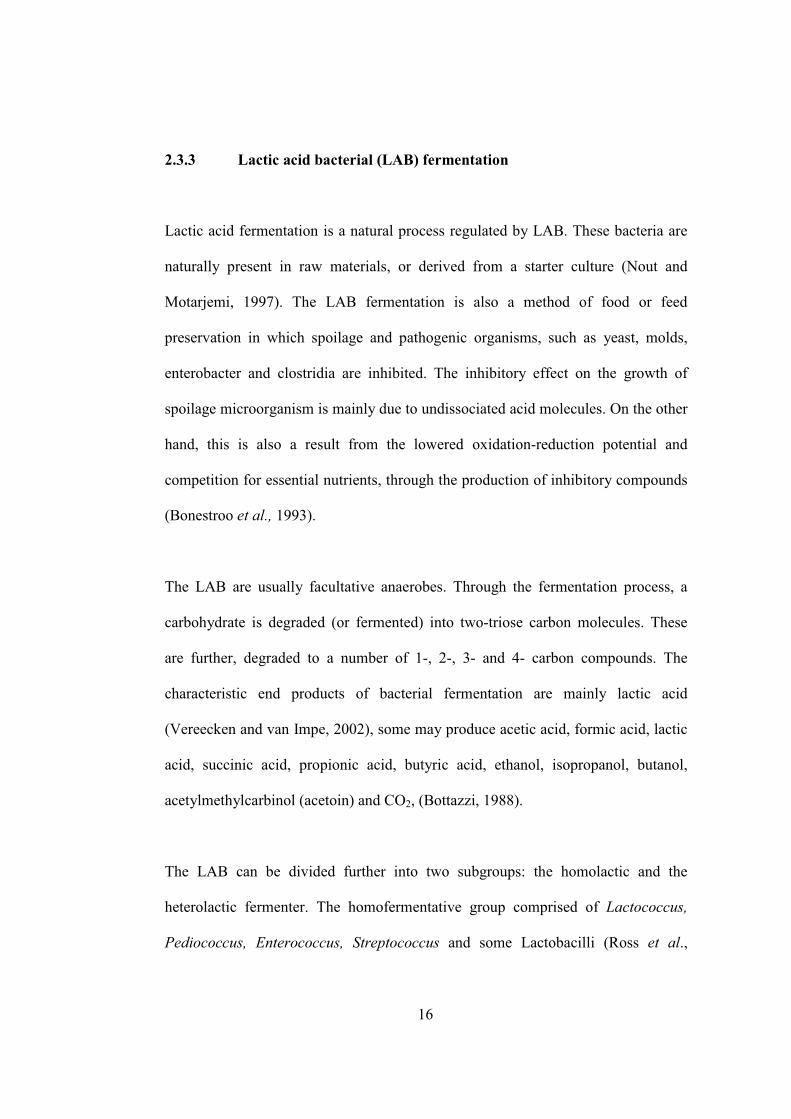
2.3.3 Lactic acid bacterial (LAB) fermentation
Lactic acid fermentation is a natural process regulated by LAB. These bacteria are
naturally present in raw materials, or derived from a starter culture (Nout and
Motarjemi, 1997). The LAB fermentation is also a method of food or feed
preservation in which spoilage and pathogenic organisms, such as yeast, molds,
enterobacter and clostridia are inhibited. The inhibitory effect on the growth of
spoilage microorganism is mainly due to undissociated acid molecules. On the other
hand, this is also a result from the lowered oxidation-reduction potential and
competition for essential nutrients, through the production of inhibitory compounds
(Bonestroo et al., 1993).
The LAB are usually facultative anaerobes. Through the fermentation process, a
carbohydrate is degraded (or fermented) into two-triose carbon molecules. These
are further, degraded to a number of 1-, 2-, 3- and 4- carbon compounds. The
characteristic end products of bacterial fermentation are mainly lactic acid
(Vereecken and van Impe, 2002), some may produce acetic acid, formic acid, lactic
acid, succinic acid, propionic acid, butyric acid, ethanol, isopropanol, butanol,
acetylmethylcarbinol (acetoin) and CO2, (Bottazzi, 1988).
The LAB can be divided further into two subgroups: the homolactic and the
heterolactic fermenter. The homofermentative group comprised of Lactococcus,
Pediococcus, Enterococcus, Streptococcus and some Lactobacilli (Ross et al.,
16

17
2002). The homolactic acid or simple LAB degrade glucose, via the Embden-
Meyerhof pathway to convert one mole of glucose into two moles of lactate
(Caplice and Fitzgerald, 1999). In homofermentative lactic acid fermentation, the
predominant product is lactic acid, which has a limited preservation effect that is
dependent on the pH value (Bottazzi, 1988; Holzapfel, et al., 1995).
The heterolactic fermenters are sometimes referred to as mixed lactic acid
fermenters. These organisms may catabolize glucose by one of three degradation
pathways (Embden-Meyerhof, Pentose Shunt or the Entner-Doudoroff process) to
yield characteristic end products comprising of lactic acid plus acetic and formic
acids, ethyl alcohol (ethanol), CO2 and glycerol. Members of this group include
Leuconostoc, Weisella, and some lactobacilli (Ross et al., 2002). The
homofermentative and heterofermentative pathways are shown in Figure 2.1.
17

18
Glucose
Glucose-6-P Glucose-6-P
Fructose-6-P 6-phosphogluconate
Fructose-1,6-DP Riboluse-5-P
Glyceraldehyde-3-P Dihydroxyacetone-P
H2O
2 Pyruvate Glyceraldehyde-3-P Acetyl-P
2 Lactate Pyruvate Acetaldehyde
Lactate Ethanol
Homofermentative organism Heterofermentative organism
Figure 2.1: Simplified major pathways of glucose fermentation in LAB.
Source: Compiled from Caplice and Fitzgerald, (1999); Liu, (2003).
On the other hand, a single bacteria species (such as Lactobacillus brevis,
Lactobacillus fermentum, Lactobacillus reuteri, Leuconostoc mesenteroides) may
exhibit both homolactic and heterolactic acid fermentation and they are known as
facultative heterofermenters. These microorganisms usually ferment hexoses
homofermentatively into lactic acid (Vuyst and Vandamme, 1994). However under
special conditions, substrates are converted to lactic acid, CO2 and ethanol (or acetic
acid). Acetic acid production occurs under conditions where NAD+ can be
regenerated without the formation of ethanol, for example through the reduction of
fructose or molecular oxygen. Pentoses are fermented into lactic and acetic acid via
a phosphoketolases. The controlling factor is influenced by the pH and substrate
18

19
present for bacterial activity (Ross et al., 2002). The examples of the
homofermentative and heterofermentative LAB are given in Table 2.4.
19

20
Table 2.4:
Homo- and heterofermentative LAB
Hom
ofe
rmen
tati
ve
H
eter
ofe
rmen
tive
Lactobacillus
spp.
Lactobacillus acidophilus Lactobacillus alimen
tarius
Lactobacillus bulg
aricu
s Lactobacillus ca
sei
Lactobacillus co
ryniform
is L
actobacillus cu
rvatu
s
Lactobacillus delbru
eckii Lactobacillus Helve
ticu
s
Lactobacillus ju
gurti L
actobacillus jense
ii
Lactobacillus la
ctis Lactobacillus leichmannii
Lactobacillus pla
nta
rum Lactobacillus sa
liva
rius
Ped
ioco
ccus
spp.
Ped
ioco
ccus acidilactici P
edio
cocc
us ce
revisiae
Ped
ioco
ccus pen
tosa
ceus P
edio
cocc
us damnosu
s
Ped
ioco
ccus dex
trin
icus P
edio
cocc
us in
opin
atu
s
Ped
ioco
ccus parv
ulu
s
Tetra
gen
oco
ccus
spp.
Tetra
gen
oco
ccus halo
philus Tetra
gen
oco
ccus muriaticu
s
Strep
toco
ccus
spp.
Strep
toco
ccus bovis Strep
toco
ccus th
ermophilus
Lactoco
ccus
spp.
Lactoco
ccus Lactis Lactoco
ccus garv
ieae
Lactoco
ccus pla
nta
rum Lactoco
ccus ra
ffin
ola
ctis
Vagoco
ccus
spp.
Vagoco
ccus fluvialis V
agoco
ccus sa
lmonin
aru
m
Lactobacillus
Lactobacillus bre
vis L
actobacillus buch
ner
i
Lactobacillus ce
llobio
sus L
actobacillus co
pro
philus
Lactobacillus ferm
entu
m Lactobacillus hilgard
ii
Lactobacillus sa
nfrancisc
o L
actobacillus trichoid
es
Lactobacillus fructivora
ns L
actobacillus pontis
Leu
conostoc
spp.
Leu
conostoc cr
emoris L
euco
nostoc dex
tranicum
Leu
conostoc la
ctis Leu
conostoc mes
entero
ides
Leu
conostoc gelid
um Leu
conostoc ca
rnosu
m
Leu
conostoc citreu
m Leu
conostoc fa
llax
Leu
conostoc arg
entinum
Leu
conostoc pse
udomes
entero
ides
Carn
obacter
ium s
pp.
Carn
obacter
ium diver
gen
s Carn
obacter
ium m
obile
Carn
obacter
ium gallin
aru
m Carn
obacter
ium pisicola
Weise
lla s
pp.
Weise
lla confu
sa W
eise
lla hellenica
Weise
lla halo
tolera
ns W
eise
lla kandleri
Weise
lla m
inor W
eise
lla virid
esce
ns
Weise
lla para
mes
entero
ides
Oen
oco
ccus
spp.
Oen
oco
ccus oen
i
Sourc
e: J
ay, (2
000).
20

21
2.3.4 Fermentation end products
The LAB produce a wide variety of antimicrobial compounds during fermentation
(de Vuyst and Vandamme, 1994; Caplice and Fitzgerald, 1999), including low
molecular weight metabolites such as CO2, H2O2, diacetyl, organic acids (lactic
acid, acetic acid, formic acid, phenyllactic acid, caproic acid), alcohols and high
molecular weight metabolites included polysaccharides, fatty acid and bacteriocins
(Adam and Nicolaides, 1997; Vereecken and van Impe, 2002; Leroy and de Vuyst,
2004). Recent observations, however, confirmed that a number of metabolites, such
as acetic acid (end product of heterofermentative fermentation), H2O2, and
bacteriocins, produced during the fermentation process, exhibit antimicrobial
properties, which may contribute to the feed safety of lactic fermented products
(Holzapfel, 2002). Obviously, each antimicrobial compound produced during
fermentation provides an additional hurdle for pathogens and spoilage bacteria to
overcome before they can survive and/or proliferate in a food, from time of
manufacture to time of consumption. This antimicrobial activity can contribute in a
number of ways towards improving the quality of fermented foods, for example,
through the control of pathogens, extending shelf life and improving sensory
qualities (Sullivan et al., 2002). Therefore, lactic fermented products in particular
are considered to be safe and wholesome. Acidification of pH values to less than 4.2
indicates a safer FP as pathogenic bacteria could not survive at this pH (Holzapfel,
2002).
21
22
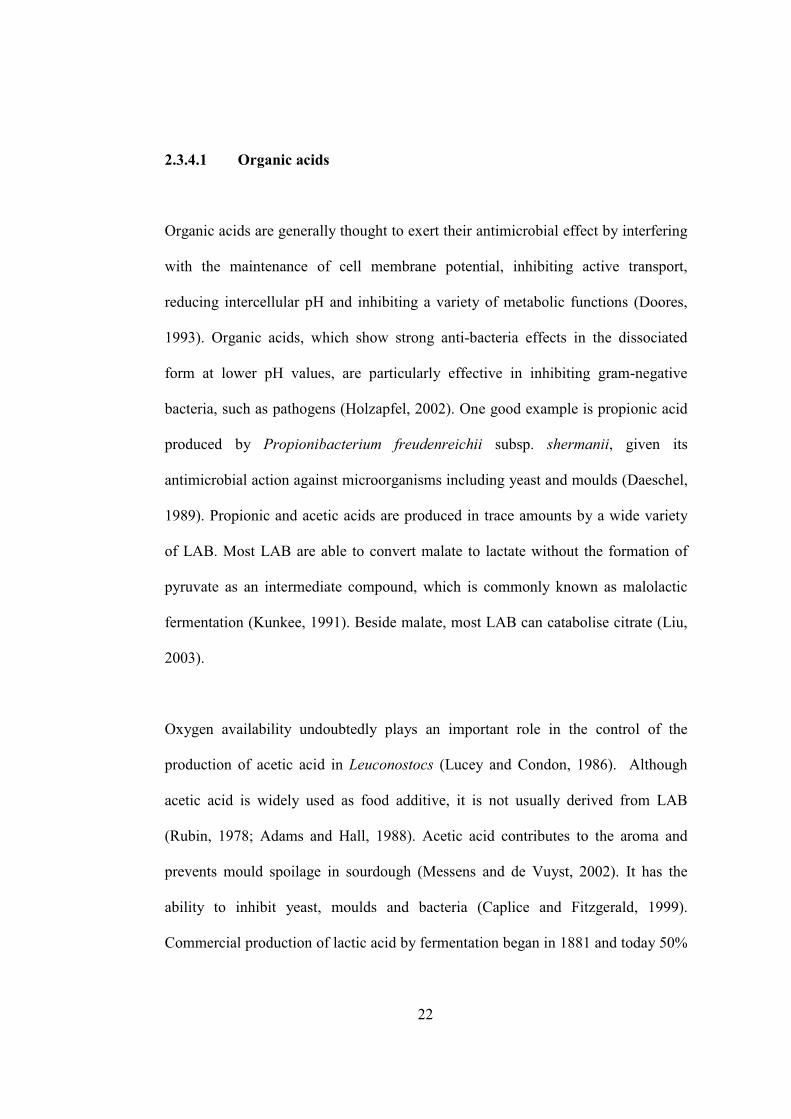
2.3.4.1 Organic acids
Organic acids are generally thought to exert their antimicrobial effect by interfering
with the maintenance of cell membrane potential, inhibiting active transport,
reducing intercellular pH and inhibiting a variety of metabolic functions (Doores,
1993). Organic acids, which show strong anti-bacteria effects in the dissociated
form at lower pH values, are particularly effective in inhibiting gram-negative
bacteria, such as pathogens (Holzapfel, 2002). One good example is propionic acid
produced by Propionibacterium freudenreichii subsp. shermanii, given its
antimicrobial action against microorganisms including yeast and moulds (Daeschel,
1989). Propionic and acetic acids are produced in trace amounts by a wide variety
of LAB. Most LAB are able to convert malate to lactate without the formation of
pyruvate as an intermediate compound, which is commonly known as malolactic
fermentation (Kunkee, 1991). Beside malate, most LAB can catabolise citrate (Liu,
2003).
Oxygen availability undoubtedly plays an important role in the control of the
production of acetic acid in Leuconostocs (Lucey and Condon, 1986). Although
acetic acid is widely used as food additive, it is not usually derived from LAB
(Rubin, 1978; Adams and Hall, 1988). Acetic acid contributes to the aroma and
prevents mould spoilage in sourdough (Messens and de Vuyst, 2002). It has the
ability to inhibit yeast, moulds and bacteria (Caplice and Fitzgerald, 1999).
Commercial production of lactic acid by fermentation began in 1881 and today 50%
22
23
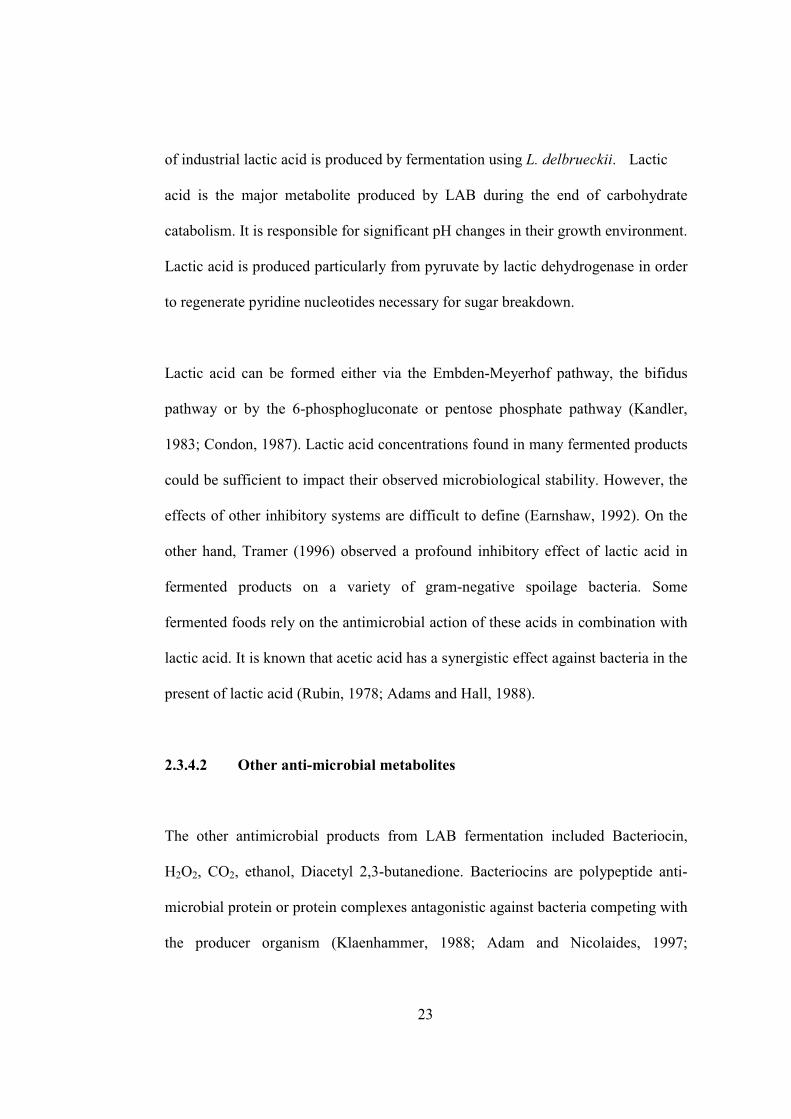
of industrial lactic acid is produced by fermentation using L. delbrueckii. Lactic
acid is the major metabolite produced by LAB during the end of carbohydrate
catabolism. It is responsible for significant pH changes in their growth environment.
Lactic acid is produced particularly from pyruvate by lactic dehydrogenase in order
to regenerate pyridine nucleotides necessary for sugar breakdown.
Lactic acid can be formed either via the Embden-Meyerhof pathway, the bifidus
pathway or by the 6-phosphogluconate or pentose phosphate pathway (Kandler,
1983; Condon, 1987). Lactic acid concentrations found in many fermented products
could be sufficient to impact their observed microbiological stability. However, the
effects of other inhibitory systems are difficult to define (Earnshaw, 1992). On the
other hand, Tramer (1996) observed a profound inhibitory effect of lactic acid in
fermented products on a variety of gram-negative spoilage bacteria. Some
fermented foods rely on the antimicrobial action of these acids in combination with
lactic acid. It is known that acetic acid has a synergistic effect against bacteria in the
present of lactic acid (Rubin, 1978; Adams and Hall, 1988).
2.3.4.2 Other anti-microbial metabolites
The other antimicrobial products from LAB fermentation included Bacteriocin,
H2O2, CO2, ethanol, Diacetyl 2,3-butanedione. Bacteriocins are polypeptide anti-
microbial protein or protein complexes antagonistic against bacteria competing with
the producer organism (Klaenhammer, 1988; Adam and Nicolaides, 1997;
23

24
Holzapfel, 2002). Proteolytic enzymes present in food substrate are capable of
inactivating bacteriocins. Bacteriocins may be produced early or late in the growth
cycle and can be either cell bound or released extracellularly. Bacteriocins are
ribosomally synthesized antimicrobial compound that are produced by many
different bacteria species including many members of LAB (Klaenhammer, 1988;
Jack et al., 1995). Nisin is produced by Lactococcus lactis subsp. Lactis (Tagg et
al., 1976). Bacteriocinogenic LAB have been shown to effectively inhibit the
growth of most gram-positive foodborne pathogens such as Streptococcus Aureus,
clostridium, bacillus spp., and Listeria monocytogenes (Holzapfel et al., 1995;
Adam and Nicolaides, 1997; Caplice and Fitzgerald, 1999; Holzapfel, 2002).
Inhibition of Escherichia coli and Salmonella are observed under conditions that
disrupt the outer membrane of target organisms at low pH and high salt
concentrations (Ross et al., 2002).
The H2O2 is produced during the aerobic growth stage. Hydrogen peroxide (H2O2)
has a strong oxidizing effect on membrane lipids and cellular proteins (Condon,
1987; Caplice and Fitzgerald, 1999). The H2O2 is produced by a wide variety of
catalase negative LAB (Condon, 1983; Thomas and Pera, 1983). The roles of LAB-
derived H2O2 in food preservation is limited because of the many complex-
controlling factors such as the availability of oxygen and the presence of varying
levels of superoxide dismutase and catalase (Simonetti et al., 1982).
24

25
The CO2, formed from heterolactic fermentation can directly create an anaerobic
environment. It is toxic at high concentration to aerobic food microorganisms such
as moulds. Moulds and oxidative gram-negative bacteria are most susceptible while
lactobacilli and yeast are highly tolerant. CO2 acts on cell membranes and has the
ability to reduce intracellular pH thereby inhibiting the growth of foodborne
pathogens (Adam and Nicolaides, 1997; Caplice and Fitzgerald, 1999; Holzapfel,
2002). Ethanol is a well established anti-microbial compound. It may contribute
significantly in the early stage of natural fermentation when heterofermenters are
most active. However the fermentation condition will change from the initial
aerobic to anaerobic as the oxygen is being utilized by the bacteria. Thus the
concentration being produced by heterofermentative LAB at the initial stage is low
so that the contribution is minimal (Adam and Nicolaides, 1997).
Diacetyl (2,3-butanedione) is produced by strains within all genera of LAB
(Lindgren and Dobrogosz, 1990) (Figure 2.2). It is a product of citrate metabolism
and is responsible for the production of aroma and flavour in the product. Low
concentration of Diacetyl (2,3-butanedione) can be an effective anti-microbial,
particularly at low temperature. It is active against Aeromonas hydrophilia, Bacillus
spp., Enterobacter aerogenes, Escherichia coli, Mycobacterium tuberculosis,
Pseudomonas spp., Salmonella spp., Staphylococcus aureus and Yersinia
enterocolitica. The mode of action is believed to be due to interference with the
utilization of arginine (Caplice and Fitzgerald, 1999).
25

26
Citrate
Acetate
Oxaloacetate
-COOH
Pyruvate
Acetolactate
O2
Acetoin Diacetyl
Figure 2.2: The general metabolic pathway for the generation of Diacetyl by
LAB
Source: Hansen, 2002; Liu, 2003.
2.3.5 Application of fermented products in animal feeds
Fermented products (FP) are one of the probiotic supplements used as animal feed
additives. Loh et al. (2003a,b) reported that feeding FP and fermented fruits
containing Lactobacillus-probiotics to rats and piglets successfully reduced the
Enterobacteriaceae and increased the LAB population in the GIT. The reduction of
faecal Enterobacteriaceae as a result of feeding lactobacilli probiotics in pigs of
different age groups have also been reported by other workers (Mikkelsen and
Jensen, 1998; van Winsen et al., 2002; Demecková et al., 2002). It is possible to
reduce the faecal Enterobacteriaceae counts by using fermented feed or lactic acid
(Cole et al., 1968). Heres et al. (2003a) reported that broilers fed fermented liquid
feeds had very much higher resistance to S. enteritidis challenge. It was found that a
26

27
total of 107 cfu/g of Salmonella was needed to infect chickens fed with fermented
liquid feeds whereas only 103 cfu/g was sufficient to infect the negative control
birds.
2.4 Gut microflora and probiotics
The gastrointestinal microflora consists of hundreds of different types of
microorganisms and is biologically important to the host. These microorganisms
have significant impacts on animal health, growth development, performance, waste
management and even food borne pathogens (Frankin et al., 2002; Dibner and
Richards, 2005). The intestinal microflora population is a complex ecosystem
composed of a species-diverse group of microflora, predominantly gram-positive
bacteria (Dibner and Richards, 2005). For farm animals, the most important purpose
in using FP, which contain probiotics is the idea that they influence the gut
beneficial microflora resulting in growth promotion of overall GIT health while
suppressing pathogenic organisms in young and growing animals. It helps in pre-
digestion of anti-nutritional factors, such as phytic acid, glucosinolates, trypsin
inhibitors, lectin and non-starch polysaccharides (dietary fibre).
The most commonly used probiotics are strains of LAB (e.g., Lactobacillus,
Bifidobacterium and Streptococcus). Directly fed microbes (lactobacilli-probiotics)
have been utilized to improve the health status and performance by modulating
and/or maintaining the gut microflora (Holzapfel et al., 1998; Jin et al., 1998a,b,
27

28
2000). The LAB are able to colonize and thrive in the host as they are able to resist
gastric acid, bile salts and pancreatic enzymes. The LAB adhere to intestinal
mucosal and readily colonize the intestinal tract. They are considered important
components of the gastrointestinal flora and are harmless in a healthy animal (Silva
et al., 1987).
2.4.1 Microbial population and the gut ecosystem
Compared to the colonic microflora, the gut microflora undergoes distinct
quantitative variation and seems to be a good qualitative indicator of the distal
colonic microflora (Holzapfel et al., 1998). In poultry, the ceca are the major site of
microbial digestion of carbohydrates and proteins leaving the small intestine.
Poultry caecum are colonized by abundant of bacterial flora. Table 2.5 shows the
estimated populations of microflora in the alimentary canal of poultry.
Table 2.5: Microflora population of the GIT and faeces in chickens
Stomach intestine Number of viable
microorganisms/gram
of contentsa
Crop Gizzard Upper Lower
Caecum Faeces
Total
Anaerobes
Enterobacteriaceaeb
Steptococci
Lactobacillus spp.
Clostridium
perfringens
6
3
6
2
5-6
<2
6
5-6
2
<2
2-3
<2
8-9
<2
1-2
4
8-9
<2
8-9
<2
1-3
3-5
8-9
<2
8-9
8-9
5-6
6-7
8-9
1-2
8-9
7-8
7-8
6-7
6-7
2
a Expressed as log 10 of the number of organisms cultured.
b Mainly Escherichia coli.
Source: Hirsh, (1990).
28

29
2.4.2 Functions of the intestinal flora
The intestinal microflora plays an important role in the development of organs,
tissues and the immune system (Holzapfel et al., 1998). The microflora also
provides both nutritional constituents and protection to the host animals in the form
of fermentation end products such as volatile fatty acids (VFA), amino acids and
vitamins (Salminen et al., 1998). The most important factor that determines the
composition of the gut microflora is the ability of it to compete for limiting
nutrients. For those which are unable to compete being effectively eliminated from
the system.
LAB especially Lactobacillus spp. are traditionally included in probiotic products to
help protect against the disruption of the colonic flora which cause by the
pathogens, dietary antigens or other harmful substances (Fook and Gibson, 2002).
These bacteria produce antimicrobial compounds prevent the colonization of
pathogens (Dibner and Richards, 2005). Gut microflora stimulate the development
of the intestinal host defense, including the mucus layer with its system of immune
cells that underlie the epithelium. This mucus layer segregates both normal and
pathogenic microbes away from the animal epithelium tissues (Dibner and
Richards, 2005).
29

30
2.4.3 Factors modulating the avian gut microflora
The avian gut microflora comprised of a dynamic population mix which is
constantly affected by intrinsic and extrinsic factors. Stress, age, feeding
programmes and diets can have an effect on the intestine microflora, usually with a
reduction of lactobacilli levels (Jin et al., 1998a,b, 2000; Timmerman et al., 2004).
There had been many attempts to manipulate the intestinal microflora in order to
maximize the performance and production of the host animal. The common method
is through dietary supplements in order to obtain the desirable microflora
(Holzapfel et al., 1998). Many products including antibiotics, organic acids,
probiotics, prebiotics, trace minerals, enzymes, herbs and spices, fermented feed
and others are used with the goal of altering the microflora for the benefit of animal
health and production (Jin et al., 1998a,b, 2000; Loh et al., 2003a,b; Dibner and
Richards, 2005). Antibiotics have been used widely for the past few decades.
However, the development of bacteria resistance has prohibited the use of
antibiotics in European countries (Patterson and Burkholder, 2003; Dibner and
Richards, 2005). Therefore, non-therapeutic alternatives such as fermented liquid
feeds have been successfully used to modulate the avian and swine gut microflora
(Mikkelsen and Jensen, 1998; van Winsen et al., 2002; Demecková et al., 2002)
without any adverse effect.
30

31
2.4.4 Roles of VFA on the caecal microflora
The VFA such as acetate, butyrate and propionate are highly prevalent anions of the
by-products of commensal bacteria in chicken intestines. They are known to
stimulate gut epithelial cell proliferation and villus size, thereby increasing the
absorptive surface area. In poultry, caecal bacteria ferment available nutrient to a
mixture of 2-5-carbon VFA, ammonia (NH3), CO2 and methane (CH3). The VFA
are absorbed and utilized by the animal, contributing significantly to the energy
supply of the animal (Annison et al., 1968; Johansson et al., 1998). The nutritional
significance of poultry caeca is limited due to its small volume. However, the
undissociated forms of VFA played an important role in reducing the number of
pathogenic bacterial species in the caecum (van der Wielen et al., 2001).
Barnes et al. (1980) reported that caecal VFA concentrations are indicators of
anaerobe growth. Nisbet et al. (1994, 1996) have confirmed this fact. There was a
negative correlation between caecal VFA concentrations, especially propionic acid,
in 3-day-old chicks with the establishment of anaerobe caecal microflora and
protection against Salmonella typhimurium colonization. Because of its antibacterial
properties, propionic acid was proposed as a prophylactic treatment for control of
salmonella infection in poultry.
31

32
2.5 The nutrient composition of eggs
Eggs are one of the few foods that are used throughout the world. It is an important
part of the human diet due to its nutritional significance (Gonzalez-Esquerra and
Leeson, 2000; Milinsk et al., 2003; Carrillo-Dominguez et al., 2005). Eggs are rich
in high quality protein. It is an important source of essential fatty acids, iron,
phosphorus, trace minerals, vitamin A, E, K and the B vitamins, including B12 and
other vital nutrients (Surai and Sparks, 2001; Kim et al., 2004; Chowdhury et al.,
2002, 2005). The yolk contributes most or all of the fat, iron, vitamin A value,
thiamine and calcium, protein and riboflavin. Most of the protein and riboflavin is
in the albumin (Cook and Briggs, 1973). However, people often limit their egg
consumption on grounds that the high cholesterol content of eggs is often associated
with coronary heart disease (Simopoulos, 2000; Bragagnolo and Rodriguez-Amaya,
2003; Carrillo-Dominguez et al., 2005). The reported values for nutrient
compositions of egg as cited by Watkins (1995) is presented in Appendix 1 (page
125).
2.5.1 Fatty acid composition and cholesterol content of eggs
The fatty acid and cholesterol content of egg yolks from several studies are
summarized in Tables 2.6 and 2.7. A 100 g edible portion of whole egg contains
3.35 g saturated fatty acids (SFA), 4.46 g monosaturated fatty acids and 1.45 g
polyunsaturated fatty acids (PUFA). The predominant SFA is palmitic acid,
32

33
whereas oleic and linoleic acids are the major monounsaturated and PUFA,
respectively.
2.5.3 Effects of dietary manipulation on the nutritional content of eggs
Many factors influence the concentration of nutrients in eggs. These include age,
breed and strain of hens, diets and others. The types and levels of lipid in the diet of
the hens influence the fatty acid composition of yolk lipid significantly (Milinsk et
al., 2003; Carrillo-Dominguez et al., 2005). Studies have shown that palmitic and
stearic acids are not affected by dietary fatty acid alterations. The total amount of
palmitic and stearic acids in yolk lipids is generally between 30 and 38%,
respectively (Privett et al., 1962). The concentration of total SFA ranged from 40%
to 44% (palmitic, stearic and myristic) and 56-60% are unsaturated fatty acids
(oleic, linoleic). Recently increasing number of work is focusing on increasing the
n-3 fatty acids content of eggs (Meluzzi et al., 2000; Bean and Leeson, 2003). Since
the chicken is monogastric, much of the dietary lipid is assimilated directly with
minimal modification. The summary of the type of dietary intervention and their
effects on the fatty acid and cholesterol contents in the egg is as depicted in Tables
2.6 and 2.7.
33

34
Table 2.6: Reported values for saturated, monosaturated and polysaturated fatty acid content of egg yolk as a
result of dietary interventions
F
atty
aci
ds
(%)
Bre
eds
Sup
ple
ments
/ D
iets
SF
A
MU
FA
P
UF
A
Ref
erence
s
Sin
gle
Co
mb
Whit
e L
egho
rn
5%
sea
l b
lub
ber
oil
3
5.9
4
47
.93
1
5.8
8
Sch
rein
er et al.
, 2
00
4
Sin
gle
Co
mb
Whit
e L
egho
rn
5%
mix
ture
of
seal
blu
bb
er o
il a
nd
tal
low
3
6.1
2
48
.84
1
5.0
4
Sch
rein
er et al.
, 2
00
4
Sin
gle
Co
mb
Whit
e L
egho
rn
5%
tal
low
3
6.2
4
50
.05
1
3.7
1
Sch
rein
er et al.
, 2
00
4
Sin
gle
Co
mb
Whit
e L
egho
rn
5%
tal
low
3
4.1
4
50
.14
1
3.1
5
An et al.
, 1
99
7
Sin
gle
Co
mb
Whit
e L
egho
rn
5%
mix
ture
of
Saf
flo
wer
oil
and
pal
m o
il
35
.92
3
5.2
6
28
.66
A
n et al.
, 1
99
7
Sin
gle
Co
mb
Whit
e L
egho
rn
5%
Cru
de
saff
low
er p
ho
spho
lip
ids
36
.24
3
5.1
4
28
.74
A
n et al.
, 1
99
7
Sin
gle
Co
mb
Whit
e L
egho
rn
5%
puri
fied
saff
low
er p
ho
sph
oli
pid
s 3
6.2
2
38
.80
2
4.9
5
An et al.
, 1
99
7
Isa
Bro
wn
30
% C
hia
(Salvia
hispanica
) die
t 2
9.7
1
35
.63
3
4.2
9
Ayer
za a
nd
Co
ates
, 1
99
9
Red
Lo
hm
an
3.2
% C
ano
la o
il
32
.21
4
7.3
3
20
.39
M
ilin
sk et al.
, 2
00
3
Red
Lo
hm
an
3%
Fla
xse
ed o
il
31
.82
4
7.0
4
20
.99
M
ilin
sk et al.
, 2
00
3
Red
Lo
hm
an
3%
So
yb
ean o
il
33
.13
4
4.6
1
22
.15
M
ilin
sk et al.
, 2
00
3
Red
Lo
hm
an
2.9
% S
un
flo
wer
oil
3
2.4
8
41
.88
2
5.4
5
Mil
insk
et al.
, 2
00
3
Whit
e L
oh
man
3
.2%
Can
ola
oil
3
7.7
3
42
.88
2
0.3
9
Mil
insk
et al.
, 2
00
3
Whit
e L
oh
man
3
% F
lax
seed
oil
3
3.6
4
41
.50
2
4.2
6
Mil
insk
et al.
, 2
00
3
Whit
e L
oh
man
3
% S
oyb
ean o
il
33
.04
3
9.8
6
27
.00
M
ilin
sk et al.
, 2
00
3
Whit
e L
oh
man
2
.9%
Sun
flo
wer
oil
3
8.3
2
33
.29
2
8.1
7
Mil
insk
et al.
, 2
00
3
Whit
e L
eg
ho
rn
Camelin
a sativa
see
d o
il
33
.14
4
1.5
0
21
.44
R
ok
ka et al.
, 2
002
SF
A:
satu
rate
d f
atty
aci
ds
MU
FA
: m
onosa
tura
ted f
atty
aci
ds
PU
FA
: poly
unsa
tura
ted f
atty
aci
ds
34

35
Table 2.7: Reported values for cholesterol content of egg yolk
B
reed
s S
up
ple
ments
C
ho
lest
ero
l
(mg/1
00
g)
Ref
erence
s
Hy-L
ine®
W-3
6 W
hit
e L
ogho
rn
0.1
25
% C
ulp
ric
sulf
ate
pen
tah
yd
rate
8
20
P
esti
and
Bak
alli
, 1
99
8
Hy-L
ine®
W
-36
Whit
e L
og
ho
rn
0.2
50
% C
ulp
ric
sulf
ate
pen
tah
yd
rate
7
70
P
esti
and
Bak
alli
, 1
99
8
Isa
Bro
wn
30
% C
hia
(Salvia
hispanica
) die
t 3
5%
A
yer
za a
nd
Co
ates
, 1
99
9
Sin
gle
Co
mb
Whit
e L
egho
rn
5%
tal
low
1
32
0
An et al.
, 1
99
7
Sin
gle
Co
mb
Whit
e L
egho
rn
5%
mix
ture
of
Saf
flo
wer
oil
and
pal
m o
il
12
80
A
n et al.
, 1
99
7
Sin
gle
Co
mb
Whit
e L
egho
rn
5%
Cru
de
saff
low
er p
ho
spho
lip
id
12
70
A
n et al.
, 1
99
7
Sin
gle
Co
mb
Whit
e L
egho
rn
5%
puri
fied
saff
low
er p
ho
sph
oli
pid
1
28
0
An et al.
, 1
99
7
Bar
red
Ply
mo
uth
Ro
ck
- 1
33
0
Mau
rice
et al.
, 1
994
New
Ham
psh
ire
-
15
20
M
auri
ce et al.
, 1
994
Rho
de
Isla
nd
Red
-
13
00
M
auri
ce et al.
, 1
994
Whit
e L
eg
ho
rn
- 1
15
0
Mau
rice
et al.
, 1
994
Isa
Bro
wn
0.0
3%
Lo
vas
tati
n
11
23
K
im et al.
, 2
00
4
Isa
Bro
wn
0.0
6%
Lo
vas
tati
n
11
59
K
im et al.
, 2
00
4
Isa
Bro
wn
0.0
3%
Sim
vast
atin
1
07
9
Kim
et al.
, 2
00
4
Isa
Bro
wn
0.0
6%
Sim
vast
atin
1
06
4
Kim
et al.
, 2
00
4
Isa
Bro
wn
0.0
3%
Pra
vas
tati
n
10
74
K
im et al.
, 2
00
4
Isa
Bro
wn
0.0
6%
Pra
vas
tati
n
10
83
K
im et al.
, 2
00
4
35

36
2.6 The digestion and absorption of fatty acids in monogastrics
The assimilation and absorption of fatty acids involve a series of integrated and
coordinated steps as illustrated in figure 2.3. The initial step in lipid digestion is
emulsification, which is achieved partly vigorous mechanical mixing in the stomach
(Ros, 2000). The next step is micellar solubilisation with the help of bile. In
monogastrics, the post digestion mixed micelle contains mainly monoacylglycerol,
lyphophospholipids and fatty acids (Gurr and Harwood, 2002). Transfer of free
fatty acids to the micellar phase take place gradually during the transit of the digesta
through the small intestine which is facilitating by the polar detergency of bile and
increasing pH of the digestive environment in the small intestine. The enterocytes
along the epithelium of small intestines are responsible for the absorption of luminal
fatty acids and lipids. The digested lipids pass from the mixed micelles into the
enterocytes by passive diffusion (Ros, 2000). Luminal fatty acids are absorbed as
free fatty acids or esterified to 2-monoacylglycerol. After acylation, the majority of
fatty acids are incorporated into triacylglycerol via the monoacylglycerol pathway
or the phosphatidic acid pathway (Levin et al., 1992).
The final step is chylomicron formation. Chylomicrons are the largest lipoproteins.
They are secreted through the basolateral membrane of the enterocytes, enter the
lymphatic capillaries of the intestine microvilli and eventually reach the systemic
circulation (Ros, 2000). As for the short and medium chain fatty acids, it is widely
accepted that C2:0 to C12:0 fatty acids are transported to the liver via the portal
36

37
system and C12:0 to C24:0 via the lymphatic system (Akoh, 1998). The liver is an
important site for the elongation and desaturation of many fatty acids (Li et al.,
1992). It generate energy by metabolizing those fatty acids with chain lengths lesser
than 12 carbons (Gurr and Harwood, 2002).
Figure 2.3: Simplified schematics showing the digestion, assimilation and
transport of fatty acids in monogastrics
Source: compiled from Ros, 2000; Gurr and Harwood 2002.
The monogastrics stomach
Mechanical mixing and gastric lipase
Emulsification and lipolysis
Various acylglycerols and free fatty acids
Dietary lipids
Post gastric lipids (Partially digested dietary lipids)
Small intestines
Hydrolisis by pancreatic lipase
Free fatty acids, monoacylglycerols
Micellar solubilisation
Enterocytes
Uptake, esterification, triacylglycerols
resynthesis
Chylomicron secretion
Medium and short
chain fatty acids
are transported
directly to the
liver
Bile Liver and other
organs
Long chain fatty
acids in lymph and
blood circulations
37

38
2.7 Literature summary
The practice of feeding antibiotics have been very successfully adopted and become
an integral part of developing nutritional strategies for all farm animals. However,
the use of antibiotic growth promoters has come under increasing scrutiny because
of the issue of antibiotic resistance in certain bacteria and residues in animal
products. This can be harmful to consumers and has lead to growing public concern
about the potential risk of antibiotic cross-resistance from animal products to
humans. Currently, alternatives such as probiotic, prebiotic, organic acid, fermented
liquid feed have been proven to improve the health status and growth performance
of the farm animals. The health of the animal is much influenced by the intestinal
micro-flora. The symbiotic relationship between the host and its beneficial intestinal
micro-flora became the critical component in the development of good nutritional
strategies. The in-vivo studies by Loh et al. (2003a,b) have demonstrated a
promising result as mentioned in Section 2.3.5 (page 26). The FP produced in this
study (Chapter III) was a combination of probiotic, prebiotic, organic acids with the
addition of the essential fatty acids such as docosapentaenoic acid (DPA) and
docosahexaenoic acid (DHA). A product which comprises a combination of
different types of alternative may exceed the results of a single alternative and can
lead to significant improvements in animal production. This study aimed to
investigate the effects of FP on layer performance and egg quality, which has not
been previously reported.
38
39
CHAPTER III
GENERAL APPROACH OF THE STUDY AND
EXPERIMENTAL PROCEDURES
3.0 General research approach
This study was conducted in two phases. Phase I was the microbiological and
physico-chemical characterization of the FP. The fermentation process was repeated
three times under the same experimental conditions and using the same amount of
raw materials to validate the stability of the end product. This product was then
used in Phase II to feed Babcock B380 pullets.
The FP was incorporated at 3% (w/w), 6% (w/w) and 9% (w/w) in the diet based on
earlier studies by Loh et al., (2003a,b). In this phase, faecal sampling was collected
at fortnightly intervals right after a two-week of adjustment period. Faecal
characteristics such as faecal LAB and Enterobacteriaceae, pH and VFA were
evaluated. Total feed intake, egg production and egg weight were recorded. Eggs
were randomly selected for cholesterol and fatty acids profile analyses during the
last five weeks of the trial. At the end of the trial, five birds from each treatment
were randomly selected and sacrificed for blood plasmid lipid analyses.
39

40
3.1 The production of fermented product (FP)
The fermentation process was performed according to the method described by Loh
et al. (2003a). The raw materials consisted of 9% (w/w) lime, 1% (v/w) molasses,
53.5% (w/w) rice bran, 35% (w/w) fish (Rastrelliger kanagurta), 1% (v/w) vinegar,
and 0.5% (w/w) starter cultures. The starter culture was a combination of LAB and
was supplied by Jia Yi Nutritional Sdn. Bhd (Klang, Malaysia). Lime was blended
with molasses and the mixture was then fermented at ambient temperature (28±2oC)
for five days under aerobic conditions. The mixture was then poured into a closed
50-liter solid fermenter together with rice bran, raw fish, vinegar and starter culture.
The fermenting mixture was mixed hourly in order to achieve homogenous mixing.
The fermentation process was carried out for seven days at 35-38oC. Fermentation
was considered completed after seven days. The completed FP was allowed to cool
to room temperature prior sampling. The final product was a dry-brownish mash
with a distinctive lime-flavoured aroma. The FP was stored in vacuum-sealed black
plastic bag until use.
40

41
3.2 Proximate analysis
3.2.1 Dry matter (DM)
Dry matter was determined as per AOAC (1990) procedures. Porcelain crucibles
were soaked and cleaned with detergent. They were then rinsed with distilled water
and dried in the oven at 105oC. The dried crucibles were cooled in a dessicator and
weighed to obtain W1, the dry net weight of crucible. One gram of sample was
placed in the pre-weighed empty crucible and the weight of sample and crucible
was recorded (W2). The crucibles were covered with lids and kept in the oven at
105oC until there were no further changes in weight.
After 24 hours of drying, the crucibles were removed from the oven and cooled to
room temperature for five to ten minutes. Subsequent cooling took place in the
dessicator for 10-15 min before weighing W3 (weight of crucible + dry sample) was
taken. Each sample determination was done in triplicates. The moisture and DM
were calculated by using the following formula:
Dry matter, % = W3 – W1 X 100
W2 – W1
Where, W1 = Dry weight of crucible
W2 = Weight of fresh sample + crucible
W3 = Weight of crucible + dry sample
% Moisture = 100 - DM %
41

42
3.2.2 Ash
The dried sample from DM analysis was utilized for ash determination. The
crucible with the sample was covered and ignited in the muffle furnace at 600oC for
four hours until white, light gray residue was obtained. The crucible and their ash
content were weighed immediately after they had cooled down in a dessicator. Each
sample was analysed in triplicates. The ash content was calculated using the
following formula:
Ash, % = Ash weight X 100
Sample dry weight
3.2.3 Crude protein
Crude protein (CP) was determined using the 2000 Digestion system and 2400
Kjeltec Auto Analyzer. The digestion system is a part of the Kjeltec system (FOSS
TECATOR AB, Höganäs, Sweden). One g of sample was placed in a digestion tube
to which one tablet of selenium oxide catalyst (BDH Laboratories, Poole, U.K) was
added to facilitate digestion. Twelve mL of concentrated sulphuric acid (H2SO4)
(Merck®
, KGaA, Darmstadt) was then added. The tubes were placed in a tube rack
and secured on to the digester. Digestion was carried out at 220oC for 30 min,
followed by 380 o
C (40 min) and finally 420 o
C for 40 min. Digestion was
completed when the mixture solution was totally colourless. After digestion, the
42

43
tubes were placed in the 2400 Kjeltec machine. Two digestion tubes containing
12mL of concentrated sulphuric acid (Merck®
, KGaA, Darmstadt) and selenium
oxide catalyst (BDH Laboratories, Poole, U.K) were included with each batch of
sample to serve as machine blanks. Another two digestion tubes containing 12mL
of concentrated sulphuric acid (Merck®
, KGaA, Darmstadt), selenium oxide catalyst
(BDH Laboratories, Poole, U.K) and one mL of one molar ammonium sulphate
(Appendix 2c) acted as standard.
Twenty-five mL of receiver solution (Appendix 2a) was dispensed into the titration
vessel from the tank by the pump. Simultaneously, dilution water was dispensed
into the digestion tube from the water tank automatically by the pump. Five mL of
alkali (40% NaOH) (Appendix 2b) was then dispensed into the sample tube. The
sample was subjected to steam distillation. The liberated NH3 gas was condensed
and trapped in the condenser and delivered to the titration vessel containing the
receiver solution. The liberated NH3 was then titrated with 0.2N hydrochloride acid
(Merck®
, KGaA, Darmstadt) until the end point was reached. The CP content was
expressed as 6.25 x Nitrogen (N) content.
3.2.4 Crude fiber
Sintered glass crucibles were soaked in Decon 90 and then scrubbed thoroughly.
The crucibles were rinse thoroughly with tap water before drying in the oven at
60oC overnight. The Fibertec 2010 Hot Extractor (FOSS TECATOR AB, Höganäs,
43

44
Sweden) was used to determine crude fiber (CF). One g of sample was placed in a
sintered glass crucible and secured with a crucible holder placed in the Hot
Extraction Unit. Two to four drops of anti-foam agent (Dekalin) were added after
solution R1 (1.25% H2SO4) was dispensed automatically into the sintered glass
crucible. Sample mixture was then allowed to boil for 30 min. The samples were
then drained using vacuum pump. Remaining samples were flushed with water until
the washings were no longer acidic. Samples were vacuum drained as dry as
possible between washing. After that, 150mL solution R2 (1.25% NaOH) together
with two to four drops of Dekalin was added to the drained sample. The sample
mixture was allowed to be re-boiled for 30 min. After boiling, the drain valve and
vacuum pump were turned on to discard the solution from the sintered glass
crucible. The residue in the sintered glass crucible was cleaned with water with the
aid of a vacuum pump. Lastly, the residue was washed with acetone and vacuum-
drained as dry as possible between washings.
The residue in sintered glass crucibles were then dried in oven at 105oC overnight,
after which they were removed with tongs and cooled down to room temperature in
a dessicator and weighed (W1). The contents of the sintered glass crucible were then
ignited in a muffle furnace at 550oC for four hours, until light gray residue was
obtained and weighed (W2). The CF content of the sample was calculated as
follows:
44

45
CF, % = W1 – W2 X 100
Sample dry weight
Where, W1 = Sintered glass + residues weight after drying at 105oC
W2 = Sintered glass + ash weight after ashing at 550oC
3.2.5 Ether extracts (Crude fat)
The 2050 Soxtec Auto Analyzer was used to determine the ether extract (EE)
content. Decon 90 (Decon Laboratories Ltd., Sussex, U.K) was used to soak the
aluminium flask before scrubbing. The flasks were then rinsed thoroughly with the
tap water before oven drying at 60oC. One gram of sample was placed in a cellulose
extraction thimble and covered with defatted cotton plug on top of the sample. The
thimbles were transferred to the thimble support holder and inserted into the
extraction unit. The aluminium flask was then transferred with tongs from the
dessicator and weighed (W1). Then, the aluminium flask was filled with petroleum
ether (BDH Laboratories, Poole, U.K) at 3/4 of total volume and connected to the
extractor. The extractor was set at 117oC for 20 min of extraction, 10 min for
dripping the solvent with fat, 20 min for drying and three min for recovery. During
recovery, the valve was closed and the condensed solvent was transferred to the
collection vessel. Finally, the aluminium flask was then dried with the fats in oven
at 105oC for 30 min and cooled down to room temperature in a dessicator and
weighed (W2).
45

46
EE, % = W2 – W1 X 100
Sample dry weight
Where, W1 = Weight of empty aluminum flask
W2 = Weight of aluminium flask with fat
3.2.6 Gross energy (GE) content
The GE content of samples was determined using an adiabatic bomb calorimeter
fitted with digital temperature recorder (1241 Adiabatic Calorimeter, Parr
Instrument Co., Moline, III, USA). The amount of heat, that is released when a
substrate is completely oxidized in a bomb calorimeter, is called GE. The heat of
combustion is usually measured in calories. Enthalpy of combustion of the
hydrocarbons typically followed the following chemical reaction.
CxHyOz + ½[ 2x + ½y – z] O2 → xCO2 + ½y H2O
The energy equivalent of the apparatus set up was obtained by combusting a known
amount of benzoic acid (6.318 kcal/g, Merck KGaA, Darmstadt, Germany) prior to
sample runs. A total of 0.5 – 0.7 g (measured to 4 decimal places) of benzoic acid
(or sample) was made into a pellet using a pelleting machine. The pellet was placed
in a fuel cup and held in a wire cradle suspended from the top of the bomb vessel.
Ten cm of nickel alloy fuse wire (NO.45C10 Parr Instrument Co. Moline, IL, USA)
46

47
was then mounted on top of the pellet completing the electrical circuit within the
oxygen bomb asSEbly. Oxygen was charged into the sealed bomb at 25 atm to
reduce the formation of nitric acid during combustion, which was then placed
within the water jacket inside the calorimeter.
Ignition leads were attached to the bomb and the water jacket temperature was
allowed to stabilize and the initial temperature (T1) was recorded. The bomb was
then ignited electrically. The maximal temperature was obtained after five to six
min and recorded (T2). After that, the oxygen bomb was removed and the high-
pressure gas within the bomb was vented slowly. The residue content was washed
with distilled water and the washing was collected in a conical flask for titration
using Na2CO3 (0.4%) solution (3.84 g/L, Hamburg Chemicals Ltd., UK). Acid
formation energy (one mL = one cal) was calculated based on the titration volume
and the un-combusted fuse was measured for calculation of caloric value of
combusted fuse later (one cm = 2.3 cal). The energy equivalent of the bomb
calorimeter was calculated as followed:
Energy equivalent of bomb (S) = (W x E) + C1 + C2
∆T
After the energy equivalent of the bomb has been obtained, the sample runs could
commence. Procedures were similar as described for the benzoic acid. The GE
content was then calculated based on the following equation as described below
47
48
GE (kcal/g) = (S x ∆T) – C1 – C2
W
Where, S = energy equivalent of bomb (kcal/oC)
E = energy content of benzoic acid (6.318 kcal/g)
C1 = acid formation energy (from titration volume)
C2 = energy generated by combusted fuse
∆T = Final temperature, T2 – initial temperature, T1
W = sample weight
3.3 pH determination
Ten percent (w/v) of the sample was mixed homogenously with deionized distilled
water in a universal bottle. The pH of the samples was measured with a Mettler-
Toledo pH meter with glass electrode (Mettler-Toledo LTD., England). The pH
meter was calibrated using standard buffer solutions (Merck®
, KGaA, Darmstadt) at
pH 4 and pH 7.
3.4 Bacteriological analyses
Ten percent (w/v) of sample was suspended in sterile peptone water (Appendix 3a)
and incubated for an hour prior to further ten-fold series dilutions (v/v). In order to
obtain a homogeneous sample, the mixtures were vortexed prior to sampling.
48

49
Enumerations of LAB were performed on MRS-agar (Lactobacillus-Agar DE Man,
ROGOSA and SHAPE) (Merck®
, KGaA, Darmstadt) (Appendix 3b). The plates
were incubated in anaerobic jar at 30oC for 48 h. Enterobacteriaceae were counted
on EMB-agar (Eosin-methylene-blue Lactose Sucrose Agar) (Merck®
, KGaA,
Darmstadt) (Appendix 3c) and incubated aerobically for 24 h at 37oC. Numbers of
colony forming units (cfu) were expressed as log10 cfu per gram. All samples were
performed in triplicates.
3.5 Fatty acid profile determination
3.5.1 Total lipid extraction
Lipids were extracted from the samples using the method of Rajion (1985) as
modified by Goh (2002). A weighed amount of sample was homogenized (Ultra
Turrax T5 FU homogenizer, IKA Germany) in 40mL of chloroform-methanol (2:1,
v/v) in a 50mL stoppered ground-glass extraction flask. The tube was then flushed
with N gas before stoppering and shaken vigorously. The mixture was then filtered
through a No. 1 Whatman paper (Whatman Int. Ltd., Maidstone, England) into a
250mL separating flask after standing for 12 hours. Five mL of chloroform-
methanol 2:1 (v/v) was used to wash the residue left over on the filter paper. Ten
mL of normal saline solution (0.9% w/v NaCl) was added to facilitate phase
separation. The mixture was then shaken vigorously for one minute and left to stand
for four hours. The lower phase solution within the separation flask was collected in
49

50
a round bottom flask after completely the phase separation. The liquid phase was
then evaporated using rotary evaporation (Heidolph GmBH, Germany) at 70-75oC.
Upon drying, the total lipid extract was weighed and then transferred to a capped
methylation tube by re-diluting it with fresh chloroform-methanol 2:1 (v/v), making
up to five mL.
3.5.2 Preparation of fatty acid methyl esters (FAME)
A known amount of heneicosanoic acid (21:0) (Sigma Chemical Co., St. Louis,
Missouri, USA) was added to each sample as an internal standard to quantify
individual fatty acid concentration within the sample. The lipid extract was then air-
dried on a heating block (40oC) under a steady stream of purified N.
Saponification was done using two mL of 0.66N methanolic potassium hydroxide
(KOH) (R & M Chemicals, Essex, U.K.). The saponifying agent was added into the
methylation tube after the sample had dried. The methylation tube was flushed with
purified N, stoppered and heated in a boiling water bath for 15 min with occasional
shaking. The mixture was allowed to cool to room temperature at the end of the 15
min. Two mL of 14% methanolic boron trifluoride (Sigma Chemical Co., St. Louis,
Missouri, USA) was added into the methylation tube to facilitate for
transmethylation. The mixture was reheated in the boiling water bath for another 30
min with occasional shaking. The sample mixture was allowed to cool to room
temperature after the transmethylation process was completed.
50

51
Four mL of distilled water and four mL of petroleum ether (BDH Laboratories,
Poole, U.K) were then added. The mixture was vortexed for one min before being
centrifuged at 1500 G for ten min to hasten phase separation. The upper petroleum
phase was transferred to a fresh test tube and washed with one mL of distilled
water. The upper phase from this test tube was transferred to a second test tube,
which contains 0.5 g of anhydrous sodium sulphate (R & M Chemicals, Essex,
U.K.) to dry the sample. Finally, the petroleum ether containing FAME was
transferred to a five mL screw-capped vial (Kimble Glass Inc., USA), and flushed
with purified N before being stored at four oC until analysis by gas-liquid
chromatography (GLC).
3.5.3 Gas liquid chromatography
FAME separation was performed using a Supelco SP-2330 (Supelco, Inc.,
Bellefonte, PA), fused silica capillary Column (30m, 0.25mm ID, 0.20µm film
thickness) in a 5890 Hewlett-Packard Gas-Liquid Chromatograph (Hewlett-
Packard, Avondale, PA). High purity N was the carrier gas at 40 mL/min. High
purity hydrogen and compressed air were used for the flame ionization detector.
The column temperature was set at the range of 100-190oC with 7.2
oC/min
increment rate to facilitate optimal separation. The injector and detector were
programmed at 220oC and 220
oC, respectively. A HP-3993A Integrator (Hewlett-
Packard, Avondale, PA) was used to integrate peak areas. Peak areas were
expressed as % total fatty acid or absolute fatty acid concentration using a
51

52
programmed PC running Microsoft Excel. The identification of the peaks was
made by comparison of the equivalent chain lengths (ECL) with those of authentic
fatty acid methyl esters (Sigma Chemical Co., St. Louis, Missouri, USA).
3.6 Total cholesterol determination
Half a gram of sample was weighed and transferred into a methylation tube. Ten
mL of 2.14M Ethanolic KOH solution (Merck®
, KGaA, Darmstadt) was added. The
mixture was homogenized thoroughly before the tube was cap-sealed. The mixture
was then held for one hour in water bath at 70oC with occasionally shaking. Mixture
was then allowed to cool to room temperature.
Upon cooling, the mixture was transferred into a fresh glass centrifuge tube. Ten
mL of petroleum ether, five mL of saturated NaCl solution and five mL of distilled
water were added into the glass centrifuge tube. Mixture was vortex-mixed for one
minute and then centrifuged at 1500 G for 15 min. The upper layer was transferred
into a second test tube and re-extracted twice with 10 mL of petroleum ether (BDH
Laboratories, Poole, U.K). The mixture was re-centrifuged and the upper petroleum
phase was transferred into capped methylation tube and dried under N gas until only
one mL of the original volume was left.
The cholesterol methyl ester was transferred into a four mL screw-capped vial
(Kimble Glass Inc., USA) and drying continued under a stream of purified N gas.
52

53
After drying, the screw-capped vial containing the dried cholesterol extract was
flushed with N gas; cap sealed and kept frozen at -20oC until GLC analysis. Prior to
GLC analysis, one mL of chloroform-methanol 2:1 (v/v) was added into the vial
containing the cholesterol extract to reconstitute the cholesterol methyl ester.
Cholesterol methyl ester was separated using a Agilent (Agilent Technologies, Inc.
USA), fused silica capillary column (30m, 0.32mm ID, 0.25µm film thickness) in a
Hewlett-Packard Model 6890N GLC. High purity N was the carrier gas at 33.5-
mL/min. High purity hydrogen and compressed air were used for the flame
ionization detector in the GLC. The oven temperature was set at 310oC. The injector
and detector were programmed at 325oC and 325
oC, respectively. Peak area was
determined using a HP-3993A Integrator (Hewlett-Packard, Avondale, PA). A
programmed PC running Microsoft Excel 2000 (Microsoft Corp., Redmond, USA)
was used to express the peak areas as absolute amount of detected cholesterol.
Quantification of the cholesterol concentration was done based on a standard
cholesterol curve at 2, 4, 6, 8, 10 mg/mL.
3.7 Volatile fatty acid (VFA) determination
The total VFA contents of the faeces were determined using GLC method as
described by Minato and Kudo (1985). One gram of sample was added into a test
tube containing one mL of 24% metaphosphoric acid (BDH Laboratories, Poole,
53

54
U.K). The acidic mixture was left at room temperature overnight and then
centrifuged at 10, 000 G for 20 min at four oC. The supernatant was then collected
in a two mL screw-capped vial (Kimble Glass Inc., USA). The internal standard
20mM 4-methyl-butyric acid (Sigma Chemical Co., St. Louis, Missouri, USA) was
added to the supernatant and stored at -20oC until analysis by GLC. VFA separation
was done on a Quadrex 007 Series (Quadrex Corporation, New Haven, CT 06525
USA) bonded phase fused silica capillary column (15m, 0.32mm ID, 0.25µm film
thickness) in a 6890N Hewlett-Packard GLC (Hewlett-Packard, Avondale, PA)
equipped with a flame ionization detector. The purified N gas as the carrier gas with
a flow rate of 60mL/min. The injector and detector temperature were programmed
at 230oC and 230
oC, respectively. The column temperature was set at the 200
oC in
an isothermal run. Commercial standards of acetic, propionic, butyric, isobutyric,
valeric, isovaleric and 4-methyl-n-valeric acids from Sigma (Sigma chemical Co.,
St. Louis, Missouri, USA) were used as authentic standards to identify the peaks.
Determination of the peak areas was performed as described earlier in Section 3.5.3
in this chapter.
3.8 Plasma Total cholesterol
Plasma total cholesterol was quantified using a cholesterol diagnostic kit (Randox®
,
UK), based on the cholesterol enzymatic endpoint method as described by Loh et
al. (2002). Ten µL of plasma was diluted with 40µL of distilled water in a clean
micro-centrifuged tube. A total of 7.5µL of solution was mixed with 750µL of
54

55
cholesterol determination reagent in a clean micro-centrifuged tube. The micro-
centrifuge tubes were then incubated for ten min at 20°C to 25°C. Within the
following 60 min, the absorbance value was read at 500nm using spectrophotometer
(GENESYSTM
, Spectronic®
20, USA). The net absorbance value of tested samples
at 500nm must fall within the range of the cholesterol standard curve. The
cholesterol standard curve was obtained by preparing 0, 4, 8, 16 and 20 µg of
cholesterol standard (200mg/dL) (Randox®
, UK) in 750µL of cholesterol
determination reagent. The solution was mixed thoroughly and the absorbance read
at 500nm within 60 min using a spectrophotometer (GENESYSTM
, Spectronic®
20,
USA).
55

56
CHAPTER IV
THE MICROBIAL PROPERTIES AND CHEMICAL COMPOSITIONS OF
THE FERMENTED PRODUCT
4.1 Introduction
Fermentation is one of the oldest technologies used for food and feed preservation
(Motarjemi, 2002; Prajapati and Nair, 2003; Jay, 2000). Over the centuries, the
fermentation process has been evolved and refined extensively to produce a
diversified range of products. Today, a variety of fermented products are produced
using this technology both in industrialized and at the household level in developing
countries, in small-scale food industries as well as in large enterprises (Nout, 2001).
It is possible to obtain a large variety of fermented products by selecting different
types and compositions raw materials, starter cultures and fermentation conditions
(Hansen, 2002). Fermentation depends on the biological activity of microorganisms,
which can suppress the growth and survival of undesirable microflora in foodstuffs.
Therefore, the actions of microorganisms during the preparation of cultured foods
play an important role in improving the safety of feeds by removing their natural
toxic components, or by preventing the growth of disease-causing microbes (e.g.
Enterobacteriaceae). Fermentation with LAB cultures has been shown to be able to
improve the quality, availability and digestibility of dietary nutrients (Nout, 2001;
56

57
Holzapfel, 2002; Ross et al., 2002). LAB improve protein digestibility and
micronutrient bioavailability of fermented feed through the biosynthesis of vitamins
and essential amino acids (Holzapfel, 2002). Thus, they play an essential role in
food and feed fermentation and are well known for their acidification of the product
(Hammes et al., 1990b; Ross et al., 2002).
Generally fermented products contain high numbers of lactic acid bacteria and
yeast, a low pH and high concentration of lactic acid (Geary et al., 1996; Mikkelsen
and Jensen, 1997; Brooks et al., 2001). The physical, chemical and biological
characteristics have been modified by the activity of microorganisms.
Microorganisms, by virtue of their metabolic activities, contribute to the
development of characteristic properties such as taste, aroma, texture, visual
appearance, shelf life and safety of the product (Holzapfel, 2002; Jay, 2000). It is
important to define and standardize the composition of raw materials and conditions
of fermentation process in order to maintain the quality of the end product.
During the early ages of civilization, fermented products are mainly used for human
consumption. The beneficial LAB present in the products are well documented for
its antimicrobial compounds such as bacteriocin, as a biopreservative for food
product (Ross, et al., 2002; Leroy and Vuyst, 2004; Schnürer and Magnusson,
2005). Product derived from LAB fermentation has the potential in the prevention
of various human diseases (Minamiyama, 2003; Kheadr et al., 2004). Recently,
fermented liquid feed has been used as a natural and environmental friendly feed
57

58
additive as well as growth enhancer in animal diets. Fermented liquid feed has also
shown promising results in enhancing the performance of animals (Mikkelsen and
Jensen, 1998; Brooks et al., 2001; Demeckova et al., 2002; Heres et al., 2003a,b,
2004). However, fermented liquid feeds are tedious to prepare and apply. The solid
form FP investigated in this study was designed to overcome these limitations. Most
of the studies on fermentation have been done on animal by-product (Kamra and
Srivastava, 1994), agricultural by-product (Joshi and Sandhu, 1996) or
slaughterhouse and household wastes (Fransen et al., 1998; Kherrati, et al., 1998; El
Jalil et al., 2001). Up to date, none of the fermentation studies done on agricultural
products involved the addition of marine fish in order to enhance the nutritive value
of the final product. In the present study, fish was used to increase the levels of
PUFA as PUFA had been used successfully to manipulate and increase the n-3
levels in animal products for livestock production (Gonzalez-Esquerra and Leeson,
2000; Milinsk et al., 2003; Visentainer et al., 2005).
Thus, the objective of this study was to evaluate the physico-chemical composition
and nutritive value of the product after the process of fermentation.
58

59
4.2 Materials and methods
4.2.1 Preparation of FP
Preparation of FP was described earlier in Chapter III. The fermentation process
was repeated three times under the same experimental conditions using the same
raw materials to validate the stability of the end product.
4.2.2 Chemical and microbiological analyses
Proximate analyses, GE determination, pH, fatty acids determination, total
lactobacilli and Enterobacteriaceae counts were performed as described previously
in Chapter III. All analyses were performed in triplicates.
4.2.3 Statistical analyses
The numbers of colony forming units (cfu) of LAB and Enterobacteriaceae in the
FP were expressed as log10 cfu per gram. The CP, CF, EE, DM and ash in FP were
expressed as percentages. Fatty acids concentration was expressed both in absolute
amount (mg/100g) and percentage of total fatty acids. All data were analyzed by
ANOVA and Duncan’s Multiple Range test using SAS (SAS®
, 1991). All values
were expressed as mean ± standard error (SE) and tested at P<0.05.
59

60
4.3 Results
4.3.1 Microflora of the FP
The total lactobacilli counts (Table 4.1) increased significantly (P<0.05) from an
average of 104
cfu/g in the fermentation mix at Day 0 to 106 cfu/g in the product at
Day 12. The total lactobacilli counts were similar in the final products although
each batch started with significantly (P<0.05) different lactobacilli counts at Day 0.
The Enterobacteriaceae counts decreased significantly (P<0.05) from Day 0 at 103
cfu/g to only 101 cfu/g in the product by Day 12. The Enterobacteriaceae counts
(Table 4.1) were not significantly (P>0.05) different across batches in the initial
stage and in the product.
Table 4.1: Total lactobacilli and Enterobacteriaceae counts in raw materials
and finished FP
Microorganisms Log10(cfu/g) Fermentation time Batch 1
(n=3)
Batch 2
(n=3)
Batch 3
(n=3)
Total Lactobacilli
Day 0
Day 12
4.28a,x
±0.01
6.26a,y
±0.03
4.40b,x
±0.01
6.25a,y
±0.11
4.37b,x
±0.02
6.41a,y
±0.02
Enterobacteriaceae
Day 0
Day 12
3.87a,x
±0.01
0.83a,y
±0.16
3.87a,x
±0.02
0.87a,y
±0.20
3.83a,x
±0.03
1.26a,y
±0.41
The results are presented as mean values ± SE. a,b
Values with different superscripts within a row differ significantly at P<0.05 due
to batch effects; x,y
Values with different superscripts within a column differ significantly at P<0.05
due to day effects;
60

61
4.3.2 Physico-chemical characteristics of the FP
4.3.2.1 Proximate analyses
The DM, CF, ash, CP, EE and GE contents of the three batches of FP were similar
(P>0.05) across the batches except pH (P<0.05) (Table 4.2). The pH ranged from
4.21 to 4.75.
Table 4.2: Physico-chemical characteristics of the FP
Parameters Batch 1
(n=3)
Batch 2
(n=3)
Batch 3
(n=3)
Sig.
pH
GE, Kcal/kg
(%, DM basis)
DM
Crude fiber
Crude proteins
Crude fat
Ash
4.75a ± 0.02
4490.97 ± 32.20
90.69 ± 0.83
0.07 ± 0.01
19.97 ± 0.10
0.11 ± 0.01
1.02 ± 0.01
4.21b ± 0.01
4509.98 ± 8.70
92.65 ± 0.07
0.06 ± 0.01
19.00 ± 0.33
0.13 ± 0.01
0.99 ± 0.01
4.55c ± 0.01
4415.69 ±
156.00
92.18 ± 0.23
0.07 ± 0.01
19.21 ± 0.22
0.13 ± 0.01
1.00 ± 0.02
*
ns
ns
ns
ns
ns
ns
The results are presented as mean values ± SE.
* P<0.05; ns
No significant difference
61

62
4.3.2.2 Fatty acid concentration
Fatty acid concentration (Table 4.3) were not significantly different (P>0.05)
between batches. In general, about one third of the FP’s fatty acid content was made
up of SFA. The SFA comprised of lauric, myristic, pentadecanoic, palmitic,
heptadecanoic, stearic, arachidic, behenic and lignoceric acids. The remaining fatty
acids content of FP was made up of total UFA, which comprised of both PUFA and
MUFA. Generally, the n-6 fatty acids seemed to be the dominant PUFA species,
constituting almost a quarter of the total fatty acids thus giving a n-6: n-3 ratio of
about 3.5.
62

63
Table 4.3: Fatty acid concentration in FP of different batches
Batch 1 Batch 2 Batch 3
Fatty Acids Mean ± SE
(mg/100g) %
Mean ± SE
(mg/100g) %
Mean ± SE
(mg/100g) %
C12:0 6.2±1.1 0.1 5.9±0.8 0.1 6.1±1.4 0.1
C14:0 200.6±13.1 2.9 193.7±2.36 2.9 212.3±22.6 2.9
C15:0 28.5±9.0 0.4 26.9±4.3 0.4 30.7±11.6 0.4
C16:0 1444.8±121.0 20.8 1393.5±170.0 20.9 1525.0±31.0 20.8
C16:1 n-9 270.6±21.6 3.9 259.5±34.8 3.9 287.8±34.7 3.9
C17:0 30.2±7.2 0.4 28.7±5.8 0.4 32.3±9.8 0.4
C17:1 40.7±7.1 0.6 38.4±5.6 0.6 43.1±10.1 0.6
C18:0 294.3±20.2 4.2 282.1±37.5 4.2 311.7±29.0 4.2
C18:1 n-9 2216.8±387.0 31.9 2138.9±237.0 32.0 2342.7±231.0 31.9
C18:2 n-6 1671.4±349.0 24.1 1613.2±167.0 24.1 1764.2±246.0 24.0
C18:3 n-3 73.3±12.5 1.1 71.3±5.6 1.1 76.7±10.1 1.0
C20:0 49.7±7.3 0.7 48.8±6.1 0.7 52.2±3.9 0.7
C20:1 n-9 35.2±4.1 0.5 34.6±4.2 0.5 37.0±1.2 0.5
C20:4 n-6 86.3±19.9 1.2 81.3±15.8 1.2 91.9±28.2 1.3
C22:0 24.1±2.7 0.3 22.6±3.4 0.3 25.4±0.9 0.3
C24:0 36.5±4.2 0.5 35.4±4.9 0.5 41.2±1.6 0.6
C20:5 n-3, EPA 246.9±19.8 3.6 230.6±22.4 3.5 261.8±31.4 3.6
C22:5 n-3, DPA 46.4±6.8 0.7 44.4±8.2 0.7 50.1±10.8 0.7
C22:6 n-3, DHA 141.9±18.1 2.0 132.3±13.7 2.0 152.1±25.2 2.1
Total SFA 2114.8±149.0 30.5 2037.5±256.0 30.5 2237.0± 102.0 30.5
Total UFA 4829.4±690.0 69.5 4644.5±509.0 69.5 5107.4± 350.0 69.5
Total MUFA 2563.3±382.0 36.9 2471.5±282.0 37.0 2710.6± 189.0 36.9
Total PUFA n-3 508.4±31.4 7.3 478.6±48.5 7.2 540.7± 57.4 7.4
Total PUFA n-6 1757.7±334.0 25.3 1694.5±182.0 25.4 1856.1± 218.0 25.3
Overall total
6944.2±802.0 6682.0±765.0 7344.4± 255.0
n-6 : n-3 ratio 3.5 3.5 3.4
UFA: SFA ratio 2.3 2.3 2.3
PUFA: SFA ratio 1.1 1.1 1.1
The results are presented as mean values ± SE.
All values within a row were not significantly different from each other (P>0.05).
63

64
4.4 Discussion
4.4.1 Microflora of the FP
The fermentation process performed in this study demonstrated a significant
reduction of harmful bacteria such as Enterobacteriaceae, which includes
Salmonella spp. and Escherichia coli in the end product compared to the raw
materials. In parallel, the population of LAB increased significantly in the finished
product compared to the raw materials. The results obtained in this study are in
agreement with those of Mikkelsen and Jensen, (2000), van Winsen et al. (2002),
Demecková et al. (2002), Loh et al. (2003a,b) and Heres et al. (2004). The use of
potentially beneficial bacteria such as LAB have been demonstrated to inhibit the
in-vitro growth of many enteric pathogens including Salmonella typhimurium,
Staphylococcus aureus, Escherichia coli, Clostridium perfringens and Clostridium
difficile (Lindgren and Dobrogosz, 1990; de Vuyst and Vandamme, 1994; Forestier
et al., 2001). Furthermore, the in-vivo studies of feeding fermented feed improved
the microbial balance in the GIT of animals (Urlings et al., 1993; Mikkelsen and
Jensen, 2000; Van Winsen et al., 2002; Demecková et al., 2002; Loh et al.,
2003a,b; Heres et al., 2004). It was reported that the beneficial LAB present in the
product produced a range of antimicrobial metabolites such as bacteriocins, ethanol,
H2O2, and organic acids during fermentation (Ross et al., 2002; Chapter II). Organic
acids helped to reduce the pH value to a range of 4-5, which was detrimental for
deleterious microbe (Østergaard et al., 1998; Christine et al., 1999; Brooks, 2003;
64

65
Beal et al., 2002). This in turn, provided a suitable environment to promote the
growth and sustenance of the lactic acid-producing microflora (Owen and Mendoza,
1985; Urlings et al., 1993; Langhendries et al., 1995; van Winsen et al., 2002; Loh
et al., 2003a,b).
The undissociated, more hydrophobic form of the organic acids diffuses over the
cell membrane. It dissociates inside the cell thus releasing H+
ions that acidify the
cytoplasm and reducing the intracellular pH. This in turn inhibits the active
transport and a variety of metabolic functions (Doores, 1993; Ross et al., 2002). In
addition to the pH effect, the undissociated acid collapses the electro-chemical
proton gradient, causing bacteriostasis and finally death of susceptible bacteria
(Axelsson et al., 1989 as cited by Schnürer and Magnusson, 2005) such as
Enterobacteriaceae in the FP. The reduction of Enterobacteriaceae in the FP was
important to the product safety as hazardous microorganisms were inhibited. This
indicated a safe product and a successful fermentation process. This product may be
used safely in the animal feed industry for optimal growth performance and as a
prophylaxis against infectious agents such as Salmonellosis.
4.4.2 Physico-chemical characteristics of the FP
The DM, CF, CP and ash content of the three batches of FP were similar. These
results indicated that the FP could be produced at consistent quality under a
reproducible fermentation process. A high content of beneficial long-chain fatty
65

66
acids (PUFA) was another important characteristic of this product. These included
notably linolenic, linoleic, arachidonic, EPA, DPA and DHA which are now
regarded as nutritionally important fatty acids (Hansen, 1986; Lauritzen et al., 2001;
Elmore et al., 2005).
The presence of n-3 long chain PUFA in the product was a direct result of
incorporation of marine fish (Rastrelliger kanagurta) as one of the raw materials.
Marine fish are rich in n-3 fatty acids because their diet is made up of zooplankton
and phytoplankton, a rich source of PUFA (Kyle, 2002). The long chain n-3 fatty
acids are prized for the beneficial effects to human health and feedstuffs with added
n-3 is definitely more advantageous over conventional feeds. This could offer an
added advantage, which helps to improve the content of these fatty acids in animal
and animal products when the FP is being fed to livestock. However, the long–chain
PUFA particularly the members of n-3 fatty acids are susceptible to lipid oxidation.
Surprisingly, these PUFA especially EPA, DPA and DHA were detected in
substantial amounts in the FP. The EPA was found to be the highest among all the
n-3 long chain fatty acids in the FP. Besides the high content of n-6 PUFA detected
in the FP was probably a direct result of the incorporation of more than 50% rice
bran in the fermentation mix. Linoleic acid (the predominant n-6 fatty acid in the
product) is the major fatty acid present in the lipid fraction of the rice bran (Ito and
Simpson, 1996; Rouanet et al., 1993). Furthermore, rice bran contained high levels
of several phytochemicals that have been claimed to be a good source of natural
antioxidants (Krings et al., 2000; Kanaya et al, 2004; Chen and Bergman, 2005;
66

67
Iqbal et al, 2005). Among these natural antioxidants are vitamin E, tocopherols,
tocotrienols and the γ-oryzanol fraction, which are thought to exert anti-oxidative
and protective effects on fatty acids in animal tissues (Qureshi and Peterson, 2001;
Kanaya, et al, 2004). In addition, rice bran has been shown to improve the storage
stability of foods (Iqbal, et al., 2005; Chen and Bergman, 2005). Thus, it may be
acted as a natural antioxidant during fermentation thereby improved the storage
stability of FP and helped to prevent the oxidation of long-chain PUFA in FP.
4.5 Conclusions
The microbiological, physical, chemical properties of FP obtained in this study
showed that the FP was of highly consistent quality and reproducible. It was rich in
LAB and had a low pH (4.5). Furthermore, the presence of essential PUFA such as
linoleic, linolenic, arachidonic, EPA, DPA and DHA in the FP was another
important characteristic of this product. The FP was a dry-brownish mash with
distinctive lime-flavoured aroma. This might have an added advantage to overcome
the problem of unpleasant odour in feed such as fishmeal, as off-flavoured products
could be a significant market disadvantage. Based on the results obtained in the
present study, FP has a great potential as an animal feed with additional source of
essential fatty acids compared to commercial feed. Results obtained from this study
are essential for the large-scale FP production for animal feed applications in the
future.
67

68
CHAPTER V
EFFECTS OF FEEDING THE FERMENTED PRODUCT ON FAECAL
MICROFLORA, ESSENTIAL FATTY ACID AND CHOLESTEROL
LEVELS IN EGGS AND PLASMA OF LAYING HENS
5.1 Introduction
The common method used to improve the productivity of animals is through the
application of feed additives. Addition of growth promoting antibiotics is the most
common approach. However, the extensive use of antibiotics as growth enhancer
worldwide may lead to the development of antimicrobial resistance (tolerance)
against pathogenic bacteria species (Mikkelsen and Jensen, 2000). This may hamper
the effectiveness of treatment in infected humans in the event of any occurrence in
human infections due to animal pathogens. Recently, fermented feed was suggested
as alternatives to the antibiotic growth promotants (Mikkelsen and Jensen, 2000;
Van Winsen et al., 2002; Demecková et al., 2002; Loh et al., 2003a,b). Therefore,
it has become an important and rapidly expanding segment of the animal feed
market in developed countries. This is one of the avenues to reduce or even
eliminate the need for antibiotics in feeds (Miles, 1997). Feeding fermented liquid
and fermented fruits to animals resulted in the reduction of coliform numbers in the
digestive tract (Mikkelsen and Jensen, 1998; Brooks et al., 2001; Demeckova et al.,
2002; van Winsen et al., 2001, 2002; Canibe and Jensen, 2003; Højberg et al.,
68

69
2003; Heres et al., 2003a,b, 2004; Loh et al., 2003a,b). In addition, it has been
reported to result in the increase in feed intake post-weaning and thus increase post-
weaning growth rate in piglets (Mikkelsen and Jensen, 1998). It also has been
reported that feeding fermented solid product (Loh et al., 2003a,b) has a similar
effect as feeding fermented liquid feed (Mikkelsen and Jensen, 1998; Brooks et al.,
2001; Demeckova et al., 2002; van Winsen et al., 2001, 2002; Canibe and Jensen,
2003; Højberg et al., 2003; Heres et al., 2003a,b, 2004). However, there is no
information on the effects of feeding fermented solid products to layers on their egg
quality. Furthermore, the fermented solid product in this experiment was designed
to contain essential PUFA, as these fatty acids are important for their nutritive
value. Additionally, the fatty acid composition in the animal product can be
manipulated through dietary manipulation (Caston et al., 1994; Gonzalez-Esquerra
and Leeson, 2000; Elmore et al., 2005; Carrillo-Domínguez et al., 2005;
Visentainer et al., 2005). Thus, the objective of this study was:
i To study the effects of different level of FP inclusions in the diet of layers
on the population of Enterobacteriaceae and LAB, pH and VFA
composition in faeces
ii To evaluate the effects of FP supplementation on the essential fatty acid and
cholesterol content in eggs and plasma
iii To investigate the effects of FP on the laying performance in layers
69

70
5.2 Materials and methods
5.2.1 Experimental birds
A total of 96 13-week old Babcock B380 pullets with an average body weight of
1.19 kg ± 0.01 (BW ± SE) were used in this study. All the birds were housed in
individual wire cages. Each cage was 36 x 30 x 35cm3
(width x depth x height).
They were randomly allotted to four numerically equal groups, with eight replicates
per treatment, three birds per replicate. The feeding period lasted for 16 weeks,
commencing when the pullets were 13-weeks of age and ended when they were 29-
weeks of age. Individual body weight was measured at the beginning and at the end
of the experiment (refer Appendix 6). Water and feed were supplied ad libitum. The
birds were raised under natural light circumstances. This feed was given early in the
morning (8am) and topped up in the afternoon (5pm). Feed intake for each
treatment groups was measured weekly. The experimental feeds were provided in
mash form.
5.2.2 Diets
The FP used in the present study was fermented with LAB cultures (Chapter III).
Isocaloric and isonitrogenous diets were formulated using the FeedLIVE software
(Live informatics Co. Ltd, Thailand). Four experimental diets were used. Diet 1
(Control) without the fermented product acted as the negative control, Diet 2 (FP3)
70

71
contained 3% (w/w) FP (30g FP/kg diet), Diet 3 (FP6) contained 6% (w/w) FP (60g
FP/kg diet) and Diet 4 (FP9) contained 9% (w/w) FP (90g FP/kg diet). The
composition of the diets and their nutrient composition are presented in Tables 5.1
and 5.2.
Table 5.1: Composition of pullet diets (from 13-18 weeks of age)
Ingredient, % Control FP3 FP6 FP9
Corn
Palm oil
Soybean meal 44%
L-lysine
DL-methionine
MDCP
Limestone
Salt
Vitamin premix *
Mineral premix **
Choline chloride
FP
Total (%)
Calculated values
ME (Cal/kg)
Crude protein, %
Analyzed values, %
Crude protein
Fatty acids, %
SFA
MUFA
PUFA
Total n-3 PUFA
Total n-6 PUFA
DHA
60.15
2.50
31.30
0.20
0.20
3.00
1.10
0.40
0.08
0.07
1.00
-
100.00
2923.27
18.89
18.70
35.09
33.75
31.16
1.63
29.53
0.00
58.65
2.20
30.10
0.20
0.20
3.00
1.10
0.40
0.08
0.07
1.00
3.00
100.00
2923.98
18.81
18.75
32.48
34.85
32.67
3.93
28.74
0.86
56.81
1.94
29.20
0.20
0.20
3.00
1.10
0.40
0.08
0.07
1.00
6.00
100.00
2923.21
18.84
18.80
31.28
35.40
33.32
5.06
28.25
1.28
54.97
1.70
28.28
0.20
0.20
3.00
1.10
0.40
0.08
0.07
1.00
9.00
100.00
2923.56
18.86
18.80
30.59
35.75
33.66
5.73
27.94
1.53
*The vitamin-premix provides the following amounts per kg of diet: Vitamin A 50.0 MIU, Vitamin
D3 8.0 MIU, Vitamin E 200g, Vitamin B2 20.0g, Vitamin B6 20.0 g, Vitamin B12 1.0g, Vitamin K3
10.0g, Biotin 0.8g, Panthothenic acid 80.0g, Folic acid 10.0g, Niacin 130.0g, Anticaking agent 20.0g
and Antioxidant 0.2g. **
The mineral premix provides the following amounts per kg of diet: Mn 20.0g, Fe 80.0g, Zn 80.0g,
Cu 10.0g, Co 0.2g, I 0.3g and Se 0.3g.
FP: Fermented product
71

72
Table 5.2: Composition of layer diets (from 19 weeks to 29 weeks of age)
Ingredient (%) Cont FP3 FP6 FP9
Corn
Palm oil
Soybean meal 44%
L-lysine
DL-methionine
MDCP
Limestone
Salt
Vitamin premix *
Mineral premix **
Choline chloride
FP
Total (%)
Calculated values
ME (Cal/kg)
Crude protein, %
Analyzed values, %
Crude protein
Fatty acids, %
SFA
MUFA
PUFA
Total n-3 PUFA
Total n-6 PUFA
DHA
60.60
1.55
25.50
0.06
0.16
2.50
8.00
0.50
0.07
0.06
1.00
-
100.00
2726.09
16.22
16.20
31.46
32.84
35.70
1.87
33.83
0.00
58.55
1.35
24.75
0.06
0.16
2.50
8.00
0.50
0.07
0.06
1.00
3.00
100.00
2726.37
16.29
16.30
30.21
34.51
35.28
4.36
30.91
0.97
57.00
1.05
23.60
0.06
0.16
2.50
8.00
0.50
0.07
0.06
1.00
6.00
100.00
2726.54
16.23
16.20
29.42
35.20
35.38
5.50
29.88
1.41
54.30
0.97
23.38
0.06
0.16
2.50
8.00
0.50
0.07
0.06
1.00
9.00
100.00
2726.43
16.49
16.41
29.40
35.65
34.95
6.05
28.89
1.63
*The vitamin-premix provides the following amounts per kg of diet: Vitamin A 50.0 MIU, Vitamin
D3 8.0 MIU, Vitamin E 200g, Vitamin B2 20.0g, Vitamin B6 20.0 g, Vitamin B12 1.0g, Vitamin K3
10.0g, Biotin 0.8g, Panthothenic acid 80.0g, Folic acid 10.0g, Niacin 130.0g, Anticaking agent 20.0g
and Antioxidant 0.2g. **
The mineral premix provides the following amounts per kg of diet: Mn 20.0g, Fe 80.0g, Zn 80.0g,
Cu 10.0g, Co 0.2g, I 0.3g and Se 0.3g.
FP: Fermented product
72

73
5.2.3 Sample collection and chemical analyses
A total of three grams of faecal samples were collected from each replicate of each
experimental group at 15, 17, 19, 21, 23, 25, 27 and 29 weeks of age during the
experimental period. Fresh faecal samples were collected immediately after
defecation and placed in different sterile universal bottle to determine the faecal pH,
faecal VFA, numbers of LAB and Enterobacteriaceae. These parameters were
analyzed according to the methods outlined previously in Chapter III.
During the production period (from 21 weeks to 29 weeks of age), the eggs were
collected daily in the morning, labeled accordingly and transported to the laboratory
of the Animal Science Department, Universiti Putra Malaysia for analyses. The
numbers of egg produced including all the normal and abnormal eggs from the
different treatment groups were recorded and only normal eggs were weighed
accordingly.
Between 25 to 29 weeks of age, eight eggs per treatment were randomly selected
and analyzed for egg yolk cholesterol and egg yolk fatty acid profiles. The eggs
were broken manually and the albumin discarded. The egg yolk was then
homogenized gently without foaming for 30 seconds by hand. About 0.3-0.5 g of
liquid egg yolk was used for fatty acid analyses. The sample was homogenized in
40 mL of chloroform-methanol (2:1, v/v) in a 50 mL stoppered ground-glass test
tube. The tube was gassed with N, stoppered and then shaken vigorously before
73

74
being allowed to stand for 12 hours. The procedures hereafter were similar to those
described for total fatty acid extraction in Chapter III. The remaining liquid yolk
was subjected to total cholesterol extraction immediately following the procedure
for cholesterol determination as described in Chapter III.
At the end of the experiment, five birds from each treatment were randomly
selected and sacrificed. The birds were fasted for 12 hours prior to blood collection.
Blood samples from each bird were collected into three mL Ethylenediamino
tetraacetic acid (EDTA) vacutainer tubes (Becton Dickinson, New Jersey, USA).
Plasma was separated by centrifuging the blood at 1000 G for 10 min. The plasma
was then transferred into a micro centrifuge tube using a Pasteur pipette and stored
under -20oC until analyses. One mL of plasma was allocated for total cholesterol
analyses as outlined in Chapter III. The remaining volume was stored for fatty acid
profiles analyses as described in Chapter III.
5.2.4 Statistical analysis
The datasets were analyzed using the one-way analysis of variance (ANOVA) in
accordance to a Completely Randomised Design model (SAS®
, 1991). Significant
differences between treatments means were separated using the Duncan’s Multiple
Range test at P<0.05.
74

75
5.3 Results
5.3.1 Faecal Enterobacteriaceae counts
The faecal Enterobacteriaceae counts (Table 5.3 and Appendix 6) for all the
treatment groups were similar (P>0.05) at the beginning of the experiment (15
weeks of age). However, the faecal Enterobacteriaceae counts for the FP9 groups
were significantly lower (P<0.05) compared to the control groups from 17 weeks of
age onwards. The faecal Enterobacteriaceae from FP6 fed group was significantly
lower (P<0.05) compared to the control group except at 15 and 19 weeks of age.
Similarly, the FP3-fed group had significantly lower (P<0.05) faecal
Enterobacteriaceae counts compared to the control group except at 15 and 29
weeks of age.
Table 5.3: Effects of treatment diets on faecal Enterobacteriaceae counts
Treatments Age
(weeks) Cont
Mean ± SE
(log10 cfu/g)
FP3
Mean ± SE
(log10 cfu/g)
FP6
Mean ± SE
(log10 cfu/g)
FP9
Mean ± SE
(log10 cfu/g)
Sig.
15
17
19
21
23
25
27
29
7.23±0.07
7.90a±0.05
6.35a±0.09
6.83a ±0.09
6.25a ±0.03
6.49a±0.09
6.32a±0.09
5.92a±0.09
7.03±0.09
6.79b ±0.09
6.11b±0.06
5.81b±0.07
5.72b±0.11
5.89b±0.12
5.75b±0.09
5.69a±0.13
6.96±0.12
7.45b±0.08
6.55b±0.14
5.52c±0.07
5.56b±0.07
5.34c±0.12
5.00c±0.07
5.24b±0.08
6.83±0.06
7.38b±0.12
6.03b±0.12
4.85d±0.05
4.96c±0.11
4.62d±0.08
4.64d±0.09
4.64c±0.08
ns
*
*
*
*
*
*
*
The results are presented as mean values ± SE.
Values with different superscripts within rows differ significantly at P<0.05; ns
No significant difference
* P<0.05
75

76
5.3.2 Faecal LAB counts
The faecal LAB counts (Table 5.4 and Appendix 7) for all the treatment groups
were similar (P>0.05) at the beginning of the experiment (15 weeks of age). The
faecal LAB counts between the control and FP3 fed group were not significantly
different (P>0.05) at 17, 21, 25, 27 and 29 weeks of age. However, the faecal LAB
counts of the FP6 and FP9 fed groups were significantly (P<0.05) higher compared
to the control group except in the initial weeks (15 weeks of age).
Table 5.4: Effects of treatment diets on faecal LAB counts.
Treatments Age
(weeks) Cont
Mean ± SE
(log10 cfu/g)
FP3
Mean ± SE
(log10 cfu/g)
FP6
Mean ± SE
(log10 cfu/g)
FP9
Mean ± SE
(log10 cfu/g)
Sig.
15
17
19
21
23
25
27
29
6.16±0.11
6.20a±0.06
6.50a±0.05
5.91a±0.10
5.90a±0.09
5.73a±0.09
5.98a±0.06
5.78a±0.08
6.06±0.11
6.24a±0.02
6.74b±0.08
6.17b±0.09
6.13b±0.06
5.75a±0.08
6.05a±0.06
5.98a±0.11
6.25±0.04
6.31b±0.07
6.73b±0.03
6.42c±0.07
6.44c±0.05
6.28b±0.05
6.48b ±0.08
6.31b±0.07
6.06±0.10
6.60c±0.07
7.05c±0.07
6.56c±0.07
6.71d±0.09
6.53c±0.08
6.65b±0.09
6.60c±0.10
ns
*
*
*
*
*
*
*
The results are presented as mean values ± SE.
Values with different superscripts within a row differ significantly at P<0.05; ns
No significant difference
* P<0.05
76

77
5.3.3 Faecal pH
The faecal pH (Table 5.5 and Appendix 8) of birds at 15 weeks of age for all the
experimental groups was not significant different (P>0.05). Significant differences
(P<0.05) in the faecal pH between FP9 fed group and control group were observed
throughout the experimental weeks except at 15 weeks of age. In general, the faecal
pH of the FP9 group remained the lowest (P<0.05) throughout the experimental
period.
Table 5.5: Effects of treatment diets on faecal pH.
Treatments Age
(weeks) Cont
Mean ± SE
FP3
Mean ± SE
FP6
Mean ± SE
FP9
Mean ± SE
Sig.
15
17
19
21
23
25
27
29
6.73±0.07
6.81ab
±0.03
6.90a±0.06
7.00a±0.05
7.57a±0.05
7.09a±0.06
7.17a±0.07
7.06a±0.04
6.85±0.05
6.85a±0.05
6.79ab
±0.09
7.03a±0.09
7.52a±0.15
6.99a±0.06
6.85b±0.08
6.86a±0.07
6.71±0.02
6.71b±0.04
6.70ab
±0.07
6.85ab
±0.06
7.40ab
±0.08
6.92a±0.05
6.95b±0.08
6.88a±0.05
6.73±0.02
6.55c ±0.04
6.68b ±0.04
6.72b±0.06
7.19b±0.03
6.65b±0.11
6.89b±0.06
6.59b±0.12
ns
*
*
*
*
*
*
*
The results are presented as mean values ± SE.
Values with different superscripts within rows differ significantly at P<0.05; ns
No significant difference
* P<0.05
77

78
5.3.4 Faecal volatile fatty acid (VFA) concentrations
The most abundant VFA (Table 5.6) found in the faeces for all groups was acetic
acid. The acetic acid production was about 60% higher than other branched chain
VFA production. Branched short-chain fatty acids (iso-butyric, iso propionic,
valeric and iso-valeric acids) were detectable only in minute proportions.
78

79
Table 5.6: Effects of treatment diets on faecal VFA (%)
Treatments Age
(weeks)
Parameters
Cont
Mean±SE
FP3
Mean±SE
FP6
Mean±SE
FP9
Mean±SE
Sig.
15
17
19
21
23
25
27
29
Acetic acid
Propionic acid
Butyric acid
Other VFAx
Acetic acid
Propionic acid
Butyric acid
Other VFAx
Acetic acid
Propionic acid
Butyric acid
Other VFAx
Acetic acid
Propionic acid
Butyric acid
Other VFAx
Acetic acid
Propionic acid
Butyric acid
Other VFAx
Acetic acid
Propionic acid
Butyric acid
Other VFAx
Acetic acid
Propionic acid
Butyric acid
Other VFAx
Acetic acid
Propionic acid
Butyric acid
Other VFAx
77.84a±5.84
5.59ab
±1.79
5.27ab
±0.96
11.30a±3.45
79.88a±1.46
7.94a±2.14
1.80a±0.61
10.38a±0.55
92.99a±1.40
2.36a±0.98
1.07a±0.36
3.58a±1.21
78.82a±1.84
3.15a±0.19
5.89a±0.83
12.14a±1.68
92.15a±1.23
3.72a±0.57
1.30a±0.26
2.83a±0.60
82.31a±3.85
6.68a±1.69
3.49ab
±1.05
7.52a±1.72
89.61a±0.74
4.64a±0.45
1.36a±0.20
4.39ab
±0.36
79.72a±3.55
9.99a±2.19
4.35a±1.01
5.94a±1.24
81.49ab
±4.71
10.23a±3.09
5.68a±1.39
2.60b±0.53
66.66b±3.43
6.30a±1.58
5.59b±0.52
21.45a±2.80
88.12a±4.40
1.33a±0.36
0.92a±0.26
9.63ab
±3.85
76.12a±3.46
10.97b±7.37
4.80a±0.93
8.11ab
±1.37
84.23a±4.59
7.08b±1.70
3.14a±1.13
5.55a±2.39
78.98a±3.21
10.14a±2.27
5.60a±1.04
5.28a±1.36
84.77a±3.04
8.67a±1.84
2.76a±0.90
3.80b±0.48
81.10a±1.84
7.48a±1.42
2.90a±0.97
8.52a±1.69
90.75b±1.71
1.84b±0.17
3.05ab
±0.68
4.36b±1.39
68.52ab
±3.95
6.01a±1.04
4.10b±0.59
21.37a±2.89
68.31b±4.49
2.88a±1.10
2.66b±0.63
26.15c±4.56
78.51a±3.75
4.18a±1.33
6.06a±1.26
11.25ab
±2.82
92.51a±1.83
3.39a±1.03
1.33a±0.47
2.77a±0.58
80.15a±4.74
10.34a±3.33
4.20ab
±1.15
5.31a±1.56
84.92a±2.16
6.43a±0.61
2.32a±0.46
6.33a±1.26
82.35a±1.90
7.71a±1.28
2.45a±0.74
7.49a±1.08
89.74b±1.31
2.96b±0.92
2.48b±0.32
4.82b±1.17
56.76ab
±4.39
27.07b±9.62
3.58b±0.50
12.59a±4.54
72.97b±6.67
7.05a±5.45
1.42a±0.19
18.56bc
±1.68
81.32a±3.05
8.48ab
±1.51
4.49a±0.93
5.71b±1.48
89.50a±1.75
3.64a±0.38
1.60a±0.40
5.26a±1.05
88.18a±2.86
4.26a±1.77
1.85b±0.75
5.71a±1.61
84.78a±2.64
8.12a±1.91
2.28a±0.66
4.82ab
±0.54
81.50a±4.99
7.22a±2.90
4.55a±2.01
6.73a±1.90
*
*
*
*
*
*
*
ns
*
ns
*
*
ns
*
ns
*
ns
*
ns
ns
ns
ns
*
ns
ns
ns
ns
*
ns
ns
ns
ns
The results are presented as mean values ± SE.
Values with different superscripts within a row differ significantly at P<0.05; ns
No significant difference, x
iso-propionic, iso-butyric, valeric and iso-valeric
* P<0.05
79

80
5.3.5 Egg yolk fatty acid profiles
The total fatty acid concentration of the egg yolk from the different treatment
groups is summarized in Tables 5.7 (Appendices 10a-10e). The SFA of eggs in all
groups was lower than the total UFA at the ratio of about 35:65 (Table 5.7). The
PUFA n-3 levels in the egg yolk from all the FP treated groups were significantly
higher (P<0.05) compared to the control group. This was contributed mainly by
higher (P<0.05) concentration of DHA in laying hens fed with FP, which resulted in
a lower n-6: n-3 ratio.
80

81
Table 5.7:
Effects of treatm
ent diets on egg yolk fatty acid compositions (average from 25 to 29 weeks of
age)
Fat
ty A
cid
Co
nt
Mea
n ±
SE
(m
g/1
00
g)
%
FP
3
Mea
n ±
SE
(mg/1
00
g)
%
FP
6
Mea
n ±
SE
(mg/1
00
g)
%
FP
9
Mea
n ±
SE
(mg/1
00
g)
%
Sig
.
C1
4:0
7
8.3
a ± 2
.2
0.4
8
2.9
ab±
1.6
0
.4
82
.3ab
± 2
.1
0.4
8
6.9
b±
1.8
0
.4
*
C1
6:0
4
78
3.3
a ± 6
.39
2
5.9
4
86
3.0
ab±
65
.9
25
.9
49
10
.8ab
± 7
8.4
2
5.8
5
01
5. 0
b±
62
.5
25
.7
*
C1
6:1
n-9
5
75
.2a ±
13
.9
3.1
5
50
.9 a
b±
14
.9
2.9
5
17
.8b±
14.4
2
.7
56
0.5
ab±
18.3
2
.9
*
C1
8:0
ns
14
38
.7±
20
.9
7.8
1
47
6.6
± 2
8.2
7
.9
14
21
.0±
27
.8
7.5
1
43
8.8
± 2
0.9
7
.4
ns
C1
8:1
n-9
ns
82
08
.5±
11
0.0
4
4.5
8
23
1.3
± 1
27
.0
43
.8
82
94
.2±
14
7.0
4
3.6
8
39
3.2
± 1
31
.0
43
.1
ns
C1
8:2
n-6
2
47
7.7
a ± 5
8.1
1
3.4
2
65
6.7
b±
48
.3
14
.1
27
85
.0bc ±
70
.3
14
.7
29
43
.5c ±
52
.7
15
.1
*
C1
8:3
n-3
5
5.3
a ± 1
.4
0.3
5
8.2
a ± 1
.4
0.3
5
8.9
a ± 1
.7
0.3
6
7.8
b±
1.4
0
.3
*
C2
0:1
n-9
6
9.6
a ± 1
.4
0.4
6
5.4
ab±
1.7
0
.3
61
.9b±
1.2
0
.3
64
.6b±
2.1
0
.3
*
C2
0:2
n-6
3
6.5
ab±
0.8
0
.2
36
.4ab
± 1
.0
0.2
3
6.0
a ± 0
.9
0.2
3
8.8
b±
0.9
0
.2
*
C2
0:4
n-6
4
14
.8a ±
7.5
2
.2
40
9.1
a ± 7
.2
2.2
4
01
.8ab
± 7
.9
2.1
3
85
.1b±
5.8
2
.0
*
DP
A,
C2
2:5
n-3
1
63
.1a ±
5.2
0
.9
13
2.2
b±
5.0
0
.7
11
0.3
c ± 3
.9
0.6
8
5.6
d±
3.9
0
.4
*
DH
A,
C2
2:6
n-3
1
51
.9a ±
3.8
0
.8
24
5.9
b±
6.7
1
.3
32
5.9
c ± 8
.5
1.7
4
02
.7d±
6.3
2
.1
*
To
tal
SF
A n
s 6
30
0.2
± 8
0.4
3
4.1
6
42
2.5
± 9
.1
34
.1
64
14
.1±
10
3.0
3
3.7
6
54
0.6
± 7
8.3
3
3.6
ns
To
tal
UF
A
12
152
.4a ±
160
.0
65
.9
12
386
.1a ±
164
.0
65
.9
12
591
.7ab
± 2
13.0
6
6.3
1
29
41
.6b±
16
8.0
6
6.4
*
To
tal
MU
FA
ns
88
53
.2±
11
9.0
4
8.0
8
84
7.7
± 1
33
.0
47
.0
88
73
.9±
15
1.0
4
6.7
9
01
8.2
± 1
43
.0
46
.3
ns
To
tal
PU
FA
n-3
3
70
.2a ±
7.5
2
.0
43
6.3
b±
8.4
2
.3
49
5.0
c ± 1
1.6
2
.6
55
6.1
d±
8.3
2
.9
*
To
tal
PU
FA
n-6
2
92
8.9
a ± 6
2.0
1
5.9
3
10
2.1
ab±
50
.1
16
.5
32
22
.8b±
77
.9
17
.0
33
67
.3b±
56
.0
17
.3
*
Over
all
To
tal n
s 1
84
52
.6±
239
.0
1
88
08
.6±
252
.0
1
90
05
.8±
313
.0
1
94
82
.2±
240
.0
ns
n-6
: n
-3 r
atio
7.9
7.1
6.5
6.1
UF
A :
SF
A r
atio
1.9
1.9
2.0
2.0
PU
FA
: S
FA
rat
io
0
.5
0
.6
0
.6
0
.6
Val
ues
wit
h d
iffe
rent
sup
ersc
ripts
wit
hin
a r
ow
dif
fer
signif
ican
tly a
t P
<0.0
5;
n
s No s
ignif
ican
t dif
fere
nce
* P
<0.0
5
81

82
5.3.6 Egg yolk cholesterol concentrations
The egg cholesterol levels (Table 5.8 and Appendix 11) were not significantly
different (P>0.05) between groups at 25 weeks of age. However, egg cholesterol
levels for the rest of the weeks were significantly different (P<0.05). A lower
(P<0.05) cholesterol level in eggs was observed in the FP9 fed group compared to
the control group except at 25 weeks of age.
Table 5.8: Effects of treatment diets on egg yolk cholesterol
concentrations in birds from 25 to 29 weeks of age.
Treatments Age
(weeks) Cont
Mean±SE
(mg/100g)
FP3
mean±SE
(mg/100g)
FP6
Mean±SE
(mg/100g)
FP9
mean±SE
(mg/100g)
Sig.
25
26
27
28
29
1364.8±38.9
1243.0ab
±55.8
1271.2a±78.6
1387.3a±83.4
1241.9a±42.2
1360.5±52.1
1287.8a±68.7
1219.3a±54.3
1302.0ab
±42.7
1165.2ab
±59.5
1324.3±58.9
1101.3bc
±66.6
1161.5ab
±52.6
1178.2bc
±61.0
1194.5a±48.6
1285.3±76.0
1058.4c±47.0
1045.9b±20.5
1068.3c±42.5
1035.9b±34.7
ns
*
*
*
*
The results are presented as mean values ± SE.
Values with different superscripts within a row differ significantly at P<0.05; ns
No significant difference
* P<0.05
82

83
5.3.7 Plasma fatty acid profiles
After 16 weeks of treatment (inclusive of two weeks of adjustment period), only
DHA concentration in the plasma (Table 5.9) from FP6 and FP9 groups were
significantly higher (P<0.05) compared to the control group. This resulted in higher
PUFA n-3 levels in the plasma of the FP treated groups compared to the control
group. This lowered the n-6: n-3 ratio from 10.5 to a more beneficial value of 6.5.
In general, more than one third of the plasma fatty acids content was made up of
SFA (Table 5.9). This comprised mainly of palmitic, myristic and stearic acids. The
remaining fatty acids were made up of UFA, which comprised both PUFA and
MUFA.
83

84
Table 5.9:
Effects of treatm
ent diets on plasm
a fatty acid compositions of birds at 29 weeks of age
Fat
ty A
cid
Co
ntr
ol
Mea
n±
SE
(µL
/10
0m
L)
%
FP
3
Mea
n±
SE
(µL
/10
0m
L)
%
FP
6
Mea
n±
SE
(µL
/10
0m
L)
%
FP
9
Mea
n±
SE
(µL
/10
0m
L)
%
Sig
.
C1
4:0
2
.29
±0
.39
0
.30
1
.78
±0
.32
0
.28
2
.62
±0
.54
0
.29
1
.87
±0
.41
0
.29
ns
C1
6:0
2
05
.40
±24
.40
2
6.8
9
17
4.6
1±
29
.40
2
7.5
3
23
3.1
2±
48
.20
2
6.2
3
17
3.1
3±
39
.20
2
6.9
1
ns
C1
6:1
n-9
9
.52
±1
.72
1
.25
7
.07
±1
.35
1
.11
1
1.7
7±
2.3
9
1.3
2
7.4
6±
8.0
9
1.1
6
ns
C1
8:0
6
5.1
2±
8.0
9
8.5
2
58
.64±
7.7
7
9.2
5
76
.68±
16.2
0
8.6
3
54
.20±
12.6
0
8.4
2
ns
C1
8:1
n-9
2
92
.16
±40
.10
3
8.2
5
24
0.3
0±
40
.80
3
7.8
8
34
9.8
6±
72
.80
3
9.3
6
23
8.3
0±
60
.60
3
7.0
4
ns
C1
8:2
n-6
1
44
.66
±16
.60
1
8.9
4
11
1.6
0±
19
.60
1
7.5
9
15
8.4
7±
36
.40
1
7.8
3
12
4.0
4±
24
.30
1
9.2
8
ns
C1
8:3
n-3
1
.83
±0
.26
0
.24
1
.49
±0
.28
0
.23
2
.24
±0
.65
0
.25
1
.60
±0
.28
0
.25
ns
C2
0:1
n-9
1
.63
±0
.19
0
.21
1
.20
±0
.19
0
.19
1
.78
±0
.58
0
.20
1
.01
±0
.31
0
.16
ns
C2
0:2
n-6
1
.25
±0
.13
0
.16
0
.97
±0
.14
0
.15
1
.44
±0
.43
6
0.1
6
0.9
7±
0.2
4
0.1
5
ns
C2
0:4
n-6
2
3.8
4±
2.7
1
3.1
2
20
.12±
2.5
8
3.1
7
26
.00±
4.5
5
2.9
3
19
.03±
3.7
4
2.9
6
ns
C2
4:1
1
.91
±0
.59
0
.25
1
.37
±0
.54
0
.22
0
.98
±0
.13
0
.11
1
.48
±0
.61
0
.23
ns
DP
A,
22
:5 n
-3
6.1
9±
1.3
8
0.8
1
5.1
6±
0.8
4
0.8
1
5.7
0±
1.4
2
0.6
4
3.6
8±
1.3
7
0.5
7
ns
DH
A,
22
:6 n
-3
8.0
8a ±
0.8
5
1.0
6
10
.01
a ±1
.36
1
.58
1
8.1
2b±
2.9
9
2.0
4
16
.61
b±
2.8
1
2.5
8
*
To
tal
SF
A
27
2.8
0±
32
.60
3
5.7
1
23
5.0
4±
37
.30
3
7.0
5
31
2.4
1±
64
.20
3
5.1
5
22
9.2
0±
52
.00
3
5.6
2
ns
To
tal
UF
A
49
1.0
7±
64
.20
6
4.2
9
39
9.2
8±
66
.70
6
2.9
5
57
6.3
7±
12
0.0
0
64
.85
4
14
.17
±95
.90
6
4.3
8
ns
To
tal
Mo
no
enes
3
05
.22
±42
.50
3
9.9
6
24
9.9
4±
42
.80
3
9.4
0
36
4.4
0±
75
.70
4
1.0
0
24
8.2
5±
63
.70
3
8.5
9
ns
To
tal
PU
FA
n-3
1
6.1
1±
2.4
1
2.1
1
16
.65±
2.3
3
2.6
3
26
.06±
4.9
2
2.9
3
21
.89±
4.1
0
3.4
0
ns
To
tal
PU
FA
n-6
1
68
.50
±19
.40
2
2.0
6
13
1.7
2±
22
.30
2
0.7
7
18
4.4
7±
41
.30
2
0.7
6
14
3.0
7±
28
.20
2
2.2
4
ns
Over
all
To
tal
76
3.8
8±
96
.70
63
4.3
2±
10
4.0
0
8
88
.78
±18
5.0
0
6
43
.37
±14
8.0
0
ns
n-6
: n
-3 r
atio
10
.46
7.9
1
7
.08
6.5
4
U :
S r
atio
1.8
0
1
.70
1.8
4
1
.81
P :
S r
atio
0.6
8
0
.63
0.6
7
0
.72
Val
ues
wit
h d
iffe
rent
sup
ersc
ripts
wit
hin
row
dif
fer
signif
ican
tly a
t P
<0.0
5;
n
s No s
ignif
ican
t dif
fere
nce
* P
<0.0
5
84

85
5.3.8 Plasma cholesterol
The plasma cholesterol concentrations (Figure 5.1) from all of the FP treated groups
were significantly lower (P<0.05) compared to the control group at the end of the
experiment (29 weeks of age). The birds from FP9 group had the lowest (P<0.05)
cholesterol concentration among the experimental groups.
6.47a
5.36b
4.52c
2.55d
0
1
2
3
4
5
6
7
8
Plasm
a cholesterol. mg/mL
Figure 5.1: Effects of treatment diets on plasma cholesterol concentrations
(mg/ml). (Error bars = SE; Bars with different superscripts differ
significantly at P<0.05
Treatments
Cont FP3 FP6 FP9
85

86
5.3.9 Layer Performance
The average daily feed intake (g), hen-day egg production (%), egg mass (g), egg
weight (g) and feed conversion ratio (g feed intake/g egg mass) are shown in
Figures 5.2 and 5.3, Tables 5.10 and 5.11 and Figure 5.4, respectively. There was
no significant difference (P>0.05) in average feed intake, egg production, egg mass
and feed conversion ratio among the experimental groups. However, the FP9 fed
hens had lower (P<0.05) egg weights compared to the control hens at 25, 26 27 and
28 weeks of age. The average initial and final body weight of the experimental
groups are presented in Appendix 12.
0
20
40
60
80
100
120
15 16 17 18 19 20 21 22 23 24 25 26 27 28 29
Age (weeks)
feed intake (g/b/d)
Cont FP3 FP6 FP9
Figure 5.2: Effects of treatment diets on daily feed intake.
(Errors bars = SE)
Cont FP3 FP6 FP9
86

87
0
20
40
60
80
100
21 22 23 24 25 26 27 28 29
Age (weeks)
Egg production,%
Cont FP3 FP6 FP9
Figure 5.3: Effects of treatment diets on egg production.
(Errors bars = SE)
Table 5.10: Effects of treatment diets on egg mass
Treatments Age
(weeks) Cont
Mean (g) ± SE
FP3
Mean (g) ± SE
FP6
Mean (g) ± SE
FP9
Mean (g) ± SE
21
22
23
24
25
26
27
28
29
9.1±2.7
25.6±5.4
37.3±3.7
43.6±2.4
47.8±1.8
49.7±1.2
50.1±1.5
46.7±2.3
51.8±1.9
7.3±1.2
26.4±5.2
37.1±3.6
36.1±3.6
46.0±2.0
44.8±2.2
46.9±2.1
47.5±1.3
49.5±1.6
15.3±4.0
28.3±6.8
35.0±2.9
37.8±3.9
44.7±2.0
44.6±2.2
46.5±2.2
46.2±2.2
48.8±1.6
9.3±1.8
34.9±4.2
38.0±4.1
37.3±4.2
41.6±2.6
44.2±2.6
47.3±2.3
47.0±1.6
49.9±1.3
The results are presented as mean values ± SE.
All values within a row were not significantly different from each other (P>0.05).
egg mass = (egg weight x egg production)/100
87

88
Table 5.11: Effects of treatment diets on egg weight
Treatments Age
(weeks) Cont
Mean (g) ± SE
FP3
Mean (g) ± SE
FP6
Mean (g) ± SE
FP9
Mean (g) ± SE
Sig.
21
22
23
24
25
26
27
28
29
43.0±2.0
47.8±1.2
49.4±0.8
52.0±0.9
52.3±0.7
53.8ab
±0.6
54.8ab
±0.6
54.3ab
±0.6
54.5a±0.9
43.1±1.9
47.8±0.6
49.0±0.7
51.1±0.7
52.1±0.6
52.6ab
±0.6
53.7b±0.5
54.2ab
±0.6
55.2ab
±0.6
42.3±2.8
45.5±0.9
49.2±0.5
51.5±0.6
52.8±0.7
54.3a±0.7
55.4a±0.5
55.7a±0.8
56.9b±0.7
41.5±2.2
46.1±1.0
48.0±0.8
50.1±0.6
50.7±0.6
51.9b±0.7
53.2b±0.5
53.3b±0.7
54.3a±0.7
ns
ns
ns
ns
ns
*
*
*
*
The results are presented as mean values ± SE.
Values with different superscripts within a row differ significantly at P<0.05; ns
No significant difference
* P<0.05
0
2
4
6
8
10
12
14
21 22 23 24 25 26 27 28 29
Age (weeks)
Feed conversion ratio
Cont FP3 FP6 FP9
Figure 5.4: Effects of treatment diets on feed conversion ratios (g feed intake/g
egg mass). (Errors bars = SE)
88

89
5.4 Discussion
5.4.1 Faecal characteristics
5.4.1.1 Faecal Enterobacteriaceae counts
The FP in the present study was produced using the LAB as the starter culture. Both
in-vitro and in-vivo studies of LAB have been shown to have a bactericidal effect on
harmful bacteria (Lindgren and Dobrogosz, 1990; de Vuyst and Vandamme, 1994;
Forestier et al., 2001; Foo et al., 2003). Oral administration of FP (6%, w/w and
9%, w/w) rich in these beneficial bacteria has been shown to be able to reduce the
faecal Enterobacteriaceae count. This was attributed to the reduction in faecal pH
as a result of FP supplementation and increased proliferation of the faecal LAB in
the present study. The faecal Enterobacteriaceae populations reflected the
Enterobacteriaceae-LAB balance in the GIT of the host animal. Several in-vivo
studies reported that the numbers of Enterobacteriaceae in the GIT of the fermented
feed fed groups were lower compared to the control group (van Winsen et al., 2001;
2002, Canibe and Jensen, 2003; Højberg et al., 2003 Loh et al., 2003a,b). This
could be due to the fact that intestinal LAB is able to produce antimicrobial
compounds such as bacteriocin, VFA’s and non-VFA, which are bacteriostatic
against pathogenic bacteria (Adam and Nicolaides, 1997; Jin et al., 1998b;
Scheinbach, 1998; Ross, et al., 2002; Holzapfel, 2002). The undissociated organic
acid decreased the pH when it passed through the cell wall of the bacteria (Beal et
89

90
al., 2002; Immerseel et al., 2003). In the internal environment of the bacteria cell,
the molecules will be dissociated and decreased the internal pH. This in turn
stopped the enzymatic processes and collapsed the proto motive force. Growth is
inhibited because the cell must spend energy trying to maintain internal pH and this
energy cannot be used for other metabolic processes. This probably resulted in less
numbers of Enterobacteriaceae that could pass the crop and gizzard, which would
reduce the probability of Enterobacteriaceae reaching the caecum and be excreted
through the faeces (Heres et al., 2003a,b).
5.4.1.2 Faecal LAB counts
In the present study, laying hens fed diets supplemented with FP (6%, w/w and 9%,
w/w) had higher faecal LAB counts compared to the control group. The acidifying
effect of the FP on the GIT provided a suitable environment for the growth of LAB
(Loh et al., 2003a,b) as reflected in the LAB population in the faeces. The LAB are
important components for a balanced microflora in the GIT. Feeding fermented
liquid feed has been reported to increase the total number of lactobacilli in the GIT
of treated animals (van Winsen et al., 2001; Canibe and Jensen, 2003; Højberg et
al., 2003). However, there were also reports citing that fermented liquid feed had no
effect on the lactobacilli populations in the GIT (van Winsen et al., 2002;
Demecková et al., 2002). Loh et al. (2003a,b) reported that a solid form of
fermented feed increased the faecal LAB of treated animals. This may be due to the
fact that liquid fermented feed is more unpredictable and less consistent compared
90

91
to solid fermented feed (van Winsen et al., 2002; Demecková et al., 2002).
Therefore, these conditions diminished the efficiency of fermented liquid feed
compared to solid fermented feed and FP on improving the LAB in the GIT. The
improvement in faecal LAB count in the present study was only observed after 2
weeks of experiment which was evidently faster than the study by Jin et al. (1998b)
for Lactobacillus-fed broilers where the effect was seen after 30 days of
experiment.
5.4.1.3 Faecal pH and volatile fatty acids (VFA)
Feeding FP (9%, w/w) to the birds was observed to decrease the faecal pH
compared to the control group. This confirmed earlier reports (Heres et al. 2003a,b,
2004; Loh et al., 2003a,b). The FP lowered the crop pH to pH 4.5 (Cox et al., 1972)
and therefore lowered the pH in GIT, resulting in a lower faecal pH. A number of
factors may account for the beneficial effect of FP and these may act independently
or synergistically. It was suggested that the FP reduced pH in the GIT thereby
enhanced the activity of VFA. The VFA are known for their bacteriostatic effects
on pathogenic bacteria in the GIT of chicken (Jin et al., 1998b; Izat et al., 1990;
Mchan and Shotts, 1992; Hume et al., 1993a; Nisbet et al., 1996; Ricke, 2003). In
the present study, the concentration of the acetic acid was the highest VFA found in
the faeces of all groups. Acetic acid was also found to be the dominant VFA present
in the ileum and cecal of chicken in earlier studies (Jin et al., 1998b; Choct et al.,
1999; Immerseel et al., 2003). Propionic acid was metabolized and reabsorbed
91

92
before reaching the intestine (Hume et al., 1993b). Thus this explained the low
proportion of propionic acids found in the faeces of all groups. It is presumed that
the presence of organic acids in the feed together with the production of VFA and
non-VFA in the GIT resulted in the more acidic faeces in the FP fed hens.
5.4.2 Egg nutritive value
5.4.2.1 Egg yolk fatty acid profiles
In the present study, feeding FP (6%, w/w and 9%, w/w) rich in n-3 and n-6 fatty
acids to laying hens had resulted in the increased n-3 and n-6 fatty acid contents in
the egg yolk. The FP (3% w/w, 6% w/w and 9%, w/w) was able to decrease the n-6:
n-3 ratio and increase PUFA: SFA ratio in the eggs. These two parameters are
currently used to determine the nutritional quality of the lipid fraction in foods
(Ansorena and Astiasarán, 2004). The level of total n-3 and DHA in egg yolk was
found to be higher in FP (3% w/w, 6% w/w and 9% w/w) fed hens compared to
control hens. This observation is in agreement with the findings by several authors
who fed the n-3 product to the laying hen successfully enhanced the n-3 fatty acids
in the eggs (Ferrier et al., 1992; Ayerza and Coates, 1998; Milinsk et al., 2003;
Carrillo-Domínguez et al., 2005). Enrichment of eggs with long-chain n-3 and n-6
PUFA had been accomplished through the supplement of hen diet with marine
algae, fish and seed oil that were rich in n-3 and n-6 PUFA (Ferrier et al., 1992,
Ayerza and Coates, 1998; Milinsk et al, 2003; Carrillo-Domínguez et al., 2005). It
92

93
is interesting to note that although the FP used in this study contained a higher level
of EPA than DHA, the resulting level of DHA in the yolk was much higher as EPA
was not detected in the egg yolk. These differences in incorporation rates of EPA
and DHA into the egg yolk had been previously reported (Baucells et al., 2000;
González-Esquerra and Leeson, 2000; Carrillo-Domínguez et al., 2005). The
biochemical differences of EPA and DHA, both in their mechanisms for
assimilation and metabolic conversion, are responsible for the different rates at
which they are incorporated into the egg yolk (González-Esquerra and Leeson,
2000). Moreover, EPA is one of the precursors of DHA, as they are normally
converted to DHA by chain reactions of desaturation and elongation (Gurr et al.,
2002).
5.4.2.2 Egg yolk cholesterol concentrations
The egg yolk cholesterol content was affected by the level of FP supplementation
(9%, w/w). Cholesterol reduction observed in this study was probably related to
decreased cholesterol synthesis in the liver. In laying hens, the liver is the major site
of cholesterol synthesis (Qureshi and Peterson, 2001). Laying hens usually
synthesis cholesterol more than the body requirements (Luhman et al., 1990). The
synthesized cholesterol was then secreted into the blood stream, carried by the very
low density lipoprotein (VLDL) particles across the ovarian membranes and
subsequently deposited in the developing yolks through the oocyte vitellogenesis
receptor (March and Millan, 1990; Elkin et al., 1999). Thus, for the laying hen, a
93

94
major excretion pathway of cholesterol through the plasma transportation seems to
be the production of egg yolk cholesterol. A reduction in cholesterol synthesized in
the liver will result in lowered plasma and egg cholesterol. This is in agreement
with the findings in the present study where egg yolk cholesterol and the plasma
cholesterol were lowered compared to the control groups.
5.4.3 Plasma fatty acid profiles
It is well known that the fatty acids found in the plasma closely reflected the fatty
acids composition of the diet offered. In the present study, the FP was able to
increase the total n-3 fatty acid and decrease the total n-6 content of the plasma
lipids, thus lowering the plasma n-6: n-3 ratio from 10.5 to a more beneficial value
of 6.5. This was related to the high n-3 PUFA in the FP, due to the incorporation of
marine fish. This is in agreement with the findings of Nash et al. (1995) who
managed to increase plasma n-3 fatty acids in laying hens by feeding herring meals.
In general, fatty acid synthesis in the laying hens usually occurred in the liver
(Luhman et al., 1990). The desaturation and elongation of enzymes in the liver of
the laying hens could elongate and desaturate the dietary sources of n-3 fatty acids
to form the long-chain n-3 PUFA such as DHA (Watkins, 1995; González-Esquerra
and Leeson, 2000; Gurr et al., 2002). This metabolite is then transported through
the plasma and deposited in the egg yolk. Thus, feeding 6% (w/w) and 9% (w/w)
FP to the laying hen increased the DHA concentration in the plasma. The high
94

95
plasma DHA was therefore postulated to contribute to the increased yolk DHA level
in the present study.
5.4.4 Plasma cholesterol
In the present study, plasma cholesterol was significantly lower in all the FP fed
hens compared to the control hens at the end of the experiment. Feeding 3% (w/w),
6% (w/w), and 9% (w/w) of FP significantly reduced the plasma cholesterol
concentration by 17%, 30% and 61%, respectively. The reductions were greater
than those observed in earlier reports (Jin et al., 1998a; Chowdhury et al., 2005).
Feeding 0.1% (w/w) of Lactobacillus-probiotic to broiler significantly decreased the
serum cholesterol by 17% (Jin et al, 1998a). Feeding a diet rich in n-6 PUFA to the
laying hens significantly decreased the serum cholesterol concentrations by 11% to
43% (Chowdhury et al., 2005). The reduction of serum cholesterol might be due to
a reduction in the synthetic enzyme activity. An increased PUFA had been known
to lower regulate hydroxy-3-methylglutaryl coenzymes A (HMG Co-A) activity, the
rate-limiting enzyme that determines the level of plasma cholesterol in animals
(Fernandez et al., 1990).
Another possible explanation might be due to the presence of Lactobacillus-
probiotic in the FP. Directly fed FP increased the LAB in GIT as reflected in the
faecal LAB counts. This bacteria cell was reported to be able to assimilate the
cholesterol and deconjugate the bile salt in the intestine (Jin et al., 1998a; Akalin et
95

96
al., 1997) and making it unavailable for absorption into the blood stream. The
deconjugated bile salt will be excreted through the faeces. This in turn stimulates an
increase in requirement for cholesterol as a precursor for the synthesis of new bile
salts that are required for lipid metabolism (Jin et al., 1998a; Farnworth and
Mainville, 2003; Chowdhury et al., 2005). This may explain the reduction of the
plasma cholesterol in the FP fed hens.
5.4.5 Layer performance
The FP used in the present study was rich in LAB, had a lower pH level and
contained beneficial long-chain PUFA. Supplementation of FP at 3% (w/w), 6%
(w/w) and 9% (w/w) in layer diets did not affect feed intake, egg production, egg
mass and FCR. There was no mortality recorded during the experimental period.
The FP produced in the present study contained high levels of n-3 fatty acids.
However, feeding higher levels of FP (9%, w/w) significantly decreased the egg
weight compared to control group (0% FP). Changes in egg weight and egg mass
associated with dietary n-3 fatty acids have been reported previously (Leeson et al.,
1998; Gonzalez-Esquerra and Leeson, 2000; Schreiner et al., 2004). Feeding higher
levels of n-3 rich products such as (6%, v/w) menhaden oil (Gonzalez-Esquerra and
Leeson, 2000) and (5%, v/w) seal blubber oil (Schreiner et al., 2004) decreased the
egg mass. A decrease in circulating triglycerides of birds due to n-3 consumption
could limit the availability of lipids for yolk formation (Gonzalez-Esquerra and
Leeson, 2000). This might be due to the lower plasma triglycerides, a result of the
96

97
hypotriglyceridemic effect of n-3 fatty acids (Schreiner et al., 2004). This could
explain the lower egg weight and egg mass found in the birds fed FP in the present
study.
5.5 Conclusions
The present experiment demonstrated that the addition of 3% (w/w), 6% (w/w) and
9% (w/w) FP to the layers diet did not affect the feed intake, egg production, egg
mass and FCR. However, the 6% (w/w) and 9% (w/w) FP diets were able to reduce
the Enterobacteriaceae population (log10 cfu/g) in faeces as well as increasing the
faecal LAB population (log10 cfu/g). Feeding 9% (w/w) of FP was able to reduce
the level of faecal pH in the present study. This indicated that FP has the potential
to be added in animal feed to promote better health performance without adversely
affecting production parameters. Furthermore, feeding 6% (w/w) and 9% (w/w) of
FP resulted in a decrease in plasma (mg/ml) and egg cholesterol (mg/100g)
concentrations. It was demonstrated in the present study that the essential fatty
acids, especially DHA in the plasma and egg were increased due to the feeding of
FP. In addition, the n-6: n-3 ratio was decreased with an increased in the PUFA:
SFA ratio to a more beneficial balance. Finally, it can be concluded that feeding 6%
and 9% FP to the laying hens enhanced the egg’s nutritive quality.
97

98
CHAPTER VI
GENERAL DICUSSION AND CONCLUSIONS
6.1 General discussion
In the present study, LAB was used as the starter culture for fermentation. It is one
of the most commonly used starter culture for food and feed fermentation (Leroy
and de Vuyst, 2004; Chapter II). The fermentation process and characteristics of FP
were reported in Chapters III and IV, respectively. The present findings
demonstrated that the physico-chemical characteristics of the FP after fermentation
process were quite constant. Furthermore, fermentation increased the numbers of
LAB and decreased the numbers of Enterobacteriaceae in the product compared to
the raw materials. LAB produced antimicrobial metabolites such as organic acids
during fermentation, and also reduced the pH of the raw materials. The
undissociated acids diffuse over the cell membrane and acidified the cytoplasm,
inhibited a variety of cell metabolic functions (Ross et al., 2002) thus suppress the
proliferation of Enterobacteriaceae. Indeed, numerous in-vitro studies on the
preparation of fermented feed and study on different genera of probiotic bacteria
and their metabolites had been reported to have bactericidal/bacteristatic effects on
the pathogenic and spoilage bacteria (Lindgren et al., 1990; McHan and Shotts,
1992; de Vuyst and Vandamme, 1994; Forestier et al., 2001; Demecková et al.,
2002; Heres et al., 2004).
98

99
Another important characteristic of FP was the presence of beneficial n-3 and n-6
PUFA. These fatty acids are now regarded as nutritionally beneficial fatty acids
(Elmore et al., 2005). Feedstuff with added n-3 and n-6 PUFA are definitely more
advantageous over conventional feeds as it improved beneficial n-3 PUFA in eggs
(Ayerza and Coates, 1999; Schreiner et al., 2004; Carrillo-Domínguez et al., 2005).
The FP (6%, w/w and 9%, w/w) diets significantly improved the LAB and
decreased the Enterobacteriaceae counts in the GIT as reflected in the faecal
bacteria counts. Similarly, directly fed fermented liquid feed with LAB has been
shown to increase the LAB and decrease the pathogenic bacteria in the GIT of the
animals (van Winsen et al., 2001, 2002; Demecková et al., 2002; Canibe and
Jensen, 2003; Højberg et al., 2003; Heres et al., 2003a,b, 2004). Feeding fermented
solid feed provided a similar effect as feeding fermented liquid feed in promoting
the growth of intestinal LAB and eliminating the intestinal Enterobacteriaceae (Loh
et al., 2003a,b). Oral administration of FP in this study was believed to have an
acidifying effect on the GIT. FP reduced the pH in the GIT thus suppressed the
growth of Enterobacteriaceae (Loh et al., 2003a,b). Furthermore, the lactobacilli
have a strong inhibitory effect in preventing the adherence, establishment and
replication of enteropathogens (Jin et al., 1998a). They competed against
pathogenic bacteria for nutrient, binding and receptor sites (Gallaher et al., 1996;
Fujiwara et al., 1997; Kailasapathy and Chin, 2000). This in turn decreased the
survivability of Enterobacteriaceae in the GIT (Heres et al., 2003a,b) and resulted
in lesser excretion of Enterobacteriaceae in faeces.
99
100
In addition, the faecal VFA played an important role in enhancing the bactericidal
effects on Enterobacteriaceae (Jin et al., 1998b). They are the major end product of
microbial carbohydrate fermentation in the intestinal tract of the animal among
which, acetic, propionic and butyric acids are dominant (Johansson et al., 1998). In
this study, the concentration of acetic acid was the highest VFA found in the faeces.
The higher level of acetic acid in combination of low pH in the GIT forms an
improved bactericidal barrier (Marounek et al., 1999; van der Wielen et al., 2000,
2001; Heres et al, 2003a). The faecal Enterobacteriaceae counts reported in
Chapter V after FP (6% w/w and 9%, w/w) feeding were lower than published
figures for Enterobacteriaceae in the gut. This could be related to the bactericidal
effects of antimicrobial substance present in the FP and pH reduction due to VFA
production in the faeces. Overall, these supported the proliferation of LAB. The
LAB are always considered as one of the important components of the
gastrointestinal flora (Salminen et al., 1999; Shimakawa et al., 2003; Coeuret et al.,
2004). These microorganisms have significant impacts on animal health, growth
development, performance and pathogens. Van Winsen et al, (2002) and Loh et al,
(2003a,b) reported that fermented feed was able to increase the faecal LAB under
the stressful condition. The mechanisms involved could be associated with the
ability of intestinal LAB to stimulate the immune system (de Simon et al., 1993;
Scheinbach, 1998) in laying hens. However, the underlying mechanism of immune
stimulation in the present study is not well understood. Overall, the FP modified the
microorganism in the GIT. This was reflected in the faecal microflora which has
shifted towards to a beneficial balance.
100

101
The LAB presence in the FP could be responsible for the cholesterol-lowering
effect observed in the present study. This confirmed earlier in-vitro and in-vivo
reports by other workers (Zacconi et al., 1992; Akalin et al, 1997; du Toit et al.,
1998; Kawase et al., 2000; Pereira and Gibson, 2002). The LAB was able to
assimilate cholesterol or to coprecipitate cholesterol with deconjugated bile acids in
the intestine and making it unavailable for absorption into the blood stream
(Gilliland et al., 1985b; Buck and Gilliland, 1994). Since cholesterol is used in the
production of bile acids, enhanced catabolism and excretion of bile acids is
reflected in the reduced plasma and egg cholesterol levels. Another explanation for
the hypocholesterolaemic effect of the FP diet is the high PUFA content in the FP.
This enabled the FP to decrease the synthesis of lipid components in the liver of the
laying hens. Laying hens usually synthesized cholesterol more than their body
requirement via de-novo synthesis in the liver (Luhman et al., 1990), which is then
secreted into the blood stream through the plasma transportation and deposited in
the rapidly developing follicle (March and Millan, 1990; Elkin et al., 1999).
Increased PUFA had been known to down regulate Hydroxy-3-methylglutaryl
coenzyme A (HMG Co-A) activity, the rate-limiting enzyme that determines the
level of plasma cholesterol in animals (Fernandez et al., 1990). Changes in egg yolk
cholesterol are generally preceded by the changes in plasma cholesterol levels (Sim
et al., 1984). This may explain the reduction of the plasma and egg cholesterol in
the FP fed hens.
101

102
Dietary inclusion of n-3 PUFA altered the fatty acid profiles in the eggs
significantly (Ayerza and Coates, 1998; Gonzalez-Esquerra and Leeson, 2000;
Meluzzi, et al., 2000; Milinsk et al., 2003; Carrillo-Domínguez et al., 2005). Eggs
are a rich source of protein and it is an important source of essential PUFA and
other essential nutrients as reported in Appendix 1. Because chicken is a
monogastric animal, much of the dietary lipid is assimilated directly with minimal
modification. Chickens are able to desaturate and elongate the fatty acids through
the desaturation and elongation enzymes which are synthesized by the liver. Thus,
the long chain (C20-22) fatty acids of the n-3 series can be synthesized from the
dietary precursor, alpha-linolenic acid albeit slowly and deposited in eggs (Wood et
al., 2003). The enrichment of foods with beneficial n-3 PUFA has been extensively
studied. This is due to its importance in the maintenance of human health by
protecting against metabolic disease such as cardiovascular diseases (Ferrier et al.,
1992; Ayerza and Coates, 1999; Schreiner et al., 2004).
n-3 PUFA was detected in substantial amounts in the FP. Feeding FP (9%, w/w) to
the laying hens increased the total n-3 PUFA and DHA concentrations in eggs and
plasma compared to the control group. These n-3 PUFA were readily incorporated
into the egg yolk in a high proportion through plasma transportation. The n-3 PUFA
exert beneficial effects on lipoprotein metabolism and modulate eicosanoid
biosynthesis in the laying hens (Watkins, 1995). Effectively, the FP was able to
lower the n-6: n-3 ratio in the eggs and plasma compared to the control group. In
addition, the FP resulted in an increase of the PUFA: SFA ratio both in plasma
102

103
(control=0.68 to FP9=0.72) and egg (control=0.5 to FP9=0.6) as these two factors
are currently used to determine the nutritional quality of the lipid fraction in food
(Ansorena and Astiasarán, 2004).
6.2 Conclusions
Based on the experiments conducted herein, it could be concluded that the inclusion
of FP up to 9% (w/w) in the diets of layers did not have any detrimental effects on
the growth and laying performance. In fact, the FP (9%, w/w) successfully
improved the nutritive value of eggs, increased the faecal LAB, and decreased the
potentially pathogenic Enterobacteriaceae in laying hens. It is well known that the
health performance of the animal is much dependent on the equilibrium between the
beneficial microflora in the GIT. The FP helps to promote the symbiotic
relationship between the host and its intestinal micro-flora. The results obtained
from the study strongly demonstrated the consistency, efficiency and stability of the
FP in enhancing the animal performance and nutrition. This indicated that FP has
the potential to partially replace antibiotics in the feed and further promote green
agricultural products in Malaysia.
103

104
6.3 Recommendations
Results from this study have shown that it is possible to alter the cholesterol and
essential fatty acid concentrations in the plasma and egg yolk through the
supplementation of FP in the diet. Lipoprotein metabolism plays an important role
in determining the fat content and composition of the yolk. The VLDL is one of the
major lipoprotein transporting triacylglycerol from the liver to extra hepatic tissues
such as adipose tissues or deposited in the egg. Furthermore, the metabolism of
VLDL in laying hens is influenced by age, diet and nutritional state. Thus, future
studies should focus on the VLDL metabolism and lipoprotein lipase activity from
different laying stages as age factors needed to be explored in order to understand
the mechanism of fat deposition in laying hens. Another interesting aspect to be
included is the organoleptic studies on eggs to determine the effects of FP on egg
flavour and colour.
104

105
BIBLIOGRAPHY
Adams, M.R and Hall, C.J. 1988. Growth inhibition of food bone pathogens by
lactic and acetic acids and their mixtures. Int. J. of Food Sci. and Technol.
23(3):287-292.
Adams, M.R and Nicolaides, L. 1997. Review of the sensitivity of different
foodborne pathogens to fermentation. Food Control. 8:227-239.
Agerbaek, M., Gerds, L.U and Richelsen, B. 1995. Hypocholesterolaemic effect of
a new fermented milk product in healthy middle-aged man. European J.
Clin. Nutr. 49:346-352.
Agerholm-Larsen, L., Raben, A., Hansen, A.S., Manders, M and Astrup, A. 2000.
effect of eight week intake of probiotic milk products on risk factors for
cardiovascular diseases. European J. Clin. Nutr. 54:288-297.
Akalin, A.SD., Gönc, S and Dőzel, S. 1997. Influence of yogurt and acidophilus
yogurt on serum cholesterol levels in mice. J. Dairy Sci. 80:2721-2725.
Akoh, C.C. 1998. Structured lipids. In: Food lipids: Chemistry, Nutrition and
Bitechnology, ed. Akoh, C.C and Min, D.B. pp699-727. Marcel Dekker Inc.:
NewYork.
Alm, L. 1982. Effects of fermentationon B-vitamin content of milk in Sweden. J.
Dairy Sci. 65:353-359.
An, B.K., Nishiyama, H., Tanaka, K., Othani, S., Iwata, T., Tsutsumi, K and Kasai,
M. 1997. Dietary safflower phospholipid reduces liver lipids in laying hens.
Poult. Sci. 76:689-695.
Annison, E.F., Hill, K.J and Kennworthy, R. 1968. Volatile fatty acid in the
digestive tract of the fowl. Br. J. Nutr. 22:207-216.
Ansorena, D and Astiasarán, I. 2004. The use of linseed oil improves nutritional
quality of the lipid fraction of dry-fermented sausages. Food Chem. 87:69-
74.
AOAC. 1990. “Official methods of analysis.” 15th ed. Assoc. Offic. Anal. Chem.,
Arlington, VA.
105

106
Axelsson, L.T., Chung, T.C., Dobrogosz, W.J and Lindgren, S.E. 1989. Production
of a broad spectrum antimicrobial substance by Lactobacillus reuteri.
Microbiol. Ecol. of Health and Disease. 2:131-136.
Ayerza, R and Coates, W. 1999. An omega-3 fatty acid enriched chia diet: influence
on egg fatty acid composition, cholesterol and oil content. Can. J. of Anim.
Sci. 79:53-58.
Barnes, E.M., Impey, C.S and Cooper D.M. 1980. Manipulation of the crop and
intestinal microflora of the newly hatched chick. Am. J. Clin. Nutr. 33:2425-
2433.
Baucells, M.D., Crespo, N., Barroeta, A.C., Lopez-Ferrer, S and Grashorn, M.A.
2000. Incorporation of different polyunsaturated fatty acids into eggs. Poult.
Sci. 79:51-59.
Beal, J.D., Niven, S.J., Campbell, A and Brooks, P.H. 2002. The effect of
temperature on the growth and persistence of Salmonella in fermented liquid
pig feed. Int. J. of Food Microbiol. 79:99-104.
Bean, L.D and Leeson, S. 2003. Long-term effects of feeding flaxseed on
performance and egg fatty acid composition of brown and white hens. Poult.
Sci. 82:388-394.
Bernardeau, M., Vernoux, J.P and Gueguen, M. 2002. Safety and efficacy of
probiotic lactobacilli in promoting growth in post-waening swiss mice. Int.
J. of Food Microbiol. 77:19-27.
Bonestroo, M. H., de Wit, J.C., Kusters, B. J. M and Rombouts, F.M. 1993.
Inhibition of the growth of yeasts in fermented salads. Int. J. of Food
Microbiol. 17(4):311-320.
Bottazzi, V. 1988. An introduction to rod-shaped lactic acid bacteria. Biochimie.
70:303-315.
Bragagnolo, N and Rodriguez-Amaya, D.B. 2003. Comparison of the cholesterol
content of Brazilian chicken and quail eggs. J. of Food Composition and
Analysis. 16:147-153.
Brooks, P.H., Beal, J.D and Niven, S. 2001. Liquid feeding of pigs: potential for
reducing environmental impact and for improving productivity and food
safety. Recent advances in Animal Nutrition in Australia. 49-63, Armidale,
Australia.
106

107
Brooks, P.H. Liquid feeding as a means to promote pig health. 2003. In proceeding
of the London Swine conference-Maintaining Your Competitive Edge, 9-10
April 2003, 83-103pp.
Brooks, P.H., Beal, J.D., Niven, S and Demečková. 2003. Liquid feeding of pigs. II.
Potential for improving pig health and food safety. Anim. Sci. Papers and
Reports. 21:23-39.
Buck, L.M and Gilliland, S.E. 1994. Comparisions of freshly isolated strain of
Lactobacillus acidophilus of human intestinal origin for ability to assimilate
cholesterol during growth. J. Dairy Sci. 77:2925-2933.
Burczak, J.D., McNaughton, J.L and Kellogg, T.F. 1979. Cholesterol metabolism in
poultry, Gallus Domesticus: fecal neutral sterol and bile acid excretion.
Comp. Biochem. Physiol. 66B:385-389.
Canibe, N and Jensen, B.B. 2003. Fermented and nonfermented liquid feed to
growing pigs: Effect on aspects of gastrointestinal ecology and growth
performance. J. of Anim. Sci. 81:2019-2031.
Caplice, E and Fitzgerald, G.F. 1999. Foods fermentations: role of microorganism
in food production and preservation. Int. J. of Food Microbiol. 50:131-149.
Carrillo-Domínguez, S., Carranco-Jauregui, M.E., Castillo-Domínguez, R.M.,
Castro-González, M.I., Avila-González, E and Pérez-Gil, F. 2005.
Cholesterol and n-3 and n-6 fatty acid content in eggs from laying hens fed
with red crab meal (Pleuroncodes planipes). Poult. Sci. 84:167-172.
Caston, L.J., Squires, E.J and Leeson, S. 1994. Hen performance, egg quality, and
the sensory evaluation of eggs from SCWL hens fed dietary flax. Can. J. of
Anim. Sci. 74:347-353.
Catherine, S., Colette, D., Mairead, C., Collins, J. K., Gerald, F and Ross, R. P.
2003. In Handbook of fermented functional foods, ed. Farnworth, E. R, pp
27-58. New York: CRC Press.
Chen, M and Bergman, C.J. 2005. A rapid procedure for analysing rice bran
tocopherol, tocotrienol and γ-oryzanol contents. J. of Food Composition and
Analysis. 18: 319-331.
Choct, M., Hughes, R.J and Bedford, M.R. 1999. Effects of a xylanase on
individual bird variations, starch digestion throughout the intestinal, and
ileal and caecal volatile fatty acid production in chickens fed wheat. British.
Poult. Sci. 40:419-422.
107

108
Chowdhury, S.R., Chowdhurry, S.D and Smith, T.K. 2002. Effects of dietary garlic
on cholesterol metabolism in laying hens. Poult. Sci. 81:1856-1862.
Chowdhury, S.R., Sarker, D.K., Chowdhury, S.D., Smith, T.K., Roy, P.K and
Wahid, M.A. 2005. Effects of dietary tamarind on cholesterol metabolism in
laying hens. Poult. Sci. 84:56-60.
Christine, P.M., Huss, H.H and Gram, L. 1999. Characterization of lactic acid
bacteria isolated from a Thai low-salt fermented fish product and the role of
garlic as substrate for fermentation. Int. J. of Food Sci. 46:219-229.
Coeuret, V., Gueguen, M and Vernoux, J.P. 2004. Numbers and strains of
lactobacilli in some probiotic products. Int. J. of Food Microbiol. 97:147-
156.
Cole, D.J., Beal, R.M and Luscombe, J.R. 1968. The effect on performance and
bacteria flora of lactic acid, propionic acid, calcium propionate and calcium
acrylate in the drinking water of weaned pigs. Vet. Rec. 83:459-464.
Collins, J. K., Thornton, G and O’Sullivan, G. O. 1998. Selection of probiotic
strains for human application. Int. Dairy J. 8:487-490.
Condon, S. 1983. Aerobic metabolism of LAB. Irish J. of Food Sci. and Technol.
7:15-25.
Condon, S. 1987. Responses of lactic acid bacteria to oxygen. FEMS Microbiol.
Rev. 46:269-280.
Cook, F and Briggs, G, M. 1973. Nutritive value of eggs. In Egg science and
technology, ed. Stadelman, W.J and Cotterill, O.J, pp 91-109. Westport,
Connecticut: The AVI Publishing Company.
Cotterill, O.J and Glauert, J.L. 1979. Nutrient values for shell, liquid/frozen, and
dehydrated eggs derived by linear regression analysis and conversion
factors. Poult. Sci. 58:131-134.
Cottyn, B.G and Bouque, C.V. 1968. Rapid method for the gas chromatographic
determination of VFA in rumen fluid. J.Agri. Food Chem. 16:105-107.
Cox, N.A., Davis, B.H., Watts, A.B and Colmer, A.R. 1972. Salmonella in the
laying hen. 2. The effect of simulated digestive tract pH levels on the
survival of the three species of Salmonella. Poult. Sci. 51:1268-1270.
d’Mello, J.P.F. 2004. Microbiology of animal feeds. In Assessing quality and safety
of animal feeds, ed. Jutzi, S, pp 89-105. Rome: FAO.
108

109
Daeschel, A.M. 1989. Antimicrobial substances from lactic acid bacteria for use as
food preservatives. Food Technol. 43:164.
Daly, C., Sandine, W.E and Elliker, P.R. 1993. Interactions of starter cultures and
food bone pathogens. J. Milk Food Technol. 25:349-357.
De Man, J.D., Rogosa, M.A and Sharpe, M.E. 1960. A medium for the cultivation
of lactobacilli. J. Appl. Bact. 23:130-135.
Demecková, V., Kelly.D., Coutts.A.G.P., Brooks.P.H and Campbell.A. 2002. The
effect of fermented liquid feeding on the faecal microbiology and colostrum
quality of farrowing sows. Int. J. of Food Microbiol. 79:85-97.
de Simon, C., Vesely, R., Salvadori, B and Jirillo, E. 1993. The role of probiotic in
modulation of the immune system in man and in animals. Int. J.
Immunother. 9:23-28.
de Vuyst, L and Vandamme, E.J. 1994. Antimicrobial potential of lactic acid
bacteria. In. de Vuyst, L and Vandamme, E.J, eds. Bacteriocin of lactic acid
bacteria. Glasgow, United Kingdom: Blackie Academic and Professional.
91-142.
Dibner, J.J and Richards, J.D. 2005. Antibiotic growth promoters in agriculture:
History and mode of action. Poult. Sci. 84:634-643.
Doores, S. 1993. Organic acids. In: Organic Acids, ed. Davidson , P.M and Branen,
A.L , pp95-136. Marcel Dekker, New York.
du Toit, M., Franz, C.M.A.P., Dicks, L.M.T., Schillinger, U., Haberrer, P., Warlies,
B., Ahrens, F Holzapfel, W.H. 1998. Characterization and selection of
probiotic Lactobacilli for a preliminary minipig feeding trial and their effect
on serum cholesterol levels, faeces pH and faeces moisture content. Int. J. of
Food Microbiol. 40:93-104.
Earnshaw, R.G. 1992. Probiotics: A General Review. In: The Lactic Acid Bacteria
in Health and Disease, ed. Wood Brian, J.B, pp151-170. United Kingdom:
Academic Press.
El Jalil, M.H., Faid, M and Elyachioui, M. 2001. A biotechnological process for
treatment and recycling poultry wastes manure as a feed ingredient. Biomass
and Bioenergy. 21:301-309.
109

110
Elkin, R.G., Yan, Z.H., Zhong, Y., Donkin, S.S., Buhman, K.K., Story, J.A., Turek.
J.J., Porter Jr, R.E., Anderson, M., Homan, R and Newton, R.S. 1999. Select
3-Hydroxy-3-Methylglutaryl-Coenzyme A Reductase inhibitors vary in their
ability to reduce egg yolk cholesterol levels in laying hens through alteration
of hepatic cholesterol biosynthesis and plasma VLDL composition. The J. of
Nutr. 129:1010-1019.
Elmore, J.S., Cooper, S.L., Enser, M., Mottram, D.S., Sinclair, L.A., Wilkinson,
R.G and Wood, J.D. 2005. Dietary manipulation of fatty acid composition in
lamb meat and its effect on the volatile aroma compounds of grilled lamb.
Meat Sci. 69:233-242.
Esquerra, R.G and Leeson, S. 2000. Effect of feeding hens regular or deodorized
menhaden oil on production parameters, yolk fatty acid profile, and sensory
quality of eggs. Poult. Sci. 79:1597-1602.
FAO/WHO. 2001. Food and Agriculture Organization of the United Nations/World
Health Organization.
Farnworth, E.R and Mainville, I. 2003. Kefir: a fermented milk product. In
Handbook of fermented functional foods, ed. Farnworth, E.R, pp77-112,
New York: CRC Press.
Fernandez, M.L., Yount, N.Y and Namara, D.J.M.C. 1990. Whole body and hepatic
cholesterol synthesis rates in the guinea-pig: Effect of dietary fat quality.
Biochimica et Biophysica Acta. 1044:340-348.
Ferrier, L.K., Caston, L., Leeson, S., Squires, E.J., Celi, B., Thomas, L and Holub,
J. 1992. Changes in serum lipids and platelet fatty acid composition
following consumption of eggs enriched in alpha-linolenic acid (LnA). Food
Research Int. 25:263-268.
Foo, H.L., Loh., T.C., Law, F.L., Lim, Y.Z., Kufli, C.N and Rusul, G. 2003. Effects
of feeding Lactobacillus plantarum I-UL4 isolated from Malaysian Tempeh
on growth performance faecal flora and lactic acid bacteria and plasma
cholesterol concentrations in postweaning rats. Food Sci. and Biotechnol.
12:403-408.
Fooks, L.J and Gibson, G.R. 2002. In-vitro investigations of the effect of probiotics
and prebiotics on selected human pathogens. FEMS Microbiol. Ecology.
39:67-75.
Forestier, C., de Champs, C., Vatoux, C and Joly B. 2001. Probiotic activities of
Lactobacillus casei rhamnosus: in-vitro adherence to intestinal cells and
antimicrobial properties. Research in Microbiol. 152:167-173.
110

111
Frankin, M.A., Mathew, A.G., Vickers, J.R and Clift, R.A. 2002. Characterization
of microbial populations and volatile fatty acid concentrations in the
jejunum, ileum and caecum of pigs weaned at 17 vs 24 days of age. J. Anim.
Sci. 80:2904-2910.
Fransen, N.G., Urlings, A.P., Bijker, P.G.H and van Logtestijn, J.G. 1998.
Fermentation of aerobically activated pig slaughterhouse sludge for animal
feed purposes. Bioresource Technol. 65:145-150.
Fujiwara, S., Hashiba, H, Hirota, T., Forstner J.F. 1997. Proteinaceous factors in
culture supernatant fluids of bifidobacteria which prevents the binding of
enterotoxigenic Escherichia coli to gangliotetraosylceramide. Appl. Envin.
Microbiol. 63:506-512.
Fuller, R. 1989. Probiotics in man and animal. J. Appl. Bacteriol. 66:365-378.
Fuller, R. 1999. Probiotic for farm animals. In Probiotics: A critical review, ed
Tannock, G. W, pp 15-22. New Zealand: Horizon Scientific Press.
Gallaher, D. D., Stallings, W. H., Blessing, L.L., Busta, F.F and Brady, L. J. 1996.
Probiotics, caecal microflora and aberrant crypts in the rat colon. J. Nutr.
126:1362-1371.
Geary, T.M., Brook, P.H.M., Morgan, D.T., Campbell, A.C and Russell, P.J. 1996.
Performance of weaner pigs fed ad libitum with liquid feed at different dry
matter concentrations. J.Sci. Food Agric. 72:17-24.
Gilliland, S.E. 1985a. Concentrated starter cultures. In Bacteria starter cultures for
foods, ed. Gilliland, S.E, pp145-158. Boca Raton, FL: CRV Press.
Gilliland, S.E., Nelson, C.R and Maxwell, C. 1985b. Assimilation of cholesterol by
Lactobacillus acidophilus. Appl. Environ. Microbiol. 49:377-381.
Goh, Y.M. 2002. Dietary manipulations using oil palm (Elaeis guineensis) fronds to
increase the unsaturated fatty acid content of mutton under tropical
conditions. PhD, Thesis, Universiti of Putra Malaysia, Malaysia, pp142.
Gonzalez-Esquerra, R and Leeson, S. 2000. Effects of feeding hens regular or
deodorized menhaden oil on production parameters, yolk fatty acid profile,
and sensory quality of eggs. Poult. Sci. 79:1597-1602.
Gurr, M.I., Harword, J.L and Frayn, K.N. 2002. Lipid biochemistry. In: Fatty acid
structure and metabolism, ed. Gurr, M.I., Harword, J.L and Frayn, K.N,
pp25-40. United Kingdom:Blackwell Science
111

112
Hammes, W.P and Hertel, C. 1998. New developments in meat starter cultures.
Meat Sci. 49:S125-S138.
Hammes, W.P. 1990a. Bacterial starter cultures in food production. Food
Biotechnol. 4:383-397.
Hammes, W.P., Bantleon, A., and Min, S. 1990b. Lactic acid bacteria in meat
fermentation. FEMS Microbiol. Review. 87:165-174.
Hansen, E.B. 2002. Commercial bacterial starter cultures for fermented foods of the
future. Int. J. of Food Microbiol. 78:119-131.
Hansen, H.S. 1986. The essential nature of linoleic acid in mammals. Trends in
Biochem. Sci. 11:263-265.
Havenaar, R. and Huis in’t veld, J.H.J 1992. Probiotics: A General Review. In: The
Lactic Acid Bacteria in Health and Disease, ed. Wood Brian, J.B, pp151-
170. United Kingdom: Academic Press.
Heres, L., Engel, B., Urlings, H.A.P., Wagenaar, J.A and van Knapen, F. 2004.
Effect of acidified feed on susceptibility of broiler chickens to intestinal
infection by Campylobacter and Salmonella. Veterinary Microbiol. 99:259-
267.
Heres, L., Engel, B., van Knapen, F., de Jong M.C.M., Wagenaar, J.A and Urlings,
B.A.P. 2003a. Fermented liquid feed reduces susceptibility of broilers for
salmonella enteritidis. Poult. Sci. 82:603-611.
Heres, L., Engel, B., van Knapen, F., Wagenaar, J.A and Urlings, B.A.P. 2003b.
Effect of fermented feed on the susceptibility for Campylobacter jejuni
colonization in broiler chickens with and without concurrent inoculation of
Salmonella enteritidis. Int. J. of Food Mcrobiol. 87:75-86.
Hirsh, D.C. 1990. The alimentary canal as a microbial habitat. In Review of
Veterinary Microbial, ed. Biberstein, E.L and Zee, Y.C, pp93-97. United
State of America:Blackwell Scientific Publication.
Højberg, O., Canibe, N., Knudsen, B and Jensen, B.B. 2003. Potential rates of
fermentation in digesta from the gastrointestinal tract of pigs: effects of
feeding fermented liquid feed. Applied and Environmental Microbiol.
69:408-418.
Holley, R.A and Blaszyk, M. 1998. Antibiotic challenge of meat starter cultures and
effects upon fermentations. Food Research Int. 30:513-522.
112

113
Holzapfel, W.H. 1997. Use of starter cultures in fermentation on a household scale.
Food Control. 8:241-258.
Holzapfel, W.H. 2002. Appropriate starter culture technologies for small-scale
fermentation in developing countries. Int. J. of Food Microbiol. 75:197-212.
Holzapfel, W.H., Geisen, R., Schillinger, U. 1995. Biological preservation of foods
with reference to protective cultures, bacteriocins and food-grade enzymes.
Int. J. of Food Microbiol. 24:343-362.
Holzapfel, W.H., Haberer, P., Snel, J., Schillinger, U and Huis in’t Veld, Jos. H.J.
1998. Overview of gut flora and probiotics. Int. J. of Food Microbiol. 41:85-
101.
Hugas, M., Garriga, M and Aymerich. 2003. Functionality of Enterococci in meat
products. Int. J. of Food Microbiol. 88:223-233.
Hume, M.E., Corrier, D.E., Ambrus, S., Hinton, J.A and Deloach, J.R. 1993a.
Effectiveness of dietary propionic acid in controlling Salmonella
typhimurium colonization in broiler chicks. Avian Dis. 37:1051-1056.
Hume, M.E., Corrier, D.E., Ivie, G.W and Deloach, J.R. 1993b. Metabolism of
[14C] propionic acid in broiler chicks. Poult. Sci. 72:786-793.
Immerseel, F.V., Buck, J.D., Pasmans, F., Velge, P., Bottreau, E., Fievez, V.,
Haesebrouck, F and Ducatelle. 2003. Invasion of Salmonella enteritidis in
avian intestinal epithelial cells in vitro is influenced by short-chain fatty
acids. Int. J. of Food Microbiol. 85:237-248.
Iqbal, S., Bhanger, M.I and Anwar, F. 2005. Antioxidant properties and components
of some commercially available varieties of rice bran in Pakistan. Food
Chem. 93:265-272.
Ito, M.K and Simpson, K.L. 1996. The biosynthesis of 3 fatty acids from 18: 2 6
in Artemia spp. Comparative Biochemistry and Physiology Part B: Biochem.
and Molecular Biol. 115:69-76.
Izat, A.L., Tidwell, N.M., Thomas, R.A., Reiber, M.A., Adams, M.H., Colberg, M
and Waldroup, P.W. 1990. Effects of a buffered propionic acid in diets on
the perfrmance of broiler chickens and on microflora of the intestine and
carcass. Poult. Sci. 69:818-826.
Jack, R.W., Tagg, J.R and Ray, B. 1995. Bacteriocin of gram positive bacteria.
Microbiol. Rev. 59:171-200.
113

114
Jay, J.M. 2000. Fermentation and fermented dairy products. In Modern food
microbiology, ed. Heldman,D.R, pp 113-128. Gaithersburg, Maryland: An
Aspen publication.
Jin, L.Z., Ho, Y.W., Abdullah, N and Jalaludin. 1998a. Growth performance,
intestinal microbial populations, and serum cholesterol of broilers fed diets
containing Lactobacillus cultures. Poult. Sci. 77:1259-1265.
Jin, L.Z., Ho, Y.W., Abdullah, N and Jalaludin. 2000. Digestive and bacterial
enzyme activities in broilers fed diets supplemented with Lactobacillus
cultures. Poult. Sci. 79:886-891.
Jin, L.Z., Ho, Y.W., Abdullah, N., Ali, M.A and Jalaludin, S. 1998b. Effects of
adherent Lactobacillus cultures on growth, weight of organs and intestinal
microflora and volatile fatty acids in broilers. Anim. Feed Sci. and Technol.
70:197-209.
Johansson, M.L., Nobaek, S., Berggren, A., Nyman, M., Björck, I., Ahrné, S.,
Jeppsson, B and Molin, G. 1998. Survival of Lactobacillus plantarum DSM
9843 (299v) and effect on the short-chain fatty acid content of faeces after
ingestion of a rose-hip drink with ferment oats. Int. J. of Food Microbiol.
42:29-38.
Joshi, V.K and Sandhu, D.K. 1996. Preparation and evaluation of an animal feed
byproduct produced by solid-state fermentation of apple pomace.
Bioresource Technol. 56:251-255.
Kailasapathy, K and Chin, J. 2000. Survival and therapeutic potential of probiotic
organisms with reference to Lactobacillus acidophilus and Bifidobacterium
spp. Immunol. Cell Biol. 78:80-88.
Kamra, D.D and Srivastava, S.K. 1994. Effect of sugarcane molasses on
fermentation of pig faeces and wheat straw inoculated with lactic-acid
producing bacteria. Bioresource Technol. 47:87-88.
Kanaya, Y., Doi, T., Sasaki, H., Fujita, A., Matsuno, S., Okamoto, K., Nakano, Y.,
Tsujiwaki, S., Furuta, H., Nishi, M., Tsuno, T., Taniguchi, H and Nanjo, K.
2004. Rice bran extract prevents the elevation of plasma peroxylipid in
KKAy diabetic mice. Diabetes Research and Clinical Practice. 66S: S157-
S160.
Kandler, O and Weiss, N. 1986. Regular, nonsporing Gram-positive rods. In P. A.
H. Sneath, N. S. Mair, M. E. Sharpe and J. G.Holt, Bergey’s Manual of
Systematic Bacteriol. 2:1208-1234.
114

115
Kandler, O. 1983. Carbohydrate metabolism in lactic acid bacteria. Antonie van
Leeuwenhoek. 49:209-224.
Kawase, M., Hashimoto, H., Hosoda, M., Morita, H and Hosono, A. 2000. Effect of
administration of fermented milk containing whey protein concentrate to
rats and healthy men on serum lipids and blood pressure. J. Dairy Sci.
83:255-263.
Kawashima, T. Food safety issues in the livestock industry. 2004. In proceeding of
the 11th
Animal Science Congress held in Malaysia 5-9th
September 2004,
edited by Wong, H.K., Liang, J.B., Jelan, Z.A and Ho, Y.W, pp58-62.
Kheadr, E., Bernoussi, N., Lacroix, C and Fliss, I. 2004. Comparison of the
sensitivity of commercial strains and infant isolates of bifidobacteria to
antibiotics and bacteriocins. Int. Dairy J. 14:1041-1053.
Kherrati, B., Faid, M., Elyachioui, M and Wahmane, A. 1998. Process for recycling
slaughterhouse wastes and by-products by fermentation. Bioresource
Technol. 63:75-79.
Kim, J.H., Hong, S.T., Lee, H.S and Kim, H.J. 2004. Oral administration of
Pravastatin reduces egg cholesterol but not plasma cholesterol in laying
hens. Poult. Sci. 83:1539-1543.
Kim, J.S and Godber, J.S. 2001. Oxidative stability and vitamin E levels increased
in rest ructured beef roast with added rice oil. J. of Food Quality. 24:17-26.
Klaenhammer, T.R. 1988. Bacteriocins of lactic acid bacteria. Biochimie. 70:337-
349.
Koenen, M.E., Kramer, J., van der Hulst, R., Heres, L., Jeurissen, S.H.M and
Boersma, W.J.A. 2004. Immunomodulation by probiotic lactobacilli in layer
and meat type chickens. British Poult. Sci. 45:355-366.
Krings, U., El-Saharty, Y.S., El-Zeany, B.A., Pabel, B and Berger, R.G. 2000.
Antioxidant activity of extracts from roasted wheat germ. Food Chem.
71:91-95.
Kunkee, R.E., 1991. Some role of malic acid in the malolactic fermentation in
winemaking. FEMS Microbiol. Rev. 88:55-72.
Kyle, D.J. 2002. Essential fatty acids as food additives. In Food additives, ed
Brenen, A.L., Davidson, P.M., Salminen, S and Thorngate, J.H, pp 277-309.
New Yolk: Marcel Dekker.
115

116
Langhendries, J.P, Detry, J, van Hees, J., Lamboray, J.M, Darimont, J., Mozin, M.J,
Secretin, M.C and Senterre, J. 1995. Effects of fermented infant formula
containing viable bifidobacteria on the fecal flora composition and pH of
health full-term infants. J. Pediatr Gastroenterol. Nutr. 177-181.
Lauritzen, L., Hansen, H.S., Jørgensen, M.H and Michaelsen, K.F. 2001. The
essentiality of long chain n-3 fatty acids in relation to development and
function of the brain and retina. Progress in Lipid Research. 40:1-94.
Lawlor, P.G., Lynch, P.B., Gardiner, GE., Cardiner, G.E., Caffrey, P.J and
O’Doherty, J.V. 2002. Effect of liquid feeding weaned pigs on growth
performance to harvest. J. of Anim. Sci. 80:1725-1735.
Lee, Y. K and Salminen, S. 1995. The coming of age of probiotics. Trends Food
Sci. Technol. 6:241-245.
Leeson, S., Caston, L and Maclaurin, T. 1998. Organoleptic evaluation of eggs
produced by laying hens fed diets containing graded levels of flaxseed and
vitamin E. Poult. Sci. 77:1436-1440.
Leroy, F and de Vuyst, L.D. 2004. Lactic acid bacteria as functional starter cultures
for the food fermentation industry. Trends in Food Sci. and Technol. 15:67-
78.
Levin, M.S., Talkad, V.D., Gordon, J.I and Stenson, W.F. 1992. Trafficking of
exogenous fatty acids within Caco-2 cells. J. of Lipid Research. 33:9-19.
Lewis, N.M., Seburg, S and Flanagan, N.L. 2000. Enriched eggs as a source of N-3
polyunsaturated fatty acids for human. Poult. Sci. 79:971-974.
Li, J., Wetzel, M.D and O’Brien, P.J. 1992. Transport of n-3 fatty acids from the
intestine to retina in rats. J. of Lipid Research. 33:539-548.
Lindgren, S.E and Dobrogosz, W.J. 1990. Antagonistic activities of lactic acid
bacteria in food and feed fermentations. FEMS Microbiol. Review. 87:149-
164.
Liu, S.Q. 2003. Practical implications of lactate and pyruvate metabolism by lactic
acid bacteria in food and beverage fermentations. Int. J. of Food Microbiol.
83:115-131.
Loh, T.C., Foo, H.L., Lee, K.L., Lim, Y.Z and Kufli, C.N. 2003a. Effects of
fermented fruits on the growth performance, Sheeding of
Enterobacteriaceae and Lactobacilli in post-weaning pigs. Asian-Aust. J.
Anim. Sci. 16(11):1-5.
116
117
Loh, T.C., Foo, H.L., Tan, S.H., Goh, Y.M., Shukriyah, M.H and Kufli, C.N.
2003b. Effects of fermented products on performance, faecal pH,
Enterobacteriaceae and lactic acid bacteria counts and relationships, and
plasma cholesterol concentration in rats. J. of Anim. and Feed Sci. 12:633-
644.
Lucey, C.A and Condon, S. 1986. Active role of oxygen and NADH Oxidase in
growth and energy metabolism of Leuconostoc. J. of General Microbiol.
132:1789-1796.
Lücke, F. K. 2000. Utilization of microbes to process and preserve meat. Meat Sci.
56:105-115.
Luhman, C.M., Miller, B.G and Beitz, D.C. 1990. The effect of feeding lovastatin
and cholestipol on production and cholesterol content of eggs. Poult. Sci.
69:852-855.
March, B.E and Millan, M.C. 1990. Linoleic acid as a mediator of egg size. Poult.
Sci. 69:634-639.
Marounek, M., Suchorska, O and Savka, O. 1999. Effect of substrate and feed
antibiotics on in-vitro production of volatile fatty acids and methane in
caecal contents of chickens. Anim. Feed Sci. and Technol. 80:223-230.
Marteau, P and Rambaud, J. 1993. Potential of using lactic acid bacteria for therapy
and immunomodulation in man. FEMS Microbiol. Reviews. 12:207-220.
Maurice, D.V., Lightsey, S.F., Hsu, K.T., Gaylord, T.G and Reddy, R.V. 1994.
Cholesterol in eggs from different species of poultry determined by capillary
GLC. Food Chem. 50:367-372.
McHan, F and Shotts, E.B. 1992. Effect of feeding selected short chain fatty acids
on the in-vivo attachment of Salmonella typhimurium in chick ceca. Avian
Dis. 36:139-142.
Meluzzi, A., Sirri, F., Manfreda, G., Tallarico, N and Franchini, A. 2000. Effects of
dietary vitamin E on the quality of table eggs enriched with n-3 long-chain
fatty acids. Poul. Sci. 79:539-545.
Messen, W and de Vuyst, L. 2002. Inhibitary substances produced by lactobacilli
isolated from sourdough-a review. Int. J. of Food Microbiol. 72:31-34.
117

118
Mikkelsen, L.L and Jensen, B.B. 1997. Effects of fermented liquid feed (FLF) on
growth performance and microbial activity in the gastrointestinal tract of
weaned piglets. In: Laplace, J.P., Fevrier, C., Barbeau, A. (Eds.), Digestive
Physiol. In pigs. European Assoc. For Animal Production Saint Mals,
France 88:639-642.
Mikkelsen, L.L and Jensen, B.B. 1998. Performance and microbial activity in the
gastrointestinal tract of piglets feed fermented liquid feed at feeding. J.
Anim. Sci.7:211-215.
Mikkelsen, L.L and Jensen, B.B. 2000. Effects of fermented liquid feed on the
activity and composition of the microbiodata in the gut of pigs. Pigs News
and information. 21:59N-66N.
Miles, R.D. 1997. Dairy and Poultry Sciences, and Jacqueline P. Jacob, poultry
extension coordinator, Dairy and Poultry Sciences, Cooperative Extension
Service, Institute of Food and Agricultural Sciences, University of Florida,
Gainesville, 32611.
Milinsk, M.C., Murakami, A.E., Gomes, S.T.M., Matsushita, M and de Souza, N.E.
2003. Fatty acid profile of egg yolk lipids from hens fed diets rich in n-3
fatty acids. Food Chem. 83:287-292.
Minamiyama, Y., Takemura, S., Yoshikawa, T and Okada, S. 2003. Fermented
grains products, production, properties and benefits to health. Pathophysiol.
9:221-227.
Minato and Kudo. 1985. “Volatile Fatty Acid analyses”. In: Laboratory method.
Department of Anim. Sci, Universiti Putra Malaysia.
Mombelli, B and Gismondo, M.R. 2000. The use of probiotics in medical practice.
Int. J. of Antimicrobial Agents. 16:531-536.
Motarjemi, Y. 2002. Impact of small scale fermentation technology on food safety
in developing countries. Int. J. of Food Microbiol. 75:213-229.
Naidu, A.S., Biblack, W.R and Clemens, R.A. 1999. Probiotic spectra of lactic acid
bacteria (LAB). Crit. Rev. Food Sci. Nutr. 39:13-16.
Nanue, J.N., McGregor, J.U and Godber, J.S. 2000. Influence of high-oryzanol rice
bran oil on the oxidative stability of whole milk powder. J. of Dairy Sci.
83:2426-2431.
118

119
Nash, D.M., Hamilton, R.M.G and Hulan, H.W. 1995. The effect of dietary herring
meal on the omega-3 fatty acid content of plasma and egg yolk lipids of
laying hens. Canadian J. of Anim. Sci. 75:247-253.
Nettles, C.G and Barefoot, S.F. 1993. Biochemical and genetic characteristics of
bacteriocins in food-associated lactic acid bacteria. J. Food Prot. 56:338-
356.
Nisbet, D.J., Corrier, D.E., Ricke, S.C., Hume, M.E., Byrd II, J.A and DeLoach, J.
R. 1996. Caecal propionic acids as a biological indicator of the early
establishment of a microbial ecosystem inhibitory to Salmonella in chicks.
Anaerobe. 2:345-350.
Nisbet, D.J., Ricke, S.C., Scanlan, C.M., Corrier, D.E., Hollister, A.G and de
Loach, J. R. 1994. Inoculation of broiler chicks with a continuous-flow
derived bacterial culture facilitates early caecal bacterial colonization and
increases resistances to Salmonella typhimurium. J. Food Prot. 57:12-15.
Nout M. J. R. 2001. Fermented foods and their production. In: Fermentation and
Food Safety. pp1-20. Maryland: An Aspen Publication.
Nout, M.J.R and Motarjemi, Y. 1997. Assessment of fermentation as a household
technology for improving food safety: a joint FAO/WHO workshop. Food
Control. 8:221-226.
Osei, S.A., Asiamah, M and Atuahene, C.C. 1990. Effects of fermented cassava
peal meal on the performance of layers. Anim. Feed Sci. and Technol.
29:295-301.
Østergaard, A., Ben Embarek, P.K., Yamprayoon, J., Wedel-Neer-gaard, C., Huss,
H.H and Gram, L. 1998. Fermentation and spoilage of som-fak, a Thai low-
salt fish product. Trop. Sci. 38:105-112.
Ouwehand, A. C., Kirjavainen, P.V., Shortt, C and Salminen, S. 1999. Probiotics:
mechanism and establishment effects. Int. Dairy J. 9:43-52.
Owen, J. D and Mendoza, L. S. 1985. Enzymically hydrolysed and bacterially
fermented fishery products. J. Food Technol. 20:273-293.
Papamanoli, E., Tzanetakis, N., Litopoulou-Tzanetaki, E., Kotzekidou, P. 2003.
Characterization of lactic acid bacteria isolated from a Greek dry-fermented
sausage in respect of their technological and probiotic properties. Meat Sci.
65:859-867.
119

120
Patterson, J.A and Burkholder, K.M. 2003. Application of probiotics and probiotics
in poultry production. Poult. Sci. 82:627-631.
Pereira, D.I and Gibson, G.R. 2002. Cholesterol assimilation by lactic acid bacteria
and bifidobacteria isolated from the human gut. American Society for
Microbiol. 68: 4689-4693.
Pesti, G.M and Bakalli, R.I. 1998. Studies on the effect of feeding cupric sulfate
pentahydrate to laying hens on egg cholesterol content. Poult. Sci. 77:1540-
1545.
Prajapati, J.B and Nair, B.M. 2003. The history of fermented foods. In Handbook of
fermented functional foods ed. Farnworth, E.R, pp1-26. New York: CRC
Press.
Prescott, S.C and Dunn, C.G. 1982. The production of lactic acid. In Industrial
microbiology, ed. Dunn. C.G, pp304-331. New Yolk: Academic Press.
Privett, O.S., Bland, M.L and Schmidt, J.A. 1962. Studies on the composition of
egg lipid. J. Food Sci. 27;463-468.
Qureshi, A.A and Peterson, D.M. 2001. The combined effects of novel tocotrienols
and lovastatin on lipid metabolism in chickens. Atherosclerosis. 156:39-47.
Rajion, M.A. 1985. Essential fatty acid metabolism in the fetal and neonatal lamb.
PhD, Thesis, University of Melbourne, Australia, 351 pp.
Ray, B. 1992. Bacteriocins of starter culture bacteria as food preservatives: an
overview. In Food biopreservatives of microbial origin ed. Ray, B and
Daeschel, M, CRC Press, Boca Raton.
Ricke, S.C. 2003. Perspectives on the use of organic acids and short chain fatty
acids as antimicrobials. Poult. Sci. 82:632-639.
Rogelj, I. 1994. Lactic acid bacteria as probiotics. Mljekarstvo. 44:277-279.
Rokka, T., Alén, K., Valaja, J and Ryhänen, E.L. 2002. The effects of a Camelina
sativa enriched diet on the composition and sensory quality of hen eggs.
Food Research Int. 35:253-256.
Rolfe, R.D. 2000. The role of probiotics cultures in the control of gastrointestinal
health. The J. of Nutri. 130(2S):396S-402S.
Rolle, R and Satin, M. 2002. Basic requirements for the transfer of fermentation
technologies to developing countries. Int. J. of Food Microbiol. 75:181-187.
120

121
Ros, E. 2000. Intestinal absorption of triglyceride and cholesterol. Dietary and
pharmacological inhibition to reduce cardiovascular risk. Atherosclerosis.
151:357-379.
Ross, R.P., Morgan, S and Hill, C. 2002. Preservation and fermentation: past,
present and future. Int. J. of Food Microbiol. 79:3-16.
Rouanet, J.M., Laurent, C and Besancon, P. 1993. Rice bran and wheat bran:
selective effect on plasma and liver cholesterol in high-cholesterol fed rats.
Food Chem. 47:67-71.
Rubin, H.E. 1978. Toxicology model for a two-acid system. App. And Environ.
Microbiol. 36(4):623-624.
Salminen, S., Isolauri, E., Salminen, E. 1996. Clinical uses of probiotics for
stabilizing the gut mucosal barrier: successful strain and future challenges.
Antonie Leeuwenhoek. 70:347-358.
Salminen, S., Ouwehand, A.C and Isolauri, E. 1998. Clinical application of
probiotic bacteria. Int. Dairy J. 8:563-572.
Salminen, S., Ouwehand, A.C., Benno, Y and Lee, Y.K. 1999. Probiotics: how
should they be defined? Trends in Food Sci. and Technol. 10:107-110.
SAS. 1991. SAS Institute Inc., North Carolina, USA.
Scheinbach, S. 1998. Probiotics: Functionality and commercial status. Biotech.
Advances. 16(3): 581-608.
Schillinger, U. 1999. Isolation and identification of lactobacilli from novel-type
probiotic and mild yoghurts and their stability during refrigerated storage.
Int. J. of Food Microbiol. 47:79-87.
Schnürer, J and Magnusson, J. 2005. Antifungal lactic acid bacteria as
bioprevatives. Trends in Food Sci. and Technol. Article in press:1-9.
Schreiner, M., Hulan, H.W., Razzazi-Fazeli, E., Böhm, J and Iben, C. 2004.
Feeding laying hens seal blubber oil: Effects on egg yolk incorporation,
stereospecific distribution of n-3 fatty acids, and sensory aspects. Poult. Sci.
83:462-473.
Sharpe, M.E. 1981. The genus Lactobacillus. In.: Stolp, H., Truper, H.G., Balows,
A., Schelegel, H.G. (Eds.), The Procariotes. 2:1657-1679.
121

122
Shimakawa, Y., Matsubara, S., Yuki, N., Ikeda, M and Ishikawa, F. 2003.
Evaluation of Bifidobacterium breve strain yakult-fermented soymilk as
probiotic food. Int. J. of Food Microbiol. 81:131-136.
Silva, C. 1993. The use of elemental diets in radiation enteritidis. In, Uses of
elemental diets in clinical situations, ed. Bonous, G, pp122-134. Boca
Raton, FL: CRC Press.
Silva, M., Jacobus, N. V., Deneke, C. and Gorbach, S.L. 1987. Antimicrobial
substance from a human Lactobacillus strain. Antimicrob. Agents
Chemother. 31:1231-1233.
Sim, J.S., Kits, W.D and Bragg, D.B. 1984. Effetc of dietary saponin on egg
cholesterol level and laying hen performance. Canadian J. of Anim. Sci.
64:977-984.
Simonetti, P., Cantoni, C and Bernardi, G., de. 1982. Colour loss in cooked
sausages. Technologie Alimentary. 5:34-35.
Simopoulos, A.P. 2000. Human requirement for n-3 polyunsaturated fatty acids.
Poult. Sci. 79:961-970.
Stadelman, W.J and Cotterill, O.J. 1995. The nutritive value of the eggs. In Egg
Science and Technology, 4th
ed. Stadelman, W.J and Cotterill, O.J, pp 177-
194. New York: HAWORTH Food Product Press.
Stanton, C., Gardiner, G., Lynch, P.B., Collins, J.K., Fitzgerald, G and Ross. R.P.
1998. Probiotic cheese. Int. Dairy J. 8:491-496.
Stiles, M. E and Holzapfel, W.H. 1997. Review article: lactic acid bacteria of foods
and their current taxonomy. Int. J. Food Microbiol. 36:1-29.
Sullivan, L.O., Ross, R.P and Hill, C. 2002. Potential of bacteriocin-producing
lactic acid bacteria for improvements in food safety and quality. Biochimie.
84:593-604.
Surai, P.F ans Sparks, N.H.C. 2001. Designer eggs: from improvement of egg
composition to functional food. Trends in Food Sci. and Technol. 12:7-16.
Tagg, J.R., Dajani, A.S and Wannamaker, L.W. 1976. Bacteriocin of gram positive
Bacteria. Rev. 40:722-756.
Thomas, E.L and Pera, K.A. 1983. Oxygen metabolism of Streptococcus
mutans:Uptake of oxygen and release of superoxide and hydrogen peroxide.
J. of Bacteriol. 154:1236-1244.
122

123
Thunell, R.K and Sandine, W.E. 1985. Types of starter cultures. In Bacterial starter
cultures for foods, ed. Gilland, S.E, pp127-144. Boca Raton, Florida: CRC
Press.
Timmerman., H.M., Koning, C.J.M., Mulder, L., Rombouts, F.M and Beynen, A.C.
2004. Monostrain, multistrain and multi species probiotics-A comparisonof
functionality and efficacy. Int. Journal of Food Microbiol. 96:219-233.
Tortuero, F and Fernández, E. 1995. Effects of inclusion of microbial cultures in
barley-based diets fed to laying hens. Anim. Feed Sci. and Technol. 53:255-
265.
Tramer, J. 1996. Inhibitory effect of Lactobacillus acidophilus. Nature. 211:204-
205.
Urlings, H.A.P., Mul, A.J., vat’t Klooster, A.T., Bijker, P.G., van Logtestijn, J.G
and van Gils, L.G. 1993. Microbial and nutritional aspects of feeding
fermented feed (poultry by-pruducts) to pigs. Vet. Quart. 15:146-151.
van der Wielen, P.W.J.J., Biesterveld, S., Notermans. S., Hofstra, H., Urlings,
B.A.P and van Kanpen, F. 2000. Role of volatile fatty acids in development
of the caecal microflora in broiler chickens during growth. Applied and
Environmental Microbiol. 66:2536-2540.
van der Wielen, P.W.J.J., Biesterveld, S., Lipman, L.J.A and van Kanpen, F. 2001.
Inhibition of a glucose-limited sequencing fed-batch culture of Salmonella
enterica serovar enteritidis by volatile fatty acids representative of the ceca
of broiler chickens. Applied and Environmental Microbiol. 67:1979-1982.
van Winsen, R.L., Urling, B.A.P., Lipman, L.J.A., Snijders, J.M.A., Keuzenkamp,
D., Verheijden, J.H.M and van Knapen, F. 2001. Effect of fermented feed on
the microbial population of the gastrointestinal tracts of pigs. Applied and
Environmental Microbiol. 67:3071-3076.
van Winsen, R.L., Urlings, B.A.P and Keuzenkamp, D. 2002. Effects of fermented
feed on shedding of Enterobacteriaceae by fattening pigs. Vet. Microbiol.
87:267-276.
Vereecken, K.M and van Impe, J.F. 2002. Analysis and practical implementation of
a model for combined growth and metabolite production of lactic acid
bacteria. Int. J. of Food Microbiol. 73:239-250.
123

124
Visentainer, J.V., de Souza, N.E., Makota, M., Hayashi, C and Franco, M.R.B.
2005. Influence of diets enriched with flaxseed oil on the α-linolenic,
eicosapentaenoic and docosahexaenoic fatty acid in Nile tilapia
(Oreochromis niloticus). Food chem. 90:557-560.
Vuyst, L.D and Vandamme, E.J. 1994. Antimicrobial potential of lactic acid
bacteria. In Bacteriocins of lactic acid bacteria, 1st ed. Vuyst, L.D and
Vandamme, E.J., 91-142. Oxford: The Alden Press.
Watkins, B.A. 1995. The nutritive value of the eggs. In Egg Science and
Technology, 4th
ed. Stadelman, W.J and Cotterill, O.J, pp 177-194. New
York: HAWORTH Food Product Press.
Wessels, S., Axelsson, L., Hansen, E.B., Vuyst, L.D., Laulund, S., Lähteenmäki, L.,
Lindgren, S., Mollet, B., Salminen, S and von Wright, A. 2004. The lactic
acid bacteria, the food chain, and their regulation. Food Sci. and Technol.
15:498-505.
Wood, J.D., Richardson, Nute, G.R., Fisher, A.V., Campo, M.M., Kasapidou, E.,
Sheard, P.R and Enser, M. 2003. Effects of fatty acids on meat quality: a
review. Meat Sci. 66:21-23.
Zacconi, C., Bottazzi, V., Rebecchi, A., Bosi, E., Sarra, P.G and Tagliaferri, L.
1992. Serum cholesterol levels in axenic mice colonized with Enterococcus
faecium and Lactobacillus acidophilus. Microbiologica. 15:413-418.
124

125
APPENDICES
Appendix 1: Reported values for nutrient composition of eggs
Egg
Nutrients and units Whole White Yolk
Proximate
Solids, g 13.47 4.6 8.81
Calories 184 19 64
Crude protein (CP) (N X
6.25), g 6.6 3.88 2.74
Total lipids, g 6 - 5.8
Ash, g 0.55 0.26 0.29
Lipids
Fatty acids, g
Saturated, total 2.01 - 1.95
C8:0 0.027 - 0.027
C10:0 0.082 - 0.08
C12:0 0.027 - 0.026
C14:0 0.022 - 0.022
C16:0 1.37 - 1.31
C18:0 0.462 - 0.459
C20:0 0.022 - 0.022
Monounsaturated, total 2.53 - 2.5
C14:1 0.005 - 0.005
C16:1 0.214 - 0.211
C18:1 2.31 - 2.28
Polyunsaturated, total 0.73 - 0.72
C18:2 0.66 - 0.65
C18:3 0.011 - 0.014
C20:4 0.055 - 0.051
Cholesterol, g 0.213 - 0.213
Lecithin, g 1.27 - 1.22
Cephalin, g 0.253 - 0.241
125

126
Egg
Nutrients and units Whole White Yolk
Vitamins
A, IU 264 - 260
D, IU 27 - 27
E, mg 0.88 - 0.87
B12, ug 0.48 - 0.48
Biotin, ug 11 2.58 8.35
Choline, mg 237 0.46 238
Folic acid, mg 0.023 0.006 0.026
Inositol, mg 5.94 1.52 4.35
Niacin, mg 0.045 0.035 0.01
Pantothenic acid, mg 0.83 0.09 0.73
Pyridoxine, mg 0.065 0.008 0.057
Riboflavin, mg 0.18 0.11 0.07
Thiamine, mg 0.05 0.004 0.048
Minerals, mg
Calcium 29.2 3.8 25.2
Chlorine 96 66.1 29.9
Copper 0.033 0.009 0.024
Iodine 0.026 0.001 0.024
Iron 1.08 0.053 1.02
Magnesium 6.33 4.15 2.15
Manganese 0.021 0.002 0.019
Phosphorus 111 8 102
Potassium 74 57 17
Sodium 71 63 9
Sulfur 90 62 28
Zinc 0.72 0.05 0.66
Amino Acids, g
Alanine 0.38 0.24 0.14
Arginine 0.42 0.23 0.19
Aspartic Acid 0.65 0.4 0.25
Cystine 0.15 0.11 0.05
Glutamic acid 0.85 0.52 0.33
Histidine 0.16 0.09 0.07
126

127
Egg
Nutrients and units Whole White Yolk
Amino Acids, g
Glycine 0.22 0.14 0.08
Isoleucine 0.36 0.21 0.15
Leucine 0.57 0.33 0.24
Lysine 0.45 0.25 0.2
Methionine 0.21 0.15 0.06
Phenylalanine 0.35 0.23 0.12
Proline 0.26 0.15 0.11
Serine 0.5 0.27 0.23
Threonine 0.32 0.18 0.14
Tryptophan 0.11 0.07 0.04
Tyrosine 0.28 0.16 0.12
Valine 0.43 0.27 0.16
Source: Cotterill and Glauert, (1979) as cited by Stadelman and Cotterill (1995)
127

128
Appendix2: Preparation and calculation of chemicals for
analysis of crude protein (CP)
a. Receiver solution
Approximately ten gram of boric acid was weighed into a one litre volumetric flask
and topped up to one litre with distilled water. One hundred ml of bromocresol
green solution (100mg in 100ml methanol) was mixed homogeneously with 70ml of
methyl red solution (100mg in 100ml methanol) as indicator solution. The boric
acid described above was added to this indicator solution.
b. Alkali
Four hundred gram of sodium hydroxide (NaOH) was dissolved in one liter of
distilled water in a volumetric flask.
128

129
c. Standard (Ammonium sulphate, (NH4)2SO4)
Molecular weight,(NH4)2SO4= 132.14
N content in (NH4)2SO4 = N/(NH4)2SO4*100
= 28/132.14*100
= 21.19%
Protein content of (NH4)2SO4= 21.19*6.25
=132.4375%
The purity of (NH4)2SO4 is 99.5%, therefore protein content = 0.995*132.4375
= 131.77%
1M of (NH4)2SO4 = 132g/L
1mL of (NH4)2SO4, Protein = 0.132/mL*131
=17.3%
129

130
Appendix 3: Preparation of buffer and agar for microbiological analyses
a. Peptone water
Approximately 25g of powdered peptone water was weighed and transferred into a
one litre biker. One litre of distilled water was added into the biker. After powdered
peptone water well dissolved, it was divided into the Duran bottle and autoclave at
121oC for 15min.
b. Lactobacillus-Agar DE Man, ROGOSA and SHAPE (MRS) agar
Approximately 66.2g of powdered agar was weighed and transferred into one litre
conical flask. One liter of distilled water was added into the conical flask. The
powdered agar was vortex until well dissolved. The prepared agar was placed into
an autoclave. The operating condition was set at 118oC for 15min.
MRS agar, a media introduced by De Man, et al (1960) for the cultivation and
isolation of Lactobacillus species from all types of materials. The MRS culture
media contained polysorbate, acetate, magnesium and manganese, which were
known to act as special growth factors for lactobacilli.
130

131
c. Eosin-Methylene-blue Lactose Sucrose Agar (EMB) agar
Approximately 36g of powdered EMB agar was weighed and transferred into one
litre conical flask. One litre of distilled water was added into the conical flask. The
powdered agar was stirred until well dissolved. The prepared agar was placed into
an autoclave. The operating condition was set at 121oC for 15min.
EMB agar is a selective agar for the enumeration of pathogenic Enterobacteriaceae.
The lactose and sucrose contained in this medium allowed lactose and sucrose
negative Salmonella and Shigella to be distinguished from lactose positive coliform
organisms and lactose negative, sucrose positive accompanying flora (e.g. Proteus
vulgaris, Citrobacter, Aeromonas hydrophilia). The growth of undesired
accompanying microorganisms, particularly gram-positive bacteria, was largely
inhibited by the dyes present in the medium. The appearances of colonies and
microorganisms are shown in Appendix3C.
Appendix 4: The appearances of colonies and microorganisms
Appearance of colonies Microorganism
Translucent, amber coloured
Greenish, metallic sheen in reflected
light, blue-black center in transmitted
light
Colonies are larger than those of E. coli,
mucoid, confluent, gray-brown center in
transmitted light
Salmonella, Shigella
Escherichia coli
Enterobacter, Klebsiella and others
Source: Merck®, KGaA, Damstadt, Microbiological manual, 2000.
131

132
Appendix 5: Preparation of glassware and chemical for gas
chromatography
All chemicals, solvents and laboratory supplies used for total lipid extraction, VFA
extraction and cholesterol extraction and preparation of cholesterol methyl esters
and fatty acid methyl esters were of analytical grade. Teflon type lining materials
were used to avoid contact of samples, solvents and chemical supplies with rubber
or fat derivatives. Ten mg/L of buthylated hydroxytoulene (2,6-di-tert-butyl-p-
cresol) (Sigma Chemical Co., St. Louis, Missouri, USA) was added into the solvent
(petroleum ether, chloroform and chloroform methanol, from Merck®
KGaA,
Darmstadt, Germany) as antioxidant to prevent the destructive oxidation of UFA
during experimental manipulations and storage. Decon 90 (Decon Laboratories
Ltd., Sussex, U.K) was used to soak the glassware before scrubbed and then rinse
thoroughly with the tap water. Finally, all the washed glassware were soaked in
distilled water for overnight and re-rinsed the next day before dried in the oven at
60oC.
132
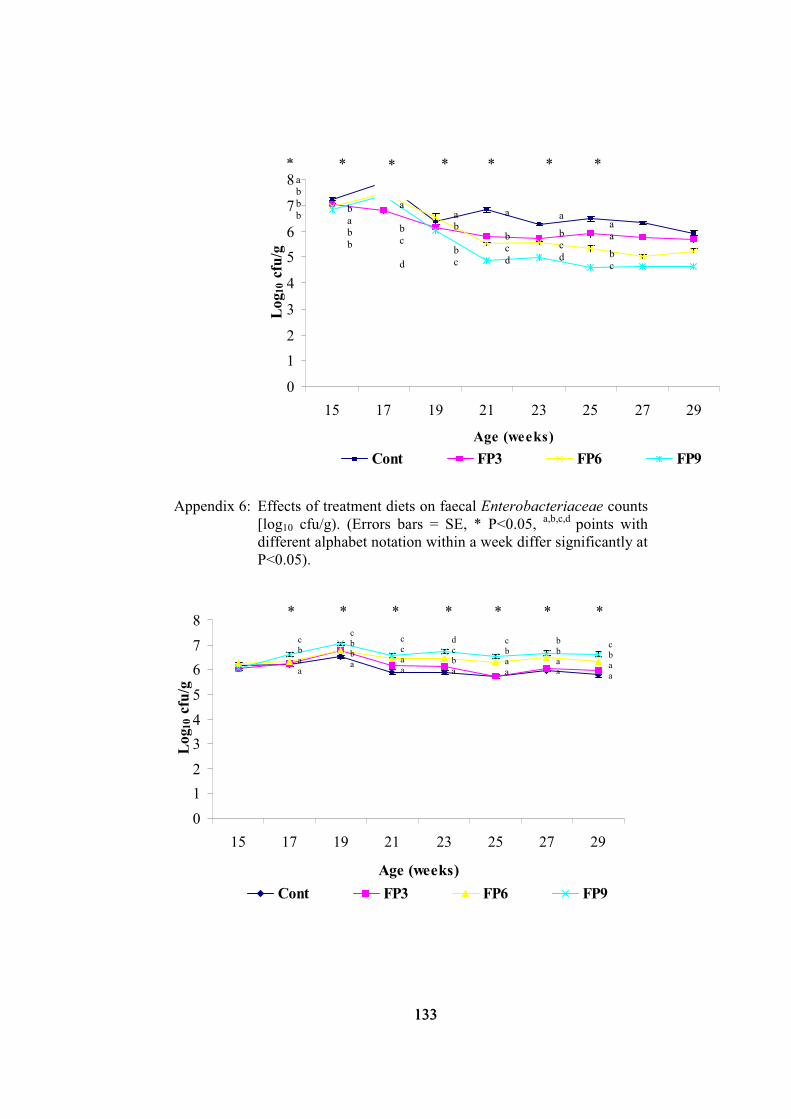
133
0
1
2
3
4
5
6
7
8
15 17 19 21 23 25 27 29
Age (weeks)
Log10 cfu/g
Cont FP3 FP6 FP9
Appendix 6: Effects of treatment diets on faecal Enterobacteriaceae counts
[log10 cfu/g). (Errors bars = SE, * P<0.05, a,b,c,d
points with
different alphabet notation within a week differ significantly at
P<0.05).
0
1
2
3
4
5
6
7
8
15 17 19 21 23 25 27 29
Age (weeks)
Log10 cfu/g
Cont FP3 FP6 FP9
* * * * * * * a b
b
b b
a b
b
a
b
c
d
a b
b
c
a
b
c
d
a
b c
d
a
a
b
c
* * * * * * *
c
b
a
a
c
b
b
a
c
c
a
a
d
c
b
a
c
b
a
a
b
b
a
a
c
b
a
a
133

134
Appendix 7: Effects of treatment diets on faecal LAB counts (log10 cfu/g). (Errors
bars = SE, * P<0.05, a,b,c,d
points with different alphabet notation
within a week differ significantly at P<0.05).
0
1
2
3
4
5
6
7
8
15 17 19 21 23 25 27 29
Age (weeks)
pH
Cont FP3 FP6 FP9
Appendix 8: Effects of treatment diets on faecal pH. (Errors bars = SE, *
P<0.05, a,b,c
points with different alphabet notation within a
week differ significantly at P<0.05).
Appendix 9: Preparation of VFA standards
a. Preparation of external standard
The VFA standard was prepared according to the procedure of Cottyn and Bouque
(1968) modified by Minato and Kudo (1985) as follows:
A. 11.45 ml acetic acid (AA), 7.46 ml propionic acid (PA), 9.27 ml iso-butyric acid
(IsBA) and 9.19 ml butyric acid (BA) were put in different 100 ml volumetric flasks
a
ab
b
c
a
ab
ab
b
a
a
ab
b
a
a
ab
b
a
a
a
b
a
b
b
b
a
a
a
b
* * * * * * *
134

135
and distilled water was added to make up to 100 ml. The concentrations of the
stock solutions are 2M for AA and 1M for PA, IsBA and BA.
B. 1.097 ml iso-valeric acid (IsoVA), 1.088 ml valeric acid (VA) and 1.262 ml 4-
methyl-n-valeric acid (4MV; internal standard) were put in different 100 ml
volumetric flasks. One drop of phenolphthalein indicator was added the acid which
was then neutralized by the addition of 2M NaOH (between 3 to 5 ml) and distilled
water was added to make up to 100ml. Neutralization is reached when the
colourless solution changes to pink. The concentrations of IsoVA, VA and 4MV
are 0.1M.
1 ml of each of the acid from A 10 ml of each of the acid from B were added to a
100 ml volumetric flask and diluted with distilled water to make up to 100 ml. The
final concentration of the acetic acid is 20 mM (0.02M) and that of the other acids is
10 mM (0.01M), respectively.
b. Preparation of internal standards
20 mM (0.02M) 4-methly-n-valeric acid was prepared by diluting 20ml of 0.1M
stock solution of 4-methyl-n-valeric acid from B with distilled water to make up to
100ml.
135

Appendix 10a:
Effects of treatm
ent diets on egg yolk fatty acid compositions in birds at 25 weeks of age
Fat
ty A
cid
Co
nt
Mea
n ±
SE
M
(mg/1
00
g)
%
FP
3
Mea
n ±
SE
M
(mg/1
00
g)
%
FP
6
Mea
n ±
SE
M
(mg/1
00
g)
%
FP
9
Mea
n ±
SE
M
(mg/1
00
g)
%
C1
4:0
7
2.5
a ± 2
.7
0.4
7
4.7
a ± 2
.4
0.4
7
8.7
ab±
3.1
0
.5
86
.7b±
4.7
0
.5
C1
6:0
4
28
4.0
a ± 1
42
.0
26
.0
43
75
.5ab
± 1
65
.0
25
.8
45
34
.8ab
± 1
06
.0
26
.6
47
81
.0b±
14
2.0
2
6.4
C1
6:1
n-9
5
39
.1ab
± 2
2.9
3
.3
46
9.9
a ± 3
4.3
2
.8
58
8.9
b±
41.1
3
.4
55
9.7
ab±
30.2
3
.1
C1
8:0
ns
12
74
.4±
32
.7
7.7
1
38
0.1
± 7
0.1
8
.1
12
65
.2±
28
.4
7.4
1
31
3.8
± 4
5.1
7
.2
C1
8:1
n-9
ns
74
06
.4±
31
1.0
4
4.9
7
31
7.0
± 3
39
.0
43
.1
73
66
.9±
95
.6
43
.1
76
55
.5±
26
8.0
4
2.2
C1
8:2
n-6
2
06
8.3
a ± 1
17
.0
12
.5
24
02
.3ab
± 1
34
.0
14
.1
23
64
.2ab
± 1
31
.0
13
.8
27
66
.1b±
15
0.0
1
5.3
C1
8:3
n-3
4
5.8
a ± 2
.9
0.3
5
2.7
a ± 3
.4
0.3
5
6.5
a ± 3
.5
0.3
7
0.4
b±
4.9
0
.4
C2
0:1
n-9
ns
63
.1±
2.6
0
.4
57
.5±
2.4
0
.3
63
.5±
1.1
0
.4
64
.0±
4.0
0
.4
C2
0:2
n-6
ns
33
.6±
6.2
0
.2
31
.8±
1.5
0
.2
32
.2±
5.4
0
.2
39
.2±
8.1
0
.2
C2
0:4
n-6
4
15
.2ab
± 2
5.4
2
.5
42
2.1
a ± 2
8.2
2
.5
35
8.3
bc ±
12.5
2
.1
35
0.8
c ± 1
1.5
1
.9
DP
A,
C2
2:5
n-3
1
31
.6a ±
7.9
0
.8
10
5.3
a ± 1
3.4
0
.6
10
0.8
b±
18.9
0
.6
51
.4c ±
9.5
0
.3
DH
A,
C2
2:6
n-3
1
56
.9a ±
9.5
1
.0
29
2.3
b±
22.8
1
.7
28
2.4
b±
26.6
1
.7
39
1.8
c ± 1
9.8
2
.2
To
tal
SF
A
56
30
.9a ±
17
2.0
3
4.1
5
83
0.3
ab±
21
7.0
3
4.3
5
87
8.7
ab±
12
8.0
3
4.4
6
18
1.5
b±
17
9.0
3
4.1
To
tal
UF
A n
s 1
08
60
.1±
361
.0
65
.9
11
151
.1±
427
.0
65
.7
11
213
.6±
208
.0
65
.6
11
949
.0±
397
.0
65
.9
To
tal
MU
FA
ns
80
08
.6±
32
1.0
4
8.6
7
84
4.5
± 3
54
.0
46
.2
80
19
.3±
10
7.0
4
6.9
8
27
9.3
± 2
69
.0
45
.7
To
tal
PU
FA
n-3
3
34
.4a ±
10
.4
2.0
4
50
.4bc ±
31.6
2
.7
43
9.6
b±
26.0
2
.6
51
3.6
c ± 1
6.6
2
.8
To
tal
PU
FA
n-6
2
48
3.6
a ± 1
22
.0
15
.1
28
24
.4ab
± 1
42
.0
16
.6
27
22
.5ab
± 1
43
.0
15
.9
31
16
.9b±
16
1.0
1
7.2
Over
all
To
tal n
s 1
64
91
.0±
526
16
981
.4±
640
.0
1
70
92
.4±
326
.0
1
81
30
.5±
563
.0
n-6
: n
-3 r
atio
7.4
6.3
6.2
6.1
UF
A :
SF
A r
atio
1.9
1.9
1.9
1.9
PU
FA
: S
FA
rat
io
0
.5
0
.6
0
.5
0
.6
Val
ues
wit
h d
iffe
rent
sup
ersc
ripts
wit
hin
row
dif
fer
signif
ican
tly a
t P
<0.0
5;
n
s No s
ignif
ican
t dif
fere
nce
136

Appendix 10b: Effects of treatm
ent diets on egg yolk fatty acid compositions in birds at 26 weeks of age
Fat
ty A
cid
Co
nt
Mea
n ±
SE
M
(mg/1
00
g)
%
FP
3
Mea
n ±
SE
M
(mg/1
00
g)
%
FP
6
Mea
n ±
SE
M
(mg/1
00
g)
%
FP
9
Mea
n ±
SE
M
(mg/1
00
g)
%
C1
4:0
ns
80
.8±
1.8
0
.4
82
.4±
3.4
0
.5
77
.8±
3.6
0
.4
84
.7±
1.6
0
.4
C1
6:0
ns
47
07
.4±
97
.9
25
.9
46
51
.4±
13
6.0
2
5.8
4
64
3.7
± 9
8.1
2
5.6
4
87
4.0
± 5
2.9
2
5.8
C1
6:1
ns n-9
5
68
.1±
23
.5
3.1
5
83
.1±
37
.6
3.2
4
97
.6±
31
.7
2.7
5
46
.3±
37
.4
2.9
C1
8:0
ns
14
62
.2±
11
.8
8.0
1
38
2.8
± 4
6.4
7
.7
14
16
.9±
46
.1
7.8
1
35
8.0
± 3
8.0
7
.2
C1
8:1
ns n-9
8
12
0.4
± 1
64
.0
44
.6
78
90
.5±
22
9.0
4
3.7
7
95
2.2
± 1
93
.0
43
.8
80
43
.9±
82
.3
42
.6
C1
8:2
n-6
2
39
2.7
a ± 6
3.7
1
3.2
2
52
8.9
a ± 1
15
.0
14
.0
25
82
.3a ±
15
2.0
1
4.2
2
92
2.6
b±
89
.0
15
.5
C1
8:3
n-3
5
6.4
a ± 1
.9
0.3
5
4.3
a ± 3
.1
0.3
5
5.4
a ± 1
.8
0.3
6
8.5
b±
1.7
0
.4
C2
0:1
ns n
-9
69
.5±
1.8
0
.4
65
.0±
2.3
0
.4
62
.3±
2.6
0
.3
69
.8±
3.7
0
.4
C2
0:2
n-6
3
5.5
ab±
0.6
0
.2
34
.4a ±
1.3
0
.2
36
.0a ±
5.0
0
.2
42
.9b±
1.9
0
.2
C2
0:4
n-6
3
96
.4ab
± 1
1.9
2
.2
41
2.8
a ± 1
3.6
2
.3
38
4.4
ab±
17.4
2
.1
36
2.6
b±
10.3
1
.9
DP
A,
C2
2:5
n-3
1
58
.5a ±
6.8
0
.9
11
2.3
b±
11.5
0
.6
10
1.0
c ± 1
7.3
0
.6
81
.8c ±
11
.5
0.4
DH
A,
C2
2:6
n-3
1
46
.5a ±
9.5
0
.8
25
2.5
b±
9.9
1
.4
32
8.9
c ± 1
5.5
1
.8
40
6.5
d±
13.3
2
.2
To
tal
SF
A n
s 6
25
0.4
± 9
.3.
34
.4
61
16
.7±
18
1.0
3
3.9
6
13
8.5
± 1
25
.0
33
.8
63
16
.7±
48
.4
33
.5
To
tal
UF
A n
s 1
19
44
.0±
239
.0
65
.6
11
933
.7±
332
.0
66
.1
11
999
.9±
248
.0
66
.2
12
544
.8±
31
.0
66
.5
To
tal
MU
FA
ns
87
58
.0±
18
3.0
4
8.1
8
53
8.6
± 2
57
.0
47
.3
85
12
.0±
20
7.0
4
6.9
8
65
9.9
± 1
10
.0
45
.9
To
tal
PU
FA
n-3
3
61
.5a ±
15
.7
2.0
4
19
.0b±
21.9
2
.3
48
5.2
b±
9.6
2
.7
55
6.8
c ± 6
.7
3.0
To
tal
PU
FA
n-6
2
78
9.1
a ± 6
6.9
1
5.3
2
94
1.7
ab±
12
4.0
1
6.3
2
96
6.7
ab±
16
7.0
1
6.4
3
28
5.2
b±
96
.9
17
.4
Over
all
To
tal n
s 1
81
94
.4±
331
.0
1
80
50
.4±
511
.0
1
81
38
.4±
364
.0
1
88
61
.4±
48
.0
n-6
: n
-3 r
atio
7.7
7.0
6.1
6.0
UF
A :
SF
A r
atio
1.9
2.0
2.0
2.0
PU
FA
: S
FA
rat
io
0
.5
0
.6
0
.6
0
.6
Val
ues
wit
h d
iffe
rent
sup
ersc
ripts
wit
hin
row
dif
fer
signif
ican
tly a
t P
<0.0
5;
n
s No s
ignif
ican
t dif
fere
nce
137

Appendix 10c:
Effects of treatm
ent diets on egg yolk fatty acid compositions in birds at 27 weeks of age
Fat
ty A
cid
Co
nt
Mea
n ±
SE
M
(mg/1
00
g)
%
FP
3
Mea
n ±
SE
M
(mg/1
00
g)
%
FP
6
Mea
n ±
SE
M
(mg/1
00
g)
%
FP
9
Mea
n ±
SE
M
(mg/1
00
g)
%
C1
4:0
ns
72
.3±
1.9
0
.4
74
.4±
2.3
0
.4
71
.4±
2.4
0
.4
74
.3±
1.9
0
.4
C1
6:0
ns
47
54
.0±
45
.0
25
.8
49
09
.3±
58
.4
25
.8
46
57
.8±
14
7.0
2
5.6
4
94
1.4
± 1
19
.0
26
.0
C1
6:1
n-9
5
43
.0a ±
13
.5
2.9
5
11
.2a ±
25
.1
2.7
4
32
.6b±
17.9
2
.4
42
8.6
b±
7.9
2
.3
C1
8:0
ns
14
32
.8±
25
.8
7.8
1
44
6.2
± 2
2.9
7
.6
13
52
.5±
52
.7
7.4
1
43
9.1
± 1
3.3
7
.6
C1
8:1
n-9
8
08
9.4
ab±
68
.7
43
.9
84
01
.6a ±
14
2.0
4
4.2
7
76
0.0
b±
25
2.0
4
2.6
7
99
7.8
ab±
65
.4
42
.0
C1
8:2
n-6
2
64
7.1
a ± 6
7.7
1
4.4
2
74
9.5
a ± 7
1.3
1
4.5
2
93
7.9
ab±
85
.9
16
.1
30
97
.7b±
15
4.0
1
6.3
C1
8:3
ns n
-3
58
.3±
2.5
0
.3
57
.2±
3.1
0
.3
56
.2±
5.6
0
.3
62
.5±
3.0
0
.3
C2
0:1
n-9
6
5.2
a ± 1
.3
0.4
6
6.1
a ± 5
.9
0.3
5
4.1
b±
1.4
0
.3
52
.3b±
0.9
0
.3
C2
0:2
n-6
3
5.2
ab±
5.8
0
.2
39
.7a ±
7.6
0
.2
37
.3b±
1.7
0
.2
37
.2b±
1.3
0
.2
C2
0:4
ns n
-6
40
3.1
± 6
.6
2.2
3
90
.6±
13
.1
2.1
3
91
.9±
13
.6
2.2
3
99
.7±
3.0
2
.1
DP
A,
22
:5 n
-3
15
6.6
a ± 1
.7
0.9
1
31
.9b±
7.3
0
.7
11
2.4
bc ±
11.4
0
.6
98
.9c ±
8.7
0
.5
DH
A,
22
:6 n
-3
15
5.1
a ± 4
.5
0.8
2
24
.7b±
11.5
1
.2
33
9.2
c ± 2
0.0
1
.9
39
3.4
d±
13.3
2
.1
To
tal
SF
A n
s 6
25
9.1
± 5
8.5
3
4.0
6
42
9.9
± 7
9.8
3
3.8
6
08
1.7
± 1
99
.0
33
.4
64
54
.7±
11
2.0
3
3.9
To
tal
UF
A n
s 1
21
53
.0±
126
.0
66
.0
12
572
.6±
118
.0
66
.2
12
121
.7±
387
.0
66
.6
12
568
.0±
163
.0
66
.1
To
tal
MU
FA
8
69
7.6
ab±
66
.4
47
.2
89
78
.9a ±
13
7.0
4
7.3
8
24
6.7
b±
26
8.0
4
5.3
8
47
8.6
b±
66
.7
44
.6
To
tal
PU
FA
n-3
3
70
.0a ±
7.3
2
.0
41
3.8
a ± 1
3.3
2
.2
50
7.9
b±
31.6
2
.8
55
4.8
b±
18.0
2
.9
To
tal
PU
FA
n-6
3
05
0.2
a ± 7
8.8
1
6.6
3
14
0.1
a ± 8
.1
16
.5
33
29
.8ab
± 1
00
.0
18
.3
34
97
.3b±
15
6.0
1
8.4
Over
all
To
tal n
s 1
84
12
.1±
177
.0
1
90
02
.5±
187
.0
1
82
03
.4±
571
.0
1
90
22
.8±
262
.0
n-6
: n
-3 r
atio
8.2
7.6
6.6
6.3
UF
A :
SF
A r
atio
1.9
2.0
2.0
2.0
PU
FA
: S
FA
rat
io
0
.5
0
.6
0
.6
0
.6
Val
ues
wit
h d
iffe
rent
sup
ersc
ripts
wit
hin
a r
ow
dif
fer
signif
ican
tly a
t P
<0.0
5;
n
s No s
ignif
ican
t dif
fere
nce
138

Appendix 10d:
Effects of treatm
ent diets on egg yolk fatty acid compositions in birds at 28 weeks of age
Fat
ty A
cid
Co
nt
Mea
n ±
SE
M
(mg/1
00
g)
%
FP
3
Mea
n ±
SE
M
(mg/1
00
g)
%
FP
6
Mea
n ±
SE
M
(mg/1
00
g)
%
FP
9
Mea
n ±
SE
M
(mg/1
00
g)
%
C1
4:0
ns
75
.3±
8.5
0
.4
86
.2±
2.2
0
.4
85
.7±
5.3
0
.4
88
.5±
2.8
0
.4
C1
6:0
ns
51
83
.3±
62
.1
26
.1
50
80
.3±
87
.4
26
.0
52
42
.6±
16
5.0
2
5.7
5
09
0.8
± 1
87
.0
25
.1
C1
6:1
ns n
-9
58
1.7
± 4
1.7
2
.9
56
9.6
± 3
0.7
2
.9
52
6.8
± 2
8.1
2
.6
59
7.3
± 3
6.6
2
.9
C1
8:0
ns
15
32
.0±
32
.3
7.7
1
51
9.6
± 6
6.0
7
.8
15
17
.9±
83
.2
7.4
1
53
5.8
± 5
2.7
7
.6
C1
8:1
ns n
-9
88
41
.8±
94
.0
44
.5
86
11
.6±
23
9.0
4
4.0
9
05
5.0
± 2
92
.0
44
.4
89
73
.4±
36
6.0
4
4.3
C1
8:2
ns n
-6
26
85
.0±
14
8.0
1
3.5
2
74
8.0
± 7
9.8
1
4.0
2
89
4.7
± 1
59
.0
14
.2
28
69
.0±
11
5.0
1
4.2
C1
8:3
ns n
-3
57
.1±
3.0
0
.3
61
.6±
1.4
0
.3
60
.8±
4.2
0
.3
65
.2±
2.9
0
.3
C2
0:1
n-9
7
1.0
a ± 3
.1
0.4
6
3.4
ab±
2.5
0
.3
59
.9b±
2.6
0
.3
58
.8b±
3.3
0
.3
C2
0:2
ns n
-6
36
.5±
2.1
0
.2
35
.6±
5.9
0
.2
33
.4±
1.3
0
.2
33
.9±
0.7
0
.2
C2
0:4
ns n
-6
44
0.2
± 1
6.5
2
.2
41
1.6
± 1
2.4
2
.1
43
4.7
± 1
9.2
2
.1
42
0.8
± 1
3.7
2
.1
DP
A,
C2
2:5
n-3
1
81
.0a ±
15
.3
0.9
1
59
.7a ±
3.8
0
.8
11
2.1
b±
4.3
0
.6
92
.3c ±
17
.5
0.5
DH
A,
C2
2:6
n-3
1
65
.3a ±
8.6
0
.8
22
6.6
b±
7.3
1
.2
35
6.4
c ± 1
2.5
1
.7
43
1.6
d±
5.5
2
.1
To
tal
SF
A n
s 6
79
0.6
± 6
2.8
3
4.2
6
68
6.2
± 1
50
.0
34
.2
68
46
.2±
25
3.0
3
3.6
6
71
5.1
± 2
36
.0
33
.1
To
tal
UF
A n
s 1
30
59
.5±
153
.0
65
.8
12
887
.7±
270
.0
65
.8
13
533
.7±
450
.0
66
.4
13
542
.1±
479
.0
66
.9
To
tal
Mo
no
enes
ns
94
94
.6±
12
2.0
4
7.8
9
24
4.6
± 2
18
.0
47
.2
96
41
.7±
32
0.0
4
7.3
9
62
9.4
± 4
00
.0
47
.5
To
tal
PU
FA
n-3
4
03
.4a ±
23
.9
2.0
4
48
.0a ±
9.6
2
.3
52
9.3
b±
17.6
2
.6
58
9.1
b±
23.0
2
.9
To
tal
PU
FA
ns n
-6
31
25
.2±
15
9.0
1
5.7
3
15
9.6
± 8
5.9
1
6.1
3
32
9.4
± 1
75
.0
16
.3
32
89
.8±
12
3.0
1
6.2
Over
all
To
tal n
s 1
98
50
.1±
208
.0
1
95
73
.9±
417
.0
2
03
80
.0±
696
.0
2
02
57
.2±
701
.0
n-6
: n
-3 r
atio
7.7
7.1
6.3
5.6
UF
A :
SF
A r
atio
1.9
1.9
2.0
2.0
PU
FA
: S
FA
rat
io
0
.5
0
.5
0
.6
0
.6
Val
ues
wit
h d
iffe
rent
sup
ersc
ripts
wit
hin
a r
ow
dif
fer
signif
ican
tly a
t P
<0.0
5;
n
s No s
ignif
ican
t dif
fere
nce
139

Appendix 10e:
Effects of treatm
ent diets on egg yolk fatty acid compositions in birds at 29 weeks of age
Fat
ty A
cid
Co
nt
Mea
n ±
SE
M
(mg/1
00
g)
%
FP
3
Mea
n ±
SE
M
(mg/1
00
g)
%
FP
6
Mea
n ±
SE
M
(mg/1
00
g)
%
FP
9
Mea
n ±
SE
M
(mg/1
00
g)
%
C1
4:0
ns
90
.4±
4.1
0
.5
95
.7±
0.7
0
.5
96
.0±
4.1
0
.5
10
0.1
± 3
.5
0.5
C1
6:0
4
98
7.5
a ± 1
13
.0
25
.8
52
37
.5ab
± 4
5.0
2
5.9
5
42
2.8
b±
92
.9
25
.8
53
58
.7b±
90
.9
25
.6
C1
6:1
n-9
6
44
.1a ±
37
.4
3.3
6
10
.7a ±
15
.9
3.0
5
27
.6b±
9.1
2
.5
67
0.6
a ± 3
1.2
3
.2
C1
8:0
1
49
2.3
a ± 6
0.6
7
.7
16
42
.2b±
60
.1
8.1
1
54
2.5
ab±
36
.3
7.3
1
53
1.6
ab±
11
.3
7.3
C1
8:1
n-9
8
58
4.3
a ± 1
73
.0
44
.4
88
21
.7ab
± 1
36
.0
43
.6
92
30
.6b±
12
6.0
4
3.9
9
20
3.0
b±
93
.1
43
.9
C1
8:2
n-6
2
59
5.3
a ± 1
12
.0
13
.4
28
23
.0ab
± 8
1.3
1
4.0
3
14
5.3
c ± 1
00
.0
15
.0
30
39
.8bc ±
46
.7
14
.5
C1
8:3
n-3
5
8.7
a ± 3
.4
0.3
6
6.0
ab±
2.5
0
.3
66
.1ab
± 2
.5
0.3
7
2.7
b±
1.5
0
.3
C2
0:1
ns n
-9
79
.1±
2.8
0
.4
74
.0±
2.5
0
.4
68
.3±
3.2
0
.3
78
.0±
4.8
0
.4
C2
0:2
ns n
-6
40
.7±
5.4
0
.2
42
.7±
7.2
0
.2
40
.2±
1.6
0
.2
41
.0±
5.3
0
.2
C2
0:4
n-6
4
19
.0ab
± 1
6.6
2
.2
40
9.9
ab±
13.6
2
.0
43
6.8
a ± 8
.6
2.1
3
87
.4b±
8.1
1
.8
DP
A,
C2
2:5
n-3
1
87
.7a ±
11
.8
1.0
1
48
.2b±
6.5
0
.7
12
1.8
b±
10.1
0
.6
79
.1c ±
13
.2
0.4
DH
A,
C2
2:6
n-3
1
35
.5a ±
6.9
0
.7
23
9.3
b±
10.1
1
.2
32
7.1
c ± 7
.8
1.6
3
88
.9d±
13.8
1
.9
To
tal
SF
A
65
70
.2a ±
15
8.0
3
4.0
6
97
5.4
b±
98
.1
34
.5
70
61
.2b±
91
.6
33
.6
69
90
.4b±
10
1.0
3
3.4
To
tal
UF
A
12
744
.4a ±
270
.0
66
.0
13
235
.5a ±
148
.0
65
.5
13
963
.9b±
19
0.0
6
6.4
1
39
60
.4b±
66
.0
66
.6
To
tal
MU
FA
9
30
7.4
a ± 2
02
.0
48
.2
95
06
.4ab
± 1
27
.0
47
.0
98
26
.6bc ±
12
1.0
4
6.7
9
95
1.6
a ± 6
9.0
4
7.5
To
tal
PU
FA
n-3
3
82
.0a ±
14
.5
2.0
4
53
.5b±
13.3
2
.2
51
5.0
c ± 1
0.0
2
.4
54
0.6
c ± 1
4.6
2
.6
To
tal
PU
FA
n-6
3
01
4.3
a ± 1
26
.0
15
.6
32
32
.9ab
± 9
3.0
1
6.0
3
58
2.1
c ± 1
09
.0
17
.0
34
27
.2bc ±
50
.0
16
.4
Over
all
To
tal
19
314
.6a ±
420
.0
2
02
11
.0b±
19
8.0
21
025
.1b±
26
4.0
20
950
.7b±
13
4.0
n-6
: n
-3 r
atio
7.9
7.1
7.0
6.3
UF
A :
SF
A r
atio
1.9
1.9
2.0
2.0
PU
FA
: S
FA
rat
io
0
.5
0
.5
0
.6
0
.6
Val
ues
wit
h d
iffe
rent
sup
ersc
ripts
wit
hin
a r
ow
dif
fer
signif
ican
tly a
t P
<0.0
5;
n
s No s
ignif
ican
t dif
fere
nce
140

0
250
500
750
1000
1250
1500
1750
25 26 27 28 29
Age (weeks)
Egg cholesterol (m
g/100g)
Control 3% FP 6% FP 9% FP
Appendix 11: Effects of treatment diets on egg yolk cholesterol
concentrations in birds from 25 to 29 weeks of age. (Errors
bars = SE, * P<0.05, a,b,c
points with different alphabet
notation within a week differ significantly at P<0.05).
Appendix 12: Initial and final body weight of birds
Treatments Age
(weeks) Cont
mean±SE
FP3
mean±SE
FP6
mean±SE
FP9
mean±SE
15
29
1.20±0.01
1.67±0.02
1.19±0.01
1.66±0.02
1.19±0.01
1.68±0.02
1.17±0.01
1.64±0.02
All values within a row were not significantly different (P>0.05) from each other.
* * * *
a
ab bc
c
a a
ab
b
a
ab
bc
c
a
a
ab
b
141

BIODATA OF THE AUTHOR
The author, Elizabeth Law Fang Lin was born on March 3, 1979 in Muar, Johore.
She completed her primary, secondary and high school education in Johor. She was
offered to do a degree study in the Faculty of Agriculture, Universiti Putra
Malaysia, in year 2000 and graduated in 2003. After graduation, she was awarded a
Graduate Research Assistantship by the Ministry of Science, Technology and
Environment Malaysia to pursue her Master of Science Degree in Animal Nutrition
under the chairmanship of Associate Professor Dr. Loh Teck Chwen at the
Department of Animal Science, Faculty of Agriculture, Universiti Putra Malaysia in
April 2003. During the time of study, she won a silver medal in the Exhibition of
invention, Research and innovation organized by UPM in year 2005.
142

Publications:
1. Law, F.L., T.C. Loh., H.L. Foo., I. Zulkifli and Y.M. Goh. 2004. Effects of
feeding fermented product on faecal Enterobacteriaceae and lactic bacteria
counts and faecal pH in layers. In Proceeding of the 11th Asian-Australasian
Animal Science Congress, 5-9th Sept 2004, Kuala Lumpur, Malaysia, pp: 110-
112.
2. Law, F.L., T.C. Loh., H.L. Foo., I. Zulkifli and Y.M. Goh. 2005. The study of
fermented product as alternative feed additive in animal’s diet. In Exhibition
of Invention, Research & Innovation UPM 2005.
3. Law, F.L., T.C. Loh., H.L. Foo., Y.M. Goh and I. Zulkifli. 2005. The
microbial properties and chemical compositions of fermented product. In
proceeding of the 26th Malaysian Society of Animal Production Annual
Conference, 1-3 June 2005, Primula Beach Resort Kuala Terengganu,
Malaysia, pp35-36.
4. Law, F.L., T.C. Loh., H.L. Foo., Y.M. Goh and I. Zulkifli. 2005. Effects of
feeding fermented product on egg nutritive value in layers. In Proceeding of
the 26th Malaysian Society of Animal Production Annual Conference, 1-3
June 2005, Primula Beach Resort Kuala Terengganu, Malaysia, pp37-38.
143