Effects of feed structure on animal performance ...
118
Aus dem Institut für Tierernährung des Fachbereichs Veterinärmedizin der Freien Universität Berlin Effects of feed structure on animal performance, gastrointestinal morphology, gut-associated lymphoid tissue and jejunal glucose transport in laying hens Inaugural-Dissertation zur Erlangung des Grades eines Doktors der Veterinärmedizin an der Freien Universität Berlin vorgelegt von Ilen Röhe Tierärztin aus Freiburg im Breisgau Berlin 2013 Journal-Nr.:3680
Transcript of Effects of feed structure on animal performance ...

Aus dem Institut für Tierernährung
des Fachbereichs Veterinärmedizin
der Freien Universität Berlin
Effects of feed structure on animal performance, gastrointestinal
morphology, gut-associated lymphoid tissue and jejunal glucose
transport in laying hens
Inaugural-Dissertation
zur Erlangung des Grades eines
Doktors der Veterinärmedizin
an der
Freien Universität Berlin
vorgelegt von Ilen Röhe Tierärztin
aus Freiburg im Breisgau
Berlin 2013
Journal-Nr.:3680

Gedruckt mit Genehmigung des Fachbereichs Veterinärmedizin
der Freien Universität Berlin
Dekan: Univ.-Prof. Dr. Jürgen Zentek
Erster Gutachter: Univ.-Prof. Dr. Jürgen Zentek
Zweiter Gutachter: Univ.-Prof. Dr. Wilfried Meyer
Dritter Gutachter: Univ.-Prof. Dr. Hafez Mohamed Hafez
Deskriptoren (nach CAB-Thesaurus): hens, feed technology, laying performance, digestive tract, morphology, local immunity, intestinal mucosa, intestinal absorption Tag der Promotion: 29.01.2014
Bibliografische Information der Deutschen Nationalbibliothek Die Deutsche Nationalbibliothek verzeichnet diese Publikation in der Deutschen Nationalbibliografie; detaillierte bibliografische Daten sind im Internet über <http://dnb.ddb.de> abrufbar.
ISBN: 978-3-86387-441-4 Zugl.: Berlin, Freie Univ., Diss., 2013 Dissertation, Freie Universität Berlin D 188
Dieses Werk ist urheberrechtlich geschützt. Alle Rechte, auch die der Übersetzung, des Nachdruckes und der Vervielfältigung des Buches, oder Teilen daraus, vorbehalten. Kein Teil des Werkes darf ohne schriftliche Genehmigung des Verlages in irgendeiner Form reproduziert oder unter Verwendung elektronischer Systeme verarbeitet, vervielfältigt oder verbreitet werden. Die Wiedergabe von Gebrauchsnamen, Warenbezeichnungen, usw. in diesem Werk berechtigt auch ohne besondere Kennzeichnung nicht zu der Annahme, dass solche Namen im Sinne der Warenzeichen- und Markenschutz-Gesetzgebung als frei zu betrachten wären und daher von jedermann benutzt werden dürfen. This document is protected by copyright law. No part of this document may be reproduced in any form by any means without prior written authorization of the publisher.
Alle Rechte vorbehalten | all rights reserved © Mensch und Buch Verlag 2014 Choriner Str. 85 - 10119 Berlin
[email protected] – www.menschundbuch.de

Table of contents
1 Introduction ..................................................................................................................... 1
2 Literature review .............................................................................................................. 3
2.1 Feed processing ........................................................................................................ 3
2.2 Anatomy, histology and physiology of the avian digestive system ............................ 5
2.2.1 Overview of major parts and functions of the digestive tract .............................. 5
2.2.2 Histological structure of the small intestine ......................................................... 7
2.2.3 Epithelial function of the small intestine .............................................................. 8
2.2.4 Absorption of glucose in the small intestine ...................................................... 10
2.3 Effect of feed structure on animal performance of birds .......................................... 11
2.4 Effect of feed structure on the morphology of the avian digestive tract ................... 15
2.5 Effect of feed structure on the microscopic structure
of the small intestine of birds ................................................................................... 17
2.6 Gut-associated lymphoid tissue (GALT) .................................................................. 17
2.6.1 Intraepithelial leucocytes in the small intestine ................................................. 18
2.6.2 Innate immune system ...................................................................................... 19
2.6.3 Cells of innate immune system ......................................................................... 19
2.6.4 Adaptive immune system .................................................................................. 21
2.6.5 Cells of adaptive immune system ..................................................................... 21
2.7 Effect of feed structure on avian intestinal immune system ..................................... 23
2.8 Aims of the study ..................................................................................................... 24
3 Material and methods ................................................................................................... 25
3.1 Experimental design ................................................................................................ 25
3.1.1 Animals and rearing conditions ......................................................................... 25
3.1.2 Experimental diets ............................................................................................ 25
3.2 Slaughtering and sampling ...................................................................................... 27
3.3 Measurement of particle size of feed by dry and wet sieving analysis .................... 30
3.4 Histological examinations ........................................................................................ 30
I

Table of contents
3.4.1 Histological preparation of the intestinal segments .......................................... 31
3.4.2 Histological staining of the intestinal sections with Haematoxylin-Eosin .......... 32
3.4.3 Microscopic evaluation ..................................................................................... 33
3.5 Ussing chamber technique ...................................................................................... 35
3.5.1 Ussing chamber design .................................................................................... 36
3.5.2 Sampling and mounting of tissue in the Ussing chamber ................................. 36
3.5.3 Electrical measurements .................................................................................. 37
3.6 Fluorescence cytometry of lymphocyte subpopulations
in gut-associated lymphoid tissue ............................................................................ 38
3.6.1 Principle of fluorescence cytometry .................................................................. 38
3.6.2 Preparation of the intraepithelial lymphocytes .................................................. 38
3.6.3 Immunostaining and flow cytometric analysis ................................................... 39
3.7 Statistical analysis .................................................................................................... 43
4 Results ........................................................................................................................... 44
4.1 Particle size distribution of the feed ......................................................................... 44
4.2 Animal performance .................................................................................................46
4.3 Organ weights of the proventriculus, gizzard, segments of the small intestine
and the pancreas ..................................................................................................... 52
4.4 Histological evaluation of villus length and crypt depth in the segments
of the small intestine ................................................................................................ 54
4.5 Intestinal glucose absorption ................................................................................... 57
4.6 Fluorescence cytometry of lymphocyte subpopulations in the gut-associated
lymphoid tissue ........................................................................................................ 59
5 Discussion ..................................................................................................................... 66
5.1 Feed processing ...................................................................................................... 66
5.2 Effect of feed structure on animal performance ....................................................... 68
5.3 Effect of feed structure on the development of digestive organs and on the
microscopic structure of the small intestine ............................................................. 71
5.4 Effect of feed structure on the intestinal glucose absorption ................................... 74
II

Table of contents
5.5 Effect of feed structure on lymphocyte subpopulations in the gut-associated
lymphoid tissue ........................................................................................................ 75
6 Conclusions and future perspectives ......................................................................... 78
7 Summary ........................................................................................................................ 80
8 Zusammenfassung ........................................................................................................ 83
9 References ..................................................................................................................... 86
10 Appendix ...................................................................................................................... 104
Publications ........................................................................................................................ 104
Acknowledgement .............................................................................................................. 105
Declaration .......................................................................................................................... 106
III

VI
List of tables
Table 1: Advantages and disadvantages of the hammermill ................................................... 3
Table 2: Advantages and disadvantages of the roller mill ....................................................... 4
Table 3: Roller gap adjustments (mm) and screen sizes (mm) used for
the production of the different experimental diets ................................................... 26
Table 4: Feed composition and nutrient content of the experimental diet ............................. 27
Table 5: Overview of sampling .............................................................................................. 28
Table 6: Overview of equipment and reagents ...................................................................... 35
Table 7: Primary antibodies used for phenotyping of the IELs .............................................. 40
Table 8: Secondary antibodies used for phenotyping of the IELs ......................................... 41
Table 9: Overview of equipment and reagents ...................................................................... 42
Table 10: Media and buffer .................................................................................................... 42
Table 11: Proportion of particle sizes (% of mass) in the diets
based on dry sieve analysis .................................................................................. 44
Table 12: Proportion of particle sizes (% of mass) in the diets
based on wet sieve analysis .................................................................................. 45
Table 13: Average daily feed intake (g/hen), average weekly body weight (g/hen) and
average weekly body weight gain (g) of the different feeding groups, recorded
for each experimental week and for total trial period; feed conversion ratio was
calculated on basis of feed intake and body weight gain12 .................................... 47
Table 14: Average weekly egg weight (g) and average weekly egg production (%) of
the different feeding groups, recorded for each experimental week and
for the total trial period. Average weekly feed efficiency was calculated from
the average daily feed intake and the average weekly egg weight 12 ................... 49
Table 15: Interaction and single factor effects of a three-factor analysis of variance on
performance data recorded in the feeding groups for the different
experimental periods. Statistical analysis was adjusted regarding to
the baseline body weight ....................................................................................... 50
Table 16: Interaction and single factor effects of a three-factor analysis of variance
on selected performance data detected in the different feeding groups
for the total experimental period. Statistical analysis was adjusted
regarding to the baseline body weight ................................................................... 51

List of tables
Table 17: Empty relative weight (g/kg body weight) of the gastrointestinal organs
of laying hens, fed with the different diets (N = number of analyzed samples).
Statistical analyses were conducted by ANOVA and posthoc Tukey’s test .......... 52
Table 18: Interaction and single factor effects of a three-factor analysis of variance
on empty relative organ weight (g/kg body weight) observed
in the eight different feeding groups ....................................................................... 53
Table 19: Histological measurements of the villi length in the duodenum, jejunum and
ileum concerning the different feeding groups (N = number of analyzed
samples); statistical analyses were conducted by ANOVA and
posthoc Tukey’s test .............................................................................................. 54
Table 20: Histological measurements of the crypt depth in the duodenum, jejunum and
ileum with regard to the eight different feeding groups
(N = number of analyzed samples) ....................................................................... 55
Table 21: Interaction and single factor effects of a three-factor analysis of variance
on villus length and crypt depth determined for
the eight different feeding groups .......................................................................... 56
Table 22: Calculation of the villus height to crypt depth ratio in the duodenum,
jejunum and ileum regarding to the different feeding groups (N = number of
analyzed samples); statistical analyses were conducted by ANOVA and
posthoc Tukey’s test .............................................................................................. 56
Table 23: Interaction and single factor effects of a three-factor analysis of variance
on the villus height to crypt depth ratio detected for the eight different
feeding groups ....................................................................................................... 57
Table 24: Transepithelial conductance (Gt) in the different feeding groups
(N = 8 for each group) ........................................................................................... 57
Table 25: Effect of D-glucose and phloridzin on short-circuit current in isolated mucosa
of chicken’s jejunum (N = 8 for each group); statistical analyses were
conducted by ANOVA and posthoc Tukey’s test ................................................... 58
Table 26: Interaction and single factor effects of a three-factor analysis of variance
according to ∆ Isc glucose and ∆ Isc phloridzin detected in the eight different
feeding groups ....................................................................................................... 58
Table 27: Proportions (%) of intraepithelial lymphocytes of the duodenum for the different
feeding groups, obtained by flow cytometric phenotyping (N = number of
analyzed samples); proportion of lymphocyte subpopulations calculated
in relation to detected CD45+ cells. IELs were characterized by their specific
surface antigens .................................................................................................... 61
V

List of tables
Table 28: Proportions (%) of intraepithelial lymphocytes of the jejunum for the different
feeding groups, obtained by flow-cytometric phenotyping (N = number of
analyzed samples); proportion of lymphocyte subpopulations calculated in
relation to detected CD45+ cells. IELs were characterized by their
specific surface antigens ....................................................................................... 62
Table 29: Interaction and single factor effects of a three-factor analysis of variance on
proportions of intraepithelial lymphocytes detected for the eight
feeding groups in the duodenum and jejunum ...................................................... 63
VI

List of figures
Figure 1: Schematic drawing of the produced diets including the electrical energy
consumption (kWh/t) required for feed production (data from the
production report of the International Research Association of
Feed Technology e.V., 2013) ................................................................................. 26
Figure 2: The gastrointestinal tract of a laying hen is shown and the different segments
are labeled. A = proventriculus, B = gizzard,C = duodenum, D = pancreas,
E = jejunum, F = ileum , G = caeca, H = rectum .................................................... 29
Figure 3: Microscopic picture of the intestinal mucosa of the ileum. Morphometric
analysis was focused on the villus length (A) and the crypt depth (B), HE ........... 34
Figure 4: Transfer of the jejunal mucosa onto the net supported Ussing chamber cylinder . 37
Figure 5: Influence of feed form (mash vs. expandate) on the daily FI (g/hen), recorded
for the first experimental week ( 1d – 7d) and the total experimental period
(1d – 21d).* P < 0.05; *** P < 0.01 ......................................................................... 51
Figure 6: Cell population obtained from jejunal tissue was characterized by forward light
scatter (FS) and side scatter light (SS). CD45 + cells are marked black and
CD45 – cells appear grey. The lymphocyte population is encircled. One
representative experiment is shown ....................................................................... 59
Figure 7: Dual immunofluorescence analysis of IELs using the 28-4 mAb together with
mAbs, specific for CD3 (Figure A) and CD8α (Figure B). Percentages
(in relation to CD45+ cells) of detected cells are shown in the corner of each
quadrant. One representative experiment is depicted, presenting IELs isolated
from jejunal tissue .................................................................................................. 64
Figure 8: Microscopic picture of jejunal tissue before (A) and after (B) the procedure of
isolation of IELs (HE) .............................................................................................. 65
Figure 9: Course of the performance parameters of LOHMANN BROWN CLASSIC;
modified from Jeroch et al. (2013). Performance data of this study are
marked by symbols: Body weight ; Egg production ; Egg weight ;
Feed intake 69
VII
........................................................................................................

List of abbreviations
ANOVA analysis of variance
APC antigen-presenting cell
Approx. approximate
ATP adenosine triphosphate
BCR B cell receptor
BSA bovine serum albumin
BW body weight
BWG body weight gain
CCK cholecystokinin
CD (+; _) cluster of differentiation (positive; negative)
Conc. concentrated
CT caecal tonsils
DNA Deoxyribonucleic Acid
DTT Dithiothreitol
EDTA Ethylenediaminetetraacetic Acid
e.g. exempli gratia
EP egg production
EW egg weight
F physical form
FACS fluorescence-activated cell sorting
FCR feed conversion ratio
FE feed efficiency
FI feed intake
FITC fluorescein isothiocyanate
FS Forward Scatter
GALT gut-associated lymphoid tissue
GLUT-2 glucose transporter 2
Gt transepithelial tissue conductance
HBSS Hanks’ Balanced Salt Solution
HE Haematoxilin and Eosin
i.a. inter alia
i.e. id est
IEL intraepithelial lymphocytes
IFN interferon
VIII

List of abbreviations
Ig immunoglobulin
IL Interleukin
Isc short-circuit current
LM light microscopy
LP lamina propria
LPL lamina propria lymphocytes
M mill
mAb monoclonal antibody
MALT mucosa-associated lymphoid tissue
MHC Major Histocompatibility Complex
mRNA messenger ribonucleic acid
NK natural killer (cells)
PAMP pathogen-associated molecular pattern
PBS phosphate buffered saline
PE phycoerythrin
PP Peyer’s patches
PRR pattern recognition receptor
PS particle size
rpm revolutions per min
RPMI Roswell Park Memorial Institute Medium
Rt total transepithelial resistance
SCFA short-chain fatty acids
SD standard deviation
SGLT-1 sodium-dependent glucose cotransporter 1
SS Side Scatter
TCR T cell receptor
TLR Toll-like receptor
Th T helper (cells)
Vt transepithelial voltage potential
x g gravity (measurement of centrifugal force)
IX

List of abbreviations
X

1
1 Introduction
The world’s population will rise considerably over the coming years and is forecasted to
exceed 9 billion people by 2050 (FAO, 2013). This development combined with rising
incomes and urbanization will result in a growing demand for livestock products (WHO,
2003). Particularly, the poultry sector is affected by this development, with poultry stocks
significantly growing at an average rate of three percent per year (FAO, 2013).
Consequently, there is also a growing interest in the opportunities to increase animal health
and thus the animal performance. Concerning this matter, the optimization of animal feed
and the development of new feeding concepts provide a central starting point. Within the
framework of such approaches, the energy consumption used for the feed production is also
a factor of interest having an economic and environmental impact.
Therefore, new developments in the production and processing of feed for the use in the
poultry sector are promoted in order to increase the quality and safety of feed and to achieve
a more energy-efficient feed production. Additionally, innovative resource-conversing feeding
concepts are implemented. Hence, different grinding methods, grinding intensities as well as
thermal treatment processes are used influencing the structure of feed, which is
characterized by the particle size and the particle size distribution as well as by the physical
form of the diet. The production of coarsely ground instead of finely ground diets using
energy-saving milling methods could reduce the feed production costs and improve the
stability, the mixing characteristics and the storability of feed. The further thermal treatment
of feed (conditioning) is an energy-intensive process but aims to increase i.a. the nutritive
value and thus the digestibility of feed.
As the feed structure is changing by production and processing the question arises whether
the animal health and thus the animal performance is influenced by this factor. In contrast to
what has been premised so far, recent studies showed that the use of coarsely ground feed
and the inclusion of whole grains had no negative impact on the performance of broilers and
turkeys, and that in contrast, positive effects regarding the gastrointestinal function and
health have been observed (Gabriel et al., 2007; Bank, 2010; Witte, 2012). There is clear
evidence that the particle size and the physical form of the diet have an impact on the
development of the avian digestive tract, which is also accompanied by changes in
physiological processes. Several studies showed that the feeding of coarsely ground as well
as mash diets led to an increase of the relative gizzard weights in broilers compared to the
feeding of finer particles and thermal processed diets (Nir et al., 1994a; Nir et al., 1994b;
Engberg et al., 2002; Peron et al., 2005; Amerah et al., 2007a).

Introduction
2
Furthermore, decreased colonization and growth of Salmonella in the caecum was observed
when broilers were fed with coarsely ground as well as mash diets (Huang et al., 2006;
Santos et al., 2008). Thus, feed structure seems to affect the intestinal microbiota, which
could help to prevent bacterial infection and reduce the use of antibiotics in the poultry
sector.
Moreover, providing laying hens with structural material, such as coarsely ground feed and
foraging material, led to a lower incidence of feather pecking and thereby improved animal
health and welfare (Blokhuis, 1986; Aerni et al., 2000; El-Lethey et al., 2000; Hetland et al.,
2003b) However, data on the effect of different feed structures on laying hens are limited,
whereas these studies generally report performance data (Wahlström et al., 1999; Hetland et
al., 2003a; MacIsaac and Anderson, 2007; Safaa et al., 2009).
Therefore, the aim of this study was to investigate whether gastrointestinal function of laying
hens and consequently their performance and health were affected by the feeding of
differently structured diets. For this purpose, investigations were focused on the influence of
feed structure on the development of digestive organs including morphometric examinations,
on the gut-associated lymphoid tissue as well as on the jejunal glucose transport in laying
hens.

3
2 Literature review
2.1 Feed processing
Due to the high energy consumption, the reduction of feed particles represents the main cost
factor of feed production in the layer industry (Amerah et al., 2007b). While the particle size
of protein meals such as soybean meal is usually defined by the pre-ground of the processor,
manufacturers of compound feeding stuffs are responsible for the particle size reduction of
cereal grains (Amerah et al., 2007b). The hammer mill and the roller mill represent the most
commonly used mills in the feedstuff production (Koch, 1996; Waldroup, 1997), whereas the
latter plays only a subordinate role (Svihus et al., 2004b). Usually laying hens are fed mash
diets, while the feed of broilers is mainly offered in pelleted form (Svihus, 2006). However,
there are attempts to use also thermally processed feed such as extruded and expanded
diets for laying hens. In the following the hammermill, the roller mill as well as the process of
expansion are described and both the advantages and disadvantages of these technologies
presented.
The hammermill contains a set of hammers, which are attached to a rotor assembly. The
rotor is enclosed by a screened grinding chamber and regulates the speed of the hammers
and thus the impact between hammers and the grinding material. The grist can leave the
grinding chamber when the particles have the appropriate size to pass through the screen
hole sizes. Hence, the size and spectrum of particles is determined by the used screen size
as well as by the hammer speed (Koch, 1996). After grinding the shape of particles appears
spherical with a smooth surface (Reece et al., 1985).
The advantages and disadvantages of the use of hammermills are shown in Table 1
according to Koch (1996).
Table 1: Advantages and disadvantages of the hammermill
Hammermill
Advantages Disadvantages
• produce a wide range of particle sizes • work with any friable material and fiber • less initial purchase compared to roller
mills • offer minimal expense for maintenance • generally feature uncomplicated
operation
• produce greater particle size variability (less uniform)
• provide less efficient use of energy compared to roller mills
• may generate heat (source of energy loss)
• may create noise and dust pollution

Literature review
4
Roller mills consist of pairs of rolls, which are horizontally aligned and encompassed by a
steel frame. The gap between one pair of rolls as well as the speed of the rolls can be
adjusted, so that different particle sizes of feed can be produced. During the grinding
process, shearing and compression are the primary forces, which are applied to the feed.
The shape of produced particles appears more irregular, being cubic or rectangular (Koch,
1996).
The advantages and disadvantages of the use of roller mills are presented in Table 2
according to Koch (1996).
Table 2: Advantages and disadvantages of the roller mill
Roller mill
Advantages Disadvantages
• energy efficient • uniform particle size distribution • little noise and dust generation
• little or no effect on fiber • particles tend to be irregular in shape and
dimension • may have high initial cost (depends on
system design) • when required, maintenance can be
expensive
There is a growing interest in using new technologies for the feed production in the poultry
sector. Thermal processed feed such as pellets or expandate is commonly used for broilers,
while laying hens are usually fed with mash diets (Svihus, 2006).
The process of expansion is referred to as a high temperature, short time (HTST) process.
Before the cereals can be fed into this process they have to be ground to mash previously.
The expander consists of a screw conveyor, residing in a barrel section, provided with an
adjustable annular discharge gap, which regulates the degree of pressure on the feed
due to shear and friction (Fancher et al., 1996). Together with the supply of steam, heat
is generated reaching temperatures of up to 130°C (Peisker, 2006). In a passage time of
2-5 sec., the screw conveyor forces the feed towards a resistor in the outlet gate of the
expander, where it is confronted with outside atmospheric conditions (Williams et al.,
1997). Thus, the moister of the expandate evaporates, the material expands in volume
and the temperature decreases rapidly (Fancher et al., 1996). Several studies
demonstrated that the feeding of expandate enhanced the digestibility of feed in broilers
connected with improved animal performance (Plavnik and Sklan, 1995; Williams et al.,
1997). The process of expansion can result in a rupture of structural carbohydrates and
may lead to an increased gelatinization of starch (Edwards, 1999).

Literature review
5
Additionally, productivity benefits were observed regarding improved pellet quality, the ability
to add high levels of liquids (particularly fat) to the mash prior to expansion as well as
improved hygienic status due to lower microbiological activity in the feed (Fancher et al.,
1996; Vest and Calhoun, 1997; Williams et al., 1997; Edwards, 1999; McCracken, 2002).
However, negative effects were observed when diets were thermally processed. During the
process of expansion the solubility of non starch polysaccharides could increase resulting in
a higher viscosity of the gut content, which may reduce the nutrient digestibility (Edwards,
1999; Svihus, 2006). Furthermore, studies showed that the enzyme activity as well as the
vitamin content is reduced when mash feed was further processed to expandate (Inborr and
Bedford, 1994; Anderson and Sunderland, 2002). Moreover, the process of expansion is
connected with a high energy consumption and accordingly increasing energy costs.
However, it should be emphasized that advantages and disadvantages related to the
expansion of feed are always dependent on the used substrate as well as on the processing
parameters (Edwards, 1999).
2.2 Anatomy, histology and physiology of the avian digestive system
2.2.1 Overview of major parts and functions of the digestive tract
As an adaption to the feed intake behavior and special diet of birds, the avian digestive tract
shares only few similarities with that of the mammals. The gastrointestinal tract of birds is
relatively short and suitable for transforming concentrated diets into nutrients (Larbier and
Leclercq, 1992). It begins with a beak, which consists of keratin and allows breaking of e.g.
hard grains while teeth and lips are absent. The mouth and pharynx form one unit, namely
the bucco-pharyngeal cavity, in which several salivary glands are distributed. The salivary
fluid contains mucus, which ensures the lubrication and humidification of ingested feed.
However, no amylase activity could be detected in the salivary fluid of chickens, so that the
starch digestibility is mainly dependent on the pancreatic amylase (Jerrett and Goodge,
1973). The bucco-pharyngeal cavity is connected to the esophagus, which is relatively long
in comparison to mammals. Just before entering the thoracic cavity, the esophagus forms a
diverticulum, designated as crop. The crop is used for temporary feed storage and enables
the bird to consume significant amounts of feed in a short period of time (Larbier and
Leclercq, 1992). Additionally, the crop regulates the transit time of the digesta, which is
dependent on several factors including the particle size and humidification of the feed, as
well as the filling state of the proventriculus and gizzard. The actual enzymatic digestion of
nutrients begins in the proventriculus or glandular stomach, which is cranially connected to
the esophagus and represents the first part of the bird’s stomach. Similar to mammals,

Literature review
6
secretory cells of tubular glands release hydrochloric acid and the proteolytic enzyme
pepsinogen, which compose the gastric juice. By maintaining a pH level of 2 to 4.5 (Svihus,
2011), pathogenic microorganisms can be eliminated and the inactive enzyme precursor
pepsinogen is converted to the active enzyme pepsin. Depending on the filling state of the
gizzard, the chyme remains in the proventriculus for between a few minutes and an hour
(Larbier and Leclercq, 1992). The gizzard, also called the ventriculus, is characterized by its
well-developed tunica muscularis with its large mass of strongly myolinated smooth muscles,
which can generate remarkable muscular strength during contraction (Svihus, 2011). This
allows an effective grinding and a reduction in feed particle size within the digesta. This effect
is facilitated by previously ingested stones (grit).
Beside the mechanical function of the gizzard, digestive processes initiated by the secretory
activity of the proventriculus also take place, e.g. protein digestion. Furthermore, the gizzard
regulates feed intake by influencing the flow of feed from the crop (Chaplin et al., 1992) and
influences satiety by mediating vagal and humoral signals. Svihus et al. (2004a) and Hetland
et al. (2003a) speculated that enhanced gizzard activity stimulates the release of
cholecystokinin, which, in connection with vagal signals, may lead to an increase of
pancreatic enzyme secretion.
The small intestine is divided into three sections: The region from the gizzard junction to the
pancreatic and bile ducts (duodenum), the area between the end of duodenum and Meckel’s
diverticulum (jejunum), and the segment between Meckel’s diverticulum and the ileo-ceco-
colic junction (ileum). The duodenal loop is surrounded by the pancreas, and the bile and
pancreatic ducts enter the duodenum near the beginning of the jejunum. Bile aids in the
digestion of lipids in the chyme as well as the absorption of fat-soluble vitamins, whereas the
pancreatic fluid comprises the enzymes amylase, chymotrypsinogen, trypsinogen and lipase
among others, which help to further break down carbohydrates, proteins and lipids (Pubols,
1991). Furthermore, the pancreas secrets bicarbonate, which ensures that the pH of the
small intestine is adjusted to a level of 6 to 7. At these pH levels, the majority of digestive
enzymes can function efficiently. In addition to the pancreatic and bile secretions, intestinal
juice is composed of enzymes released by the brush border of the small intestine. These
include saccharase and isomaltase, which are specialized in the hydrolysis of short chain
carbohydrates. After passing the ileum, the digesta reaches the large intestine, which can be
differentiated into the caeca and the rectum. Within the blind sacks, microbial degradation of
particular cell wall components takes place and short chain fatty acids (SCFA) are produced,
which serve as energy source for the organism. Moreover, water and electrolytes, in
particular sodium, are absorbed. The large intestine terminates with the cloaca, which
represents a common passage for digestive, urinary, and reproductive systems.

Literature review
7
2.2.2 Histological structure of the small intestine
The small intestine is separated into three different sections, namely the duodenum, jejunum
and ileum. The intestinal part from the ventriculus to the bile duct junction is regarded as the
duodenum; the section from the duodenum end to the Meckel’s diverticulum is defined as the
jejunum and the ileum comprises the Meckel’s diverticulum to the ileo-ceco-colic junction
(Yamauchi, 2001; Rougiere et al., 2009).
General structure of the intestinal wall of the small intestine according to König et al. (2008):
• Tunica mucosa
Lamina epithelialis mucosae
Lamina propria mucosae
Lamina muscularis mucosae
• Lamina (Tela) submucosa
• Tunica muscularis
Lamina (Stratum) circularis
Lamina (Stratum) longitudinalis
• Lamina (Tela) subserosa
• Tunica serosa
Lamina propria serosae
Lamina epithelialis serosae
The tunica mucosa of the small intestine is arranged into two fundamental structures, namely
villi and crypts. Villi are projections into the intestinal lumen, whereby the core of a villus is
considered as an extension of the lamina propria mucosae.
Crypts of Lieberkühn are finger-like invaginations of the epithelium around the villi that are
largely lined with younger epithelial cells, while stem cells are situated at the basis. These
dividing cells migrate upwards from the depths of the crypts onto the surfaces of the villi,
where they are extruded into the lumen. During migration, the cells are subject to
differentiation, and develop to mature enterocytes with specialized features in regard to
digestion, absorption and mucin secretion. The total transit time in the jejunum of chickens is
reported to be approximately 48 hours (Imondi and Bird, 1966).

Literature review
8
The single-layered prismatic epithelium of the small intestine mainly consists of enterocytes.
Each enterocyte has a basal nucleus and is covered with numerous microvilli located at the
luminal surface, which form the brush border. The enterocytes are involved in several
transport processes e.g. in the absorption of amino acids, monosaccharides and fatty acids.
The structure and function of the epithelium is described in detail in chapter 2.2.3.
Beside the enterocytes, mucus-secreting goblet cells, intraepithelial lymphocytes (IEL) and
enteroendocrine cells are also present. Goblet cells are scattered among the epithelial lining
and their luminal surface is covered with microvilli similar to those found on enterocytes.
These cells are responsible for the production of the mucins, high-molecular-weight
glycoproteins (Forstner, 2009). The secretion of mucins leads to a formation of a protective
mucus layer, covering the epithelial surface. This mucus layer provides a physical and
chemical barrier that protects the epithelium against harmful external influences, e.g. enteric
bacteria, as well as bacterial and environmental toxins (Specian and Oliver, 1991).
The IELs consist of a heterogeneous population of cells, mainly T cells and natural killer
cells, as well as to a lesser extent B cells, monocytes, macrophages, dendritic cells and
heterophils that reside among the basal and apical part of the epithelium in the gut (Vervelde
and Jeurissen, 1993; Bar-Shira and Friedman, 2005; Davison et al., 2011).
Enteroendocrine cells produce peptide hormones, which influence various digestive
processes.
The lamina propria mucosae is composed of glandular complexes, smooth muscle cells as
well as lymphatic structures. The lamina muscularis mucosae is poorly developed and
separates the tunica mucosa from the tunica submucosa, which is rich in vessels and
nerves. The tunica muscularis is thin-walled, and the combination of circular and longitudinal
smooth muscle gives the intestine an ability to perform complex movements. The lamina
subserosa lies immediately beneath the tunica muscularis, followed by the tunica serosa,
which encloses the intestinal tract.
2.2.3 Epithelial function of the small intestine
The intestinal epithelium has two major functions: Firstly, it constitutes a barrier against the
external environment and prevents the invasion of harmful antigens such as microorganisms
and their toxins (Madara et al., 1990; Podolsky, 1999).
Secondly, the epithelium acts as a selectively permeable barrier and regulates the transport
of nutrients, electrolytes and water from the intestinal lumen into the organism (Powell, 1981;
Ferraris and Diamond, 1997).

Literature review
9
This transport is mediated by two different pathways: The transcellular and paracellular
pathway.
The transcellular route is associated with selective transmembrane energy-dependent
channels and carriers, which enable the transport of e.g. amino acids, electrolytes and
glucose through the epithelia cells by passing the apical and basolateral membrane (Ferraris
and Diamond, 1997; Broer, 2008).
The paracellular pathway or shunt path is found between epithelial cells and consists of
multicomponent, multifunctional complexes composing tight junctions, adherens junctions
and desmosomes (Schneeberger and Lynch, 2004).
Tight junctions are located as a continuous intercellular barrier at apical-lateral membrane
borders and consist of transmembrane proteins such as occludin and claudin (Furuse et al.,
1993; Furuse et al., 1998).
In contrast to the transcellular pathway, the paracellular transport is dependent on an
electrochemical gradient and regulates the passive diffusion of ions and small noncharged
solutes.
The ability of the epithelium to exchange substances depends on the permeability and
permselectivity of its epithelial barriers. While the permselectivity is characterized by the
specific qualitative tissue property including transporters and carriers, the permeability is
determined by the electrical resistance of the epithelia (Powell, 1981).
The total transepithelial resistance (Rt) is defined by Kirchhoff’s law; formula adapted from Li
et al. (2004):
= + × ℎ+ + ℎ
Rt is calculated by the transcellular resistance, which is composed of the resistance of the
apical (Ra) and basolateral membrane (Rb) and shunted by a parallel resistor (Rshunt),
consisting of tight junctions and intercellular space.
Epithelia can be classified into leaky (gall bladder and small intestine), moderately tight
(distal colon) and tight epithelia (urinary bladder) as described by Frömter and Diamond
(1972). Powell (1981) describes leaky epithelial as having a total transepithelial resistance of
less than 1000 Ω · cm2 or a paracellular conductance that is greater than 50 % of the total
tissue conductance. In leaky epithelia, the paracellular pathway determines transport and
charge selectivity, i.e. the preference of tight junctions passing a specific ion more than
others (Van Itallie and Anderson, 2004).

Literature review
10
On the contrary, in tight epithelia the paracellular permeability and the charge selectivity of
tight junctions is negligible, and the high electrochemical gradient is maintained by active
transcellular transport (Anderson and Van Itallie, 2009).
2.2.4 Absorption of glucose in the small intestine
In all segments of the chicken intestine, except in the coprodeum, glucose absorption occurs
and is mediated by the transcellular or paracellular pathway. However, sugar absorption is
more efficient in the duodenum and jejunum compared with the ileum and the large intestine
(Levin et al., 1983; Savory and Mitchell, 1991; Ferrer, 1993; Amat et al., 1996).
In contrast to other vertebrates, the large intestine of the chicken has the capacity to
transport glucose, which has been observed in the proximal region of the caeca (Ferrer et al.,
1986) as well as in the rectum (Lind et al., 1980).
Glucose is absorbed across the brush border membrane by the secondary active sodium-
dependent glucose cotransporter 1 (SGLT-1). Glucose enters the cell along with two sodium
ions, accumulates within the enterocyte and is then transported by the glucose transporter 2
(GLUT-2), situated in the basolateral membrane, into the blood (Ferrer, 1993; Garriga et al.,
1999). The latter represents a downhill, passive transport while the electrochemcial gradient
across the brush border membrane is maintained by the Na/K-ATPase, which actively
transports sodium out of the cell by consuming ATP. This generated sodium electrochemical
gradient is the mainspring of glucose uptake in the cell against the concentration gradient,
and in consequence the transport rate is dependent on the magnitude of the sodium
electrochemical potential gradient (Wright et al., 2007).
Transport rates of glucose are closely related to the degree of villi (Calhaun, 1933) and
microvilli development (Planas et al., 1987), as well as to the availability of nutrients i.e. to
the luminal carbohydrate concentration (Ferraris and Diamond, 1986).
The SGLT-1 expression is directly regulated by the level of monosaccharides in the lumen of
the intestine in many species (Solberg and Diamond, 1987; Shirazi-Beechey et al., 1991;
Ferraris, 2001; Suvarna et al., 2005). Specific glucose sensors are located in the apical
membrane of the intestine, which are similar to the sweet taste receptors situated in taste
cells of the lingual epithelium (Nelson et al., 2001; Shirazi-Beechey et al., 2011). These
sensors, namely T1R2 and T1R3, are responsible for detecting luminal sugars and mediate
the up and down regulation of SGLT-1 expression (Shirazi-Beechey et al., 2011).
The glucose sensor is able to initiate a G-protein-coupled second-messenger pathway
associated with neuroendocrine mechanism, which finally leads to increased SGLT-1
expression (Dyer et al., 2003; Shirazi-Beechey et al., 2011).

Literature review
11
However, Shi and Zhang (2006) demonstrated that the T1R2 gene in the chicken genome is
absent, which may explain the relatively low level of taste reactivity in chicks during the
posthatch period (Ganchrow et al., 1990). There is evidence that in some species of birds,
the regulation of the SGLT-1 expression is independent of the luminal glucose concentration
(Levey and Karasov, 1992; Afik et al., 1997). Barfull et al. (2001) demonstrated that the
SGLT-1 expression and the uptake of a D-glucose analogue across the jejunal brush border
membrane vesicles isolated from enterocytes of two day-old chicks were higher compared
with those of five week-old chicks, although both feeding groups received equivalent
amounts of carbohydrates. It was therefore proposed that there may be other signals besides
the luminal glucose level, which control the SGLT-1 expression during ontogenetic
development.
The active glucose absorption across the apical brush border can be inhibited by phloridzin,
a specific inhibitor of the SGLT-1. Phloridzin, which occurs naturally in plants, binds to the
transporter but is not transferred, whereby glucose absorption into the cell is prevented. It is
a useful tool to study the function of the SGLT-1 and has therefore been used in several
recent experiments (Shapiro, 1947; Ferraris and Diamond, 1986; Ferrer, 1993; Awad et al.,
2007).
In addition to the transcellular pathway, glucose is also absorbed passively through
intercellular spaces in birds, particularly in wild birds (Karasov, 1994; Caviedes-Vidal and
Karasov, 1996; Afik et al., 1997). However, the precise mechanism and its contribution to the
total glucose absorption is still unknown. It has been suggested that a cotransport of water
with nonaqueous substrates through the SGLT-1 or a water transport driven by osmosis may
occur, where the SGLT-1 acts as a water channel (Charron et al., 2006; Zeuthen and
Zeuthen, 2007).
2.3 Effect of feed structure on animal performance of birds
The assumption that positive performance effects can be achieved in poultry through
intensive grinding of feed no longer corresponds to current findings in research (Kluth, 2011).
Recent studies showed that using coarsely ground feed and the inclusion of whole grains
had no negative impact on the performance of broilers and turkeys, and that in contrast,
positive effects regarding the gastrointestinal function and health have been observed
(Gabriel et al., 2007; Bank, 2010; Witte, 2012). In addition to the particle size, the structure of
the feed is also characterized by the physical form of the diet. Only few studies have been
performed regarding the effect of different physical forms of diets in laying hens, presumably
as mash is commonly fed in practice (Svihus, 2006). In the following, an overview will be

Literature review
12
provided regarding the effect of feed structure in laying hens and broilers, particularly
focusing on the factors particle size and physical form of the diet.
Earlier work has shown that the factor particle size in mash diets did not influence the egg
production and body weight gains of laying hens (Berg and Bearse, 1951; Deaton et al.,
1989). These studies generally report performance data, including egg production, feed
intake and feed conversion ratios, in addition to nutrient digestibility. Recent studies also
suggest that coarsely ground feed did not impair these performance parameters. Safaa et al.
(2009) investigated the effect of feed particles that varied in their geometric mean diameter
(fine, medium or coarse mash), on productive performance and egg quality of brown egg-
laying hens. The results illustrated that the factor particle size did not affect the productive
performance or egg quality of laying hens, except for the parameter feed intake, that was
higher for hens fed with the coarsely ground mash. Blair et al. (1973) demonstrated that the
egg production of hens, fed with either mash, whole grains or pellets, was similar, but the
feed intake increased when feeding whole grains. MacIsaac and Anderson (2007) also
examined the effect of feed structure on the productive performance of laying hens. White
Leghorn hens were fed with diets that differed in particle size as well as feed, which
contained 20 % of whole wheat. The results showed that performance parameters such as
feed intake, body weight, weight gain and feed consumption were not impaired by the use of
coarsely ground grains or the inclusion of whole wheat, except in regard to egg production,
which decreased during the late production phase.
An unique feature of the bird is the existence of the gizzard, which enables a high digestibility
when taking up coarse feed particles as well as whole grains. Therefore, an intensive pre-
grinding of grains by mills seems not to be beneficial for avian digestion. Furthermore,
investigations showed that birds preferred larger feed particles instead of finer ones (Portella
et al., 1988). However, the prerequisite appears to be that the digestive system is almost
completely developed as animal performance decreased when feeding coarse particles to
chicks (Davis et al., 1951; Douglas et al., 1990).
Hamilton and Proudfoot (1995) reported that, with regard to performance parameters of
laying hens, the particle size of the feed was of less importance than the physical form of the
diet. Leghorn hens were fed with diets differing in their physical form (mash, pellets or
crumbles) and particle size (fine or coarse). The results showed that hens given the mash
diet had an increased egg production and higher feed intakes than those that received
pellets or crumbles, irrespective of whether fine mash or coarse mash was fed.
Pepper et al. (1968) demonstrated that pullets fed with steamed crumbles had higher feed
intakes and increased weight gains, but decreased egg production rates in comparison with
those that received feed in mash form. Wahlström et al. (1999) observed increased body

Literature review
13
weights for laying hens that received crumbled diets in relation to hens fed with mash.
Moreover, misplaced eggs and decreased egg weights as well as a decreased feed
conversion ratio and an increased energy consumption were detected for laying hens that
were fed with the mash diets. However, early studies showed that by feeding laying hens
with mash instead of pelleted diets, higher body weights and increased feed consumption
could be achieved, although the egg production, egg weights and feed efficiency were
comparable within the feeding groups (Heywang and Morgan, 1944; Jensen and McGinnis,
1952; Black et al., 1958). Furthermore, it could be demonstrated that the inclusion of wood
shavings led to a higher apparent ileal starch digestibility in laying hens (Hetland et al.,
2003a). In a large scale experiment, Hetland et al. (2003b) examined whether the inclusion
of 40 % whole wheat, incorporated into 3 mm pellets, had an effect on animal performance.
The control group was fed with 3 mm pellets, which did not contain whole wheat. The results
showed that laying hens (Hybrids LSL and Shaver 2000), given the experimental diet, had a
tendency towards a lower feed conversion ratio (P = 0.07). However, no differences were
found with regard to egg production and egg weight between the groups. It was speculated
that a better plumage condition of hens, fed with the experimental diet, resulted in a lower
feed conversion ratio.
In this context, it is important to stress that animal performance always depends on animal
health and welfare. Therefore, several experiments were conducted in order to examine the
effect of feed structure on animal health. The results underline that the feeding of pelleted
diets instead of mash diets had a negative impact on the welfare of laying hens due to an
increased risk of feather picking (Aerni et al., 2000; El-Lethey et al., 2000). Therefore, it has
been recommended to provide laying hens with structural material, such as coarsely ground
feed and foraging material, which may result in a lower incidence of feather pecking and
thereby improve animal health and welfare (Blokhuis, 1986; Aerni et al., 2000; El-Lethey et
al., 2000; Hetland et al., 2003b).
Many scientific studies address the examination of effects of different feed structures on
performance and nutrient digestibility in broilers. By feeding coarsely ground mash instead of
finely ground mash, a higher feed intake and increased animal performance (favorable feed
conversion ratio and higher weight gain) could be obtained (Nir et al., 1994a; Amerah et al.,
2007c). Peron et al. (2005) investigated the effect of different particle sizes of wheat
(coarsely ground vs. finely ground), fed in pelleted form, on the digestibility and performance
of broilers. The study showed that the use of coarsely ground pelleted feed compared with
finely ground pelleted feed led to decreased digestibility with regard to starch and dry matter.
However, the digestibility of proteins and lipids as well as the growth performance was not
influenced by the wheat grinding. Jacobs et al. (2010) also demonstrated that the growth
performance of broilers were not affected by the diet’s particle size, when young chicks were

Literature review
14
fed a corn-soybean meal-based diet. The inclusion of whole grains in diets of broilers
improved the starch digestibility as well as the feed efficiency in comparison to the use of
finely ground commercial compound feeds (Svihus and Hetland, 2001; Hetland et al., 2002;
Plavnik, 2002; Hetland et al., 2003a). However, Svihus et al. (2004b) found that broiler
performance was not affected by the extent of grinding, when mash or pelleted feed was
implemented.
Regarding the influence of thermal feed processing on broiler performance, several studies
have shown that higher animal performances, better feed conversion ratios and higher
weight gains could be achieved with pelleted feed in comparison with mash feed (Calet,
1965; Douglas et al., 1990; Hamilton and Proudfoot, 1994; Amerah et al., 2007c). In addition,
it was demonstrated that broilers fed with pellets containing higher amounts of coarse
particles had a similar productive performance to those fed with pellets consisting of finely
ground feed particles (Engberg et al., 2002; Svihus et al., 2004b; Witte, 2012).
However, laying hens and broilers, which were provided with mash diets or structural
materials such as wood shavings or oat hulls, showed an improvement in starch digestibility
(Rogel et al., 1987; Svihus and Hetland, 2001; Hetland et al., 2003a). In this context, it was
speculated that birds fed with pelleted diets are becoming overeaters. Thus, the passage
rate of ingested feed increases, which may lead to a decreased starch digestion and reduced
activity of pancreatic digestive enzymes (Engberg et al., 2002; Svihus, 2006).
Svihus (2006) noted that, with regard to thermal feed processing, negative effects e.g. in
terms of the nutrient digestibility (decreased starch digestibility, increased viscosity, reduced
nutrient absorption) could occur and concluded that the temperature during processing
should be maintained as low as possible.
There is a lack of publications focusing on the effects of feed, produced by different milling
methods, on the animal performance. Svihus et al. (2004b) investigated the impact of diets,
which had the same geometric mean diameter but were produced either by a hammermill or
by a roller mill, on broiler performance and digestibility of feed. While no significant
differences were observed regarding the animal performance, a higher digestibility was found
for feed ground through a roller mill than for diets produced by a hammermill. It was
suggested that conceivably roller mills are rather able to break off the entire cereals by
shearing and compression than hammermills, where fragmentation by collision occurs.

Literature review
15
2.4 Effect of feed structure on the morphology of the avian digestive tract
Several studies have been carried out in order to examine the effect of different particle sizes
and the physical forms of diets on the development of the avian digestive tract, although
particularly broilers were used as target animals. Particle sizes range from fine to coarse
particles and whole grain as well as mash, which may be processed further to pellets,
crumbles or expandate. There is clear evidence that the structure of feed has an impact on
size and weight of different segments of the digestive tract, particularly regarding the gizzard.
Higher relative gizzard weights were observed when feeding coarse particles compared to
feeding fine particles in broilers (Nir et al., 1994a; Engberg et al., 2002; Peron et al., 2005;
Amerah et al., 2007d).
Several studies illustrated that by feeding whole grain diets in comparison to pelleted diets,
the relative gizzard weights of broilers were increased (Preston et al., 2000; Plavnik, 2002;
Gabriel et al., 2003; Svihus et al., 2004a; Williams et al., 2008). Furthermore, Hetland et al.
(2003a) demonstrated that the implementation of wood shavings to the diet led to increased
gizzard weights of layers accompanied with an increase of the total amount of bile acids,
suggesting an enhanced gastroduodenal reflux. The gastroduodenal reflux together with the
intestine and the cloaca-ceca reflux form the gut reflux, where reverse peristalsis occurs.
This reflux ensures that chyme is re-exposed to gastric as well as pancreatic secretions so
that digestion and nutrient absorption is promoted (Ferket, 2000)
It was also reported that the physical form of the diet affected the gizzard weight. Pellet-fed
birds had significantly lower gizzard weights than mash-fed birds (Nir et al., 1994b; Nir et al.,
1995; Engberg et al., 2002). In this context, Hetland et al. (2003b) demonstrated that higher
gizzard weights of laying hens could be achieved when feeding 40 % of whole wheat,
incorporated into 3 mm pellets, in comparison with feeding 3 mm pellets, which did not
contain whole wheat. These results suggest that the microstructure of thermally processed
feed, i.e. the particle size distribution within the pellet, is essential for the development of the
gizzard. However, it should be noted that thermal processing of feed is always connected
with a further size reduction of particles and therefore the factors physical form and particle
size of the diet can be interlinked.
The higher gizzard weights in birds fed with diets containing coarse particles are a
consequence of an increased frequency of gizzard contractions (Roche, 1981). The intensive
grinding reduces feed particle sizes and leads to a greater gizzard development as well as to
an increase of the gastrointestinal reflux (Engberg et al., 2002; Gabriel et al., 2003; Hetland
et al., 2003a; Amerah et al., 2007b). Conversely, fine particles are not ground extensively for
further digestion and a reduction of gizzard weights can subsequently be observed.

Literature review
16
Wu et al. (2004) and Witte (2012) stated that the higher gizzard weights of broilers related to
coarser particles in feed were not based on an increased tunica muscularis layer thickness
but rather on an enlargement of the entire organ.
In this regard, increased relative pancreas weights in combination with increased relative
gizzard weights were observed in several studies (Engberg et al., 2004; Gabriel et al., 2007;
Williams et al., 2008; Rougiere et al., 2009). Engberg et al. (2002) reported that the relative
weight of the pancreas as well as the activity of pancreatic digestive enzymes were affected
by feed form, and were significantly higher in mash-fed birds than in pellet-fed birds. In
addition, Svihus et al. (2004a) stated that the inclusion of whole wheat leads to an increased
secretory activity of the pancreas, potentially as a result of an increased gizzard activity. The
enhanced gizzard activity may stimulate the vagus nerve and the release of cholecystokinin
(CCK), a duodenal peptide hormone, which influences pancreatic enzyme secretion (Li and
Owyang, 1993; Svihus et al., 2004a; Svihus, 2006).
The relative proventriculus weight was not increased by feeding coarse particles in most of
the studies, however, a dilatation of this organ could be detected when fine pelleted diets
were fed (Jones and Taylor, 2001; Gabriel et al., 2007; Witte, 2012).
Several studies suggest that the dilatation of submucosal glands of the proventriculus may
be responsible for this enlargement (O’Dell et al., 1959; Gabriel et al., 2003). In addition,
O’Dell et al. (1959) observed degenerated glands, increased cell numbers and mucus
secretion, as well as distended musculature in these dilated organs. Witte (2012) reported
that broilers fed with fine pelleted diets showed enlarged proventriculi combined with
decreased relative gizzard weights and thinner tunica muscularis layers.
The reason for the occurrence of the dilatation of the proventriculus and the underdeveloped
gizzards in relation to finely pelleted feed in birds remains unclear. However, it is possible
that an overload of the proventriculus may play a role, which might be a consequence of a
reduced gizzard motility as a result of fine feed structure (Witte, 2012).
The development of the small intestine tends not to be affected as strongly by the feed
structure as compared to the gizzard. Several studies illustrated that coarser particles did not
influence the relative organ weight or size of the different parts of the small intestine (Wu et
al., 2004; Peron et al., 2005; Gabriel et al., 2007). This may be due to the fact that the
gizzard is able to grind feed to a consistently fine particle size irrespective of whether the
ingested diet contains large or small particles (Hetland et al., 2004). Thus, by evening out
particles size differences, segments of the small intestine might be not affected by different
particle sizes in the feed.
In contrast, Amerah et al. (2007a) could demonstrate that duodenal digesta of broilers fed
with coarser particles in mash diets contained greater amounts of large particles compared
with those fed fine particles in pelleted diets. These results are consistent with findings of

Literature review
17
Lentle et al. (2006) who compared the particle sizes of feed with excreta samples from
broilers fed with finer or coarser particles. On the basis of these results, it appears that the
gizzard does not grind feed to uniformly-sized particles. Therefore, coarser particles from
original coarsely ground feed can pass the gizzard and are able to enter the small intestine.
Nir et al. (1994b) reported that pelleting reduced the length of the jejunum and ileum. In
addition, Gabriel et al. (2003) observed lower duodenum weights in pellet-fed birds
compared with those receiving whole grains. Dahlke et al. (2002) showed that the relative
organ weights of the duodenum and jejunum plus ileum were positively related to increased
particle size in mash diets.
2.5 Effect of feed structure on the microscopic structure of the small intestine
of birds
Published data on the effect of the physical form and particle size of feed on the microscopic
structure of the intestine are scarce.
Dahlke et al. (2002) investigated the effect of particle size and physical form of diet (mash vs.
pellet) on the villus number, villus height and crypt depth in the duodenum of broilers. Pellet-
fed birds showed a higher number of villi per transversal duodenum cut and greater duodenal
crypt depths when compared to mash-fed birds. An increase in particle size of the diets
resulted in deeper crypts and higher duodenal villi, irrespective of the physical form of the
diet. Gabriel et al. (2007) observed increased villus to crypt length and surface rations in the
duodenum of broilers fed with whole wheat in comparison with mash-fed broilers. This was
contrary to the results obtained by Williams et al. (2008) showing no effect of whole wheat on
morphological parameters in the duodenum.
A general assumption exists that coarse feed particles and their interactions with the
intestinal wall have beneficial effects on the development of the intestinal villi. A resulting
enlargement of the absorptive surface can increase the absorption of nutrients and may lead
to a better feed conversion ratio (Dahlke et al., 2002; Gabriel et al., 2007).
2.6 Gut-associated lymphoid tissue (GALT)
The gut-associated lymphoid tissue (GALT) is a component of the mucosa-associated
lymphoid tissue (MALT), which also includes the bronchial, salivary, nasopharyngeal, and
genitourinary lymphoid tissue. The MALT has developed specialized features that underline
its role as the first line of defense on mucosal surfaces (Lillehoj and Trout, 1996; Bar-Shira et
al., 2003). This defense comprises physical, chemical and cellular barriers supported by the

Literature review
18
appearance of antigen-presenting cells, immunoregulatory cells, and effector cell types that
are distinct from their counterparts in the systemic immune system (Lillehoj and Trout, 1996;
Beal et al., 2006).
The GALT contains more lymphocytes than any of the other lymphoid tissues (Kasahara
1993) and more than half of the total lymphocyte pool of the MALT (Yun et al., 2000; Bar-
Shira et al., 2003). It represents a key immunological system by initiating and mediating
immune function. Thereby the GALT has to on the one hand distinguish between innocuous
antigens such as nutrients, and as such should not provoke an immune response, and on the
other hand harmful pathogens, which should trigger immune processes in order to defend
the body against infections. Handling this balance between tolerance and response is mainly
dependent on the interaction of the immune cells of the GALT and precondition for gut health
(Bar-Shira and Friedman, 2005; Beal et al., 2006).
The GALT in chicken has organized lymphoid structures, which include all lymphatic cells in
the epithelial lining and underlying lamina propria, the so-called intraepithelial cells (IEL) and
lamina propria lymphocytes (LPL), as well as specialized lymphoid structures residing in
strategic sites along the intestine (Davison et al., 2011). Such definable structures are the
bursa of Fabricius, the caecal tonsils (CT), the Meckel’s diverticulum, the Peyer’s patches
(PP) and lymphoid aggregates located within the lamina propria (Lillehoj and Trout, 1996;
Davison et al., 2011). In comparison to mammals, the avian immune system lacks structured
lymph nodes (Bar-Shira and Friedman, 2005; Casteleyn et al., 2010; Davison et al., 2011).
This situation stresses the role of the avian GALT as the major secondary lymphoid organ for
the defense against avian intestinal infections (Oláh and Glick, 1984; Muir et al., 2000).
2.6.1 Intraepithelial leucocytes in the small intestine
Morphologically, the gastrointestinal mucosa is separated by a basement membrane into two
different compartments: The epithelium and the lamina propria (Lillehoj and Trout, 1996;
Davison et al., 2011). Within these two layers intraepithelial leucocytes (IEL) and lamina
propria leucocytes (LPL) can be found.
The IELs consist of a heterogeneous population of cells, mainly T cells and natural killer
cells, as well as to a lesser extent B cells, monocytes, macrophages, dendritic cells and
heterophils that reside among the basal and apical part of the epithelium in the gut (Vervelde
and Jeurissen, 1993; Bar-Shira and Friedman, 2005; Davison et al., 2011). According to
locality, strain, age, and antigen stimulation, the total number and distribution of the IELs
differ during the postnatal development (Bäck, 1972; Lillehoj and Chung, 1992; Vervelde and
Jeurissen, 1993; Göbel et al., 2001).

Literature review
19
2.6.2 Innate immune system
The innate immune system is considered as the first line of defense and is able to react
quickly so that the spread of pathogens can be limited until adaptive response become
mobilized (Davison et al., 2011). It comprises physical and chemical barriers including mucus
and antimicrobial chemical components on epithelial surfaces that prevent the entry of
pathogens. In case pathogens are able to overcome these barriers, cellular and soluble
components are present, which can immediately build on an innate immune response
(Murphy et al., 2009; Davison et al., 2011). In addition to phagocytosis and lysis of
pathogens, the innate immune system also instigates a cascade of events such as
recruitment of diverse immune components and induction and modulation of the adaptive
immune system.
The cellular mediators of the innate immune system include leukocytes such as natural killer
cells, monocytes and macrophages, dendritic cells and heterophils. These cells are able to
identify pathogen-associated molecular patterns (PAMP) by pattern recognition receptors
(PRR) such as Toll-like receptors or C-type lectins which are encoded in their germline DNA
(Davison et al., 2011). The stimulation of PRRs leads to maturation and activation of e.g.
dendritic cells, the most important representative of the antigen presenting cells (APC). By
presenting captured antigens and expressing co-stimulatory molecules, activated dendritic
cells are able prime naive T cells.
The humoral mediator of the innate immune system is the complement system with its
different cytokines and chemokines. These substances are released by innate immune cells
in order to stimulate diverse processes of the immune system. Those and the antigen
presenting cells represent the connection to the adaptive immune response (Murphy et al.,
2009).
2.6.3 Cells of innate immune system
Natural killer cells
Natural killer cells are considered to be part of the innate immune system (Lanier, 2005;
Murphy et al., 2009). Similar to T cells and B-cells, NK cells originate from lymphoid stem
cells and are described as large lymphocytes with electron dense granula (Göbel et al.,
1994), containing perforin and granzymes. Similar to CD8+ cytotoxic T lymphocytes, they are
able to recognize and kill intracellular pathogens, virus-infected cells and neoplastic cells. By
expressing, activating and inhibiting receptors, NK cells interact with surface antigens of
cells, namely the major histocompatibility complex class 1 (MHC) molecules. They can

Literature review
20
distinguish between healthy conventional MHC 1 expressing cells and infected non-
conventional MHC 1 expressing cells (Lanier and Phillips, 1995; Lanier, 2005; Murphy et al.,
2009). In this process, inteferons such as IFN α and IFN β as well as cytokines e.g. IL-12
secreted by macrophages play an important role as an activator for the NK cells, which on
their part release IFN-γ, a immunostimulatory and immunomodulatory cytokine. In opposition
to cells of the adaptive immune system, NK cells are unable to generate antigen-specific
receptors by somatic cell genetic alterations, and their development is thymus-independent
(Pat Bucy et al., 1990; Davison et al., 2011).
Due to the lack of suitable antibodies for detecting NK cells in chicken, early studies were
concerned with assaying NK cell-like activity (Sharma and Okazaki, 1981; Chai and Lillehoj,
1988). In 2001 however, Göbel et al. (2001) developed a specific antibody, the 28-4 mAb, in
order to identify and characterize NK cells within the intraepithelial leukocytes in the chicken
gut. These cells were CD8+ but lacked specific markers for the T cell or B cell lineage,
although a small portion of cells were 28-4+ and CD3+, which are probably comparable to
mammalian NKT cells (Godfrey et al., 2000; Göbel et al., 2001; Godfrey et al., 2004).
Furthermore, NK cells expressed the common leukocyte antigen CD45, cytoplasmic CD3
and Fc receptor-like Ig-binding activity but did not express MHC class II antigens, CD4 and
immunglobulin (Göbel et al., 1994).
Phenotypic studies demonstrated that NK cells in adult chickens are located primarily in the
intestinal epithelium and that they may reside in the spleen and blood in low numbers, in
contrast to humans, mice and rats (Göbel et al., 2001; Jansen et al., 2010).
Macrophages
Macrophages derive from bone marrow stem cells, which develop into monocytes, and after
their arrival into the bloodstream are seeded in diverse tissues and organs. Macrophages
therefore represent tissue forms of blood monocytes (Dil and Qureshi, 2002).
The principal role of macrophages is in chemotaxis, phagocytosis, killing bacteria and tumor
cells, cytokine production and antigen presentation (Qureshi, 2003). Therefore, macrophages
are involved in both, the innate and adaptive immune response.
By expressing different pattern recognition receptors (PRR), e.g. scavenger receptors or Toll-
like receptors (TLR) are able to detect present pathogens (Dil and Qureshi, 2002). They also
secrete cytokines, cytokine inhibitors, endocrine hormones, eicosanoids, neurotransmitters
and reactive oxygen intermediates, and thus are essential for regulating immune and
inflammatory responses (Klasing, 1998).

Literature review
21
Heterophils
The complements of mammalian neutrophils are avian heterophils. They represent
polymorphonuclear leukocytes which (like neutrophils) form the first line of defense by
phagocytosis and elimination of invading pathogens (Beal et al., 2006; Davison et al., 2011).
In opposition to mammalian neutrophils, heterophils lack myeloperoxidase and do not
produce oxygen radicals.
2.6.4 Adaptive immune system
When the non-specific immunity is not effective and overwhelmed by invading pathogens,
the adaptive immunity also known as specific immunity or acquired immunity is of
fundamental importance. The adaptive immunity involves on the one hand the humoral
immunity, which is based on the activity of antibodies produced by B cells, and on the other
hand on the cell-mediated immunity, which refers to the activity of lymphocytes, primarily to T
cell activity (Erf, 2004; Murphy et al., 2009).
In contrast to the innate immune system, the cells of the adaptive immune system show a
high specificity due to the immune response. This specificity enables the immune cells to
differentiate between particular pathogens that are mediated by specific pathogen receptors.
These receptors, namely the B cell receptor (BCR) and the T cell receptor (TCR), are not
encoded in the germ line but instead are acquired through somatic expression processes
during maturation. Additionally, the adaptive immune system is characterized by an
immunological memory which ensures rapid responses and protection in case of a
reinfection with the same pathogen (Davison et al., 2011).
2.6.5 Cells of adaptive immune system
T cells
T cells represent the antigen-specific component of the cell-mediated immunity (Chen et al.,
1991). They originate from haematopoietic stem cells in the bone marrow, colonialize the
cortex of the thymus, undergo the process of differentiation and maturation, and finally are
released from the thymus to peripheral tissues. T cells express the CD3 polypeptide complex
and are characterized by the presence of a T cell receptor (TCR) on their cell surface. Due to
the TCR, T cells can be classified into either TCRαβ+ or TCRγδ+ cells, depending on the
different protein chains which are connected to each other by disulfide bridges (Davison et
al., 2011). In contrast to TCRγδ+ cells, two different subfamilies of TCRαβ+ cells exist, the
TCRαβ1 subfamily (expressing Vβ1) and the TCRαβ2 subfamily (expressing Vβ2).

Literature review
22
In addition to the TCR, other TCR co-receptors such as CD4 exist, which are expressed by T
helper (Th) cells (CD4+) and CD8, located on the cell surface of cytotoxic T cells (CD8+).
Th cells can be assigned into Th1 and Th2 cells. Both cell types recognize antigen peptides,
which are presented by APC in association with self-MHC class II molecules. The antigen
peptides are derived from endogenous synthesized proteins, e.g. peptides of viral or
intracellular bacterial origin, and are displayed by APCs including dendritic cells or
macrophages. The interaction with antigen-peptides and the simultaneous binding of the
MHC molecules leads to an activation of Th cells. Both subtypes of cells are able to enhance
the humoral immune system by activating naive B cells to produce antibodies. Additionally,
Th1 cells are able to activate the cell-mediated immunity by reinforcing the killing efficacy of
macrophages and the proliferation of cytotoxic CD8+ T cells. All these processes are
mediated by cytokines e.g. interferon-γ and interleukin-10 associated with Th 1 cells and
interleukin 4 and 13 regarding to Th 2 cells (Murphy et al., 2009; Davison et al., 2011).
Cytotoxic T cells bear the co-receptor CD8 and are specific for MHC class I molecules.
Chicken CD8 expresses 2 different isoforms, which are composed of either a CD8αα
homodimer or a CD8αβ heterodimer (Tregaskes et al., 1995). The CD8 αα homodimer is
expressed on splenic and gut NK cells, intraepithelial γδ T cells and peripheral CD4+ cells
while thymocytes as well as cytotoxic T-cells bear CDαβ heterodimer (Göbel et al., 1994;
Tregaskes et al., 1995; Luhtala et al., 1997; Luhtala, 1998).
Cytotoxic T cells are able to destroy dysfunctional cells such as cancer cells or virus-infected
cells. They recognize antigen peptides, which are presented by any nucleated cells and
displayed on MHC class I molecules on the cell surface. If cytotoxic cells recognize infected
cells, they can destroy these by inducing apoptosis.
Information regarding to the occurrence and distribution of avian T cells within the population
of intraepithelial lymphocytes are scarce. Few studies show that the IEL of the chicken small
intestine contains TCRαβ+ and TCRγδ+ CD3+ T cells with minor populations of TCRαβ+
CD4+ (Lillehoj, 1994). Mainly CD8+ T cells could be detected, which primarily express the
CD8αα homodimer rather than the CD8αβ heterodimer (Vervelde and Jeurissen, 1993;
Göbel et al., 2001; Lillehoj et al., 2004).
In contrast to the IEL population, the lamina propria lymphocytes consist of a larger
proportion of TCRαβ+ T cells, and only few TCRγδ+ T cells. The TCRαβ+ T cells
predominantly express CD4+, while only a small proportion of CD8+ cells are detectable
(Davison et al., 2011).
Natural Killer T cells
Although to date only little data exists regarding natural killer T cells (NKT cells) in mammals,
it is likely that these cells also exist in chickens (Göbel et al., 2001). NKT cells are a

Literature review
23
population of T cells that share some characteristics with natural killer cells, most
mentionable the expression of the NK1.1 receptor, the invariant α T cell receptor linked with
3 different β chains, the CD1d (nonclassical MHC class Ib molecules) restriction and
considerable cytokine production, in particular interleukin 4, interleukin 10 and interferon γ
(Godfrey et al., 2000; Murphy et al., 2009). Instead of NK cells, the NKT cells are thymus –
dependent, similarly to T cells, but are not MHC I or II restricted.
NKT cells can be activated in case of infection or innate stimuli, present microbial lipids on
their surface and release high levels of IL-4 and IFN-γ. Therefore, these cells have a capable
immunoregulatory potential (Godfrey and Rossjohn, 2011).
B cells
The bursa of Fabricius, first described by the scientists Glick et al. (1956) and Cooper et al.
(1966), is located in the proctodeal region of the cloaca and is unique to birds and essential
for the proliferation and differentiation of B cells. B cells represent the humoral immunity arm
of the adaptive immune system and are characterized by their ability to produce antibodies
against antigens. B cells are distinguishable from other cells by their B cell receptor (BCR),
which recognizes specific antigens directly. For an effective activation they need the support
of CD4+ T helper cells, which deliver signals via specific cytokines in order to enhance the
differentiation of B cells into antibody-producing plasma cells or memory B cells (Murphy et
al., 2009). The immunoglobulins (Ig) secreted by plasma cells bind to pathogenic antigens
that trigger the immune response. By activating the complement system and stimulating
effector cells such as macrophages, IGs ensure that pathogens are removed from the
organism.
B cells are almost entirely absent from the IEL, but in contrast, a high amount are detectable
in the lamina propria (Davison et al., 2011).
2.7 Effect of feed structure on avian intestinal immune system
Few studies are published considering the effect of feed structure on the intestinal immune
system. These studies are mainly focused on the effects of feeding different feed structures
on the intestinal microbiota. In this context, the use of coarsely ground feed resulted in
decreased colonization and growth of Salmonella in the intestine, and thereby to a reduced
excretion of these zoonotic pathogens by the animal. Thus, the caecal Salmonella
concentration was reduced by feeding coarsely ground feed or whole cereal grains in broiler
chickens (Santos et al., 2008). The physical form of the feed offered also seems to have an
influence on the intestinal content of Salmonella. The concentration of Salmonella in the

Literature review
24
caecum was increased by feeding a fine pelleted diet compared to a coarse mash diet
(Huang et al., 2006). In addition to the observed positive effects of pH reduction in the
gizzard including an increase of microbially produced volatile fatty acids in the caecum and
the formation of a thicker intestinal mucus layer, the question arises to what extent the gut-
associated immune system is influenced by the feed structure.
Scientific studies investigating the influence of particle size and physical form of the diet on
the immune system are scarce. Liu et al. (2006) examined the effect of particle size (coarse
vs. fine) and physical form of the diet (mash vs. pellet) on the number and location of mast
cells as well as on the histamine content in the small intestine of broilers. By feeding coarsely
ground diets, more mast cells were detected in histological sections, which were
concentrated in the upper part of the villi of the intestinal epithelium. In the animals fed with
finely ground diets, less mast cells were present in the intestinal tissue and these were
evenly distributed in the tissue sections. In accordance with the results of the mast cell
numbers, the histamine content was higher in the jejunum when feeding coarsely ground
diets. With regard to the physical form of feed, no significant differences in the number and
localization of mast cells and the histamine content in the intestinal tissue were observed.
2.8 Aims of the study
In the light of global population growth, rising incomes and urbanization the demand for
livestock products specifically for poultry products is growing continuously (WHO, 2003;
FAO, 2013). As a consequence, there is a growing interest in the opportunities to increase
animal health and thus the animal performance. In this regard, the optimization of animal
feed and the development of new feeding concepts provide a central starting point. The use
of different grinding methods, grinding intensities as well as thermal treatment processes
influence the structure of feed i.e. the particle size, particle size distribution and the physical
form of the diets. The aim of this study was to investigate whether gastrointestinal function
and consequently animal performance and health of laying hens were affected by the feeding
of differently structured diets.The following hypotheses were derived:
The implementation of different grinding methods (hammermill vs. roller mill), grinding
intensities (coarsely ground vs. finely ground) as well as thermal treatment processes (mash
vs. expandate) changes the feed structure and has an impact on:
1. Animal performance
2. Development of digestive organs and on the intestinal microscopic structure
3. Intestinal glucose transport
4. Intestinal immune system

25
3 Material and methods
3.1 Experimental design
3.1.1 Animals and rearing conditions
In eight consecutive trial runs, a total of 384 laying hens (Lohmann Brown) aged 19 weeks
were randomly allocated to eight different experimental groups (in total 48 hens per feeding
group) with six animals per floor pen each representing a single experimental unit. The
lighting program was continuous and consisted of 16 h light and 8 h dark. The ambient
temperature was maintained at a constant 21 ± 2°C during the entire experiment. The birds
had ad libitum access to feed and water, and were reared on litter floor pens (barn system)
for a period of 28 days. In the first seven days, all hens were fed with a commercial mash
diet in order to adapt them to the experimental conditions. They then received the different
experimental diets over a period of 21 days. The laying performance (egg weight and egg
production) of each feeding group was recorded daily, and the feed intake and body weight
were determined weekly. At the end of each trial run, the hens, aged 23 weeks, were
slaughtered by stunning and cervical decapitation, followed by exsanguination.
The study was performed in accordance with the Animal Welfare Act of Germany and all
procedures involving handling of animals were approved by the local state office of
occupational health and technical safety (Landesamt für Gesundheit und Soziales Berlin,
Germany, LaGeSo Reg. Nr. 0117/11).
3.1.2 Experimental diets
All diets were produced by the International Research Association of Feed Technology e.V.
(Braunschweig-Thune) and based on corn (30 %), wheat (29 %), and extracted soybean
meal (22 %). The feed composition and the nutrient content of the experimental diet are
shown in Table 4. In total, eight different diets were produced: Coarsely ground mash, finely
ground mash, coarsely ground and expanded feed, and finely ground and expanded feed,
whereby each diet was produced using two different mills: A hammermill (Horizontalrotor-
Hammermühle, Tietjen Verfahrenstechnik GmbH, Hemdingen, Germany) and a roller mill
(Walzenstuhl, MIAG, Braunschweig, Germany) (Figure 1). The roller gap adjustments and
the hammermill screen sizes used for the production of the different diets are depicted in
Table 3.The cereals corn and wheat were separately ground by the mills and afterwards
mixed (Zweiwellenpaddelmischer, Dinnissen BV, Sevenum, Netherlands) with the other

Material and methods
26
components or further processed to expandate The expander (Einwellen-Extruder/Expander,
Amandus Kahl GmbH & Co KG, Reinbeck, Germany) was operated at 85 - 90 bar and a
processing temperature of 116 °C; mass throughput was in the range of 130 - 150 kg/h. The
supply rates of the electrical energy used for the production of the different diets were
measured by wattmeters and are shown in Figure 1. High readings of expander energy
consumption refer to the applied small sized experimental plant (max. 150 - 200 kg/h).
Industrial scale plants operate at lower specific energy consumption.
Figure 1: Schematic drawing of the produced diets including the electrical energy consumption (kWh/t) required for feed production (data from the production report of the International Research Association of Feed Technology e.V., 2013) Table 3: Roller gap adjustments (mm) and screen sizes (mm) used for the production of the different experimental diets
Roller mill Hammermill
Mash Expandate Mash Expandate
Roller Gap Adjustment/
Screen Size (mm)
Coarse Fine Coarse Fine Coarse Fine Coarse Fine
Wheat 2 0.75 2 0.75 − 1 5 − 1 5
Corn 3.25 3.25 3.25 3.25 − 1 6 − 1 6 1 no screen was present

Material and methods
27
Table 4: Feed composition and nutrient content of the experimental diet
Ingredients g/kg as fed
Corn 300.8 Wheat 290.8 Soybean meal (42 %CP1) 224.8 Sodium carbonate 86.0 Soya oil 44.6 Molasses 30.0
Mineral/Vitamin premix2 12.0 Monocalcium phosphate 7.8 Salt 2.0 DL-Methionine 1.0 L-Tryptophan 0.2
Nutrient content g/kg
Dry matter 881.9 Crude protein 185.8
Ether extract 59.7 Crude fiber 32.7 Starch 418.5 Ash 110.6 Calculated ME (MJ/kg) 11.4 1CP crude protein 2 Mineral and Vitamin Premix (Spezialfutter Neuruppin, Germany) containing per kg premix: 400000 IU vitamin A; 40000 IU vitamin D3; 8000 mg vitamin E (alpha-Tocopherole acetate); 300 mg vitamin K3; 250 mg vitamin B1; 250 mg vitamin B2; 2500 mg nicotinic acid; 400 mg vitamin B6; 2000 µg vitamin B12; 25000 µg biotin; 1000 mg calcium pantothenate; 100 mg folic acid; 80000 mg choline chloride; 5000 mg zinc (zinc oxide); 2000 mg iron (iron carbonate); 6000 mg manganese (manganese oxide); 1200 mg copper (copper sulfate-pentahydrate); 45 mg iodine (calcium jodate); 30 mg cobalt (cobalt- (II)-sulfate-heptahydrate); 35 mg selenium (sodium selenite); 35 g sodium (sodium chloride); 55 g magnesium (magnesium oxide).
3.2 Slaughtering and sampling
Birds were slaughtered by stunning and cervical decapitation, followed by exsanguination.
Table 5 provides an overview of the samples taken as well as the sampling points used for
the different analyses.
In order to determine the organ weights, the pancreas, proventriculus, gizzard and the three
segments of the small intestine were extracted, emptied, the adhering fat and mesenteries
were removed, and the organs were weighed (Figure 2).

Material and methods
28
The segments removed from the small intestine were:
1. Region from the gizzard junction to the pancreatic and bile ducts (duodenum)
2. Area between the end of duodenum and Meckel’s diverticulum (jejunum)
3. Segment between Meckel’s diverticulum and ileo-ceco-colic junction (ileum).
For the morphometric analysis, 8 to 10 cm long segments were removed from the
duodenum, jejunum and ileum, as described by Uni (Uni et al., 1999):
1. Apex of the duodenum
2. Midway between the point of entry of the bile ducts and Meckel’s diverticulum
3. 10 cm proximal to the ileocecal junction
The samples were flushed with cold PBS buffer, the existing fat and mesenteries were
removed, and the samples were cut open longitudinally. The open segments were placed on
cork boards by using hedgehog spines and subsequently fixed in Bouin’s solution.
For the Ussing chamber studies, the entire jejunum was resected and placed in ice-cold-
carbogen-gassed Krebs-Henseleit buffer.
The entire duodenum and jejunum used for the flow cytometric analysis were resected, the
adhering fat and mesenteries were removed, cut open longitudinally on their mesenteric side,
and immediately transferred to the PBS buffer.
Table 5: Overview of sampling
Samples used for Excised tissue/organs
per animal
Number of animals sampled
Determination of organ weights
Proventriculus Gizzard
Duodenum Jejunum
Ileum Pancreas
N = 256 (4 animals per group x 8 groups x 8
repetitions)
Ussing chamber experiments
Jejunum N = 64 (1 animal per group x 8 groups x 8
repetitions) Histology Duodenum
Jejunum Ileum
N = 64 (1 animal per group x 8 groups x 8
repetitions) Fluorescence cytometry Duodenum
Jejunum N = 64
(1 animal per group x 8 groups x 8 repetitions)

Material and methods
29
Figure 2: The gastrointestinal tract of a laying hen is shown and the different segments are labeled. A = proventriculus, B = gizzard,C = duodenum, D = pancreas, E = jejunum, F = ileum , G = caeca, H = rectum

Material and methods
30
3.3 Measurement of particle size of feed by dry and wet sieving analysis
Feed particle sizes of the eight diets were determined by dry and wet sieving. To date there
is no official method or protocol, which describes the procedure of determining the particle
size distribution of feed by using dry or wet sieving analysis (Wolf et al., 2012). Therefore,
sieve analyses were conducted based on the protocols of previous studies (Laurinen et al.,
2000, Wolf et al. 2010, Witte 2012, Wolf et al. 2012).
Representative 100 gram samples of each diet were passed through a sieve stack on a sieve
shaker (Analysette 3®, Fritsch, Idar Oberstein, Germany) for 10 min at an amplitude of 7.
The sieve stack consisted of nine sieves with screens of different mesh sizes (4 mm; 2,5
mm; 2 mm; 1,6 mm; 1,25 mm; 1 mm; 0,63 mm; 0,4 mm; 0,15 mm).
The sieves were dried prior to analysis at 103°C in a drying oven, cooled in a desiccator, and
individually weighed. After the shaking process, the amount of particles retained on each
screen was determined by subtracting the weight of the sieve and the retained feed from the
blank weight of the sieve.
In the case of wet sieving, representative 100 gram samples of each diet were previously
suspended in 1000 ml water with occasional stirring. After one hour, each sample was
washed by flushing with 10 liters of water with corresponding pressures through the sieve
stack.
By weighting the sieves again after drying, fractions of feed particles on each screen were
detected, and the proportion of particle sizes (% of mass) was calculated in relation to the dry
matter content of the original feed sample.
3.4 Histological examinations
Tissue samples from the small intestine were used for the histological examinations. 8 to 10
cm long segments were removed from the duodenum, jejunum and ileum as described by
Uni (1999):
1. Apex of the duodenum
2. Midway between the point of entry of the bile ducts and Meckel’s diverticulum
3. 10 cm proximal to the ileocaecal junction

Material and methods
31
After flushing with cold PBS buffer, the excised samples were cut open longitudinally, placed
on cork boards, and subsequently fixed in Bouin’s solution. In total, samples from the
duodenum, jejunum and ileum of eight animals per feeding group were evaluated.
The histological preparation of the intestinal segments was conducted within one week after
sampling. After dehydration and infiltration with solidified paraffin wax, the samples were
embedded and stored in a refrigerator to cure until sectioning. The paraffin blocks were cut
with a sledge microtome, and the obtained sections were mounted on slides. Finally, the
sections were stained with Haematoxylin-Eosin (HE) and evaluated using a light microscope
for morphometric analyses. The equipment and reagents used for the histological work are
listed in Table 6. The individual steps of the procedure are described in detail in the following
chapter.
3.4.1 Histological preparation of the intestinal segments
Tissue samples from the small intestine were fixed in Bouin’s solution (according to Böck
1989) for 48 hours. The fixative comprised the following chemicals:
• 1500 ml of saturated picric acid
• 500 ml of 37 % formaldehyde
• 100 ml glacial acetic acid 99 to 100 %
After fixation, the samples were cut into small pieces sized with an area of ca. 5 x 10 mm and
a thickness of 5 mm, in order to ensure the rapid penetration of the fixation medium and
subsequently an optimal fixation quality (Meyer and Hornickel, 2011). Specimens were
passed through a series of liquids during the course of embedding, staining, and mounting
(Kiernan, 2008). At first, tissue samples were placed in plastic capsules and passed through
an ascending concentration of ethanol for dehydration, in order to make them suitable for the
following embedding process:
• 48 hours in 70 % ethanol + few drops of ammonia (conc.)
• 48 hours in 80 % ethanol
• 2 hours in 96 % ethanol
• 2 hours in isopropanol

Material and methods
32
The drops of ammonia (conc.) were added to the 70 % ethanol. After passing the ascending
concentrations of ethanol, samples were transferred into the clearing agent xylene for two
hours to remove the ethanol from the tissue.
After this procedure, the samples were stored in paraffin I overnight, placed in paraffin II for 4
hours on the next day, and finally transferred into paraffin III for another 4 hours. The process
of tissue infiltration with paraffin wax was carried out in an oven maintained at a temperature
of 60°C. In the last step, the tissue samples were embedded with fresh 60°C paraffin in metal
molds and afterwards hardened using a cooling plate at 4°C. The paraffin blocks were stored
in the refrigerator until sectioning.
The hardened blocks were cut with a sledge microtome. The 5 µm thick sections obtained
were placed in a warm water bath (40°C) in order to allow stretching. Then the sections were
carefully mounted on adhesive silanized glass slides and dried in an oven overnight at a
temperature of 37°C. For further storage, the sections were kept at room temperature.
3.4.2 Histological staining of the intestinal sections with Haematoxylin-Eosin
HE staining is a standard staining method implemented in histology that comprises
dichromatic staining, which is composed of the nucleus dye haematoxylin and the acidic
cytoplasm dye eosin (Böck, 1989). After staining, the nuclear chromatin appears blue to
purple while the cytoplasm, collagen and keratin are pink, which allows the differentiation of
the individual components of the section (Kiernan, 2008).
The staining method began with the process of deparaffinisation, in which adhering paraffin
wax was removed from the tissue by using xylene. Afterwards, the process of rehydration
was achieved by using descending concentrations of ethanol. This step was essential
because the staining process took place in an aqueous milieu and the agents xylene and
alcohol are immiscible with water. After staining with haemalum according to Mayer and
eosin, the slides were again dehydrated in ascending concentrations of ethanol, and finally
covered with the synthetic resin Histokitt®. The following protocol was applied:
1. Process of deparaffinisation and rehydration
• Xylene I 10 min
• Xylene II 10 min
• Isopropanol 6 min
• 96 % ethanol 3 min
• 80 % ethanol 3 min
• 70 % ethanol 3 min

Material and methods
33
• 50 % ethanol 3 min
• Aqua bidest I 3 min
• Aqua bidest II 3 min
2. Staining with haemalum and eosin
• Haemalum after Mayer 5 min
• Washing in running tap water 10 min
• 1 % eosin in Aqua dest. 3 min
• Washing in running tap water 1 min
3. Process of dehydratation
• 70 % ethanol 2 min
• 80 % ethanol 2 min
• 96 % ethanol 2 min
• Isopropanol 3 min
• Xylene I 10 min
• Xylene II 10 min
4. Covering slides with the synthetic resign Histokitt®
3.4.3 Microscopic evaluation
After staining with HE, the Bouin-fixed tissue slides of the different intestinal sections were
analyzed with a light microscope (Photomicroscope III, Zeiss, Germany), which was
equipped with a digital camera (DP72, Olympus, Germany) and a corresponding analysis
program (Cell Sense software, Olympus, Germany). The morphometric analyses were
focused on the intestinal villi with their crypts of Lieberkühn. The villus height (measured from
the tip of the villi to the villus crypt junction) and crypt depth (defined as the depth of the
invagination between adjacent villi) were measured for each intestinal segment (Figure 3).
20 villi and 20 crypts per section were examined while only vertically oriented villi and crypts
were taken into account. Per animal and intestinal segment (duodenum, jejunum, ileum), four
sections were analyzed. For the evaluation of the villus height and crypt depth, a 2x
respectively 4x magnification was used.

Material and methods
34
In total, 64 animals (1 animal per group x 8 groups x 8 repetitions) were examined taking the
single-blind method into account.
Figure 3: Microscopic picture of the intestinal mucosa of the ileum. Morphometric analysis was focused on the villus length (A) and the crypt depth (B), HE
A
B

Material and methods
35
Table 6: Overview of equipment and reagents
Product Supplier Based in
EC-350 paraffin-embedding station Microm Walldorf, Germany Sledge microtome, Typ 1400 Leitz Wetzlar, Germany Heraeus® drying oven, T5042 Heraeus electronic Hanau, Germany Rotilabo®-embedding cassettes Macro Carl Roth GmbH&Co.KG Karlsruhe, Germany Magnetic and heating stirrer, RH-KT/C IKA Labortechnik
GmbH&Co.KG Staufen, Germany
Coverslip, 24 x 50 mm VWR International Darmstadt, Germany
Histobond® microscope slides Marienfeld GmbH Lauda-Königshofen, Germany
Paraplast® Carl Roth GmbH&Co. KG Karlsruhe, Germany Haemalum after Mayer Carl Roth GmbH&Co.KG Karlsruhe, Germany
Eosin Merck Darmstadt, Germany
Xylene Medite Burgdorf, Germany
Ammonia (conc.) Merck Darmstadt, Germany
96 % ethanol denatured with Methylethylketon (MEK)
Carl Roth GmbH&Co.KG Karlsruhe, Germany
Isopropanol Carl Roth GmbH&Co.KG Karlsruhe, Germany 70 % ethanol Carl Roth GmbH&Co.KG Karlsruhe, Germany Roti®-Histokitt Carl Roth GmbH&Co.KG Karlsruhe, Germany Glacial acetic acid Carl Roth GmbH&Co.KG Karlsruhe, Germany 37 % Formaldehyde Carl Roth GmbH&Co.KG Karlsruhe, Germany Picric acid solution (saturated) Sigma-Aldrich Biochemie
GmbH Darmstadt, Germany
PBS (Phosphate Buffered Saline Substance Dubecco’s)
Biochrom AG Berlin, Germany
3.5 Ussing chamber technique
Over 60 years ago, the Danish scientists Ussing and Zerahn (1951) developed an apparatus
that was able to simultaneously determine the Na+ transport and electric current through frog
skin, today known as the Ussing chamber.
By eliminating transepithelial diffusion forces (osmotic and electrochemical gradients),
Ussing detected ion movements that are transported actively by epithelial cells and thus
provided the basis for subsequent research regarding transepithelial transport processes
(Clarke, 2009).

Material and methods
36
3.5.1 Ussing chamber design
Transepithelial voltage potential (Vt), short-circuit current (Isc) and electrical resistance (Rt)
were measured with a microcomputer-controlled voltage/current clamp (K. Mussler Scientific
Instruments, Aachen, Germany). The voltage clamp was connected with a modified net-
supported Ussing chamber (constructed by Freie Universität Berlin). The net was used in
order to protect the fragile tunica mucosa from hydrostatic and hydrodynamic loads. The
voltage/current clamp was attached to electrodes as follows:
• Agar salt bridges (mm) located close to the serosal and mucosal surface of the
mounted tissue provided contact to Ag-AgCl electrodes, that were used to measure
the transepithelial voltage potential Vt.
• Salt bridges (mm), situated in distance to the mounted tissue, connected the Ussing
chamber with Ag-AgCl electrodes, responsible for short-circuit current passing across
intestinal preparation.
3.5.2 Sampling and mounting of tissue in the Ussing chamber
In total, jejunal segments of 64 laying hens (1 animal per group x 8 groups x 8 repetitions)
were analyzed in the Ussing chamber.
The jejunum, maintained in oxygenated (95 % O2, 5 % CO2) and ice-cooled Krebs-Henseleit
buffer, was cut into sections of 5-7 cm, and existing fat and mesenteries were removed.
A longitudinal incision was placed along the mesenteric border of the jejunum to obtain the
tunica mucosa. It was subsequently placed vertically between the two halves of the Ussing
chamber (Figure 4), as described in detail by Ruhnke et al. (2013). The time span from
slaughtering of the animals to the mounting of the tissue in the chamber took place within 10
min.
The serosal and mucosal surface of the tissue, with an exposed area of 0.79 cm2, was
bathed in a modified Krebs-Henseleit buffer in glass reservoirs, each filled with 15 ml buffer
solution and connected to one of the chamber halves. The buffer was continually stirred,
heated to 38°C, and oxygenated with carbogen, a 95 % /5 % mixture of O2 and CO2, in order
to simulate the conditions in the chicken’s intestine. During the experiment, leads from above
permitted the addition of substances into the buffer of the respective half-cell.

Material and methods
37
Figure 4: Transfer of the jejunal mucosa onto the net supported Ussing chamber cylinder
3.5.3 Electrical measurements
Before inserting the tissue in the chamber, the resistance of the system, consisting of fluid
resistance, electrode resistance, and the resistance of the agarose bridges was determined
in order to obtain a blank value. This parameter was required for adequate calculation of
resistance and current.
After tissue insertion, the transepithelial resistance Rt was detected under open-circuit
conditions. The transepithelial voltage potential was measured in response to bipolar 50 μA
current pulses that were generated for 200 ms, and Rt, was calculated every 6 sec.
according to Ohm’s law. The transepithelial conductance (Gt) corresponds to the reciprocal
value of the transepithelial resistance, and both parameters represent an useful indicator for
the integrity of the sample.
After equilibration for approximately 8 to 10 minutes, the tissue was short-circuited by
clamping the voltage to 0 mV by passing the appropriate Isc through the Ag-AgCl electrodes.
After a tissue stabilization period of about 10 minutes, D - glucose (10 mmol/l) was added to
the buffer solution of the mucosal side of the chamber. Simultaneously, mannitol (10 mmol/l)
was added to the serosal side in order to maintain an osmotic balance across the mucosa.
After reaching a baseline of Isc, phloridzin (100 µmol/l) was applied to the mucosal side and
finally carbachol (100 µmol/l) was added to the serosal side of the tissue.
The electrical response was observed as the peak response, obtained approximately 1
minute after addition of the different substrates. The difference between the peak Isc/Gt and
the basal Isc/Gt expressed by ∆Isc represented the electrogenic ion movements by active
transport.

Material and methods
38
3.6 Fluorescence cytometry of lymphocyte subpopulations in gut-associated
lymphoid tissue
3.6.1 Principle of fluorescence cytometry
The method of Fluorescence Activated Cell Scanning (FACS) allows the measurement and
analyses of physical and molecular characteristics of cells or other particles. A fluorescence
cytometer is able to detect the size and granularity of single cells. If these cells were
previously labeled with a fluorescent dye, fluorescence signals can also be detected. The
particles are strung by a hydrodynamically focused stream of liquid, such that they are
consecutively hit by a monochromatic laser beam. The light scattered from each particle is
collected by band-pass filters. The forward light scatter (FS) is proportional to cell-surface
area or size. Side-scattered light (SS) is proportional to cell granularity or internal complexity.
Fluorescence signals emitted by the cells while passing the laser beam are detected by
photodetectors and amplified by photomultiplier tubes. The cell cytometer used in this study
has an argon laser beam that emits light at a wavelength of 488 nm as well as a red diode
laser that emits light at a wavelength of 635 nm.
Based on the light scattering and the fluorescence characteristics of individual cells, the flow
cytometer allows the differentiation, characterization and quantification of different cell
populations. The equipment and chemicals used for flow cytometric analyses are listed in
Table 9.
3.6.2 Preparation of the intraepithelial lymphocytes
At first, a protocol was established, which ensures the reliable determination of different
lymphocyte subsets from the gut-associated lymphoid tissue of laying hens using
fluorescence cytometry. For the analyses, the entire duodenum and jejunum were resected,
and adhering fat and mesenteries were removed. Afterwards, the segments were opened
longitudinally at the mesenteric side, flushed with PBS buffer to remove fecal contents, and
immediately transferred to the PBS buffer. In order to isolate and purify the intraepithelial
lymphocytes from the intestinal epithelium, incubation and centrifugation steps were
performed as follows (composition of media used for flow cytometric analyses are listed in
Table 10.

Material and methods
39
Isolation and purification of the lymphocyte subsets:
• Transfer of each tissue sample into 100 ml of media containing dithiothreitol (DDT)
and ethylenediamine tetraacetic acid (EDTA)
• Incubation of the sample in an orbital shaker at 110 rpm (revolutions per min) for 3 x
30 min at 4°C; filtering of the sample through a synthetic gauze after every 30 min to
obtain the cell suspension; transfer of the tissue sample to a fresh 100 ml medium;
incubation in order to obtain additional IELs
• Centrifugation of the obtained cell suspension at 600 x g for 10 min at 4°C
• Discarding of the supernatant without disturbing the pellet and resuspension of the
pellet in Hanks-balanced salt solution (HBSS)
• Addition of 60 µl DNAse (1 : 500 dilution); incubation of the sample after gentle
shaking at room temperature for 5 min
• Centrifugation at 600 x g for 10 min at 4°C
• Removal of the supernatant and resuspension of the pellet in 25 % Percoll solution so
as to eliminate remaining cellular debris and mucus; subsequent centrifugation at 600
x g for 20 min at 4°C
• Rejection of the supernatant and resuspension of the pellet in Roswell Park Memorial
Institute Medium No. 1640 (RPMI 1640) followed by centrifugation at 300 x g for 10
min at 4°C
• Discarding of the supernatant and resuspension of the pellet in RPMI 1640
• Assessment of the cells in regard to their vitality via trypan blue exclusion staining;
counting and adjustment in RPMI 1640 at 1 x 10⁶ cells/100µl
In order to ensure that only IELs were isolated from the intestinal tissue, several tissue
samples were fixed in Bouin’s solution, stained with HE and finally examined histologically.
The histological preparations were performed as described in chapter 3.4.
3.6.3 Immunostaining and flow cytometric analysis
In order to characterize the lymphocyte subpopulations of the epithelium, specific
fluorescence-labeled antibodies were used, which were directed specifically against certain
cell surface proteins. Thus, the different IELs were marked based on their cell surface
structure and analyzed in the FACS. The focus lay on the characterization and differentiation
of T cells and their subpopulations, NK cells, NKT cells and B cells. The fluorochromes that

Material and methods
40
were applied for the FACS analysis were fluorescein isothiocyanate (FITC), R-phycoerythrin
(R-PE) and Alexa Fluor 647. The primary and secondary antibodies used are listed in
Table 7 and Table 8. Additionally, isotype control antibodies were used in order to confirm
the specificity of primary antibody binding and to assess the level of background staining.
Table 7: Primary antibodies used for phenotyping of the IELs
Primary antibody Isotype Dilution Antigen specificity Target cells
Mouse Anti Chicken CD451 IgG2a 1:400 CD45 All leukocytes
Clone: UM 16-6
Mouse Anti chicken CD31 IgG1 1:100 CD3 T cells
Clone: CT-3
Rat Anti Human CD3:FITC1 Clone: CD3-12
IgG1 1:5 CD3 (surface and intracellular CD3 protein)
T cells NK cells (intracellular CD3 protein)
Mouse Anti Chicken CD8α:RPE1 Clone: 11-39
IgG1 1:10 CD8 alpha Cytotoxic T cells NK cells
Mouse Anti Chicken TCR γ/δ1 Clone: TCR-1
IgG1 1:50 Gamma/delta T cell receptor
γδ T cells
Mouse Anti Chicken TCRab/Vb14
Clone: TCR 2
IgG1 1:100 Alpha/beta T cell receptor
Subpopulation of αβ T cells
Mouse Anti Chicken TCRab/Vb24
Clone: TCR3
IgG1 1:100 Alpha/beta T cell receptor
Subpopulation of αβ T cells
Mouse Anti Chicken 28-44 IgG3 1:100 NK cell receptor NK cells
Mouse Anti Chicken AV201 IgG1 1:1000 B cell receptor B cells
Mouse Anti Chicken CD4-FITC1 IgG1 1:500 CD 4 T helper cells 1 AbD Serotec, Düsseldorf, Germany 2 Life Technologies, Darmstadt, Germany 3 Southern Biotech, Birmingham, USA 4 Prof. Thomas Göbel, Ludwig-Maximilians-Universität München (LMU), Germany
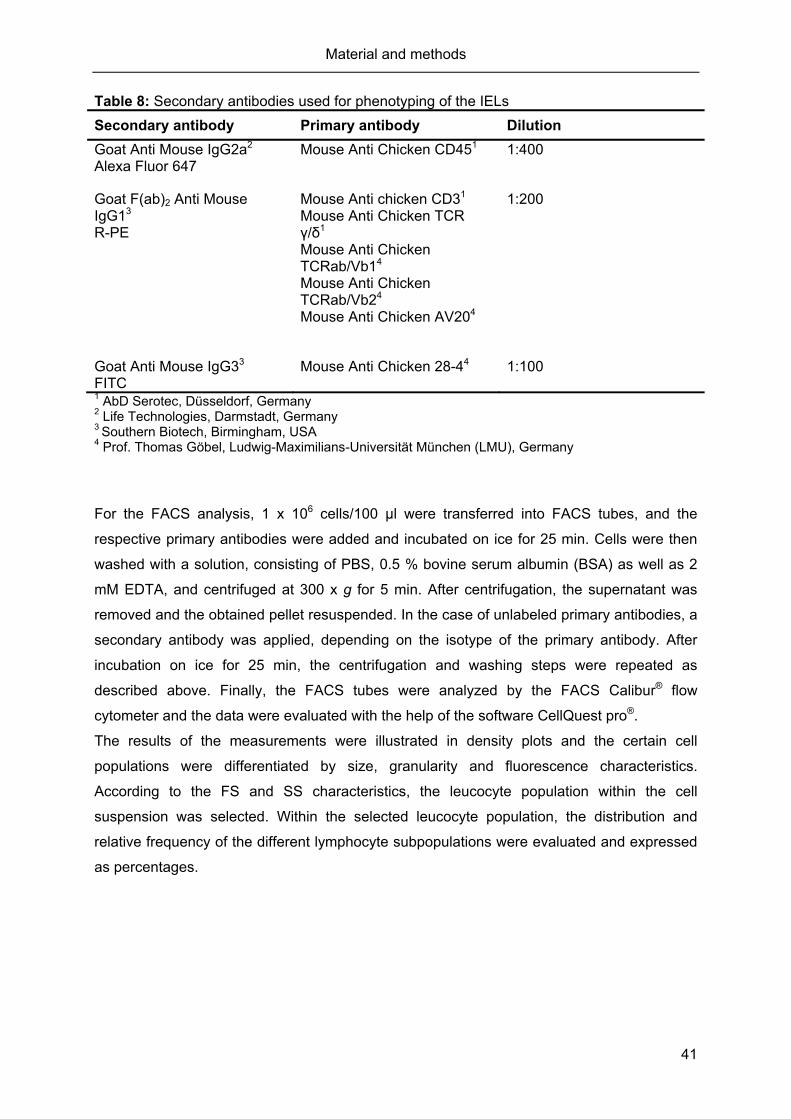
Material and methods
41
Table 8: Secondary antibodies used for phenotyping of the IELs
Secondary antibody Primary antibody Dilution
Goat Anti Mouse IgG2a2 Alexa Fluor 647
Mouse Anti Chicken CD451 1:400
Goat F(ab)2 Anti Mouse IgG13 R-PE
Mouse Anti chicken CD31 Mouse Anti Chicken TCR γ/δ1
Mouse Anti Chicken TCRab/Vb14 Mouse Anti Chicken TCRab/Vb24 Mouse Anti Chicken AV204
1:200
Goat Anti Mouse IgG33 FITC
Mouse Anti Chicken 28-44 1:100
1 AbD Serotec, Düsseldorf, Germany 2 Life Technologies, Darmstadt, Germany 3 Southern Biotech, Birmingham, USA 4 Prof. Thomas Göbel, Ludwig-Maximilians-Universität München (LMU), Germany
For the FACS analysis, 1 x 10⁶ cells/100 µl were transferred into FACS tubes, and the
respective primary antibodies were added and incubated on ice for 25 min. Cells were then
washed with a solution, consisting of PBS, 0.5 % bovine serum albumin (BSA) as well as 2
mM EDTA, and centrifuged at 300 x g for 5 min. After centrifugation, the supernatant was
removed and the obtained pellet resuspended. In the case of unlabeled primary antibodies, a
secondary antibody was applied, depending on the isotype of the primary antibody. After
incubation on ice for 25 min, the centrifugation and washing steps were repeated as
described above. Finally, the FACS tubes were analyzed by the FACS Calibur® flow
cytometer and the data were evaluated with the help of the software CellQuest pro®.
The results of the measurements were illustrated in density plots and the certain cell
populations were differentiated by size, granularity and fluorescence characteristics.
According to the FS and SS characteristics, the leucocyte population within the cell
suspension was selected. Within the selected leucocyte population, the distribution and
relative frequency of the different lymphocyte subpopulations were evaluated and expressed
as percentages.

Material and methods
42
Table 9: Overview of equipment and reagents
Product Supplier Based in
Heraeus®Megafuge®1.0R Thermo Scientific Karlsruhe, Germany MaxQShakers Fisher Scientific GmbH Schwerte, Germany FACS Calibur® Becton Dickinson Bioscience San José, USA CellQuest pro® Becton Dickinson Bioscience San José, USA FACS-tubes Falcon (Becton Dickinson) Franklin Lake, USA Sefar Nitex (120µm Nilon net) Sefar AG Heiden, Switzerland HBSS (Hanks balanced salt solution) Biochrom AG Berlin, Germany EDTA > 99 % Carl Roth GmbH&Co.KG Karlsruhe, Germany (ethylenediaminetetraacetic acid) 1,4-Dithiothreitol >99 % Sigma-Aldrich Biochemie
GmbH Hamburg, Germany
Instamed 9.55 g/L PBS Dulbecco Biochrom AG Berlin, Germany w/0 Ca2+, Mg2+ RPMI,1640 (Roswell Park Memorial Institute Medium)
Biochrom AG Berlin, Germany
PercollTM GE Healthcare Bio Science Uppsala, Sweden DNAse Sigma-Aldrich Biochemie
GmbH Hamburg, Germany
Hepes Pufferan® >99 % Carl Roth GmbH&Co.KG Karlsruhe, Germany
Table 10: Media and buffer
DTT-EDTA Medium 1,4-Dithiothreitol (DTT) Ethylenediaminetetraacetic acid (EDTA)
2 mM 1 mM
Percoll (90 %) 10 x HBSS NaHCO3
Percoll (density: 1.131 g/ml)
10 ml 0.175 g 90 ml
Percoll (25 %) HBSS without Ca2+ and Mg2+
Percoll (90 %)
43.34 ml 16.66 ml

Material and methods
43
3.7 Statistical analysis
Statistical analyses were conducted using SPSS (version 21.0, Chicago, IL, USA).
The floor pen represented the experimental unit. Means and standard deviations for each of
the eight experimental groups (mean ± SD) are reported.
The Shapiro-Wilk Test was used to test whether the data were normally distributed.
Since the sample under investigation was found to be normally distributed, all data were
analyzed by using a three-factor analysis of variance to control for interaction and single
factor effects with respect to the factors milling method, physical form and particle size of the
diet (2 x 2 x 2 factorial arrangement).
Additionally, a one-way ANOVA and the post hoc Tukey’s test were performed in order to
identify significant differences between the eight feeding groups. Results tables show
superscript notation. Group means with different superscripts are significantly different in
Tukey’s post-hoc test. Differences were considered significant at P < 0.05.
Statistical analyses were adjusted with respect to the initial body weight, in order to take into
account that minor changes in the initial body weights within the groups could have effects
on the results of the overall performance data. Therefore, the variable “baseline body weight”
was defined.
With regard to the flow cytometric analyses the fractions of CD4+ and AV20+ cells were not
included in the statistical analysis due small sample sizes. Data were expressed in means
and standard deviations.
The graphical presentation (box plots) of the data was done with SPSS 21.0 while the scatter
plots showing the results of the flow cytometric analyses were performed using the software
CellQuest pro®.
.

44
4 Results
4.1 Particle size distribution of the feed
In order to assess the particle sizes and the particle size distribution of the different diets, dry
sieving as well as wet sieving analyses were conducted.
The results of the dry sieving and the wet sieving analysis for each diet are presented in
Table 11 and in Table 12.
Table 11: Proportion of particle sizes (% of mass) in the diets based on dry sieve analysis
Roller mill Hammermill
Mash Expandate Mash Expandate
Particle size (mm)
Coarse Fine Coarse Fine Coarse Fine Coarse Fine
> 4.0 3.05 0.37 7.63 0.38 7.63 0.08 2.55 0.00
> 2.5 ≤ 4.0 22.0 2.11 27.0 8.54 31.0 11.1 24.6 1.96
> 2.0 ≤ 2.5 14.6 8.82 18.91 7.86 10.4 19.3 25.1 10.6
> 1.6 ≤ 2.0 11.0 19.8 15.36 12.1 7.42 18.3 13.2 20.9
> 1.25 ≤ 1.6 12.1 21.4 8.66 11.0 10.1 14.4 7.41 21.0
> 1.0 ≤ 1.25 8.21 11.8 5.73 10.8 8.97 10.7 5.51 11.8
> 0.63 ≤ 1.0 14.2 15.5 8.47 15.4 12.2 13.3 9.64 15.0
> 0.4 ≤ 0.63 7.93 8.85 4.12 18.7 5.62 6.50 5.64 9.22
> 0.15 ≤ 0.4 6.02 9.36 3.36 14.0 6.64 6.10 5.42 8.10
< 0.15 0.93 1.97 0.78 1.12 0.11 0.32 0.96 1.37
Ʃ 100 100 100 100 100 100 100 100
> 2.5 25.1 2.49 34.6 8.92 38.6 11.2 27.1 1.96
> 1 to ≤ 2.5 45.8 61.9 48.7 41.8 36.8 62.6 51.2 64.4 > 0.15 to ≤
128.1 33.7 15.9 48.2 24.5 25.9 20.7 32.3
< 0.15 0.93 1.97 0.78 1.12 0.11 0.32 0.96 1.37
The results of the dry sieving analysis show that the proportion of coarse particles (> 2.5 mm)
exceeded 25 % in coarse feed while the proportion of coarse particles in the finely ground
diets ranged from 2 % to 11 %. The proportion of particles with a size of > 1 mm to ≤ 2.5 mm
ranged from 37 % to 46 % in coarsely ground mash and was about 50 % in coarsely ground
expandate. With regard to the finely ground mash diets, approx. 62 % of the particles were
sized between > 1 mm and ≤ 2.5 mm, while in the finely ground expandate, 42 % to 64 % of
the particles were of this size. In fine feed, the largest portion of particles was between > 0.15

Results
45
mm to ≤ 2.5 mm. In all diets, less than 2 % of particles passed through the 0.15 mm sieve.
The results of the dry sieving analysis underline the differences in particle size distribution
between coarse and fine grinding, independently of the milling method and thermal
processing techniques implemented. This is not in accordance with the results of the wet
sieving analysis, as shown in Table 12.
Table 12: Proportion of particle sizes (% of mass) in the diets based on wet sieve analysis
Roller mill Hammermill
Mash Expandate Mash Expandate
Particle size (mm)
Coarse Fine Coarse Fine Coarse Fine Coarse Fine
> 4.0 9.39 0.23 0.00 0.00 18.2 0.11 0.11 0.00
> 2.5 ≤ 4.0 23.3 5.32 6.47 0.00 37.4 11.8 11.3 0.34
> 2.0 ≤ 2.5 9.28 13.7 10.9 0.23 7.96 14.9 9.74 4.18
> 1.6 ≤ 2.0 7.81 17.3 7.61 2.04 6.82 12.4 4.87 6.22
> 1.25 ≤ 1.6 7.58 11.7 5.34 4.08 6.48 10.3 4.53 5.65
> 1.0 ≤ 1.25 5.32 6.23 4.20 3.40 2.73 4.92 3.17 3.28
> 0.63 ≤ 1.0 6.79 6.23 6.47 7.37 3.18 7.66 7.14 7.57
> 0.4 ≤ 0.63 4.41 3.51 4.20 6.35 1.25 4.46 6.34 6.67
> 0.15 ≤ 0.4 3.85 4.30 7.72 9.86 1.48 5.03 7.70 8.70
< 0.15 22.3 31.5 47.1 66.7 14.5 28.5 45.1 57.4
Ʃ 100 100 100 100 100 100 100 100
> 2.5 32.7 5.55 6.47 0.00 55.6 11.9 11.4 0.34
> 1 to ≤ 2.5 30.0 48.9 28.0 9.74 24.0 42.4 22.3 19.3
> 0.15 ≤ 1 15.0 14.0 18.4 23.6 5.91 17.2 21.2 22.9
< 0.15 22.3 31.5 47.1 66.7 14.5 28.5 45.1 57.4
In general, there was an increase of particles sized < 0.15 mm in all diets in comparison with
the results of the dry sieving analysis. Concerning the coarsely ground expandate, on
average, 34 % of the particles were sized > 1 mm, while about 46 % were sized < 0.15 mm.
In the finely ground expandate, the proportion of particles sized > 1 mm were on average 15
% and particles sized < 0.15 mm were on average 62 %. With regard to particles sized > 2.5
mm, there was an increase in the proportion of about 10 % in the coarsely ground mash
diets. However, the particle size distribution of the coarsely ground mash diets was
comparable with that of the dry sieving analysis. This was also the case for the finely ground
mash diets, although a shift occurred from medium-sized particles in favor of particles sized
< 0.15 mm.

Results
46
4.2 Animal performance
The laying performance (egg weight and egg production) of each feeding group was
recorded daily, and the feed intake (FI) and body weight (BW) determined weekly. From
these data, the feed conversion ratio (kg of feed/kg of weight gain; FCR) and the feed
efficiency (kg of feed/kg of eggs; FE) were calculated.
Table 13 provides the collected data for feed intake, body weight, body weight gain (BWG)
and feed conversion ratio determined for the different feeding groups during the experimental
periods and for the total trial period. The average daily FI (g/hen) ranged from 105 g to 113 g
with regard to the total experimental period. On average, the FI increased over the course of
the trial, so that in the first week the FI was 99 g to 106 g, whereas it increased to 112 g to
119 g during the last week of the trial.
Similar to the FI, the BW increased during the experimental period. At day one, the animals
were randomly allocated to the eight different feeding groups and the initial body weights
(baseline body weights) showed no significant differences between the groups, thus, the
comparability of the groups and their performances were ensured. However, statistical
analyses were adjusted with respect to the baseline body weight, in order to take into
account that minor changes in the initial body weights within the groups could have effects
on the results of the performance data.
The baseline body weights were about 1500 g per hen on average, and values of about
1700 g were recorded for the final body weights. Average weekly weight gains of the laying
hens were highest in the first experimental week and decreased over the course of the
experiment. Regarding to the total experimental period, the weekly BWGs were between
54 g and 66 g per hen. The FCR was calculated on the basis of the FI (kg of feed) and BWG
(kg of gain). In the first week, FCRs were uniform among the different feeding groups and
ranged between 1.0 and 1.5. With regard to the second and third week, FCRs for the
different feeding groups were higher and subject to major fluctuations. These variations can
be explained by the increased laying performance during this period. Thus, the values for the
BWGs decreased during the course of the experiment, while EWs and EP increased.
Concerning the total experimental period, FCR values of 1.8 to 2.5 were achieved among the
feeding groups.
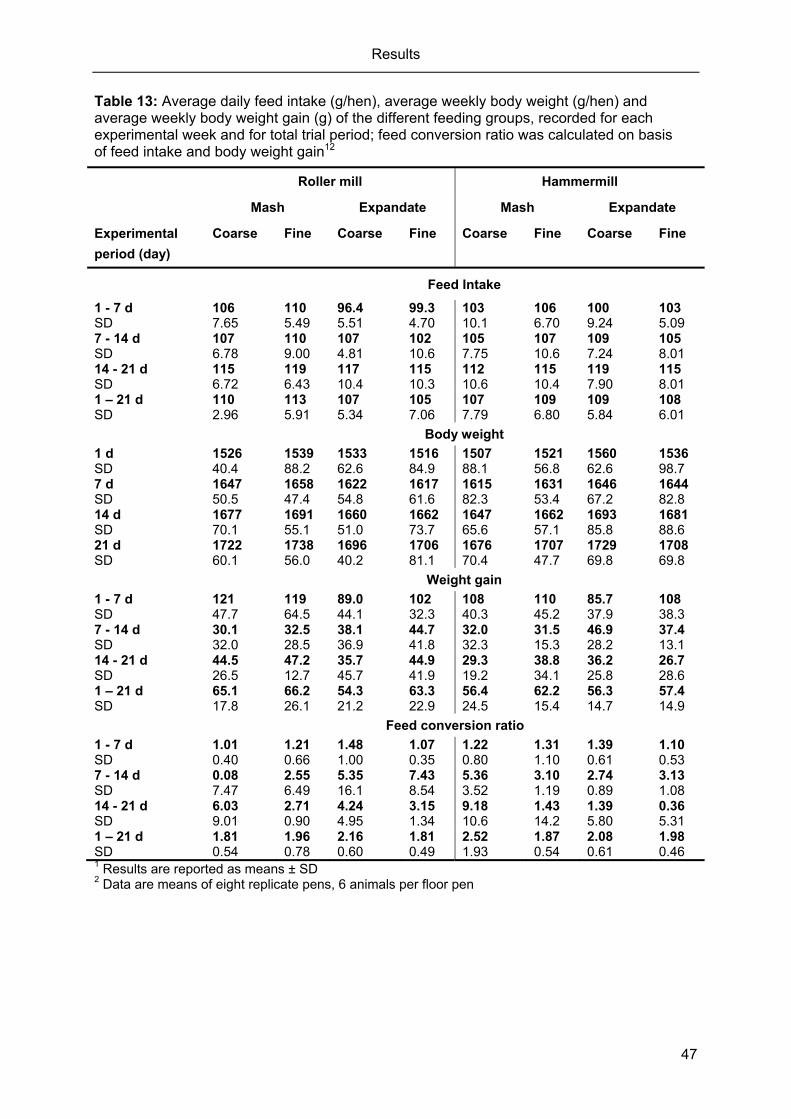
Results
47
Table 13: Average daily feed intake (g/hen), average weekly body weight (g/hen) and average weekly body weight gain (g) of the different feeding groups, recorded for each experimental week and for total trial period; feed conversion ratio was calculated on basis of feed intake and body weight gain12
1 Results are reported as means ± SD 2 Data are means of eight replicate pens, 6 animals per floor pen
Roller mill Hammermill
Mash Expandate Mash Expandate
Experimental
period (day)
Coarse Fine Coarse Fine Coarse Fine Coarse Fine
Feed Intake
1 - 7 d SD
106 7.65
110 5.49
96.4 5.51
99.3 4.70
103 10.1
106 6.70
100 9.24
103 5.09
7 - 14 d SD
107 6.78
110 9.00
107 4.81
102 10.6
105 7.75
107 10.6
109 7.24
105 8.01
14 - 21 d SD
115 6.72
119 6.43
117 10.4
115 10.3
112 10.6
115 10.4
119 7.90
115 8.01
1 – 21 d SD
110 2.96
113 5.91
107 5.34
105 7.06
107 7.79
109 6.80
109 5.84
108 6.01
Body weight
1 d SD
1526 40.4
1539 88.2
1533 62.6
1516 84.9
1507 88.1
1521 56.8
1560 62.6
1536 98.7
7 d SD
1647 50.5
1658 47.4
1622 54.8
1617 61.6
1615 82.3
1631 53.4
1646 67.2
1644 82.8
14 d SD
1677 70.1
1691 55.1
1660 51.0
1662 73.7
1647 65.6
1662 57.1
1693 85.8
1681 88.6
21 d SD
1722 60.1
1738 56.0
1696 40.2
1706 81.1
1676 70.4
1707 47.7
1729 69.8
1708 69.8
Weight gain
1 - 7 d SD
121 47.7
119 64.5
89.0 44.1
102 32.3
108 40.3
110 45.2
85.7 37.9
108 38.3
7 - 14 d SD
30.1 32.0
32.5 28.5
38.1 36.9
44.7 41.8
32.0 32.3
31.5 15.3
46.9 28.2
37.4 13.1
14 - 21 d SD
44.5 26.5
47.2 12.7
35.7 45.7
44.9 41.9
29.3 19.2
38.8 34.1
36.2 25.8
26.7 28.6
1 – 21 d SD
65.1 17.8
66.2 26.1
54.3 21.2
63.3 22.9
56.4 24.5
62.2 15.4
56.3 14.7
57.4 14.9
Feed conversion ratio
1 - 7 d SD
1.01 0.40
1.21 0.66
1.48 1.00
1.07 0.35
1.22 0.80
1.31 1.10
1.39 0.61
1.10 0.53
7 - 14 d SD
0.08 7.47
2.55 6.49
5.35 16.1
7.43 8.54
5.36 3.52
3.10 1.19
2.74 0.89
3.13 1.08
14 - 21 d SD
6.03 9.01
2.71 0.90
4.24 4.95
3.15 1.34
9.18 10.6
1.43 14.2
1.39 5.80
0.36 5.31
1 – 21 d SD
1.81 0.54
1.96 0.78
2.16 0.60
1.81 0.49
2.52 1.93
1.87 0.54
2.08 0.61
1.98 0.46

Results
48
The laying performance, expressed by the parameters egg weight (EW), egg production (EP)
and feed efficiency (FE), also showed no significant differences between the feeding groups
as analyzed by ANOVA and posthoc Tukey’s test (Table 14).
An increase of EWs and EP was detected during the trial period. At the beginning, average
EWs of 47 g to 49 g were found, and the average EP was between 37 % and 46 %.
In the last week of the experiment, EWs were between 53 g and 55 g, and the EP ranged
from 89 % to 95 %. The FE was calculated in accordance with FI (kg of feed) and EW (kg of
egg weight). The detected weekly FEs were comparable among the feeding groups and
barely changed during the course of the experiment. Concerning the total experimental
period, FE values of 2.0 to 2.2 were calculated for the feeding groups on average.
In order to control for interaction and single factor effects, a three-factor analysis of variance
was conducted on collected performance data concerning the different experimental periods
(Table 15) and the total experimental period (Table 16). Statistical analyses were adjusted
regarding the baseline body weight. Statistical significances were detected for the covariate
“baseline body weight” in each experimental week as well as in the total experimental period,
indicating that there were differences in the initial body weights of laying hens within the
feeding groups. The physical form of the diet affected the FI and FE of hens in the first
experimental week. The FI and FE of laying hens, fed with mash diets, were significantly
higher compared with those that received the expandate (FI: P < 0.001; FE: P = 0.005).
Furthermore, in the last experimental week, the FCR was influenced by the factor particle
size and was significantly higher for birds that were fed with coarsely ground feed in
comparisons with those fed finely ground feed (P = 0.042). With regard to the total
experimental period, the three-factor analysis of variance on selected performance data
showed no interaction and single factor effects, except for the parameter FI. The FI was
significantly influenced by the physical form of the feed (P = 0.045). The FI of laying hens
that consumed the mash diets were higher than the FI of hens fed with the expandate
(Figure 5).

Results
49
Table 14: Average weekly egg weight (g) and average weekly egg production (%) of the different feeding groups, recorded for each experimental week and for the total trial period. Average weekly feed efficiency was calculated from the average daily feed intake and the average weekly egg weight 12
1 Results are reported as means ± SD 2 Data are means of eight replicate pens, 6 animals per floor pen
Roller mill Hammermill
Mash Expandate Mash Expandate
Experimental period (day)
Coarse Fine Coarse Fine Coarse Fine Coarse Fine
Egg weight
1 - 7 d SD
47.8 3.93
49.0 3.22
47.1 3.28
48.2 4.88
48.4 3.91
47.9 2.72
48.0 3.30
47.6 1.54
7 - 14 d SD
50.5 1.69
51.6 2.66
51.1 2.86
51.9 3.54
51.5 2.80
51.6 1.61
52.9 2.22
50.2 1.71
14 - 21 d SD
53.6 1.68
55.1 2.45
54.5 2.53
54.9 2.80
54.5 2.14
54.7 2.24
55.4 2.28
53.6 1.67
1 – 21 d SD
50.6 1.97
51.9 2.59
50.9 2.68
51.6 3.67
51.5 2.75
51.4 2.05
52.1 2.30
50.5 0.88
Egg production
1 - 7 d SD
37.4 18.7
46.4 21.8
40.6 14.8
30.7 12.3
35.7 20.3
45.3 22.8
42.9 13.9
43.2 21.0
7 - 14 d SD
77.3 13.6
82.7 9.10
81.3 11.6
75.6 14.9
77.6 10.7
82.0 12.7
76.5 13.5
82.5 10.4
14 - 21 d SD
89.0 6.15
92.6 3.52
89.2 10.2
89.3 5.47
92.2 5.97
95.2 6.78
91.3 6.57
90.8 11.3
1 – 21 d SD
67.9 9.45
73.9 9.42
70.4 9.01
65.2 8.55
68.5 10.7
74.2 12.3
70.2 6.48
72.1 9.54
Feed efficiency
1 - 7 d SD
2.23 0.19
2.26 0.13
2.05 0.13
2.08 0.17
2.14 0.19
2.21 0.11
2.09 0.12
2.17 0.14
7 - 14 d SD
2.12 0.12
2.14 0.12
2.09 0.07
1.97 0.19
2.04 0.09
2.07 0.18
2.06 0.18
2.10 0.15
14 - 21 d SD
2.15 0.07
2.16 0.10
2.14 0.15
2.09 0.15
2.06 0.17
2.10 0.15
2.14 0.12
2.15 0.15
1 – 21 d SD
2.17 0.07
2.18 0.08
2.10 0.06
2.04 0.12
2.08 0.12
2.13 0.10
2.10 0.11
2.14 0.10

Results
50
Table 15: Interaction and single factor effects of a three-factor analysis of variance on performance data recorded in the feeding groups for the different experimental periods. Statistical analysis was adjusted regarding to the baseline body weight
P-value
Experimental period: 1 – 7 d
Feed intake
Body weight
Weight gain
FCR Egg weight
Egg production
Feed efficiency
Baseline body weight
0.208 <0.001 <0.001 0.003 0.041 0.605 0.373
Mill (M) 0.967 0.685 0.645 0.756 0.924 0.533 0.994 Physical form (F) <0.001 0.144 0.158 0.893 0.391 0.661 0.005 Particle size (PS) 0.094 0.426 0.394 0.605 0.690 0.622 0.198 M * F 0.061 0.188 0.163 0.329 0.963 0.402 0.069 M * PS 0.779 0.768 0.724 0.954 0.348 0.564 0.526 F * PS 0.997 0.734 0.783 0.284 0.806 0.158 0.914 M * F * PS 0.867 0.933 0.975 0.702 0.945 0.608 0.984
Experimental period: 7 – 14 d
P-value
Baseline body weight
<0.001 <0.001 0.639 0.686 0.002 0.973 0.036
Mill (M) 0.946 0.789 0.938 0.880 0.651 0.889 0.711 Physical form (F) 0.212 0.768 0.168 0.340 0.937 0.768 0.212 Particle size (PS) 0.743 0.553 0.967 0.715 0.815 0.413 0.833 M * F 0.411 0.282 0.935 0.088 0.370 0.849 0.159 M * PS 0.974 0.874 0.527 0.398 0.054 0.393 0.196 F * PS 0.151 0.893 0.832 0.730 0.294 0.448 0.447 M * F * PS 0.689 0.835 0.655 0.683 0.306 0.317 0.303
Experimental period: 14 – 21 d
P-value
Baseline body weight
0.017 <0.001 0.009 0.357 0.001 0.267 0.383
Mill (M) 0.532 0.360 0.233 0.407 0.973 0.216 0.467 Physical form (F) 0.770 0.523 0.523 0.396 0.987 0.227 0.748 Particle size (PS) 0.856 0.378 0.519 0.042 0.791 0.383 0.936 M * F 0.504 0.191 0.658 0.656 0.359 0.648 0.186 M * PS 0.885 0.796 0.854 0.353 0.110 0.877 0.443 F * PS 0.287 0.657 0.289 0.170 0.252 0.418 0.588 M * F * PS 0.937 0.406 0.252 0.355 0.711 0.980 0.886

Results
51
Table 16: Interaction and single factor effects of a three-factor analysis of variance on selected performance data detected in the different feeding groups for the total experimental period. Statistical analysis was adjusted regarding to the baseline body weight
P-value
Total experimental period Feed intake
Body weight
Weight gain
Egg weight
Egg production
Baseline body weight 0.001 <0.001 <0.001 0.003 0.526 Mill (M) 0.737 0.577 0.360 0.909 0.435 Physical form (F) 0.045 0.417 0.523 0.698 0.472 Particle size (PS) 0.506 0.412 0.378 0.844 0.373 M * F 0.134 0.183 0.191 0.552 0.610 M * PS 0.858 0.941 0.796 0.116 0.484 F * PS 0.236 0.985 0.657 0.567 0.149 M * F * PS 0.836 0.702 0.406 0.677 0.443
Figure 5: Influence of feed form (mash vs. expandate) on the daily FI (g/hen), recorded for the first experimental week ( 1d – 7d) and the total experimental period (1d – 21d).* P < 0.05; *** P < 0.01

Results
52
4.3 Organ weights of the proventriculus, gizzard, segments of the small
intestine and the pancreas
The weights of digestive tract organs were calculated as relative organ weights based on
organ-to-body weight ratio (Table 17).
Table 17: Empty relative weight (g/kg body weight) of the gastrointestinal organs of laying hens, fed with the different diets (N = number of analyzed samples). Statistical analyses were conducted by ANOVA and posthoc Tukey’s test
Roller mill Hammermill
Mash Expandate Mash Expandate
Organ weight (g/kg)
Coarse Fine Coarse Fine Coarse Fine Coarse Fine
Proventriculus1 3.38 3.37 3.17 3.31 3.50 3.30 3.22 3.11
SD 0.30 0.34 0.28 0.28 0.35 0.26 0.27 0.12 N3 32 32 31 31 30 30 32 31
Gizzard12 16.6a 15.4ab 14.2bcd 13.6cd 16.5a 14.9abc 13.7cd 12.8d
SD 1.01 1.31 1.53 1.18 1.30 0.80 0.77 0.81 N3 32 32 31 31 30 29 31 31
Duodenum1 7.28 7.15 7.19 6.92 7.01 6.79 6.96 6.92
SD 0.89 0.56 0.56 0.69 0.92 0.36 0.72 0.40 N3 32 32 31 31 30 30 32 31
Jejunum1 11.3 11.1 11.2 11.5 11.6 10.8 10.9 11.0
SD 1.47 1.26 0.93 1.43 1.74 1.43 1.05 1.01 N3 32 32 31 30 30 30 32 31
Ileum1 6.62 6.21 6.55 6.43 6.13 6.20 6.24 6.70
SD 0.66 0.84 0.55 0.71 0.52 0.33 0.89 0.69 N3 32 32 30 31 30 30 32 31
In total1 45.1 43.2 42.4 41.7 44.7 42.1 40.8 40.5
SD 3,43 3.11 2.88 3.21 3.33 2.54 3.14 1.57 N3 32 32 30 30 30 29 31 31
Pancreas1 1.89 1.84 1.71 1.70 1.89 1.71 1.70 1.72
SD 0.12 0.16 0.25 0.16 0.33 0.16 0.14 0.14 N3 27 27 26 26 26 26 24 24 1 Results are reported as means ± SD. 2 a-d Means with different superscripts are significantly different (P < 0.05) 3 Sample sizes vary due to missing samples

Results
53
Among the different feeding groups, significant differences were detected concerning the
relative organ weight of the gizzard. Relative gizzard weights were on average higher in
laying hens fed mash diets compared to those fed expanded diets. The highest gizzard
weights were observed in birds fed with the coarsely ground mash diets, followed by birds
fed with finely ground mash diets, irrespective of whether either a hammermill or roller mill
was used for feed production.
In order to control for interaction and single factor effects, a three-factor analysis of variance
was conducted, illustrating significant differences regarding the relative organ weights (Table
18).
Table 18: Interaction and single factor effects of a three-factor analysis of variance on empty relative organ weight (g/kg body weight) observed in the eight different feeding groups
P-value
Proven-triculus
Gizzard Duodenum Jejunum Ileum In total
Pancreas
Mill (M) 0.702 0.101 0.207 0.554 0.430 0.150 0.565 Physical form (F) 0.011 <0.001 0.713 0.810 0.269 0.002 0.019 Particle size (PS) 0.517 <0.001 0.338 0.688 0.992 0.073 0.260 M * F 0.496 0.481 0.551 0.485 0.458 0.676 0.468 M * PS 0.125 0.576 0.831 0.576 0.119 0.907 0.680 F * PS 0.416 0.298 0.944 0.312 0.311 0.236 0.303 M * F * PS 0.838 0.922 0.627 0.775 0.890 0.754 0.428
Concerning the proventriculus, gizzard and pancreas, the results show that the physical form
of the diet was the main factor which influenced organ weight development (P < 0.01), while
no combined effects of factors were observed. In general, birds fed with mash diets had
significantly higher organ weights with regard to the proventriculus, gizzard, pancreas and
total organ weight compared to birds fed the expandate. Additionally, the factor particle size
affected the relative organ weights of the gizzard (P < 0.001) i. e. hens fed with coarsely
ground feed had significantly higher gizzard weights than hens given the finely ground diets.
Owing to the increased gizzard weights, the total weight of the investigated organs were also
significantly affected by the factor physical form of the diet (P = 0.002).
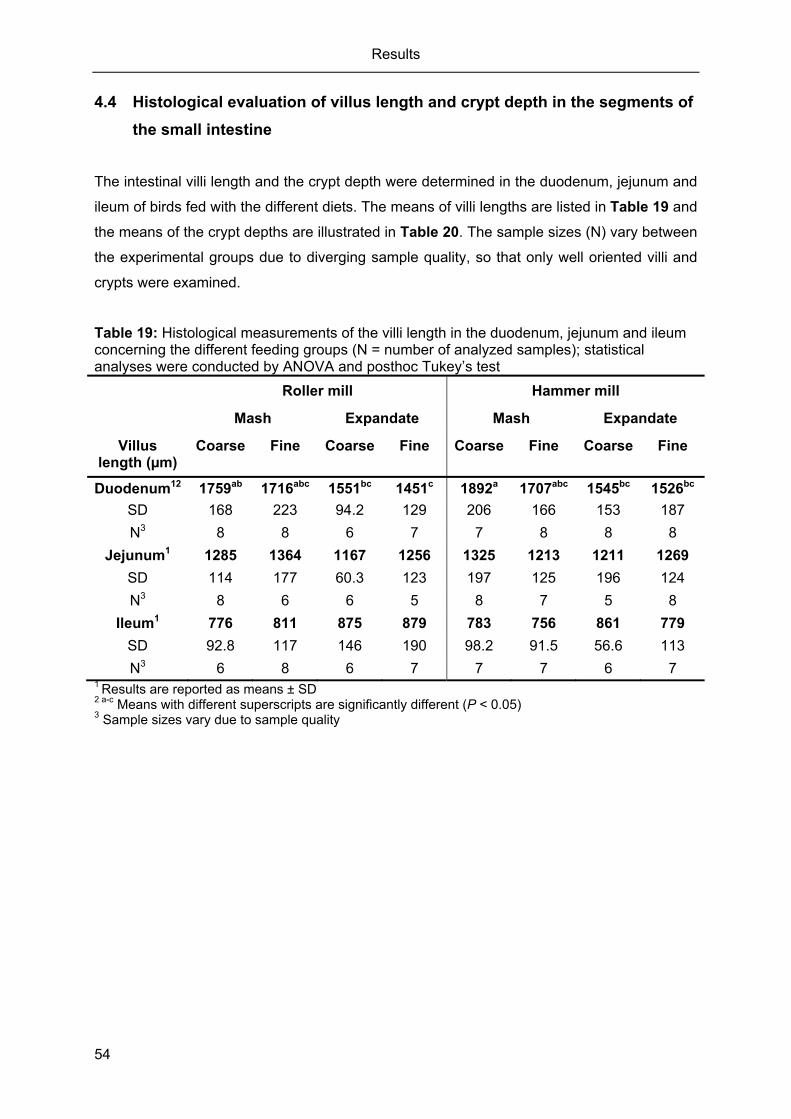
Results
54
4.4 Histological evaluation of villus length and crypt depth in the segments of
the small intestine
The intestinal villi length and the crypt depth were determined in the duodenum, jejunum and
ileum of birds fed with the different diets. The means of villi lengths are listed in Table 19 and
the means of the crypt depths are illustrated in Table 20. The sample sizes (N) vary between
the experimental groups due to diverging sample quality, so that only well oriented villi and
crypts were examined.
Table 19: Histological measurements of the villi length in the duodenum, jejunum and ileum concerning the different feeding groups (N = number of analyzed samples); statistical analyses were conducted by ANOVA and posthoc Tukey’s test
Roller mill Hammer mill
Mash Expandate Mash Expandate
Villus length (µm)
Coarse Fine Coarse Fine Coarse Fine Coarse Fine
Duodenum12 1759ab 1716abc 1551bc 1451c 1892a 1707abc 1545bc 1526bc
SD 168 223 94.2 129 206 166 153 187
N3 8 8 6 7 7 8 8 8
Jejunum1 1285 1364 1167 1256 1325 1213 1211 1269
SD 114 177 60.3 123 197 125 196 124
N3 8 6 6 5 8 7 5 8
Ileum1 776 811 875 879 783 756 861 779
SD 92.8 117 146 190 98.2 91.5 56.6 113
N3 6 8 6 7 7 7 6 7 1 Results are reported as means ± SD 2 a-c Means with different superscripts are significantly different (P < 0.05) 3 Sample sizes vary due to sample quality

Results
55
Table 20: Histological measurements of the crypt depth in the duodenum, jejunum and ileum with regard to the eight different feeding groups (N = number of analyzed samples)
Roller mill Hammer mill
Mash Expandate Mash Expandate
Crypt depth (µm)
Coarse Fine Coarse Fine Coarse Fine Coarse Fine
Duodenum1 244 223 237 250 250 218 265 246
SD 32.9 19.2 26.0 31.7 41.8 39.0 28.6 26.5
N2 8 8 6 7 7 8 8 8
Jejunum1 209 200 198 196 187 182 216 194
SD 56.3 32.6 36.4 64.0 46.7 43.5 40.5 19.8
N2 8 6 6 5 8 7 5 8
Ileum1 139 118 126 128 125 111 137 122
SD 47.7 10.8 10.0 19.7 15.9 18.8 19.0 20.2
N2 6 8 6 7 7 7 6 7 1 Results are reported as means ± SD 2 Sample sizes vary due to sample quality
Among the feeding groups, significant differences were detected regarding the villi length of
the duodenum. In general, birds fed with mash diets had significantly longer duodenal villi
compared with chicks that consumed expandate. The longest villi were detected for laying
hens fed with the coarsely ground mash diets, followed by those fed with finely ground mash
diets. No significant differences were found between the feeding groups with regard to the
villus length of the jejunum and ileum, as well concerning the crypt depth of the duodenum,
jejunum and ileum.
In order to examine interaction and single factor effects, a three-factor analysis of variance
was conducted (Table 21). Whereas no interaction and single factor effects were assessed
concerning the factors mill and particle size, significant differences were observed regarding
the factor physical form of the diet. Hens fed with mash diets had longer duodenal (P <
0.001) and shorter ileal (P = 0.47) villi than those given the expandate. Additionally, the
feeding of mash tended to increase jejunal villus height (P = 0.087), while expanded fed birds
showed tendentially deeper duodenal crypts (P = 0.053). Moreover coarsely instead of finely
ground feed tended to promote duodenal villus height (P = 0.057), duodenal crypt depth (P =
0.072) as well as ileal crypt depth (P = 0.061).

Results
56
Table 21: Interaction and single factor effects of a three-factor analysis of variance on villus length and crypt depth determined for the eight different feeding groups
P-value
Villus length Crypt depth
Duodenum Jejunum Ileum Duodenum Jejunum Ileum
Mill (M) 0.285 0.739 0.221 0.436 0.637 0.547 Physical form (F) <0.001 0.087 0.047 0.053 0.597 0.407 Particle size (PS) 0.057 0.486 0.597 0.072 0.432 0.061 M * F 0.763 0.308 0.618 0.494 0.264 0.299 M * PS 0.733 0.178 0.267 0.201 0.756 0.689 F * PS 0.546 0.272 0.508 0.149 0.834 0.351 M * F * PS 0.213 0.330 0.855 0.501 0.616 0.313
Additionally, the villus height to crypt depth ratio was calculated for the different feeding
groups (Table 22). Similar to the results illustrated before, an increased villus height to crypt
depth ratio was found for birds fed with the mash diets. A three-factor analysis of variance
showed that the feeding of mash led to increased duodenal villus height to crypt depth ratios
(P < 0.001) and tended to increase jejunal villus height to crypt depth ratios (P = 0.082)
(Table 23).
Table 22: Calculation of the villus height to crypt depth ratio in the duodenum, jejunum and ileum regarding to the different feeding groups (N = number of analyzed samples); statistical analyses were conducted by ANOVA and posthoc Tukey’s test
Roller mill Hammer mill
Mash Expandate Mash Expandate
Villus/crypt ratio
Coarse Fine Coarse Fine Coarse Fine Coarse Fine
Duodenum12 7.33ac 7.76ab 6.50ac 5.89c 7.76ab 8.00a 5.86c 6.22bc
SD 1.35 1.13 0.81 1.02 1.50 1.36 0.68 0.80
N3 8 8 6 7 7 8 8 8
Jejunum1 6.51 6.94 6.05 6.82 7.32 6.95 5.67 6.65
SD 1.56 1.24 1.07 1.62 1.22 1.57 0.73 0.95
N3 8 6 6 5 8 7 5 8
Ileum1 6.09 6.93 6.99 6.92 6.29 6.89 6.42 6.45
SD 1.87 1.09 1.24 1.58 0.66 0.95 1.26 0.98
N3 6 8 6 7 7 7 6 7 1 Results are reported as means ± SD 2 a-c Means with different superscripts are significantly different (P < 0.05) 3 Sample sizes vary due to sample quality

Results
57
Table 23: Interaction and single factor effects of a three-factor analysis of variance on the villus height to crypt depth ratio detected for the eight different feeding groups
P-value
Duodenum villus/crypt Jejunum villus crypt
Ileum villus crypt
Mill (M) 0.812 0.878 0.514 Physical form (F) <0.001 0.082 0.670 Particle size (PS) 0.776 0.218 0.308 M * F 0.360 0.336 0.378 M * PS 0.443 0.657 0.916 F * PS 0.384 0.258 0.281 M * F * PS 0.277 0.495 0.797
4.5 Intestinal glucose absorption
In order to investigate the effect of the different diets on the active glucose transport in the
jejunum of laying hens, changes in the short-circuit current (Isc) were detected after applying
glucose and phloridzin to the mucosal surface of the tissue.
The basal values for the transepithelial conductance (Gt) were uniform during the experiment
and among the different feeding groups, indicating the integrity of the intestinal preparation
and ensuring the comparability of the results (Table 24). The mean of Gt was 9.07 mS/cm2 ±
3,51 corresponding to the transepithelial resistance Rt of 122 Ω * cm2 ± 36,6.
Table 24: Transepithelial conductance (Gt) in the different feeding groups (N = 8 for each group)
Roller mill Hammermill
Mash Expandate Mash Expandate
(mS/cm2) Coarse Fine Coarse Fine Coarse Fine Coarse Fine
Conductance (Gt)1 11.3 8.05 8.88 8.33 7.95 10.5 8.67 8.92
SD 7.21 1.98 1.96 2.70 3.40 3.02 2.70 2.08 1 Results are reported as means ± SD
Concerning the different feeding groups, means of ∆ Isc for glucose and phloridzin are
illustrated in Table 25, showing significant differences between the feeding groups. In the
mash groups, the ∆ Isc values for glucose ranged from 9.13 to 12.3 µA/cm2 and were higher
compared to the ∆ Isc values detected for the expandate groups, which ranged from 6.08 to
8.30 µA/cm2. The birds fed with the coarsely ground mash showed the highest values for ∆
Isc, while the lowest were recorded for birds fed the finely ground expandate. These results
were comparable with those determined for ∆ Isc phloridzin.

Results
58
Table 25: Effect of D-glucose and phloridzin on short-circuit current in isolated mucosa of chicken’s jejunum (N = 8 for each group); statistical analyses were conducted by ANOVA and posthoc Tukey’s test
Roller mill Hammermill
Mash Expandate Mash Expandate
∆ Isc (µA/cm2)
Coarse Fine Coarse Fine Coarse Fine Coarse Fine
Glucose12 9.13abc 12.3a 7.08bc 6.08c 11.95ab 10.79abc 8.30abc 8.12abc
SD 3.69 2.89 3.26 2.68 3.01 2.84 3.00 2.91
Phloridzin12 ˗8.15abc ˗10.5a ˗6.03bc ˗5.67c ˗9.80ab ˗8.73ab ˗7.09abc ˗7.48abc
SD 2.71 2.70 2.71 2.81 2.26 1.92 2.69 2.93 1 Results are reported as means ± SD 2 a-c Means with different superscripts are significantly different (P < 0.05)
In order to control for interaction and single factor effects, a three-factor analysis of variance
was performed pointing out significant differences regarding the factor physical form of the
diet (Table 26). Laying hens fed with mash diets had significantly higher values for ∆ Isc
glucose and ∆ Isc phloridzin compared with those fed expandate. The factor mill and particle
size as well as their interactions did not influence the values of ∆ Isc glucose and ∆ Isc
phloridzin.
Table 26: Interaction and single factor effects of a three-factor analysis of variance according to ∆ Isc glucose and ∆ Isc phloridzin detected in the eight different feeding groups
P-value
∆ Isc glucose ∆ Isc phloridzin
Mill (M) 0.241 0.305 Physical form (F) <0.001 <0.001 Particle size (PS) 0.556 0.611 M * F 0.343 0.253 M * PS 0.419 0.307 F * PS 0.178 0.628 M * F * PS 0.181 0.114

Results
59
4.6 Fluorescence cytometry of lymphocyte subpopulations in the gut-
associated lymphoid tissue
On the basis of the flow cytometric measurements, the distribution and relative frequency of
different lymphocyte subpopulations were determined in the duodenum and jejunum for the
different feeding groups. Cell viability was greater than 90 % as determined by trypan blue
exclusion. Cells were sorted on the basis of their size and granularity in order to select those
representing the pool of leucocytes (Figure 6).
Figure 6: Cell population obtained from jejunal tissue was characterized by forward light scatter (FS) and side scatter light (SS). CD45 + cells are marked black and CD45 – cells appear grey. The lymphocyte population is encircled. One representative experiment is shown

Results
60
The cell population, highlighted in Figure 6, was identified as a leucocyte population with
cells that expressed mainly the leucocyte common antigen CD45.
Within the selected leucocyte population, the distribution and relative frequency of the
different lymphocyte subpopulations were evaluated on the basis of their surface antigens
and expressed as percentages (Table 27 and Table 28). The sample sizes (N) vary between
the experimental groups because partly not enough cells could be isolated from the tissue in
order to evaluate the different lymphocyte subpopulations. Furthermore, the primary
antibodies phenotyping 28-4, TCR2, TCR3, CD4 and AV20 positive cells were established
during the course of the experiment, which explains the varying sample sizes.

Results
61
Table 27: Proportions (%) of intraepithelial lymphocytes of the duodenum for the different feeding groups, obtained by flow cytometric phenotyping (N = number of analyzed samples); proportion of lymphocyte subpopulations calculated in relation to detected CD45+ cells. IELs were characterized by their specific surface antigens
Roller mill Hammermill
Mash Expandate Mash Expandate
Phenotype Coarse Fine Coarse Fine Coarse Fine Coarse Fine In total
CD3+1 53.9 54.4 63.6 52.4 58.9 49.8 63.3 64.1 57.6
SD 23.2 27.0 23.5 23.5 12.2 24.3 12.9 21.0 21.0
N 8 8 8 8 8 8 8 8 64
TCR1+1 25.9 29.1 30.9 31.6 31.6 26.5 31.6 30.2 29.6
SD 9.32 8.66 7.68 6.28 4.16 12.2 12.2 10.8 9.06
N2 8 7 8 7 8 8 8 8 62
TCR2+1 22.2 19.5 22.6 20.5 18.7 16.9 21.4 27.2 21.2
SD 6.54 5.88 5.63 3.77 6.55 5.25 14.2 2.61 7.00
N3 4 4 4 4 4 4 4 4 32
TCR3+1 14.6 12.4 16.3 14.4 14.3 11.9 16.4 14.5 14.4
SD 4.43 0.73 2.36 5.13 3.34 3.61 3.15 4.83 3.57
N3 4 4 4 4 4 4 4 4 32
CD8α+1 46.8 54.7 58.3 50.1 55.1 44.5 54.9 54.6 52.4
SD 18.9 7.04 8.05 6.12 5.31 17.8 7.15 8.39 11.5
N2 8 7 8 7 8 8 8 8 62
28-4+1 5.94 6.69 7.44 7.38 7.48 6.01 5.47 6.40 6.58
SD 3.21 1.75 3.66 2.90 1.21 3.61 1.25 2.16 2.58
N23 7 6 7 6 7 7 7 7 54 28-4+ CD3+1 3.75 4.49 5.05 5.84 4.80 3.56 4.28 4.03 4.45
SD 2.04 1.98 2.94 2.80 1.64 2.47 1.42 1.92 2.16
N23 7 6 7 6 7 7 7 7 54
CD4+1 7.32 9.74 6.03 8.56 9.85 5.32 6.62 8.37 7.58
SD 0.52 4.93 2.38 4.05 1.30 1.95 3.38 3.55 3.03
N23 3 3 3 2 3 4 4 4 26
AV20+1 8.85 9.25 6.26 6.68 8.76 11.5 5.67 9.99 8.47
SD 6.65 0.83 0.35 4.50 3.37 4.38 4.87 2.21 3.70
N23 2 2 2 2 2 3 3 3 19 1 Results are reported as means ± SD 2 Sample sizes vary due to sample quality 3 Sample sizes vary because antibody was established during the course of the experiment

Results
62
Table 28: Proportions (%) of intraepithelial lymphocytes of the jejunum for the different feeding groups, obtained by flow-cytometric phenotyping (N = number of analyzed samples); proportion of lymphocyte subpopulations calculated in relation to detected CD45+ cells. IELs were characterized by their specific surface antigens
Roller mill Hammermill
Mash Expandate Mash Expandate
Phenotype Coarse Fine Coarse Fine Coarse Fine Coarse Fine In total
CD3+1 63.1 67.0 67.7 69.0 69.5 65.4 67.7 67.3 67.1
SD 22.5 24.0 18.2 16.9 16.7 11.5 15.1 18.0 17.4
N2 8 8 8 8 8 7 8 8 63
TCR1+1 27.9 31.3 32.3 32.7 39.9 32.9 32.2 32.3 32.7
SD 11.2 11.0 5.74 10.8 9.08 11.5 7.02 8.55 9.51
N2 8 8 8 8 8 7 8 8 63
TCR2+1 23.8 23.0 23.5 22.8 23.5 22.4 20.8 27.8 23.5
SD 8.25 5.20 3.73 7.61 7.59 2.9 15.7 4.90 7.33
N3 4 4 4 4 4 4 4 4 32
TCR3+1 15.9 16.6 15.6 15.3 15.0 15.9 15.6 17.7 15.95
SD 5.13 5.20 2.09 6.26 3.57 3.95 7.43 7.11 4.82
N3 4 4 4 4 4 4 4 4 32
CD8α+1 51.9 53.6 61.1 55.8 57.4 56.3 57.0 57.3 56.3
SD 16.6 13.8 6.89 14.9 9.51 9.39 14.2 9.92 11.9
N2 8 8 8 8 8 7 8 8 63
28-4+1 6.02 6.56 5.85 7.21 7.12 8.54 6.51 7.04 6.82
SD 2.92 3.26 2.45 3.12 2.46 3.62 3.20 2.96 2.91
N23 7 7 7 7 7 6 7 7 55 28-4+ CD3+1 4.89 4.70 3.30 5.06 5.75 5.28 4.66 4.27 4.73
SD 2.74 2.88 1.17 2.29 1.40 2.62 2.39 1.82 2.20
N23 7 7 7 7 7 6 7 7 55
CD4+1 7.44 7.73 5.97 10.1 9.93 7.52 6.69 7.76 7.83
SD 0.32 4.21 3.02 3.28 1.99 2.95 2.55 2.74 2.81
N23 3 4 3 3 3 3 4 4 27
AV20+1 7.37 9.91 7.46 5.63 9.88 12.41 4.88 10.8 8.54
SD 4,13 2.18 0.20 1.10 1.8 3.92 3.01 3.63 3.40
N23 2 3 2 2 2 2 3 3 19 1 Results are reported as means ± SD 2 Sample sizes vary due to sample quality 3 Sample sizes vary because antibody was established during the course of the experiment

Results
63
Regarding to the proportions of intraepithelial lymphocytes in the duodenum and jejunum, the
results show no statistically significant differences among the feeding groups. Between the
different intestinal segments, there were also no statistically significant differences. However,
the means of the different IEL fractions were higher in the case of cells isolated from the
jejunum. A three-factor analysis of variance showed no interaction and single factor effects
concerning the factors mill, physical form and particle size of the diet (Table 29). The
fractions of CD4+ and AV20+ cells were not included in the statistical analysis due to the
small number of sample sizes.
Table 29: Interaction and single factor effects of a three-factor analysis of variance on proportions of intraepithelial lymphocytes detected for the eight feeding groups in the duodenum and jejunum
P-value
CD3+ TCR1+ TCR2+ TCR3+ CD8α+ 28-4+ 28-4+CD3+
Mill (M) 0.628 0.270 0.958 0.898 0.830 0.760 0.874 Physical form (F) 0.234 0.499 0.258 0.313 0.073 0.839 0.841 Particle size (PS) 0.498 0.674 0.810 0.588 0.335 0.378 0.868 M * F 0.844 0.196 0.300 0.537 0.663 0.149 0.323 M * PS 0.773 0.106 0.324 0.904 0.598 0.749 0.104 F * PS 0.985 0.684 0.263 0.905 0.547 0.688 0.353 M * F * PS 0.313 0.220 0.284 0.721 0.380 0.692 0.835
On average, 83 % of CD45+ leucocytes were isolated from the duodenum and 88 % of
CD45+ leucocytes from the jejunum. The fraction of cells expressing the CD3 receptor (T
cells) ranged from 70 % in the duodenum to 75 % in the jejunum. Within the T cell
population, αβ+ T cells and γδ+ T cells were detected, whereas higher percentages of γδ+T
cells (30 % in the duodenum; 32 % in the jejunum) were found compared with TCRαβ1+ cells
(21 % in the duodenum; 24 % in the jejunum) and TCRαβ2+ cells (15 % in the duodenum; 16
% in the jejunum).
NK cells, expressing the 28-4 glycoprotein, had percentages of about 7 % in both intestinal
segments. There were also cells of about 5 %, which bore the CD3 receptor in addition with
28-4 glycoprotein (Figure 7). In the duodenum, 52 % of cells expressed the CD8α receptor
and 56 % of CD8α+ cells were detected in the jejunum. The CD8 glycoprotein is
characteristic for cytotoxic T cells as well as for NK cells, although there were proportions of
28-4+ cells, which did not bear the CD8 receptor (Figure 7). T helper cells, identified by their
CD4 receptor, and AV20+ B cells were determined in proportions of about 8 % respectively.

Results
64
Figure 7: Dual immunofluorescence analysis of IELs using the 28-4 mAb together with mAbs, specific for CD3 (Figure A) and CD8α (Figure B). Percentages (in relation to CD45+ cells) of detected cells are shown in the corner of each quadrant. One representative experiment is depicted, presenting IELs isolated from jejunal tissue

Results
65
In order to examine whether only IELs were isolated, tissue sections were verified by histological examination (Figure 8). The histological image shows that almost exclusively, cells were obtained from the epithelium, and that the lamina propria was preserved to a large extent.
Figure 8: Microscopic picture of jejunal tissue before (A) and after (B) the procedure of isolation of IELs (HE)
A B

66
5 Discussion
5.1 Feed processing
The eight experimental diets were produced using two different mills, the roller mill and the
hammermill. By changing the grinding intensities, coarsely and finely ground feed was
produced either as a mash or it was processed further to expandate. Thus, the feed structure
of the different experimental diets was determined by three different factors:
1. Milling method
2. Physical form
3. Particle size
The structure of thermally processed feed can be characterized by its macro- and
microstructure (Svihus, 2006). These terms can be explained using the example of expanded
feed. Expandate has a diameter of e.g. 2.5 mm and has a coarsely ground macrostructure.
However, by dissolving the expandate in water, the microstructure, namely the particle size
distribution of the feed constituents, becomes apparent. This differentiation is not common
for mash diets as thermal processing is not implemented and therefore no microstructure
exists. Therefore, mash feed is characterized by its macrostructure only.
The results of the dry sieving analysis reflect the macrostructure of the diets. They showed
that in the case of coarse grinding, 32 % coarse particles (> 2.5 mm) were found on average,
irrespective of the physical form of the diet (mash or expandate) or the milling method used
(roller mill or hammermill). The proportions of coarse particles in the finely ground diets
ranged from 2 % to 11 %. Considerable amounts of medium sized particles (> 1 mm to ≤ 2.5
mm) were found in all diets, although on average, this particle fraction was larger within the
finely ground diets (58 %) compared to the coarsely ground diets (46 %). The proportion of
small particles (> 0.15 mm to ≤ 1 mm) were on average higher in the finely ground diets (35
%) than in the coarsely ground diets (23 %), and with regard to all diets, only a small amount
of particles passed through the 0.15 mm sieve (1 - 2%).
In summary, the dry sieving analysis showed that the diets can be divided into finely and
coarsely ground feed in regard to their macrostructure. In this respect, the physical form of
the diets as well as the mill, which was used for grinding, had only a minor impact on the
particle size distribution. This is not in accordance with the results of the wet sieving analysis.
The wet sieving analysis is normally used for the determination of the particle size
distribution of thermally processed feed such as pellets or expandate (Wolf et al. 2012). In
order to allow for a better comparability, the mash diets were also wet sieved. By dissolving

Discussion
67
the expanded diets in water, the microstructure was revealed and significant shifts occurred
in the particle size distribution compared with the results of the dry sieving analysis.
Irrespective of the milling method used, there was a significant increase of particles that were
smaller than 0.15 mm in the expanded diets. Nevertheless, differences between coarsely
and finely ground expandate were observed. On average, the coarsely ground expandate
had smaller proportions of particles sized < 0.15 mm (46 %) than the finely ground
expandate (62 %). In addition, the proportion of particles sized > 1 mm were larger in the
coarsely ground expandate (34 %) compared with the finely ground expandate (15 %).
The results of the wet sieving analysis demonstrated that the process of thermal expansion
led to a further reduction of particle sizes. As a consequence, differences in the particle size
distribution between the coarsely and finely ground expandate became less pronounced but
were still detectable. With regard to the results of the dry sieving analysis, there was an
increase of particles smaller than 0.15 mm in the mash diets, although to a lesser extent as
found in the expandate. The results of the proportion of coarse particles in the coarsely
ground mash diets were comparable with those of the dry sieving analysis. However, with
regard to particles larger than 2.5 mm, there was an increase of about 10 % in the coarsely
ground mash diets, which can be attributed to the water-related swelling of the grains (Wolf
et al. 2012). The particle size distribution of the finely ground mash diets was also
comparable with that analyzed by dry sieving, although a shift occurred from medium-sized
particles in favor of particles smaller than 0.15 mm.
In summary, mash as well as expanded diets could be classified into coarsely and finely
ground feed with regard to their macrostructure. However, after the wet sieving analysis,
mainly medium and small-sized particles could be detected in the expandate, revealing its
microstructure. Nevertheless, differences between the coarsely and finely ground expandate
could be observed.
Therefore, it should be emphasized that effects induced by the feeding of expandate may be
attributed to both its macro- and microstructure. This is especially the case regarding effects,
which take place after the feed comes into contact with digestive juices in the upper digestive
tract and consequently loses its macrostructure. In this context, Svihus (2006) stated that the
macrostructure of thermally processed feed can affect feed intake patterns while the
microstructure is able to influence the gut function.

Discussion
68
Apart from differences in the feed structure, the electrical energy consumption (kWh/t)
required during feed production also varied among the feed variants and depended mainly
on three factors:
1. Mill
2. Grinding intensity
3. Physical form
The hammermill uses energy less efficiently compared to the roller mill (Koch, 1996), which
was also the case in this study (Figure 1), particularly concerning the processing of finely
ground diets. Additionally, the production of finely ground feed required more energy than the
processing of coarsely ground feed. The roller mill used 2.6 times and the hammermill 6.7
times more energy, respectively. The electrical energy, which was used to produce the
expandate, by far exceeded that which was required for the mash feed production.
From an environmental and economic point of view, a higher net energy consumption may
be justified if simultaneous positive effects can be attained in terms of animal health, animal
performance and feed hygiene and safety.
5.2 Effect of feed structure on animal performance
The performance data of the laying hens recorded during the experimental trial (Figure 9)
were in accordance with values reported by the breeding company and found in the literature
(Jeroch et al., 2013). This indicates that the hens were reared under optimal conditions and
received an adequate diet, which led to a normal development and the maintenance of
healthy animals.

Discussion
69
Figure 9: Course of the performance parameters of LOHMANN BROWN CLASSIC; modified from Jeroch et al. (2013). Performance data of this study are marked by symbols: Body weight ; Egg production ; Egg weight ; Feed intake
Due to different experimental conditions including differences in particle sizes, feed forms,
grinding methods and age and breed of the hens, it is not entirely possible to compare the
present results with those of other studies.
As emphasized by Hamilton and Proudfoot (1995), the particle size of the feed is of less
importance than the physical form of the diet in regard to the performance of laying hens.
Few studies showed that the EP and the FI were influenced by the feed form, i.e. an
increased EP as well as higher FIs were found for laying hens which were fed mash instead
of pelleted/crumbled diets (Pepper et al., 1968; Blair et al., 1973; Deaton et al., 1987;
Hamilton and Proudfoot, 1995).
This was confirmed by the results of the present study, due to the fact that the physical form
of the diet had an impact on the FI of the first experimental week as well as on the overall FI,
while the EP remained unaffected. Hens that were fed with mash had higher FIs than those
given the expandate. It is possible, however, that observed differences in animal
performance in the first experimental week were a consequence of the changeover of the
feed. In the pre-experimental period, all laying hens received mash, while during the trial
runs, four feeding groups were fed with mash, and four with expandate (Figure 1).
0
20
40
60
80
100
120
140
0
400
800
1200
1600
2000
2400
20 23 26 29 32 35 38 41 44 Eg
g P
rod
uct
ion
, Eg
g W
eig
ht,
Fee
d In
take
Bo
dy
Wei
gh
t (g
)
Age (weeks)
Body Weight (g) Egg Production (%) Egg Weight (g) Feed Intake (g)

Discussion
70
In this context, Jones (1986) showed that the feeding of a new diet formulation in birds
resulted in a decreased FI. According to Haskell et al. (2001), the decreased FI may be the
result of frustration as the broilers had different expectations regarding the feed.
In this study, the lower FI of hens fed the expandate also led to an improved FE in the first
experimental week, although recorded EWs were comparable within the groups.
However, apart from the higher FIs of the first experimental week, it should also be noted
that higher FIs were recorded for the mash-fed-birds regarding the total experimental trial.
The question arises why the FI behavior of hens was influenced by the physical form of the
diet.
It is conceivable that the diet form mash was more attractive for the birds than the thermally
processed feed, as also shown by Savory (1974), who observed a preference of mash to
pellets when chicks were given a choice of feed. Additionally, it was demonstrated that birds
had a pecking preference for textured feed over non-textured feed (Schiffman, 1969), and
that they spent more time consuming mash than pellets, although the quantity of total
ingested feed was not influenced (Jensen et al., 1962; Fujita, 1973). In contrast, other
studies observed higher FIs in pelleted-fed hens compared with those given a mash-form
diet (Jensen and McGinnis, 1952; Black et al., 1958).
However, it is known that the feeding of highly processed feed can impair the gut motility e.g.
by the occurrence of a decreased gizzard activity, which may result in a decrease of the gut
reflux and of the pancreatic enzyme secretion (Nir et al., 1994b; Engberg et al., 2002;
Svihus, 2006). Therefore, it seems reasonable to suppose that the FI behavior is also
influenced by such a dysfunctional gut motility.
It is also possible that the energy level of the diets had an impact on the FI behavior as it has
been suggested that laying hens are able to regulate their FI with regard to the energy level
(Hill and Dansky, 1954). This hypothesis was confirmed by Harms et al. (2000), who reported
that the feeding of low energy diets led to a compensatory increase of the FI of laying hens.
Vice versa, laying hens fed with high energy diets had decreased FIs, while the egg
production was not influenced by the dietary energy content. In the present study however,
the starch apparent ileal nutrient digestibility was significantly lower in hens fed with the
expandate, than that of those given the mash diets (Ruhnke, I. 2013, pers. comm.), and thus
the above-mentioned hypotheses could not be corroborated. In this context, Svihus (Svihus,
2006) emphasized that the use of thermally processed feed could lead to a decreased starch
digestibility, which was confirmed by the results of the present study (Ruhnke, I. 2013, pers.
comm.).
Regarding the effect of feeding different particle sizes, a consensus exists that laying hens
perform equally, irrespective of whether coarsely ground or finely ground diets are used as
feed (Berg and Bearse, 1951; Deaton et al., 1989; Hamilton and Proudfoot, 1995). However,

Discussion
71
few studies showed that performance parameters such as BW, BWG, EW or EP were similar
when fine or coarse particles were fed, but higher FIs were observed when coarse particles
were fed (MacIsaac and Anderson, 2007; Safaa et al., 2009). There is evidence suggesting
that laying hens prefer larger feed particles instead of finer ones (Portella et al., 1988), which
may explain the increased feed consumption. In the present study, no significant differences
were found regarding the influence of the factor particle size on laying performance, with the
exception that in the last experimental week, the FCR was significantly higher for laying
hens that were fed with coarsely ground feed compared to those that received the finely
ground diet. This indicates that these hens had a lower feed conversion efficiency in the last
experimental week, although this could be not confirmed for the total experimental period.
While the FI of the last experimental week was comparable within the groups, hens which
were fed with finely ground diets had higher weight gains on average (39.1 g/hen) than those
fed with coarsely ground feed (36.4 g/hen), which explains the favorable FCR. The improved
FCR of hens fed with finely ground diets was not connected with an improvement in the FE,
which is of greater significance for the assessment of productive performance in laying hens.
Furthermore, the factor particle size did not affect the BW, BWG, EP and EW, while the
milling method had no impact on the overall animal performance.
5.3 Effect of feed structure on the development of digestive organs and on
the microscopic structure of the small intestine
Several studies were performed in order to examine the effect of feed structure on the avian
digestive tract, whereby mostly broilers were used as study animals. Thus in the following,
the influence of feed structure will be discussed on the basis of scientific literature referring to
laying hens as well as broilers.
In the present study, laying hens that were given coarsely ground feed had significantly
higher relative gizzard weights than hens fed with the finely ground diets, whereas the weight
of the proventriculus, pancreas and segments of the small intestine were not affected.
There is clear evidence that the particle size of the diet has an impact on the development of
the digestive tract, which is also accompanied by changes in physiological processes.
Several studies showed that the feeding of coarse particles led to an increase of the relative
gizzard weight in broilers compared to the feeding of finer particles (Nir et al., 1994a;
Engberg et al., 2002; Peron et al., 2005; Amerah et al., 2007c). The inclusion of whole grains
in the diet led to the same effect so that broilers which received whole grains had heavier
gizzards than those fed with pelleted diets (Preston et al., 2000; Plavnik, 2002; Gabriel et al.,
2003; Svihus et al., 2004a). Higher gizzard weights of laying hens could be achieved when

Discussion
72
feeding 40 % of whole wheat, incorporated into 3 mm pellets, in comparison with feeding 3
mm pellets, which did not contain whole wheat (Hetland et al., 2003b). Moreover, the
addition of wood shavings to layer diets also resulted in increased gizzard weights and
enhanced gastroduodenal refluxes (Hetland et al., 2003a). It can be concluded that the
feeding of structural components is associated with an increase in the gizzard weight in
laying hens.
Furthermore, this study showed that on average, the gizzard weights of birds fed with
coarsely ground mash were higher than those of animals which received the coarsely ground
expandate. This can be explained by the differences in the particle size distribution of both
feed forms. The mash feed had larger proportions of coarser particles than the expandate, as
illustrated by the results of the wet sieving analysis. The intake of coarse feed particles leads
to an increased frequency of gizzard contractions (Roche, 1981), producing finer particles, so
that an utilization of the feed is ensured.
Studies demonstrated that the development of the small intestine did not tend to be affected
as strongly by the feed particle size as the gizzard (Wu et al., 2004; Peron et al., 2005;
Gabriel et al., 2007), which was also consistent with results found in this study. The reason
for this may be that the gizzard is able to grind feed to a consistently fine particle size
irrespective of whether the ingested diet contains large or small particles (Hetland et al.,
2004). However, Amerah et al. (2007a) and Lentle et al. (2006) demonstrated that both the
duodenal digesta and the excreta of broilers, which were fed with coarser particles in mash
diets, contained greater amounts of large particles compared with those fed fine particles in
pelleted diets. Consequently, it would be conceivable that the small intestine is also affected
by the feed structure, although this was not confirmed by the present study. In this context,
Nir et al. (1994b) observed that the length of the jejunum and ileum was reduced when feed
was offered as fine pellets. Dahlke et al. (2002) showed that the relative organ weights of the
duodenum and jejunum plus ileum were positively related to increased particle size in mash
diets. Moreover, Gabriel et al. (2003) observed lower duodenum weights in pellet-fed birds
compared with those receiving whole grains.
Focusing on the physical form of the diet, various investigations demonstrated that feeding
mash instead of thermally processed feed led to increased gizzard weights in broilers (Nir et
al., 1994b; Engberg et al., 2002). Engberg et al. (2002) observed higher gizzard and
pancreas weights when broilers were fed with mash diets instead of pelleted diets.
Additionally, a higher activity of pancreatic enzymes including amylase, lipase, and
chymotrypsin was found in pancreatic homogenates of mash-fed birds compared to pelleted-
fed birds.

Discussion
73
There seems to be a connection between the development of the gizzard and the pancreas,
because increased relative gizzard weights were often found in combination with increased
relative pancreas weights (Engberg et al., 2002; Gabriel et al., 2007; Williams et al., 2008;
Rougiere et al., 2009).
The results of the present study corroborated these observations. Laying hens which
received the mash diets had significantly higher gizzard weights as well as increased
pancreas weights than those fed with the expandate. The increased gizzard weight might be
a consequence of enhanced gizzard activity. The reason for the increased organ weights
remains unclear. It is possible however that the expandate did not have to be ground to such
an extent as mash in the gizzard due to its softer consistency and finer microstructure.
In this context, it was speculated that birds fed with pelleted diets become "overeaters”
(Svihus and Hetland, 2001; Svihus, 2006). Thus, the passage rate of ingested feed increases
while the gizzard activity is reduced. Ferket (2000) stated that the feeding of highly
processed diets has a negative impact on the gastric reflux, which leads to proventricular
hypertrophy and less efficient digestion. Vice versa, when mash feed is ingested, the
retention time in the gizzard is increased, and the activity of the gizzard as well as the gut
reflux enhanced. The release of CCK might consequently be stimulated, which could
reinforce the pancreatic enzyme secretion (Li and Owyang, 1993; Svihus et al., 2004a;
Svihus, 2006). This would explain the increased pancreas weights, which were also found in
the present study, suggesting a higher activity of this organ.
Apart from the higher weights of the gizzard and the pancreas, the physical form of the diet
also had an impact on the weight of the proventriculus. Mash-fed hens had increased
proventriculus weights compared with expandate-fed hens. These results were not confirmed
by other related studies, however, a dilatation of this organ could be determined when fine
pelleted diets were fed (Jones and Taylor, 2001; Gabriel et al., 2007; Witte, 2012). Witte
(2012) observed both a dilatation of the proventriculus and an underdeveloped gizzard,
suggesting that an overload of the proventriculus may play a role as a consequence of
reduced gizzard motility induced by fine pelleted feed.
Regarding the microstructure of the small intestine, this study showed that the physical form
of the diet influenced the villus length and crypt depth. Hens fed with mash diets had longer
duodenal and shorter ileal villi as well as increased duodenal villus height to crypt depth
ratios than those given the expandate. Additionally, the feeding of mash tended to increase
jejunal villus height, while expanded fed birds showed tendentially deeper duodenal crypts.
Moreover coarsely instead of finely ground feed tended to promote duodenal villus height as
well as duodenal and ileal crypt depth. In this context, increased villus to crypt length and
surface ratios in the duodenum occurred when broilers were fed with whole wheat compared

Discussion
74
to those given the mash, suggesting that the feeding of coarse diets enhances the intestinal
villus and crypt development (Gabriel et al., 2007). Further investigations revealed that pellet-
fed broilers had a higher number of villi per transversal duodenum cut and greater duodenal
crypt depths when compared to mash-fed birds. Moreover, an increase in particle size of the
diets resulted in deeper crypts and higher duodenal villi, irrespective of the physical form of
the diet (Dahlke et al., 2002). With regard to the effect of feed structure on the intestinal
microstructure, the mechanism that leads to the development of longer villi and deeper crypts
has not yet been elucidated. However, it is known that the factor diet plays an important role
in maintaining and improving gut health (Uni et al., 1998; Noy et al., 2001; Montagne et al.,
2003). The general assumption exists that an enlargement of the absorptive surface can
increase the absorption of nutrients and may lead to an improved feed conversion ratio
(Dahlke et al., 2002; Gabriel et al., 2007).
5.4 Effect of feed structure on the intestinal glucose absorption
To date, there are no studies that address the question of how differently processed feed
affects glucose absorption in the small intestine of poultry. An important objective of the
present work was to examine the effect of different feed structures on active glucose
absorption in the jejunum of laying hens. The results showed that the jejunal active glucose
transport, mediated by the SGLT-1, was influenced by the physical form of the diet, while the
particle size of the feed as well as the milling method used had no impact. The application of
phloridzin led to a congruent decrease of the glucose absorption rate, demonstrating that the
SGLT-1 was responsible for glucose transport. Mash-fed hens had a higher glucose
transport rate than expandate-fed hens. In the following, possible explanations for the
increased glucose transport rates and the involvement of the physical form of the diet will be
discussed.
Two different hypothesizes exist, which may explain the higher glucose transport rates:
Firstly, the villus surface area of mash-fed birds was increased (same SGLT-1 density, but
increased villus surface area); secondly, the expression of the SGLT-1 was enhanced in the
jejunal tissue of mash-fed birds (higher SGLT-1 density per villus surface area). Concerning
the first hypothesis, the jejunal villi in the jejunum of hens that were fed with mash were not
significantly higher than in those given the expandate. However, there was a tendency that
the villus height of mash-fed hens was increased (P = 0.087) compared with the villus height
of expandate-fed hens, whereby the villus surface area might also be increased.
In this context, it was stated that the transport rates of glucose are closely related to the
degree of villi (Calhaun, 1933) and microvilli development (Planas et al., 1987), as well as to

Discussion
75
the availability of nutrients, i.e. to the luminal carbohydrate concentration (Ferraris and
Diamond, 1986, Suvarna et al. 2005). Regarding the latter and the second hypothesis, it
might be possible that the feeding of thermally processed diets resulted in a poorer nutrient
utilization and consequently in a lower intestinal carbohydrate level reducing the expression
of the SGLT-1 transporter. This was confirmed by the results of the present study, according
to the decreased starch apparent ileal digestibilities in hens fed with the expandate (I.
Ruhnke, 2013, Institute of Animal Nutrition, Freie Universität Berlin, Germany, pers. comm.).
This could be explained by the occurrence of increased gizzard and pancreas weights in the
mash-fed birds, which is associated with increased secretory activity of the pancreas
(Hetland et al., 2003; Svihus et al., 2004). Therefore, it is possible that the feeding of mash
diets enhanced digestion and nutrient absorption, whereby the expression of the SGLT-1
might be increased due to increased luminal carbohydrate concentrations.
5.5 Effect of feed structure on lymphocyte subpopulations in the gut-
associated lymphoid tissue
Only few studies are published concerning the effect of the feed structure on the intestinal
immune system, whereby they are mainly focused on interactions with the intestinal
microbiota. Decreased colonization and growth of Salmonella in the caecum was observed
when broilers were fed with coarsely ground as well as mash diets (Huang et al., 2006;
Santos et al., 2008).
However, flow cytometric investigations including the characterization of IELs in laying hens
and the examination of effects on the distribution and relative frequency of IELs related to the
use of different feed structures are scarce.
This study showed that the protocol for the flow cytometric analysis, which was established in
order to determine the different lymphocyte subsets from the gut-associated lymphoid tissue
of laying hens, led to reliable and reproducible results. In this context, it should be
emphasized that the comparison to results of other studies is not entirely possible due to the
use of different species/chicken strains, ages of animals, sample sites as well as applied
methodology (Ernst et al., 1986; Lillehoj and Chung, 1992). However, the results of this study
showed several similarities to priorly published research.
The majority of IELs in the duodenum and in the jejunum were T cells expressing the CD3
receptor. These T cells consisted of a greater amount of the γδ T cells than TCRαβ1 cells
and TCRαβ2 cells, which is consistent with findings of Lillehoj and Chung (1992). They could
demonstrate that the amount of intraepithelial γδ T cells among the IELs increased during the
postnatal development while the proportions of TCRαβ cells decreased.

Discussion
76
With regard to the present study, most of the detected T cells also expressed the CD8
homologue and were CD4−, so that they could be identified as cytotoxic T cells. This T cell
subpopulation was often found in the epithelium, whereas T helper cells (CD4+), similarly to
B cells, represented a minor subpopulation among the IELs (Lillehoj and Chung, 1992; Göbel
et al., 2001).
In this study, it could be demonstrated that ~ 5 % of T cells also carried the 28-4
glycoprotein, which is usually expressed by NK cells. These cells are probably comparable to
NKT cells, which were previously determined in mammals as well as in chickens (Godfrey et
al., 2000; Göbel et al., 2001; Godfrey and Rossjohn, 2011).
The percentages of detected NK cells (~ 7 %) were lower in the duodenum and jejunum as
compared with those determined by Göbel et al. (2001). This could be explained by the use
of different chicken breeds as well as the different age of the chickens, because the number
and distribution of the IELs differ during the postnatal development as well as within the
strains (Bäck, 1972; Lillehoj and Chung, 1992; Vervelde and Jeurissen, 1993; Göbel et al.,
2001). In this context, the IELs of 19-day-old embryos almost exclusively expressed the 28-4
glycoprotein, while only few T cells were found. By contrast, IELs of 2- to 3-month-old birds
contained a large proportion of T cells (~ 40 %), whereas only about 15 % of NK cells were
detected (Göbel et al., 2001). Although NK cells are associated with the expression of CD8
homologue and 28-4 glycoprotein, few cells were found in this study, which carried the 28-4
receptor but did not express CD8.
With regard to the effect of feed structure on the IELs, the results showed no difference in the
distribution and relative frequency among the feeding groups as well as concerning the
factors particle size, physical form and grinding method of the diets. The assumption that the
feed structure has an impact on the enteric immune system is based on investigations
focusing on mast cells as well as on the intestinal microbiota.
Liu et al. (2006) examined the effect of particle size (coarse vs. fine) and physical form of the
diet (mash vs. pellet) on the number and location of mast cells as well as on the histamine
content in the small intestine of broilers. The histological examination showed that the
feeding of coarsely ground diets led to an increase of the total number of mast cells, which
were concentrated in the upper part of the villi of the intestinal epithelium. In contrast, the
epithelium of broilers fed with finely ground diets, contained fewer numbers of mast cells,
which were evenly distributed in the tissue sections. Additionally, the histamine content was
higher in the jejunum when feeding coarsely ground rather than finely ground diets. With
regard to the physical form of the feed, no significant differences were observed in the
number and localization of mast cells and histamine content in the intestinal tissue. These
results suggest that the factor particle size might particularly impact the cells of the enteric
immune system. However, it could be not concluded that either finely ground nor coarsely

Discussion
77
ground feed had positive or negative effects on the immunological response, because the
parameter immune cell number within the epithelium is not solely an appropriate indicator for
evaluating the immune competence of animals.

78
6 Conclusions and future perspectives
The results of the present study illustrated that the feed structure had no impact on the
animal performance in general, with the exception that the physical form of the diet (mash vs.
expandate) influenced the FI. Regarding the development of gastrointestinal organs and the
intestinal microstructure of epithelium, positive effects were observed when hens were fed
mash instead of expanded diets, which may explain the observed heightened glucose
absorption in the jejunum of mash-fed birds. This study provided a characterization of
different lymphocyte subpopulations from the gut-associated lymphoid tissue of Lohmann
Brown hens, aged 23 weeks. However, the feed structure did not seem to influence the
distribution and relative frequency of IELs in healthy hens of this age. The milling method
used for the feed production had no effect on the investigated parameters.
Finally, it should be noted that based on the results of the present study, neither intensive
grinding nor the use of thermal treatment processes led to improved animal performance. In
contrast, the feeding of coarsely ground mash diets seemed to have positive effects on the
gastrointestinal function and thus may lead to improved animal health and welfare. From an
environmental and economical point of view, it should be stressed that the production of
coarsely ground mash diets using energy-saving milling methods is resource-efficient and
therefore contributes to climate protection.
Based on the results of this study, further investigations are required in order to clarify in
more detail in which way the feed structure is influencing physiological processes in the
organism of laying hens. In this context, it would be important to examine whether observed
structural changes of the gastrointestinal organs are accompanied by functional changes,
e.g. regarding the passage rate of ingested feed, the gut reflux and the pancreatic enzyme
secretion.
With respect to the results of the Ussing chamber experiment and the detected differences in
the glucose absorption, it should be elucidated whether the intestinal SGLT-1 protein content
is also influenced by the feed structure. Thereby, the connection between functional glucose
absorption, SGLT-1 density and absorptive surface area could be explained. In this regard, it
would be interesting to assess whether the feeding of differently structure diets also
influences the absorption of other nutrients such as amino acids or minerals.
The results of this study showed that the feed structure did not seem to influence the
distribution and relative frequency of IELs in healthy hens. It might be conceivable that the
effect of feed structure on the avian intestinal immune system will become sufficiently
Conclusions and future perspectives
79
apparent only in case of the occurrence of diseases. Therefore, further investigations might
be important including infection experiments.
Moreover, the experimental design could be modified by extending the duration of the
feeding trial. This could lead to even more significant effects particularly regarding the animal
performance. In this context, the experimental design could be used focusing on the post
hatch period of chicks due to the fact that most of the development occurs when the neonatal
bird begins to consume feed (Uni, 2006).
With regard to the experimental diets the effect of the inclusion of whole grains could be
proofed in future studies. In addition, it should be investigated whether the results of this
study are robust to changes in the processing parameters (e.g. temperature and pressure)
during the process of expansion.

80
7 Summary
Röhe, Ilen:
Effects of feed structure on animal performance, gastrointestinal morphology, gut-
associated lymphoid tissue and jejunal glucose transport in laying hens
New developments in the production and processing of feed for the use in the poultry sector
are associated with changes in the feed structure, which is characterized by the particle size
and the particle size distribution as well as the physical form of the diet, i.e. mash, pellets or
expandate. Different grinding methods, grinding intensities as well as thermal treatment
processes are used in order to achieve more energy-efficient feed production and to increase
the quality and safety of feed. The aim of this study was to investigate whether
gastrointestinal function and consequently animal performance and health were affected by
the feeding of differently structured diets. For this purpose, investigations were focused on
morphological, histological and immunological parameters and on the jejunal glucose
transport of the digestive tract in laying hens.
The eight experimental diets were produced using two different mills, the roller mill and the
hammermill. By changing the grinding intensities, coarsely and finely ground feed was
produced either as a mash or it was processed further to expandate. In total, the following
eight diets were produced, which differed in their feed structure, but showed an identical
botanical and chemical composition (30 % corn, 29 % wheat and 22 % extracted soybean
mash): Coarsely and finely ground mash diets, coarsely and finely ground expanded diets,
each of them produced by one of the two mills. In eight consecutive trial runs, a total of 384
laying hens (Lohmann Brown), aged 20 weeks were randomly allocated to eight different
experimental groups (in total 48 hens per feeding group) with six animals per floor pen each
representing a single experimental unit. The hens had ad libitum access to feed and water
and were kept in barn systems. Each experimental group received differently structured diets
over a period of 21 days. During the experimental trial, the laying performance, i.e. the egg
production and the egg weight of each feeding group was recorded daily, and the feed intake
and body weight recorded weekly. At the end of each trial run, the hens, aged 23 weeks,
were slaughtered. In order to examine the effect of different feed structures on the
development of the digestive organs, the pancreas, proventriculus, gizzard and the three
segments of the small intestine of hens of each feeding group were extracted and
subsequently weighed. For morphometric analysis, segments from the duodenum, jejunum
and ileum were removed, processed histologically and finally the villi lengths and crypt

Summary
81
depths were determined. In order to investigate the effect of the different diets on the active
glucose transport in the jejunum, Ussing chamber experiments were conducted. On the basis
of flow cytometric investigations, the intraepithelial lymphocytes (IELs) of the duodenum and
jejunum of laying hens were characterized, and the effect of different feed structures on their
distribution and relative frequency examined. All collected data were analyzed by using a
three-factorial analysis of variance in order to control for interaction and single factor effects
with respect to the factors milling method, physical form and particle size of the diet.
Concerning the collected animal performance data, the physical form of the diet had an
impact on the overall feed intake. Hens fed with mash diets showed significantly higher feed
intakes than those given the expandate. Regarding the total experimental period, neither the
particle size of the feed nor the milling method used affected the overall animal performance.
However, the results showed that both the physical form as well as the particle size of the
diet influenced the development of the digestive organs. Laying hens that received mash
instead of expandate had significantly higher gizzard and proventriculus weights as well as
increased pancreas weights. Hens fed the coarsely ground diets showed significantly higher
relative gizzard weights than those fed the finely ground diets. Regarding the microscopic
structure of the small intestine, the results demonstrated that only the physical form of the
diet had an impact on the villus lengths and crypt depths. Laying hens fed with mash diets
showed significantly longer duodenal and shorter ileal villi as well as increased duodenal
villus height to crypt depth ratios than those given the expandate. Moreover, the results of
the Ussing chamber experiment showed that the active glucose transport in the jejunum,
mediated by the SGLT-1, was influenced by the factor physical form of the diet. Mash-fed
hens had a higher glucose transport rate than expandate-fed hens. The protocol for the flow
cytometric analysis, which was established in order to determine the different lymphocyte
subsets from the gut-associated lymphoid tissue of laying hens, led to reliable and
reproducible results. With regard to the effect of the feed structure, the results showed no
difference in the distribution and relative frequency of the IELs.
To conclude, the results of this study illustrated that in general the feed structure had no
impact on the animal performance, with the exception that the physical form of the diet (mash
vs. expandate) influenced the FI. The feeding of mash diets compared with the feeding of
expanded diets showed positive effects regarding the development of gastrointestinal organs
and the intestinal microstructure of epithelium of laying hens, which may have led to the
observed heightened glucose absorption of the jejunum. Furthermore, the feeding of
coarsely ground diets also resulted in increased gizzard weights, but did not influence the
intestinal microstructure of the epithelium and the jejunal glucose absorption. This study
provides a characterization of different lymphocyte subpopulations from the gut-associated
lymphoid tissue of Lohmann Brown hens. However, the feed structure did not seem to

Summary
82
influence the distribution and relative frequency of IELs in healthy hens of this age. The
milling method used for the feed production had no effect on the investigated parameters.
Finally, it should be noted that based on the results of the present study, neither intensive
grinding nor the use of thermal treatment processes led to improved animal performance. In
contrast, the feeding of coarsely ground mash diets seemed to have positive effects on the
gastrointestinal function and thus may lead to improved animal health and welfare. From an
environmental and economical point of view, it should be emphasized that the production of
coarsely ground mash diets using energy-saving milling methods is resource-efficient and
therefore contributes to climate protection.

83
8 Zusammenfassung
Röhe, Ilen:
Einfluss der Futterstruktur auf die Leistung, die gastrointestinale Morphologie, das
darmassoziierte lymphatische Gewebe und auf den jejunalen Glukosetransport von
Legehennen
Neue Entwicklungen in der Herstellung und Bearbeitung von Futter im Geflügelsektor sind
mit Veränderungen in der Futterstruktur verbunden. Der Begriff der Futterstruktur umfasst
dabei einerseits die Partikelgröße und Partikelgrößenverteilung, andererseits die Form des
Angebots, das heißt, ob beispielsweise schrotförmiges, pelletiertes oder expandiertes Futter
verfüttert wird. Dabei werden unterschiedliche Vermahlungsarten und -intensitäten sowie
thermische Behandlungsverfahren genutzt, um eine energieeffizientere Futterproduktion zu
erzielen und die Qualität und Sicherheit der Futtermittel zu erhöhen.
Ziel der Studie war es daher zu überprüfen, ob die Fütterung unterschiedlich strukturierten
Futters die Magen-Darm-Funktion sowie die damit verbundene Leistung und Gesundheit von
Legehennen beeinflusst. Zu diesem Zweck wurden morphologische, histologische,
transportphysiologische und immunologische Untersuchungen des Gastrointestinaltrakts bei
Legehennen durchgeführt.
Die Futtervarianten wurden mittels zwei verschiedener Mühlen, der Hammermühle und dem
Weizenstuhl hergestellt, grob und fein vermahlen und entweder ohne Behandlung als Schrot
verfüttert oder noch zusätzlich einer thermisch-mechanischen Druckkonditionierung
unterzogen und als Expandat verfüttert. Es entstanden die folgenden acht Futtervarianten,
die sich in ihrer Futterstruktur unterschieden, jedoch aus botanisch und chemisch
identischen Ausgangskomponenten bestanden (30 % Mais, 29 % Weizen und 22 %
Sojaextraktionsschrot): grob und fein vermahlenes Schrot, grob und fein vermahlenes
Expandat, jeweils produziert durch eine der beiden Mühlen. In acht konsekutiv angelegten
Versuchsreihen wurden insgesamt 384 Legehennen (Lohmann Brown; Alter: 20 Wochen)
acht Fütterungsgruppen (48 pro Gruppe) zugeordnet, die jeweils über einen Zeitraum von 21
Tagen das entsprechende Futter erhielten. Dabei wurden sechs Tiere zusammen in einer
Gruppe in Bodenhaltung gehalten (experimentelle Einheit), denen ad libitum-Fütterungs- und
Tränkeeinrichtungen zur Verfügung standen.
Während des gesamten Versuchszeitraumes wurden verschiedene Leistungsparameter der
Legehennen erhoben, d.h. pro Fütterungsgruppe wurde die Legeleistung und die Eigewichte
täglich, die Futteraufnahme sowie das Gewicht der Tiere wöchentlich bestimmt. Im Alter von

Zusammenfassung
84
23 Wochen wurden die Versuchstiere nach vorheriger Betäubung durch Blutentzug getötet.
Um den Einfluss der Futterstruktur auf die Entwicklung der Verdauungsorgane der
Legehennen in den verschiedenen Versuchsgruppen zu untersuchen, wurden Pankreas,
Drüsen- und Muskelmagen sowie die drei Dünndarmabschnitte entnommen und
anschließend gewogen. Für die histologischen Untersuchungen wurden Gewebeproben vom
Duodenum, Jejunum und Ileum entnommen, histologisch bearbeitet und die Länge der
Darmzotten und Kryptentiefe morphometrisch beurteilt. Mit Hilfe von Ussing Kammer
Versuchen wurde der aktive Glukosetransport im Jejunum der Tiere gemessen und
überprüft, ob dieser durch die Fütterung der verschieden Diäten beeinflusst wurde. Mittels
durchflusszytometrischer Messungen wurden intraepitheliale Lymphozyten (IEL) im
Duodenum und Jejunum zum einen charakterisiert und zum anderen mögliche Effekte der
Futterstruktur auf deren Verteilung und relative Häufigkeit untersucht. Die statistische
Analyse der Ergebnisse erfolgte durch eine dreifaktorielle Varianzanalyse, so dass der
Einfluss der einzelnen Faktoren (Mühle, Form und Partikelgröße) sowie deren
Interaktionseffekte überprüft werden konnte.
Die Auswertung der Leistungsdaten ergab, dass die Form des Futters einen Einfluss auf die
Futteraufnahme der Tiere hatte. Legehennen, die mit Schrot gefüttert wurden, hatten
signifikant höhere Futteraufnahmen als jene, die das Expandat erhielten. Bezogen auf den
gesamten Versuchszeitraum beeinflusste dagegen weder die Partikelgröße des Futters noch
die verwendete Mühle die Leistung der Tiere. Allerdings hatte die Form sowie die
Partikelgröße des Futters einen Einfluss auf die Entwicklung einzelner Organgewichte des
Gastrointestinaltraktes. Legehennen, die mit Schrot anstelle von Expandat gefüttert wurden,
hatten signifikant schwerere Drüsen- und Muskelmägen sowie höhere Pankreasgewichte.
Außerdem wiesen Hennen, die mit grob vermahlenen Diäten gefüttert wurden im Vergleich
zu denen, die fein vermahlenes Futter erhielten, signifikant höhere Muskelmagengewichte
auf. Die Ergebnisse der histologischen Untersuchungen des Dünndarmgewebes
veranschaulichten, dass einzig die Form des Futters Einfluss auf die Länge der Darmzotten
und Kryptentiefe hatte. Die mit Schrot gefütterten Legehennen hatten signifikant längere
duodenale und kürzere ileale Darmzotten als Hennen, die Expandat als Futter erhielten.
Außerdem führte die Fütterung von Schrot zu einem größeren Verhältnis von Villuslänge zur
Kryptentiefe im Duodenum. Die Resultate der Ussing Kammer Versuche ergaben, dass der
durch den SGLT-1 vermittelte aktive Glukosetransport im Jejunum durch den Faktor Form
des Futters beeinflusst wird. Somit wiesen die mit Schrot gefütterten Hennen höhere
Glukosetransportraten auf als Hennen, die mit Expandat gefüttert wurden. Das eigens
etablierte Protokoll für die durchflusszytometrische Bestimmung unterschiedlicher
Lymphozytensubpopulationen aus dem darmassoziierten lymphatischen Gewebe führte zu

Zusammenfassung
85
aussagekräftigen und reproduzierbaren Ergebnissen. Allerdings konnten keine durch Futter
bedingten Effekte auf die Verteilung und relative Häufigkeit der IEL festgestellt werden.
Die Ergebnisse der vorliegenden Studie deuten darauf hin, dass die Futterstruktur im
Allgemeinen keinen Einfluss auf die Leistung der Legehennen hat, mit Ausnahme der
Futteraufnahme, die durch die Form des Futters (Schrot vs. Expandat) beeinflusst wurde.
Die Fütterung von Schrot im Vergleich zu Expandat hatte positive Effekte auf die Entwicklung
der Organe des Magen-Darm-Traktes und auf die Mikroarchitektur der intestinalen
Schleimhaut, wodurch möglicherweise auch die nachgewiesenen erhöhten
Glukoseaufnahmeraten im Jejunum zu erklären sind. Zudem führte die Verfütterung von grob
vermahlenen Diäten zu erhöhten Muskelmagengewichten, während die Mikroarchitektur des
Darmepithels sowie der intestinale Glukosetransport davon nicht beeinflusst wurde. Durch
die vorliegende Arbeit konnten verschiedene Lymphozytensubpopulationen im
darmassoziierten lymphatischen Gewebe von Legehennen der Rasse Lohmann Brown
charakterisiert werden. Allerdings deuten die Ergebnisse daraufhin, dass die Futterstruktur
keinen Einfluss auf die Verteilung und relative Häufigkeit der IELs in gesunden Legehennen
dieses Alters hat. Die zur Futterproduktion genutzten Mühlen hatten insgesamt keinen
Einfluss auf die untersuchten Parameter.
Auf Grundlage der Ergebnisse dieser Studie ist abschließend festzuhalten, dass weder die
intensive Vermahlung noch die Nutzung thermischer Behandlungsverfahren von Futter zu
verbesserten Leistungen der Legehennen führten. Vielmehr deuten die
Untersuchungsergebnisse darauf hin, dass insbesondere durch die Fütterung von grob
vermahlenem Schrot die Funktion des Magen-Darm-Traktes positiv beeinflusst wird und dies
auch positive Auswirkungen auf die Gesundheit und das Wohlbefinden der Tiere haben
könnte. Zudem ist aus ökologischer und ökonomischer Sicht zu betonen, dass eine
ressourcenschonende Futtermittelproduktion durch die Herstellung von grob vermahlenem
Schrot und die Verwendung energiesparender Mühlen gewährleistet wird und somit zum
Klimaschutz beitragen könnte.

86
9 References
Aerni, V., H. El-Lethey and B. Wechsler (2000). Effect of foraging material and food form on
feather pecking in laying hens. British Poultry Science 41: 16-21.
Afik, D., B. W. Darken and W. H. Karasov (1997). Is diet shifting facilitated by modulation of
intestinal nutrient uptake? Test of an adaptational hypothesis in Yellow-rumped
Warblers. Physiological Zoology 70: 213-221.
Amat, C., J. M. Planas and M. Moreto (1996). Kinetics of hexose uptake by the small and
large intestine of the chicken. The American Journal of Physiology 271: R1085-1089.
Amerah, A. M., R. G. Lentle and V. Ravindran (2007a). Influence of feed form on gizzard
morphology and particle size spectra of duodenal digesta in broiler chickens. Journal
of Poultry Science 44: 175-181.
Amerah, A. M., V. Ravindran, R. G. Lentle and D. G. Thomas (2007b). Feed particle size:
Implications on the digestion and performance of poultry. World's Poultry Science
Journal 63: 439-455.
Amerah, A. M., V. Ravindran, R. G. Lentle and D. G. Thomas (2007c). Influence of feed
particle size and feed form on the performance, energy utilization, digestive tract
development, and digesta parameters of broiler starters. Poultry Science 86: 2615-
2623.
Amerah, A. M., V. Ravindran, R. G. Lentle and D. G. Thomas (2007d). Influence of particle
size on the performance, digesta characteristics and energy utilisation of broilers fed
maize and wheat based diets. in: Proceedings of the Australian Poultry Science
Symposium 19, University of Sydney, Sydney: 89-92.
Anderson, J. M. and C. M. Van Itallie (2009). Physiology and function of the tight junction.
Cold Spring Harbor Perspectives in Biology 1: a002584.
Anderson, J. S. and R. Sunderland (2002). Effect of extruder moisture and dryer processing
temperature on vitamin C and E and astaxanthin stability. Aquaculture 207: 137-149.

References
87
Awad, W. A., J. R. Aschenbach, F. M. Setyabudi, E. Razzazi-Fazeli, J. Bohm and J. Zentek
(2007). In vitro effects of deoxynivalenol on small intestinal D-glucose uptake and
absorption of deoxynivalenol across the isolated jejunal epithelium of laying hens.
Poultry Science 86: 15-20.
Bäck, O. (1972). Studies on the lymphocytes in the intestinal epithelium of the chicken. Acta
Pathologica Microbiologica Scandinavica Section A Pathology 80: 84-90.
Bank, S. (2010). Zur Bedeutung von Art und Intensität der Vermahlung für die Verdaulichkeit
von organischer Substanz und Stärke bei Einsatz von Weizen und Mais in der
Fütterung von Mastputen. Hannover, Tierärztliche Hochschule, Dissertation.
Bar-Shira, E., D. Sklan and A. Friedman (2003). Establishment of immune competence in the
avian GALT during the immediate post-hatch period. Developmental and
Comparative Immunology 27: 147-157.
Bar-Shira, E. and A. Friedman (2005). Ontogeny of gut associated immune competence in
the chick. Israel Journal of Veterinary Medicine 60: 42-50.
Barfull, A., C. Garriga, M. Mitjans and J. M. Planas (2001). Ontogenetic expression and
regulation of Na+-D-glucose cotransporter in jejunum of domestic chicken. American
Journal of Physiology-Gastrointestinal and Liver Physiology 282: G559-G564.
Beal, R., C. Powers, T. Davison and A. Smith (2006). Avian Gut Function in Health and
Disease. Poultry Science Symposium Series Vol. 28, CAB International, Wallingford.
Berg, L. R. and G. E. Bearse (1951). Studies of the granulation of chicken laying mashes.
Poultry Science 27: 635.
Black, D., R. Jennings and T. Morris (1958). The relative merits of pellets and mash for
laying stock. Poultry Science 37: 707-722.
Blair, R., J. Downie and W. Dewar (1973). Egg production responses of hens given a
complete mash or unground grain together with concentrate pellets. British Poultry
Science 14: 373-377.

References
88
Blokhuis, H. (1986). Feather-pecking in poultry: its relation with ground-pecking. Applied
Animal Behaviour Science 16: 63-67.
Böck, P. (1989). Romeis Mikroskopische Technik. 17. Auflage, Urban und Schwarzenberg,
München, Wien, Baltimore.
Broer, S. (2008). Amino acid transport across mammalian intestinal and renal epithelia.
Physiological Reviews 88: 249-286.
Calet, C. (1965). The relative value of pellets versus mash and grain in poultry nutrition.
World's Poultry Science Journal 21: 23-52.
Calhaun, M. L. (1933). The Microscopic Anatomy of the Digestive Tract of Gallus
domesticus. Iowa State College Press, Ames, Iowa.
Casteleyn, C., M. Doom, E. Lambrechts, W. Van den Broeck, P. Simoens and P. Cornillie
(2010). Locations of gut-associated lymphoid tissue in the 3-month-old chicken: a
review. Avian Pathology 39: 143-150.
Caviedes-Vidal, E. and W. H. Karasov (1996). Glucose and amino acid absorption in house
sparrow intestine and its dietary modulation. American Journal of Physiology-
Regulatory, Integrative and Comparative Physiology 271: R561-R568.
Chai, J. and H. Lillehoj (1988). Isolation and functional characterization of chicken intestinal
intra-epithelial lymphocytes showing natural killer cell activity against tumour target
cells. Immunology 63: 111.
Chaplin, S. B., J. Raven and G. E. Duke (1992). The influence of the stomach on crop
function and feeding behavior in domestic turkeys. Physiology & Behavior 52: 261-
266.
Charron, F. M., M. G. Blanchard and J. Y. Lapointe (2006). Intracellular hypertonicity is
responsible for water flux associated with Na+/glucose cotransport. Biophysical
Journal 90: 3546-3554.
Chen, C., J. Pickel, J. Lahti and M. Cooper (1991). Avian Cellular Immunology. CRC Press,
Boca Raton, Florida.

References
89
Clarke, L. L. (2009). A guide to Ussing chamber studies of mouse intestine. American
Journal of Physiology - Gastrointestinal and Liver Physiology 296: G1151-1166.
Cooper, M. D., R. D. Peterson, M. A. South and R. A. Good (1966). The functions of the
thymus system and the bursa system in the chicken. The Journal of Experimental
Medicine 123: 75-102.
Dahlke, F., A. M. L. Ribeiro, A. d. M. Kessler, A. R. Lima and A. Maiorka (2002). Effects of
corn particle size and physical form of the diet on the gastrointestinal structures of
broiler chickens. Brazilian Journal of Poultry Science 5: 61-67.
Davis, R., E. Hill, H. Sloan and G. Briggs (1951). Detrimental effect of corn of coarse particle
size in rations for chicks. Poultry Science 30: 325-328.
Davison, F., B. Kaspers, K. A. Schat and P. Kaiser (2011). Avian Immunology. Elsevier Ltd.,
London, UK.
Deaton, J., B. Lott, S. Branton and J. Simmons (1987). Research note: effect of beak
trimming on body weight and feed intake of egg-type pullets fed pellets or mash.
Poultry Science 66: 1552-1554.
Deaton, J., B. Lott and J. Simmons (1989). Hammer mill versus roller mill grinding of corn for
commercial egg layers. Poultry Science 68: 1342-1344.
Dil, N. and M. A. Qureshi (2002). Differential expression of inducible nitric oxide synthase is
associated with differential Toll-like receptor-4 expression in chicken macrophages
from different genetic backgrounds. Veterinary Immunology and Immunopathology
84: 191-207.
Douglas, J., T. Sullivan, P. Bond, F. Struwe, J. Baier and L. Robeson (1990). Influence of
grinding, rolling, and pelleting on the nutritional value of grain sorghums and yellow
corn for broilers. Poultry Science 69: 2150-2156.
Dyer, J., S. Vayro, T. P. King and S. P. Shirazi-Beechey (2003). Glucose sensing in the
intestinal epithelium. European Journal of Biochemistry 270: 3377-3388.

References
90
Edwards, A. (1999). Feed processing and feeding management to enhance nutrient
utilization in commercial livestock production. Recent Advances in Animal Nutrition –
Australia 12: 137-144.
El-Lethey, H., V. Aerni, T. Jungi and B. Wechsler (2000). Stress and feather pecking in laying
hens in relation to housing conditions. British Poultry Science 41: 22-28.
Engberg, R. M., M. S. Hedemann and B. B. Jensen (2002). The influence of grinding and
pelleting of feed on the microbial composition and activity in the digestive tract of
broiler chickens. British Poultry Science 43: 569-579.
Engberg, R. M., M. S. Hedemann, S. Steenfeldt and B. B. Jensen (2004). Influence of whole
wheat and xylanase on broiler performance and microbial composition and activity in
the digestive tract. Poultry Science 83: 925-938.
Erf, G. F. (2004). Cell-mediated immunity in poultry. Poultry Science 83: 580-590.
Ernst, P., D. Clark, K. Rosenthal, A. Befus and J. Bienenstock (1986). Detection and
characterization of cytotoxic T lymphocyte precursors in the murine intestinal
intraepithelial leukocyte population. The Journal of Immunology 136: 2121-2126.
Fancher, B. I., D. Rollins and B. Trimbee (1996). Feed processing using the annular gap
expander and its impact on poultry performance. The Journal of Applied Poultry
Research 5: 386-394.
FAO (2013). FAO statistical yearbook 2013 World Food and Agriculture. Food and
Agriculture Organization of the United Nations, Rome.
Ferket, P. (2000). Feeding whole grains to poultry improves gut health. Feedstuffs 72 (37):
12-13, 16.
Ferraris, R. P. and J. M. Diamond (1986). Use of phlorizin binding to demonstrate induction
of intestinal glucose transporters. Journal of Membrane Biology 94: 77-82.
Ferraris, R. P. and J. Diamond (1997). Regulation of intestinal sugar transport. Physiological
Reviews 77: 257-302.

References
91
Ferraris, R. P. (2001). Dietary and developmental regulation of intestinal sugar transport.
Biochemical Journal 360: 265-276.
Ferrer, R., J. M. Planas and M. Moreto (1986). Characteristics of the chicken proximal cecum
hexose-transport system. Pflügers Archiv 407: 100-104.
Ferrer, R. (1993). Hexose transport across the apical and basolateral membrane of
enterocytes from different regions of the chicken intestine. Plügers Archiv 426: 83-88.
Forstner, J. (2009). Intestinal mucins in health and disease. Digestion 17: 234-263.
Frömter, E. and J. Diamond (1972). Route of passive ion permeation in epithelia. Nature:
New biology 235: 9-13.
Fujita, H. (1973). Quantitative studies on the variations in feeding activity of chickens. II.
Effect of the physical form of the feed on the feeding activity of laying hens. Japanese
Poultry Science 10: 47-54.
Furuse, M., T. Hirase, M. Itoh, A. Nagafuchi, S. Yonemura and S. Tsukita (1993). Occludin: a
novel integral membrane protein localizing at tight junctions. The Journal of Cell
Biology 123: 1777-1788.
Furuse, M., H. Sasaki, K. Fujimoto and S. Tsukita (1998). A single gene product, claudin-1 or
-2, reconstitutes tight junction strands and recruits occludin in fibroblasts. The Journal
of Cell Biology 143: 391-401.
Gabriel, I., S. Mallet and M. Leconte (2003). Differences in the digestive tract characteristics
of broiler chickens fed on complete pelleted diet or on whole wheat added to pelleted
protein concentrate. British Poultry Science 44: 283-290.
Gabriel, I., S. Mallet, M. Leconte, A. Travel and J. Lalles (2007). Effects of whole wheat
feeding on the development of the digestive tract of broiler chickens. Animal Feed
Science and Technology 142: 144-162.
Ganchrow, J. R., J. E. Steiner and A. Bartana (1990). Behavioral reactions to gustatory
stimuli in young chicks (Gallus gallus domesticus). Developmental Psychobiology 23:
103-117.

References
92
Garriga, C., M. Moreto and J. M. Planas (1999). Hexose transport in the apical and
basolateral membranes of enterocytes in chickens adapted to high and low NaCl
intakes. Journal of Physiology 514.1: 189-199.
Glick, B., T. S. Chang and R. G. Jaap (1956). The bursa of Fabricius and antibody
production. Poultry Science 35: 224-225.
Göbel, T. W., C. L. Chen, J. Shrimpf, C. E. Grossi, A. Bernot, R. P. Bucy, C. Auffray and M.
D. Cooper (1994). Characterization of avian natural killer cells and their intracellular
CD3 protein complex. European Journal of Immunology 24: 1685-1691.
Göbel, T. W., B. Kaspers and M. Stangassinger (2001). NK and T cells constitute two major,
functionally distinct intestinal epithelial lymphocyte subsets in the chicken.
International Immunology 13: 757-762.
Godfrey, D. I., K. J. Hammond, L. D. Poulton, M. J. Smyth and A. G. Baxter (2000). NKT
cells: facts, functions and fallacies. Immunology Today 21: 573-583.
Godfrey, D. I., H. R. MacDonald, M. Kronenberg, M. J. Smyth and L. Van Kaer (2004). NKT
cells: what's in a name? Nature Reviews Immunology 4: 231-237.
Godfrey, D. I. and J. Rossjohn (2011). New ways to turn on NKT cells. Journal of
Experimental Medicine 208: 1121-1125.
Hamilton, R. and F. Proudfoot (1994). Ingredient particle size and feed texture: effects on the
performance of broiler chickens. Animal Feed Science and Technology 51: 203-210.
Hamilton, R. and F. Proudfoot (1995). Effects of ingredient particle size and feed form on the
performance of Leghorn hens. Canadian Journal of Animal Science 75: 109-114.
Harms, R., G. Russell and D. Sloan (2000). Performance of four strains of commercial layers
with major changes in dietary energy. The Journal of Applied Poultry Research 9:
535-541.
Haskell, M., M. Vilarino, M. Savina, J. Atamna and M. Picard (2001). Do broiler chicks have a
cognitive representation of food quality?: Appetitive, behavioural and ingestive
responses to a change in diet quality. Applied Animal Behaviour Science 72: 63-77.

References
93
Hetland, H., B. Svihus and V. Olaisen (2002). Effect of feeding whole cereals on
performance, starch digestibility and duodenal particle size distribution in broiler
chickens. British Poultry Science 43: 416-423.
Hetland, H., B. Svihus and A. Krogdahl (2003a). Effects of oat hulls and wood shavings on
digestion in broilers and layers fed diets based on whole or ground wheat. British
Poultry Science 44: 275-282.
Hetland, H., B. Svihus, S. Lervik and R. Moe (2003b). Effect of feed structure on
performance and welfare in laying hens housed in conventional and furnished cages.
Acta Agriculturae Scandinavica 53: 92-100.
Hetland, H., M. Choct and B. Svihus (2004). Role of insoluble non-starch polysaccharides in
poultry nutrition. World's Poultry Science Journal 60: 415-422.
Heywang, B. W. and R. B. Morgan (1944). A comparison of a pelleted and unpelleted all-
mash diet for growing chickens. Poultry Science 23: 16-20.
Hill, F. and L. Dansky (1954). Studies of the energy requirements of chickens 1. The effect of
dietary energy level on growth and feed comsumption. Poultry Science 33: 112-119.
Huang, D. S., D. F. Li, J. J. Xing, Y. X. Ma, Z. J. Li and S. Q. Lv (2006). Effects of feed
particle size and feed form on survival of Salmonella typhimurium in the alimentary
tract and cecal S. typhimurium reduction in growing broilers. Poultry Science 85: 831-
836.
Imondi, A. and F. Bird (1966). The turnover of intestinal epithelium in the chick. Poultry
Science 45: 142-147.
Inborr, J. and M. Bedford (1994). Stability of feed enzymes to steam pelleting during feed
processing. Animal Feed Science and Technology 46: 179-196.
Jacobs, C., P. Utterback and C. Parsons (2010). Effects of corn particle size on growth
performance and nutrient utilization in young chicks. Poultry Science 89: 539-544.
Jansen, C. A., P. M. van de Haar, D. van Haarlem, P. van Kooten, S. de Wit, W. van Eden,
B. C. Viertlbock, T. W. Göbel and L. Vervelde (2010). Identification of new

References
94
populations of chicken natural killer (NK) cells. Developmental and Comparative
Immunologyl 34: 759-767.
Jensen, L. S. and J. McGinnis (1952). A comparison of feeding pelleted and unpelleted diets
containing different levels of alfalfa to laying hens. Poultry Science 31: 307-310.
Jensen, L. S., L. H. Merrill, C. Reddy and J. McGinnis (1962). Observations on eating
patterns and rate of food passage of birds fed pelleted and unpelleted diets. Poultry
Science 41: 1414-1419.
Jeroch, H., A. Simon and J. Zentek (2013). Geflügelernährung. Eugen Ulmer KG, Stuttgart.
Jerrett, S. A. and W. R. Goodge (1973). Evidence for amylase in avian salivary glands.
Journal of Morphology 139: 27-45.
Jones, G. and R. Taylor (2001). The incorporation of whole grain into pelleted broiler chicken
diets: production and physiological responses. British Poultry Science 42: 477-483.
Jones, R. B. (1986). Responses of domestic chicks to novel food as a function of sex, strain
and previous experience. Behavioural Processes 12: 261-271.
Karasov, W. H. (1994). Glucose absorption by a nectarivorous bird the passive pathway is
paramount. American Journal of Physiology: G18-G26.
Kiernan, J. (2008). Histology and Histochemical Methods. 4th ed., Scion Publishing Ltd,
Oxfordshire.
Klasing, K. C. (1998). Avian macrophages: regulators of local and systemic immune
responses. Poultry Science 77: 983-989.
Kluth, H. (2011). Relationship between feed particle size and digesibility of nutrients in
poultry. Übersichten zur Tierernährung 39: 47-66.
Koch, K. (1996). Hammermills and roller mills, MF-2048 Feed Manufacturing, Department of
Grain Science and Industry, Kansas State University: 1-8.

References
95
König, H. E., R. Korbel and H. G. Liebich (2008). Anatomie der Vögel: Klinische Aspekte und
Propädeutik. Zier-, Greif-, Zoo-, Wildvögel und Wirtschaftsgeflügel. 2. Auflage,
Schattauer Verlag, Stuttgart New York.
Lanier, L. L. and J. H. Phillips (1995). NK cell recognition of major histocompatibility complex
class I molecules. Seminars in Immunology 7: 75-82.
Lanier, L. L. (2005). NK cell recognition. Annual Review of Immunology 23: 225-274.
Larbier, M. and B. Leclercq (1992). Nutrition and feeding of poultry. Nottingham University
Press, Nottingham.
Laurinen, P., H. Siljander-Rasi, J. Karhunen, T. Alaviuhkola, M. Näsi and K. Tuppi (2000).
Effects of different grinding methods and particle size of barley and wheat on pig
performance and digestibility. Animal Feed Science and Technology 83: 1-16.
Lentle, R. G., V. Ravindran, G. Ravindran and D. V. Thomas (2006). Influence of feed
particle size on the efficiency of broiler chickens fed wheat-based diets. Journal of
Poultry Science 43: 135-142.
Levey, D. J. and W. H. Karasov (1992). Digestive modulation in a seasonal frugivore, the
American Robin (Turdus migratorius). American Journal of Physiology-
Gastrointestinal and Liver Physiology 262: G711-G718.
Levin, R. J., M. A. Mitchell and D. C. Barber (1983). Comparison of jejunal and ileal
absorptive functions for glucose and valine in vivo--a technique for estimating real Km
and Jmax in the domestic fowl. Comparative Biochemistry and Physiology Part A:
Physiology 74: 961-966.
Li, H., D. N. Sheppard and M. J. Hug (2004). Transepithelial electrical measurements with
the Ussing chamber. Journal of Cystic Fibrosis 3: 123-126.
Li, Y. and C. Owyang (1993). Vagal afferent pathway mediates physiological action of
cholecystokinin on pancreatic enzyme secretion. Journal of Clinical Investigation 92:
418.

References
96
Lillehoj, H. S. and K. S. Chung (1992). Postnatal development of T-lymphocyte
subpopulations in the intestinal intraepithelium and lamina propria in chickens.
Veterinary Immunology and Immunopathology 31: 347-360.
Lillehoj, H. S. (1994). Analysis of Eimeria acervulina-induced changes in the intestinal T
lymphocyte subpopulations in two chicken strains showing different levels of
susceptibility to coccidiosis. Research in Veterinary Science 56: 1-7.
Lillehoj, H. S. and J. M. Trout (1996). Avian gut-associated lymphoid tissues and intestinal
immune responses to Eimeria parasites. Clinical Microbiology Reviews 9: 349-360.
Lillehoj, H. S., W. Min and R. A. Dalloul (2004). Recent progress on the cytokine regulation of
intestinal immune responses to Eimeria. Poultry Science 83: 611-623.
Lind, J., B. G. Munck and O. Olsen (1980). Effects of dietary intake of sodium chloride on
sugar and amino acid transport across isolated hen colon. The Journal of Physiology
305: 327-336.
Liu, Y. H., X. S. Piao, D. Y. Ou, Y. H. Cao, D. S. Huang and D. F. Li (2006). Effects of
particle size and physical form of diets on mast cell numbers, histamine, and stem
cell factor concentration in the small intestine of broiler chickens. Poultry Science 85:
2149-2155.
Luhtala, M., C. A. Tregaskes, J. R. Young and O. Vainio (1997). Polymorphism of chicken
CD8-alpha, but not CD8-beta. Immunogenetics 46: 396-401.
Luhtala, M. (1998). Chicken CD4, CD8alphabeta, and CD8alphaalpha T cell co-receptor
molecules. Poultry Science 77: 1858-1873.
MacIsaac, J. L. and D. M. Anderson (2007). Effect of whole wheat, enzyme supplementation
and grain texture on the production performance of laying hens. Canadian Journal of
Animal Science 87: 579-589.
Madara, J. L., S. Nash, R. Moore and K. Atisook (1990). Structure and function of the
intestinal epithelial barrier in health and disease. Monographs in Pathology: 306-324.

References
97
McCracken, K. (2002). Poultry Feedstuffs: Supply, Composition, and Nutritive Value. CAB
International, Wallingford.
Meyer, W. and I. Hornickel (2011). Tissue fixation—the most underestimated methodical
feature of immunohistochemistry. Microscopy: Science, Technology, Applications and
Education 2: 953-959.
Montagne, L., J. Pluske and D. Hampson (2003). A review of interactions between dietary
fibre and the intestinal mucosa, and their consequences on digestive health in young
non-ruminant animals. Animal Feed Science and Technology 108: 95-117.
Muir, W. I., W. L. Bryden and A. J. Husband (2000). Immunity, vaccination and the avian
intestinal tract. Developmental and Comparative Immunology 24: 325-342.
Murphy, K., P. Travers and M. Walport (2009). Janeway Immunologie. 7. Auflage, Spektrum
Akademischer Verlag, Heidelberg.
Nelson, G., M. A. Hoon, J. Chandrashekar, Y. Zhang, N. J. Ryba and C. S. Zuker (2001).
Mammalian sweet taste receptors. Cell 106: 381-390.
Nir, I., R. Hillel, G. Shefet and Z. Nitsan (1994a). Effect of grain particle-size on performance
.2. Grain texture interactions. Poultry Science 73: 781-791.
Nir, I., Y. Twina, E. Grossman and Z. Nitsan (1994b). Quantitative effects of pelleting on
performance, gastrointestinal tract and behaviour of meat-type chickens. British
Poultry Science 35: 589-602.
Nir, I., R. Hillel, I. Ptichi and G. Shefet (1995). Effect of particle size on performance. 3.
Grinding pelleting interactions. Poultry Science 74: 771-783.
Noy, Y., A. Geyra and D. Sklan (2001). The effect of early feeding on growth and small
intestinal development in the posthatch poult. Poultry Science 80: 912-919.
O’Dell, B., P. Newberne and J. Savage (1959). An abnormality of the proventriculus caused
by feed texture. Poultry Science 38: 296-301.

References
98
Oláh, I. and B. Glick (1984). Meckel's diverticulum. I. Extramedullary myelopoiesis in the yolk
sac of hatched chickens (Gallus domesticus). The Anatomical Record 208: 243-252.
Pat Bucy, R., C. I. H. Chen and M. D. Cooper (1990). Development of cytoplasmic CD3+/T
cell receptor‐negative cells in the peripheral lymphoid tissues of chickens. European
Journal of Immunology 20: 1345-1350.
Peisker, M. (2006). Feed Processing–Impacts on nutritive value and hygienic status in broiler
feeds. Proceedings of Australian Poultry Science Symposium 18: 7-16.
Pepper, W., J. Summers, S. Slinger and G. Ashton (1968). Effect of steam pelleting on the
performance of hens fed various laying diets. Canadian Journal of Animal Science
48: 229-234.
Peron, A., D. Bastianelli, F. X. Oury, J. Gomez and B. Carre (2005). Effects of food
deprivation and particle size of ground wheat on digestibility of food components in
broilers fed on a pelleted diet. British Poultry Science 46: 223-230.
Planas, J. M., R. Ferrer and M. Moreto (1987). Relation between alpha-methyl-D-glucoside
influx and brush-border surface-area in enterocytes from chicken cecum and jejunum.
Pflügers Archiv 408: 515-518.
Plavnik, I. and D. Sklan (1995). Nutritional effects of expansion and short time extrusion on
feeds for broilers. Animal Feed Science and Technology 55: 247-251.
Plavnik, I., B. Macovsky and D. Sklan (2002). Effect of feeding whole wheat on performance
of broiler chickens. Animal Feed Science and Technology 96: 229–236.
Podolsky, D. K. (1999). Mucosal immunity and inflammation. V. Innate mechanisms of
mucosal defense and repair: the best offense is a good defense. The American
Journal of Physiology 277: G495-499.
Portella, F., L. Caston and S. Leeson (1988). Apparent feed particle size preference by
broilers. Canadian Journal of Animal Science 68: 923-930.
Powell, D. W. (1981). Barrier function of epithelia. American Journal of Physiology 241:
G275-288.

References
99
Preston, C. M., K. J. McKracken and A. McAllister (2000). Effect of diet form and enzyme
supplementation on growth, efficiency and energy utilisation of wheat-based diets for
broilers. British Poultry Science 41: 324-331.
Pubols, M. (1991). Ratio of digestive enzymes in the chick pancreas. Poultry Science 70:
337-342.
Qureshi, M. A. (2003). Avian macrophage and immune response: an overview. Poultry
Science 82: 691-698.
Reece, F., B. Lott and J. Deaton (1985). The effects of feed form, grinding method, energy
level, and gender on broiler performance in a moderate (21 C) environment. Poultry
Science 64: 1834-1839.
Roche, M. (1981). Feeding behaviour and digestive motility of birds. Reproduction Nutrition
Development 21: 781-788.
Rogel, A., D. Balnave, W. Bryden and E. Annison (1987). Improvement of raw potato starch
digestion in chickens by feeding oat hulls and other fibrous feedstuffs. Crop and
Pasture Science 38: 629-637.
Rougiere, N., J. Gomez, S. Mignon-Grasteau and B. Carre (2009). Effects of diet particle
size on digestive parameters in D+ and D- genetic chicken lines selected for
divergent digestion efficiency. Poultry Science 88: 1206-1215.
Ruhnke, I., I. Röhe, W. Meyer, S. Kröger, K. Neumann and J. Zentek (2013). Method for the
preparation of mucosal flaps from the jejunum of laying hens for transporter studies in
Ussing chambers. Archives of Animal Nutrition 67: 161-168.
Safaa, H., E. Jiménez-Moreno, D. Valencia, M. Frikha, M. Serrano and G. Mateos (2009).
Effect of main cereal of the diet and particle size of the cereal on productive
performance and egg quality of brown egg-laying hens in early phase of production.
Poultry Science 88: 608-614.
Santos, F. B., B. W. Sheldon, A. A. Santos, Jr. and P. R. Ferket (2008). Influence of housing
system, grain type, and particle size on Salmonella colonization and shedding of
broilers fed triticale or corn-soybean meal diets. Poultry Science 87: 405-420.

References
100
Savory, C. J. (1974). Growth and behaviour of chicks fed on pellets or mash. British Poultry
Science 15: 281-286.
Savory, C. J. and M. A. Mitchell (1991). Absorption of hexose and pentose sugars in vivo in
perfused intestinal segments in the fowl. Comparative Biochemistry and Physiology.
A, Comparative Physiology 100: 969-974.
Schiffman, H. (1969). Texture preference and acivity in the domestic chick. Journal of
Comparative and Physiological Psychology 67: 462-464.
Schneeberger, E. E. and R. D. Lynch (2004). The tight junction: a multifunctional complex.
American Journal of Physiology-Cell Physiology 286: C1213-1228.
Shapiro, B. (1947). The mechanism of phloridzin glucosuria. The Biochemical Journal 41:
151-154.
Sharma, J. and W. Okazaki (1981). Natural killer cell activity in chickens: target cell analysis
and effect of antithymocyte serum on effector cells. Infection and immunity 31: 1078-
1085.
Shi, P. and J. Zhang (2006). Contrasting modes of evolution between vertebrate
sweet/umami receptor genes and bitter receptor genes. Molecular Biology and
Evolution 23: 292-300.
Shirazi-Beechey, S., B. Hirayama, Y. Wang, D. Scott, M. Smith and E. Wright (1991).
Ontogenic development of lamb intestinal sodium-glucose co-transporter is regulated
by diet. The Journal of Physiology 437: 699-708.
Shirazi-Beechey, S. P., A. W. Moran, D. J. Batchelor, K. Daly and M. Al-Rammahi (2011).
Glucose sensing and signalling; regulation of intestinal glucose transport. The
Proceedings of the Nutrition Society 70: 185-193.
Solberg, D. H. and J. M. Diamond (1987). Comparison of different dietary sugars as inducers
of intestinal sugar transporters. American Journal of Physiology-Gastrointestinal and
Liver Physiology 252: G574-G584.

References
101
Specian, R. D. and M. G. Oliver (1991). Functional biology of intestinal goblet cells. American
Journal of Physiology-Cell Physiology 260: C183-C193.
Svihus, B. and H. Hetland (2001). Ileal starch digestibility in growing broiler chickens fed on a
wheat-based diet is improved by mash feeding, dilution with cellulose or whole wheat
inclusion. British Poultry Science 42: 633-637.
Svihus, B., E. Juvik, H. Hetland and A. Krogdahl (2004a). Causes for improvement in
nutritive value of broiler chicken diets with whole wheat instead of ground wheat.
British Poultry Science 45: 55-60.
Svihus, B., K. Klovstad, V. Perez, O. Zimonja, S. Sahlstrom, R. Schuller, W. Jeksrud and E.
Prestlokken (2004b). Physical and nutritional effects of pelleting of broiler chicken
diets made from wheat ground to different coarsenesses by the use of roller mill and
hammer mill. Animal Feed Science and Technology 117: 281-293.
Svihus, B. (2006). The role of feed processing on gastrointestinal function and health in
poultry. ed. GC Perry, vol. 28, CAB International: Wallingford, UK, pp.183-194.
Svihus, B. (2011). The gizzard: function, influence of diet structure and effects on nutrient
availability. World's Poultry Science Journal 67: 207-224.
Suvarna, S., V. Christensen, D. Ort and W. Croom Jr (2005). High levels of dietary
carbohydrate increase glucose transport in poult intestine. Comparative Biochemistry
and Physiology Part A: Molecular & Integrative Physiology 141: 257-263.
Tregaskes, C. A., F. Kong, E. Paramithiotis, C. Chen, M. Ratcliffe, T. F. Davison and J. R.
Young (1995). Identification and analysis of the expression of CD8 alpha beta and
CD8 alpha alpha isoforms in chickens reveals a major TCR-gamma delta CD8 alpha
beta subset of intestinal intraepithelial lymphocytes. The Journal of Immunology 154:
4485-4494.
Uni, Z., S. Ganot and D. Sklan (1998). Posthatch development of mucosal function in the
broiler small intestine. Poultry Science 77: 75-82.
Uni, Z., Y. Noy and D. Sklan (1999). Posthatch development of small intestinal function in the
poult. Poultry Science 78: 215-222.

References
102
Uni, Z. (2006). Early development of small intestinal function. in: Avian Gut Function in
Health and Disease. Poultry Science Symposium Series: 29-42.
Ussing, H. H. and K. Zerahn (1951). Active transport of sodium as the source of electric
current in the short‐circuited isolated frog skin. Acta Physiologica Scandinavica 23:
110-127.
Van Itallie, C. M. and J. M. Anderson (2004). The role of claudins in determining paracellular
charge selectivity. Proceedings of the American Thoracic Society 1: 38-41.
Vervelde, L. and S. H. Jeurissen (1993). Postnatal development of intra-epithelial leukocytes
in the chicken digestive tract: phenotypical characterization in situ. Cell andTissue
Research 274: 295-301.
Vest, L. and G. Calhoun (1997). Expanders and their influence on broiler performance.
American Soybean Association: [pdf] Available at: http://www.asaim-
europe.org/backup/pdf/expanders.pdf [Accessed 20 Juli 2013].
Wahlström, A., R. Tauson and K. Elwinger (1999). Production and egg quality as influenced
by mash or crumbled diets fed to laying hens in an aviary system. Poultry Science 78:
1675-1680.
Waldroup, P. (1997). Particle size reduction of cereal grains and its significance in poultry
nutrition. American Soybean Association Technical Bulletin PO34-1997: 1-14.
WHO (2003). Diet, Nutrition and the Prevention of Chronic Diseases. Report of a Joint
WHO/FAO Expert Consultation. World Health Organisation, Geneva, Switzerland.
Williams, J., S. Mallet, M. Leconte, M. Lessire and I. Gabriel (2008). The effects of fructo-
oligosaccharides or whole wheat on the performance and digestive tract of broiler
chickens. British Poultry Science 49: 329-339.
Williams, P. E., V, H. Monge and D. Jackson (1997). Effects on the performance of poultry of
manufacturing feed using expansion plus pelleting compared with pelleting alone. in:
Proceedings of the Australian Poultry Science Symposium 9, University of Sydney,
Sydney: 74-78.

References
103
Witte, M. (2012). Zur Bedeutung einer unterschiedlichen Mischfutterstruktur
(Vermahlungsart/-intensität, Konfektionierung) für die Leistung, Verdaulichkeit des
Futters und Morphologie des Gastrointestinaltraktes bei Masthähnchen. Hannover,
Tierärztliche Hochschule, Dissertation.
Wolf, P., P. Rust and J. Kamphues (2010). How to assess particle size distribution in diets for
pigs? Livestock Science 133: 78-80.
Wolf, P., M. Arlinghaus, J. Kamphues, N. Sauer and R. Mosenthin (2012). Einfluss der
Partikelgrösse im Futter auf die Nährstoffverdaulichkeit und Leistung beim Schwein.
Übersichten zur Tierernährung 40: 21-64.
Wright, E. M., B. A. Hirayama and D. F. Loo (2007). Active sugar transport in health and
disease. Journal of Internal Medicine 261: 32-43.
Wu, Y. B., V. Ravindran, D. G. Thomas, M. J. Birtles and W. H. Hendriks (2004). Influence of
method of whole wheat inclusion and xylanase supplementation on the performance,
apparent metabolisable energy, digestive tract measurements and gut morphology of
broilers. British Poultry Science 45: 385-394.
Yamauchi, K. (2001). Digestive organ. in: Japanese Association of Veterinary Anatomists
(ed.) , Veterinary Histology, Gakusosha, Tokyo: 265-273.
Yun, C. H., H. S. Lillehoj and E. P. Lillehoj (2000). Intestinal immune responses to
coccidiosis. Developmental and Comparative Immunology 24: 303-324.
Zeuthen, T. and E. Zeuthen (2007). The mechanism of water transport in Na+-coupled
glucose transporters expressed in Xenopus oocytes. Biophysical Journal 93: 1413-
1419.

104
10 Appendix
Publications
Oral Presentations
Röhe, I. (2012)
Überprüfung der Effekte unterschiedlicher Zerkleinerungsverfahren von Futtermitteln auf
ernährungsphysiologische Parameter bei Legehennen. 7. Doktorandensymposium & DRS
Präsentationssemiar „Biomedical Sciences”, Freie Universität Berlin, Berlin, Germany,
13.Juli.2012.
Röhe, I., I. Ruhnke, R. Löwe, J. Zentek (2013)
Effects of grinding method, particle size, and physical form of the diet on the glucose
transport of the isolated epithelium of the jejunum in laying hens.
Proceedings of the Society of Nutrition Physiology 22: 158, Göttingen, Germany,
19.-21.März 2013.
Journal Publications
Röhe, I., I. Ruhnke, F. Knorr, A. Mader, F. Goodarzi Boroojeni, R. Löwe, and J. Zentek
(2013). Effects of grinding method, particle size and physical form of the diet on
gastrointestinal morphology and jejunal glucose transport in laying hens. Poultry Science,
Submitted.
Ruhnke, I., I. Röhe, W. Meyer, S. Kröger, K. Neumann and J. Zentek (2013).
Method for the preparation of mucosal flaps from the jejunum of laying hens for transporter
studies in Ussing chambers. Archives of Animal Nutrition 67: 161-168.
Goodarzi Boroojeni, F., A. Mader, F. Knorr, I. Ruhnke, I. Röhe, H. Abdul, K. Männer and J.
Zentek (2013).
Effect of different heat treatments and organic acid levels on nutrient digestibility in broilers.
Poultry Science, Submitted.

Appendix
105
Acknowledgement
First and foremost, I would like to express my sincere appreciation to my supervisor, Prof.
Jürgen Zentek for his guidance, patience and encouragement whilst giving me the
opportunity to explore and put forth my own ideas during the completion of this dissertation.
Further, I would sincerely like to thank Prof. Thomas Göbel and Prof. Bernd Kaspers for
giving me academic support. I would like to thank Prof. Klaus Männer for his support during
the animal trials and Dr. Konrad Neumann for his statistical advices.
I would also like to extend my thanks to my friends and colleagues at the Institute of Animal
Nutrition as well as to the technicians of the laboratory staff. My research would not have
been possible without their help and assistance.
I am grateful to the German Federation of Industrial Research Associations e.V. (AiF) (AiF-
No. 16800 N) for their financial support and to the International Research Association of
Feed Technology e.V. (IFF) for providing the experimental diets.
I would also like to thank Fabienne, Janet and Ben for their friendship and support. Special
thanks go to Claudia for her personal support and great patience at all times.
Finally, my deepest gratitude goes to my parents, Monika and Peter, and my brother, Oke,
for their encouragement and continued support during the years.

Appendix
106
Declaration
I hereby declare that this dissertation is my own work and has not previously been submitted
anywhere for any award. Where other sources of information have been used they have
been acknowledged.
Berlin, 20.09.2013
Ilen Röhe


![Animal Feed Mill[1]](https://static.fdocuments.in/doc/165x107/553da3444a7959632d8b46e3/animal-feed-mill1.jpg)