EFFECTS OF FATIGUE ON MOTOR UNIT FIRING … OF FATIGUE ON MOTOR UNIT FIRING RATE VERSUS RECRUITMENT...
10
EFFECTS OF FATIGUE ON MOTOR UNIT FIRING RATE VERSUS RECRUITMENT THRESHOLD RELATIONSHIPS MATT S. STOCK, MS, TRAVIS W. BECK, PhD, and JASON M. DEFREITAS, MS Department of Health and Exercise Science, University of Oklahoma, 1401 Asp Avenue, Norman, Oklahoma 73019-6081, USA Accepted 1 August 2011 ABSTRACT: Introduction: The purpose of this study was to examine the influence of fatigue on the average firing rate ver- sus recruitment threshold relationships for the vastus lateralis (VL) and vastus medialis. Methods: Nineteen subjects per- formed ten maximum voluntary contractions of the dominant leg extensors. Before and after this fatiguing protocol, the subjects performed a trapezoid isometric muscle action of the leg exten- sors, and bipolar surface electromyographic signals were detected from both muscles. These signals were then decom- posed into individual motor unit action potential trains. For each subject and muscle, the relationship between average firing rate and recruitment threshold was examined using linear regression analyses. Results: For the VL, the linear slope coefficients and y-intercepts for these relationships increased and decreased, respectively, after fatigue. For both muscles, many of the motor units decreased their firing rates. Conclusion: With fatigue, recruitment of higher threshold motor units resulted in an increase in slope for the VL. Muscle Nerve 45: 100–109, 2012 Edwards 1 defined fatigue as ‘‘the failure to main- tain the required or expected force.’’ As addressed by Weir et al., 2 identifying the precise mechanisms underlying the decline in force is complicated by the fact that multiple processes are involved (e.g., calcium release, changes in reflex function, motor unit recruitment, etc.). They also argued that mus- cle fatigue is highly dependent on task-specific fac- tors and cannot be explained with a single model. 2 Furthermore, several investigators have suggested that fatigue could be due to central or peripheral factors, with central and peripheral fatigue occur- ring proximal and distal to the neuromuscular junction, respectively. 3–5 Many studies have examined the effects of fa- tigue on motor unit recruitment, derecruitment, and firing rates during constant-force isometric muscle actions. 6–15 Several of these investigations have demonstrated that, as a muscle is progres- sively more fatigued, the ability to maintain a con- stant force is accomplished, at least in part, by the recruitment of additional motor units, which often results in an increase in surface electromyographic (EMG) amplitude. 6–9 In addition, several studies have reported a decline in motor unit firing rates as a muscle becomes fatigued. 9–13 Adam and De Luca 6,7 examined motor unit firing rates for the vastus lateralis (VL) during prolonged submaximal isometric muscle actions. Specifically, the subjects were required to hold a force level corresponding to 50% of the predetermined maximum voluntary contraction (MVC), followed by a decrease to 20% MVC, which was then held for 50 seconds. Their results show that motor unit firing rates first increased and then decreased, which they 7 believed may explain some of the differences in fir- ing rate responses reported in previous studies. 13,14 In addition, they reported that the recruitment threshold of motor units declined throughout the contraction series. 6 For nearly three decades, many of the studies by De Luca and colleagues have focused on EMG signal decomposition. 16–21 The long-term goal of these investigations was to eventually develop a fully automatic system capable of separating the surface EMG signal into its constituent motor unit action potential trains, thereby allowing research- ers to study the firing rates of individual motor units. As a result of recent improvements, 19,20 the Precision Decomposition (PD) algorithm is now applicable to surface EMG signals and does not require assistance from an expert operator. According to De Luca and Nawab, 21 the ability to decompose surface EMG signals was made possi- ble by combining their PD approach with the arti- ficial intelligence–based Integrated Processing and Understanding of Signals concept, originally described by Lesser et al. 22 According to Nawab et al., 20 these types of algorithms are widely applied in other fields, and are effective due to their use of a knowledge base of adaptable ‘‘rules’’ and ‘‘cases.’’ However, the PD III algorithm and the ‘‘reconstruct-and-test’’ procedure introduced by Nawab et al. 20 were recently called into question. 23 Without going into great detail, Farina and Enoka 23 were not convinced that the data reported recently by De Luca and Hostage 24 portrayed an accurate assessment of motor unit behavior, as they indicated that the reconstruct-and-test proce- dure had not yet been adequately validated. 23 In their rebuttal, De Luca and Nawab 21 noted that both De Luca et al. 19 and Nawab et al. 20 validated their algorithms with variations of the original two- source test 18 and that, in both studies, the average accuracy of the PD algorithm was >92% when Abbreviations: ANOVA, analysis of variance; EMG, electromyography; MVC, maximum voluntary contraction; PD, Precision Decomposition; PPS, pulses per second; RF, rectus femoris; VL, vastus lateralis; VM, vastus medialis Correspondence to: M. S. Stock; e-mail: [email protected] V C 2011 Wiley Periodicals, Inc. Published online in Wiley Online Library (wileyonlinelibrary.com). DOI 10.1002/mus.22266 Key words: decomposition, electromyography, force, isometric, motor control 100 Motor Unit Fatigue MUSCLE & NERVE January 2012
Transcript of EFFECTS OF FATIGUE ON MOTOR UNIT FIRING … OF FATIGUE ON MOTOR UNIT FIRING RATE VERSUS RECRUITMENT...
EFFECTS OF FATIGUE ON MOTOR UNIT FIRING RATE VERSUSRECRUITMENT THRESHOLD RELATIONSHIPSMATT S. STOCK, MS, TRAVIS W. BECK, PhD, and JASON M. DEFREITAS, MS
Department of Health and Exercise Science, University of Oklahoma, 1401 Asp Avenue, Norman, Oklahoma 73019-6081, USA
Accepted 1 August 2011
ABSTRACT: Introduction: The purpose of this study was toexamine the influence of fatigue on the average firing rate ver-sus recruitment threshold relationships for the vastus lateralis(VL) and vastus medialis. Methods: Nineteen subjects per-formed ten maximum voluntary contractions of the dominant legextensors. Before and after this fatiguing protocol, the subjectsperformed a trapezoid isometric muscle action of the leg exten-sors, and bipolar surface electromyographic signals weredetected from both muscles. These signals were then decom-posed into individual motor unit action potential trains. For eachsubject and muscle, the relationship between average firing rateand recruitment threshold was examined using linear regressionanalyses. Results: For the VL, the linear slope coefficients andy-intercepts for these relationships increased and decreased,respectively, after fatigue. For both muscles, many of the motorunits decreased their firing rates. Conclusion: With fatigue,recruitment of higher threshold motor units resulted in anincrease in slope for the VL.
Muscle Nerve 45: 100–109, 2012
Edwards1 defined fatigue as ‘‘the failure to main-tain the required or expected force.’’ As addressedby Weir et al.,2 identifying the precise mechanismsunderlying the decline in force is complicated bythe fact that multiple processes are involved (e.g.,calcium release, changes in reflex function, motorunit recruitment, etc.). They also argued that mus-cle fatigue is highly dependent on task-specific fac-tors and cannot be explained with a single model.2
Furthermore, several investigators have suggestedthat fatigue could be due to central or peripheralfactors, with central and peripheral fatigue occur-ring proximal and distal to the neuromuscularjunction, respectively.3–5
Many studies have examined the effects of fa-tigue on motor unit recruitment, derecruitment,and firing rates during constant-force isometricmuscle actions.6–15 Several of these investigationshave demonstrated that, as a muscle is progres-sively more fatigued, the ability to maintain a con-stant force is accomplished, at least in part, by therecruitment of additional motor units, which oftenresults in an increase in surface electromyographic(EMG) amplitude.6–9 In addition, several studieshave reported a decline in motor unit firing rates
as a muscle becomes fatigued.9–13 Adam and DeLuca6,7 examined motor unit firing rates for thevastus lateralis (VL) during prolonged submaximalisometric muscle actions. Specifically, the subjectswere required to hold a force level correspondingto 50% of the predetermined maximum voluntarycontraction (MVC), followed by a decrease to 20%MVC, which was then held for 50 seconds. Theirresults show that motor unit firing rates firstincreased and then decreased, which they7
believed may explain some of the differences in fir-ing rate responses reported in previous studies.13,14
In addition, they reported that the recruitmentthreshold of motor units declined throughout thecontraction series.6
For nearly three decades, many of the studiesby De Luca and colleagues have focused on EMGsignal decomposition.16–21 The long-term goal ofthese investigations was to eventually develop afully automatic system capable of separating thesurface EMG signal into its constituent motor unitaction potential trains, thereby allowing research-ers to study the firing rates of individual motorunits. As a result of recent improvements,19,20 thePrecision Decomposition (PD) algorithm is nowapplicable to surface EMG signals and does notrequire assistance from an expert operator.
According to De Luca and Nawab,21 the abilityto decompose surface EMG signals was made possi-ble by combining their PD approach with the arti-ficial intelligence–based Integrated Processing andUnderstanding of Signals concept, originallydescribed by Lesser et al.22 According to Nawabet al.,20 these types of algorithms are widelyapplied in other fields, and are effective due totheir use of a knowledge base of adaptable ‘‘rules’’and ‘‘cases.’’ However, the PD III algorithm andthe ‘‘reconstruct-and-test’’ procedure introduced byNawab et al.20 were recently called into question.23
Without going into great detail, Farina andEnoka23 were not convinced that the data reportedrecently by De Luca and Hostage24 portrayed anaccurate assessment of motor unit behavior, asthey indicated that the reconstruct-and-test proce-dure had not yet been adequately validated.23 Intheir rebuttal, De Luca and Nawab21 noted thatboth De Luca et al.19 and Nawab et al.20 validatedtheir algorithms with variations of the original two-source test18 and that, in both studies, the averageaccuracy of the PD algorithm was >92% when
Abbreviations: ANOVA, analysis of variance; EMG, electromyography;MVC, maximum voluntary contraction; PD, Precision Decomposition; PPS,pulses per second; RF, rectus femoris; VL, vastus lateralis; VM, vastusmedialis
Correspondence to: M. S. Stock; e-mail: [email protected]
VC 2011 Wiley Periodicals, Inc.Published online in Wiley Online Library (wileyonlinelibrary.com).DOI 10.1002/mus.22266
Key words: decomposition, electromyography, force, isometric,motor control
100 Motor Unit Fatigue MUSCLE & NERVE January 2012

compared with separate sensors. The reader wasthen reminded that the reconstruct-and-test proce-dure uses ‘‘…synthetic surface EMG signals forwhich we know the action potential shapes and thefiring times of all involved motor units throughoutthe signal.’’21 De Luca and Nawab21 concludedtheir letter by stating that accuracy assessmentsmust be specific to each decomposed EMG signal,and that understanding ‘‘…how well a decomposi-tion algorithm functions under artificial test condi-tions provides no assurance that it works well on aspecific real EMG signal….’’
In a recent study by De Luca and Hostage,24
linear regression analyses were used to examinethe relationship between the average firing rates ofmotor units and their recruitment thresholds dur-ing constant-force isometric muscle actions of theVL, tibialis anterior, and first dorsal interosseous.By examining force levels corresponding to 20%,50%, 80%, and 100% MVC, they were able to studychanges in the linear regression lines for theserelationships. In agreement with the ‘‘onion skin’’phenomenon demonstrated earlier by De Lucaet al.25 and De Luca and Erim,26 both individualsubject and grouped data showed inverse relation-ships across all force levels, indicating that the low-threshold motor units consistently maintained thehighest average firing rates. As displayed in theirFigures 2 and 3,24 the increase in firing rates andthe recruitment of additional motor units athigher force levels resulted in slight increases inthe linear slope coefficients (i.e., the slopesbecame less negative). Even at the 100% MVCforce level, however, the inverse relationshipsbetween the average firing rates of motor unitsand their recruitment thresholds were maintained.
Although data are limited on the sensitivity ofthe linear regression line for the average firingrate versus recruitment threshold relationship, theresults from De Luca and Hostage24 suggest thatthese linear slope coefficients and y-intercepts maybe useful for studying changes in motor controlduring the course of an intervention (e.g., strengthtraining, stretching, and fatigue). As just oneexample, if a researcher were to hypothesize thatstrength training results in an increase in the aver-age firing rates for only the high-threshold motorunits, after the training program, one wouldexpect to observe an increase in the linear slopecoefficients (i.e., flatter slopes) for these relation-ships with no change in the y-intercepts. Alterna-tively, an increase in the mean y-intercept with nochange for the mean linear slope coefficient wouldbe interpreted as an increase in the average firingrates for all of the observed motor units. Previousstudies6,7 examining the average firing rates ofmotor units throughout the fatigue process have
reported that the onion skin property was main-tained; however, the purpose of this study was toexamine the average firing rate versus recruitmentthreshold relationships for the VL and vastus medi-alis (VM) before and immediately after a fatiguingprotocol of the dominant leg extensors.
METHODS
Subjects. Twelve healthy men (mean 6 SD: age,22.1 6 1.4 years; body weight, 78.9 6 10.4 kg) and7 healthy women (age, 21.6 6 1.2 years; bodyweight, 65.4 6 13.1 kg) volunteered to participatein this study. Each subject completed a pre-exer-cise health and exercise status questionnaire,which indicated no current or recent (within thepast 6 months) neuromuscular or musculoskeletalproblems. The study was approved by the univer-sity institutional review board for human subjects,and all participants signed an informed consentform prior to testing.
Familiarization Session. At a minimum of 48 hprior to data collection, the subjects participatedin a familiarization session to become acquaintedwith the equipment and to minimize the influenceof learning on the study’s dependent variables.The purpose of the familiarization session was forthe subjects to become comfortable performingmultiple unilateral isometric MVCs of the domi-nant (based on kicking preference) leg extensors.The subjects also performed several trapezoid iso-metric muscle actions of the leg extensors. Specifi-cally, the subjects were required to linearlyincrease isometric leg extension force from 0% to50% MVC over a period of 4 s. They then held theforce constant at 50% MVC for 12 s, followed by alinear decrease in force from 50% to 0% MVC in 4s. They were provided with a visual template oftheir force production during the trapezoid muscleaction. Practicing these muscle actions helped thesubjects perform smooth linear increases anddecreases in force during data collection.
Isometric Testing and Fatigue Protocol. After thefamiliarization session, the subjects returned to thelaboratory for the data collection trial. Upon ar-rival, they were seated in a custom-built chairdesigned for lower body isometric strength testing.Furthermore, the subjects were strapped tightly tothe chair with a Velcro strap around the abdomenand were instructed to remain seated during alldata collection procedures. After a brief warm-up,they performed two 3-s unilateral MVCs of the legextensors separated by 3 min of rest at a jointangle of 120� between the thigh and the leg. Atension/compression load cell (Model SSM-AJ-500;Interface, Scottsdale, Arizona) was attached to anankle cuff to allow for measurement of force
Motor Unit Fatigue MUSCLE & NERVE January 2012 101
production. The highest force from the twoattempts was used as the MVC value. After determi-nation of the isometric MVC, the subjects per-formed a trapezoid isometric muscle action of theleg extensors using the same force template as thatfor the familiarization session (i.e., increased iso-metric leg extension force from 0% to 50% MVCin 4 s, held the force constant for 12 s, anddecreased increased isometric leg extension forcefrom 50% to 0% MVC in 4 s). All subjects wereinstructed to maintain their force output as closeas possible to the target force.
Immediately after performing the trapezoid iso-metric muscle action, the subjects performed a fati-guing protocol that involved ten 10-s isometricMVCs of the dominant leg extensors, with 10 s ofrest between each MVC (i.e., 10 s on, 10 s off).They were given verbal encouragement to produceas much force as possible during each MVC. Afterthis protocol, they performed a 3-s isometric MVCto measure strength when the quadriceps femorismuscles were in the fatigued state. Immediately af-ter this MVC, they performed a second trapezoidisometric muscle action in the same manner as thefirst. However, the same absolute force level (i.e.,50% of the fresh muscle MVC) was used for thefirst and second trapezoid muscle actions.
EMG Signal Detection and Processing. Eight sepa-rate bipolar surface EMG signals were detectedfrom the VL and VM (i.e., four signals per muscle)during the trapezoid isometric actions. For eachmuscle, the signals were detected with a surfacearray EMG sensor (Delsys, Inc., Boston, Massachu-setts) that consists of five pin electrodes. Four ofthe five electrodes are arranged in a square (inter-electrode distance 5.6 mm), with the fifth elec-trode in the center of the square and at a distanceof 3.6 mm from all other electrodes. (For detailedinformation regarding the surface EMG sensorsused in this study, refer to the Methods sectionand Fig. 1 in the study by Nawab et al.20)
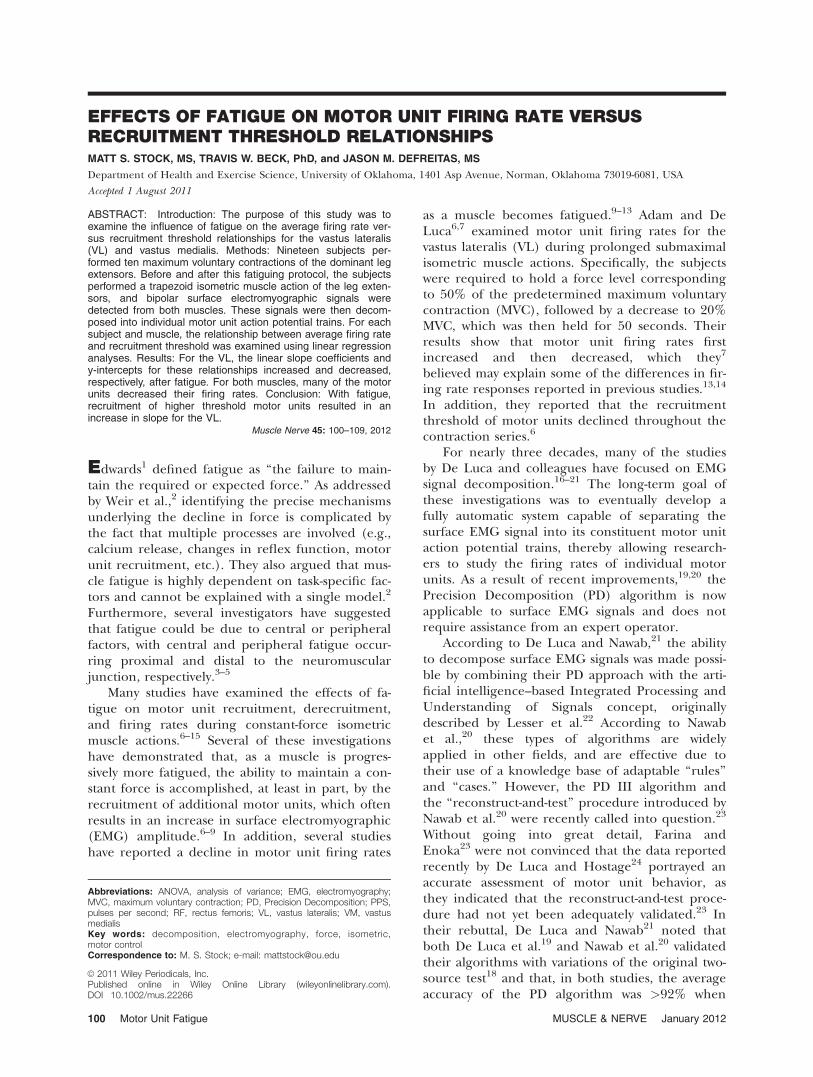
Prior to detecting any EMG signals, the skinover both muscles was shaved and cleansed withrubbing alcohol. The surface EMG sensors werethen placed over the belly of the VL and VM, andfixed with adhesive tape (Fig. 1). The referenceelectrode was placed over the patella. All analogEMG signals were low-pass (fourth-order Butter-worth, 24 dB/octave slope, 9500-HZ cut-off) andhigh-pass (second-order Butterworth, 12 dB/octaveslope, 100-HZ cut-off) filtered prior to sampling ata rate of 20,000 samples/s. The digitized EMG sig-nals were then digitally band-pass filtered with aneighth-order Butterworth filter (24 dB/octave onboth the high- and low-pass slopes, cut-off frequen-cies of 250 and 2000 HZ). The four separate fil-tered EMG signals from each muscle then served
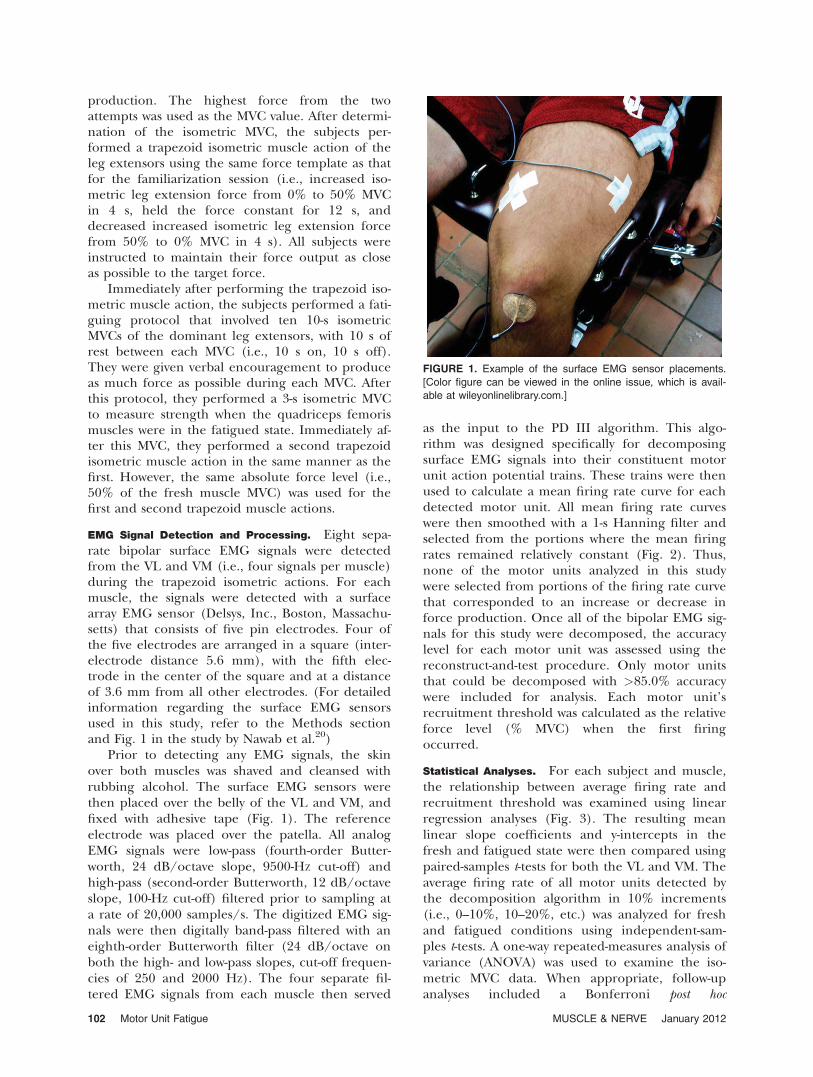
as the input to the PD III algorithm. This algo-rithm was designed specifically for decomposingsurface EMG signals into their constituent motorunit action potential trains. These trains were thenused to calculate a mean firing rate curve for eachdetected motor unit. All mean firing rate curveswere then smoothed with a 1-s Hanning filter andselected from the portions where the mean firingrates remained relatively constant (Fig. 2). Thus,none of the motor units analyzed in this studywere selected from portions of the firing rate curvethat corresponded to an increase or decrease inforce production. Once all of the bipolar EMG sig-nals for this study were decomposed, the accuracylevel for each motor unit was assessed using thereconstruct-and-test procedure. Only motor unitsthat could be decomposed with >85.0% accuracywere included for analysis. Each motor unit’srecruitment threshold was calculated as the relativeforce level (% MVC) when the first firingoccurred.
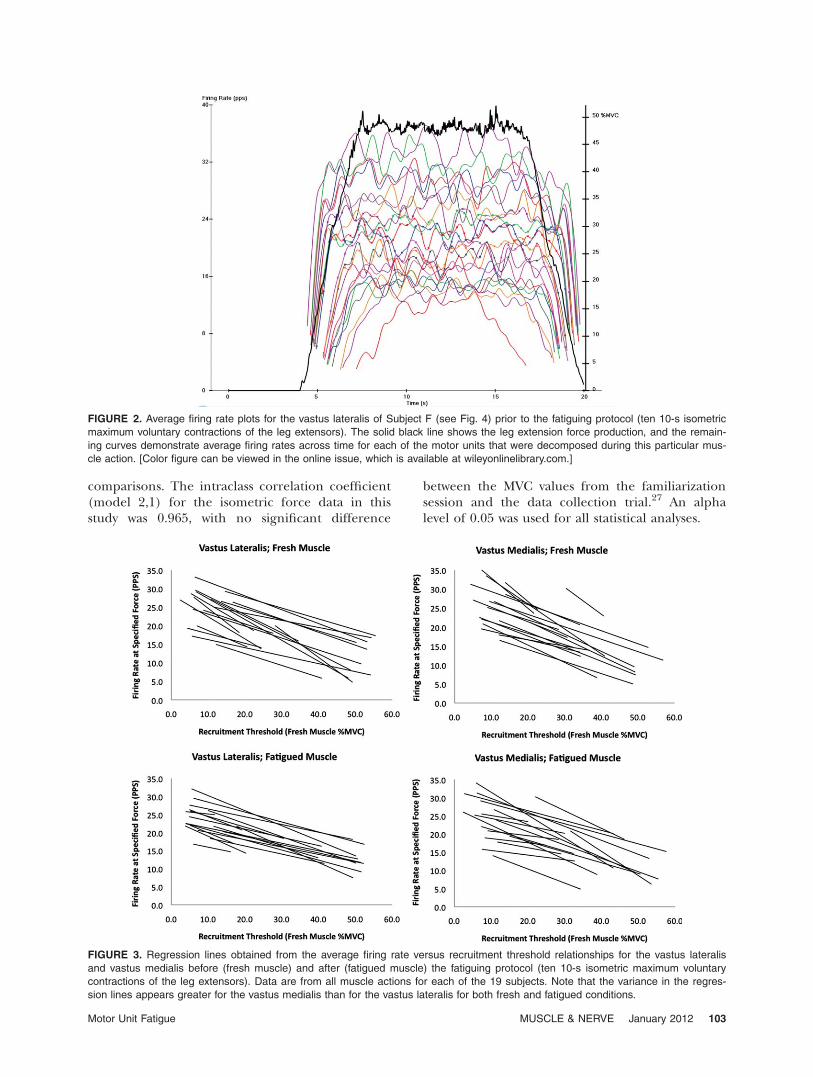
Statistical Analyses. For each subject and muscle,the relationship between average firing rate andrecruitment threshold was examined using linearregression analyses (Fig. 3). The resulting meanlinear slope coefficients and y-intercepts in thefresh and fatigued state were then compared usingpaired-samples t-tests for both the VL and VM. Theaverage firing rate of all motor units detected bythe decomposition algorithm in 10% increments(i.e., 0–10%, 10–20%, etc.) was analyzed for freshand fatigued conditions using independent-sam-ples t-tests. A one-way repeated-measures analysis ofvariance (ANOVA) was used to examine the iso-metric MVC data. When appropriate, follow-upanalyses included a Bonferroni post hoc
FIGURE 1. Example of the surface EMG sensor placements.
[Color figure can be viewed in the online issue, which is avail-
able at wileyonlinelibrary.com.]
102 Motor Unit Fatigue MUSCLE & NERVE January 2012
comparisons. The intraclass correlation coefficient(model 2,1) for the isometric force data in thisstudy was 0.965, with no significant difference
between the MVC values from the familiarizationsession and the data collection trial.27 An alphalevel of 0.05 was used for all statistical analyses.
FIGURE 2. Average firing rate plots for the vastus lateralis of Subject F (see Fig. 4) prior to the fatiguing protocol (ten 10-s isometric
maximum voluntary contractions of the leg extensors). The solid black line shows the leg extension force production, and the remain-
ing curves demonstrate average firing rates across time for each of the motor units that were decomposed during this particular mus-
cle action. [Color figure can be viewed in the online issue, which is available at wileyonlinelibrary.com.]
FIGURE 3. Regression lines obtained from the average firing rate versus recruitment threshold relationships for the vastus lateralis
and vastus medialis before (fresh muscle) and after (fatigued muscle) the fatiguing protocol (ten 10-s isometric maximum voluntary
contractions of the leg extensors). Data are from all muscle actions for each of the 19 subjects. Note that the variance in the regres-
sion lines appears greater for the vastus medialis than for the vastus lateralis for both fresh and fatigued conditions.
Motor Unit Fatigue MUSCLE & NERVE January 2012 103

RESULTS
As displayed in Tables 1 and 2 for the VL and VM,the mean 6 SD number of motor units detectedby the PD III algorithm prior to the fatiguing pro-tocol was 25.5 6 4.6 and 23.7 6 7.3, respectively.When examined after the fatiguing protocol, the
mean 6 SD number of motor units detected was26.5 6 4.6 for the VL and 24.6 6 7.1 for the VM.Tables 1 and 2 also show individual subject resultsfor the linear slope coefficients and y-intercepts forthe relationships between average firing rate andrecruitment thresholds for fresh and fatigued
Table 1. Number of motor units detected by the decomposition algorithm from the vastus lateralis for each subject as well as the linearslope coefficients (PPS/% MVC) and y-intercepts (PPS) for the relationship between average firing rate and recruitment threshold for fresh
versus fatigued muscle.
Vastus lateralis fresh muscle Vastus lateralis fatigued muscle
Subject Motor units Slope coefficient y-int. Motor units Slope coefficient y-int.
A 20 –0.490 32.8 21 –0.223 20.7B 22 –0.348 32.2 22 –0.453 29.8C 30 –0.217 18.0 30 –0.210 23.4D 26 –0.592 28.4 27 –0.299 27.5E 26 –0.772 32.4 17 –0.106 26.2F 23 –0.563 32.9 28 –0.363 29.8G 32 –0.382 34.0 27 –0.404 33.7H 29 –0.192 27.2 31 –0.227 25.5I 19 –0.417 22.8 21 –0.209 18.1J 28 –0.725 40.5 29 –0.280 23.6K 22 –0.328 27.0 22 –0.426 24.2L 16 –0.584 31.8 23 –0.393 28.3M 26 –0.504 32.6 27 –0.417 34.4N 29 –0.373 35.5 30 –0.275 31.2O 28 –0.260 20.4 28 –0.457 23.6P 33 –0.322 26.3 32 –0.203 22.1Q 30 –0.292 33.5 31 –0.214 28.7R 22 –0.317 18.8 34 –0.308 25.3S 23 –0.302 30.7 23 –0.244 24.1Mean 25.5 –0.420 29.4 26.5 –0.301 26.3SD 4.6 0.165 6.0 4.6 0.102 4.3
Table 2. Number of motor units detected by the decomposition algorithm from the vastus medialis for each subject as well as the linearslope coefficients (PPS/% MVC) and y-intercepts (PPS) for the relationship between average firing rate and recruitment threshold for fresh
vs. fatigued muscle.
Vastus medialis fresh muscle Vastus medialis fatigued muscle
Subject Motor units Slope coefficient y-int. Motor units Slope coefficient y-int.
A 20 –0.393 34.0 17 –0.484 40.9B 28 –0.343 32.7 31 –0.385 33.7C 21 –0.445 24.3 28 –0.293 23.8D 37 –0.799 40.9 39 –0.271 31.9E 18 –0.371 25.0 24 –0.190 20.0F 20 –0.316 20.4 22 –0.387 18.1G 24 –0.649 52.6 21 –0.460 38.1H 17 –0.709 51.7 21 –0.205 26.3I 25 –0.227 21.2 26 –0.128 16.8J 23 –0.654 39.1 31 –0.629 37.8K 14 –0.297 27.8 15 –0.118 19.9L 9 –0.808 42.7 14 –0.167 26.8M 33 –0.455 30.6 36 –0.665 41.9N 33 –0.382 29.0 17 –0.122 22.0O 33 –0.297 24.2 21 –0.325 24.5P 24 –0.450 31.6 19 –0.455 32.5Q 28 –0.326 29.8 25 –0.276 31.1R 17 –0.164 19.2 32 –0.368 28.0S 27 –0.383 26.3 28 –0.472 27.2Mean 23.7 –0.446 31.7 24.6 –0.337 28.5SD 7.3 0.189 9.7 7.1 0.164 7.7
104 Motor Unit Fatigue MUSCLE & NERVE January 2012
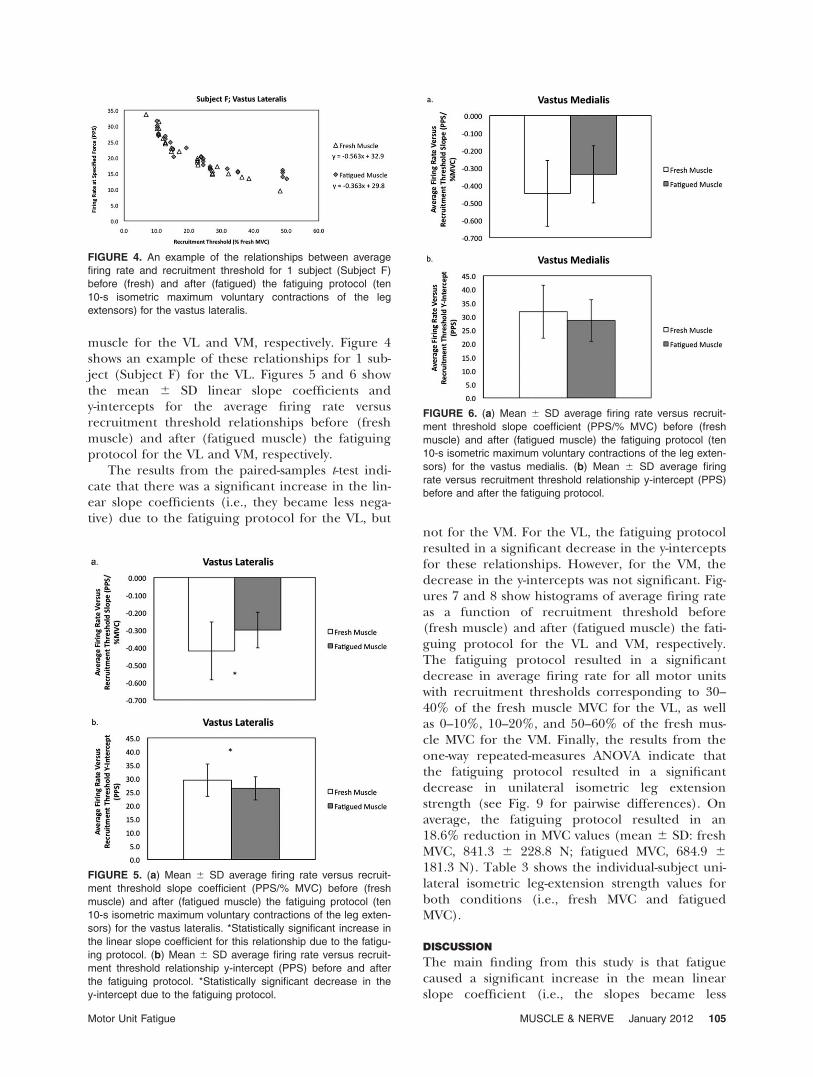
muscle for the VL and VM, respectively. Figure 4shows an example of these relationships for 1 sub-ject (Subject F) for the VL. Figures 5 and 6 showthe mean 6 SD linear slope coefficients andy-intercepts for the average firing rate versusrecruitment threshold relationships before (freshmuscle) and after (fatigued muscle) the fatiguingprotocol for the VL and VM, respectively.
The results from the paired-samples t-test indi-cate that there was a significant increase in the lin-ear slope coefficients (i.e., they became less nega-tive) due to the fatiguing protocol for the VL, but
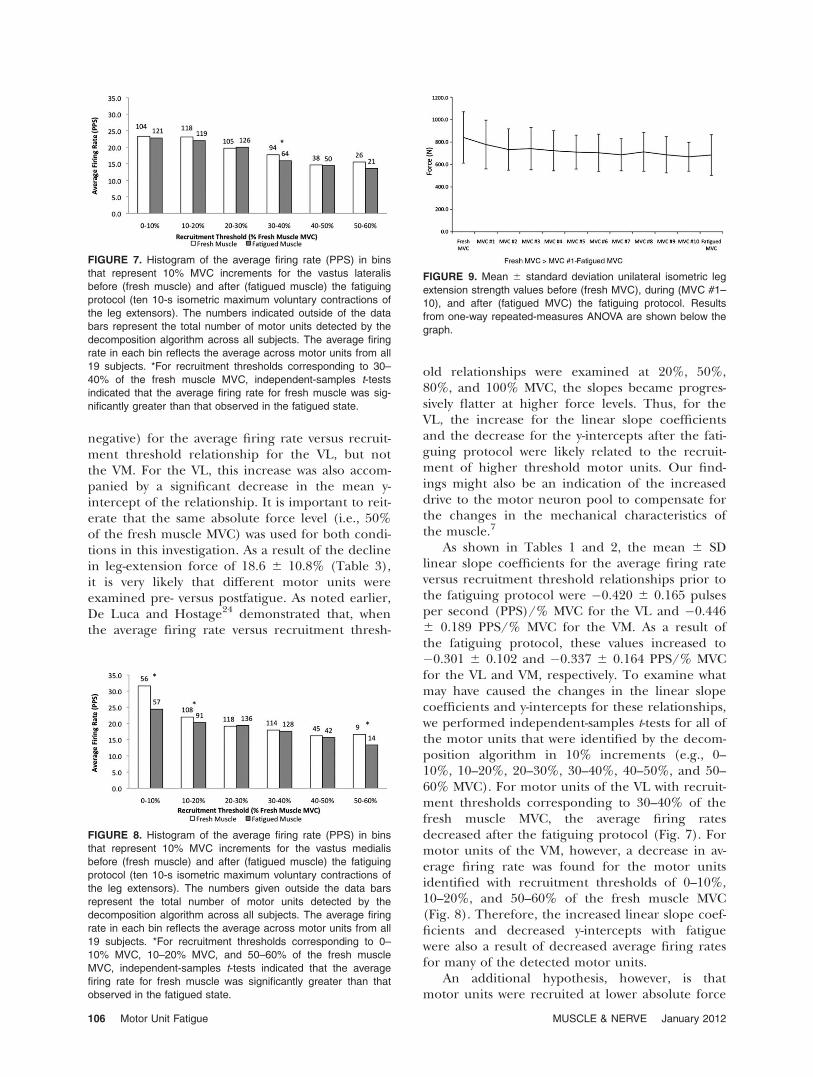
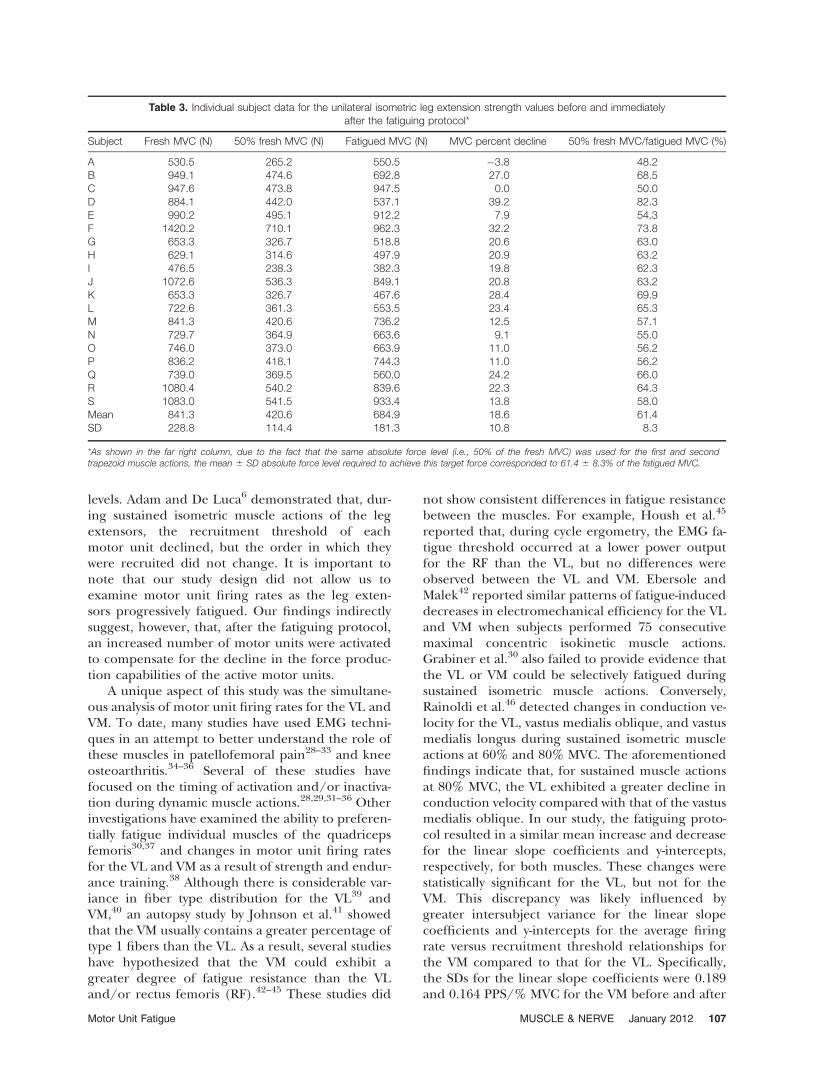
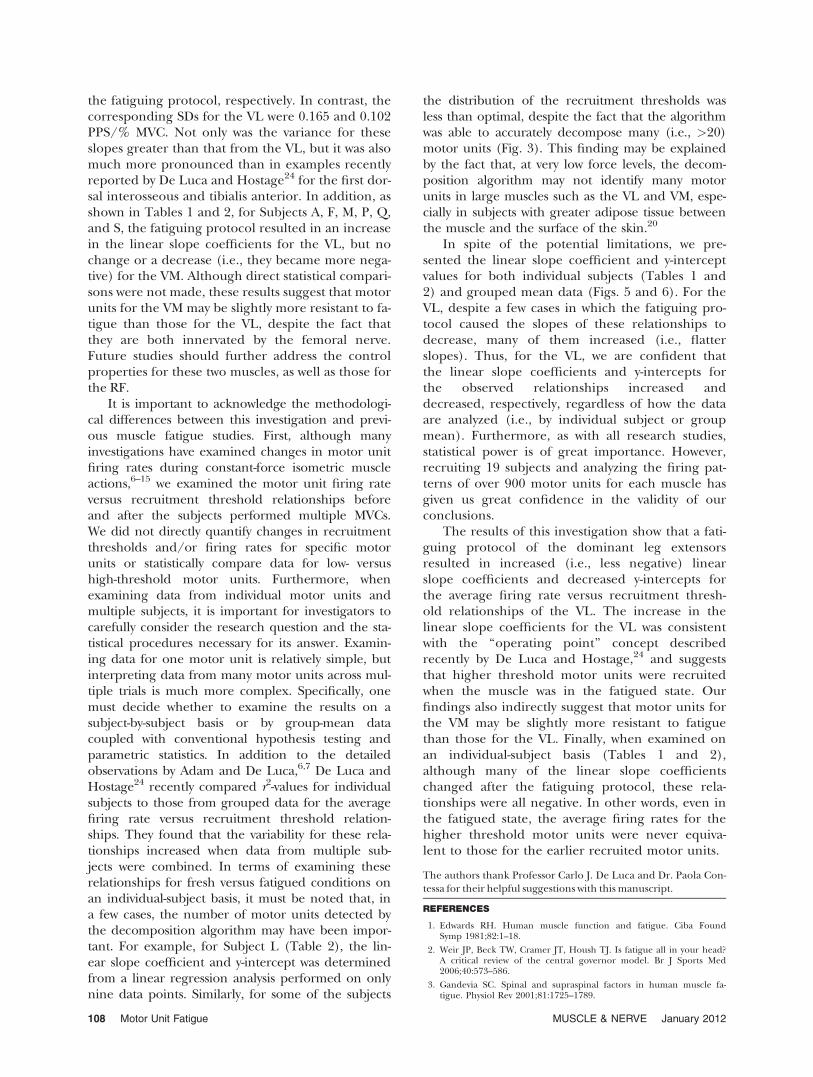
not for the VM. For the VL, the fatiguing protocolresulted in a significant decrease in the y-interceptsfor these relationships. However, for the VM, thedecrease in the y-intercepts was not significant. Fig-ures 7 and 8 show histograms of average firing rateas a function of recruitment threshold before(fresh muscle) and after (fatigued muscle) the fati-guing protocol for the VL and VM, respectively.The fatiguing protocol resulted in a significantdecrease in average firing rate for all motor unitswith recruitment thresholds corresponding to 30–40% of the fresh muscle MVC for the VL, as wellas 0–10%, 10–20%, and 50–60% of the fresh mus-cle MVC for the VM. Finally, the results from theone-way repeated-measures ANOVA indicate thatthe fatiguing protocol resulted in a significantdecrease in unilateral isometric leg extensionstrength (see Fig. 9 for pairwise differences). Onaverage, the fatiguing protocol resulted in an18.6% reduction in MVC values (mean 6 SD: freshMVC, 841.3 6 228.8 N; fatigued MVC, 684.9 6181.3 N). Table 3 shows the individual-subject uni-lateral isometric leg-extension strength values forboth conditions (i.e., fresh MVC and fatiguedMVC).
DISCUSSION
The main finding from this study is that fatiguecaused a significant increase in the mean linearslope coefficient (i.e., the slopes became less
FIGURE 4. An example of the relationships between average
firing rate and recruitment threshold for 1 subject (Subject F)
before (fresh) and after (fatigued) the fatiguing protocol (ten
10-s isometric maximum voluntary contractions of the leg
extensors) for the vastus lateralis.
FIGURE 5. (a) Mean 6 SD average firing rate versus recruit-
ment threshold slope coefficient (PPS/% MVC) before (fresh
muscle) and after (fatigued muscle) the fatiguing protocol (ten
10-s isometric maximum voluntary contractions of the leg exten-
sors) for the vastus lateralis. *Statistically significant increase in
the linear slope coefficient for this relationship due to the fatigu-
ing protocol. (b) Mean 6 SD average firing rate versus recruit-
ment threshold relationship y-intercept (PPS) before and after
the fatiguing protocol. *Statistically significant decrease in the
y-intercept due to the fatiguing protocol.
FIGURE 6. (a) Mean 6 SD average firing rate versus recruit-
ment threshold slope coefficient (PPS/% MVC) before (fresh
muscle) and after (fatigued muscle) the fatiguing protocol (ten
10-s isometric maximum voluntary contractions of the leg exten-
sors) for the vastus medialis. (b) Mean 6 SD average firing
rate versus recruitment threshold relationship y-intercept (PPS)
before and after the fatiguing protocol.
Motor Unit Fatigue MUSCLE & NERVE January 2012 105
negative) for the average firing rate versus recruit-ment threshold relationship for the VL, but notthe VM. For the VL, this increase was also accom-panied by a significant decrease in the mean y-intercept of the relationship. It is important to reit-erate that the same absolute force level (i.e., 50%of the fresh muscle MVC) was used for both condi-tions in this investigation. As a result of the declinein leg-extension force of 18.6 6 10.8% (Table 3),it is very likely that different motor units wereexamined pre- versus postfatigue. As noted earlier,De Luca and Hostage24 demonstrated that, whenthe average firing rate versus recruitment thresh-
old relationships were examined at 20%, 50%,80%, and 100% MVC, the slopes became progres-sively flatter at higher force levels. Thus, for theVL, the increase for the linear slope coefficientsand the decrease for the y-intercepts after the fati-guing protocol were likely related to the recruit-ment of higher threshold motor units. Our find-ings might also be an indication of the increaseddrive to the motor neuron pool to compensate forthe changes in the mechanical characteristics ofthe muscle.7
As shown in Tables 1 and 2, the mean 6 SDlinear slope coefficients for the average firing rateversus recruitment threshold relationships prior tothe fatiguing protocol were �0.420 6 0.165 pulsesper second (PPS)/% MVC for the VL and �0.4466 0.189 PPS/% MVC for the VM. As a result ofthe fatiguing protocol, these values increased to�0.301 6 0.102 and �0.337 6 0.164 PPS/% MVCfor the VL and VM, respectively. To examine whatmay have caused the changes in the linear slopecoefficients and y-intercepts for these relationships,we performed independent-samples t-tests for all ofthe motor units that were identified by the decom-position algorithm in 10% increments (e.g., 0–10%, 10–20%, 20–30%, 30–40%, 40–50%, and 50–60% MVC). For motor units of the VL with recruit-ment thresholds corresponding to 30–40% of thefresh muscle MVC, the average firing ratesdecreased after the fatiguing protocol (Fig. 7). Formotor units of the VM, however, a decrease in av-erage firing rate was found for the motor unitsidentified with recruitment thresholds of 0–10%,10–20%, and 50–60% of the fresh muscle MVC(Fig. 8). Therefore, the increased linear slope coef-ficients and decreased y-intercepts with fatiguewere also a result of decreased average firing ratesfor many of the detected motor units.
An additional hypothesis, however, is thatmotor units were recruited at lower absolute force
FIGURE 7. Histogram of the average firing rate (PPS) in bins
that represent 10% MVC increments for the vastus lateralis
before (fresh muscle) and after (fatigued muscle) the fatiguing
protocol (ten 10-s isometric maximum voluntary contractions of
the leg extensors). The numbers indicated outside of the data
bars represent the total number of motor units detected by the
decomposition algorithm across all subjects. The average firing
rate in each bin reflects the average across motor units from all
19 subjects. *For recruitment thresholds corresponding to 30–
40% of the fresh muscle MVC, independent-samples t-tests
indicated that the average firing rate for fresh muscle was sig-
nificantly greater than that observed in the fatigued state.
FIGURE 8. Histogram of the average firing rate (PPS) in bins
that represent 10% MVC increments for the vastus medialis
before (fresh muscle) and after (fatigued muscle) the fatiguing
protocol (ten 10-s isometric maximum voluntary contractions of
the leg extensors). The numbers given outside the data bars
represent the total number of motor units detected by the
decomposition algorithm across all subjects. The average firing
rate in each bin reflects the average across motor units from all
19 subjects. *For recruitment thresholds corresponding to 0–
10% MVC, 10–20% MVC, and 50–60% of the fresh muscle
MVC, independent-samples t-tests indicated that the average
firing rate for fresh muscle was significantly greater than that
observed in the fatigued state.
FIGURE 9. Mean 6 standard deviation unilateral isometric leg
extension strength values before (fresh MVC), during (MVC #1–
10), and after (fatigued MVC) the fatiguing protocol. Results
from one-way repeated-measures ANOVA are shown below the
graph.
106 Motor Unit Fatigue MUSCLE & NERVE January 2012
levels. Adam and De Luca6 demonstrated that, dur-ing sustained isometric muscle actions of the legextensors, the recruitment threshold of eachmotor unit declined, but the order in which theywere recruited did not change. It is important tonote that our study design did not allow us toexamine motor unit firing rates as the leg exten-sors progressively fatigued. Our findings indirectlysuggest, however, that, after the fatiguing protocol,an increased number of motor units were activatedto compensate for the decline in the force produc-tion capabilities of the active motor units.
A unique aspect of this study was the simultane-ous analysis of motor unit firing rates for the VL andVM. To date, many studies have used EMG techni-ques in an attempt to better understand the role ofthese muscles in patellofemoral pain28–33 and kneeosteoarthritis.34–36 Several of these studies havefocused on the timing of activation and/or inactiva-tion during dynamic muscle actions.28,29,31–36 Otherinvestigations have examined the ability to preferen-tially fatigue individual muscles of the quadricepsfemoris30,37 and changes in motor unit firing ratesfor the VL and VM as a result of strength and endur-ance training.38 Although there is considerable var-iance in fiber type distribution for the VL39 andVM,40 an autopsy study by Johnson et al.41 showedthat the VM usually contains a greater percentage oftype 1 fibers than the VL. As a result, several studieshave hypothesized that the VM could exhibit agreater degree of fatigue resistance than the VLand/or rectus femoris (RF).42–45 These studies did
not show consistent differences in fatigue resistancebetween the muscles. For example, Housh et al.45
reported that, during cycle ergometry, the EMG fa-tigue threshold occurred at a lower power outputfor the RF than the VL, but no differences wereobserved between the VL and VM. Ebersole andMalek42 reported similar patterns of fatigue-induceddecreases in electromechanical efficiency for the VLand VM when subjects performed 75 consecutivemaximal concentric isokinetic muscle actions.Grabiner et al.30 also failed to provide evidence thatthe VL or VM could be selectively fatigued duringsustained isometric muscle actions. Conversely,Rainoldi et al.46 detected changes in conduction ve-locity for the VL, vastus medialis oblique, and vastusmedialis longus during sustained isometric muscleactions at 60% and 80% MVC. The aforementionedfindings indicate that, for sustained muscle actionsat 80% MVC, the VL exhibited a greater decline inconduction velocity compared with that of the vastusmedialis oblique. In our study, the fatiguing proto-col resulted in a similar mean increase and decreasefor the linear slope coefficients and y-intercepts,respectively, for both muscles. These changes werestatistically significant for the VL, but not for theVM. This discrepancy was likely influenced bygreater intersubject variance for the linear slopecoefficients and y-intercepts for the average firingrate versus recruitment threshold relationships forthe VM compared to that for the VL. Specifically,the SDs for the linear slope coefficients were 0.189and 0.164 PPS/% MVC for the VM before and after
Table 3. Individual subject data for the unilateral isometric leg extension strength values before and immediatelyafter the fatiguing protocol*
Subject Fresh MVC (N) 50% fresh MVC (N) Fatigued MVC (N) MVC percent decline 50% fresh MVC/fatigued MVC (%)
A 530.5 265.2 550.5 �3.8 48.2B 949.1 474.6 692.8 27.0 68.5C 947.6 473.8 947.5 0.0 50.0D 884.1 442.0 537.1 39.2 82.3E 990.2 495.1 912.2 7.9 54.3F 1420.2 710.1 962.3 32.2 73.8G 653.3 326.7 518.8 20.6 63.0H 629.1 314.6 497.9 20.9 63.2I 476.5 238.3 382.3 19.8 62.3J 1072.6 536.3 849.1 20.8 63.2K 653.3 326.7 467.6 28.4 69.9L 722.6 361.3 553.5 23.4 65.3M 841.3 420.6 736.2 12.5 57.1N 729.7 364.9 663.6 9.1 55.0O 746.0 373.0 663.9 11.0 56.2P 836.2 418.1 744.3 11.0 56.2Q 739.0 369.5 560.0 24.2 66.0R 1080.4 540.2 839.6 22.3 64.3S 1083.0 541.5 933.4 13.8 58.0Mean 841.3 420.6 684.9 18.6 61.4SD 228.8 114.4 181.3 10.8 8.3
*As shown in the far right column, due to the fact that the same absolute force level (i.e., 50% of the fresh MVC) was used for the first and secondtrapezoid muscle actions, the mean 6 SD absolute force level required to achieve this target force corresponded to 61.4 6 8.3% of the fatigued MVC.
Motor Unit Fatigue MUSCLE & NERVE January 2012 107
the fatiguing protocol, respectively. In contrast, thecorresponding SDs for the VL were 0.165 and 0.102PPS/% MVC. Not only was the variance for theseslopes greater than that from the VL, but it was alsomuch more pronounced than in examples recentlyreported by De Luca and Hostage24 for the first dor-sal interosseous and tibialis anterior. In addition, asshown in Tables 1 and 2, for Subjects A, F, M, P, Q,and S, the fatiguing protocol resulted in an increasein the linear slope coefficients for the VL, but nochange or a decrease (i.e., they became more nega-tive) for the VM. Although direct statistical compari-sons were not made, these results suggest that motorunits for the VM may be slightly more resistant to fa-tigue than those for the VL, despite the fact thatthey are both innervated by the femoral nerve.Future studies should further address the controlproperties for these two muscles, as well as those forthe RF.
It is important to acknowledge the methodologi-cal differences between this investigation and previ-ous muscle fatigue studies. First, although manyinvestigations have examined changes in motor unitfiring rates during constant-force isometric muscleactions,6–15 we examined the motor unit firing rateversus recruitment threshold relationships beforeand after the subjects performed multiple MVCs.We did not directly quantify changes in recruitmentthresholds and/or firing rates for specific motorunits or statistically compare data for low- versushigh-threshold motor units. Furthermore, whenexamining data from individual motor units andmultiple subjects, it is important for investigators tocarefully consider the research question and the sta-tistical procedures necessary for its answer. Examin-ing data for one motor unit is relatively simple, butinterpreting data from many motor units across mul-tiple trials is much more complex. Specifically, onemust decide whether to examine the results on asubject-by-subject basis or by group-mean datacoupled with conventional hypothesis testing andparametric statistics. In addition to the detailedobservations by Adam and De Luca,6,7 De Luca andHostage24 recently compared r2-values for individualsubjects to those from grouped data for the averagefiring rate versus recruitment threshold relation-ships. They found that the variability for these rela-tionships increased when data from multiple sub-jects were combined. In terms of examining theserelationships for fresh versus fatigued conditions onan individual-subject basis, it must be noted that, ina few cases, the number of motor units detected bythe decomposition algorithm may have been impor-tant. For example, for Subject L (Table 2), the lin-ear slope coefficient and y-intercept was determinedfrom a linear regression analysis performed on onlynine data points. Similarly, for some of the subjects
the distribution of the recruitment thresholds wasless than optimal, despite the fact that the algorithmwas able to accurately decompose many (i.e., >20)motor units (Fig. 3). This finding may be explainedby the fact that, at very low force levels, the decom-position algorithm may not identify many motorunits in large muscles such as the VL and VM, espe-cially in subjects with greater adipose tissue betweenthe muscle and the surface of the skin.20
In spite of the potential limitations, we pre-sented the linear slope coefficient and y-interceptvalues for both individual subjects (Tables 1 and2) and grouped mean data (Figs. 5 and 6). For theVL, despite a few cases in which the fatiguing pro-tocol caused the slopes of these relationships todecrease, many of them increased (i.e., flatterslopes). Thus, for the VL, we are confident thatthe linear slope coefficients and y-intercepts forthe observed relationships increased anddecreased, respectively, regardless of how the dataare analyzed (i.e., by individual subject or groupmean). Furthermore, as with all research studies,statistical power is of great importance. However,recruiting 19 subjects and analyzing the firing pat-terns of over 900 motor units for each muscle hasgiven us great confidence in the validity of ourconclusions.
The results of this investigation show that a fati-guing protocol of the dominant leg extensorsresulted in increased (i.e., less negative) linearslope coefficients and decreased y-intercepts forthe average firing rate versus recruitment thresh-old relationships of the VL. The increase in thelinear slope coefficients for the VL was consistentwith the ‘‘operating point’’ concept describedrecently by De Luca and Hostage,24 and suggeststhat higher threshold motor units were recruitedwhen the muscle was in the fatigued state. Ourfindings also indirectly suggest that motor units forthe VM may be slightly more resistant to fatiguethan those for the VL. Finally, when examined onan individual-subject basis (Tables 1 and 2),although many of the linear slope coefficientschanged after the fatiguing protocol, these rela-tionships were all negative. In other words, even inthe fatigued state, the average firing rates for thehigher threshold motor units were never equiva-lent to those for the earlier recruited motor units.
The authors thank Professor Carlo J. De Luca and Dr. Paola Con-tessa for their helpful suggestions with this manuscript.
REFERENCES
1. Edwards RH. Human muscle function and fatigue. Ciba FoundSymp 1981;82:1–18.
2. Weir JP, Beck TW, Cramer JT, Housh TJ. Is fatigue all in your head?A critical review of the central governor model. Br J Sports Med2006;40:573–586.
3. Gandevia SC. Spinal and supraspinal factors in human muscle fa-tigue. Physiol Rev 2001;81:1725–1789.
108 Motor Unit Fatigue MUSCLE & NERVE January 2012

4. Gandevia SC, Allen GM, Butler JE, Taylor JL. Supraspinal factors inhuman muscle fatigue: evidence for suboptimal output from themotor cortex. J Physiol 1996;490:529–536.
5. Taylor JL, Butler JE, Allen GM, Gandevia SC. Changes in motor cort-ical excitability during human muscle fatigue. J Physiol 1996;490:519–528.
6. Adam A, De Luca CJ. Recruitment order of motor units in humanvastus lateralis muscle is maintained during fatiguing contractions. JNeurophysiol 2003;90:2919–2927.
7. Adam A, De Luca CJ. Firing rates of motor units in human vastus lat-eralis muscle during fatiguing isometric contractions. J Appl Physiol2005;99:268–280.
8. Basmajian JV, De Luca CJ. Muscles alive, 5th ed. Baltimore: Williamsand Wilkins; 1985.
9. Carpentier A, Duchateau J, Hainaut K. Motor unit behaviour andcontractile changes during fatigue in the human first dorsal interos-seous. J Physiol 2001;534:903–912.
10. Bigland-Ritchie B, Johansson R, Lippold OC, Smith S, Woods JJ.Changes in motoneurone firing rates during sustained maximal vol-untary contractions. J Physiol 1983;340:335–346.
11. Bigland-Ritchie B, Woods JJ. Changes in muscle contractile proper-ties and neural control during human muscular fatigue. MuscleNerve 1984;7:691–699.
12. Christova P, Kossev A. Motor unit activity during long-lasting inter-mittent muscle contractions in humans. Eur J Appl Physiol 1998;77:379–387.
13. Garland SJ, Enoka RM, Serrano LP, Robinson GA. Behavior ofmotor units in human biceps brachii during a submaximal fatiguingcontraction. J Appl Physiol 1994;76:2411–2419.
14. Dorfman LJ, Howard JE, McGill KC. Triphasic behavioral responseof motor units to submaximal fatiguing exercise. Muscle Nerve 1990;13:621–628.
15. Farina D, Holobar A, Gazzoni M, Zazula D, Merletti R, Enoka RM.Adjustments differ among low-threshold motor units during intermit-tent, isometric contractions. J Neurophysiol 2009;101:350–359.
16. LeFever RS, De Luca CJ. A procedure for decomposing the myoelectricsignal into its constituent action potentials: part I—technique, theoryand implementation. IEEE Trans Biomed Eng 1982;29:149–157.
17. LeFever RS, Xenakis AP, De Luca CJ. A procedure for decomposingthe myoelectric signal into its constituent action potentials: part II—execution and test for accuracy. IEEE Trans Biomed Eng 1982;29:158–164.
18. Mambrito B, De Luca CJ. A technique for the detection, decomposi-tion and analysis of the EMG signal. Electroencephalogr Clin Neuro-physiol 1984;58:175–188.
19. De Luca CJ, Adam A, Wotiz R, Gilmore LD, Nawab SH. Decomposi-tion of surface EMG signals. J Neurophysiol 2006;96:1646–1657.
20. Nawab SH, Chang SS, De Luca CJ. High-yield decomposition of sur-face EMG signals. Clin Neurophysiol 2010;121:1602–1615.
21. De Luca CJ, Nawab SH. Reply to Farina and Enoka: The reconstruct-and-test approach is the most appropriate validation for surface EMGsignal decomposition to date. J Neurophysiol 2011;105:983–984.
22. Lesser V, Nawab SH, Klassner F. IPUS: an architecture for the integratedprocessing and understanding of signals. Artif Intell 1995;77:129–171.
23. Farina D, Enoka RM. Surface EMG decomposition requires anappropriate validation. J Neurophysiol 2011;105:981–982.
24. De Luca CJ, Hostage EC. Relationship between firing rate andrecruitment threshold of motoneurons in voluntary isometric con-tractions. J Neurophysiol 2010;104:1034–1046.
25. De Luca CJ, LeFever RS, McCue MP, Xenakis AP. Control schemegoverning concurrently active human motor units during voluntarycontractions. J Physiol 1982;329:129–142.
26. De Luca CJ, Erim Z. Common drive of motor units in regulation ofmuscle force. Trends Neurosci 1994;17:299–305.
27. Weir JP. Quantifying test–retest reliability using the intraclass correla-tion coefficient and the SEM. J Strength Cond Res 2005;19:231–240.
28. Cowan SM, Bennell KL, Crossley KM, Hodges PW, McConnell J.Physical therapy alters recruitment of the vasti in patellofemoralpain syndrome. Med Sci Sports Exerc 2002;34:1879–1885.
29. Cowan SM, Bennell KL, Hodges PW. Therapeutic patellar tapingchanges the timing of vasti muscle activation in people with patello-femoral pain syndrome. Clin J Sport Med 2002;12:339–347.
30. Grabiner MD, Koh TJ, Miller GF. Fatigue rates of vastus medialisoblique and vastus lateralis during static and dynamic knee exten-sion. J Orthop Res 1991;9:391–397.
31. Karst GM, Willett GM. Onset timing of electromyographic activity inthe vastus medialis oblique and vastus lateralis muscles in subjectswith and without patellofemoral pain syndrome. Phys Ther 1995;75:813–823.
32. Karst GM, Willett GM. Reflex response times of vastus medialisoblique and vastus lateralis in normal subjects and in subjects withpatellofemoral pain. J Orthop Sports Phys Ther 1997;26:108–110.
33. van Tiggelen D, Cowan S, Coorevits P, Duvigneaud N, Witvrouw E.Delayed vastus medialis obliquus to vastus lateralis onset timing con-tributes to the development of patellofemoral pain in previouslyhealthy men: a prospective study. Am J Sports Med 2009;37:1099–1105.
34. Hinman RS, Bennell KL, Metcalf BR, Crossley KM. Temporal activityof vastus medialis obliquus and vastus lateralis in symptomatic kneeosteoarthritis. Am J Phys Med Rehabil 2002;81:684–690.
35. Hinman RS, Bennell KL, Metcalf BR, Crossley KM. Delayed onset ofquadriceps activity and altered knee joint kinematics during stairstepping in individuals with knee osteoarthritis. Arch Phys MedRehabil 2002;83:1080–1086.
36. Hinman RS, Cowan SM, Crossley KM, Bennell KL. Age-relatedchanges in electromyographic quadriceps activity during stairdescent. J Orthop Res 2005;23:322–326.
37. Akima H, Foley JM, Prior BM, Dudley GA, Meyer RA. Vastus lateralisfatigue alters recruitment of musculus quadriceps femoris inhumans. J Appl Physiol 2002;92:679–684.
38. Vila-Cha C, Falla D, Farina D. Motor unit behavior during submaxi-mal contractions following six weeks of an endurance and a strengthtraining program. J Appl Physiol 2010;109:1455–1466.
39. Staron RS, Hagerman FC, Hikida RS, Murray TF, Hostler DP, CrillMT, et al. Fiber type composition of the vastus lateralis muscle ofyoung men and women. J Histochem Cytochem 2000;48:623–629.
40. Travnik L, Pernus F, Erzen I. Histochemical and morphometric char-acteristics of the normal human vastus medialis longus and vastusmedialis obliquus muscles. J Anat 1995;187:403–411.
41. Johnson MA, Polgar J, Weightman D, Appleton D. Data on the distri-bution of fibre types in thirty-six human muscles. An autopsy study. JNeurol Sci 1973;18:111–129.
42. Ebersole KT, Malek DM. Fatigue and the electromechanical effi-ciency of the vastus medialis and vastus lateralis muscles. J Athl Train2008;43:152–156.
43. Ebersole KT, Sabin MJ, Haggard HA. Patellofemoral pain and themechanomyographic responses of the vastus lateralis and vastusmedialis muscles. Electromyogr Clin Neurophysiol 2009;49:9–17.
44. Housh TJ, deVries HA, Johnson GO, Evans SA, Housh DJ, Stout JR,et al. Neuromuscular fatigue thresholds of the vastus lateralis, vastusmedialis and rectus femoris muscles. Electromyogr Clin Neurophy-siol 1996;36:247–255.
45. Housh TJ, deVries HA, Johnson GO, Housh DJ, Evans SA, Stout JR,et al. Electromyographic fatigue thresholds of the superficial musclesof the quadriceps femoris. Eur J Appl Physiol Occup Physiol 1995;71:131–136.
46. Rainoldi A, Falla D, Mellor R, Bennell K, Hodges P. Myoelectricmanifestations of fatigue in vastus lateralis, medialis obliquus andmedialis longus muscles. J Electromyogr Kinesiol 2008;18:1032–1037.
Motor Unit Fatigue MUSCLE & NERVE January 2012 109