Effects of Distributed Generation on Power Loss, Loadability and Stability
6
Effects of Distributed Generation on Power Loss, Loadability and Sta bility Xi Chen Center for Energy Systems Research Departme nt of Electric al and Computer E ngineeri ng Tennessee Tech University xchen2 [email protected] Wenzhong Gao Center for Energy Systems Research Department of Electr ical and Computer E ngineerin g Tennessee Tech University [email protected] Abstract Distributed Gen eration (DG) can provide solution s to many energy supply system problems. While DG is demonstrating its benefits to the power system, the extent varies with different placement strategies. In this paper, a static model for Proton Exchange Membrane Fuel Cell (PEMFC) DG system model in powerflow analysis is proposed. The overall effects of adding DG to the modified IEEE 14 bus test case are studied. Differ ent DG placements are compar ed in terms of power loss, loadability and voltage stability index. The Fast Voltage Stability Index (FVSI) and Line Stability Factor (LQP) for voltage stability contingency analysis are compared. 1.Introduction Distributed energy systems can provide solution to many power system problems. Distributed Generation (DG) has proven to effectively improve power system stability, power quality, energy efficiency, and help environmental protectio n. As Distributed Generation has shown its benefits in the practical world as well as its great promise in the future, we are becoming increasingly interested in where and how we shall locate the Distributed Generation, how much improvement could be expected, etc. In this paper, we focus on Proton Exchange Membrane Fuel Cell (PEMFC). One challenge is how to model PEMFC for powerflow studies. Many models and control strategies have been developed [1]-[3]. A powerf low model which conside rs the PEMFC DG to be a PV bus with a lower reactive power limit of zero has also been proposed [4]. While DG has sh own its contributions to an improved power quality, the extent of effects varies depending on the placement of a DG in the network. Different design strategies for Distributed Generation in modified IEEE 14 bus test case [5] (The shunt susceptance connected to bus 9 is eliminated. The load on all the buses is increased by 150% to stress the system.), are studied and compared in terms of power loss reduction, loadability, and voltage stability indexThe financial cost and availability of PEMFC DG installation, however, are not considered in this paper. 2.PEMFC DG System Model The equivalent circuit of grid-connected fuel cell system as shown in Figure 1 is composed of a fuel cell, a power co ndition unit (PCU) an d a transfo rmer. The PCU is composed of a DC/AC inverter, a voltage controller and a power controller. m is the modulation index of the PCU. ψ is the firing angle. The system output voltage magnitude could be controlled by m: pu dc pu pu f V m V . . = ( 1 ) The DG system output active power P could be controlled by firing angle ψ through out put voltage angel δ: − ⋅ = ⋅ = T T f T f X E X V E Q X V E P 2 cos sin δ δ ( 2 ) ⋅ + = − ψ δ tan / tan 2 1 ref f S ref P X V P ( 3 ) Therefore, the fuel cell system could be modeled as a PV bus in a power system, where the output active power P and terminal voltage magnitude V are controlled to be a constant value. 3. Approaches Applied in DG System Study 3.1. Power Loss Analysis In this paper, the power loss on the transmission line is calculated by solving powerflow using the full Newton-R aphson’s met hod [6]. FC R DC U m ψ I T X δ ∠ f V 0 ∠ E jQ P + Figure 1 Equivalent circuit of a PEMFC DG system connected to the power grid. 978-1-4244-1884-8/08/$25.00 ©2008 IEEE 468
-
Upload
raul-gordillo-bolanos -
Category
Documents
-
view
217 -
download
0
Transcript of Effects of Distributed Generation on Power Loss, Loadability and Stability

7/25/2019 Effects of Distributed Generation on Power Loss, Loadability and Stability
http://slidepdf.com/reader/full/effects-of-distributed-generation-on-power-loss-loadability-and-stability 1/6
Effects of Distributed Generation on Power Loss, Loadability and Stability
Xi Chen
Center for Energy Systems Research Department of Electrical and Computer Engineering
Tennessee Tech University
Wenzhong Gao
Center for Energy Systems Research Department of Electrical and Computer Engineering
Tennessee Tech University
Abstract
Distributed Generation (DG) can provide solutions tomany energy supply system problems. While DG isdemonstrating its benefits to the power system, the
extent varies with different placement strategies. In this paper, a static model for Proton Exchange
Membrane Fuel Cell (PEMFC) DG system model in
powerflow analysis is proposed. The overall effects ofadding DG to the modified IEEE 14 bus test case are
studied. Different DG placements are compared in termsof power loss, loadability and voltage stability index.The Fast Voltage Stability Index (FVSI) and Line
Stability Factor (LQP) for voltage stability contingencyanalysis are compared.
1.Introduction
Distributed energy systems can provide solution tomany power system problems. Distributed Generation
(DG) has proven to effectively improve power systemstability, power quality, energy efficiency, and help
environmental protection.As Distributed Generation has shown its benefits in
the practical world as well as its great promise in thefuture, we are becoming increasingly interested in where
and how we shall locate the Distributed Generation, how
much improvement could be expected, etc.In this paper, we focus on Proton Exchange
Membrane Fuel Cell (PEMFC). One challenge is how tomodel PEMFC for powerflow studies. Many models and
control strategies have been developed [1]-[3]. A
powerflow model which considers the PEMFC DG to bea PV bus with a lower reactive power limit of zero has
also been proposed [4].While DG has shown its contributions to an improved
power quality, the extent of effects varies depending onthe placement of a DG in the network. Different design
strategies for Distributed Generation in modified IEEE14 bus test case [5] (The shunt susceptance connected to
bus 9 is eliminated. The load on all the buses is
increased by 150% to stress the system.), are studied andcompared in terms of power loss reduction, loadability,
and voltage stability indexThe financial cost andavailability of PEMFC DG installation, however, are not
considered in this paper.
2.PEMFC DG System Model
The equivalent circuit of grid-connected fuel cell
system as shown in Figure 1 is composed of a fuel cell, a power condition unit (PCU) and a transformer. The PCU
is composed of a DC/AC inverter, a voltage controllerand a power controller. m is the modulation index of the
PCU. ψ is the firing angle.The system output voltage magnitude could be
controlled by m:
pudc pu pu f V mV .. = ( 1 )
The DG system output active power P could becontrolled by firing angle ψ through out put voltage
angel δ:
−⋅
=
⋅=
T T
f
T
f
X
E
X
V E Q
X
V E P
2
cos
sin
δ
δ ( 2 )
⋅+=
−
ψ δ
tan/tan
2
1
ref f S
ref
P X V
P ( 3 )
Therefore, the fuel cell system could be modeled as aPV bus in a power system, where the output active power P and terminal voltage magnitude V are
controlled to be a constant value.
3. Approaches Applied in DG System
Study
3.1.
Power Loss Analysis
In this paper, the power loss on the transmission lineis calculated by solving powerflow using the full Newton-Raphson’s method [6].
FC R
DC U
m ψ
I
T X
δ ∠ f V 0∠ E
jQ P +
Figure 1 Equivalent circuit of a PEMFC DGsystem connected to the power grid.
978-1-4244-1884-8/08/$25.00 ©2008 IEEE 468

7/25/2019 Effects of Distributed Generation on Power Loss, Loadability and Stability
http://slidepdf.com/reader/full/effects-of-distributed-generation-on-power-loss-loadability-and-stability 2/6
The PEMFC DG is modeled as a PV bus with pre-determined output active power P and voltagemagnitude V. When the demand for generated reactive power Q exceeds the limit, the PEMFC DG is thenmodeled as a PQ bus with fixed negative real andreactive load.
3.2.
PV Curve and Maximum Allowable Active
Power
A PV curve is used to estimate the relationship between the voltage and active load at a particular bus.In drawing a PV curve, the voltage at one bus is plottedas the load varies from the base case to a loadabilitylimit. Continuation powerflow, [6] is applied to draw thePV curve.
At the loadability limit, the system Jacobian of the
powerflow equations will become singular as the slopeof the curve becomes infinite. Therefore the traditional Newton-Raphson’s method for powerflow solution willnot converge. In that case, a modified Newton-Raphson’s method is applied by introducing anadditional parameter, the “continuation parameter”. A predictor-corrector step is applied in this method.
In the first step, the predictor will assume a linearrelationship between active load P and voltagemagnitude V, and predict the result with unit change ofactive load as shown in Figure 2. The corrector will thencorrect the result by using the predicted value as theinitial value and apply Newton-Raphson’s method to the powerflow equations:
=
−−−+−=∆
=
−+−+−=∆
∑∑
∑∑
0)cos(||)sin(||||
0)sin(||)cos(||||
i
jiij j jiij jiii
jiij j jiij jiii
bV g V V QQ
bV g V V P P
δ δ δ δ
δ δ δ δ ( 4 )
In the second step, the predictor will predict the result
with unit change of voltage magnitude V instead ofactive load P. The corrector will then correct the resultwith Newton-Raphson’s method with an additional parameter PL and an additional equation:
0=− predicted V V ( 5 )
In the third step, the predictor will predict the resultwith PL decreases.
3.3. Voltage Stability Contingency Analysis
As the requirement of the reliability for distributionsystem increases, contingency analysis is becoming avery important subject in power system analysis [7].
Voltage stability contingency analysis refers tovoltage stability study of the failure of one or moresystem. The time consumed to consider all possiblesituations is too large and a short contingency list, whereonly the most serious situations are included, is alwaysapplied to reduce the calculation time [7]-[11].
A Fast Voltage Stability Index is proposed in [12].Theline stability index is derived from a 2 bus system asshown in Figure 3. The current flow from bus 1 to bus 2
is could be calculated as:
jX R
V V I
+
∠−∠=
δ 21 0 ( 6 )
where R is the line resistance and X is the linereactance.
The derivation of Q2 could be expressed as in (7):
22212221
*
22
)sin()cos(V
)*(
V X R
RV
X R
X V
I V real Q
++
+−=
∠=
δ δ
δ ( 7 )
So,
0)(cossin( 2
2
21
2
2 =++)+− Q
X
R X V V
X
RV δ δ ( 8 )
For V2 to have a real solution, we have:
1cossin()(
422
1
2
2
≤)+ δ δ X RV
X Q Z ( 9 )
The angle difference δ is normally small. Therefore,the fast voltage stability index is defined as:
JX R +
1 Bus 2 Bus
01∠V δ ∠
2V
111 ,, S Q P 222
,, S Q P I
Figure 3 2-bus model representation.V1, V2: voltage at the sending and receiving buses
P1, Q1: active and reactive powers at the sending busP2, Q2: active and reactive powers at the receiving busS1, S2: complex powers on the sending and receiving
buses: angle of the voltage at the receiving end
0 0.5 1 1.5 2 2.5 3 3.5 4 4.5 50
0.2
0.4
0.6
0.8
1
1.2
1.4
Predictor
Corrector
Step1
Step2
Step3
Figure 2 Typical PV curve.
B u s V o l t a g e
Active Load PL
469

7/25/2019 Effects of Distributed Generation on Power Loss, Loadability and Stability
http://slidepdf.com/reader/full/effects-of-distributed-generation-on-power-loss-loadability-and-stability 3/6
14
2
2
≤= X V
Q Z FVSI
i
j
ij ( 10 )
where Z is the magnitude of the line impedance.The line stability factor is also derived from the 2 bus
model presented in Figure 3. Similar to (7), we have:
++
+−=
+
−
+
−=
2222122212
22122212
)sin()cos(V
)sin()cos(V
V X R
RV
X R
X V Q
V
X R
X V
X R
RV P
δ δ
δ δ
( 11 )
Consider a lossless line where: 1<< X
R, we have:
+=
=
⇒
−=
=
21
2
2
21
2
2212
212
cos
sin
cos
sin
V V
V XQ
V V
XP
X
V V V Q
X
V V P
δ
δ
δ
δ
( 12 )
Then:
1cossin22
2
21
2
22
2
21
2
=+=
+
+
δ δ V V
V XQ
V V
XP
( 13 )
⇒
0)2( 22
2
2
2
22
2
2
12
4
2 =++−+ X P Q X V V XQV ( 14 )
Consider (14) to be a quadratic equation of2
2V , for
2
2V to have a real solution, the discriminant must be
larger than or equal to zero:
0)(4)2( 22
2
2
2
222
12 ≥+−− X P Q X V XQ ( 15 )
So,
2
2
2
2
12
4 s
V
X P
X
V Q −≤ ( 16 )
Since the line is lossless,21
P P −= ,we have:
14 2
2
12
1
2
1
≤
+−
Q P
V
X
V
X ( 17 )
The line stability index is therefore defined as:
+−
= ji
ii
ijQ P
V
X
V
X LQP
2
224 ( 18 )
The values of LQP or FVSIij must be less than 1 forthe system to be stable. The line that exhibits FVSI orLQP close to 1 implies that the system is approaching itsload limit and is nearly unstable.
Comparisons between FVSI and LQP are made inFigure 4 and Figure 5 as functions of active and reactiveload. It is found out that FVSI reflects the systemstability well in terms of reactive load but not well interms of active load. Therefore the line stability factorLQP is used as the stability index in this paper.
In this paper a N-1 contingency analysis, where oneline outage is applied in one contingency, is simulated.In each case, one of the transmission lines is eliminatedfrom the system and the system stability factor SLQP inthat contingency is defined as the biggest LQP ij value
for all the transmission lines.}max{ ij LQP SLQP = ( 19 )
indiceslineiontransmissall, ∈ ji
In case the system collapses, the value of SLQPcannot be obtained because power flow solution doesnot exist. However, the SLQP of this contingency isassigned to be the upper limit of 1.
4. Case Study
4.1.
Comparison of Effects of multiple PEMFC
DGs on Different Buses
In case A1, we keep adding PEMFC DGs with acapacity of 2MW and with lower reactive power limit of0 and upper limit of 2MVar to different buses of themodified IEEE 14 bus test case. Table 1 and Figure 6show the effect when DGs are added to the system. Inthe original case, the total load on the system is 388.5
0 0.5 1 1.5 2 2.5 30
0.1
0.2
0.3
0.4
0.5
0.6
0.7
0.8
0.9
1
S t a
b i l i t y I n d e x
Additional Active Load on Bus 4
FVSI
LQP
Figure 5 Comparison of FVSI and LQP asactive load on bus 4 the IEEE 14 bus testcase increases.
0 0.5 1 1.5 2 2.50
0.1
0.2
0.3
0.4
0.5
0.6
0.7
0.8
0.9
1
S t a b i l i t y I n d e x
Additional Reactive Load on Bus 4
FVSI
LQP
Figure 4 Comparison of FVSI and LQP asreactive load on bus 4 of the IEEE 14 bus testcase increases.
470
7/25/2019 Effects of Distributed Generation on Power Loss, Loadability and Stability
http://slidepdf.com/reader/full/effects-of-distributed-generation-on-power-loss-loadability-and-stability 4/6
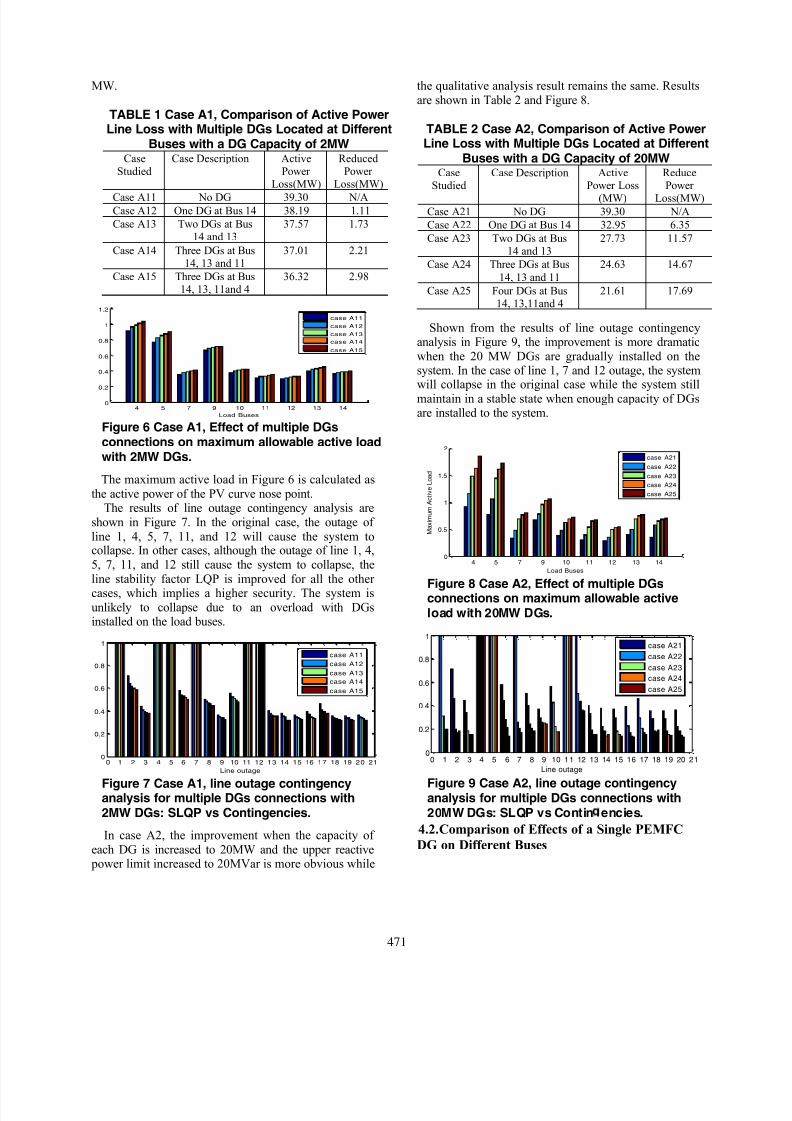
MW.
The maximum active load in Figure 6 is calculated asthe active power of the PV curve nose point.
The results of line outage contingency analysis areshown in Figure 7. In the original case, the outage ofline 1, 4, 5, 7, 11, and 12 will cause the system tocollapse. In other cases, although the outage of line 1, 4,5, 7, 11, and 12 still cause the system to collapse, theline stability factor LQP is improved for all the other
cases, which implies a higher security. The system isunlikely to collapse due to an overload with DGsinstalled on the load buses.
In case A2, the improvement when the capacity ofeach DG is increased to 20MW and the upper reactive power limit increased to 20MVar is more obvious while
the qualitative analysis result remains the same. Resultsare shown in Table 2 and Figure 8.
Shown from the results of line outage contingencyanalysis in Figure 9, the improvement is more dramaticwhen the 20 MW DGs are gradually installed on thesystem. In the case of line 1, 7 and 12 outage, the systemwill collapse in the original case while the system stillmaintain in a stable state when enough capacity of DGsare installed to the system.
4.2.
Comparison of Effects of a Single PEMFC
DG on Different Buses
TABLE 1 Case A1, Comparison of Active PowerLine Loss with Multiple DGs Located at Different
Buses with a DG Capacity of 2MWCase
StudiedCase Description Active
PowerLoss(MW)
ReducedPower
Loss(MW)
Case A11 No DG 39.30 N/ACase A12 One DG at Bus 14 38.19 1.11
Case A13 Two DGs at Bus14 and 13
37.57 1.73
Case A14 Three DGs at Bus14, 13 and 11
37.01 2.21
Case A15 Three DGs at Bus14, 13, 11and 4
36.32 2.98
TABLE 2 Case A2, Comparison of Active PowerLine Loss with Multiple DGs Located at Different
Buses with a DG Capacity of 20MWCase
StudiedCase Description Active
Power Loss
(MW)
ReducePower
Loss(MW)Case A21 No DG 39.30 N/A
Case A22 One DG at Bus 14 32.95 6.35
Case A23 Two DGs at Bus14 and 13
27.73 11.57
Case A24 Three DGs at Bus
14, 13 and 11
24.63 14.67
Case A25 Four DGs at Bus14, 13,11and 4
21.61 17.69
4 5 7 9 10 11 12 13 140
0.2
0.4
0.6
0.8
1
1.2
Load Buses
case A11
case A12
case A13
case A14
case A15
Figure 6 Case A1, Effect of multiple DGsconnections on maximum allowable active loadwith 2MW DGs.
0 1 2 3 4 5 6 7 8 9 10 11 12 13 14 15 16 17 18 19 20 210
0.2
0.4
0.6
0.8
1
Line outage
case A11
case A12
case A13
case A14
case A15
Figure 7 Case A1, line outage contingencyanalysis for multiple DGs connections with2MW DGs: SLQP vs Contingencies.
4 5 7 9 10 11 12 13 140
0.5
1
1.5
2
Load Buses
M a x i m u m A
c t i v e L o a d
case A21
case A22
case A23
case A24
case A25
Figure 8 Case A2, Effect of multiple DGsconnections on maximum allowable activeload with 20MW DGs.
0 1 2 3 4 5 6 7 8 9 10 11 12 13 14 15 16 17 18 19 20 210
0.2
0.4
0.6
0.8
1
Line outage
case A21
case A22
case A23
case A24
case A25
Figure 9 Case A2, line outage contingencyanalysis for multiple DGs connections with20MW DGs: SLQP vs Contin encies.
471

7/25/2019 Effects of Distributed Generation on Power Loss, Loadability and Stability
http://slidepdf.com/reader/full/effects-of-distributed-generation-on-power-loss-loadability-and-stability 5/6
In case B, a fuel cell DG system with 2MW active power capacity is connected to different buses. Theactive power line loss is shown in Table 3. The resultshows dramatic difference when the DG is connected to bus 14, 13, 11 and 4 respectively. The strategy toconnect the DG to Bus 14 improves the systemefficiency most significantly while connecting to other buses shows much less benefits. A very interesting result
is that in order to improve the loadability at a certainload bus in the IEEE 14 bus test case, connecting theDG to that bus is not necessarily as good as connectingthe same DG to bus 14.
4.3.
Comparison of Effects of Two PEMFC DGs
on Different or a Single Bus
In this case, we locate two PEMFC DGs in two ways:at different buses or at one single bus. Table 4, Figure 10and Figure 11 show the results when two PEMFC DGswith an active power capacity of 2MW and with lowerreactive power limit of 0 and upper limit of 2MVar areconnected. In Table 5, Figure 12 and Figure 13, weinstead use two PEMFC DGs with an active power
capacity of 20MW and with lower reactive power limitof 0 and upper limit of 20MVar.
When 2MW DGs are applied, to connect both of themon the critical bus (bus 14) has proven to be a betterstrategy in terms of real power loss, maximum allowableactive load and system stability, compared to thestrategy of connecting them separately on bus 14 and bus 13. However, when the 20MW DGs are applied, thestrategy to locate the two DGs separately on bus 14 and
13 shows more benefits. The result suggests that whenthe DGs are gradually added to the power system, it ismore desirable to add the first several DGs to the critical bus that is far away from generation. However, when thecapacity on that bus reaches some limit where thecondition on the original critical bus has been improvedso much that it is not ‘critical’ anymore, adding newDGs on some other buses may improve the system performance and stability more effectively.
0 1 2 3 4 5 6 7 8 9 10 11 12 13 14 15 16 17 18 19 20 210
0.2
0.4
0.6
0.8
1
Line outage
original
two DGs on Bus 13 and 14
both two DGs on Bus 14
Figure 11 Case C1 line outage contingencyanalysis for case C1 with 2MW DGs: SLQP vsContingencies.
4 5 7 9 10 11 12 13 140
0.2
0.4
0.6
0.8
1
1.2
Load Buses
M a x i m u m A
c t i v e L o a d
original
two DGs in bus 13 and 14
two DGs both in bus 14
Figure 10 Case C1 Comparison of Maximumallowable Active load with two DGs located atdifferent buses and a single bus with 2MWDGs.
TABLE 4 Case C1 Comparison of Active PowerLoss with Two DGs Located at Different Busesand a Single Bus with a DG Capacity of 2MW
Case
Studied
Case
Description
Active
PowerLoss(MW)
Reduced
PowerLoss(MW)
Case C11 No DG 39.30 N/A
Case C12 Two DGs both at Bus 14
37.17 2.13
Case C13 Two DGs atBus 14 and 13
37.57 1.73
TABLE 5 Case C2 Comparison of Active PowerLoss with Two DGs Located at Different Busesand a Single Bus with a DG Capacity of 20MWCase
Studied
Case
Description
Active Power
Loss(MW)
Reduced Power
Loss(MW)Case C21 No DG 39.30 N/A
Case C22 Two DGs bothat Bus 14
28.83 10.47
Case C23 Two DGs atBus 14 and 13
27.73 11.57
TABLE 3 Case B Comparison of Active PowerLine Loss with a Single DG Located at Different
Buses with a DG Capacity of 2MWCase
StudiedCase Description ctive Power
Loss(MW)Reduced
PowerLoss(MW)
Case B11 No DG 39.30 N/A
Case B12 One DG at Bus 14 38.19 1.11
Case B13 One DG at Bus 13 38.65 0.65
Case B14 One DG at Bus 11 38.71 0.59Case B15 One DG at Bus 4 38.54 0.76
472

7/25/2019 Effects of Distributed Generation on Power Loss, Loadability and Stability
http://slidepdf.com/reader/full/effects-of-distributed-generation-on-power-loss-loadability-and-stability 6/6
5. Conclusion
Study shows that adding PEMFC DGs to the IEEE 14 bus test case reduces the active power loss effectively.Adding DGs to the system also improves the loadabilityon different buses and decreases the stability index. Thesystem security has been improved due to the lower possibility that the system will collapse with anoverload. In several contingencies, when enough
capacity of DGs is connected to the system, the situationwhere the system originally collapses may remainstable. The effect of adding multiple DGs maintains anearly linear relationship between the DGs added andthe improvement of the system performance in terms ofthe reduced active power line loss and improvedloadability.
The system performance improvement on the systemdepends largely on where the DG is located. In the IEEE14 Bus Test Case, Bus 14 is found to be the critical buswhere it is most desirable to locate the DG. Oneexplanation is that Bus 14 is farthest away from theswing. Therefore, transferring power from the swing busto bus 14 results in the most dramatic power loss
compared to other load buses. Therefore, adding a DG tothat bus will reduce the power transferred on thetransmission line most effectively.
While adding DG to the critical bus will improve thesystem security and performance most effectively, it isnot desirable to put too much capacity on the critical buswhen the overall DG capacity reaches certain limit.
6. References
[1] C. Wang, M. H. Nehrir, H. Gao, “Control of PEM FuelCell Distributed Generation Systems ,” IEEE Transactions on
Energy Conversion, Vol. 21, No. 2, June 2006.
[2] J. Jung, A. Keyhani, “Modeling and Control of Fuel Cell
Based Distributed Generation Systems in a Standalone ACPower Supply,” Journal of Iranian Association of Electricaland Electronics Engineers, Vol.2, No.1, 2005.
[3] C. Wang, M. H. Nehrir, “Dynamic Models and Model
Validation for PEM Fuel Cells Using Electrical Circuits ,” IEEE Trans. Energy Conversion, Vol. 20, No. 2, June 2005.
[4] H. Chen, J. Chen, D. Shi, X. Duan, “Power flow Study andVoltage Stability Analysis for Distribution Systems withDistributed Generation ,” Power Engineering Society General Meeting , pp. 1-8, 18-22 June 2006.
[5] R. Christie, UW Power System Test Case Archive,Available: http://www.ee.washington.edu/research/pstca/.
[6] Mariesa Crow, Computational Methods for Electric Power Systems, CRC Press, 2003.
[7] “Using the Contingency Analysis in Power World,”Available:http://ecow.engr.wisc.edu/cgibin/get/ece/427/hiskens/1discussi
on/pwcontingencyanalysis.pdf.
[8] S. Repo, P. Jarentausta, “Contingency analysis for a largenumber of voltage stability studies,” Budapest 99. International Conference, Sept. 1999, pp. 34.
[9] C. N. Lu, M. Unum, “Interactive simulation of branchoutages with remedial action on a personal computer for the
study of security analysis,” IEEE Transaction on Power
Systems, Volume 6, pp. 1266 – 1271, Aug. 1991.
[10] R. H. Chen, J. Gao, O. P. Malik, G. S. Hope, S. Wang, N.Xiang, “Multi-contingency preprocessing for securityassessment using physical concepts and CQR withclassifications,” IEEE Transaction on Power Systems, Volume8, pp. 840 – 848, Aug. 1993.
[11] P. A. Ruiz, P. W. Sauer, “Voltage and Reactive PowerEstimation for Contingency Analysis Using Sensitivities,” IEEE Trans. Power Systems, Vol. 22, pp. 639–647, May 2007.
[12] I. Musirin, T. K. A. Rahman, “Novel Fast VoltageStability Index (FVSI) for Voltage Stability Analysis in PowerTransmission System,” Student Conference on Research and
Development Proceedings, Shah Alam, Malaysia, 2002.
0 1 2 3 4 5 6 7 8 9 10 11 12 13 14 15 16 17 18 19 200
0.2
0.4
0.6
0.8
1
Line outage
original
two DGs on Bus 13 and 14
both two DGs on Bus 14
Figure 13 Case C2 line outage contingencyanalysis for case C2 with 20MW DGs: SLQPvs Contingencies.
4 5 7 9 10 11 12 13 140
0.2
0.4
0.6
0.8
1
1.2
1.4
1.6
Load Buses
M a x i m u m
A c t i v e L o a d
original
two DGs in bus 13 and 14
two DGs both in bus 14
Figure 12 Case C2 Comparison of Maximumallowable Active load with two DGs located atdifferent buses and a single bus with 20MW
473