Effects of different amounts of exercise on preventing ...
106
For peer review only Impacts of different exercise models on depressive symptoms in community-dwelling older adults: a longitudinal cohort study Journal: BMJ Open Manuscript ID bmjopen-2016-014256 Article Type: Research Date Submitted by the Author: 13-Sep-2016 Complete List of Authors: Chang, Yu-Chen ; Ditmanson Medical Foundation Chia-Yi Christian Hospital, Community Health Lu, Mei-Chun ; Kuang Tien General Hospital, Medical Research Hu, I-Han; National Cheng Kung University College of Medicine, Institute of Gerontology Wu, Wan-Chi; National Cheng Kung University College of Medicine, Public Health Hu, Susan; National Cheng Kung University College of Medicine, Public Health <b>Primary Subject Heading</b>: Mental health Secondary Subject Heading: Geriatric medicine, Epidemiology, Sports and exercise medicine Keywords: EPIDEMIOLOGY, MENTAL HEALTH, Depression & mood disorders < PSYCHIATRY, SPORTS MEDICINE For peer review only - http://bmjopen.bmj.com/site/about/guidelines.xhtml BMJ Open on March 11, 2022 by guest. Protected by copyright. http://bmjopen.bmj.com/ BMJ Open: first published as 10.1136/bmjopen-2016-014256 on 2 May 2017. Downloaded from
Transcript of Effects of different amounts of exercise on preventing ...

For peer review only
Impacts of different exercise models on depressive symptoms in community-dwelling older adults: a
longitudinal cohort study
Journal: BMJ Open
Manuscript ID bmjopen-2016-014256
Article Type: Research
Date Submitted by the Author: 13-Sep-2016
Complete List of Authors: Chang, Yu-Chen ; Ditmanson Medical Foundation Chia-Yi Christian Hospital, Community Health Lu, Mei-Chun ; Kuang Tien General Hospital, Medical Research
Hu, I-Han; National Cheng Kung University College of Medicine, Institute of Gerontology Wu, Wan-Chi; National Cheng Kung University College of Medicine, Public Health Hu, Susan; National Cheng Kung University College of Medicine, Public Health
<b>Primary Subject Heading</b>:
Mental health
Secondary Subject Heading: Geriatric medicine, Epidemiology, Sports and exercise medicine
Keywords: EPIDEMIOLOGY, MENTAL HEALTH, Depression & mood disorders < PSYCHIATRY, SPORTS MEDICINE
For peer review only - http://bmjopen.bmj.com/site/about/guidelines.xhtml
BMJ Open on M
arch 11, 2022 by guest. Protected by copyright.
http://bmjopen.bm
j.com/
BM
J Open: first published as 10.1136/bm
jopen-2016-014256 on 2 May 2017. D
ownloaded from
For peer review only
Impacts of different exercise models on depressive symptoms in
community-dwelling older adults: a longitudinal cohort study
Yu-Chen Chang1, Mei-Chun Lu
2, I-Han Hu
3, Wan-Chi Ida Wu
4, Susan C. Hu
5*
1. Yu-Chen Chang, MD, PhD, Department of Community Health, Chia-Yi Christian
Hospital, Chia-Yi, Taiwan. [email protected]
2. Mei-Chun Lu, MS, Department of Medical Research, Kuang Tien General Hospital,
Taichung, Taiwan. [email protected]
3. I-Han Hu, MS, Institute of Gerontology, College of Medicine, National Cheng Kung
University. [email protected]
4. Wan-Chi Ida Wu, PhD, Department of Public Health, College of Medicine, National
Cheng Kung University, Tainan, Taiwan. [email protected]
5. Susan C. Hu, PhD, Department of Public Health, College of Medicine, National Cheng
Kung University, Tainan, Taiwan. [email protected]
*Corresponding author: Susan C. Hu, PhD
Dept. of Public Health, College of Medicine, National Cheng Kung University,
No.1, University Rd, Tainan, Taiwan, 70101
E-mail: [email protected]
Tel: +886-972-967800, Fax: +886-6-2359033
Running title: Exercise on depression
World count: Abstract 252, Text 3010
Number of figures: 1
Number of tables: 4
Page 1 of 24
For peer review only - http://bmjopen.bmj.com/site/about/guidelines.xhtml
BMJ Open
123456789101112131415161718192021222324252627282930313233343536373839404142434445464748495051525354555657585960
on March 11, 2022 by guest. P
rotected by copyright.http://bm
jopen.bmj.com
/B
MJ O
pen: first published as 10.1136/bmjopen-2016-014256 on 2 M
ay 2017. Dow
nloaded from

For peer review only
1
ABSTRACT
Objectives: to examine the impacts of four different exercise models on depressive
symptoms in community-dwelling older adults.
Design: prospective cohort study.
Setting: a nationally representative sample, Taiwan.
Participants: Four waves of the survey “Taiwan Longitudinal Study on Aging (TLSA)” from
1996 to 2007 were used. A total of 2,673 older adults aged 65 and over were recruited.
Primary and secondary outcome measures: Depressive symptoms were measured using
the Center for Epidemiologic Studies Depression scale (CESD). Four different exercise
models were examined, including (1) 3 times/week, 15 min/time; (2) 3 times/week, 30
min/time; (3) 6 times/week, 15 min/time; and (4) 6 times/week, 30 min/time. All exercise
models were required to have at least moderate intensity. The impacts of different exercise
models on depressive symptoms were analyzed using generalized linear mixed models.
Results: More than one fifth of the elderly had depressive symptoms (CESD ≥10). About
38.6% of older adults met the lowest criteria of exercise model 1, and fewer (28.0%) met the
highest criteria of model 4. Only exercise model 4 in the current survey was initially related
to lower depressive symptoms (OR=0.8, 95%CI=0.66-0.95). However, after considering the
interaction between time and changes in the exercise patterns, we found that all persistent
exercise models, even if very low amount (3 times/week, 15 min/week), had significantly
preventive effects on depressive symptoms (OR=0.56~0.67).
Conclusion: A consistent exercise with 15-min moderate intensity and a frequency of no less
than 3 times a week is significantly associated with lower risk of depressive symptoms. This
exercise model may be easier to promote at the community and population level.
Trial registration: registry number 104040 of the Institutional Ethics Committee of Chia-Yi
Christian Hospital.
Keywords:
Exercise, depression, mental health, elderly, generalized linear mixed models, cohort study.
Page 2 of 24
For peer review only - http://bmjopen.bmj.com/site/about/guidelines.xhtml
BMJ Open
123456789101112131415161718192021222324252627282930313233343536373839404142434445464748495051525354555657585960
on March 11, 2022 by guest. P
rotected by copyright.http://bm
jopen.bmj.com
/B
MJ O
pen: first published as 10.1136/bmjopen-2016-014256 on 2 M
ay 2017. Dow
nloaded from

For peer review only
2
Strengths and limitations of this study
� This is the first report to examine the impacts of four different exercise models on
depressive symptoms in the elderly.
� A low volume of persistent exercise (≥15 min, 3 times per week of moderate intensity
exercise) can provide preventive effects on depressive symptoms for
community-dwelling older adults.
� The effects of different variables for depression may be altered for different cohorts
because of changes in medicine, nutrition or in the environment.
� The outcome event was performed the same time as the second visit to develop the
transitional patterns of exercise, which may reduce the interpretation of a causal
relationship.
Page 3 of 24
For peer review only - http://bmjopen.bmj.com/site/about/guidelines.xhtml
BMJ Open
123456789101112131415161718192021222324252627282930313233343536373839404142434445464748495051525354555657585960
on March 11, 2022 by guest. P
rotected by copyright.http://bm
jopen.bmj.com
/B
MJ O
pen: first published as 10.1136/bmjopen-2016-014256 on 2 M
ay 2017. Dow
nloaded from

For peer review only
3
INTRODUCTION
Late life depression is an important health issue in different ethnic groups, affecting
13.7% of the population in the US and 20% of Chinese older adults in Taiwan.1-2
Depressive
disorder has been indicated as the top ten causes of years lived with disability among 188
countries based on the Global Burden of Disease Study, 2013.3 It has also been closely linked
to quality of life among community-dwelling older adults in many studies.4-6
Several relevant interventions have been suggested for preventing or treating depression
besides medicine. For instance, having a marital partner or having good social support will
significantly reduce the impacts of disability from depression.7 Psychological intervention,
especially group-based, has been shown to have benefits in regard to both prevention and
economic effects.8-10
Six weeks of healthy dietary practice has also been helpful in reducing
depressive symptoms, and the benefits may be sustained for 2 years.11
However, as early as in ancient Greece, Hippocrates suggested his patients exercise to
treat the disease of consumption, and Galen further instructed patients to exercise to reduce
troublesome depression.12
Many mechanisms of anti-depressive effects of exercise were
summarized in Rethorst, Wipfli, and Landers’s study.13
For example, four mechanisms in
hippocampal neurogenesis can be potentially facilitated by exercise: increases in
B-endorphins, vascular endothelial growth factor, brain-derived neurotrophic factor and
serotonin. Thus, exercise is potentially an effective approach to treating or preventing
depression.
Little research has focused on the relationship between exercise and depressive
symptoms in the elderly. Among the limited number of studies, exercise seems to have
similar effects to some pharmacological treatments14
but some meta-analysis studies have
yielded inconsistent results.15-17
Also, exercise did not always show benefits related to
preventing or treating depression because many of the studies did not control for previous
levels of depressive symptoms, and only a few included a follow-up period of more than 2
years. Furthermore, since exercise status will change as people age, how the transitional
patterns of exercise in older adults affect depressive symptoms has yet to be studied.
In addition, for older adults, exercise programs need to consider the intensity and
duration. The general recommendation for exercise by the American College of Sports
Medicine is moderate intensity; exercise is engaged in at least 30 minutes per day at least 5
days a week to accumulate a total of 150-300 minutes per week, or vigorous intensity of at
least 20 minutes per day for 3-5 days per week to a total of 75-100 minutes/week.18
However,
Page 4 of 24
For peer review only - http://bmjopen.bmj.com/site/about/guidelines.xhtml
BMJ Open
123456789101112131415161718192021222324252627282930313233343536373839404142434445464748495051525354555657585960
on March 11, 2022 by guest. P
rotected by copyright.http://bm
jopen.bmj.com
/B
MJ O
pen: first published as 10.1136/bmjopen-2016-014256 on 2 M
ay 2017. Dow
nloaded from
For peer review only
4
a recent study by Wen et al. have indicated that a low amount of exercise, which refers to 15
minutes per day or 90 minutes per week at moderate intensity, has been proven beneficial in
reducing all-cause and all-cancer mortality.19
This result provides a more age-friendly
exercise model, which could be further explored in regard to its effects on depressive
symptoms in older adults.
Therefore, in this study, we use an 11-year cohort data from a population-based survey
to examine how different exercise models affect depressive symptoms in
community-dwelling older adults. The purposes of the study were: (1) to examine the impacts
of four different exercise models on preventing depressive symptoms in older adults, using
Taiwan as an example; and (2) to test the effects of changes in exercise status during a period
of time on depressive symptoms in the elderly.
METHODS
Study design and participants
This is a longitudinal cohort study, using nationally representative data from the survey
“Taiwan Longitudinal Study on Aging, TLSA”. The TLSA survey was undertaken by a
collaborative project from the University of Michigan, USA and the Health Promotion
Administration, Ministry of Health and Welfare, Taiwan. There were six waves of surveys for
those aged 60 and over in 1989, 1993, 1996, 1999, 2003 and 2007. Supplemental cases who
were aged 50 and older were added to the cohort in 1996 and 2003. A three-stage
proportional-to-size probability sampling technique was used in the survey, and face-to-face
interviews were performed for each individual. The response rates in each wave were high,
ranging from 81.2% to 91.4%.
Since detailed exercise questionnaires were launched in 1996, we combined two cohorts
(cohort I aged 67+ and cohort II aged 50-66) in 1996 together as our study cohort. The
inclusion criteria was aged 65 and older; the exclusion criteria was those who did not
complete the relevant questionnaires, lived in institutions or answered by proxy. We used the
1999 survey as the baseline and followed them up to 2007. A total of 2,673 valid participants
was selected as the baseline. The flow chart of the valid sample size is shown in Figure 1.
Due to the significant effects of previous depressive symptoms and changes in exercise
behavior on depression, we thus added more related data from the 1996 survey. Thus, the
total number of observations in the four survey waves was 8,397. This study was approved by
the Institutional Ethics Committee of Chia-Yi Christian Hospital (registry number 104040).
Page 5 of 24
For peer review only - http://bmjopen.bmj.com/site/about/guidelines.xhtml
BMJ Open
123456789101112131415161718192021222324252627282930313233343536373839404142434445464748495051525354555657585960
on March 11, 2022 by guest. P
rotected by copyright.http://bm
jopen.bmj.com
/B
MJ O
pen: first published as 10.1136/bmjopen-2016-014256 on 2 M
ay 2017. Dow
nloaded from
For peer review only
5
Measurements
Dependent Variable: Depressive Symptoms
Depressive symptoms were measured with the Center for Epidemiologic Studies
Depression Scale (CESD). This 20-item scale assessment20
was modified to a 10-item scale,21
which was used in the TLSA survey. Each item was scored from 0 to 3, making the total
score range from 0 to 30. The measure, with a cutoff score of 10, has been recommended as a
good tool to assess depressive symptom severity in a community.22
Because the levels of
depressive symptoms are associated with future depression and quality of life,23-24
we
categorized the levels of depressive symptoms as No Depressive Symptom (NDS), which
means CESD=0; Lower Level of Depressive Symptoms (LLDS), 0<CESD≤9; and Higher
Level of Depressive Symptoms (HLDS), CESD≥10.
Independent Variables: Exercise Models and Transitional Patterns
The degree of exercise was quantified by asking about the frequency (0, ≤2, 3-5, ≥6
times per week), duration (<15 min, 15-30 min, >30 min), and intensity by sweating level
(none, a little, a lot, none of the above) and panting level (none, a little, a lot, none of the
above) after exercise.
Four exercise models (EMs) were classified in this study. Exercise model 1 means that
exercise of at least moderate intensity was performed ≥3 times/week, ≥15 min/time
(EM3_15); Exercise model 2 means ≥3 times/week, >30 min/time (EM3_30); Exercise model
3 means ≥6 times/week, ≥15 min/time (EM6_15); Exercise model 4 means ≥6 times/week,
>30 min/time (EM6_30). The moderate intensity was defined as experiencing a little
sweating and panting after exercise.18
The pattern of exercise transition refers to changes in practices of respective exercise
models between two waves, which was classified as (a) Low pattern (pattern NN): the
respective exercise model was not practiced in the previous or in the current surveys; (b)
Declining pattern (pattern YN): the respective exercise model was practiced in the previous
but not in the current surveys; (c) Increasing pattern (pattern NY): the respective exercise
model was practiced in the current but not in the previous surveys; and (d) Persistent pattern
(pattern YY): the respective exercise model was practiced in both the previous and in the
current surveys.
Page 6 of 24
For peer review only - http://bmjopen.bmj.com/site/about/guidelines.xhtml
BMJ Open
123456789101112131415161718192021222324252627282930313233343536373839404142434445464748495051525354555657585960
on March 11, 2022 by guest. P
rotected by copyright.http://bm
jopen.bmj.com
/B
MJ O
pen: first published as 10.1136/bmjopen-2016-014256 on 2 M
ay 2017. Dow
nloaded from

For peer review only
6
Control Variables
Sociodemographic variables included gender, age, marital status (married or living with
a partner was coded as 1, otherwise 0), level of education (none, elementary, junior high
school, senior high school, and college and above), economic satisfaction (dissatisfied,
satisfied) and employment status (yes/no).
Physical function involved reversing the score from a 4-point measurement inquiring
about level of difficulty of seven mobility tasks, including standing for 15 min, squatting,
raising both arms up, grasping with fingers, lifting an 11 kg weight, running 20-30 m,
climbing up two to three floors. The sum of the physical battery ranged from 0-21. A higher
score indicated a better physical battery. These measurements have been reported as
hierarchically associated with instrumental and basic activities of daily living.25
Social participation refers to participation in any of the following groups: volunteers,
community groups, religious groups, occupational associations, political parties or groups,
social service groups, clan associations, seniors’ groups or schools. Social participation was
coded as a binary variable (yes/no).
Emotional support was the summed scores of seven items, which were coded from 0 to 3,
including (1) family/relatives/friends care about you, (2) family/relatives/friends listen to you,
(3) you can count on family/relatives/friends when you are ill, (4) you are satisfied with the
support from your family/relatives/friends, (5) How often do your family or friends come to
you for opinions, (6) In what ways do you feel that you are helpful to your family or friends,
and (7) How often do you feel rejected by your family/relatives/friends. The last item was
scored reversely.
Health-related variables included self-rated health (poor, fair and good) and other binary
variables such as current smoking and 10 chronic conditions including cancer, chronic
respiratory disease, gastrointestinal disease, hypertension, diabetes mellitus, heart disease,
stroke, arthritis, hepatobiliary disease and renal disease.
Statistical analysis
The descriptive analysis of depressive symptoms and covariates were presented as a
mean ± standard deviation (SD) or as n (%) for continuous or categorical data, respectively.
We applied generalized linear mixed models (GLMMs) via PROC GLIMMIX to estimate the
effects of different transitional patterns of exercise on depressive symptoms with HLDS as
the event, after adjusting for previous CESD score, age, gender, level of education, marital
status, smoking, physical function, emotional support, social participation, self-rated health,
Page 7 of 24
For peer review only - http://bmjopen.bmj.com/site/about/guidelines.xhtml
BMJ Open
123456789101112131415161718192021222324252627282930313233343536373839404142434445464748495051525354555657585960
on March 11, 2022 by guest. P
rotected by copyright.http://bm
jopen.bmj.com
/B
MJ O
pen: first published as 10.1136/bmjopen-2016-014256 on 2 M
ay 2017. Dow
nloaded from

For peer review only
7
economic satisfaction, employment and 10 chronic conditions. The interaction of time and
transitional patterns of exercise was also included in the above analysis. A two-sided p-value
<0.05 was considered statistically significant. All data was merged and analyzed using SAS
9.2 (SAS Institute, Cary, NC).
RESULTS
There were 2,673 valid subjects selected from the survey conducted in 1999, and a total
of 8,397 observations in four waves of survey. Table 1 shows the distribution of
characteristics for the subjects from 1999 (baseline) to 2007. At baseline, the average age was
74.2 ± 5.7 years old, of which 54.5% were male. The prevalence of LLDS and HLDS was
20~24% over time. About 38.6% of participants met the lowest criteria of EM3_15, and
fewer (28.0%) met the highest criteria of EM6_30. Noticeably, in any survey, exercise
models EM3_15 and EM6_15 have a higher proportion than EM3_30 and EM6_30. This may
imply the difficulty of engaging in long exercise in older adults.
Table 2 illustrates the odd ratios (OR) of HLDS according to the current practices of
exercise models and other determining factors. Only exercise model 4 (EM6_30) had a
significant reducing effect on HLDS (OR=0.80, 95% CI=0.66-0.95). Also, the previous level
of depressive symptoms, physical function, emotional support, self-rated health and
economic satisfaction were all positively predictive of HLDS.
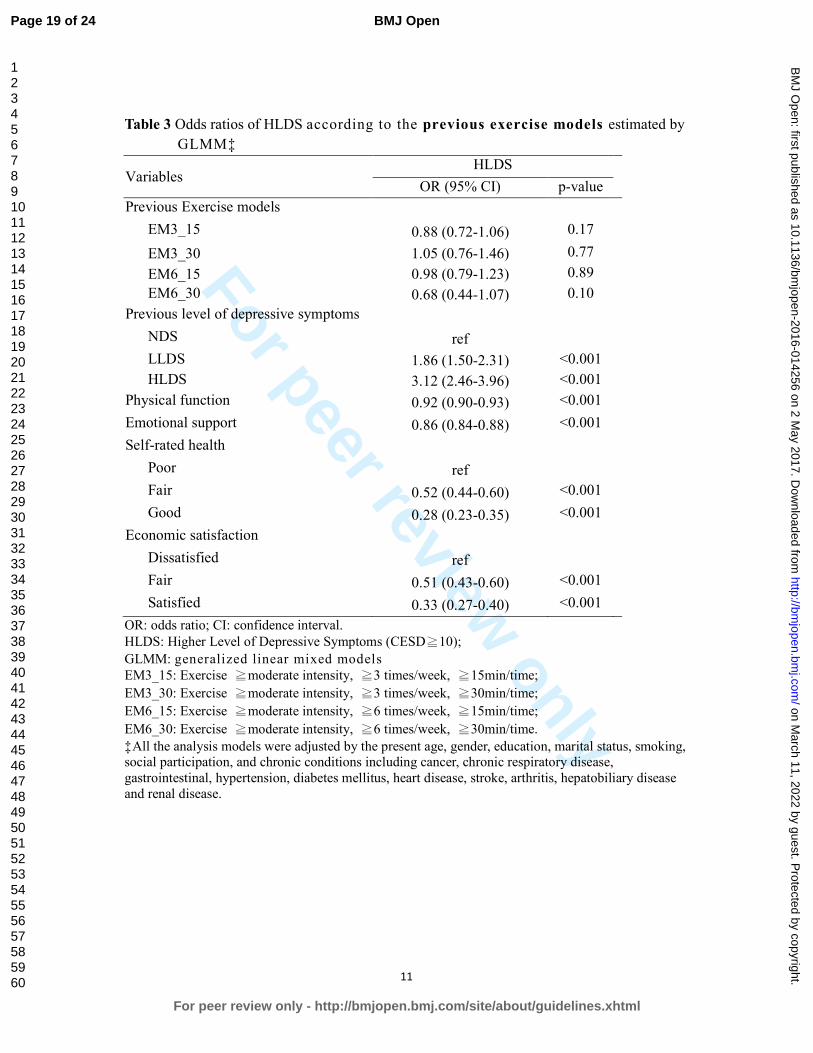
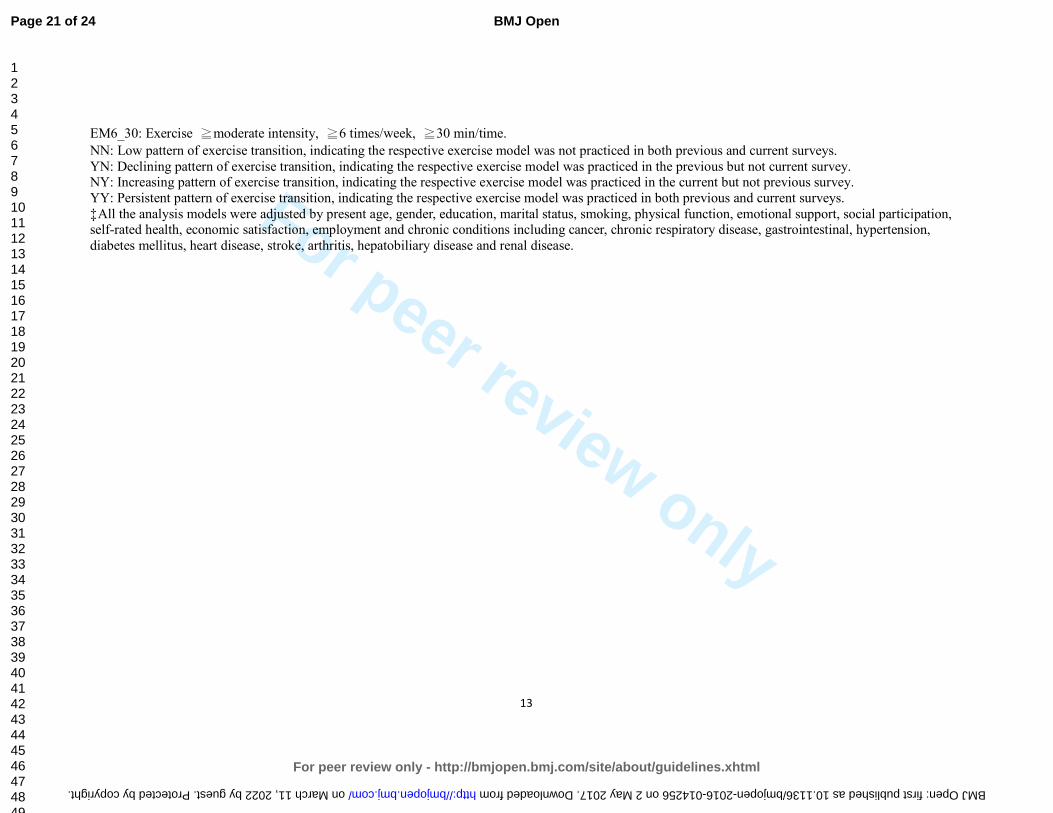
Table 3 shows the predictive effects of previous exercise models for HLDS. However,
none of the four exercise models in the previous survey could predict the present HLDS.
Namely, previous exercise behavior appeared to have no benefits on reducing depression,
regardless of amount or type of exercise. This may suggest that the effects of exercise on
depressive symptoms are only concurrent and short-term.
Thus, we conducted another test to examine the effect of changes in different exercise
models on depressive symptoms, as shown in Table 4. After controlling for other determining
factors and considering the interaction of time and transitional patterns of exercise, the results
indicated that only persistent patterns of exercise transitions (pattern YY) reveal a significant
protective effect from HLDS, regardless of exercise model (OR=0.58, 0.56, 0.67, 0.62,
respectively, all p<0.05). Namely, even the lower amount of exercise (EM3_15) may have
Page 8 of 24
For peer review only - http://bmjopen.bmj.com/site/about/guidelines.xhtml
BMJ Open
123456789101112131415161718192021222324252627282930313233343536373839404142434445464748495051525354555657585960
on March 11, 2022 by guest. P
rotected by copyright.http://bm
jopen.bmj.com
/B
MJ O
pen: first published as 10.1136/bmjopen-2016-014256 on 2 M
ay 2017. Dow
nloaded from
For peer review only
8
protective effects on depression as long as the older adults continuously reach moderate
intensity at least 15 minutes with a frequency of no less than three times a week.
DISCUSSION
Very limited research has been conducted to determine the long-term effects of different
exercise models on depressive symptoms in the elderly. This study shows that different
transitional patterns of exercise are significantly associated with HLDS outcomes. The
persistent patterns of exercise transitions (pattern YY) revealed a significant protective effect
from HLDS, regardless of the exercise model. The concordant associations between
transitional patterns of respective exercise models and depressive symptoms may suggest a
changing influence of exercise on depression over time.
Furthermore, this study shows that persistent low-volume exercise, i.e. ≥15 min of
moderate intensity exercise (EM3_15 and EM6_15), can provide preventive effects on
depressive symptoms, similar to the benefits of high-volume exercise, i.e. ≥30 min of
moderate intensity exercise (EM3_30 and EM6_30), for older adults. These findings suggest
a shorter, age-friendly exercise model may benefit older adults physically and
psychologically.
One study suggested that frequency of exercise may be important for depressive
symptoms.26
Our study revealed that consistency may be the key factor when the frequencies
of exercise with moderate intensity are different. Both exercise frequencies of ≥3 times/week
or ≥6 times/week with respective durations each time showed significantly negative
association for HLDS in this study. These results indicate the importance of the consistency
of exercise.
Another study using the Taiwanese national survey suggested promoting high intensity,
rather than frequent or long duration exercise, to improve mental well-being in older adults,27
which seems to be not completely compatible with our findings. However, the nature of the
cross-sectional study design of that study may have caused it to have a higher possibility of
over-interpreting the results. Less depressed people may be more likely to engage in higher
intensity exercise as compared to more depressed people. Our longitudinal study suggests
that a low amount of exercise also has benefits related to preventing depressive symptoms.
Furthermore, transitional patterns of exercise may be more important than the current
exercise models that people are practicing.
Physical inactivity was found to be among the top 10 leading risk factors for global
Page 9 of 24
For peer review only - http://bmjopen.bmj.com/site/about/guidelines.xhtml
BMJ Open
123456789101112131415161718192021222324252627282930313233343536373839404142434445464748495051525354555657585960
on March 11, 2022 by guest. P
rotected by copyright.http://bm
jopen.bmj.com
/B
MJ O
pen: first published as 10.1136/bmjopen-2016-014256 on 2 M
ay 2017. Dow
nloaded from

For peer review only
9
disease burden in 2010.28
It is important to promote exercise especially among older adults,
who are more vulnerable to physical and psychological dysfunction. The general
recommendation for older adults is moderate intensity exercise accumulated at least 30 min
each day for at least 5 days a week to total 150-300 min/week, or vigorous intensity exercise
at least 20-30 min per day for 3-5 days per week to total 75-100 min/week.18
However, East
Asians usually engage in fewer physical activities at lower intensity than people in western
countries.29-30
In consideration of physical conditions, it would be helpful to find out the
minimal volume of exercise for older adults required to improve their health.
This study showed that the percentage of participants who engaged in exercise model
EM6_15 was higher than that of EM3_30 and EM6_30, which indicates that lower intensity,
higher frequency exercise may be more acceptable to older people than higher intensity
exercise with a lower frequency. Furthermore, the low-volume exercise model has been
shown to have the benefits related to reducing all-cause mortality and all-cancer mortality.19,
31 Therefore, with the findings of our study, we are confident to conclude that persistent
low-amount exercise with the same moderate intensity (at least ≥15 min/ 6 times/ week) may
also benefit older adults both physically and psychologically.
Because of the social stigma of depressive symptoms, many people with this condition
tend to remain under-treated. When unable to appropriately address the causes or when there
is no access to adequate non-medical or community services to treat depression, patients may
become further burdened due to a lack of solutions for specific conditions.32
Our study
provides a practical and non-medical option to prevent people from HLDS. Most importantly,
it will help reduce the unnecessary use of medication, which sometimes causes adverse drug
reactions in older adults, and it may also help people when they lack awareness of their
disorder or are reluctant to be treated.
Still, there are several other factors affecting depressive symptoms. Depression is
significantly associated with chronic medical conditions, problems with ADLs, poor social
support, and previous depressive conditions.7, 33-34
Functional limitation and arthritis are the
strong risk factors in chronic conditions for depression.35
In our study, physical function,
emotional support, self-rated health, and economic satisfaction have always been shown to
significantly influence HLDS in all analyses. However, among the above-mentioned factors,
exercise is the more changeable variable, which could also benefit physical function and
self-rated health.
The advantages of this study include the fact that it had a nationally representative
sample, a longitudinal cohort design, a test of different exercise models, an examination of
Page 10 of 24
For peer review only - http://bmjopen.bmj.com/site/about/guidelines.xhtml
BMJ Open
123456789101112131415161718192021222324252627282930313233343536373839404142434445464748495051525354555657585960
on March 11, 2022 by guest. P
rotected by copyright.http://bm
jopen.bmj.com
/B
MJ O
pen: first published as 10.1136/bmjopen-2016-014256 on 2 M
ay 2017. Dow
nloaded from

For peer review only
10
the changes in exercise status over time, and a proper consideration of statistical analysis
methods. Nonetheless, the study has some limitations. Firstly, the observation for the
outcome event was performed the same time as the second visit to develop the variables for
transitional patterns of exercise, which may have reduced the interpretation of a causal
relationship if the association between current exercise and the outcome event is too strong.
However, if the assumption is true, the bias will support the null hypothesis. The results
indicate that the significantly protective effects of a persistent pattern of exercise transitions
are consistent across all of the exercise models. The increasing exercise model did not have
the same finding although both models indicated that the subjects had practiced the respective
exercises on their second visit. We are therefore comfortable to infer that a persistent pattern
of exercise transitions has more influence than increasing and other transitional patterns of
exercise. Secondly, the effects of different variables for HLDS may be altered for different
cohorts because of changes in medicine, nutrition or in the environment. This may limit the
application of the findings of this study. Lastly, activities of daily living (ADL) was not
included in the analysis, which may include those who cannot perform exercise. We used
physical function ability, which has shown to be hierarchically associated with instrumental
and basic ADL25
to control the differences related to mobility limitation.
CONCLUSION
A consistent exercise with 15-min moderate intensity and a frequency of no less than 3
times a week is significantly associated with lower risk of depressive symptoms. Increasing
the frequency to more than 5 times per week will benefit older adults both physically and
psychologically. We recommend taking this low amount of exercise model into core
consideration when designing exercise programs related to older adults.
Page 11 of 24
For peer review only - http://bmjopen.bmj.com/site/about/guidelines.xhtml
BMJ Open
123456789101112131415161718192021222324252627282930313233343536373839404142434445464748495051525354555657585960
on March 11, 2022 by guest. P
rotected by copyright.http://bm
jopen.bmj.com
/B
MJ O
pen: first published as 10.1136/bmjopen-2016-014256 on 2 M
ay 2017. Dow
nloaded from

For peer review only
11
Acknowledgements
We would like to thank the Health Promotion Administration, Ministry of Health and
Welfare of Taiwan for providing the dataset for analysis.
Contributors
Y-CC and M-CL designed and conducted the study, and wrote the daft; I-HH analyzed
the data and interpreted the tables; W-CW involved literature review and revised the draft;
SCH advised the whole study and completed the manuscript. All authors contributed to the
interpretation of results, critically reviewed the draft, and approved the final manuscript.
Funding
This study was supported by Research Center for Humanities and Social Sciences,
National Cheng Kung University, (H10-A304, FD101037).
Competing interests
None declared.
Ethical approval
This study was approved by the Institutional Ethics Committee of Chia-Yi Christian
Hospital (registry number 104040).
Provenance and peer review
Not commissioned; externally peer reviewed.
Data sharing statement
No additional data are available.
Page 12 of 24
For peer review only - http://bmjopen.bmj.com/site/about/guidelines.xhtml
BMJ Open
123456789101112131415161718192021222324252627282930313233343536373839404142434445464748495051525354555657585960
on March 11, 2022 by guest. P
rotected by copyright.http://bm
jopen.bmj.com
/B
MJ O
pen: first published as 10.1136/bmjopen-2016-014256 on 2 M
ay 2017. Dow
nloaded from
For peer review only
12
References
1. Laborde‐Lahoz P, El‐Gabalawy R, Kinley J, et al. Subsyndromal depression among
older adults in the USA: prevalence, comorbidity, and risk for new‐onset psychiatric
disorders in late life. Int J Geriatr Psychiatry 2015;30:677-85.
2. Chong MY, Tsang HY, Chen CS, et al. Community study of depression in old age in
Taiwan: prevalence, life events and socio-demographic correlates. Br J Psychiatry
2001;178:29-35.
3. Global Burden of Disease Study C. Global, regional, and national incidence, prevalence,
and years lived with disability for 301 acute and chronic diseases and injuries in 188
countries, 1990-2013: a systematic analysis for the Global Burden of Disease Study
2013. Lancet 2015;386:743-800.
4. Chang YC, Yao G, Hu SC, et al. Depression Affects the Scores of All Facets of the
WHOQOL-BREF and May Mediate the Effects of Physical Disability among
Community-Dwelling Older Adults. PLoS One 2015;10:e0128356.
5. Webb E, Blane D, McMunn A, et al. Proximal predictors of change in quality of life at
older ages. J Epidemiol Community Health 2011;65:542-7.
6. Garin N, Olaya B, Moneta MV, et al. Impact of multimorbidity on disability and quality
of life in the Spanish older population. PLoS One 2014;9:e111498.
7. Schoevers RA, Beekman AT, Deeg DJ, et al. Risk factors for depression in later life;
results of a prospective community based study (AMSTEL). J Affect Disord
2000;59:127-37.
8. Veerman JL, Shrestha RN, Mihalopoulos C, et al. Depression prevention, labour force
participation and income of older working aged Australians: A microsimulation
economic analysis. Aust N Z J Psychiatry 2015;49:430-6.
9. Lee SY, Franchetti MK, Imanbayev A, et al. Non-pharmacological prevention of major
depression among community-dwelling older adults: a systematic review of the efficacy
of psychotherapy interventions. Arch Gerontol Geriatr 2012;55:522-9.
10. Forsman AK, Schierenbeck I, Wahlbeck K. Psychosocial interventions for the
prevention of depression in older adults: systematic review and meta-analysis. J Aging
Health 2011;23:387-416.
11. Stahl ST, Albert SM, Dew MA, et al. Coaching in healthy dietary practices in at-risk
older adults: a case of indicated depression prevention. Am J Psychiatry
2014;171:499-505.
Page 13 of 24
For peer review only - http://bmjopen.bmj.com/site/about/guidelines.xhtml
BMJ Open
123456789101112131415161718192021222324252627282930313233343536373839404142434445464748495051525354555657585960
on March 11, 2022 by guest. P
rotected by copyright.http://bm
jopen.bmj.com
/B
MJ O
pen: first published as 10.1136/bmjopen-2016-014256 on 2 M
ay 2017. Dow
nloaded from

For peer review only
13
12. Tipton CM. The history of "Exercise Is Medicine" in ancient civilizations. Adv Physiol
Educ 2014;38:109-17.
13. Rethorst CD, Wipfli BM, Landers DM. The antidepressive effects of exercise: a
meta-analysis of randomized trials. Sports Med 2009;39:491-511.
14. Brenes GA, Williamson JD, Messier SP, et al. Treatment of minor depression in older
adults: a pilot study comparing sertraline and exercise. Aging Ment Health 2007;11:61-8.
15. Cooney GM, Dwan K, Greig CA, et al. Exercise for depression. Cochrane Database
Syst Rev 2013;9:CD004366.
16. Walker JG, Mackinnon AJ, Batterham P, et al. Mental health literacy, folic acid and
vitamin B12, and physical activity for the prevention of depression in older adults:
randomised controlled trial. Br J Psychiatry 2010;197:45-54.
17. Rhyner KT, Watts A. Exercise and Depressive Symptoms in Older Adults: A Systematic
Meta-Analytic Review. J Aging Phys Act 2016;24:234-246.
18. Pescatello LS. ACSM's Guidelines for Exercise Testing and Prescription. 9th Edition,
edited by American College of Sports Medicine; 2013.
19. Wen CP, Wai JP, Tsai MK, et al. Minimum amount of physical activity for reduced
mortality and extended life expectancy: a prospective cohort study. Lancet
2011;378:1244-53.
20. Radloff LS. The CES-D scale: a self-reported depression scale for research in the
general population. Appl Psychol Meas 1977;I:385-401.
21. Kohout FJ, Berkman LF, Evans DA,et al. Two shorter forms of the CES-D (Center for
Epidemiological Studies Depression) depression symptoms index. J Aging Health
1993;5:179-93.
22. Bjorgvinsson T, Kertz SJ, Bigda-Peyton JS,et al. Psychometric properties of the
CES-D-10 in a psychiatric sample. Assessment 2013;20:429-36.
23. Lyness JM, Chapman BP, McGriff J,et al. One-year outcomes of minor and
subsyndromal depression in older primary care patients. Int Psychogeriatr 2009;21:60-8.
24. Chang YC, Ouyang WC, Lu MC,et al. Levels of depressive symptoms may modify the
relationship between the WHOQOL-BREF and its determining factors in
community-dwelling older adults. Int Psychogeriatr 2016;28:591-601.
25. Chen HY, Wang CY, Lee MY,et al. A hierarchical categorisation of tasks in mobility
disability. Disabil Rehabil 2010;32:1586-93.
26. Ku PW, Fox KR, Chen LJ, et al. Physical activity and depressive symptoms in older
adults: 11-year follow-up. Am J Prev Med 2012;42:355-62.
Page 14 of 24
For peer review only - http://bmjopen.bmj.com/site/about/guidelines.xhtml
BMJ Open
123456789101112131415161718192021222324252627282930313233343536373839404142434445464748495051525354555657585960
on March 11, 2022 by guest. P
rotected by copyright.http://bm
jopen.bmj.com
/B
MJ O
pen: first published as 10.1136/bmjopen-2016-014256 on 2 M
ay 2017. Dow
nloaded from

For peer review only
14
27. Chen LJ, Stevinson C, Ku PW, et al. Relationships of leisure-time and non-leisure-time
physical activity with depressive symptoms: a population-based study of Taiwanese
older adults. Int J Behav Nutr Phys Act 2012;9:28.
28. Lim SS, Vos T, Flaxman AD, et al. A comparative risk assessment of burden of disease
and injury attributable to 67 risk factors and risk factor clusters in 21 regions, 1990-2010:
a systematic analysis for the Global Burden of Disease Study 2010. Lancet
2012;380:2224-60.
29. Ku PW, Fox KR, McKenna J, et al. Prevalence of leisure-time physical activity in
Taiwanese adults: results of four national surveys, 2000-2004. Prev Med 2006;43:454-7.
30. Wai JP, Wen CP, Chan HT, et al. Assessing physical activity in an Asian country: low
energy expenditure and exercise frequency among adults in Taiwan. Asia Pac J Clin
Nutr 2008;17:297-308.
31. Hubbard RE, Fallah N, Searle SD, et al. Impact of exercise in community-dwelling older
adults. PLoS One 2009;4:e6174.
32. Bird MJ, Parslow RA. Potential for community programs to prevent depression in older
people. Med J Aust 2002;177 Suppl:S107-10.
33. Schoevers RA, Geerlings MI, Beekman AT, et al. Association of depression and gender
with mortality in old age. Results from the Amsterdam Study of the Elderly (AMSTEL).
Br J Psychiatry 2000;177:336-42.
34. Roberts RE, Kaplan GA, Shema SJ, et al. Does growing old increase the risk for
depression? Am J Psychiatry 1997;154:1384-90.
35. Dunlop DD, Lyons JS, Manheim LM, et al. Arthritis and heart disease as risk factors for
major depression: the role of functional limitation. Med Care 2004;42:502-11.
Page 15 of 24
For peer review only - http://bmjopen.bmj.com/site/about/guidelines.xhtml
BMJ Open
123456789101112131415161718192021222324252627282930313233343536373839404142434445464748495051525354555657585960
on March 11, 2022 by guest. P
rotected by copyright.http://bm
jopen.bmj.com
/B
MJ O
pen: first published as 10.1136/bmjopen-2016-014256 on 2 M
ay 2017. Dow
nloaded from

For peer review only
15
Table 1 Characteristics of the participants from 1999 to 2007
Variables
1999 2003 2007
N=2673 N=1889 N=1361
n (%) n (%) n (%)
Age 74.2 ± 5.7 77.1 ± 5.1 80.2 ± 4.7
Male 1456 (54.5) 1019 (53.9) 703 (51.7)
Level of depressive symptoms
NDS 1401 (52.5) 1049 (55.5) 708 (52.0)
LLDS 646 (24.2) 388 (20.5) 321 (23.6)
HLDS 624 (23.4) 452 (23.9) 332 (24.4)
M±SD 6.1 ± 6.4 5.7 ± 5.9 5.8 ± 6.1
Exercise models*
EM3_15 1032 (38.6) 810 (42.9) 562 (41.3)
EM3_30 859 (32.1) 671 (35.5) 450 (33.1)
EM6_15 922 (34.5) 742 (39.3) 498 (36.6)
EM6_30 749 (28.0) 603 (31.9) 386 (28.4)
Education
No 1111 (41.6) 733 (38.8) 507 (37.3)
Elementary 983 (36.8) 723 (38.3) 515 (37.8)
Junior high school 273 (10.2) 200 (10.6) 155 (11.4)
Senior high school 162 (6.1) 124 (6.6) 96 (7.1)
College and above 143 (5.4) 109 (5.8) 88 (6.5)
Married 1630 (61.0) 1096 (58.0) 727 (53.4)
Employment 322 (12.1) 142 (7.5) 84 (6.2)
Current smoking 595 (22.3) 344 (18.2) 189 (13.9)
Physical function 17.2 ± 4.8 16.2 ± 5.0 16.0 ± 5.1
Emotional support 18.1 ± 3.0 18.0 ± 2.9 18.4 ± 2.7
Social participation 1369 (51.2) 842 (44.6) 576 (42.3)
Self-rated health
Poor 934 (34.9) 707 (37.4) 481 (35.3)
Fair 927 (34.7) 583 (30.9) 531 (39.0)
Good 812 (30.4) 599 (31.7) 349 (25.6)
Economic satisfaction
Dissatisfied 544 (20.4) 407 (21.6) 271 (19.9)
Fair 1144 (42.9) 653 (34.6) 486 (35.7)
Satisfied 978 (36.7) 828 (43.9) 604 (44.4)
Chronic conditions
Page 16 of 24
For peer review only - http://bmjopen.bmj.com/site/about/guidelines.xhtml
BMJ Open
123456789101112131415161718192021222324252627282930313233343536373839404142434445464748495051525354555657585960
on March 11, 2022 by guest. P
rotected by copyright.http://bm
jopen.bmj.com
/B
MJ O
pen: first published as 10.1136/bmjopen-2016-014256 on 2 M
ay 2017. Dow
nloaded from

For peer review only
16
Cancer 71 (2.7) 61 (3.2) 54 (4.0)
Chronic respiratory disease 370 (13.8) 256 (13.6) 179 (13.2)
Gastrointestinal 543 (20.3) 402 (21.3) 301 (22.1)
Hypertension 1002 (37.5) 829 (43.9) 672 (49.4)
Diabetes mellitus 408 (15.3) 319 (16.9) 235 (17.3)
Heart disease 576 (21.6) 469 (24.8) 373 (27.4)
Stroke 144 (5.4) 126 (6.7) 83 (6.1)
Arthritis 594 (22.2) 465 (24.6) 322 (23.7)
Hepatobiliary disease 191 (7.2) 158 (8.4) 116 (8.5)
Renal disease 217 (8.1) 192 (10.2) 139 (10.2)
Data were presented as mean ± SD or n (%).
NDS: No Depressive Symptom (CESD=0);
LLDS: Lower Level of Depressive Symptoms (0<CESD≦9);
HLDS: Higher Level of Depressive Symptoms (CESD≧10);
CESD: Center for Epidemiologic Studies of Depression;
*EM3_15: Exercise ≧moderate intensity, ≧3 times/week, ≧15 min/time;
EM3_30: Exercise ≧moderate intensity, ≧3 times/week, ≧30 min/time;
EM6_15: Exercise ≧moderate intensity, ≧6 times/week, ≧15 min/time;
EM6_30: Exercise ≧moderate intensity, ≧6 times/week, ≧30 min/time.
Page 17 of 24
For peer review only - http://bmjopen.bmj.com/site/about/guidelines.xhtml
BMJ Open
123456789101112131415161718192021222324252627282930313233343536373839404142434445464748495051525354555657585960
on March 11, 2022 by guest. P
rotected by copyright.http://bm
jopen.bmj.com
/B
MJ O
pen: first published as 10.1136/bmjopen-2016-014256 on 2 M
ay 2017. Dow
nloaded from

For peer review only
10
Table 2 Odds ratios of HLDS according to the current exercise models estimated by
GLMM ‡
Variables HLDS
OR (95% CI) p-value
Exercise models
EM3_15 1.14 (0.92-1.42) 0.24
EM3_30 0.86 (0.59-1.25) 0.42
EM6_15 0.86 (0.65-1.13) 0.27
EM6_30 0.80 (0.66-0.95) 0.01
Previous level of depressive symptoms
NDS ref
LLDS 1.83 (1.48-2.28) <0.001
HLDS 3.04 (2.39-3.85) <0.001
Physical function 0.92 (0.90-0.93) <0.001
Emotional support 0.86 (0.84-0.88) <0.001
Self-rated health
Poor ref
Fair 0.52 (0.44-0.61) <0.001
Good 0.29 (0.23-0.36) <0.001
Economic satisfaction
Dissatisfied ref
Fair 0.51 (0.43-0.60) <0.001
Satisfied 0.33 (0.27-0.40) <0.001
OR: odds ratio; CI: confidence interval.
HLDS: Higher Level of Depressive Symptoms (CESD≧10);
GLMM: generalized linear mixed models
EM3_15: Exercise ≧moderate intensity, ≧3 times/week, ≧15 min/time;
EM3_30: Exercise ≧moderate intensity, ≧3 times/week, ≧30 min/time;
EM6_15: Exercise ≧moderate intensity, ≧6 times/week, ≧15 min/time;
EM6_30: Exercise ≧moderate intensity, ≧6 times/week, ≧30 min/time.
‡All the analysis models were adjusted by the present age, gender, education, marital status, smoking,
social participation, and chronic conditions including cancer, chronic respiratory disease,
gastrointestinal, hypertension, diabetes mellitus, heart disease, stroke, arthritis, hepatobiliary disease
and renal disease.
Page 18 of 24
For peer review only - http://bmjopen.bmj.com/site/about/guidelines.xhtml
BMJ Open
123456789101112131415161718192021222324252627282930313233343536373839404142434445464748495051525354555657585960
on March 11, 2022 by guest. P
rotected by copyright.http://bm
jopen.bmj.com
/B
MJ O
pen: first published as 10.1136/bmjopen-2016-014256 on 2 M
ay 2017. Dow
nloaded from
For peer review only
11
Table 3 Odds ratios of HLDS according to the previous exercise models estimated by
GLMM‡
Variables HLDS
OR (95% CI) p-value
Previous Exercise models
EM3_15 0.88 (0.72-1.06) 0.17
EM3_30 1.05 (0.76-1.46) 0.77
EM6_15 0.98 (0.79-1.23) 0.89
EM6_30 0.68 (0.44-1.07) 0.10
Previous level of depressive symptoms
NDS ref
LLDS 1.86 (1.50-2.31) <0.001
HLDS 3.12 (2.46-3.96) <0.001
Physical function 0.92 (0.90-0.93) <0.001
Emotional support 0.86 (0.84-0.88) <0.001
Self-rated health
Poor ref
Fair 0.52 (0.44-0.60) <0.001
Good 0.28 (0.23-0.35) <0.001
Economic satisfaction
Dissatisfied ref
Fair 0.51 (0.43-0.60) <0.001
Satisfied 0.33 (0.27-0.40) <0.001
OR: odds ratio; CI: confidence interval.
HLDS: Higher Level of Depressive Symptoms (CESD≧10);
GLMM: generalized linear mixed models
EM3_15: Exercise ≧moderate intensity, ≧3 times/week, ≧15min/time;
EM3_30: Exercise ≧moderate intensity, ≧3 times/week, ≧30min/time;
EM6_15: Exercise ≧moderate intensity, ≧6 times/week, ≧15min/time;
EM6_30: Exercise ≧moderate intensity, ≧6 times/week, ≧30min/time.
‡All the analysis models were adjusted by the present age, gender, education, marital status, smoking, social participation, and chronic conditions including cancer, chronic respiratory disease,
gastrointestinal, hypertension, diabetes mellitus, heart disease, stroke, arthritis, hepatobiliary disease
and renal disease.
Page 19 of 24
For peer review only - http://bmjopen.bmj.com/site/about/guidelines.xhtml
BMJ Open
123456789101112131415161718192021222324252627282930313233343536373839404142434445464748495051525354555657585960
on March 11, 2022 by guest. P
rotected by copyright.http://bm
jopen.bmj.com
/B
MJ O
pen: first published as 10.1136/bmjopen-2016-014256 on 2 M
ay 2017. Dow
nloaded from

For peer review only
12
Table 4 Odds ratios of HLDS under the consideration of the interaction of time and exercise transition‡
Variables
Model 1
(EM3_15)
Model 2
(EM3_30)
Model 3
(EM6_15)
Model 4
(EM6_30)
OR (95% CI) P OR (95% CI) P OR (95% CI) P OR (95% CI) P
Exercise transitions
NN ref ref ref ref
YN 0.77 (0.54-1.11) 0.16 0.86 (0.60-1.25) 0.43 0.76 (0.53-1.09) 0.14 0.92 (0.64-1.34) 0.68
NY 0.79 (0.54-1.16) 0.24 0.78 (0.52-1.17) 0.23 0.68 (0.45-1.01) 0.06 0.71 (0.46-1.10) 0.12
YY 0.58 (0.40-0.85) 0.01 0.56 (0.36-0.88) 0.01 0.67 (0.45-1.00) 0.048 0.62 (0.38-0.99) 0.047
Previous CESD
NDS ref ref ref ref
LLDS 1.82 (1.43-2.33) <0.001 1.81 (1.42-2.31) <0.001 1.82 (1.42-2.32) <0.001 1.81 (1.42-2.31) <0.001
HLDS 3.23 (2.47-4.23) <0.001 3.20 (2.45-4.18) <0.001 3.23 (2.47-4.22) <0.001 3.20 (2.45-4.19) <0.001
Time slope 0.95 (0.92-0.99) 0.01 0.97 (0.94-1.00) 0.08 0.96 (0.92-0.99) 0.01 0.98 (0.94-1.01) 0.14
Time x exercise transitions
NN ref ref ref ref
YN 1.12 (1.05-1.20) <0.01 1.07 (1.00-1.15) 0.04 1.12 (1.05-1.20) <0.01 1.06 (0.99-1.14) 0.07
NY 1.01 (0.93-1.09) 0.79 0.99 (0.91-1.08) 0.84 1.02 (0.94-1.10) 0.69 0.98 (0.90-1.07) 0.68
YY 1.11 (1.03-1.18) <0.01 1.09 (1.01-1.17) 0.04 1.09 (1.01-1.17) 0.02 1.07 (0.99-1.17) 0.10
OR: odds ratio; CI: confidence interval.
HLDS: Higher Level of Depressive Symptoms (CESD≧10);
GLMM: generalized linear mixed models
EM3_15: Exercise ≧moderate intensity, ≧3 times/week, ≧15 min/time;
EM3_30: Exercise ≧moderate intensity, ≧3 times/week, ≧30 min/time;
EM6_15: Exercise ≧moderate intensity, ≧6 times/week, ≧15 min/time;
Page 20 of 24
For peer review only - http://bmjopen.bmj.com/site/about/guidelines.xhtml
BMJ Open
123456789101112131415161718192021222324252627282930313233343536373839404142434445464748495051525354555657585960
on March 11, 2022 by guest. Protected by copyright. http://bmjopen.bmj.com/ BMJ Open: first published as 10.1136/bmjopen-2016-014256 on 2 May 2017. Downloaded from
For peer review only
13
EM6_30: Exercise ≧moderate intensity, ≧6 times/week, ≧30 min/time.
NN: Low pattern of exercise transition, indicating the respective exercise model was not practiced in both previous and current surveys.
YN: Declining pattern of exercise transition, indicating the respective exercise model was practiced in the previous but not current survey. NY: Increasing pattern of exercise transition, indicating the respective exercise model was practiced in the current but not previous survey.
YY: Persistent pattern of exercise transition, indicating the respective exercise model was practiced in both previous and current surveys.
‡All the analysis models were adjusted by present age, gender, education, marital status, smoking, physical function, emotional support, social participation, self-rated health, economic satisfaction, employment and chronic conditions including cancer, chronic respiratory disease, gastrointestinal, hypertension,
diabetes mellitus, heart disease, stroke, arthritis, hepatobiliary disease and renal disease.
Page 21 of 24
For peer review only - http://bmjopen.bmj.com/site/about/guidelines.xhtml
BMJ Open
123456789101112131415161718192021222324252627282930313233343536373839404142434445464748495051525354555657585960
on March 11, 2022 by guest. Protected by copyright. http://bmjopen.bmj.com/ BMJ Open: first published as 10.1136/bmjopen-2016-014256 on 2 May 2017. Downloaded from

For peer review only
210x297mm (300 x 300 DPI)
Page 22 of 24
For peer review only - http://bmjopen.bmj.com/site/about/guidelines.xhtml
BMJ Open
123456789101112131415161718192021222324252627282930313233343536373839404142434445464748495051525354555657585960
on March 11, 2022 by guest. P
rotected by copyright.http://bm
jopen.bmj.com
/B
MJ O
pen: first published as 10.1136/bmjopen-2016-014256 on 2 M
ay 2017. Dow
nloaded from

For peer review only
1
STROBE Statement—checklist of items that should be included in reports of observational studies
Item
No Recommendation
Title and abstract 1 (a) Indicate the study’s design with a commonly used term in the title or the abstract
(b) Provide in the abstract an informative and balanced summary of what was done
and what was found
Introduction
Background/rationale 2 Explain the scientific background and rationale for the investigation being reported
Objectives 3 State specific objectives, including any prespecified hypotheses
Methods
Study design 4 Present key elements of study design early in the paper
Setting 5 Describe the setting, locations, and relevant dates, including periods of recruitment,
exposure, follow-up, and data collection
Participants 6 (a) Cohort study—Give the eligibility criteria, and the sources and methods of
selection of participants. Describe methods of follow-up
Case-control study—Give the eligibility criteria, and the sources and methods of
case ascertainment and control selection. Give the rationale for the choice of cases
and controls
Cross-sectional study—Give the eligibility criteria, and the sources and methods of
selection of participants
(b) Cohort study—For matched studies, give matching criteria and number of
exposed and unexposed
Case-control study—For matched studies, give matching criteria and the number of
controls per case
Variables 7 Clearly define all outcomes, exposures, predictors, potential confounders, and effect
modifiers. Give diagnostic criteria, if applicable
Data sources/
measurement
8* For each variable of interest, give sources of data and details of methods of
assessment (measurement). Describe comparability of assessment methods if there
is more than one group
Bias 9 Describe any efforts to address potential sources of bias
Study size 10 Explain how the study size was arrived at
Quantitative variables 11 Explain how quantitative variables were handled in the analyses. If applicable,
describe which groupings were chosen and why
Statistical methods 12 (a) Describe all statistical methods, including those used to control for confounding
(b) Describe any methods used to examine subgroups and interactions
(c) Explain how missing data were addressed
(d) Cohort study—If applicable, explain how loss to follow-up was addressed
Case-control study—If applicable, explain how matching of cases and controls was
addressed
Cross-sectional study—If applicable, describe analytical methods taking account of
sampling strategy
(e) Describe any sensitivity analyses
Continued on next page
Page 23 of 24
For peer review only - http://bmjopen.bmj.com/site/about/guidelines.xhtml
BMJ Open
123456789101112131415161718192021222324252627282930313233343536373839404142434445464748495051525354555657585960
on March 11, 2022 by guest. P
rotected by copyright.http://bm
jopen.bmj.com
/B
MJ O
pen: first published as 10.1136/bmjopen-2016-014256 on 2 M
ay 2017. Dow
nloaded from

For peer review only
2
Results
Participants 13* (a) Report numbers of individuals at each stage of study—eg numbers potentially eligible,
examined for eligibility, confirmed eligible, included in the study, completing follow-up, and
analysed
(b) Give reasons for non-participation at each stage
(c) Consider use of a flow diagram
Descriptive
data
14* (a) Give characteristics of study participants (eg demographic, clinical, social) and information
on exposures and potential confounders
(b) Indicate number of participants with missing data for each variable of interest
(c) Cohort study—Summarise follow-up time (eg, average and total amount)
Outcome data 15* Cohort study—Report numbers of outcome events or summary measures over time
Case-control study—Report numbers in each exposure category, or summary measures of
exposure
Cross-sectional study—Report numbers of outcome events or summary measures
Main results 16 (a) Give unadjusted estimates and, if applicable, confounder-adjusted estimates and their
precision (eg, 95% confidence interval). Make clear which confounders were adjusted for and
why they were included
(b) Report category boundaries when continuous variables were categorized
(c) If relevant, consider translating estimates of relative risk into absolute risk for a meaningful
time period
Other analyses 17 Report other analyses done—eg analyses of subgroups and interactions, and sensitivity
analyses
Discussion
Key results 18 Summarise key results with reference to study objectives
Limitations 19 Discuss limitations of the study, taking into account sources of potential bias or imprecision.
Discuss both direction and magnitude of any potential bias
Interpretation 20 Give a cautious overall interpretation of results considering objectives, limitations, multiplicity
of analyses, results from similar studies, and other relevant evidence
Generalisability 21 Discuss the generalisability (external validity) of the study results
Other information
Funding 22 Give the source of funding and the role of the funders for the present study and, if applicable,
for the original study on which the present article is based
*Give information separately for cases and controls in case-control studies and, if applicable, for exposed and
unexposed groups in cohort and cross-sectional studies.
Note: An Explanation and Elaboration article discusses each checklist item and gives methodological background and
published examples of transparent reporting. The STROBE checklist is best used in conjunction with this article (freely
available on the Web sites of PLoS Medicine at http://www.plosmedicine.org/, Annals of Internal Medicine at
http://www.annals.org/, and Epidemiology at http://www.epidem.com/). Information on the STROBE Initiative is
available at www.strobe-statement.org.
Page 24 of 24
For peer review only - http://bmjopen.bmj.com/site/about/guidelines.xhtml
BMJ Open
123456789101112131415161718192021222324252627282930313233343536373839404142434445464748495051525354555657585960
on March 11, 2022 by guest. P
rotected by copyright.http://bm
jopen.bmj.com
/B
MJ O
pen: first published as 10.1136/bmjopen-2016-014256 on 2 M
ay 2017. Dow
nloaded from

For peer review only
Impacts of different amount of exercise on depressive symptoms in community-dwelling older adults: a
longitudinal cohort study
Journal: BMJ Open
Manuscript ID bmjopen-2016-014256.R1
Article Type: Research
Date Submitted by the Author: 09-Dec-2016
Complete List of Authors: Chang, Yu-Chen ; Ditmanson Medical Foundation Chia-Yi Christian Hospital, Community Health Lu, Mei-Chun ; Kuang Tien General Hospital, Medical Research
Hu, I-Han; National Cheng Kung University College of Medicine, Institute of Gerontology Wu, Wan-Chi; National Cheng Kung University College of Medicine, Public Health Hu, Susan; National Cheng Kung University College of Medicine, Public Health
<b>Primary Subject Heading</b>:
Mental health
Secondary Subject Heading: Geriatric medicine, Epidemiology, Sports and exercise medicine
Keywords: EPIDEMIOLOGY, MENTAL HEALTH, Depression & mood disorders < PSYCHIATRY, SPORTS MEDICINE
For peer review only - http://bmjopen.bmj.com/site/about/guidelines.xhtml
BMJ Open on M
arch 11, 2022 by guest. Protected by copyright.
http://bmjopen.bm
j.com/
BM
J Open: first published as 10.1136/bm
jopen-2016-014256 on 2 May 2017. D
ownloaded from

For peer review only
Impacts of different amount of exercise on depressive symptoms in
community-dwelling older adults: a longitudinal cohort study
Yu-Chen Chang1, Mei-Chun Lu
2, I-Han Hu
3, Wan-Chi Ida Wu
4, Susan C. Hu
5*
1. Yu-Chen Chang, MD, PhD, Department of Community Health, Chia-Yi Christian
Hospital, Chia-Yi, Taiwan. [email protected]
2. Mei-Chun Lu, MS, Department of Medical Research, Kuang Tien General Hospital,
Taichung, Taiwan. [email protected]
3. I-Han Hu, MS, Institute of Gerontology, College of Medicine, National Cheng Kung
University. [email protected]
4. Wan-Chi Ida Wu, PhD, Department of Public Health, College of Medicine, National
Cheng Kung University, Tainan, Taiwan. [email protected]
5. Susan C. Hu, PhD, Department of Public Health, College of Medicine, National Cheng
Kung University, Tainan, Taiwan. [email protected]
*Corresponding author: Susan C. Hu, PhD
Dept. of Public Health, College of Medicine, National Cheng Kung University,
No.1, University Rd, Tainan, Taiwan, 70101
E-mail: [email protected]
Tel: +886-972-967800, Fax: +886-6-2359033
Running title: Exercise on depression
World count: Abstract 252, Text 3010
Number of figures: 1
Number of tables: 4
Page 1 of 26
For peer review only - http://bmjopen.bmj.com/site/about/guidelines.xhtml
BMJ Open
123456789101112131415161718192021222324252627282930313233343536373839404142434445464748495051525354555657585960
on March 11, 2022 by guest. P
rotected by copyright.http://bm
jopen.bmj.com
/B
MJ O
pen: first published as 10.1136/bmjopen-2016-014256 on 2 M
ay 2017. Dow
nloaded from

For peer review only
1
ABSTRACT
Objectives: to examine the impacts of four different types of exercise on depressive
symptoms in community-dwelling older adults.
Design: prospective cohort study.
Setting: a nationally representative sample, Taiwan.
Participants: Four waves of the survey “Taiwan Longitudinal Study on Aging (TLSA)” from
1996 to 2007 were used. A total of 2,673 older adults aged 65 and over were recruited.
Primary and secondary outcome measures: Depressive symptoms were measured using
the Center for Epidemiologic Studies Depression scale (CESD). Four different types of
exercise were examined, including (1) 3 times/week, 15 min/time; (2) 3 times/week, 30
min/time; (3) 6 times/week, 15 min/time; and (4) 6 times/week, 30 min/time. All exercise
types were required to have at least moderate intensity. The impacts of different types of
exercise on depressive symptoms were analyzed using generalized linear mixed models.
Results: More than one fifth of the elderly had depressive symptoms (CESD ≥10). About
38.6% of older adults met the lowest criteria of exercise type 1, and fewer (28.0%) met the
highest criteria of type 4. Only exercise type 4 in the current survey was initially related to
lower depressive symptoms (OR=0.8, 95%CI=0.66-0.95). However, after considering the
interaction between time and changes in the exercise patterns, we found that all persistent
exercise models, even if very low amount (3 times/week, 15 min/week), had significantly
preventive effects on depressive symptoms (OR=0.56~0.67).
Conclusion: A consistent exercise with 15-min moderate intensity and a frequency of no less
than 3 times a week is significantly associated with lower risk of depressive symptoms. This
exercise type may be easier to promote at the community and population level.
Trial registration: registry number 104040 of the Institutional Ethics Committee of Chia-Yi
Christian Hospital.
Keywords:
Exercise, depression, mental health, elderly, generalized linear mixed models, cohort study.
Page 2 of 26
For peer review only - http://bmjopen.bmj.com/site/about/guidelines.xhtml
BMJ Open
123456789101112131415161718192021222324252627282930313233343536373839404142434445464748495051525354555657585960
on March 11, 2022 by guest. P
rotected by copyright.http://bm
jopen.bmj.com
/B
MJ O
pen: first published as 10.1136/bmjopen-2016-014256 on 2 M
ay 2017. Dow
nloaded from

For peer review only
2
Strengths and limitations of this study
� This is the first report to examine the impacts of four different types of exercise, on
depressive symptoms in the elderly, according to different criteria.
� The strengths of this study include a nationally representative sample, a longitudinal
cohort design, an examination of the changes in exercise status over time, and a proper
consideration of statistical analysis methods.
� However, the effects of different variables for depression may be altered for different
cohorts because of changes in medicine, nutrition or in the environment.
� The outcome event was performed the same time as the second visit to develop the
change patterns of exercise, which may reduce the interpretation of a causal relationship.
Page 3 of 26
For peer review only - http://bmjopen.bmj.com/site/about/guidelines.xhtml
BMJ Open
123456789101112131415161718192021222324252627282930313233343536373839404142434445464748495051525354555657585960
on March 11, 2022 by guest. P
rotected by copyright.http://bm
jopen.bmj.com
/B
MJ O
pen: first published as 10.1136/bmjopen-2016-014256 on 2 M
ay 2017. Dow
nloaded from

For peer review only
3
INTRODUCTION
Late life depression is an important health issue in different ethnic groups, affecting
13.7% of the population in the US and 20% of Chinese older adults in Taiwan.1-2
Depressive
disorder has been indicated as the top ten causes of years lived with disability among 188
countries based on the Global Burden of Disease Study, 2013.3 It has also been closely linked
to quality of life among community-dwelling older adults in many studies.4-6
Several relevant interventions have been suggested for preventing or treating depression
besides medicine. For instance, having a marital partner or having good social support will
significantly reduce the impacts of disability from depression.7 Psychological intervention,
especially group-based, has been shown to have benefits in regard to both prevention and
economic effects.8-10
Six weeks of healthy dietary practice has also been helpful in reducing
depressive symptoms, and the benefits may be sustained for 2 years.11
However, as early as in ancient Greece, Hippocrates suggested his patients exercise to
treat the disease of consumption, and Galen further instructed patients to exercise to reduce
troublesome depression.12
Many mechanisms of anti-depressive effects of exercise were
summarized in Rethorst, Wipfli, and Landers’s study.13
For example, four mechanisms in
hippocampal neurogenesis can be potentially facilitated by exercise: increases in
B-endorphins, vascular endothelial growth factor, brain-derived neurotrophic factor and
serotonin. Thus, exercise is potentially an effective approach to treating or preventing
depression.
Little research has focused on the relationship between exercise and depressive
symptoms in the elderly. Among the limited number of studies, exercise seems to have
similar effects to some pharmacological treatments14
but some meta-analysis studies have
yielded inconsistent results.15-17
Also, exercise did not always show benefits related to
preventing or treating depression because many of the studies did not control for previous
levels of depressive symptoms, and only a few included a follow-up period of more than 2
years. Furthermore, since exercise status will change as people age, how the transitional
patterns of exercise in older adults affect depressive symptoms has yet to be studied.
In addition, for older adults, exercise programs need to consider the intensity and
duration. The general recommendation for exercise by the American College of Sports
Medicine is moderate intensity; exercise is engaged in at least 30 minutes per day at least 5
days a week to accumulate a total of 150-300 minutes per week, or vigorous intensity of at
least 20 minutes per day for 3-5 days per week to a total of 75-100 minutes/week.18
However,
Page 4 of 26
For peer review only - http://bmjopen.bmj.com/site/about/guidelines.xhtml
BMJ Open
123456789101112131415161718192021222324252627282930313233343536373839404142434445464748495051525354555657585960
on March 11, 2022 by guest. P
rotected by copyright.http://bm
jopen.bmj.com
/B
MJ O
pen: first published as 10.1136/bmjopen-2016-014256 on 2 M
ay 2017. Dow
nloaded from

For peer review only
4
a recent study by Wen et al. have indicated that a low amount of exercise, which refers to 15
minutes per day or 90 minutes per week at moderate intensity, has been proven beneficial in
reducing all-cause and all-cancer mortality.19
This result provides a more age-friendly
exercise model, which could be further explored in regard to its effects on depressive
symptoms in older adults.
Therefore, in this study, we use an 11-year cohort data from a population-based survey
to examine how different amount of exercise affect depressive symptoms in older adults. The
purposes of the study were: (1) to examine the impacts of four different types of exercise on
preventing depressive symptoms in older adults, using Taiwan as an example; and (2) to test
the effects of changes in exercise status during a period of time on depressive symptoms in
the elderly.
METHODS
Study design and participants
This is a longitudinal cohort study, using nationally representative data from the survey
“Taiwan Longitudinal Study on Aging, TLSA”. The TLSA survey was undertaken by a
collaborative project from the University of Michigan, USA and the Health Promotion
Administration, Ministry of Health and Welfare, Taiwan. There were six waves of surveys for
those aged 60 and over in 1989, 1993, 1996, 1999, 2003 and 2007. Supplemental cases who
were aged 50 and older were added to the cohort in 1996 and 2003. A three-stage
proportional-to-size probability sampling technique was used in the survey, and face-to-face
interviews were performed for each individual. The response rates in each wave were high,
ranging from 81.2% to 91.4%.
Since detailed exercise questionnaires were launched in 1996, we combined two cohorts
(cohort B aged 67+ and cohort A aged 50-66) in 1996 together as our study cohort. The
inclusion criteria was aged 65 and older; the exclusion criteria was those who did not
complete the relevant questionnaires, lived in institutions or answered by proxy. We used the
1999 survey as the baseline and followed them up to 2007. A total of 2,673 valid participants
was selected as the baseline and 5923 observations were counted.
Due to the significant effects of previous depressive symptoms and changes in exercise
behavior on depression, we thus put more retrospective data as control variables from the
1996 survey when analyzing the effects in 1999. Thus, the total number of observations in the
four-wave surveys was added up to 8,397. The flow chart of the valid sample size is shown in
Page 5 of 26
For peer review only - http://bmjopen.bmj.com/site/about/guidelines.xhtml
BMJ Open
123456789101112131415161718192021222324252627282930313233343536373839404142434445464748495051525354555657585960
on March 11, 2022 by guest. P
rotected by copyright.http://bm
jopen.bmj.com
/B
MJ O
pen: first published as 10.1136/bmjopen-2016-014256 on 2 M
ay 2017. Dow
nloaded from

For peer review only
5
Figure 1. This study was approved by the Institutional Ethics Committee of Chia-Yi Christian
Hospital (registry number 104040).
Fig. 1: No. of participants in the four-wave surveys
Measurements
Dependent Variable: Depressive Symptoms
Depressive symptoms were measured with the Center for Epidemiologic Studies
Depression Scale (CESD). This 20-item scale assessment20
was modified to a 10-item scale,21
which was used in the TLSA survey. Each item was scored from 0 to 3, making the total
score range from 0 to 30. The measure, with a cutoff score of 10, has been recommended as a
good tool to assess depressive symptom severity in a community.22
Because the levels of
depressive symptoms are associated with future depression and quality of life,23-24
we
categorized the levels of depressive symptoms as No Depressive Symptom (NDS), which
means CESD=0; Lower Level of Depressive Symptoms (LLDS), 0<CESD≤9; and Higher
Level of Depressive Symptoms (HLDS), CESD≥10.
Independent Variables: Types of exercise and Changing patterns
The degree of exercise was quantified by asking about the frequency (0, ≤2, 3-5, ≥6
times per week), duration (<15 min, 15-30 min, >30 min), and intensity by sweating level
(none, a little, a lot, none of the above) and panting level (none, a little, a lot, none of the
above) after exercise.
Four types of exercise were classified in this study. Exercise type 1 means that exercise
of at least moderate intensity was performed ≥3 times/week, ≥15 min/time (T3_15); Exercise
type 2 means ≥3 times/week, >30 min/time (T3_30); Exercise type 3 means ≥6 times/week,
≥15 min/time (T6_15); Exercise type 4 means ≥6 times/week, >30 min/time (T6_30). The
moderate intensity was defined as experiencing a little sweating and panting after exercise.18
The patterns of exercise consistency refers to changes in practices of respective exercise
types between two waves, which was classified as (a) Low pattern (pattern NN): the
respective exercise type was not practiced in the previous or in the current surveys; (b)
Declining pattern (pattern YN): the respective exercise type was practiced in the previous but
not in the current surveys; (c) Increasing pattern (pattern NY): the respective exercise type
was practiced in the current but not in the previous surveys; and (d) Persistent pattern (pattern
YY): the respective exercise type was practiced in both the previous and in the current
Page 6 of 26
For peer review only - http://bmjopen.bmj.com/site/about/guidelines.xhtml
BMJ Open
123456789101112131415161718192021222324252627282930313233343536373839404142434445464748495051525354555657585960
on March 11, 2022 by guest. P
rotected by copyright.http://bm
jopen.bmj.com
/B
MJ O
pen: first published as 10.1136/bmjopen-2016-014256 on 2 M
ay 2017. Dow
nloaded from

For peer review only
6
surveys. In the analysis, all models were based on paired observations between two waves,
for example, 1996-1999, 1999-2003, 2003-2007. Therefore, when someone exercised in 2003
and 2007 but not 1999, he/she will be counted twice as “increasing pattern” in 1999-2003 and
as “persistent pattern” in 2003-2007.
Control Variables
Sociodemographic variables included gender, age, marital status (married or living with
a partner was coded as 1, otherwise 0), level of education (none, elementary, junior high
school, senior high school, and college and above), economic satisfaction (dissatisfied,
satisfied) and employment status (yes/no).
Physical function involved reversing the score from a 4-point measurement inquiring
about level of difficulty of seven mobility tasks, including standing for 15 min, squatting,
raising both arms up, grasping with fingers, lifting an 11 kg weight, running 20-30 m,
climbing up two to three floors. The sum of the physical battery ranged from 0-21. A higher
score indicated a better physical battery. These measurements have been reported as
hierarchically associated with instrumental and basic activities of daily living.25
Social participation refers to participation in any of the following groups: volunteers,
community groups, religious groups, occupational associations, political parties or groups,
social service groups, clan associations, seniors’ groups or schools. Social participation was
coded as a binary variable (yes/no).
Emotional support was the summed scores of seven items, which were coded from 0 to 3,
including (1) family/relatives/friends care about you, (2) family/relatives/friends listen to you,
(3) you can count on family/relatives/friends when you are ill, (4) you are satisfied with the
support from your family/relatives/friends, (5) How often do your family or friends come to
you for opinions, (6) In what ways do you feel that you are helpful to your family or friends,
and (7) How often do you feel rejected by your family/relatives/friends. The last item was
scored reversely.
Health-related variables included self-rated health (poor, fair and good) and other binary
variables such as current smoking and 10 chronic conditions including cancer, chronic
respiratory disease, gastrointestinal disease, hypertension, diabetes mellitus, heart disease,
stroke, arthritis, hepatobiliary disease and renal disease.
Statistical analysis
The descriptive analysis of depressive symptoms and covariates were presented as a
Page 7 of 26
For peer review only - http://bmjopen.bmj.com/site/about/guidelines.xhtml
BMJ Open
123456789101112131415161718192021222324252627282930313233343536373839404142434445464748495051525354555657585960
on March 11, 2022 by guest. P
rotected by copyright.http://bm
jopen.bmj.com
/B
MJ O
pen: first published as 10.1136/bmjopen-2016-014256 on 2 M
ay 2017. Dow
nloaded from

For peer review only
7
mean ± standard deviation (SD) or as n (%) for continuous or categorical data, respectively.
We applied generalized linear mixed models (GLMMs) via PROC GLIMMIX to estimate the
effects of different transitional patterns of exercise on depressive symptoms with HLDS as
the event, after adjusting for previous CESD score, age, gender, level of education, marital
status, smoking, physical function, emotional support, social participation, self-rated health,
economic satisfaction, employment and 10 chronic conditions. The interaction of time and
transitional patterns of exercise was also included in the above analysis. A two-sided p-value
<0.05 was considered statistically significant. All data was merged and analyzed using SAS
9.2 (SAS Institute, Cary, NC).
RESULTS
There were 2,673 valid subjects selected from the survey conducted in 1999, and a total
of 8,397 observations in four waves of survey. Table 1 shows the distribution of
characteristics for the subjects from 1999 (baseline) to 2007. At baseline, the average age was
74.2 ± 5.7 years old, of which 54.5% were male. The prevalence of LLDS and HLDS was
20~24% over time. About 38.6% of participants met the lowest criteria of T3_15, and fewer
(28.0%) met the highest criteria of T6_30. Noticeably, in any survey, exercise models T3_15
and T6_15 have a higher proportion than T3_30 and T6_30. This may imply the difficulty of
engaging in long exercise in older adults.
Table 2 illustrates the odd ratios (OR) of HLDS according to the current practices of
exercise models and other determining factors. Only exercise type 4 (T6_30) had a significant
reducing effect on HLDS (OR=0.80, 95% CI=0.66-0.95). Also, the previous level of
depressive symptoms, physical function, emotional support, self-rated health and economic
satisfaction were all positively predictive of HLDS.
Table 3 shows the predictive effects of previous exercise models for HLDS. However,
none of the four exercise models in the previous survey could predict the present HLDS.
Namely, previous exercise behavior appeared to have no benefits on reducing depression,
regardless of amount or type of exercise. This may suggest that the effects of exercise on
depressive symptoms are only concurrent and short-term.
Thus, we conducted another test to examine the effect of changes in different exercise
Page 8 of 26
For peer review only - http://bmjopen.bmj.com/site/about/guidelines.xhtml
BMJ Open
123456789101112131415161718192021222324252627282930313233343536373839404142434445464748495051525354555657585960
on March 11, 2022 by guest. P
rotected by copyright.http://bm
jopen.bmj.com
/B
MJ O
pen: first published as 10.1136/bmjopen-2016-014256 on 2 M
ay 2017. Dow
nloaded from

For peer review only
8
models on depressive symptoms, as shown in Table 4. After controlling for other determining
factors and considering the interaction of time and patterns of exercise, the results indicated
that only persistent patterns (pattern YY) reveal a significant protective effect from HLDS,
regardless of exercise type (OR=0.58, 0.56, 0.67, 0.62, respectively, all p<0.05). Namely,
even the lower amount of exercise (T3_15) may have protective effects on depression as long
as the older adults continuously reach moderate intensity at least 15 minutes with a frequency
of no less than three times a week.
DISCUSSION
Very limited research has been conducted to determine the long-term effects of different
exercise models on depressive symptoms in the elderly. The purpose of the study was to
examine the impacts of four different types of exercise on depressive symptoms in
community-dwelling older adults. We found that only current exercise type 4 (T6_30) was
significantly associated with lower depressive symptoms, whereas previous exercise
behaviors seemed to have no benefits on reducing depression. However, when considering
the changes in exercise behaviors between two waves, this study shows that different patterns
of exercise are significantly associated with HLDS outcomes. Only the persistent patterns of
exercise (pattern YY) revealed a significant protective effect from HLDS.
Furthermore, this study shows that persistent low-volume exercise, i.e. ≥15 min of
moderate intensity exercise (T3_15 and T6_15), can provide preventive effects on depressive
symptoms, similar to the benefits of high-volume exercise, i.e. ≥30 min of moderate intensity
exercise (T3_30 and T6_30), for older adults. These findings suggest a shorter, age-friendly
exercise type may benefit older adults physically and psychologically.
Comparing with the similar studies from Ku et al., Ku et al suggested that frequency of
exercise may be important for depressive symptoms26
and the changing pattern of low-low
group had a high risk to developing depressive symtoms.27
Our study revealed that
consistency may be the key factor, regardless the frequency or duration of exercise, as long as
the exercise with moderate intensity. Namely, both exercise frequencies of ≥3 times/week or
≥6 times/week with at least 15- or 30- minutes each time showed significantly negative
association for HLDS in this study. These results indicate the importance of the consistency
of exercise.
Noticeably, Ku et al study analyzed only traditional type of physical activity by using its
frequency, while, in this study, we compared 4 types of physical activity and measured
Page 9 of 26
For peer review only - http://bmjopen.bmj.com/site/about/guidelines.xhtml
BMJ Open
123456789101112131415161718192021222324252627282930313233343536373839404142434445464748495051525354555657585960
on March 11, 2022 by guest. P
rotected by copyright.http://bm
jopen.bmj.com
/B
MJ O
pen: first published as 10.1136/bmjopen-2016-014256 on 2 M
ay 2017. Dow
nloaded from

For peer review only
9
physical activity simultaneously by using three dimensions including frequency, duration and
intensity. Besides, we considered the important covariates related depressive symptoms, such
as social participation, emotional support, mobility, and self-rated health etc. Therefore, we
believe our results can substantially contribute to the existing knowledge of physical activity
and depressive symptoms.
Another study using the Taiwanese national survey suggested promoting high intensity,
rather than frequent or long duration exercise, to improve mental well-being in older adults,28
which seems to be not completely compatible with our findings. However, the nature of the
cross-sectional study design of that study may have caused it to have a higher possibility of
over-interpreting the results. Less depressed people may be more likely to engage in higher
intensity exercise as compared to more depressed people. Our longitudinal study suggests
that a low amount of exercise also has benefits related to preventing depressive symptoms.
Furthermore, transitional patterns of exercise may be more important than the current
exercise models that people are practicing.
Physical inactivity was found to be among the top 10 leading risk factors for global
disease burden in 2010.29
It is important to promote exercise especially among older adults,
who are more vulnerable to physical and psychological dysfunction. The general
recommendation for older adults is moderate intensity exercise accumulated at least 30 min
each day for at least 5 days a week to total 150-300 min/week, or vigorous intensity exercise
at least 20-30 min per day for 3-5 days per week to total 75-100 min/week.18
However, East
Asians usually engage in fewer physical activities at lower intensity than people in western
countries.30-31
In consideration of physical conditions, it would be helpful to find out the
minimal volume of exercise for older adults required to improve their health.
This study showed that the percentage of participants who engaged in exercise type
T6_15 was higher than that of T3_30 and T6_30, which indicates that lower intensity, higher
frequency exercise may be more acceptable to older people than higher intensity exercise
with a lower frequency. Furthermore, the low-volume exercise type has been shown to have
the benefits related to reducing all-cause mortality and all-cancer mortality.19, 32
Therefore,
with the findings of our study, we are confident to conclude that persistent low-amount
exercise with the same moderate intensity (at least ≥15 min/ 6 times/ week) may also benefit
older adults both physically and psychologically.
Because of the social stigma of depressive symptoms, many people with this condition
tend to remain under-treated. When unable to appropriately address the causes or when there
is no access to adequate non-medical or community services to treat depression, patients may
Page 10 of 26
For peer review only - http://bmjopen.bmj.com/site/about/guidelines.xhtml
BMJ Open
123456789101112131415161718192021222324252627282930313233343536373839404142434445464748495051525354555657585960
on March 11, 2022 by guest. P
rotected by copyright.http://bm
jopen.bmj.com
/B
MJ O
pen: first published as 10.1136/bmjopen-2016-014256 on 2 M
ay 2017. Dow
nloaded from
For peer review only
10
become further burdened due to a lack of solutions for specific conditions.33
Our study
provides a practical and non-medical option to prevent people from HLDS. Most importantly,
it will help reduce the unnecessary use of medication, which sometimes causes adverse drug
reactions in older adults, and it may also help people when they lack awareness of their
disorder or are reluctant to be treated.
Still, there are several other factors affecting depressive symptoms. Depression is
significantly associated with chronic medical conditions, problems with ADLs, poor social
support, and previous depressive conditions.7, 34-35
Functional limitation and arthritis are the
strong risk factors in chronic conditions for depression.36
In our study, physical function,
emotional support, self-rated health, and economic satisfaction have always been shown to
significantly influence HLDS in all analyses. However, among the above-mentioned factors,
exercise is the more changeable variable, which could also benefit physical function and
self-rated health.
This is the first report to examine the impacts of four different types of exercise, on
depressive symptoms in the elderly, according to different expert’s recommendations.18-19
However, there are previous studies that have examined the relationship between physical
activity and depressive symptoms in the elderly with different definitions of exercise groups
from different places (city/rural).37-38
Thus, to compare the results with each other, it should
be careful for the compatibility of participants, the measurement of exercise, and the
categories of exercise groups. The advantages of this study include the fact that it had a
nationally representative sample, a longitudinal cohort design, a test of different amount of
exercise, an examination of the changes in exercise status over time, and a proper
consideration of statistical analysis methods.
Nonetheless, the study has some limitations. Firstly, the observation for the outcome
event was performed the same time as the second visit to develop the variables for
transitional patterns of exercise, which may have reduced the interpretation of a causal
relationship if the association between current exercise and the outcome event is too strong.
However, if the assumption is true, the bias will support the null hypothesis. The results
indicate that the significantly protective effects of a persistent pattern of exercise are
consistent across all of the types of exercise. The increasing exercise pattern did not have the
same finding although both patterns indicated that the subjects had practiced the respective
exercises on their second visit. We are therefore comfortable to infer that a persistent pattern
of exercise has more influence than increasing and other transitional patterns of exercise.
Secondly, the effects of different variables for HLDS may be altered for different cohorts
Page 11 of 26
For peer review only - http://bmjopen.bmj.com/site/about/guidelines.xhtml
BMJ Open
123456789101112131415161718192021222324252627282930313233343536373839404142434445464748495051525354555657585960
on March 11, 2022 by guest. P
rotected by copyright.http://bm
jopen.bmj.com
/B
MJ O
pen: first published as 10.1136/bmjopen-2016-014256 on 2 M
ay 2017. Dow
nloaded from

For peer review only
11
because of changes in medicine, antidepressants, nutrition or in the environment. This may
limit the application of the findings of this study. Lastly, activities of daily living (ADL) was
not included in the analysis, which may include those who cannot perform exercise. We used
physical function ability, which has shown to be hierarchically associated with instrumental
and basic ADL25
to control the differences related to mobility limitation.
CONCLUSION
A consistent exercise with 15-min moderate intensity and a frequency of no less than 3
times a week is significantly associated with lower risk of depressive symptoms. Increasing
the frequency to more than 5 times per week will benefit older adults both physically and
psychologically. We recommend taking this low amount of exercise into core consideration
when designing exercise programs related to older adults.
Page 12 of 26
For peer review only - http://bmjopen.bmj.com/site/about/guidelines.xhtml
BMJ Open
123456789101112131415161718192021222324252627282930313233343536373839404142434445464748495051525354555657585960
on March 11, 2022 by guest. P
rotected by copyright.http://bm
jopen.bmj.com
/B
MJ O
pen: first published as 10.1136/bmjopen-2016-014256 on 2 M
ay 2017. Dow
nloaded from

For peer review only
12
Acknowledgements
We would like to thank the Health Promotion Administration, Ministry of Health and
Welfare of Taiwan for providing the dataset for analysis.
Contributors
Y-CC and M-CL designed and conducted the study, and wrote the daft; I-HH analyzed
the data and interpreted the tables; W-CW involved literature review and revised the draft;
SCH advised the whole study and completed the manuscript. All authors contributed to the
interpretation of results, critically reviewed the draft, and approved the final manuscript.
Funding
This study was supported by Research Center for Humanities and Social Sciences,
National Cheng Kung University, (H10-A304, FD101037).
Competing interests
None declared.
Ethical approval
This study was approved by the Institutional Ethics Committee of Chia-Yi Christian
Hospital (registry number 104040).
Provenance and peer review
Not commissioned; externally peer reviewed.
Data sharing statement
No additional data are available.
Page 13 of 26
For peer review only - http://bmjopen.bmj.com/site/about/guidelines.xhtml
BMJ Open
123456789101112131415161718192021222324252627282930313233343536373839404142434445464748495051525354555657585960
on March 11, 2022 by guest. P
rotected by copyright.http://bm
jopen.bmj.com
/B
MJ O
pen: first published as 10.1136/bmjopen-2016-014256 on 2 M
ay 2017. Dow
nloaded from
For peer review only
13
References
1. Laborde‐Lahoz P, El‐Gabalawy R, Kinley J, et al. Subsyndromal depression among
older adults in the USA: prevalence, comorbidity, and risk for new‐onset psychiatric
disorders in late life. Int J Geriatr Psychiatry 2015;30:677-85.
2. Chong MY, Tsang HY, Chen CS, et al. Community study of depression in old age in
Taiwan: prevalence, life events and socio-demographic correlates. Br J Psychiatry
2001;178:29-35.
3. Global Burden of Disease Study C. Global, regional, and national incidence, prevalence,
and years lived with disability for 301 acute and chronic diseases and injuries in 188
countries, 1990-2013: a systematic analysis for the Global Burden of Disease Study
2013. Lancet 2015;386:743-800.
4. Chang YC, Yao G, Hu SC, et al. Depression Affects the Scores of All Facets of the
WHOQOL-BREF and May Mediate the Effects of Physical Disability among
Community-Dwelling Older Adults. PLoS One 2015;10:e0128356.
5. Webb E, Blane D, McMunn A, et al. Proximal predictors of change in quality of life at
older ages. J Epidemiol Community Health 2011;65:542-7.
6. Garin N, Olaya B, Moneta MV, et al. Impact of multimorbidity on disability and quality
of life in the Spanish older population. PLoS One 2014;9:e111498.
7. Schoevers RA, Beekman AT, Deeg DJ, et al. Risk factors for depression in later life;
results of a prospective community based study (AMSTEL). J Affect Disord
2000;59:127-37.
8. Veerman JL, Shrestha RN, Mihalopoulos C, et al. Depression prevention, labour force
participation and income of older working aged Australians: A microsimulation
economic analysis. Aust N Z J Psychiatry 2015;49:430-6.
9. Lee SY, Franchetti MK, Imanbayev A, et al. Non-pharmacological prevention of major
depression among community-dwelling older adults: a systematic review of the efficacy
of psychotherapy interventions. Arch Gerontol Geriatr 2012;55:522-9.
10. Forsman AK, Schierenbeck I, Wahlbeck K. Psychosocial interventions for the
prevention of depression in older adults: systematic review and meta-analysis. J Aging
Health 2011;23:387-416.
11. Stahl ST, Albert SM, Dew MA, et al. Coaching in healthy dietary practices in at-risk
older adults: a case of indicated depression prevention. Am J Psychiatry
2014;171:499-505.
Page 14 of 26
For peer review only - http://bmjopen.bmj.com/site/about/guidelines.xhtml
BMJ Open
123456789101112131415161718192021222324252627282930313233343536373839404142434445464748495051525354555657585960
on March 11, 2022 by guest. P
rotected by copyright.http://bm
jopen.bmj.com
/B
MJ O
pen: first published as 10.1136/bmjopen-2016-014256 on 2 M
ay 2017. Dow
nloaded from

For peer review only
14
12. Tipton CM. The history of "Exercise Is Medicine" in ancient civilizations. Adv Physiol
Educ 2014;38:109-17.
13. Rethorst CD, Wipfli BM, Landers DM. The antidepressive effects of exercise: a
meta-analysis of randomized trials. Sports Med 2009;39:491-511.
14. Brenes GA, Williamson JD, Messier SP, et al. Treatment of minor depression in older
adults: a pilot study comparing sertraline and exercise. Aging Ment Health 2007;11:61-8.
15. Cooney GM, Dwan K, Greig CA, et al. Exercise for depression. Cochrane Database
Syst Rev 2013;9:CD004366.
16. Walker JG, Mackinnon AJ, Batterham P, et al. Mental health literacy, folic acid and
vitamin B12, and physical activity for the prevention of depression in older adults:
randomised controlled trial. Br J Psychiatry 2010;197:45-54.
17. Rhyner KT, Watts A. Exercise and Depressive Symptoms in Older Adults: A Systematic
Meta-Analytic Review. J Aging Phys Act 2016;24:234-246.
18. Pescatello LS. ACSM's Guidelines for Exercise Testing and Prescription. 9th Edition,
edited by American College of Sports Medicine; 2013.
19. Wen CP, Wai JP, Tsai MK, et al. Minimum amount of physical activity for reduced
mortality and extended life expectancy: a prospective cohort study. Lancet
2011;378:1244-53.
20. Radloff LS. The CES-D scale: a self-reported depression scale for research in the
general population. Appl Psychol Meas 1977;I:385-401.
21. Kohout FJ, Berkman LF, Evans DA,et al. Two shorter forms of the CES-D (Center for
Epidemiological Studies Depression) depression symptoms index. J Aging Health
1993;5:179-93.
22. Bjorgvinsson T, Kertz SJ, Bigda-Peyton JS,et al. Psychometric properties of the
CES-D-10 in a psychiatric sample. Assessment 2013;20:429-36.
23. Lyness JM, Chapman BP, McGriff J,et al. One-year outcomes of minor and
subsyndromal depression in older primary care patients. Int Psychogeriatr 2009;21:60-8.
24. Chang YC, Ouyang WC, Lu MC,et al. Levels of depressive symptoms may modify the
relationship between the WHOQOL-BREF and its determining factors in
community-dwelling older adults. Int Psychogeriatr 2016;28:591-601.
25. Chen HY, Wang CY, Lee MY,et al. A hierarchical categorisation of tasks in mobility
disability. Disabil Rehabil 2010;32:1586-93.
26. Ku PW, Fox KR, Chen LJ, et al. Physical activity and depressive symptoms in older
adults: 11-year follow-up. Am J Prev Med 2012;42:355-62.
Page 15 of 26
For peer review only - http://bmjopen.bmj.com/site/about/guidelines.xhtml
BMJ Open
123456789101112131415161718192021222324252627282930313233343536373839404142434445464748495051525354555657585960
on March 11, 2022 by guest. P
rotected by copyright.http://bm
jopen.bmj.com
/B
MJ O
pen: first published as 10.1136/bmjopen-2016-014256 on 2 M
ay 2017. Dow
nloaded from

For peer review only
15
27. Ku PW, Fox KR, Chen LJ. Physical activity and depressive symptoms in Taiwanese
older adults: a seven-year follow-up study. Prev Med 2009;48:250-5.
28. Chen LJ, Stevinson C, Ku PW, et al. Relationships of leisure-time and non-leisure-time
physical activity with depressive symptoms: a population-based study of Taiwanese
older adults. Int J Behav Nutr Phys Act 2012;9:28.
29. Lim SS, Vos T, Flaxman AD, et al. A comparative risk assessment of burden of disease
and injury attributable to 67 risk factors and risk factor clusters in 21 regions, 1990-2010:
a systematic analysis for the Global Burden of Disease Study 2010. Lancet
2012;380:2224-60.
30. Ku PW, Fox KR, McKenna J, et al. Prevalence of leisure-time physical activity in
Taiwanese adults: results of four national surveys, 2000-2004. Prev Med 2006;43:454-7.
31. Wai JP, Wen CP, Chan HT, et al. Assessing physical activity in an Asian country: low
energy expenditure and exercise frequency among adults in Taiwan. Asia Pac J Clin
Nutr 2008;17:297-308.
32. Hubbard RE, Fallah N, Searle SD, et al. Impact of exercise in community-dwelling older
adults. PLoS One 2009;4:e6174.
33. Bird MJ, Parslow RA. Potential for community programs to prevent depression in older
people. Med J Aust 2002;177 Suppl:S107-10.
34. Schoevers RA, Geerlings MI, Beekman AT, et al. Association of depression and gender
with mortality in old age. Results from the Amsterdam Study of the Elderly (AMSTEL).
Br J Psychiatry 2000;177:336-42.
35. Roberts RE, Kaplan GA, Shema SJ, et al. Does growing old increase the risk for
depression? Am J Psychiatry 1997;154:1384-90.
36. Dunlop DD, Lyons JS, Manheim LM, et al. Arthritis and heart disease as risk factors for
major depression: the role of functional limitation. Med Care 2004;42:502-11.
37. Lampinen P, Heikkinen E. Reduced mobility and physical activity as predictors of
depressive symptoms among community-dwelling older adults: an eight-year follow-up
study. Aging Clin Exp Res 2003;15:205-11.
38. Yoshida Y, Iwasa H, Kumagai S, Suzuki T, Awata S, Yoshida H. Longitudinal
association between habitual physical activity and depressive symptoms in older people.
Psychiatry Clin Neurosci 2015;69:686-92.
Page 16 of 26
For peer review only - http://bmjopen.bmj.com/site/about/guidelines.xhtml
BMJ Open
123456789101112131415161718192021222324252627282930313233343536373839404142434445464748495051525354555657585960
on March 11, 2022 by guest. P
rotected by copyright.http://bm
jopen.bmj.com
/B
MJ O
pen: first published as 10.1136/bmjopen-2016-014256 on 2 M
ay 2017. Dow
nloaded from

For peer review only
16
Table 1 Characteristics of the participants from 1999 to 2007
Variables
1999 2003 2007
N=2673 N=1889 N=1361
n (%) n (%) n (%)
Age 74.2 ± 5.7 77.1 ± 5.1 80.2 ± 4.7
Male 1456 (54.5) 1019 (53.9) 703 (51.7)
Level of depressive symptoms
NDS 1401 (52.5) 1049 (55.5) 708 (52.0)
LLDS 646 (24.2) 388 (20.5) 321 (23.6)
HLDS 624 (23.4) 452 (23.9) 332 (24.4)
M±SD 6.1 ± 6.4 5.7 ± 5.9 5.8 ± 6.1
Types of exercise*
T3_15 1032 (38.6) 810 (42.9) 562 (41.3)
T3_30 859 (32.1) 671 (35.5) 450 (33.1)
T6_15 922 (34.5) 742 (39.3) 498 (36.6)
T6_30 749 (28.0) 603 (31.9) 386 (28.4)
Education
No 1111 (41.6) 733 (38.8) 507 (37.3)
Elementary 983 (36.8) 723 (38.3) 515 (37.8)
Junior high school 273 (10.2) 200 (10.6) 155 (11.4)
Senior high school 162 (6.1) 124 (6.6) 96 (7.1)
College and above 143 (5.4) 109 (5.8) 88 (6.5)
Married 1630 (61.0) 1096 (58.0) 727 (53.4)
Employment 322 (12.1) 142 (7.5) 84 (6.2)
Current smoking 595 (22.3) 344 (18.2) 189 (13.9)
Physical function 17.2 ± 4.8 16.2 ± 5.0 16.0 ± 5.1
Emotional support 18.1 ± 3.0 18.0 ± 2.9 18.4 ± 2.7
Social participation 1369 (51.2) 842 (44.6) 576 (42.3)
Self-rated health
Poor 934 (34.9) 707 (37.4) 481 (35.3)
Fair 927 (34.7) 583 (30.9) 531 (39.0)
Good 812 (30.4) 599 (31.7) 349 (25.6)
Economic satisfaction
Dissatisfied 544 (20.4) 407 (21.6) 271 (19.9)
Fair 1144 (42.9) 653 (34.6) 486 (35.7)
Satisfied 978 (36.7) 828 (43.9) 604 (44.4)
Chronic conditions
Page 17 of 26
For peer review only - http://bmjopen.bmj.com/site/about/guidelines.xhtml
BMJ Open
123456789101112131415161718192021222324252627282930313233343536373839404142434445464748495051525354555657585960
on March 11, 2022 by guest. P
rotected by copyright.http://bm
jopen.bmj.com
/B
MJ O
pen: first published as 10.1136/bmjopen-2016-014256 on 2 M
ay 2017. Dow
nloaded from

For peer review only
17
Cancer 71 (2.7) 61 (3.2) 54 (4.0)
Chronic respiratory disease 370 (13.8) 256 (13.6) 179 (13.2)
Gastrointestinal 543 (20.3) 402 (21.3) 301 (22.1)
Hypertension 1002 (37.5) 829 (43.9) 672 (49.4)
Diabetes mellitus 408 (15.3) 319 (16.9) 235 (17.3)
Heart disease 576 (21.6) 469 (24.8) 373 (27.4)
Stroke 144 (5.4) 126 (6.7) 83 (6.1)
Arthritis 594 (22.2) 465 (24.6) 322 (23.7)
Hepatobiliary disease 191 (7.2) 158 (8.4) 116 (8.5)
Renal disease 217 (8.1) 192 (10.2) 139 (10.2)
Data were presented as mean ± SD or n (%).
NDS: No Depressive Symptom (CESD=0);
LLDS: Lower Level of Depressive Symptoms (0<CESD≦9);
HLDS: Higher Level of Depressive Symptoms (CESD≧10);
CESD: Center for Epidemiologic Studies of Depression;
*T3_15: Exercise ≧moderate intensity, ≧3 times/week, ≧15 min/time;
T3_30: Exercise ≧moderate intensity, ≧3 times/week, ≧30 min/time;
T6_15: Exercise ≧moderate intensity, ≧6 times/week, ≧15 min/time;
T6_30: Exercise ≧moderate intensity, ≧6 times/week, ≧30 min/time.
Page 18 of 26
For peer review only - http://bmjopen.bmj.com/site/about/guidelines.xhtml
BMJ Open
123456789101112131415161718192021222324252627282930313233343536373839404142434445464748495051525354555657585960
on March 11, 2022 by guest. P
rotected by copyright.http://bm
jopen.bmj.com
/B
MJ O
pen: first published as 10.1136/bmjopen-2016-014256 on 2 M
ay 2017. Dow
nloaded from
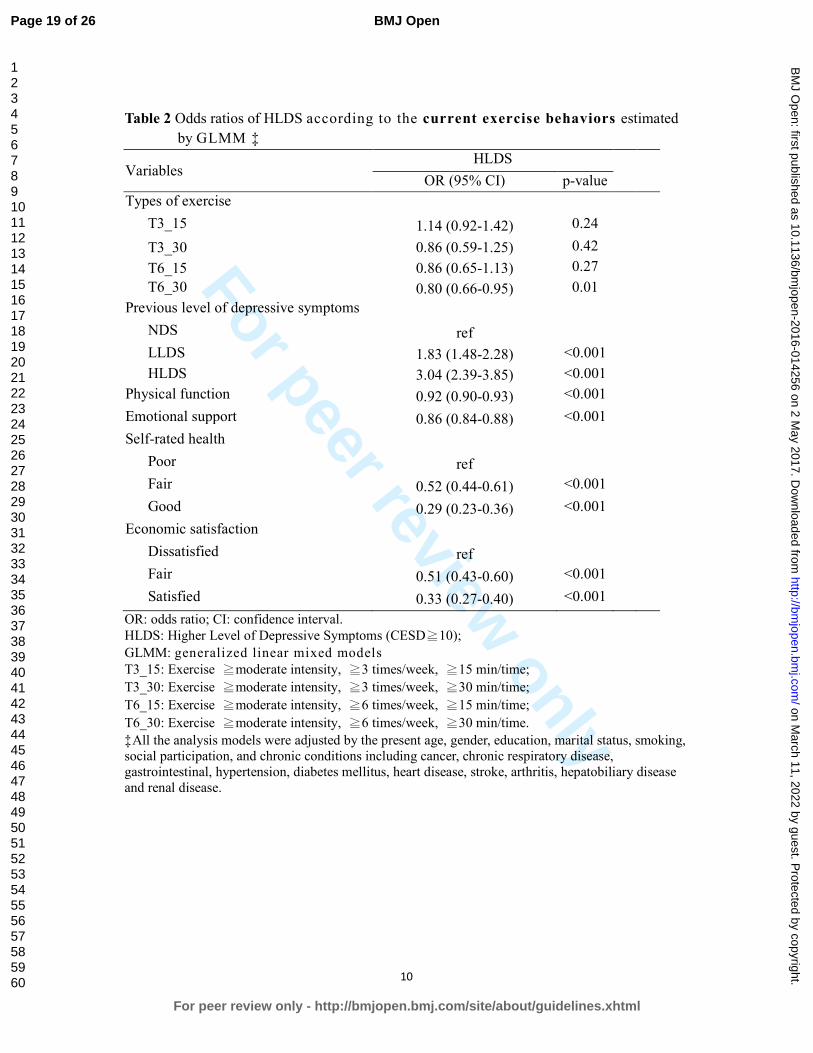
For peer review only
10
Table 2 Odds ratios of HLDS according to the current exercise behaviors estimated
by GLMM ‡
Variables HLDS
OR (95% CI) p-value
Types of exercise
T3_15 1.14 (0.92-1.42) 0.24
T3_30 0.86 (0.59-1.25) 0.42
T6_15 0.86 (0.65-1.13) 0.27
T6_30 0.80 (0.66-0.95) 0.01
Previous level of depressive symptoms
NDS ref
LLDS 1.83 (1.48-2.28) <0.001
HLDS 3.04 (2.39-3.85) <0.001
Physical function 0.92 (0.90-0.93) <0.001
Emotional support 0.86 (0.84-0.88) <0.001
Self-rated health
Poor ref
Fair 0.52 (0.44-0.61) <0.001
Good 0.29 (0.23-0.36) <0.001
Economic satisfaction
Dissatisfied ref
Fair 0.51 (0.43-0.60) <0.001
Satisfied 0.33 (0.27-0.40) <0.001
OR: odds ratio; CI: confidence interval.
HLDS: Higher Level of Depressive Symptoms (CESD≧10);
GLMM: generalized linear mixed models
T3_15: Exercise ≧moderate intensity, ≧3 times/week, ≧15 min/time;
T3_30: Exercise ≧moderate intensity, ≧3 times/week, ≧30 min/time;
T6_15: Exercise ≧moderate intensity, ≧6 times/week, ≧15 min/time;
T6_30: Exercise ≧moderate intensity, ≧6 times/week, ≧30 min/time.
‡All the analysis models were adjusted by the present age, gender, education, marital status, smoking,
social participation, and chronic conditions including cancer, chronic respiratory disease,
gastrointestinal, hypertension, diabetes mellitus, heart disease, stroke, arthritis, hepatobiliary disease
and renal disease.
Page 19 of 26
For peer review only - http://bmjopen.bmj.com/site/about/guidelines.xhtml
BMJ Open
123456789101112131415161718192021222324252627282930313233343536373839404142434445464748495051525354555657585960
on March 11, 2022 by guest. P
rotected by copyright.http://bm
jopen.bmj.com
/B
MJ O
pen: first published as 10.1136/bmjopen-2016-014256 on 2 M
ay 2017. Dow
nloaded from

For peer review only
11
Table 3 Odds ratios of HLDS according to the previous exercise behaviors estimated
by GLMM‡
Variables HLDS
OR (95% CI) p-value
Previous exercise types
T3_15 0.88 (0.72-1.06) 0.17
T3_30 1.05 (0.76-1.46) 0.77
T6_15 0.98 (0.79-1.23) 0.89
T6_30 0.68 (0.44-1.07) 0.10
Previous level of depressive symptoms
NDS ref
LLDS 1.86 (1.50-2.31) <0.001
HLDS 3.12 (2.46-3.96) <0.001
Physical function 0.92 (0.90-0.93) <0.001
Emotional support 0.86 (0.84-0.88) <0.001
Self-rated health
Poor ref
Fair 0.52 (0.44-0.60) <0.001
Good 0.28 (0.23-0.35) <0.001
Economic satisfaction
Dissatisfied ref
Fair 0.51 (0.43-0.60) <0.001
Satisfied 0.33 (0.27-0.40) <0.001
OR: odds ratio; CI: confidence interval.
HLDS: Higher Level of Depressive Symptoms (CESD≧10);
GLMM: generalized linear mixed models
T3_15: Exercise ≧moderate intensity, ≧3 times/week, ≧15min/time;
T3_30: Exercise ≧moderate intensity, ≧3 times/week, ≧30min/time;
T6_15: Exercise ≧moderate intensity, ≧6 times/week, ≧15min/time;
T6_30: Exercise ≧moderate intensity, ≧6 times/week, ≧30min/time.
‡All the analysis models were adjusted by the present age, gender, education, marital status, smoking, social participation, and chronic conditions including cancer, chronic respiratory disease,
gastrointestinal, hypertension, diabetes mellitus, heart disease, stroke, arthritis, hepatobiliary disease
and renal disease.
Page 20 of 26
For peer review only - http://bmjopen.bmj.com/site/about/guidelines.xhtml
BMJ Open
123456789101112131415161718192021222324252627282930313233343536373839404142434445464748495051525354555657585960
on March 11, 2022 by guest. P
rotected by copyright.http://bm
jopen.bmj.com
/B
MJ O
pen: first published as 10.1136/bmjopen-2016-014256 on 2 M
ay 2017. Dow
nloaded from

For peer review only
12
Table 4 Odds ratios of HLDS under the consideration of the interaction of time and exercise consistency‡
Variables
Model 1
(T3_15)
Model 2
(T3_30)
Model 3
(T6_15)
Model 4
(T6_30)
OR (95% CI) P OR (95% CI) P OR (95% CI) P OR (95% CI) P
Patterns of consistency
NN ref ref ref ref
YN 0.77 (0.54-1.11) 0.16 0.86 (0.60-1.25) 0.43 0.76 (0.53-1.09) 0.14 0.92 (0.64-1.34) 0.68
NY 0.79 (0.54-1.16) 0.24 0.78 (0.52-1.17) 0.23 0.68 (0.45-1.01) 0.06 0.71 (0.46-1.10) 0.12
YY 0.58 (0.40-0.85) 0.01 0.56 (0.36-0.88) 0.01 0.67 (0.45-1.00) 0.048 0.62 (0.38-0.99) 0.047
Previous CESD
NDS ref ref ref ref
LLDS 1.82 (1.43-2.33) <0.001 1.81 (1.42-2.31) <0.001 1.82 (1.42-2.32) <0.001 1.81 (1.42-2.31) <0.001
HLDS 3.23 (2.47-4.23) <0.001 3.20 (2.45-4.18) <0.001 3.23 (2.47-4.22) <0.001 3.20 (2.45-4.19) <0.001
Time slope 0.95 (0.92-0.99) 0.01 0.97 (0.94-1.00) 0.08 0.96 (0.92-0.99) 0.01 0.98 (0.94-1.01) 0.14
Time x Exercise consistency
NN ref ref ref ref
YN 1.12 (1.05-1.20) <0.01 1.07 (1.00-1.15) 0.04 1.12 (1.05-1.20) <0.01 1.06 (0.99-1.14) 0.07
NY 1.01 (0.93-1.09) 0.79 0.99 (0.91-1.08) 0.84 1.02 (0.94-1.10) 0.69 0.98 (0.90-1.07) 0.68
YY 1.11 (1.03-1.18) <0.01 1.09 (1.01-1.17) 0.04 1.09 (1.01-1.17) 0.02 1.07 (0.99-1.17) 0.10
OR: odds ratio; CI: confidence interval.
HLDS: Higher Level of Depressive Symptoms (CESD≧10);
GLMM: generalized linear mixed models
T3_15: Exercise ≧moderate intensity, ≧3 times/week, ≧15 min/time;
T3_30: Exercise ≧moderate intensity, ≧3 times/week, ≧30 min/time;
T6_15: Exercise ≧moderate intensity, ≧6 times/week, ≧15 min/time;
Page 21 of 26
For peer review only - http://bmjopen.bmj.com/site/about/guidelines.xhtml
BMJ Open
123456789101112131415161718192021222324252627282930313233343536373839404142434445464748495051525354555657585960
on March 11, 2022 by guest. Protected by copyright. http://bmjopen.bmj.com/ BMJ Open: first published as 10.1136/bmjopen-2016-014256 on 2 May 2017. Downloaded from
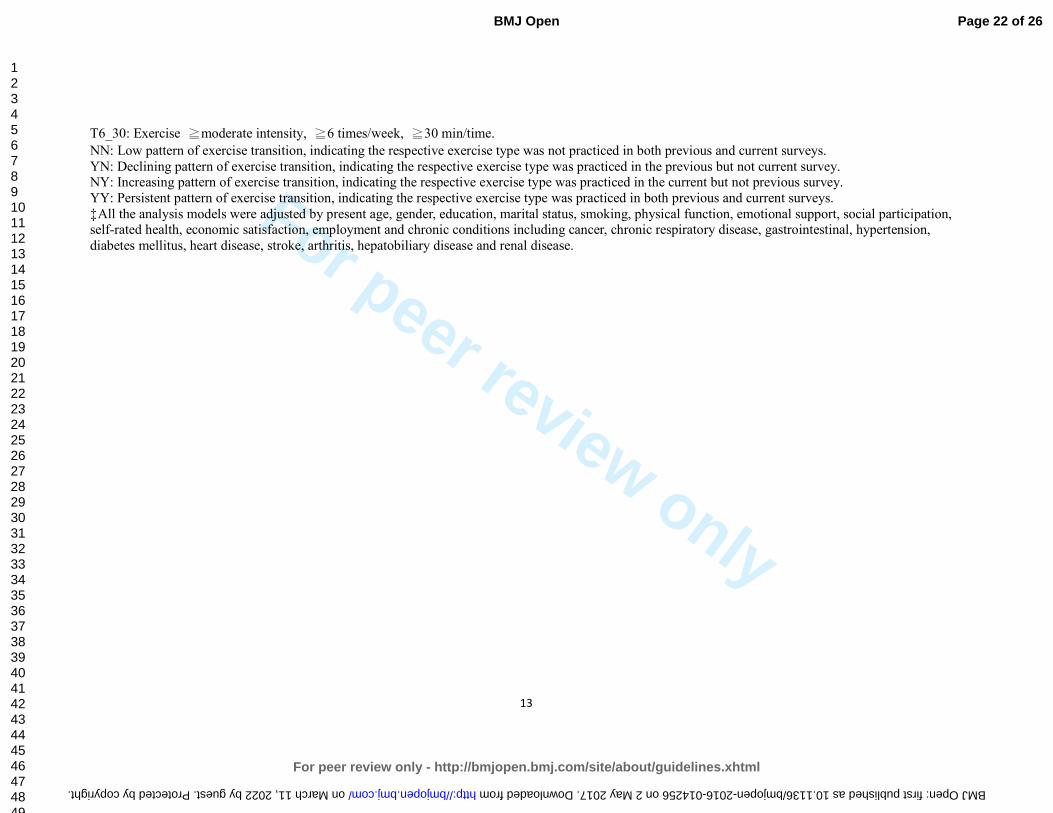
For peer review only
13
T6_30: Exercise ≧moderate intensity, ≧6 times/week, ≧30 min/time.
NN: Low pattern of exercise transition, indicating the respective exercise type was not practiced in both previous and current surveys.
YN: Declining pattern of exercise transition, indicating the respective exercise type was practiced in the previous but not current survey. NY: Increasing pattern of exercise transition, indicating the respective exercise type was practiced in the current but not previous survey.
YY: Persistent pattern of exercise transition, indicating the respective exercise type was practiced in both previous and current surveys.
‡All the analysis models were adjusted by present age, gender, education, marital status, smoking, physical function, emotional support, social participation, self-rated health, economic satisfaction, employment and chronic conditions including cancer, chronic respiratory disease, gastrointestinal, hypertension,
diabetes mellitus, heart disease, stroke, arthritis, hepatobiliary disease and renal disease.
Page 22 of 26
For peer review only - http://bmjopen.bmj.com/site/about/guidelines.xhtml
BMJ Open
123456789101112131415161718192021222324252627282930313233343536373839404142434445464748495051525354555657585960
on March 11, 2022 by guest. Protected by copyright. http://bmjopen.bmj.com/ BMJ Open: first published as 10.1136/bmjopen-2016-014256 on 2 May 2017. Downloaded from
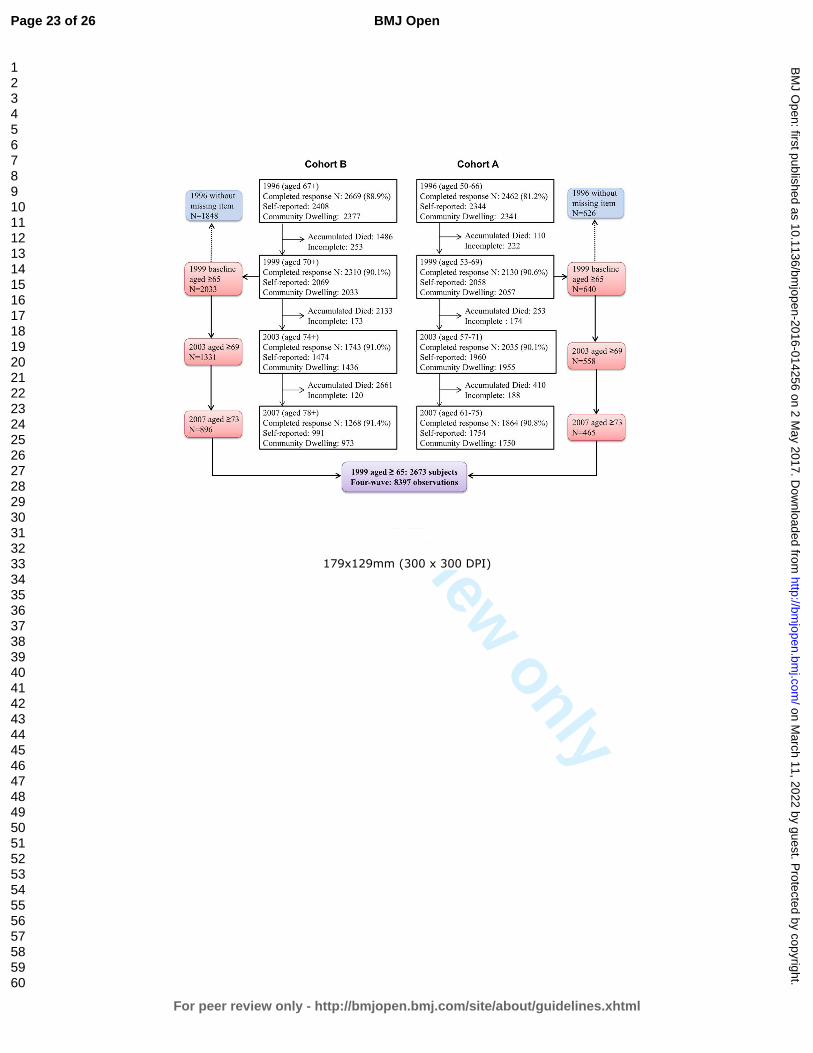
For peer review only
179x129mm (300 x 300 DPI)
Page 23 of 26
For peer review only - http://bmjopen.bmj.com/site/about/guidelines.xhtml
BMJ Open
123456789101112131415161718192021222324252627282930313233343536373839404142434445464748495051525354555657585960
on March 11, 2022 by guest. P
rotected by copyright.http://bm
jopen.bmj.com
/B
MJ O
pen: first published as 10.1136/bmjopen-2016-014256 on 2 M
ay 2017. Dow
nloaded from

For peer review only
1
STROBE Statement—checklist of items that should be included in reports of observational studies
Item No Page Recommendation
Title and abstract 1 0-1 (a) Indicate the study’s design with a commonly used term in the title
or the abstract
(b) Provide in the abstract an informative and balanced summary of
what was done and what was found
Introduction
Background/rationale 2 3-4 Explain the scientific background and rationale for the investigation
being reported
Objectives 3 4 State specific objectives, including any prespecified hypotheses
Methods
Study design 4 4 Present key elements of study design early in the paper
Setting 5 4 Describe the setting, locations, and relevant dates, including periods of
recruitment, exposure, follow-up, and data collection
Participants 6 4 (a) Cohort study—Give the eligibility criteria, and the sources and
methods of selection of participants. Describe methods of follow-up
Case-control study—Give the eligibility criteria, and the sources and
methods of case ascertainment and control selection. Give the rationale
for the choice of cases and controls
Cross-sectional study—Give the eligibility criteria, and the sources
and methods of selection of participants
(b) Cohort study—For matched studies, give matching criteria and
number of exposed and unexposed
Case-control study—For matched studies, give matching criteria and
the number of controls per case
Variables 7 5-6 Clearly define all outcomes, exposures, predictors, potential
confounders, and effect modifiers. Give diagnostic criteria, if
applicable
Data sources/
measurement
8* 5-6 For each variable of interest, give sources of data and details of
methods of assessment (measurement). Describe comparability of
assessment methods if there is more than one group
Bias 9 4-5 Describe any efforts to address potential sources of bias
Study size 10 4 Explain how the study size was arrived at
Quantitative
variables
11 5-6 Explain how quantitative variables were handled in the analyses. If
applicable, describe which groupings were chosen and why
Statistical methods 12 6-7 (a) Describe all statistical methods, including those used to control for
confounding
(b) Describe any methods used to examine subgroups and interactions
(c) Explain how missing data were addressed
(d) Cohort study—If applicable, explain how loss to follow-up was
addressed
Case-control study—If applicable, explain how matching of cases and
controls was addressed
Cross-sectional study—If applicable, describe analytical methods
taking account of sampling strategy
(e) Describe any sensitivity analyses
Page 24 of 26
For peer review only - http://bmjopen.bmj.com/site/about/guidelines.xhtml
BMJ Open
123456789101112131415161718192021222324252627282930313233343536373839404142434445464748495051525354555657585960
on March 11, 2022 by guest. P
rotected by copyright.http://bm
jopen.bmj.com
/B
MJ O
pen: first published as 10.1136/bmjopen-2016-014256 on 2 M
ay 2017. Dow
nloaded from

For peer review only
2
(Continue)
Item No Page Results
Participants 13* 7 (a) Report numbers of individuals at each stage of study—eg numbers
potentially eligible, examined for eligibility, confirmed eligible,
included in the study, completing follow-up, and analysed
(b) Give reasons for non-participation at each stage
(c) Consider use of a flow diagram
Descriptive
data
14* 7 (a) Give characteristics of study participants (eg demographic, clinical,
social) and information on exposures and potential confounders
(b) Indicate number of participants with missing data for each variable
of interest
(c) Cohort study—Summarise follow-up time (eg, average and total
amount)
Outcome data 15* 7-8 Cohort study—Report numbers of outcome events or summary
measures over time
Case-control study—Report numbers in each exposure category, or
summary measures of exposure
Cross-sectional study—Report numbers of outcome events or
summary measures
Main results 16 7-8 (a) Give unadjusted estimates and, if applicable, confounder-adjusted
estimates and their precision (eg, 95% confidence interval). Make
clear which confounders were adjusted for and why they were
included
(b) Report category boundaries when continuous variables were
categorized
(c) If relevant, consider translating estimates of relative risk into
absolute risk for a meaningful time period
Other analyses 17 7-8 Report other analyses done—eg analyses of subgroups and
interactions, and sensitivity analyses
Discussion
Key results 18 8 Summarise key results with reference to study objectives
Limitations 19 10 Discuss limitations of the study, taking into account sources of
potential bias or imprecision. Discuss both direction and magnitude of
any potential bias
Interpretation 20 8-10 Give a cautious overall interpretation of results considering objectives,
limitations, multiplicity of analyses, results from similar studies, and
other relevant evidence
Generalisability 21 10 Discuss the generalisability (external validity) of the study results
Other information
Funding 22 12 Give the source of funding and the role of the funders for the present
study and, if applicable, for the original study on which the present
article is based
*Give information separately for cases and controls in case-control studies and, if applicable, for exposed
and unexposed groups in cohort and cross-sectional studies.
Page 25 of 26
For peer review only - http://bmjopen.bmj.com/site/about/guidelines.xhtml
BMJ Open
123456789101112131415161718192021222324252627282930313233343536373839404142434445464748495051525354555657585960
on March 11, 2022 by guest. P
rotected by copyright.http://bm
jopen.bmj.com
/B
MJ O
pen: first published as 10.1136/bmjopen-2016-014256 on 2 M
ay 2017. Dow
nloaded from

For peer review only
3
Note: An Explanation and Elaboration article discusses each checklist item and gives methodological
background and published examples of transparent reporting. The STROBE checklist is best used in
conjunction with this article (freely available on the Web sites of PLoS Medicine at
http://www.plosmedicine.org/, Annals of Internal Medicine at http://www.annals.org/, and Epidemiology at
http://www.epidem.com/). Information on the STROBE Initiative is available at www.strobe-statement.org.
Page 26 of 26
For peer review only - http://bmjopen.bmj.com/site/about/guidelines.xhtml
BMJ Open
123456789101112131415161718192021222324252627282930313233343536373839404142434445464748495051525354555657585960
on March 11, 2022 by guest. P
rotected by copyright.http://bm
jopen.bmj.com
/B
MJ O
pen: first published as 10.1136/bmjopen-2016-014256 on 2 M
ay 2017. Dow
nloaded from

For peer review only
Comparisons of four different amounts of exercise for preventing depressive symptoms in community-dwelling
older adults: an 11-year follow-up study in Taiwan
Journal: BMJ Open
Manuscript ID bmjopen-2016-014256.R2
Article Type: Research
Date Submitted by the Author: 29-Jan-2017
Complete List of Authors: Chang, Yu-Chen ; Ditmanson Medical Foundation Chia-Yi Christian Hospital, Community Health Lu, Mei-Chun ; Kuang Tien General Hospital, Medical Research
Hu, I-Han; National Cheng Kung University College of Medicine, Institute of Gerontology Wu, Wan-Chi; National Cheng Kung University College of Medicine, Public Health Hu, Susan; National Cheng Kung University College of Medicine, Public Health
<b>Primary Subject Heading</b>:
Mental health
Secondary Subject Heading: Geriatric medicine, Epidemiology, Sports and exercise medicine
Keywords: EPIDEMIOLOGY, MENTAL HEALTH, Depression & mood disorders < PSYCHIATRY, SPORTS MEDICINE
For peer review only - http://bmjopen.bmj.com/site/about/guidelines.xhtml
BMJ Open on M
arch 11, 2022 by guest. Protected by copyright.
http://bmjopen.bm
j.com/
BM
J Open: first published as 10.1136/bm
jopen-2016-014256 on 2 May 2017. D
ownloaded from

For peer review only
Comparisons of four different amounts of exercise for preventing 1
depressive symptoms in community-dwelling older adults: an 11-year 2
follow-up study in Taiwan 3
4
Yu-Chen Chang1, Mei-Chun Lu
2, I-Han Hu
3, Wan-Chi Ida Wu
4, Susan C. Hu
5* 5
6
7
1. Yu-Chen Chang, MD, PhD, Department of Community Health, Chia-Yi Christian 8
Hospital, Chia-Yi, Taiwan. [email protected] 9
2. Mei-Chun Lu, MS, Department of Medical Research, Kuang Tien General Hospital, 10
Taichung, Taiwan. [email protected] 11
3. I-Han Hu, MS, Institute of Gerontology, College of Medicine, National Cheng Kung 12
University. [email protected] 13
4. Wan-Chi Ida Wu, PhD, Department of Public Health, College of Medicine, National 14
Cheng Kung University, Tainan, Taiwan. [email protected] 15
5. Susan C. Hu, PhD, Department of Public Health, College of Medicine, National Cheng 16
Kung University, Tainan, Taiwan. [email protected] 17
18
19
*Corresponding author: Susan C. Hu, PhD 20
Dept. of Public Health, College of Medicine, National Cheng Kung University, 21
No.1, University Rd, Tainan, Taiwan, 70101 22
E-mail: [email protected] 23
Tel: +886-972-967800, Fax: +886-6-2359033 24
25
Running title: Exercise on depression 26
World count: Abstract 272, Text 3389 27
Number of figures: 1 28
Number of tables: 429
30
31
Page 1 of 26
For peer review only - http://bmjopen.bmj.com/site/about/guidelines.xhtml
BMJ Open
123456789101112131415161718192021222324252627282930313233343536373839404142434445464748495051525354555657585960
on March 11, 2022 by guest. P
rotected by copyright.http://bm
jopen.bmj.com
/B
MJ O
pen: first published as 10.1136/bmjopen-2016-014256 on 2 M
ay 2017. Dow
nloaded from

For peer review only
1
ABSTRACT 1
Objectives: to compare the effects of four different amounts of exercise for preventing 2
depressive symptoms in community-dwelling older adults. 3
Design: prospective cohort study. 4
Setting: a nationally representative sample in Taiwan. 5
Participants: Four waves of the survey “Taiwan Longitudinal Study on Aging (TLSA)” from 6
1996 to 2007 were analyzed. A total of 2,673 older adults aged 65 and over were recruited. 7
Primary and secondary outcome measures: Depressive symptoms were measured using 8
the Center for Epidemiologic Studies Depression scale (CESD). Four different types/amounts 9
of exercise were examined, including (1) 3 times/week, 15 min/time; (2) 3 times/week, 30 10
min/time; (3) 6 times/week, 15 min/time; and (4) 6 times/week, 30 min/time. All exercise 11
types were required to have at least moderate intensity. The impacts of different amounts of 12
exercise on depressive symptoms were analyzed using generalized linear mixed models. 13
Results: More than one fifth of the elder individuals under consideration had depressive 14
symptoms (CESD ≥10). About 38.6% of older adults met the lowest criteria for exercise type 15
1, and fewer (28.0%) met the highest criteria for type 4. Only exercise type 4 in the current 16
survey was initially related to lower depressive symptoms (OR=0.8, 95%CI=0.66-0.95). 17
However, after considering the interaction between time and changes in exercise patterns, the 18
results showed that all persistent exercise models, even if a very low amount (3 times/week, 19
15 min/time), had significantly preventive effects on depressive symptoms (OR=0.56~0.67). 20
Conclusion: Consistent exercise with at least 15-min per time, 3 times a week of moderate 21
intensity is significantly associated with lower risk of depressive symptoms. This low amount 22
of exercise may be easier to promote at the community and population level than other 23
alternatives. 24
Trial registration: registry number 104040 of the Institutional Ethics Committee of Chia-Yi 25
Christian Hospital. 26
27
Keywords: 28
Exercise, depression, mental health, elderly, generalized linear mixed models, cohort study. 29
30
Page 2 of 26
For peer review only - http://bmjopen.bmj.com/site/about/guidelines.xhtml
BMJ Open
123456789101112131415161718192021222324252627282930313233343536373839404142434445464748495051525354555657585960
on March 11, 2022 by guest. P
rotected by copyright.http://bm
jopen.bmj.com
/B
MJ O
pen: first published as 10.1136/bmjopen-2016-014256 on 2 M
ay 2017. Dow
nloaded from
For peer review only
2
Strengths and limitations of this study 1
� This is the first report to compare the effects of four different amounts of exercise on 2
preventing depressive symptoms in older adults. 3
� The strengths of this study include the fact that it is a nationally representative sample, a 4
longitudinal cohort design, an examination of the changes in exercise status over time, 5
and a proper consideration of statistical analysis methods. 6
� However, the effects of different variables for depression may be altered for different 7
cohorts because of changes in medicine, nutrition, or in the environment. 8
� The outcome event was performed the same time as the second visit to develop the 9
changes in exercise patterns, which may reduce the interpretation of a causal 10
relationship. 11
12
Page 3 of 26
For peer review only - http://bmjopen.bmj.com/site/about/guidelines.xhtml
BMJ Open
123456789101112131415161718192021222324252627282930313233343536373839404142434445464748495051525354555657585960
on March 11, 2022 by guest. P
rotected by copyright.http://bm
jopen.bmj.com
/B
MJ O
pen: first published as 10.1136/bmjopen-2016-014256 on 2 M
ay 2017. Dow
nloaded from

For peer review only
3
INTRODUCTION 1
Late life depression is an important health issue among different ethnic groups, affecting 2
13.7% of the population in the US and 20% of older Chinese adults in Taiwan.1-2
Depressive 3
disorder has been indicated as one of the top ten causes of years lived with disability among 4
188 countries based on the Global Burden of Disease Study, 2013.3 It has also been closely 5
linked to quality of life among community-dwelling older adults in many studies.4-6
6
Several relevant interventions have been suggested for preventing or treating depression 7
in addition to medicine. For instance, having a marital partner or having good social support 8
will significantly reduce the impacts of disability from depression.7 Psychological 9
intervention, especially group-based, has been shown to have benefits in regard to both 10
prevention and economic effects.8-10
Six weeks of healthy dietary practice has also been 11
helpful in reducing depressive symptoms, and the benefits may be sustained for as long as 2 12
years.11
13
However, even in ancient Greece, Hippocrates suggested that his patients exercise to 14
treat the behaviors of overconsumption, and Galen further instructed patients to exercise to 15
reduce troublesome depression.12
Many mechanisms of anti-depressive effects of exercise 16
were summarized in Rethorst, Wipfli, and Landers’s study.13
For example, four mechanisms 17
in hippocampal neurogenesis can be potentially facilitated by exercise: increases in 18
B-endorphins, vascular endothelial growth factor, brain-derived neurotrophic factor, and 19
serotonin. Thus, exercise is potentially an effective approach to treating or preventing 20
depression. 21
Little research has focused on the relationship between exercise and depressive 22
symptoms in the elderly. Among the limited number of studies, exercise seems to have 23
similar effects to those of some pharmacological treatments14
, but some meta-analysis studies 24
have yielded inconsistent results.15-17
Also, exercise did not always show benefits related to 25
preventing or treating depression because many of the studies did not control for previous 26
levels of depressive symptoms, and only a few included a follow-up period of more than 2 27
years. Furthermore, since exercise status changes as people age, how the transitional patterns 28
of exercise in older adults affect depressive symptoms has yet to be studied. 29
In addition, in the case of older adults, exercise programs must consider both intensity 30
and duration. The general recommendation for exercise by the American College of Sports 31
Medicine is moderate intensity; exercise is engaged in at least 30 minutes per day at least 5 32
days a week to accumulate a total of 150-300 minutes per week, or vigorous intensity of at 33
Page 4 of 26
For peer review only - http://bmjopen.bmj.com/site/about/guidelines.xhtml
BMJ Open
123456789101112131415161718192021222324252627282930313233343536373839404142434445464748495051525354555657585960
on March 11, 2022 by guest. P
rotected by copyright.http://bm
jopen.bmj.com
/B
MJ O
pen: first published as 10.1136/bmjopen-2016-014256 on 2 M
ay 2017. Dow
nloaded from

For peer review only
4
least 20 minutes per day for 3-5 days per week to a total of 75-100 minutes/week.18
However, 1
a recent study by Wen et al. indicated that a low amount of exercise, which is defined as 15 2
minutes per day or 90 minutes per week at moderate intensity, has proven beneficial in 3
reducing all-cause and all-cancer mortality.19
This result provides a more age-friendly 4
exercise model, which could be further explored in regard to its effects on depressive 5
symptoms in older adults. 6
Therefore, in this study, we use an 11-year cohort data from a population-based survey 7
to examine how different amounts of exercise affect depressive symptoms in older adults. 8
The purposes of the study were: (1) to examine the impacts of four different types of exercise 9
on preventing depressive symptoms in older adults using Taiwan as an example and (2) to test 10
the effects of changes in exercise status during a specific period of time on depressive 11
symptoms in the elderly. 12
13
METHODS 14
Study design and participants 15
This is a longitudinal cohort study, using nationally representative data from the survey 16
“Taiwan Longitudinal Study on Aging, TLSA.” The TLSA survey was undertaken as a 17
collaborative project between the University of Michigan, USA and the Health Promotion 18
Administration, Ministry of Health and Welfare, Taiwan. There were six waves of surveys for 19
those aged 60 and over in 1989, 1993, 1996, 1999, 2003 and 2007. Supplemental cases aged 20
50 and older were added to the cohort in 1996 and 2003. A three-stage proportional-to-size 21
probability sampling technique was used in the survey, and face-to-face interviews were 22
conducted with each individual. The response rates in each wave were high, ranging from 23
81.2% to 91.4%. 24
Since detailed exercise questionnaires were launched in 1996, we combined two cohorts 25
(cohort B aged 67+ and cohort A aged 50-66) in 1996 as our study cohort. The inclusion 26
criterion was aged 65 and older; the exclusion criteria included those who did not complete 27
the relevant questionnaires, lived in institutions, or answered by proxy. We used the 1999 28
survey as the baseline and followed subjects up to 2007. A total of 2,673 valid participants 29
was selected as the baseline, and 5923 observations were counted. 30
Due to the significant effects of previous depressive symptoms and changes in exercise 31
behavior on depression, we used more retrospective data as control variables from the 1996 32
survey when analyzing the effects in 1999. Thus, the total number of observations in the 33
Page 5 of 26
For peer review only - http://bmjopen.bmj.com/site/about/guidelines.xhtml
BMJ Open
123456789101112131415161718192021222324252627282930313233343536373839404142434445464748495051525354555657585960
on March 11, 2022 by guest. P
rotected by copyright.http://bm
jopen.bmj.com
/B
MJ O
pen: first published as 10.1136/bmjopen-2016-014256 on 2 M
ay 2017. Dow
nloaded from
For peer review only
5
four-wave surveys was 8,397. The flow chart of the valid sample size is shown in Figure 1. 1
This study was approved by the Institutional Ethics Committee of Chia-Yi Christian Hospital 2
(registry number 104040). 3
4
Fig. 1: No. of participants in the four-wave surveys 5
6
Measurements 7
Dependent Variable: Depressive Symptoms 8
Depressive symptoms were measured with the Center for Epidemiologic Studies 9
Depression Scale (CESD). This 20-item scale assessment20
was modified to a 10-item scale21
, 10
which was used in the TLSA survey. Each item was scored from 0 to 3, making the total 11
score range from 0 to 30. The measure, with a cutoff score of 10, has been recommended as a 12
good tool to assess depressive symptom severity at the community level.22
Because level of 13
depressive symptoms is associated with future depression and quality of life23-24
, we 14
categorized the level of depressive symptoms into No Depressive Symptom (NDS), defined 15
as CESD=0; Lower Level of Depressive Symptoms (LLDS), 0<CESD≤9; and Higher Level 16
of Depressive Symptoms (HLDS), CESD≥10. 17
18
Independent Variables: Types/amount of exercise and Changing patterns 19
The degree of exercise was quantified by asking about the frequency (0, ≤2, 3-5, ≥6 20
times per week), duration (<15 min, 15-30 min, >30 min), and intensity based on sweating 21
level (none, a little, a lot, none of the above) and panting level (none, a little, a lot, none of 22
the above) after exercise. 23
Four types/amount of exercise were classified in this study. Exercise type 1 means that 24
exercise of at least moderate intensity was performed ≥3 times/week, ≥15 min/time (T3_15); 25
Exercise type 2 means ≥3 times/week, >30 min/time (T3_30); Exercise type 3 means ≥6 26
times/week, ≥15 min/time (T6_15); Exercise type 4 means ≥6 times/week, >30 min/time 27
(T6_30). Moderate intensity was defined as experiencing some sweating and panting after 28
exercise.18
29
Patterns of exercise consistency refers to changes in the practice of respective exercise 30
types between two waves, which was classified as (a) Low pattern (pattern NN): the 31
respective exercise type was not practiced in the previous or in the current surveys; (b) 32
Declining pattern (pattern YN): the respective exercise type was practiced in the previous but 33
not in the current surveys; (c) Increasing pattern (pattern NY): the respective exercise type 34
Page 6 of 26
For peer review only - http://bmjopen.bmj.com/site/about/guidelines.xhtml
BMJ Open
123456789101112131415161718192021222324252627282930313233343536373839404142434445464748495051525354555657585960
on March 11, 2022 by guest. P
rotected by copyright.http://bm
jopen.bmj.com
/B
MJ O
pen: first published as 10.1136/bmjopen-2016-014256 on 2 M
ay 2017. Dow
nloaded from

For peer review only
6
was practiced in the current but not in the previous surveys; and (d) Persistent pattern (pattern 1
YY): the respective exercise type was practiced in both the previous and in the current 2
surveys. In the analysis, all models were based on paired observations between two waves, 3
for example, 1996-1999, 1999-2003, 2003-2007. Therefore, when someone exercised in 2003 4
and 2007 but not 1999, he/she was counted twice, as “increasing pattern” in 1999-2003 and 5
as “persistent pattern” in 2003-2007. 6
7
Control Variables 8
Sociodemographic variables included gender, age, marital status (married or living with 9
a partner was coded as 1, otherwise 0), level of education (none, elementary, junior high 10
school, senior high school, and college and above), economic satisfaction (dissatisfied, 11
satisfied) and employment status (yes/no). 12
Physical function involved reversing the scale of a 4-point measurement inquiring the 13
level of difficulty of seven mobility tasks, including standing for 15 min, squatting, raising 14
both arms up, grasping with fingers, lifting an 11 kg weight, running 20-30 m, and climbing 15
up two to three floors. The sum of the physical battery ranged from 0-21. A higher score 16
indicated a better physical battery. These measurements have been reported as hierarchically 17
associated with instrumental and basic activities of daily living.25
18
Social participation refers to participation in any of the following groups: volunteers, 19
community groups, religious groups, occupational associations, political parties or groups, 20
social service groups, clan associations, senior groups, or schools. Social participation was 21
coded as a binary variable (yes/no). 22
Emotional support was the summed scores of seven items, which were coded from 0 to 3, 23
including (1) family/relatives/friends care about you; (2) family/relatives/friends listen to you; 24
(3) you can count on family/relatives/friends when you are ill; (4) you are satisfied with the 25
support from your family/relatives/friends. (5) How often do your family or friends come to 26
you for opinions? (6) In what ways do you feel that you are helpful to your family or friends? 27
(7) How often do you feel rejected by your family/relatives/friends? The last item was scored 28
reversely. 29
Health-related variables included self-rated health (poor, fair and good) and other binary 30
variables such as current smoking and 10 chronic conditions including cancer, chronic 31
respiratory disease, gastrointestinal disease, hypertension, diabetes mellitus, heart disease, 32
stroke, arthritis, hepatobiliary disease and renal disease. 33
34
Page 7 of 26
For peer review only - http://bmjopen.bmj.com/site/about/guidelines.xhtml
BMJ Open
123456789101112131415161718192021222324252627282930313233343536373839404142434445464748495051525354555657585960
on March 11, 2022 by guest. P
rotected by copyright.http://bm
jopen.bmj.com
/B
MJ O
pen: first published as 10.1136/bmjopen-2016-014256 on 2 M
ay 2017. Dow
nloaded from
For peer review only
7
Statistical analysis 1
The descriptive analysis of depressive symptoms and covariates were presented as a 2
mean ± standard deviation (SD) or as n (%) for continuous or categorical data, respectively. 3
We applied generalized linear mixed models (GLMMs) via PROC GLIMMIX to estimate the 4
effects of different transitional patterns of exercise on depressive symptoms with HLDS as 5
the event, after adjusting for the previous CESD score, age, gender, level of education, 6
marital status, smoking, physical function, emotional support, social participation, self-rated 7
health, economic satisfaction, employment, and 10 chronic conditions. The interaction of 8
time and transitional patterns of exercise was also included in the above analysis. A two-sided 9
p-value <0.05 was considered statistically significant. All data was merged and analyzed 10
using SAS 9.2 (SAS Institute, Cary, NC). 11
12
RESULTS 13
There were 2,673 valid subjects selected from the survey conducted in 1999, and a total 14
of 8,397 observations in four survey waves. Table 1 shows the distribution of characteristics 15
for the subjects from 1999 (baseline) to 2007. At baseline, the average age was 74.2 ± 5.7 16
years old, of which 54.5% were male. The prevalence of LLDS and HLDS was 20~24% over 17
time. About 38.6% of participants met the lowest criteria of T3_15, and fewer (28.0%) met 18
the highest criteria of T6_30. Noticeably, in any survey, exercise models T3_15 and T6_15 19
have a higher proportion than T3_30 and T6_30. This may imply the difficulty for older 20
adults to engage in long periods of exercise. 21
Table 2 illustrates the odd ratios (OR) of HLDS according to the current practices of 22
exercise models and other determining factors. Only exercise type 4 (T6_30) had a significant 23
reducing effect on HLDS (OR=0.80, 95% CI=0.66-0.95). Also, the previous level of 24
depressive symptoms, physical function, emotional support, self-rated health and economic 25
satisfaction were all positively predictive of HLDS. 26
Table 3 shows the predictive effects of previous exercise models for higher levels of 27
depressive symptoms. However, none of the four exercise models in the previous survey 28
could predict the presence of higher levels of depressive symptoms. Namely, previous 29
exercise behavior appeared to have no benefits on reducing depression, regardless of the 30
amount or type of exercise. This may suggest that the effects of exercise on depressive 31
symptoms are only concurrent and short-term. 32
Thus, we conducted another test to examine the effect of changes in different exercise 33
Page 8 of 26
For peer review only - http://bmjopen.bmj.com/site/about/guidelines.xhtml
BMJ Open
123456789101112131415161718192021222324252627282930313233343536373839404142434445464748495051525354555657585960
on March 11, 2022 by guest. P
rotected by copyright.http://bm
jopen.bmj.com
/B
MJ O
pen: first published as 10.1136/bmjopen-2016-014256 on 2 M
ay 2017. Dow
nloaded from

For peer review only
8
models on depressive symptoms, as shown in Table 4. After controlling for other determining 1
factors and considering the interaction of time and patterns of exercise, the results indicated 2
that only persistent patterns (pattern YY) reveal a significant protective effect from higher 3
levels of depressive symptoms, regardless of exercise type (OR=0.58, 0.56, 0.67, 0.62, 4
respectively, all p<0.05). Namely, even the lower amount of exercise (T3_15) may have 5
protective effects on depression as long as older adults continuously reach moderate intensity 6
for at least 15 minutes with a frequency of no less than three times a week. 7
8
DISCUSSION 9
Very limited research has been conducted to determine the long-term effects of different 10
exercise models on depressive symptoms in the elderly. The purpose of the current study was 11
to examine the impacts of four different types of exercise on depressive symptoms in 12
community-dwelling older adults. We found that only current exercise type 4 (T6_30) was 13
significantly associated with lower depressive symptoms, whereas previous exercise behavior 14
seemed to have no benefits with regard to reducing depression. However, when considering 15
the changes in exercise behavior between two waves, this study shows that different patterns 16
of exercise are significantly associated with HLDS outcomes. Only the persistent patterns of 17
exercise (pattern YY) revealed a significant protective effect from higher levels of depressive 18
symptoms. 19
Furthermore, this study shows that persistent low-volume exercise, i.e. ≥15 min of 20
moderate intensity exercise (T3_15 and T6_15), can provide preventive effects on depressive 21
symptoms, similar to the benefits of high-volume exercise, i.e. ≥30 min of moderate intensity 22
exercise (T3_30 and T6_30), in older adults. These findings suggest that short, age-friendly 23
exercise types may benefit older adults both physically and psychologically. 24
Comparing similar studies from Ku et al., where they suggested that exercise frequency 25
may be important for depressive symptoms26
and where the changing pattern of the low-low 26
group led to a high risk of developing depressive symtoms27
, our study revealed that 27
consistency may be the key factor, regardless the frequency or duration of exercise, as long as 28
the exercise is of moderate intensity. Namely, both exercise frequencies of ≥3 times/week or 29
≥6 times/week with at least 15- or 30- minutes each time showed significantly negative 30
association with higher levels of depressive symptoms in this study. These results indicate the 31
importance of the consistency of exercise. 32
Noticeably, the study by Ku et al. analyzed only traditional types of physical activity 33
Page 9 of 26
For peer review only - http://bmjopen.bmj.com/site/about/guidelines.xhtml
BMJ Open
123456789101112131415161718192021222324252627282930313233343536373839404142434445464748495051525354555657585960
on March 11, 2022 by guest. P
rotected by copyright.http://bm
jopen.bmj.com
/B
MJ O
pen: first published as 10.1136/bmjopen-2016-014256 on 2 M
ay 2017. Dow
nloaded from
For peer review only
9
according to frequency, while in this study, we compared four types of physical activity and 1
measured physical activity simultaneously by using three dimensions, including frequency, 2
duration and intensity. In addition, we considered important covariates related to depressive 3
symptoms, such as social participation, emotional support, mobility, and self-rated health, 4
among others. Therefore, we believe our results can substantially contribute to the existing 5
knowledge of the relationship between physical activity and depressive symptoms. 6
Another study using a Taiwanese national survey suggested promoting high intensity, 7
rather than frequent or long duration exercise, to improve mental well-being in older adults,28
8
the results of which are not completely compatible with our findings. However, the nature of 9
the cross-sectional study design used in that study may have caused it to have a higher 10
possibility of over-interpretation of the results. Less depressed people may be more likely to 11
engage in higher intensity exercise as compared to more depressed people. Our longitudinal 12
study suggests that a low amount of exercise also has benefits related to preventing 13
depressive symptoms. Furthermore, transitional patterns of exercise may be more important 14
than the current exercise models that people are practicing. 15
Physical inactivity was found to be among the top 10 leading risk factors for the global 16
disease burden in 2010.29
It is important to promote exercise, especially among older adults, 17
who are more vulnerable to physical and psychological dysfunction. The general 18
recommendation for older adults is moderate intensity exercise accumulated to at least 30 19
min each day for at least 5 days a week to total 150-300 min/week, or vigorous intensity 20
exercise at least 20-30 min per day for 3-5 days per week to total 75-100 min/week.18
21
However, East Asians usually engage in fewer physical activities at lower intensity than 22
people in western countries.30-31
In consideration of physical conditions, it would be helpful 23
to determine the minimal volume of exercise for older adults required to improve their health. 24
This study showed that the percentage of participants who engaged in exercise type 25
T6_15 was higher than that of T3_30 and T6_30, which indicates that lower intensity, higher 26
frequency exercise may be more acceptable to older people than higher intensity exercise at a 27
lower frequency. Furthermore, the low-volume exercise type has been shown to have benefits 28
related to reducing all-cause mortality and all-cancer mortality.19, 32
Therefore, based on the 29
findings of our study, we feel confident about concluding that persistent low-amount exercise 30
with the same moderate intensity (at least ≥15 min/ 6 times/ week) may also benefit older 31
adults both physically and psychologically. 32
Because of the social stigma of depressive symptoms, many people with this condition 33
tend to remain under-treated. When unable to appropriately address the causes or when there 34
Page 10 of 26
For peer review only - http://bmjopen.bmj.com/site/about/guidelines.xhtml
BMJ Open
123456789101112131415161718192021222324252627282930313233343536373839404142434445464748495051525354555657585960
on March 11, 2022 by guest. P
rotected by copyright.http://bm
jopen.bmj.com
/B
MJ O
pen: first published as 10.1136/bmjopen-2016-014256 on 2 M
ay 2017. Dow
nloaded from

For peer review only
10
is no access to adequate non-medical or community services to treat depression, patients may 1
become further burdened due to a lack of solutions for specific conditions.33
Our study 2
provides a practical and non-medical option to prevent higher levels of depressive symptoms. 3
Most importantly, it will help reduce the unnecessary use of medication, which sometimes 4
causes adverse drug reactions in older adults, and it may also help people when they lack 5
awareness of their disorder or are reluctant to be treated. 6
Still, there are several other factors affecting depressive symptoms. Depression is 7
significantly associated with chronic medical conditions, problems with ADLs, poor social 8
support, and previous depressive conditions.7, 34-35
Functional limitations and arthritis are 9
among the strong risk factors in chronic conditions for depression.36
Physical function, 10
emotional support, self-rated health, and economic satisfaction were consistently shown to 11
significantly influence HLDS in all analyses in our study. However, among the 12
above-mentioned factors, exercise is the more changeable variable, which could also benefit 13
physical function and self-rated health. 14
This is the first report to examine the impacts of four different types of exercise on 15
depressive symptoms in the elderly according to the recommendations of different 16
experts.18-19
However, there have been previous studies that have examined the relationship 17
between physical activity and depressive symptoms in the elderly with different definitions of 18
exercise groups in different areas (city/rural).37-38
Thus, to compare the results, the 19
compatibility of participants, the exercise measurement, and the categories of the exercise 20
groups should be carefully considered. The advantages of this study include the fact that it 21
included a nationally representative sample, a longitudinal cohort design, a test of different 22
amount of exercise, an examination of the changes in exercise status over time, and a proper 23
consideration of statistical analysis methods. 24
Nonetheless, the study has some limitations. Firstly, the observation for the outcome 25
event was performed the same time as the second visit to develop the variables for 26
transitional patterns of exercise, which may have reduced the interpretation of a causal 27
relationship if the association between current exercise and the outcome event is too strong. 28
However, if the assumption is true, the bias will support the null hypothesis. The results 29
indicate that the significantly protective effects of a persistent pattern of exercise are 30
consistent across all types of exercise considered in this study. The increasing exercise 31
pattern did not result in the same finding although both patterns indicated that the subjects 32
had practiced the respective exercises on their second visit. We are therefore comfortable 33
with inferring that a persistent pattern of exercise has more influence than increasing and 34
Page 11 of 26
For peer review only - http://bmjopen.bmj.com/site/about/guidelines.xhtml
BMJ Open
123456789101112131415161718192021222324252627282930313233343536373839404142434445464748495051525354555657585960
on March 11, 2022 by guest. P
rotected by copyright.http://bm
jopen.bmj.com
/B
MJ O
pen: first published as 10.1136/bmjopen-2016-014256 on 2 M
ay 2017. Dow
nloaded from

For peer review only
11
other transitional patterns of exercise. Secondly, the effects of different variables for HLDS 1
may be altered for different cohorts because of changes in medicine, antidepressants, 2
nutrition or in the environment. This may limit the application of the findings of this study. 3
Thirdly, the measurement for physical activity did not include a timeframe but only asked 4
participants “Do you usually engage in exercise?” This may reduce the reliability of the 5
measurement of exercise. However, most of the time, when a questionnaire does not mention 6
a timeframe, it implies “in the past year.” Lastly, activities of daily living (ADL) was not 7
included in the analysis because it may include those who cannot perform exercise. We used 8
physical function ability, which has shown to be hierarchically associated with instrumental 9
and basic ADL25
to control for any differences related to limitations in mobility. 10
11
CONCLUSION 12
Consistent exercise comprised of at least 15-min per time, 3 times a week of moderate 13
intensity is significantly associated with lower risk of depressive symptoms. Increasing the 14
frequency to more than 5 times per week will benefit older adults both physically and 15
psychologically. We recommend taking this low amount of exercise into serious consideration 16
when designing exercise programs related to older adults. 17
18
Page 12 of 26
For peer review only - http://bmjopen.bmj.com/site/about/guidelines.xhtml
BMJ Open
123456789101112131415161718192021222324252627282930313233343536373839404142434445464748495051525354555657585960
on March 11, 2022 by guest. P
rotected by copyright.http://bm
jopen.bmj.com
/B
MJ O
pen: first published as 10.1136/bmjopen-2016-014256 on 2 M
ay 2017. Dow
nloaded from
For peer review only
12
Acknowledgements 1
We would like to thank the Health Promotion Administration, Ministry of Health and 2
Welfare of Taiwan for providing the dataset for analysis. 3
Contributors 4
Y-CC and M-CL designed and conducted the study and wrote the daft; I-HH analyzed 5
the data and interpreted the tables; W-CW conducted the literature review and revised the 6
draft; SCH advised the whole study and completed the manuscript. All authors contributed to 7
the interpretation of results, critically reviewed the draft, and approved the final manuscript. 8
Funding 9
This study was supported by Research Center for Humanities and Social Sciences, 10
National Cheng Kung University, (H10-A304, FD101037). 11
Competing interests 12
None declared. 13
Ethical approval 14
This study was approved by the Institutional Ethics Committee of Chia-Yi Christian 15
Hospital (registry number 104040). 16
Provenance and peer review 17
Not commissioned; externally peer reviewed. 18
Data sharing statement 19
No additional data are available. 20
21
Page 13 of 26
For peer review only - http://bmjopen.bmj.com/site/about/guidelines.xhtml
BMJ Open
123456789101112131415161718192021222324252627282930313233343536373839404142434445464748495051525354555657585960
on March 11, 2022 by guest. P
rotected by copyright.http://bm
jopen.bmj.com
/B
MJ O
pen: first published as 10.1136/bmjopen-2016-014256 on 2 M
ay 2017. Dow
nloaded from

For peer review only
13
References 1
1. Laborde‐Lahoz P, El‐Gabalawy R, Kinley J, et al. Subsyndromal depression among 2
older adults in the USA: prevalence, comorbidity, and risk for new‐onset psychiatric 3
disorders in late life. Int J Geriatr Psychiatry 2015;30:677-85. 4
2. Chong MY, Tsang HY, Chen CS, et al. Community study of depression in old age in 5
Taiwan: prevalence, life events and socio-demographic correlates. Br J Psychiatry 6
2001;178:29-35. 7
3. Global Burden of Disease Study C. Global, regional, and national incidence, prevalence, 8
and years lived with disability for 301 acute and chronic diseases and injuries in 188 9
countries, 1990-2013: a systematic analysis for the Global Burden of Disease Study 10
2013. Lancet 2015;386:743-800. 11
4. Chang YC, Yao G, Hu SC, et al. Depression Affects the Scores of All Facets of the 12
WHOQOL-BREF and May Mediate the Effects of Physical Disability among 13
Community-Dwelling Older Adults. PLoS One 2015;10:e0128356. 14
5. Webb E, Blane D, McMunn A, et al. Proximal predictors of change in quality of life at 15
older ages. J Epidemiol Community Health 2011;65:542-7. 16
6. Garin N, Olaya B, Moneta MV, et al. Impact of multimorbidity on disability and quality 17
of life in the Spanish older population. PLoS One 2014;9:e111498. 18
7. Schoevers RA, Beekman AT, Deeg DJ, et al. Risk factors for depression in later life; 19
results of a prospective community based study (AMSTEL). J Affect Disord 20
2000;59:127-37. 21
8. Veerman JL, Shrestha RN, Mihalopoulos C, et al. Depression prevention, labour force 22
participation and income of older working aged Australians: A microsimulation 23
economic analysis. Aust N Z J Psychiatry 2015;49:430-6. 24
9. Lee SY, Franchetti MK, Imanbayev A, et al. Non-pharmacological prevention of major 25
depression among community-dwelling older adults: a systematic review of the efficacy 26
of psychotherapy interventions. Arch Gerontol Geriatr 2012;55:522-9. 27
10. Forsman AK, Schierenbeck I, Wahlbeck K. Psychosocial interventions for the 28
prevention of depression in older adults: systematic review and meta-analysis. J Aging 29
Health 2011;23:387-416. 30
11. Stahl ST, Albert SM, Dew MA, et al. Coaching in healthy dietary practices in at-risk 31
older adults: a case of indicated depression prevention. Am J Psychiatry 32
2014;171:499-505. 33
Page 14 of 26
For peer review only - http://bmjopen.bmj.com/site/about/guidelines.xhtml
BMJ Open
123456789101112131415161718192021222324252627282930313233343536373839404142434445464748495051525354555657585960
on March 11, 2022 by guest. P
rotected by copyright.http://bm
jopen.bmj.com
/B
MJ O
pen: first published as 10.1136/bmjopen-2016-014256 on 2 M
ay 2017. Dow
nloaded from

For peer review only
14
12. Tipton CM. The history of "Exercise Is Medicine" in ancient civilizations. Adv Physiol 1
Educ 2014;38:109-17. 2
13. Rethorst CD, Wipfli BM, Landers DM. The antidepressive effects of exercise: a 3
meta-analysis of randomized trials. Sports Med 2009;39:491-511. 4
14. Brenes GA, Williamson JD, Messier SP, et al. Treatment of minor depression in older 5
adults: a pilot study comparing sertraline and exercise. Aging Ment Health 2007;11:61-8. 6
15. Cooney GM, Dwan K, Greig CA, et al. Exercise for depression. Cochrane Database 7
Syst Rev 2013;9:CD004366. 8
16. Walker JG, Mackinnon AJ, Batterham P, et al. Mental health literacy, folic acid and 9
vitamin B12, and physical activity for the prevention of depression in older adults: 10
randomised controlled trial. Br J Psychiatry 2010;197:45-54. 11
17. Rhyner KT, Watts A. Exercise and Depressive Symptoms in Older Adults: A Systematic 12
Meta-Analytic Review. J Aging Phys Act 2016;24:234-246. 13
18. Pescatello LS. ACSM's Guidelines for Exercise Testing and Prescription. 9th Edition, 14
edited by American College of Sports Medicine; 2013. 15
19. Wen CP, Wai JP, Tsai MK, et al. Minimum amount of physical activity for reduced 16
mortality and extended life expectancy: a prospective cohort study. Lancet 17
2011;378:1244-53. 18
20. Radloff LS. The CES-D scale: a self-reported depression scale for research in the 19
general population. Appl Psychol Meas 1977;I:385-401. 20
21. Kohout FJ, Berkman LF, Evans DA,et al. Two shorter forms of the CES-D (Center for 21
Epidemiological Studies Depression) depression symptoms index. J Aging Health 22
1993;5:179-93. 23
22. Bjorgvinsson T, Kertz SJ, Bigda-Peyton JS,et al. Psychometric properties of the 24
CES-D-10 in a psychiatric sample. Assessment 2013;20:429-36. 25
23. Lyness JM, Chapman BP, McGriff J,et al. One-year outcomes of minor and 26
subsyndromal depression in older primary care patients. Int Psychogeriatr 2009;21:60-8. 27
24. Chang YC, Ouyang WC, Lu MC,et al. Levels of depressive symptoms may modify the 28
relationship between the WHOQOL-BREF and its determining factors in 29
community-dwelling older adults. Int Psychogeriatr 2016;28:591-601. 30
25. Chen HY, Wang CY, Lee MY,et al. A hierarchical categorisation of tasks in mobility 31
disability. Disabil Rehabil 2010;32:1586-93. 32
26. Ku PW, Fox KR, Chen LJ, et al. Physical activity and depressive symptoms in older 33
adults: 11-year follow-up. Am J Prev Med 2012;42:355-62. 34
Page 15 of 26
For peer review only - http://bmjopen.bmj.com/site/about/guidelines.xhtml
BMJ Open
123456789101112131415161718192021222324252627282930313233343536373839404142434445464748495051525354555657585960
on March 11, 2022 by guest. P
rotected by copyright.http://bm
jopen.bmj.com
/B
MJ O
pen: first published as 10.1136/bmjopen-2016-014256 on 2 M
ay 2017. Dow
nloaded from

For peer review only
15
27. Ku PW, Fox KR, Chen LJ. Physical activity and depressive symptoms in Taiwanese 1
older adults: a seven-year follow-up study. Prev Med 2009;48:250-5. 2
28. Chen LJ, Stevinson C, Ku PW, et al. Relationships of leisure-time and non-leisure-time 3
physical activity with depressive symptoms: a population-based study of Taiwanese 4
older adults. Int J Behav Nutr Phys Act 2012;9:28. 5
29. Lim SS, Vos T, Flaxman AD, et al. A comparative risk assessment of burden of disease 6
and injury attributable to 67 risk factors and risk factor clusters in 21 regions, 1990-2010: 7
a systematic analysis for the Global Burden of Disease Study 2010. Lancet 8
2012;380:2224-60. 9
30. Ku PW, Fox KR, McKenna J, et al. Prevalence of leisure-time physical activity in 10
Taiwanese adults: results of four national surveys, 2000-2004. Prev Med 2006;43:454-7. 11
31. Wai JP, Wen CP, Chan HT, et al. Assessing physical activity in an Asian country: low 12
energy expenditure and exercise frequency among adults in Taiwan. Asia Pac J Clin 13
Nutr 2008;17:297-308. 14
32. Hubbard RE, Fallah N, Searle SD, et al. Impact of exercise in community-dwelling older 15
adults. PLoS One 2009;4:e6174. 16
33. Bird MJ, Parslow RA. Potential for community programs to prevent depression in older 17
people. Med J Aust 2002;177 Suppl:S107-10. 18
34. Schoevers RA, Geerlings MI, Beekman AT, et al. Association of depression and gender 19
with mortality in old age. Results from the Amsterdam Study of the Elderly (AMSTEL). 20
Br J Psychiatry 2000;177:336-42. 21
35. Roberts RE, Kaplan GA, Shema SJ, et al. Does growing old increase the risk for 22
depression? Am J Psychiatry 1997;154:1384-90. 23
36. Dunlop DD, Lyons JS, Manheim LM, et al. Arthritis and heart disease as risk factors for 24
major depression: the role of functional limitation. Med Care 2004;42:502-11. 25
37. Lampinen P, Heikkinen E. Reduced mobility and physical activity as predictors of 26
depressive symptoms among community-dwelling older adults: an eight-year follow-up 27
study. Aging Clin Exp Res 2003;15:205-11. 28
38. Yoshida Y, Iwasa H, Kumagai S, Suzuki T, Awata S, Yoshida H. Longitudinal 29
association between habitual physical activity and depressive symptoms in older people. 30
Psychiatry Clin Neurosci 2015;69:686-92. 31
32
Page 16 of 26
For peer review only - http://bmjopen.bmj.com/site/about/guidelines.xhtml
BMJ Open
123456789101112131415161718192021222324252627282930313233343536373839404142434445464748495051525354555657585960
on March 11, 2022 by guest. P
rotected by copyright.http://bm
jopen.bmj.com
/B
MJ O
pen: first published as 10.1136/bmjopen-2016-014256 on 2 M
ay 2017. Dow
nloaded from

For peer review only
16
1
Table 1 Characteristics of the participants from 1999 to 2007 2
Variables
1999 2003 2007
N=2673 N=1889 N=1361
n (%) n (%) n (%)
Age 74.2 ± 5.7 77.1 ± 5.1 80.2 ± 4.7
Male 1456 (54.5) 1019 (53.9) 703 (51.7)
Level of depressive symptoms
NDS 1401 (52.5) 1049 (55.5) 708 (52.0)
LLDS 646 (24.2) 388 (20.5) 321 (23.6)
HLDS 624 (23.4) 452 (23.9) 332 (24.4)
M±SD 6.1 ± 6.4 5.7 ± 5.9 5.8 ± 6.1
Types/amount of exercise*
T3_15 1032 (38.6) 810 (42.9) 562 (41.3)
T3_30 859 (32.1) 671 (35.5) 450 (33.1)
T6_15 922 (34.5) 742 (39.3) 498 (36.6)
T6_30 749 (28.0) 603 (31.9) 386 (28.4)
Education
No 1111 (41.6) 733 (38.8) 507 (37.3)
Elementary 983 (36.8) 723 (38.3) 515 (37.8)
Junior high school 273 (10.2) 200 (10.6) 155 (11.4)
Senior high school 162 (6.1) 124 (6.6) 96 (7.1)
College and above 143 (5.4) 109 (5.8) 88 (6.5)
Married 1630 (61.0) 1096 (58.0) 727 (53.4)
Employment 322 (12.1) 142 (7.5) 84 (6.2)
Current smoking 595 (22.3) 344 (18.2) 189 (13.9)
Physical function 17.2 ± 4.8 16.2 ± 5.0 16.0 ± 5.1
Emotional support 18.1 ± 3.0 18.0 ± 2.9 18.4 ± 2.7
Social participation 1369 (51.2) 842 (44.6) 576 (42.3)
Self-rated health
Poor 934 (34.9) 707 (37.4) 481 (35.3)
Fair 927 (34.7) 583 (30.9) 531 (39.0)
Good 812 (30.4) 599 (31.7) 349 (25.6)
Economic satisfaction
Dissatisfied 544 (20.4) 407 (21.6) 271 (19.9)
Fair 1144 (42.9) 653 (34.6) 486 (35.7)
Satisfied 978 (36.7) 828 (43.9) 604 (44.4)
Chronic conditions
Page 17 of 26
For peer review only - http://bmjopen.bmj.com/site/about/guidelines.xhtml
BMJ Open
123456789101112131415161718192021222324252627282930313233343536373839404142434445464748495051525354555657585960
on March 11, 2022 by guest. P
rotected by copyright.http://bm
jopen.bmj.com
/B
MJ O
pen: first published as 10.1136/bmjopen-2016-014256 on 2 M
ay 2017. Dow
nloaded from

For peer review only
17
Cancer 71 (2.7) 61 (3.2) 54 (4.0)
Chronic respiratory disease 370 (13.8) 256 (13.6) 179 (13.2)
Gastrointestinal 543 (20.3) 402 (21.3) 301 (22.1)
Hypertension 1002 (37.5) 829 (43.9) 672 (49.4)
Diabetes mellitus 408 (15.3) 319 (16.9) 235 (17.3)
Heart disease 576 (21.6) 469 (24.8) 373 (27.4)
Stroke 144 (5.4) 126 (6.7) 83 (6.1)
Arthritis 594 (22.2) 465 (24.6) 322 (23.7)
Hepatobiliary disease 191 (7.2) 158 (8.4) 116 (8.5)
Renal disease 217 (8.1) 192 (10.2) 139 (10.2)
Data were presented as mean ± SD or n (%). 1
NDS: No Depressive Symptom (CESD=0); 2
LLDS: Lower Level of Depressive Symptoms (0<CESD≦9); 3
HLDS: Higher Level of Depressive Symptoms (CESD≧10); 4
CESD: Center for Epidemiologic Studies of Depression; 5
*T3_15: Exercise ≧moderate intensity, ≧3 times/week, ≧15 min/time; 6
T3_30: Exercise ≧moderate intensity, ≧3 times/week, ≧30 min/time; 7
T6_15: Exercise ≧moderate intensity, ≧6 times/week, ≧15 min/time; 8
T6_30: Exercise ≧moderate intensity, ≧6 times/week, ≧30 min/time. 9
Page 18 of 26
For peer review only - http://bmjopen.bmj.com/site/about/guidelines.xhtml
BMJ Open
123456789101112131415161718192021222324252627282930313233343536373839404142434445464748495051525354555657585960
on March 11, 2022 by guest. P
rotected by copyright.http://bm
jopen.bmj.com
/B
MJ O
pen: first published as 10.1136/bmjopen-2016-014256 on 2 M
ay 2017. Dow
nloaded from
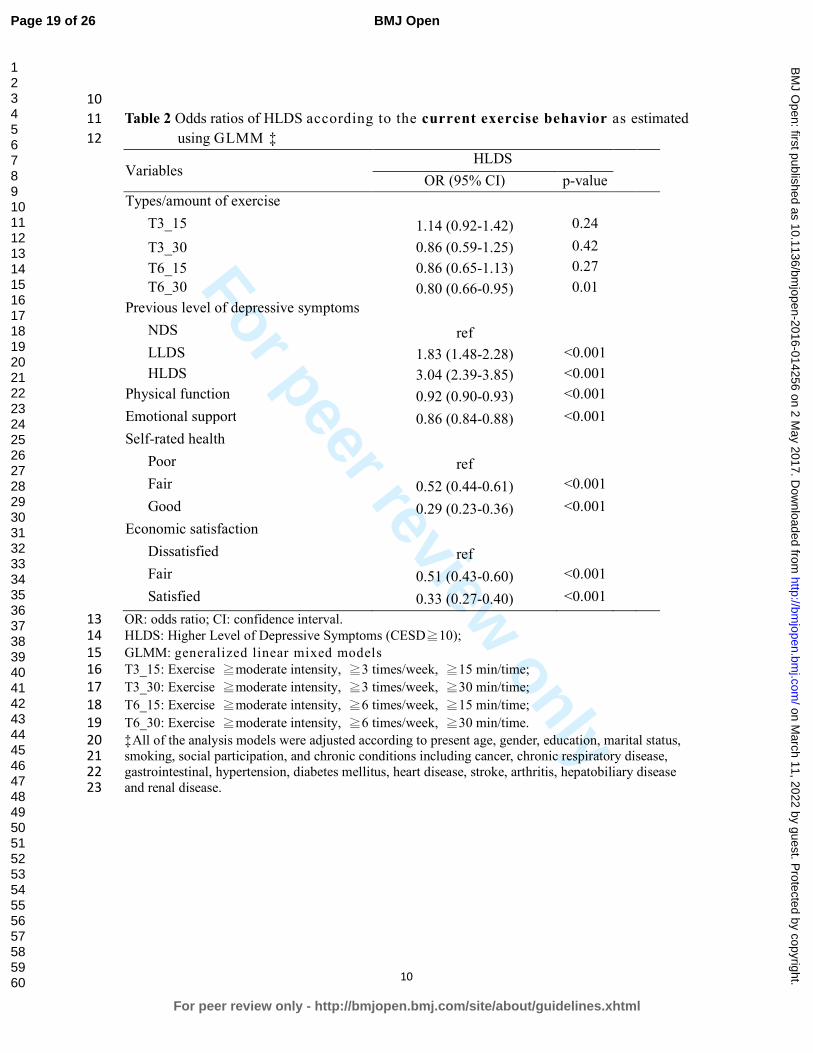
For peer review only
10
10
Table 2 Odds ratios of HLDS according to the current exercise behavior as estimated 11
using GLMM ‡ 12
Variables HLDS
OR (95% CI) p-value
Types/amount of exercise
T3_15 1.14 (0.92-1.42) 0.24
T3_30 0.86 (0.59-1.25) 0.42
T6_15 0.86 (0.65-1.13) 0.27
T6_30 0.80 (0.66-0.95) 0.01
Previous level of depressive symptoms
NDS ref
LLDS 1.83 (1.48-2.28) <0.001
HLDS 3.04 (2.39-3.85) <0.001
Physical function 0.92 (0.90-0.93) <0.001
Emotional support 0.86 (0.84-0.88) <0.001
Self-rated health
Poor ref
Fair 0.52 (0.44-0.61) <0.001
Good 0.29 (0.23-0.36) <0.001
Economic satisfaction
Dissatisfied ref
Fair 0.51 (0.43-0.60) <0.001
Satisfied 0.33 (0.27-0.40) <0.001
OR: odds ratio; CI: confidence interval. 13
HLDS: Higher Level of Depressive Symptoms (CESD≧10); 14
GLMM: generalized linear mixed models 15
T3_15: Exercise ≧moderate intensity, ≧3 times/week, ≧15 min/time; 16
T3_30: Exercise ≧moderate intensity, ≧3 times/week, ≧30 min/time; 17
T6_15: Exercise ≧moderate intensity, ≧6 times/week, ≧15 min/time; 18
T6_30: Exercise ≧moderate intensity, ≧6 times/week, ≧30 min/time. 19
‡All of the analysis models were adjusted according to present age, gender, education, marital status, 20
smoking, social participation, and chronic conditions including cancer, chronic respiratory disease, 21
gastrointestinal, hypertension, diabetes mellitus, heart disease, stroke, arthritis, hepatobiliary disease 22
and renal disease. 23
Page 19 of 26
For peer review only - http://bmjopen.bmj.com/site/about/guidelines.xhtml
BMJ Open
123456789101112131415161718192021222324252627282930313233343536373839404142434445464748495051525354555657585960
on March 11, 2022 by guest. P
rotected by copyright.http://bm
jopen.bmj.com
/B
MJ O
pen: first published as 10.1136/bmjopen-2016-014256 on 2 M
ay 2017. Dow
nloaded from

For peer review only
11
24
Table 3 Odds ratios of HLDS according to the previous exercise behavior as 25
estimated by GLMM‡ 26
Variables HLDS
OR (95% CI) p-value
Previous exercise types/amount
T3_15 0.88 (0.72-1.06) 0.17
T3_30 1.05 (0.76-1.46) 0.77
T6_15 0.98 (0.79-1.23) 0.89
T6_30 0.68 (0.44-1.07) 0.10
Previous level of depressive symptoms
NDS ref
LLDS 1.86 (1.50-2.31) <0.001
HLDS 3.12 (2.46-3.96) <0.001
Physical function 0.92 (0.90-0.93) <0.001
Emotional support 0.86 (0.84-0.88) <0.001
Self-rated health
Poor ref
Fair 0.52 (0.44-0.60) <0.001
Good 0.28 (0.23-0.35) <0.001
Economic satisfaction
Dissatisfied ref
Fair 0.51 (0.43-0.60) <0.001
Satisfied 0.33 (0.27-0.40) <0.001
OR: odds ratio; CI: confidence interval. 27
HLDS: Higher Level of Depressive Symptoms (CESD≧10); 28
GLMM: generalized linear mixed models 29
T3_15: Exercise ≧moderate intensity, ≧3 times/week, ≧15min/time; 30
T3_30: Exercise ≧moderate intensity, ≧3 times/week, ≧30min/time; 31
T6_15: Exercise ≧moderate intensity, ≧6 times/week, ≧15min/time; 32
T6_30: Exercise ≧moderate intensity, ≧6 times/week, ≧30min/time. 33
‡All of the analysis models were adjusted according to present age, gender, education, marital status, 34
smoking, social participation, and chronic conditions including cancer, chronic respiratory disease, 35
gastrointestinal, hypertension, diabetes mellitus, heart disease, stroke, arthritis, hepatobiliary disease 36
and renal disease. 37
38
Page 20 of 26
For peer review only - http://bmjopen.bmj.com/site/about/guidelines.xhtml
BMJ Open
123456789101112131415161718192021222324252627282930313233343536373839404142434445464748495051525354555657585960
on March 11, 2022 by guest. P
rotected by copyright.http://bm
jopen.bmj.com
/B
MJ O
pen: first published as 10.1136/bmjopen-2016-014256 on 2 M
ay 2017. Dow
nloaded from
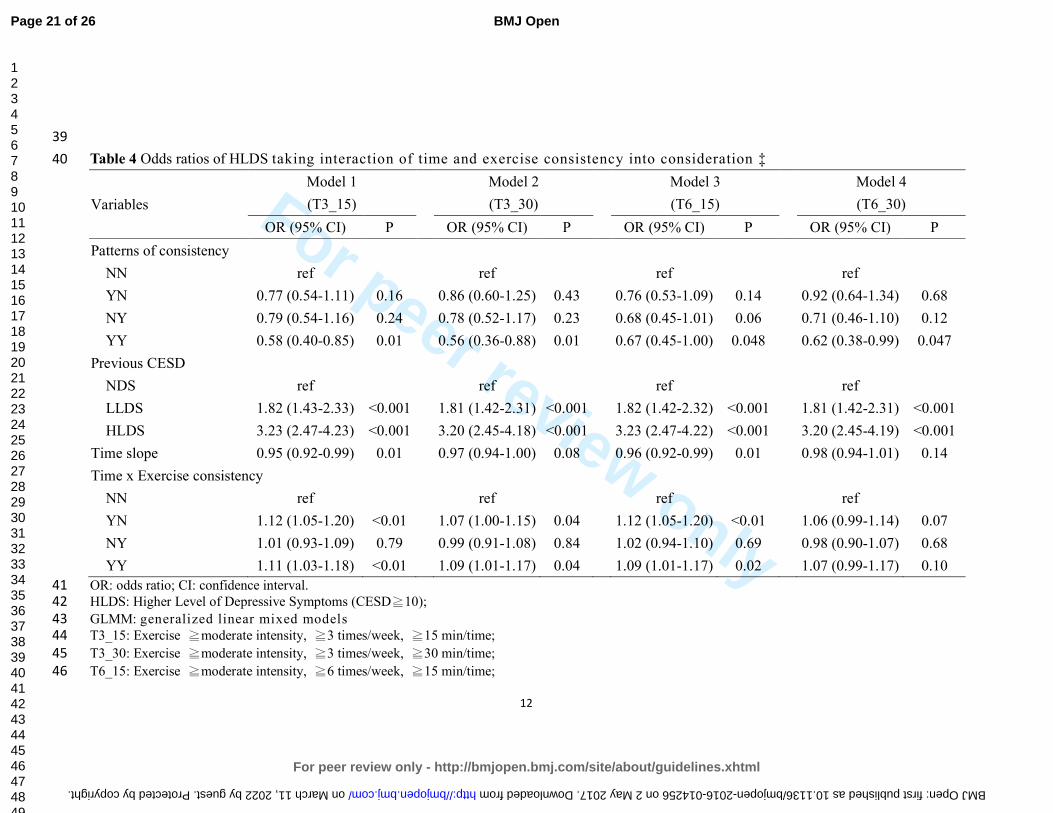
For peer review only
12
39
Table 4 Odds ratios of HLDS taking interaction of time and exercise consistency into consideration ‡ 40
Variables
Model 1
(T3_15)
Model 2
(T3_30)
Model 3
(T6_15)
Model 4
(T6_30)
OR (95% CI) P OR (95% CI) P OR (95% CI) P OR (95% CI) P
Patterns of consistency
NN ref ref ref ref
YN 0.77 (0.54-1.11) 0.16 0.86 (0.60-1.25) 0.43 0.76 (0.53-1.09) 0.14 0.92 (0.64-1.34) 0.68
NY 0.79 (0.54-1.16) 0.24 0.78 (0.52-1.17) 0.23 0.68 (0.45-1.01) 0.06 0.71 (0.46-1.10) 0.12
YY 0.58 (0.40-0.85) 0.01 0.56 (0.36-0.88) 0.01 0.67 (0.45-1.00) 0.048 0.62 (0.38-0.99) 0.047
Previous CESD
NDS ref ref ref ref
LLDS 1.82 (1.43-2.33) <0.001 1.81 (1.42-2.31) <0.001 1.82 (1.42-2.32) <0.001 1.81 (1.42-2.31) <0.001
HLDS 3.23 (2.47-4.23) <0.001 3.20 (2.45-4.18) <0.001 3.23 (2.47-4.22) <0.001 3.20 (2.45-4.19) <0.001
Time slope 0.95 (0.92-0.99) 0.01 0.97 (0.94-1.00) 0.08 0.96 (0.92-0.99) 0.01 0.98 (0.94-1.01) 0.14
Time x Exercise consistency
NN ref ref ref ref
YN 1.12 (1.05-1.20) <0.01 1.07 (1.00-1.15) 0.04 1.12 (1.05-1.20) <0.01 1.06 (0.99-1.14) 0.07
NY 1.01 (0.93-1.09) 0.79 0.99 (0.91-1.08) 0.84 1.02 (0.94-1.10) 0.69 0.98 (0.90-1.07) 0.68
YY 1.11 (1.03-1.18) <0.01 1.09 (1.01-1.17) 0.04 1.09 (1.01-1.17) 0.02 1.07 (0.99-1.17) 0.10
OR: odds ratio; CI: confidence interval. 41
HLDS: Higher Level of Depressive Symptoms (CESD≧10); 42
GLMM: generalized linear mixed models 43
T3_15: Exercise ≧moderate intensity, ≧3 times/week, ≧15 min/time; 44
T3_30: Exercise ≧moderate intensity, ≧3 times/week, ≧30 min/time; 45
T6_15: Exercise ≧moderate intensity, ≧6 times/week, ≧15 min/time; 46
Page 21 of 26
For peer review only - http://bmjopen.bmj.com/site/about/guidelines.xhtml
BMJ Open
123456789101112131415161718192021222324252627282930313233343536373839404142434445464748495051525354555657585960
on March 11, 2022 by guest. Protected by copyright. http://bmjopen.bmj.com/ BMJ Open: first published as 10.1136/bmjopen-2016-014256 on 2 May 2017. Downloaded from
For peer review only
13
T6_30: Exercise ≧moderate intensity, ≧6 times/week, ≧30 min/time. 47
NN: Low pattern of exercise transition, indicating the respective exercise type was not practiced in either the previous or current survey. 48
YN: Declining pattern of exercise transition, indicating the respective exercise type was practiced in the previous but not in the current survey. 49
NY: Increasing pattern of exercise transition, indicating the respective exercise type was practiced in the current but not in the previous survey. 50
YY: Persistent pattern of exercise transition, indicating the respective exercise type was practiced in both the previous and current surveys. 51
‡All the analysis models were adjusted according to present age, gender, education, marital status, smoking, physical function, emotional support, social 52
participation, self-rated health, economic satisfaction, employment and chronic conditions including cancer, chronic respiratory disease, gastrointestinal, 53
hypertension, diabetes mellitus, heart disease, stroke, arthritis, hepatobiliary disease and renal disease. 54
55
56
Page 22 of 26
For peer review only - http://bmjopen.bmj.com/site/about/guidelines.xhtml
BMJ Open
123456789101112131415161718192021222324252627282930313233343536373839404142434445464748495051525354555657585960
on March 11, 2022 by guest. Protected by copyright. http://bmjopen.bmj.com/ BMJ Open: first published as 10.1136/bmjopen-2016-014256 on 2 May 2017. Downloaded from

For peer review only
179x129mm (300 x 300 DPI)
Page 23 of 26
For peer review only - http://bmjopen.bmj.com/site/about/guidelines.xhtml
BMJ Open
123456789101112131415161718192021222324252627282930313233343536373839404142434445464748495051525354555657585960
on March 11, 2022 by guest. P
rotected by copyright.http://bm
jopen.bmj.com
/B
MJ O
pen: first published as 10.1136/bmjopen-2016-014256 on 2 M
ay 2017. Dow
nloaded from
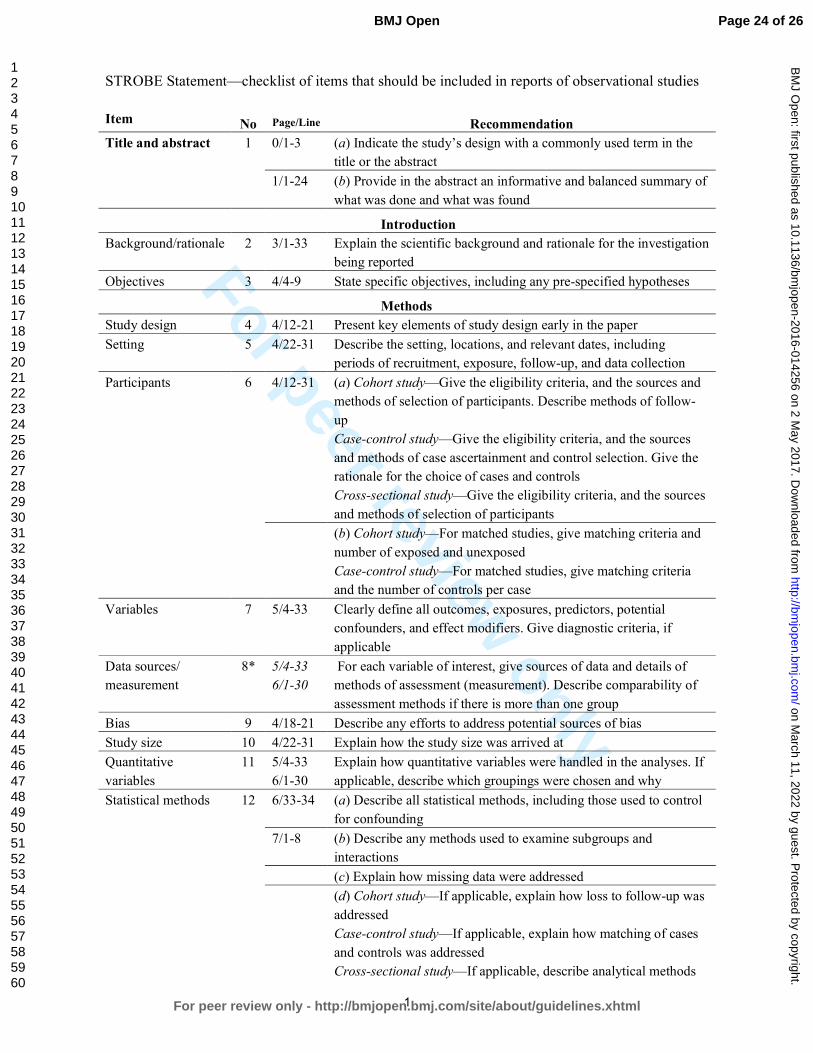
For peer review only
1
STROBE Statement—checklist of items that should be included in reports of observational studies
Item No Page/Line Recommendation
Title and abstract 1 0/1-3 (a) Indicate the study’s design with a commonly used term in the
title or the abstract
1/1-24 (b) Provide in the abstract an informative and balanced summary of
what was done and what was found
Introduction
Background/rationale 2 3/1-33 Explain the scientific background and rationale for the investigation
being reported
Objectives 3 4/4-9 State specific objectives, including any pre-specified hypotheses
Methods
Study design 4 4/12-21 Present key elements of study design early in the paper
Setting 5 4/22-31 Describe the setting, locations, and relevant dates, including
periods of recruitment, exposure, follow-up, and data collection
Participants 6 4/12-31 (a) Cohort study—Give the eligibility criteria, and the sources and
methods of selection of participants. Describe methods of follow-
up
Case-control study—Give the eligibility criteria, and the sources
and methods of case ascertainment and control selection. Give the
rationale for the choice of cases and controls
Cross-sectional study—Give the eligibility criteria, and the sources
and methods of selection of participants
(b) Cohort study—For matched studies, give matching criteria and
number of exposed and unexposed
Case-control study—For matched studies, give matching criteria
and the number of controls per case
Variables 7 5/4-33 Clearly define all outcomes, exposures, predictors, potential
confounders, and effect modifiers. Give diagnostic criteria, if
applicable
Data sources/
measurement
8* 5/4-33
6/1-30
For each variable of interest, give sources of data and details of
methods of assessment (measurement). Describe comparability of
assessment methods if there is more than one group
Bias 9 4/18-21 Describe any efforts to address potential sources of bias
Study size 10 4/22-31 Explain how the study size was arrived at
Quantitative
variables
11 5/4-33
6/1-30
Explain how quantitative variables were handled in the analyses. If
applicable, describe which groupings were chosen and why
Statistical methods 12 6/33-34 (a) Describe all statistical methods, including those used to control
for confounding
7/1-8 (b) Describe any methods used to examine subgroups and
interactions
(c) Explain how missing data were addressed
(d) Cohort study—If applicable, explain how loss to follow-up was
addressed
Case-control study—If applicable, explain how matching of cases
and controls was addressed
Cross-sectional study—If applicable, describe analytical methods
Page 24 of 26
For peer review only - http://bmjopen.bmj.com/site/about/guidelines.xhtml
BMJ Open
123456789101112131415161718192021222324252627282930313233343536373839404142434445464748495051525354555657585960
on March 11, 2022 by guest. P
rotected by copyright.http://bm
jopen.bmj.com
/B
MJ O
pen: first published as 10.1136/bmjopen-2016-014256 on 2 M
ay 2017. Dow
nloaded from

For peer review only
2
taking account of sampling strategy
(e) Describe any sensitivity analyses
(Continue)
Item No Page/Line Results
Participants 13* 7/11-13 (a) Report numbers of individuals at each stage of study—eg
numbers potentially eligible, examined for eligibility, confirmed
eligible, included in the study, completing follow-up, and analysed
(b) Give reasons for non-participation at each stage
(c) Consider use of a flow diagram
Descriptive
data
14* 7/13-18 (a) Give characteristics of study participants (eg demographic,
clinical, social) and information on exposures and potential
confounders
(b) Indicate number of participants with missing data for each
variable of interest
(c) Cohort study—Summarise follow-up time (eg, average and total
amount)
Outcome data 15* 7/19-23 Cohort study—Report numbers of outcome events or summary
measures over time
Case-control study—Report numbers in each exposure category, or
summary measures of exposure
Cross-sectional study—Report numbers of outcome events or
summary measures
Main results 16 7/24-33
8/1-4
(a) Give unadjusted estimates and, if applicable, confounder-adjusted
estimates and their precision (eg, 95% confidence interval). Make
clear which confounders were adjusted for and why they were
included
(b) Report category boundaries when continuous variables were
categorized
(c) If relevant, consider translating estimates of relative risk into
absolute risk for a meaningful time period
Other analyses 17 8/1-4 Report other analyses done—eg analyses of subgroups and
interactions, and sensitivity analyses
Discussion
Key results 18 8/7-21 Summarise key results with reference to study objectives
Limitations 19 10/22-34
11/1-7
Discuss limitations of the study, taking into account sources of
potential bias or imprecision. Discuss both direction and magnitude
of any potential bias
Interpretation 20 8/22-33
9/1-34
Give a cautious overall interpretation of results considering
objectives, limitations, multiplicity of analyses, results from similar
studies, and other relevant evidence
Generalisability 21 10/4-21 Discuss the generalisability (external validity) of the study results
Other information
Funding 22 12/9-11 Give the source of funding and the role of the funders for the present
study and, if applicable, for the original study on which the present
article is based
Page 25 of 26
For peer review only - http://bmjopen.bmj.com/site/about/guidelines.xhtml
BMJ Open
123456789101112131415161718192021222324252627282930313233343536373839404142434445464748495051525354555657585960
on March 11, 2022 by guest. P
rotected by copyright.http://bm
jopen.bmj.com
/B
MJ O
pen: first published as 10.1136/bmjopen-2016-014256 on 2 M
ay 2017. Dow
nloaded from

For peer review only
3
*Give information separately for cases and controls in case-control studies and, if applicable, for exposed
and unexposed groups in cohort and cross-sectional studies.
Note: An Explanation and Elaboration article discusses each checklist item and gives methodological
background and published examples of transparent reporting. The STROBE checklist is best used in
conjunction with this article (freely available on the Web sites of PLoS Medicine at
http://www.plosmedicine.org/, Annals of Internal Medicine at http://www.annals.org/, and Epidemiology at
http://www.epidem.com/). Information on the STROBE Initiative is available at www.strobe-statement.org.
Page 26 of 26
For peer review only - http://bmjopen.bmj.com/site/about/guidelines.xhtml
BMJ Open
123456789101112131415161718192021222324252627282930313233343536373839404142434445464748495051525354555657585960
on March 11, 2022 by guest. P
rotected by copyright.http://bm
jopen.bmj.com
/B
MJ O
pen: first published as 10.1136/bmjopen-2016-014256 on 2 M
ay 2017. Dow
nloaded from

For peer review only
Effects of different amounts of exercise on preventing depressive symptoms in community-dwelling older adults: a
prospective cohort study in Taiwan
Journal: BMJ Open
Manuscript ID bmjopen-2016-014256.R3
Article Type: Research
Date Submitted by the Author: 26-Feb-2017
Complete List of Authors: Chang, Yu-Chen ; Ditmanson Medical Foundation Chia-Yi Christian Hospital, Community Health Lu, Mei-Chun ; Kuang Tien General Hospital, Medical Research
Hu, I-Han; National Cheng Kung University College of Medicine, Institute of Gerontology Wu, Wan-Chi; National Cheng Kung University College of Medicine, Public Health Hu, Susan; National Cheng Kung University College of Medicine, Public Health
<b>Primary Subject Heading</b>:
Mental health
Secondary Subject Heading: Geriatric medicine, Epidemiology, Sports and exercise medicine
Keywords: EPIDEMIOLOGY, MENTAL HEALTH, Depression & mood disorders < PSYCHIATRY, SPORTS MEDICINE
For peer review only - http://bmjopen.bmj.com/site/about/guidelines.xhtml
BMJ Open on M
arch 11, 2022 by guest. Protected by copyright.
http://bmjopen.bm
j.com/
BM
J Open: first published as 10.1136/bm
jopen-2016-014256 on 2 May 2017. D
ownloaded from
For peer review only
Effects of different amounts of exercise on preventing depressive symptoms 1
in community-dwelling older adults: a prospective cohort study in Taiwan 2
3
Yu-Chen Chang1, Mei-Chun Lu
2, I-Han Hu
3, Wan-Chi Ida Wu
4, Susan C. Hu
5* 4
5
6
1. Yu-Chen Chang, MD, PhD, Department of Community Health, Chia-Yi Christian 7
Hospital, Chia-Yi, Taiwan. [email protected] 8
2. Mei-Chun Lu, MS, Department of Medical Research, Kuang Tien General Hospital, 9
Taichung, Taiwan. [email protected] 10
3. I-Han Hu, MS, Institute of Gerontology, College of Medicine, National Cheng Kung 11
University. [email protected] 12
4. Wan-Chi Ida Wu, PhD, Department of Public Health, College of Medicine, National 13
Cheng Kung University, Tainan, Taiwan. [email protected] 14
5. Susan C. Hu, PhD, Department of Public Health, College of Medicine, National Cheng 15
Kung University, Tainan, Taiwan. [email protected] 16
17
18
*Corresponding author: Susan C. Hu, PhD 19
Dept. of Public Health, College of Medicine, National Cheng Kung University, 20
No.1, University Rd, Tainan, Taiwan, 70101 21
E-mail: [email protected] 22
Tel: +886-972-967800, Fax: +886-6-2359033 23
24
Running title: Exercise on depression 25
World count: Abstract 272, Text 3389 26
Number of figures: 1 27
Number of tables: 428
29
30
Page 1 of 26
For peer review only - http://bmjopen.bmj.com/site/about/guidelines.xhtml
BMJ Open
123456789101112131415161718192021222324252627282930313233343536373839404142434445464748495051525354555657585960
on March 11, 2022 by guest. P
rotected by copyright.http://bm
jopen.bmj.com
/B
MJ O
pen: first published as 10.1136/bmjopen-2016-014256 on 2 M
ay 2017. Dow
nloaded from

For peer review only
1
ABSTRACT 1
Objectives: to compare the effects of four different amounts of exercise for preventing 2
depressive symptoms in community-dwelling older adults. 3
Design: prospective cohort study. 4
Setting: a nationally representative sample in Taiwan. 5
Participants: Four waves of the survey “Taiwan Longitudinal Study on Aging (TLSA)” from 6
1996 to 2007 were analyzed. A total of 2,673 older adults aged 65 and over were recruited. 7
Primary and secondary outcome measures: Depressive symptoms were measured using 8
the Center for Epidemiologic Studies Depression scale (CESD). Four different types/amounts 9
of exercise were examined, including (1) 3 times/week, 15 min/time; (2) 3 times/week, 30 10
min/time; (3) 6 times/week, 15 min/time; and (4) 6 times/week, 30 min/time. All exercise 11
types were required to have at least moderate intensity. The impacts of different amounts of 12
exercise on depressive symptoms were analyzed using generalized linear mixed models. 13
Results: More than one fifth of the elder individuals under consideration had depressive 14
symptoms (CESD ≥10). About 38.6% of older adults met the lowest criteria for exercise type 15
1, and fewer (28.0%) met the highest criteria for type 4. Only exercise type 4 in the current 16
survey was initially related to lower depressive symptoms (OR=0.8, 95%CI=0.66-0.95). 17
However, after considering the interaction between time and changes in exercise patterns, the 18
results showed that all persistent exercise models, even if a very low amount (3 times/week, 19
15 min/time), had significantly preventive effects on depressive symptoms (OR=0.56~0.67). 20
Conclusion: Consistent exercise with at least 15-min per time, 3 times a week of moderate 21
intensity is significantly associated with lower risk of depressive symptoms. This low amount 22
of exercise may be easier to promote at the community and population level than other 23
alternatives. 24
Trial registration: registry number 104040 of the Institutional Ethics Committee of Chia-Yi 25
Christian Hospital. 26
27
Keywords: 28
Exercise, depression, mental health, elderly, generalized linear mixed models, cohort study. 29
30
Page 2 of 26
For peer review only - http://bmjopen.bmj.com/site/about/guidelines.xhtml
BMJ Open
123456789101112131415161718192021222324252627282930313233343536373839404142434445464748495051525354555657585960
on March 11, 2022 by guest. P
rotected by copyright.http://bm
jopen.bmj.com
/B
MJ O
pen: first published as 10.1136/bmjopen-2016-014256 on 2 M
ay 2017. Dow
nloaded from

For peer review only
2
Strengths and limitations of this study 1
� This is the first report to compare the effects of four different amounts of exercise on 2
preventing depressive symptoms in older adults. 3
� The strengths of this study include the fact that it is a nationally representative sample, a 4
longitudinal cohort design, an examination of the changes in exercise status over time, 5
and a proper consideration of statistical analysis methods. 6
� However, the effects of different variables for depression may be altered for different 7
cohorts because of changes in medicine, nutrition, or in the environment. 8
� The outcome event was performed the same time as the second visit to develop the 9
changes in exercise patterns, which may reduce the interpretation of a causal 10
relationship. 11
12
Page 3 of 26
For peer review only - http://bmjopen.bmj.com/site/about/guidelines.xhtml
BMJ Open
123456789101112131415161718192021222324252627282930313233343536373839404142434445464748495051525354555657585960
on March 11, 2022 by guest. P
rotected by copyright.http://bm
jopen.bmj.com
/B
MJ O
pen: first published as 10.1136/bmjopen-2016-014256 on 2 M
ay 2017. Dow
nloaded from

For peer review only
3
INTRODUCTION 1
Late life depression is an important health issue among different ethnic groups, affecting 2
13.7% of the population in the US and 20% of older Chinese adults in Taiwan.1-2
Depressive 3
disorder has been indicated as one of the top ten causes of years lived with disability among 4
188 countries based on the Global Burden of Disease Study, 2013.3 It has also been closely 5
linked to quality of life among community-dwelling older adults in many studies.4-6
6
Several relevant interventions have been suggested for preventing or treating depression 7
in addition to medicine. For instance, having a marital partner or having good social support 8
will significantly reduce the impacts of disability from depression.7 Psychological 9
intervention, especially group-based, has been shown to have benefits in regard to both 10
prevention and economic effects.8-10
Six weeks of healthy dietary practice has also been 11
helpful in reducing depressive symptoms, and the benefits may be sustained for as long as 2 12
years.11
13
However, even in ancient Greece, Hippocrates suggested that his patients exercise to 14
treat the behaviors of overconsumption, and Galen further instructed patients to exercise to 15
reduce troublesome depression.12
Many mechanisms of anti-depressive effects of exercise 16
were summarized in Rethorst, Wipfli, and Landers’s study.13
For example, four mechanisms 17
in hippocampal neurogenesis can be potentially facilitated by exercise: increases in 18
B-endorphins, vascular endothelial growth factor, brain-derived neurotrophic factor, and 19
serotonin. Thus, exercise is potentially an effective approach to treating or preventing 20
depression. 21
Little research has focused on the relationship between exercise and depressive 22
symptoms in the elderly. Among the limited number of studies, exercise seems to have 23
similar effects to those of some pharmacological treatments14
, but some meta-analysis studies 24
have yielded inconsistent results.15-17
Also, exercise did not always show benefits related to 25
preventing or treating depression because many of the studies did not control for previous 26
levels of depressive symptoms, and only a few included a follow-up period of more than 2 27
years. Furthermore, since exercise status changes as people age, how the transitional patterns 28
of exercise in older adults affect depressive symptoms has yet to be studied. 29
In addition, in the case of older adults, exercise programs must consider both intensity 30
and duration. The general recommendation for exercise by the American College of Sports 31
Medicine is moderate intensity; exercise is engaged in at least 30 minutes per day at least 5 32
days a week to accumulate a total of 150-300 minutes per week, or vigorous intensity of at 33
Page 4 of 26
For peer review only - http://bmjopen.bmj.com/site/about/guidelines.xhtml
BMJ Open
123456789101112131415161718192021222324252627282930313233343536373839404142434445464748495051525354555657585960
on March 11, 2022 by guest. P
rotected by copyright.http://bm
jopen.bmj.com
/B
MJ O
pen: first published as 10.1136/bmjopen-2016-014256 on 2 M
ay 2017. Dow
nloaded from
For peer review only
4
least 20 minutes per day for 3-5 days per week to a total of 75-100 minutes/week.18
However, 1
a recent study by Wen et al. indicated that a low amount of exercise, which is defined as 15 2
minutes per day or 90 minutes per week at moderate intensity, has proven beneficial in 3
reducing all-cause and all-cancer mortality.19
This result provides a more age-friendly 4
exercise model, which could be further explored in regard to its effects on depressive 5
symptoms in older adults. 6
Therefore, in this study, we use an 11-year cohort data from a population-based survey 7
to examine how different amounts of exercise affect depressive symptoms in older adults. 8
The purposes of the study were: (1) to examine the impacts of four different types of exercise 9
on preventing depressive symptoms in older adults using Taiwan as an example and (2) to test 10
the effects of changes in exercise status during a specific period of time on depressive 11
symptoms in the elderly. 12
13
METHODS 14
Study design and participants 15
This is a longitudinal cohort study, using nationally representative data from the survey 16
“Taiwan Longitudinal Study on Aging, TLSA.” The TLSA survey was undertaken as a 17
collaborative project between the University of Michigan, USA and the Health Promotion 18
Administration, Ministry of Health and Welfare, Taiwan. There were six waves of surveys for 19
those aged 60 and over in 1989, 1993, 1996, 1999, 2003 and 2007. Supplemental cases aged 20
50 and older were added to the cohort in 1996 and 2003. A three-stage proportional-to-size 21
probability sampling technique was used in the survey, and face-to-face interviews were 22
conducted with each individual. The response rates in each wave were high, ranging from 23
81.2% to 91.4%. 24
Since detailed exercise questionnaires were launched in 1996, we combined two cohorts 25
(cohort B aged 67+ and cohort A aged 50-66) in 1996 as our study cohort. The inclusion 26
criterion was aged 65 and older; the exclusion criteria included those who did not complete 27
the relevant questionnaires, lived in institutions, or answered by proxy. We used the 1999 28
survey as the baseline and followed subjects up to 2007. A total of 2,673 valid participants 29
was selected as the baseline, and 5923 observations were counted. 30
Due to the significant effects of previous depressive symptoms and changes in exercise 31
behavior on depression, we used more retrospective data as control variables from the 1996 32
survey when analyzing the effects in 1999. Thus, the total number of observations in the 33
Page 5 of 26
For peer review only - http://bmjopen.bmj.com/site/about/guidelines.xhtml
BMJ Open
123456789101112131415161718192021222324252627282930313233343536373839404142434445464748495051525354555657585960
on March 11, 2022 by guest. P
rotected by copyright.http://bm
jopen.bmj.com
/B
MJ O
pen: first published as 10.1136/bmjopen-2016-014256 on 2 M
ay 2017. Dow
nloaded from

For peer review only
5
four-wave surveys was 8,397. The flow chart of the valid sample size is shown in Figure 1. 1
This study was approved by the Institutional Ethics Committee of Chia-Yi Christian Hospital 2
(registry number 104040). 3
4
Fig. 1: No. of participants in the four-wave surveys 5
6
Measurements 7
Dependent Variable: Depressive Symptoms 8
Depressive symptoms were measured with the Center for Epidemiologic Studies 9
Depression Scale (CESD). This 20-item scale assessment20
was modified to a 10-item scale21
, 10
which was used in the TLSA survey. Each item was scored from 0 to 3, making the total 11
score range from 0 to 30. The measure, with a cutoff score of 10, has been recommended as a 12
good tool to assess depressive symptom severity at the community level.22
Because level of 13
depressive symptoms is associated with future depression and quality of life23-24
, we 14
categorized the level of depressive symptoms into No Depressive Symptom (NDS), defined 15
as CESD=0; Lower Level of Depressive Symptoms (LLDS), 0<CESD≤9; and Higher Level 16
of Depressive Symptoms (HLDS), CESD≥10. 17
18
Independent Variables: Types/amount of exercise and Changing patterns 19
The degree of exercise was quantified by asking about the frequency (0, ≤2, 3-5, ≥6 20
times per week), duration (<15 min, 15-30 min, >30 min), and intensity based on sweating 21
level (none, a little, a lot, none of the above) and panting level (none, a little, a lot, none of 22
the above) after exercise. 23
Four types/amount of exercise were classified in this study. Exercise type 1 means that 24
exercise of at least moderate intensity was performed ≥3 times/week, ≥15 min/time (T3_15); 25
Exercise type 2 means ≥3 times/week, >30 min/time (T3_30); Exercise type 3 means ≥6 26
times/week, ≥15 min/time (T6_15); Exercise type 4 means ≥6 times/week, >30 min/time 27
(T6_30). Moderate intensity was defined as experiencing some sweating and panting after 28
exercise.18
29
Patterns of exercise consistency refers to changes in the practice of respective exercise 30
types between two waves, which was classified as (a) Low pattern (pattern NN): the 31
respective exercise type was not practiced in the previous or in the current surveys; (b) 32
Declining pattern (pattern YN): the respective exercise type was practiced in the previous but 33
not in the current surveys; (c) Increasing pattern (pattern NY): the respective exercise type 34
Page 6 of 26
For peer review only - http://bmjopen.bmj.com/site/about/guidelines.xhtml
BMJ Open
123456789101112131415161718192021222324252627282930313233343536373839404142434445464748495051525354555657585960
on March 11, 2022 by guest. P
rotected by copyright.http://bm
jopen.bmj.com
/B
MJ O
pen: first published as 10.1136/bmjopen-2016-014256 on 2 M
ay 2017. Dow
nloaded from

For peer review only
6
was practiced in the current but not in the previous surveys; and (d) Persistent pattern (pattern 1
YY): the respective exercise type was practiced in both the previous and in the current 2
surveys. In the analysis, all models were based on paired observations between two waves, 3
for example, 1996-1999, 1999-2003, 2003-2007. Therefore, when someone exercised in 2003 4
and 2007 but not 1999, he/she was counted twice, as “increasing pattern” in 1999-2003 and 5
as “persistent pattern” in 2003-2007. 6
7
Control Variables 8
Sociodemographic variables included gender, age, marital status (married or living with 9
a partner was coded as 1, otherwise 0), level of education (none, elementary, junior high 10
school, senior high school, and college and above), economic satisfaction (dissatisfied, 11
satisfied) and employment status (yes/no). 12
Physical function involved reversing the scale of a 4-point measurement inquiring the 13
level of difficulty of seven mobility tasks, including standing for 15 min, squatting, raising 14
both arms up, grasping with fingers, lifting an 11 kg weight, running 20-30 m, and climbing 15
up two to three floors. The sum of the physical battery ranged from 0-21. A higher score 16
indicated a better physical battery. These measurements have been reported as hierarchically 17
associated with instrumental and basic activities of daily living.25
18
Social participation refers to participation in any of the following groups: volunteers, 19
community groups, religious groups, occupational associations, political parties or groups, 20
social service groups, clan associations, senior groups, or schools. Social participation was 21
coded as a binary variable (yes/no). 22
Emotional support was the summed scores of seven items, which were coded from 0 to 3, 23
including (1) family/relatives/friends care about you; (2) family/relatives/friends listen to you; 24
(3) you can count on family/relatives/friends when you are ill; (4) you are satisfied with the 25
support from your family/relatives/friends. (5) How often do your family or friends come to 26
you for opinions? (6) In what ways do you feel that you are helpful to your family or friends? 27
(7) How often do you feel rejected by your family/relatives/friends? The last item was scored 28
reversely. 29
Health-related variables included self-rated health (poor, fair and good) and other binary 30
variables such as current smoking and 10 chronic conditions including cancer, chronic 31
respiratory disease, gastrointestinal disease, hypertension, diabetes mellitus, heart disease, 32
stroke, arthritis, hepatobiliary disease and renal disease. 33
34
Page 7 of 26
For peer review only - http://bmjopen.bmj.com/site/about/guidelines.xhtml
BMJ Open
123456789101112131415161718192021222324252627282930313233343536373839404142434445464748495051525354555657585960
on March 11, 2022 by guest. P
rotected by copyright.http://bm
jopen.bmj.com
/B
MJ O
pen: first published as 10.1136/bmjopen-2016-014256 on 2 M
ay 2017. Dow
nloaded from

For peer review only
7
Statistical analysis 1
The descriptive analysis of depressive symptoms and covariates were presented as a 2
mean ± standard deviation (SD) or as n (%) for continuous or categorical data, respectively. 3
We applied generalized linear mixed models (GLMMs) via PROC GLIMMIX to estimate the 4
effects of different transitional patterns of exercise on depressive symptoms with HLDS as 5
the event, after adjusting for the previous CESD score, age, gender, level of education, 6
marital status, smoking, physical function, emotional support, social participation, self-rated 7
health, economic satisfaction, employment, and 10 chronic conditions. The interaction of 8
time and transitional patterns of exercise was also included in the above analysis. A two-sided 9
p-value <0.05 was considered statistically significant. All data was merged and analyzed 10
using SAS 9.2 (SAS Institute, Cary, NC). 11
12
RESULTS 13
There were 2,673 valid subjects selected from the survey conducted in 1999, and a total 14
of 8,397 observations in four survey waves. Table 1 shows the distribution of characteristics 15
for the subjects from 1999 (baseline) to 2007. At baseline, the average age was 74.2 ± 5.7 16
years old, of which 54.5% were male. The prevalence of LLDS and HLDS was 20~24% over 17
time. About 38.6% of participants met the lowest criteria of T3_15, and fewer (28.0%) met 18
the highest criteria of T6_30. Noticeably, in any survey, exercise models T3_15 and T6_15 19
have a higher proportion than T3_30 and T6_30. This may imply the difficulty for older 20
adults to engage in long periods of exercise. 21
Table 2 illustrates the odd ratios (OR) of HLDS according to the current practices of 22
exercise models and other determining factors. Only exercise type 4 (T6_30) had a significant 23
reducing effect on HLDS (OR=0.80, 95% CI=0.66-0.95). Also, the previous level of 24
depressive symptoms, physical function, emotional support, self-rated health and economic 25
satisfaction were all positively predictive of HLDS. 26
Table 3 shows the predictive effects of previous exercise models for higher levels of 27
depressive symptoms. However, none of the four exercise models in the previous survey 28
could predict the presence of higher levels of depressive symptoms. Namely, previous 29
exercise behavior appeared to have no benefits on reducing depression, regardless of the 30
amount or type of exercise. This may suggest that the effects of exercise on depressive 31
symptoms are only concurrent and short-term. 32
Thus, we conducted another test to examine the effect of changes in different exercise 33
Page 8 of 26
For peer review only - http://bmjopen.bmj.com/site/about/guidelines.xhtml
BMJ Open
123456789101112131415161718192021222324252627282930313233343536373839404142434445464748495051525354555657585960
on March 11, 2022 by guest. P
rotected by copyright.http://bm
jopen.bmj.com
/B
MJ O
pen: first published as 10.1136/bmjopen-2016-014256 on 2 M
ay 2017. Dow
nloaded from

For peer review only
8
models on depressive symptoms, as shown in Table 4. After controlling for other determining 1
factors and considering the interaction of time and patterns of exercise, the results indicated 2
that only persistent patterns (pattern YY) reveal a significant protective effect from higher 3
levels of depressive symptoms, regardless of exercise type (OR=0.58, 0.56, 0.67, 0.62, 4
respectively, all p<0.05). Namely, even the lower amount of exercise (T3_15) may have 5
protective effects on depression as long as older adults continuously reach moderate intensity 6
for at least 15 minutes with a frequency of no less than three times a week. 7
8
DISCUSSION 9
Very limited research has been conducted to determine the long-term effects of different 10
exercise models on depressive symptoms in the elderly. The purpose of the current study was 11
to examine the impacts of four different types of exercise on depressive symptoms in 12
community-dwelling older adults. We found that only current exercise type 4 (T6_30) was 13
significantly associated with lower depressive symptoms, whereas previous exercise behavior 14
seemed to have no benefits with regard to reducing depression. However, when considering 15
the changes in exercise behavior between two waves, this study shows that different patterns 16
of exercise are significantly associated with HLDS outcomes. Only the persistent patterns of 17
exercise (pattern YY) revealed a significant protective effect from higher levels of depressive 18
symptoms. 19
Furthermore, this study shows that persistent low-volume exercise, i.e. ≥15 min of 20
moderate intensity exercise (T3_15 and T6_15), can provide preventive effects on depressive 21
symptoms, similar to the benefits of high-volume exercise, i.e. ≥30 min of moderate intensity 22
exercise (T3_30 and T6_30), in older adults. These findings suggest that short, age-friendly 23
exercise types may benefit older adults both physically and psychologically. 24
Comparing similar studies from Ku et al., where they suggested that exercise frequency 25
may be important for depressive symptoms26
and where the changing pattern of the low-low 26
group led to a high risk of developing depressive symtoms27
, our study revealed that 27
consistency may be the key factor, regardless the frequency or duration of exercise, as long as 28
the exercise is of moderate intensity. Namely, both exercise frequencies of ≥3 times/week or 29
≥6 times/week with at least 15- or 30- minutes each time showed significantly negative 30
association with higher levels of depressive symptoms in this study. These results indicate the 31
importance of the consistency of exercise. 32
Noticeably, the study by Ku et al. analyzed only traditional types of physical activity 33
Page 9 of 26
For peer review only - http://bmjopen.bmj.com/site/about/guidelines.xhtml
BMJ Open
123456789101112131415161718192021222324252627282930313233343536373839404142434445464748495051525354555657585960
on March 11, 2022 by guest. P
rotected by copyright.http://bm
jopen.bmj.com
/B
MJ O
pen: first published as 10.1136/bmjopen-2016-014256 on 2 M
ay 2017. Dow
nloaded from

For peer review only
9
according to frequency, while in this study, we compared four types of physical activity and 1
measured physical activity simultaneously by using three dimensions, including frequency, 2
duration and intensity. In addition, we considered important covariates related to depressive 3
symptoms, such as social participation, emotional support, mobility, and self-rated health, 4
among others. Therefore, we believe our results can substantially contribute to the existing 5
knowledge of the relationship between physical activity and depressive symptoms. 6
Another study using a Taiwanese national survey suggested promoting high intensity, 7
rather than frequent or long duration exercise, to improve mental well-being in older adults,28
8
the results of which are not completely compatible with our findings. However, the nature of 9
the cross-sectional study design used in that study may have caused it to have a higher 10
possibility of over-interpretation of the results. Less depressed people may be more likely to 11
engage in higher intensity exercise as compared to more depressed people. Our longitudinal 12
study suggests that a low amount of exercise also has benefits related to preventing 13
depressive symptoms. Furthermore, transitional patterns of exercise may be more important 14
than the current exercise models that people are practicing. 15
Physical inactivity was found to be among the top 10 leading risk factors for the global 16
disease burden in 2010.29
It is important to promote exercise, especially among older adults, 17
who are more vulnerable to physical and psychological dysfunction. The general 18
recommendation for older adults is moderate intensity exercise accumulated to at least 30 19
min each day for at least 5 days a week to total 150-300 min/week, or vigorous intensity 20
exercise at least 20-30 min per day for 3-5 days per week to total 75-100 min/week.18
21
However, East Asians usually engage in fewer physical activities at lower intensity than 22
people in western countries.30-31
In consideration of physical conditions, it would be helpful 23
to determine the minimal volume of exercise for older adults required to improve their health. 24
This study showed that the percentage of participants who engaged in exercise type 25
T6_15 was higher than that of T3_30 and T6_30, which indicates that lower intensity, higher 26
frequency exercise may be more acceptable to older people than higher intensity exercise at a 27
lower frequency. Furthermore, the low-volume exercise type has been shown to have benefits 28
related to reducing all-cause mortality and all-cancer mortality.19, 32
Therefore, based on the 29
findings of our study, we feel confident about concluding that persistent low-amount exercise 30
with the same moderate intensity (at least ≥15 min/ 6 times/ week) may also benefit older 31
adults both physically and psychologically. 32
Because of the social stigma of depressive symptoms, many people with this condition 33
tend to remain under-treated. When unable to appropriately address the causes or when there 34
Page 10 of 26
For peer review only - http://bmjopen.bmj.com/site/about/guidelines.xhtml
BMJ Open
123456789101112131415161718192021222324252627282930313233343536373839404142434445464748495051525354555657585960
on March 11, 2022 by guest. P
rotected by copyright.http://bm
jopen.bmj.com
/B
MJ O
pen: first published as 10.1136/bmjopen-2016-014256 on 2 M
ay 2017. Dow
nloaded from

For peer review only
10
is no access to adequate non-medical or community services to treat depression, patients may 1
become further burdened due to a lack of solutions for specific conditions.33
Our study 2
provides a practical and non-medical option to prevent higher levels of depressive symptoms. 3
Most importantly, it will help reduce the unnecessary use of medication, which sometimes 4
causes adverse drug reactions in older adults, and it may also help people when they lack 5
awareness of their disorder or are reluctant to be treated. 6
Still, there are several other factors affecting depressive symptoms. Depression is 7
significantly associated with chronic medical conditions, problems with ADLs, poor social 8
support, and previous depressive conditions.7, 34-35
Functional limitations and arthritis are 9
among the strong risk factors in chronic conditions for depression.36
Physical function, 10
emotional support, self-rated health, and economic satisfaction were consistently shown to 11
significantly influence HLDS in all analyses in our study. However, among the 12
above-mentioned factors, exercise is the more changeable variable, which could also benefit 13
physical function and self-rated health. 14
This is the first report to examine the impacts of four different types of exercise on 15
depressive symptoms in the elderly according to the recommendations of different 16
experts.18-19
However, there have been previous studies that have examined the relationship 17
between physical activity and depressive symptoms in the elderly with different definitions of 18
exercise groups in different areas (city/rural).37-38
Thus, to compare the results, the 19
compatibility of participants, the exercise measurement, and the categories of the exercise 20
groups should be carefully considered. The advantages of this study include the fact that it 21
included a nationally representative sample, a longitudinal cohort design, a test of different 22
amount of exercise, an examination of the changes in exercise status over time, and a proper 23
consideration of statistical analysis methods. 24
Nonetheless, the study has some limitations. Firstly, the observation for the outcome 25
event was performed the same time as the second visit to develop the variables for 26
transitional patterns of exercise, which may have reduced the interpretation of a causal 27
relationship if the association between current exercise and the outcome event is too strong. 28
However, if the assumption is true, the bias will support the null hypothesis. The results 29
indicate that the significantly protective effects of a persistent pattern of exercise are 30
consistent across all types of exercise considered in this study. The increasing exercise 31
pattern did not result in the same finding although both patterns indicated that the subjects 32
had practiced the respective exercises on their second visit. We are therefore comfortable 33
with inferring that a persistent pattern of exercise has more influence than increasing and 34
Page 11 of 26
For peer review only - http://bmjopen.bmj.com/site/about/guidelines.xhtml
BMJ Open
123456789101112131415161718192021222324252627282930313233343536373839404142434445464748495051525354555657585960
on March 11, 2022 by guest. P
rotected by copyright.http://bm
jopen.bmj.com
/B
MJ O
pen: first published as 10.1136/bmjopen-2016-014256 on 2 M
ay 2017. Dow
nloaded from

For peer review only
11
other transitional patterns of exercise. Secondly, the effects of different variables for HLDS 1
may be altered for different cohorts because of changes in medicine, antidepressants, 2
nutrition or in the environment. This may limit the application of the findings of this study. 3
Thirdly, the measurement for physical activity did not include a timeframe but only asked 4
participants “Do you usually engage in exercise?” This may reduce the reliability of the 5
measurement of exercise. However, most of the time, when a questionnaire does not mention 6
a timeframe, it implies “in the past year.” Lastly, activities of daily living (ADL) was not 7
included in the analysis because it may include those who cannot perform exercise. We used 8
physical function ability, which has shown to be hierarchically associated with instrumental 9
and basic ADL25
to control for any differences related to limitations in mobility. 10
11
CONCLUSION 12
Consistent exercise comprised of at least 15-min per time, 3 times a week of moderate 13
intensity is significantly associated with lower risk of depressive symptoms. Increasing the 14
frequency to more than 5 times per week will benefit older adults both physically and 15
psychologically. We recommend taking this low amount of exercise into serious consideration 16
when designing exercise programs related to older adults. 17
18
Page 12 of 26
For peer review only - http://bmjopen.bmj.com/site/about/guidelines.xhtml
BMJ Open
123456789101112131415161718192021222324252627282930313233343536373839404142434445464748495051525354555657585960
on March 11, 2022 by guest. P
rotected by copyright.http://bm
jopen.bmj.com
/B
MJ O
pen: first published as 10.1136/bmjopen-2016-014256 on 2 M
ay 2017. Dow
nloaded from

For peer review only
12
Acknowledgements 1
We would like to thank the Health Promotion Administration, Ministry of Health and 2
Welfare of Taiwan for providing the dataset for analysis. 3
Contributors 4
Y-CC and M-CL designed and conducted the study and wrote the daft; I-HH analyzed 5
the data and interpreted the tables; W-CW conducted the literature review and revised the 6
draft; SCH advised the whole study and completed the manuscript. All authors contributed to 7
the interpretation of results, critically reviewed the draft, and approved the final manuscript. 8
Funding 9
This study was supported by Research Center for Humanities and Social Sciences, 10
National Cheng Kung University, (H10-A304, FD101037). 11
Competing interests 12
None declared. 13
Ethical approval 14
This study was approved by the Institutional Ethics Committee of Chia-Yi Christian 15
Hospital (registry number 104040). 16
Provenance and peer review 17
Not commissioned; externally peer reviewed. 18
Data sharing statement 19
No additional data are available. 20
21
Page 13 of 26
For peer review only - http://bmjopen.bmj.com/site/about/guidelines.xhtml
BMJ Open
123456789101112131415161718192021222324252627282930313233343536373839404142434445464748495051525354555657585960
on March 11, 2022 by guest. P
rotected by copyright.http://bm
jopen.bmj.com
/B
MJ O
pen: first published as 10.1136/bmjopen-2016-014256 on 2 M
ay 2017. Dow
nloaded from

For peer review only
13
References 1
1. Laborde‐Lahoz P, El‐Gabalawy R, Kinley J, et al. Subsyndromal depression among 2
older adults in the USA: prevalence, comorbidity, and risk for new‐onset psychiatric 3
disorders in late life. Int J Geriatr Psychiatry 2015;30:677-85. 4
2. Chong MY, Tsang HY, Chen CS, et al. Community study of depression in old age in 5
Taiwan: prevalence, life events and socio-demographic correlates. Br J Psychiatry 6
2001;178:29-35. 7
3. Global Burden of Disease Study C. Global, regional, and national incidence, prevalence, 8
and years lived with disability for 301 acute and chronic diseases and injuries in 188 9
countries, 1990-2013: a systematic analysis for the Global Burden of Disease Study 10
2013. Lancet 2015;386:743-800. 11
4. Chang YC, Yao G, Hu SC, et al. Depression Affects the Scores of All Facets of the 12
WHOQOL-BREF and May Mediate the Effects of Physical Disability among 13
Community-Dwelling Older Adults. PLoS One 2015;10:e0128356. 14
5. Webb E, Blane D, McMunn A, et al. Proximal predictors of change in quality of life at 15
older ages. J Epidemiol Community Health 2011;65:542-7. 16
6. Garin N, Olaya B, Moneta MV, et al. Impact of multimorbidity on disability and quality 17
of life in the Spanish older population. PLoS One 2014;9:e111498. 18
7. Schoevers RA, Beekman AT, Deeg DJ, et al. Risk factors for depression in later life; 19
results of a prospective community based study (AMSTEL). J Affect Disord 20
2000;59:127-37. 21
8. Veerman JL, Shrestha RN, Mihalopoulos C, et al. Depression prevention, labour force 22
participation and income of older working aged Australians: A microsimulation 23
economic analysis. Aust N Z J Psychiatry 2015;49:430-6. 24
9. Lee SY, Franchetti MK, Imanbayev A, et al. Non-pharmacological prevention of major 25
depression among community-dwelling older adults: a systematic review of the efficacy 26
of psychotherapy interventions. Arch Gerontol Geriatr 2012;55:522-9. 27
10. Forsman AK, Schierenbeck I, Wahlbeck K. Psychosocial interventions for the 28
prevention of depression in older adults: systematic review and meta-analysis. J Aging 29
Health 2011;23:387-416. 30
11. Stahl ST, Albert SM, Dew MA, et al. Coaching in healthy dietary practices in at-risk 31
older adults: a case of indicated depression prevention. Am J Psychiatry 32
2014;171:499-505. 33
Page 14 of 26
For peer review only - http://bmjopen.bmj.com/site/about/guidelines.xhtml
BMJ Open
123456789101112131415161718192021222324252627282930313233343536373839404142434445464748495051525354555657585960
on March 11, 2022 by guest. P
rotected by copyright.http://bm
jopen.bmj.com
/B
MJ O
pen: first published as 10.1136/bmjopen-2016-014256 on 2 M
ay 2017. Dow
nloaded from

For peer review only
14
12. Tipton CM. The history of "Exercise Is Medicine" in ancient civilizations. Adv Physiol 1
Educ 2014;38:109-17. 2
13. Rethorst CD, Wipfli BM, Landers DM. The antidepressive effects of exercise: a 3
meta-analysis of randomized trials. Sports Med 2009;39:491-511. 4
14. Brenes GA, Williamson JD, Messier SP, et al. Treatment of minor depression in older 5
adults: a pilot study comparing sertraline and exercise. Aging Ment Health 2007;11:61-8. 6
15. Cooney GM, Dwan K, Greig CA, et al. Exercise for depression. Cochrane Database 7
Syst Rev 2013;9:CD004366. 8
16. Walker JG, Mackinnon AJ, Batterham P, et al. Mental health literacy, folic acid and 9
vitamin B12, and physical activity for the prevention of depression in older adults: 10
randomised controlled trial. Br J Psychiatry 2010;197:45-54. 11
17. Rhyner KT, Watts A. Exercise and Depressive Symptoms in Older Adults: A Systematic 12
Meta-Analytic Review. J Aging Phys Act 2016;24:234-246. 13
18. Pescatello LS. ACSM's Guidelines for Exercise Testing and Prescription. 9th Edition, 14
edited by American College of Sports Medicine; 2013. 15
19. Wen CP, Wai JP, Tsai MK, et al. Minimum amount of physical activity for reduced 16
mortality and extended life expectancy: a prospective cohort study. Lancet 17
2011;378:1244-53. 18
20. Radloff LS. The CES-D scale: a self-reported depression scale for research in the 19
general population. Appl Psychol Meas 1977;I:385-401. 20
21. Kohout FJ, Berkman LF, Evans DA,et al. Two shorter forms of the CES-D (Center for 21
Epidemiological Studies Depression) depression symptoms index. J Aging Health 22
1993;5:179-93. 23
22. Bjorgvinsson T, Kertz SJ, Bigda-Peyton JS,et al. Psychometric properties of the 24
CES-D-10 in a psychiatric sample. Assessment 2013;20:429-36. 25
23. Lyness JM, Chapman BP, McGriff J,et al. One-year outcomes of minor and 26
subsyndromal depression in older primary care patients. Int Psychogeriatr 2009;21:60-8. 27
24. Chang YC, Ouyang WC, Lu MC,et al. Levels of depressive symptoms may modify the 28
relationship between the WHOQOL-BREF and its determining factors in 29
community-dwelling older adults. Int Psychogeriatr 2016;28:591-601. 30
25. Chen HY, Wang CY, Lee MY,et al. A hierarchical categorisation of tasks in mobility 31
disability. Disabil Rehabil 2010;32:1586-93. 32
26. Ku PW, Fox KR, Chen LJ, et al. Physical activity and depressive symptoms in older 33
adults: 11-year follow-up. Am J Prev Med 2012;42:355-62. 34
Page 15 of 26
For peer review only - http://bmjopen.bmj.com/site/about/guidelines.xhtml
BMJ Open
123456789101112131415161718192021222324252627282930313233343536373839404142434445464748495051525354555657585960
on March 11, 2022 by guest. P
rotected by copyright.http://bm
jopen.bmj.com
/B
MJ O
pen: first published as 10.1136/bmjopen-2016-014256 on 2 M
ay 2017. Dow
nloaded from
For peer review only
15
27. Ku PW, Fox KR, Chen LJ. Physical activity and depressive symptoms in Taiwanese 1
older adults: a seven-year follow-up study. Prev Med 2009;48:250-5. 2
28. Chen LJ, Stevinson C, Ku PW, et al. Relationships of leisure-time and non-leisure-time 3
physical activity with depressive symptoms: a population-based study of Taiwanese 4
older adults. Int J Behav Nutr Phys Act 2012;9:28. 5
29. Lim SS, Vos T, Flaxman AD, et al. A comparative risk assessment of burden of disease 6
and injury attributable to 67 risk factors and risk factor clusters in 21 regions, 1990-2010: 7
a systematic analysis for the Global Burden of Disease Study 2010. Lancet 8
2012;380:2224-60. 9
30. Ku PW, Fox KR, McKenna J, et al. Prevalence of leisure-time physical activity in 10
Taiwanese adults: results of four national surveys, 2000-2004. Prev Med 2006;43:454-7. 11
31. Wai JP, Wen CP, Chan HT, et al. Assessing physical activity in an Asian country: low 12
energy expenditure and exercise frequency among adults in Taiwan. Asia Pac J Clin 13
Nutr 2008;17:297-308. 14
32. Hubbard RE, Fallah N, Searle SD, et al. Impact of exercise in community-dwelling older 15
adults. PLoS One 2009;4:e6174. 16
33. Bird MJ, Parslow RA. Potential for community programs to prevent depression in older 17
people. Med J Aust 2002;177 Suppl:S107-10. 18
34. Schoevers RA, Geerlings MI, Beekman AT, et al. Association of depression and gender 19
with mortality in old age. Results from the Amsterdam Study of the Elderly (AMSTEL). 20
Br J Psychiatry 2000;177:336-42. 21
35. Roberts RE, Kaplan GA, Shema SJ, et al. Does growing old increase the risk for 22
depression? Am J Psychiatry 1997;154:1384-90. 23
36. Dunlop DD, Lyons JS, Manheim LM, et al. Arthritis and heart disease as risk factors for 24
major depression: the role of functional limitation. Med Care 2004;42:502-11. 25
37. Lampinen P, Heikkinen E. Reduced mobility and physical activity as predictors of 26
depressive symptoms among community-dwelling older adults: an eight-year follow-up 27
study. Aging Clin Exp Res 2003;15:205-11. 28
38. Yoshida Y, Iwasa H, Kumagai S, Suzuki T, Awata S, Yoshida H. Longitudinal 29
association between habitual physical activity and depressive symptoms in older people. 30
Psychiatry Clin Neurosci 2015;69:686-92. 31
32
Page 16 of 26
For peer review only - http://bmjopen.bmj.com/site/about/guidelines.xhtml
BMJ Open
123456789101112131415161718192021222324252627282930313233343536373839404142434445464748495051525354555657585960
on March 11, 2022 by guest. P
rotected by copyright.http://bm
jopen.bmj.com
/B
MJ O
pen: first published as 10.1136/bmjopen-2016-014256 on 2 M
ay 2017. Dow
nloaded from

For peer review only
16
1
Table 1 Characteristics of the participants from 1999 to 2007 2
Variables
1999 2003 2007
N=2673 N=1889 N=1361
n (%) n (%) n (%)
Age 74.2 ± 5.7 77.1 ± 5.1 80.2 ± 4.7
Male 1456 (54.5) 1019 (53.9) 703 (51.7)
Level of depressive symptoms
NDS 1401 (52.5) 1049 (55.5) 708 (52.0)
LLDS 646 (24.2) 388 (20.5) 321 (23.6)
HLDS 624 (23.4) 452 (23.9) 332 (24.4)
M±SD 6.1 ± 6.4 5.7 ± 5.9 5.8 ± 6.1
Types/amount of exercise*
T3_15 1032 (38.6) 810 (42.9) 562 (41.3)
T3_30 859 (32.1) 671 (35.5) 450 (33.1)
T6_15 922 (34.5) 742 (39.3) 498 (36.6)
T6_30 749 (28.0) 603 (31.9) 386 (28.4)
Education
No 1111 (41.6) 733 (38.8) 507 (37.3)
Elementary 983 (36.8) 723 (38.3) 515 (37.8)
Junior high school 273 (10.2) 200 (10.6) 155 (11.4)
Senior high school 162 (6.1) 124 (6.6) 96 (7.1)
College and above 143 (5.4) 109 (5.8) 88 (6.5)
Married 1630 (61.0) 1096 (58.0) 727 (53.4)
Employment 322 (12.1) 142 (7.5) 84 (6.2)
Current smoking 595 (22.3) 344 (18.2) 189 (13.9)
Physical function 17.2 ± 4.8 16.2 ± 5.0 16.0 ± 5.1
Emotional support 18.1 ± 3.0 18.0 ± 2.9 18.4 ± 2.7
Social participation 1369 (51.2) 842 (44.6) 576 (42.3)
Self-rated health
Poor 934 (34.9) 707 (37.4) 481 (35.3)
Fair 927 (34.7) 583 (30.9) 531 (39.0)
Good 812 (30.4) 599 (31.7) 349 (25.6)
Economic satisfaction
Dissatisfied 544 (20.4) 407 (21.6) 271 (19.9)
Fair 1144 (42.9) 653 (34.6) 486 (35.7)
Satisfied 978 (36.7) 828 (43.9) 604 (44.4)
Chronic conditions
Page 17 of 26
For peer review only - http://bmjopen.bmj.com/site/about/guidelines.xhtml
BMJ Open
123456789101112131415161718192021222324252627282930313233343536373839404142434445464748495051525354555657585960
on March 11, 2022 by guest. P
rotected by copyright.http://bm
jopen.bmj.com
/B
MJ O
pen: first published as 10.1136/bmjopen-2016-014256 on 2 M
ay 2017. Dow
nloaded from

For peer review only
17
Cancer 71 (2.7) 61 (3.2) 54 (4.0)
Chronic respiratory disease 370 (13.8) 256 (13.6) 179 (13.2)
Gastrointestinal 543 (20.3) 402 (21.3) 301 (22.1)
Hypertension 1002 (37.5) 829 (43.9) 672 (49.4)
Diabetes mellitus 408 (15.3) 319 (16.9) 235 (17.3)
Heart disease 576 (21.6) 469 (24.8) 373 (27.4)
Stroke 144 (5.4) 126 (6.7) 83 (6.1)
Arthritis 594 (22.2) 465 (24.6) 322 (23.7)
Hepatobiliary disease 191 (7.2) 158 (8.4) 116 (8.5)
Renal disease 217 (8.1) 192 (10.2) 139 (10.2)
Data were presented as mean ± SD or n (%). 1
NDS: No Depressive Symptom (CESD=0); 2
LLDS: Lower Level of Depressive Symptoms (0<CESD≦9); 3
HLDS: Higher Level of Depressive Symptoms (CESD≧10); 4
CESD: Center for Epidemiologic Studies of Depression; 5
*T3_15: Exercise ≧moderate intensity, ≧3 times/week, ≧15 min/time; 6
T3_30: Exercise ≧moderate intensity, ≧3 times/week, ≧30 min/time; 7
T6_15: Exercise ≧moderate intensity, ≧6 times/week, ≧15 min/time; 8
T6_30: Exercise ≧moderate intensity, ≧6 times/week, ≧30 min/time. 9
Page 18 of 26
For peer review only - http://bmjopen.bmj.com/site/about/guidelines.xhtml
BMJ Open
123456789101112131415161718192021222324252627282930313233343536373839404142434445464748495051525354555657585960
on March 11, 2022 by guest. P
rotected by copyright.http://bm
jopen.bmj.com
/B
MJ O
pen: first published as 10.1136/bmjopen-2016-014256 on 2 M
ay 2017. Dow
nloaded from

For peer review only
10
10
Table 2 Odds ratios of HLDS according to the current exercise behavior as estimated 11
using GLMM ‡ 12
Variables HLDS
OR (95% CI) p-value
Types/amount of exercise
T3_15 1.14 (0.92-1.42) 0.24
T3_30 0.86 (0.59-1.25) 0.42
T6_15 0.86 (0.65-1.13) 0.27
T6_30 0.80 (0.66-0.95) 0.01
Previous level of depressive symptoms
NDS ref
LLDS 1.83 (1.48-2.28) <0.001
HLDS 3.04 (2.39-3.85) <0.001
Physical function 0.92 (0.90-0.93) <0.001
Emotional support 0.86 (0.84-0.88) <0.001
Self-rated health
Poor ref
Fair 0.52 (0.44-0.61) <0.001
Good 0.29 (0.23-0.36) <0.001
Economic satisfaction
Dissatisfied ref
Fair 0.51 (0.43-0.60) <0.001
Satisfied 0.33 (0.27-0.40) <0.001
OR: odds ratio; CI: confidence interval. 13
HLDS: Higher Level of Depressive Symptoms (CESD≧10); 14
GLMM: generalized linear mixed models 15
T3_15: Exercise ≧moderate intensity, ≧3 times/week, ≧15 min/time; 16
T3_30: Exercise ≧moderate intensity, ≧3 times/week, ≧30 min/time; 17
T6_15: Exercise ≧moderate intensity, ≧6 times/week, ≧15 min/time; 18
T6_30: Exercise ≧moderate intensity, ≧6 times/week, ≧30 min/time. 19
‡All of the analysis models were adjusted according to present age, gender, education, marital status, 20
smoking, social participation, and chronic conditions including cancer, chronic respiratory disease, 21
gastrointestinal, hypertension, diabetes mellitus, heart disease, stroke, arthritis, hepatobiliary disease 22
and renal disease. 23
Page 19 of 26
For peer review only - http://bmjopen.bmj.com/site/about/guidelines.xhtml
BMJ Open
123456789101112131415161718192021222324252627282930313233343536373839404142434445464748495051525354555657585960
on March 11, 2022 by guest. P
rotected by copyright.http://bm
jopen.bmj.com
/B
MJ O
pen: first published as 10.1136/bmjopen-2016-014256 on 2 M
ay 2017. Dow
nloaded from
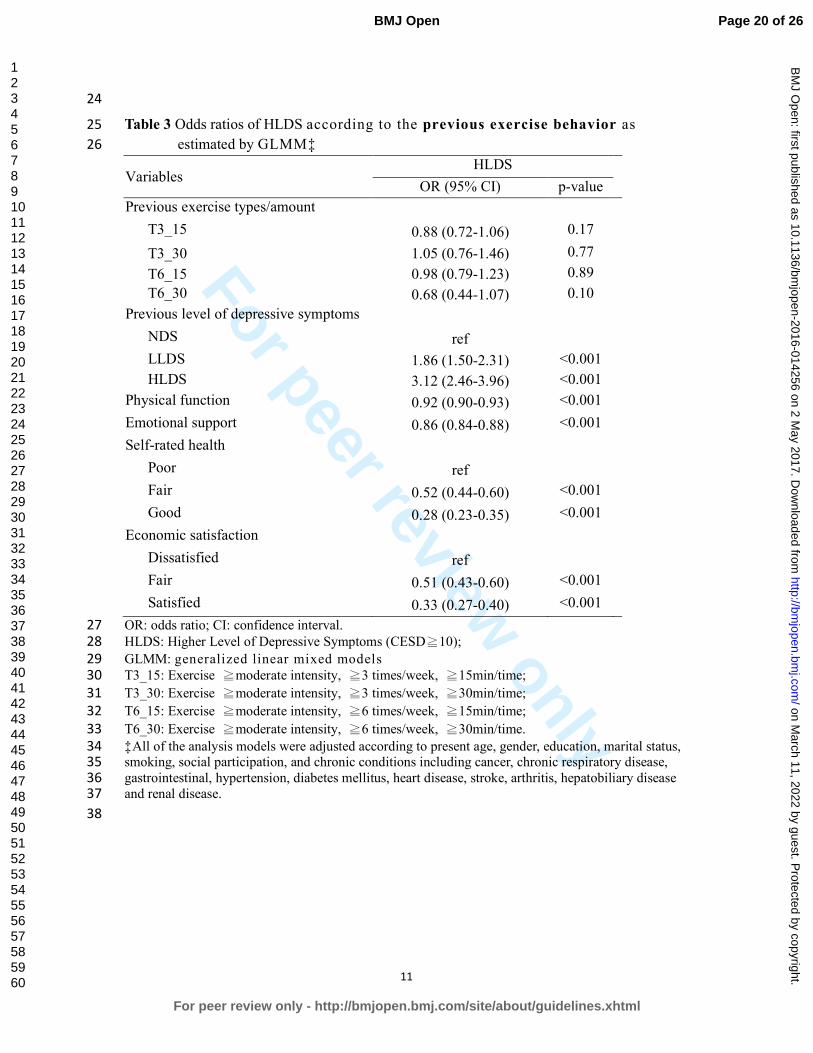
For peer review only
11
24
Table 3 Odds ratios of HLDS according to the previous exercise behavior as 25
estimated by GLMM‡ 26
Variables HLDS
OR (95% CI) p-value
Previous exercise types/amount
T3_15 0.88 (0.72-1.06) 0.17
T3_30 1.05 (0.76-1.46) 0.77
T6_15 0.98 (0.79-1.23) 0.89
T6_30 0.68 (0.44-1.07) 0.10
Previous level of depressive symptoms
NDS ref
LLDS 1.86 (1.50-2.31) <0.001
HLDS 3.12 (2.46-3.96) <0.001
Physical function 0.92 (0.90-0.93) <0.001
Emotional support 0.86 (0.84-0.88) <0.001
Self-rated health
Poor ref
Fair 0.52 (0.44-0.60) <0.001
Good 0.28 (0.23-0.35) <0.001
Economic satisfaction
Dissatisfied ref
Fair 0.51 (0.43-0.60) <0.001
Satisfied 0.33 (0.27-0.40) <0.001
OR: odds ratio; CI: confidence interval. 27
HLDS: Higher Level of Depressive Symptoms (CESD≧10); 28
GLMM: generalized linear mixed models 29
T3_15: Exercise ≧moderate intensity, ≧3 times/week, ≧15min/time; 30
T3_30: Exercise ≧moderate intensity, ≧3 times/week, ≧30min/time; 31
T6_15: Exercise ≧moderate intensity, ≧6 times/week, ≧15min/time; 32
T6_30: Exercise ≧moderate intensity, ≧6 times/week, ≧30min/time. 33
‡All of the analysis models were adjusted according to present age, gender, education, marital status, 34
smoking, social participation, and chronic conditions including cancer, chronic respiratory disease, 35
gastrointestinal, hypertension, diabetes mellitus, heart disease, stroke, arthritis, hepatobiliary disease 36
and renal disease. 37
38
Page 20 of 26
For peer review only - http://bmjopen.bmj.com/site/about/guidelines.xhtml
BMJ Open
123456789101112131415161718192021222324252627282930313233343536373839404142434445464748495051525354555657585960
on March 11, 2022 by guest. P
rotected by copyright.http://bm
jopen.bmj.com
/B
MJ O
pen: first published as 10.1136/bmjopen-2016-014256 on 2 M
ay 2017. Dow
nloaded from

For peer review only
12
39
Table 4 Odds ratios of HLDS taking interaction of time and exercise consistency into consideration ‡ 40
Variables
Model 1
(T3_15)
Model 2
(T3_30)
Model 3
(T6_15)
Model 4
(T6_30)
OR (95% CI) P OR (95% CI) P OR (95% CI) P OR (95% CI) P
Patterns of consistency
NN ref ref ref ref
YN 0.77 (0.54-1.11) 0.16 0.86 (0.60-1.25) 0.43 0.76 (0.53-1.09) 0.14 0.92 (0.64-1.34) 0.68
NY 0.79 (0.54-1.16) 0.24 0.78 (0.52-1.17) 0.23 0.68 (0.45-1.01) 0.06 0.71 (0.46-1.10) 0.12
YY 0.58 (0.40-0.85) 0.01 0.56 (0.36-0.88) 0.01 0.67 (0.45-1.00) 0.048 0.62 (0.38-0.99) 0.047
Previous CESD
NDS ref ref ref ref
LLDS 1.82 (1.43-2.33) <0.001 1.81 (1.42-2.31) <0.001 1.82 (1.42-2.32) <0.001 1.81 (1.42-2.31) <0.001
HLDS 3.23 (2.47-4.23) <0.001 3.20 (2.45-4.18) <0.001 3.23 (2.47-4.22) <0.001 3.20 (2.45-4.19) <0.001
Time slope 0.95 (0.92-0.99) 0.01 0.97 (0.94-1.00) 0.08 0.96 (0.92-0.99) 0.01 0.98 (0.94-1.01) 0.14
Time x Exercise consistency
NN ref ref ref ref
YN 1.12 (1.05-1.20) <0.01 1.07 (1.00-1.15) 0.04 1.12 (1.05-1.20) <0.01 1.06 (0.99-1.14) 0.07
NY 1.01 (0.93-1.09) 0.79 0.99 (0.91-1.08) 0.84 1.02 (0.94-1.10) 0.69 0.98 (0.90-1.07) 0.68
YY 1.11 (1.03-1.18) <0.01 1.09 (1.01-1.17) 0.04 1.09 (1.01-1.17) 0.02 1.07 (0.99-1.17) 0.10
OR: odds ratio; CI: confidence interval. 41
HLDS: Higher Level of Depressive Symptoms (CESD≧10); 42
GLMM: generalized linear mixed models 43
T3_15: Exercise ≧moderate intensity, ≧3 times/week, ≧15 min/time; 44
T3_30: Exercise ≧moderate intensity, ≧3 times/week, ≧30 min/time; 45
T6_15: Exercise ≧moderate intensity, ≧6 times/week, ≧15 min/time; 46
Page 21 of 26
For peer review only - http://bmjopen.bmj.com/site/about/guidelines.xhtml
BMJ Open
123456789101112131415161718192021222324252627282930313233343536373839404142434445464748495051525354555657585960
on March 11, 2022 by guest. Protected by copyright. http://bmjopen.bmj.com/ BMJ Open: first published as 10.1136/bmjopen-2016-014256 on 2 May 2017. Downloaded from

For peer review only
13
T6_30: Exercise ≧moderate intensity, ≧6 times/week, ≧30 min/time. 47
NN: Low pattern of exercise transition, indicating the respective exercise type was not practiced in either the previous or current survey. 48
YN: Declining pattern of exercise transition, indicating the respective exercise type was practiced in the previous but not in the current survey. 49
NY: Increasing pattern of exercise transition, indicating the respective exercise type was practiced in the current but not in the previous survey. 50
YY: Persistent pattern of exercise transition, indicating the respective exercise type was practiced in both the previous and current surveys. 51
‡All the analysis models were adjusted according to present age, gender, education, marital status, smoking, physical function, emotional support, social 52
participation, self-rated health, economic satisfaction, employment and chronic conditions including cancer, chronic respiratory disease, gastrointestinal, 53
hypertension, diabetes mellitus, heart disease, stroke, arthritis, hepatobiliary disease and renal disease. 54
55
56
Page 22 of 26
For peer review only - http://bmjopen.bmj.com/site/about/guidelines.xhtml
BMJ Open
123456789101112131415161718192021222324252627282930313233343536373839404142434445464748495051525354555657585960
on March 11, 2022 by guest. Protected by copyright. http://bmjopen.bmj.com/ BMJ Open: first published as 10.1136/bmjopen-2016-014256 on 2 May 2017. Downloaded from

For peer review only
179x129mm (300 x 300 DPI)
Page 23 of 26
For peer review only - http://bmjopen.bmj.com/site/about/guidelines.xhtml
BMJ Open
123456789101112131415161718192021222324252627282930313233343536373839404142434445464748495051525354555657585960
on March 11, 2022 by guest. P
rotected by copyright.http://bm
jopen.bmj.com
/B
MJ O
pen: first published as 10.1136/bmjopen-2016-014256 on 2 M
ay 2017. Dow
nloaded from

For peer review only
1
STROBE Statement—checklist of items that should be included in reports of observational studies
Item No Page/Line Recommendation
Title and abstract 1 0/1-2 (a) Indicate the study’s design with a commonly used term in the
title or the abstract
1/1-24 (b) Provide in the abstract an informative and balanced summary of
what was done and what was found
Introduction
Background/rationale 2 3/1-33
4/1-3
Explain the scientific background and rationale for the investigation
being reported
Objectives 3 4/4-9 State specific objectives, including any pre-specified hypotheses
Methods
Study design 4 4/12-21 Present key elements of study design early in the paper
Setting 5 4/22-31 Describe the setting, locations, and relevant dates, including
periods of recruitment, exposure, follow-up, and data collection
Participants 6 4/12-31 (a) Cohort study—Give the eligibility criteria, and the sources and
methods of selection of participants. Describe methods of follow-
up
Case-control study—Give the eligibility criteria, and the sources
and methods of case ascertainment and control selection. Give the
rationale for the choice of cases and controls
Cross-sectional study—Give the eligibility criteria, and the sources
and methods of selection of participants
(b) Cohort study—For matched studies, give matching criteria and
number of exposed and unexposed
Case-control study—For matched studies, give matching criteria
and the number of controls per case
Variables 7 5/4-34
6/1-30
Clearly define all outcomes, exposures, predictors, potential
confounders, and effect modifiers. Give diagnostic criteria, if
applicable
Data sources/
measurement
8* 5/4-34
6/1-30
For each variable of interest, give sources of data and details of
methods of assessment (measurement). Describe comparability of
assessment methods if there is more than one group
Bias 9 4/18-21 Describe any efforts to address potential sources of bias
Study size 10 4/22-31 Explain how the study size was arrived at
Quantitative
variables
11 5/4-34
6/1-30
Explain how quantitative variables were handled in the analyses. If
applicable, describe which groupings were chosen and why
Statistical methods 12 6/32-34
7/1-8
(a) Describe all statistical methods, including those used to control
for confounding
7/5-6 (b) Describe any methods used to examine subgroups and
interactions
4/24-25 (c) Explain how missing data were addressed
(d) Cohort study—If applicable, explain how loss to follow-up was
addressed
Case-control study—If applicable, explain how matching of cases
and controls was addressed
Cross-sectional study—If applicable, describe analytical methods
Page 24 of 26
For peer review only - http://bmjopen.bmj.com/site/about/guidelines.xhtml
BMJ Open
123456789101112131415161718192021222324252627282930313233343536373839404142434445464748495051525354555657585960
on March 11, 2022 by guest. P
rotected by copyright.http://bm
jopen.bmj.com
/B
MJ O
pen: first published as 10.1136/bmjopen-2016-014256 on 2 M
ay 2017. Dow
nloaded from

For peer review only
2
taking account of sampling strategy
(e) Describe any sensitivity analyses
(Continue)
Item No Page/Line Results
Participants 13* 7/11-13 (a) Report numbers of individuals at each stage of study—eg
numbers potentially eligible, examined for eligibility, confirmed
eligible, included in the study, completing follow-up, and analysed
(b) Give reasons for non-participation at each stage
(c) Consider use of a flow diagram
Descriptive
data
14* 7/13-18 (a) Give characteristics of study participants (eg demographic,
clinical, social) and information on exposures and potential
confounders
(b) Indicate number of participants with missing data for each
variable of interest
(c) Cohort study—Summarise follow-up time (eg, average and total
amount)
Outcome data 15* 7/19-23 Cohort study—Report numbers of outcome events or summary
measures over time
Case-control study—Report numbers in each exposure category, or
summary measures of exposure
Cross-sectional study—Report numbers of outcome events or
summary measures
Main results 16 7/24-33
8/1-4
(a) Give unadjusted estimates and, if applicable, confounder-adjusted
estimates and their precision (eg, 95% confidence interval). Make
clear which confounders were adjusted for and why they were
included
(b) Report category boundaries when continuous variables were
categorized
(c) If relevant, consider translating estimates of relative risk into
absolute risk for a meaningful time period
Other analyses 17 7/30-33
8/1-4
Report other analyses done—eg analyses of subgroups and
interactions, and sensitivity analyses
Discussion
Key results 18 8/7-21 Summarise key results with reference to study objectives
Limitations 19 10/22-34
11/1-7
Discuss limitations of the study, taking into account sources of
potential bias or imprecision. Discuss both direction and magnitude
of any potential bias
Interpretation 20 8/22-33
9/1-34
10/1-11
Give a cautious overall interpretation of results considering
objectives, limitations, multiplicity of analyses, results from similar
studies, and other relevant evidence
Generalisability 21 10/12-21 Discuss the generalisability (external validity) of the study results
Other information
Funding 22 12/9-11 Give the source of funding and the role of the funders for the present
study and, if applicable, for the original study on which the present
article is based
Page 25 of 26
For peer review only - http://bmjopen.bmj.com/site/about/guidelines.xhtml
BMJ Open
123456789101112131415161718192021222324252627282930313233343536373839404142434445464748495051525354555657585960
on March 11, 2022 by guest. P
rotected by copyright.http://bm
jopen.bmj.com
/B
MJ O
pen: first published as 10.1136/bmjopen-2016-014256 on 2 M
ay 2017. Dow
nloaded from

For peer review only
3
*Give information separately for cases and controls in case-control studies and, if applicable, for exposed
and unexposed groups in cohort and cross-sectional studies.
Note: An Explanation and Elaboration article discusses each checklist item and gives methodological
background and published examples of transparent reporting. The STROBE checklist is best used in
conjunction with this article (freely available on the Web sites of PLoS Medicine at
http://www.plosmedicine.org/, Annals of Internal Medicine at http://www.annals.org/, and Epidemiology at
http://www.epidem.com/). Information on the STROBE Initiative is available at www.strobe-statement.org.
Page 26 of 26
For peer review only - http://bmjopen.bmj.com/site/about/guidelines.xhtml
BMJ Open
123456789101112131415161718192021222324252627282930313233343536373839404142434445464748495051525354555657585960
on March 11, 2022 by guest. P
rotected by copyright.http://bm
jopen.bmj.com
/B
MJ O
pen: first published as 10.1136/bmjopen-2016-014256 on 2 M
ay 2017. Dow
nloaded from