Effects of Cutting Parameters on Surface Roughness … 6061 under minimum quantity lubrication (MQL)...
6
International Journal of Science and Research (IJSR) ISSN (Online): 2319-7064 Index Copernicus Value (2013): 6.14 | Impact Factor (2013): 4.438 Volume 4 Issue 5, May 2015 www.ijsr.net Licensed Under Creative Commons Attribution CC BY Effects of Cutting Parameters on Surface Roughness during End Milling of Aluminium under Minimum Quantity Lubrication (MQL) Okokpujie Imhade P. 1 , Okonkwo Ugochukwu C. 2 Department of Mechanical Engineering, Nnamdi Azikiwe University, Awka, Nigeria Abstract: In this study an experimental investigation of effects of cutting parameters on surface roughness during end milling of aluminium 6061 under minimum quantity lubrication (MQL) condition was carried out. The experiments were carried out to investigate surface quality of the machined parameters and to developed mathematical models using least square techniques. Spindle speed (N), feed rate (f), axial depth of cut (a) and radial depth of cut (r) has been chosen as input variables in order to predict surface roughness. The experiment was designed by using central composite design (CCD) in which 30 samples were run in a CNC milling machine. Each of the experimental result was measured using Mitutoyo surface tester. After the predicted surface roughness values have been obtained the average percentage errors were calculated. The mathematical model developed by using least square method shows accuracy of 89.5% which is reasonably reliable for surface roughness prediction. With the obtained optimum input parameters for surface roughness, production operations will be enhanced. Keywords: CNC end milling, Minimum quantity lubrication (MQL), Surface roughness, Response surface methodology. 1. Introduction Milling is a process of generating machined surfaces by progressively removing a predetermined amount of materials from the work-piece at a relatively slow rate of movement by a milling cutter rotating at a comparatively high speed. The characteristic feature of the milling process is that each milling cutter tooth removes its share of the stock in the form of small individual chips. It is of three types which are: Peripheral milling, Face milling and End milling. End milling is one of the most common metal removal operation encountered in industrial process. It is widely used in the manufacturing industries which include the automotive and aerospace sectors, where quality is an important factor in the production of slots, pockets, precision molds, and dies. In end milling, the cutter generally rotates on an axis vertical to the work-piece. It can be tilted to machine tapered surfaces. Cutting teeth are located on both the end face of the cutter and the periphery of the cutter body. The quality of machined surface is characterized by the accuracy of its manufacture with respect to the dimensions specified by the designer. Each type of cutting tool leaves its own individual pattern which therefore can be identified. This pattern is known as surface finish or surface roughness. The primary function of the MQL in metal machining operations is to serve as a coolant, also as a lubricant thereby reducing friction and tool wear. It is generally agreed that the application of MQL can improve the tool life and results in good surface finish by reducing thermal distortion and flushing away of machined chips. What is perhaps even more important is to ensure proper filtration of the fluid as suspended swarf can cause random deep scratches on the job. Predictive modeling of machining processes is the first and the most important step for process control and optimization. A predictive model is an accurate relationship between the independent input variables and dependent output performance measures. There are two well-known approaches to obtain this relationship: the empirical approach and, the fundamental approach involving analytical means. The empirical approach is considered a short-term and practical method, and it is the most suited approach for industrial applications. Ginta et al, (2009) developed an effective methodology to determine the performance of uncoated WC-Co inserts in predicting minimum surface roughness in end milling of titanium alloys Ti-6Al-4V under dry conditions. Central composite design (CCD) of response surface methodology was employed to create an efficient analytical model for surface roughness in terms of cutting parameters: cutting speed, axial depth of cut, and feed per tooth. End milling tests were conducted on Vertical Machining Center (VMC ZPS, Model: MLR 542 with full immersion cutting and under dry condition. They concluded with CCD being a successful technique to predict the surface roughness produced in end- milling of titanium alloy Ti-6Al-4V using uncoated inserts under dry conditions. Linear CCD model proved inadequate while quadratic CCD model is adequate with 95% accuracy. The two developed models indicated that feed is the most predominant cutting condition followed by cutting speed and depth of cut. Interaction effect between cutting speed and feed will also give a high effect on surface roughness values. Arokiadass et al, (2011) also studied the influence of four machining parameters including spindle speed (N), feed rate (f), depth of cut (d), and various percentage weight of silicon carbide (S) on surface roughness (Ra). The response surface methodology was employed to establish the mathematical relationship between the response and the various process parameters. The result they obtained shows that the quadratic model is statistically significant for analysis of surface roughness. The value of R is 99.85 %, which indicates that the developed regression model is adequately significant at a 95% confidence level. Their model also indicated that the feed rate was the most dominant parameter on surface roughness followed by spindle speed and %weight of SiC. Depth of cut has less influence on surface roughness. They also concluded that the regression model is Paper ID: SUB154684 2937
-
Upload
trinhthuan -
Category
Documents
-
view
222 -
download
0
Transcript of Effects of Cutting Parameters on Surface Roughness … 6061 under minimum quantity lubrication (MQL)...

International Journal of Science and Research (IJSR) ISSN (Online): 2319-7064
Index Copernicus Value (2013): 6.14 | Impact Factor (2013): 4.438
Volume 4 Issue 5, May 2015
www.ijsr.net Licensed Under Creative Commons Attribution CC BY
Effects of Cutting Parameters on Surface Roughness
during End Milling of Aluminium under Minimum
Quantity Lubrication (MQL)
Okokpujie Imhade P. 1, Okonkwo Ugochukwu C.
2
Department of Mechanical Engineering, Nnamdi Azikiwe University, Awka, Nigeria
Abstract: In this study an experimental investigation of effects of cutting parameters on surface roughness during end milling of
aluminium 6061 under minimum quantity lubrication (MQL) condition was carried out. The experiments were carried out to investigate
surface quality of the machined parameters and to developed mathematical models using least square techniques. Spindle speed (N),
feed rate (f), axial depth of cut (a) and radial depth of cut (r) has been chosen as input variables in order to predict surface roughness.
The experiment was designed by using central composite design (CCD) in which 30 samples were run in a CNC milling machine. Each
of the experimental result was measured using Mitutoyo surface tester. After the predicted surface roughness values have been obtained
the average percentage errors were calculated. The mathematical model developed by using least square method shows accuracy of
89.5% which is reasonably reliable for surface roughness prediction. With the obtained optimum input parameters for surface
roughness, production operations will be enhanced.
Keywords: CNC end milling, Minimum quantity lubrication (MQL), Surface roughness, Response surface methodology.
1. Introduction
Milling is a process of generating machined surfaces by
progressively removing a predetermined amount of materials
from the work-piece at a relatively slow rate of movement
by a milling cutter rotating at a comparatively high speed.
The characteristic feature of the milling process is that each
milling cutter tooth removes its share of the stock in the
form of small individual chips. It is of three types which are:
Peripheral milling, Face milling and End milling. End
milling is one of the most common metal removal operation
encountered in industrial process. It is widely used in the
manufacturing industries which include the automotive and
aerospace sectors, where quality is an important factor in the
production of slots, pockets, precision molds, and dies. In
end milling, the cutter generally rotates on an axis vertical to
the work-piece. It can be tilted to machine tapered surfaces.
Cutting teeth are located on both the end face of the cutter
and the periphery of the cutter body. The quality of
machined surface is characterized by the accuracy of its
manufacture with respect to the dimensions specified by the
designer. Each type of cutting tool leaves its own individual
pattern which therefore can be identified. This pattern is
known as surface finish or surface roughness.
The primary function of the MQL in metal machining
operations is to serve as a coolant, also as a lubricant thereby
reducing friction and tool wear. It is generally agreed that
the application of MQL can improve the tool life and results
in good surface finish by reducing thermal distortion and
flushing away of machined chips. What is perhaps even
more important is to ensure proper filtration of the fluid as
suspended swarf can cause random deep scratches on the
job. Predictive modeling of machining processes is the first
and the most important step for process control and
optimization. A predictive model is an accurate relationship
between the independent input variables and dependent
output performance measures. There are two well-known
approaches to obtain this relationship: the empirical
approach and, the fundamental approach involving
analytical means. The empirical approach is considered a
short-term and practical method, and it is the most suited
approach for industrial applications. Ginta et al, (2009)
developed an effective methodology to determine the
performance of uncoated WC-Co inserts in predicting
minimum surface roughness in end milling of titanium
alloys Ti-6Al-4V under dry conditions. Central composite
design (CCD) of response surface methodology was
employed to create an efficient analytical model for surface
roughness in terms of cutting parameters: cutting speed,
axial depth of cut, and feed per tooth. End milling tests were
conducted on Vertical Machining Center (VMC ZPS,
Model: MLR 542 with full immersion cutting and under dry
condition. They concluded with CCD being a successful
technique to predict the surface roughness produced in end-
milling of titanium alloy Ti-6Al-4V using uncoated inserts
under dry conditions. Linear CCD model proved inadequate
while quadratic CCD model is adequate with 95% accuracy.
The two developed models indicated that feed is the most
predominant cutting condition followed by cutting speed and
depth of cut. Interaction effect between cutting speed and
feed will also give a high effect on surface roughness values.
Arokiadass et al, (2011) also studied the influence of four
machining parameters including spindle speed (N), feed rate
(f), depth of cut (d), and various percentage weight of silicon
carbide (S) on surface roughness (Ra). The response surface
methodology was employed to establish the mathematical
relationship between the response and the various process
parameters. The result they obtained shows that the
quadratic model is statistically significant for analysis of
surface roughness. The value of R is 99.85 %, which
indicates that the developed regression model is adequately
significant at a 95% confidence level. Their model also
indicated that the feed rate was the most dominant parameter
on surface roughness followed by spindle speed and
%weight of SiC. Depth of cut has less influence on surface
roughness. They also concluded that the regression model is
Paper ID: SUB154684 2937

International Journal of Science and Research (IJSR) ISSN (Online): 2319-7064
Index Copernicus Value (2013): 6.14 | Impact Factor (2013): 4.438
Volume 4 Issue 5, May 2015
www.ijsr.net Licensed Under Creative Commons Attribution CC BY
well fitted with the observed values and high correlation that
exists between fitted values and observed values.
2. Materials and Methods
The work piece material used for the study is a rectangular
6061Aluminium blocks of 2000mm×50mm×5mm. Method
used for the experimental investigations is explained thus:
Preparation of the vertical CNC milling machine system
ready for performing the machining operation, Cutting of
the work piece of the aluminium 6061 rectangle plate
into different sizes of 10, 15, 20, 25 and 30mm. A total
of 30 pieces, for MQL condition
Fixing of the high speed steel (HSS) end milling cutter of
12mm diameter on the spindle taper of the machine
Mounting the work piece, clamped on a vice mounted on
top of the table of the machine
Creating CNC part programs on CNC professional
software for tool paths, with specific commands using
different levels of spindle speed, feed rate, axial depth of
cut and radial depth of cut, taking reference for Y axis,
and Z axis then performing end milling operation.
After each machining the surface roughness of the work
piece was measured with the press-o-firm and mitutoyo
surface tester
Detailed information on chemical composition of the 6061
Aluminium is provided in table 1, and details of the
experimental outlay, only up-milling cutting mode was
investigated.
Table 1: Chemical Composition of Al-6061 Element Mg Fe Si Cu Mn V Ti AL
Weight % 1.08 0.17 0.63 0.32 0.52 0.01 0.02 Remainder
Table 2: Details of the Experimental Outlay Exp.
Runs
Material Mql Cutting
Condition
Cutting
Tool
Input Parameters Response
Parameters
1 to 30 Al-6061
alloy
10% boric
acid + base
oil SAE 40
High
speed
steel
Cutting speed Surface
Roughness Feed rate
Axial depth of cut
Radial depth of cut
The experiment was performed on SIEG 3/10/0010 table top
CNC machine vertical milling centre. The vertical milling
centre has three (3) planes namely x, y and z planes.
Response surface methodology (RSM) was employed in the
experimental design using second-order rotatable central
composite design. By considering all the factorial corner
points, some of the central replicates and all the axial points
second-order rotatable central composite design requires
between 25 to 33 experimental runs depending on the
number of the central replicates considered while a full
factorial design will require 54= 625 experimental runs. This
explains the choice of second-order rotatable central
composite design which tremendously reduces needed
number of experimental runs for the MQL cutting
conditions, which doubles the calculated number of
experimental runs. The design expert 9.0.1 was used in
analysis and presentation of results. The response surface
methodology (RSM) is the procedure for determining the
relationship between the independent process parameters
with the desired response and exploring the effect of these
parameters on responses, including six steps (Chiang 2008).
These are in the order;
• Define the independent input variables and the desired
responses with the design constants.
• Adopt an experimental design plan.
• Perform regression analysis with the quadratic model of
RSM.
• Calculate the statistical analysis of variance (ANOVA)
for the independent input variables in order to find which
parameter significantly affects the desired response.
• Determine the situation of the quadratic model of RSM
and decide whether the model of RSM needs screening
variables or not.
• Optimize and conduct confirmation experiment and
verify the predicted performance characteristics.
In the current study, the relationship between the cutting
conditions and the technology parameters aspect is given as
(Sabahudin et al, 2011).
Y = φ (N, f, a, r), (1)
Where Y is the desired machinability aspect and φ is the
response function. The approximation of Y is proposed by
using a non-linear (quadratic) mathematical model, which is
suitable for studying the interaction effects of process
parameters on machinability characteristics. In the present
work, the RMS-based second order mathematical model is
given by
Y = β0+ β1x1 + β2x2 + β3x3 + β4x4 (2) Where βo is the free term of the regression equation, the
coefficients, β1, β2, β3 and β4 values are the estimates of
corresponding parameters , x1, x2, x3, x4 are logarithmic
transformation of factors: spindle speed, cutting feed, axial
dept of cut and radial depth of cut, respectively.
The experimental plan is developed to assess the influence
of spindle speed (N), feed rate (f), axial depth of cut (a) and
radial depth of cut (r) on the surface roughness parameters
(Ra). Five levels were allocated for each cutting variable as
given in table 3. The variable levels were chosen within the
intervals recommended by cutting tool manufacturer. Four
cutting variables at five levels led to a total of 30 tests for
each condition.
Table 3: Factor levels to be used in the experimental design
Variable Levels
-2 -1 0 1 2 Spindle speed [rpm] 1000 1500 2000 2500 3000 Feed rate [mm/min] 100 150 200 300 500 Radial depth of cut [mm] 0.5 1 1.5 2.0 2.5 Axial depth of cut[mm] 10 15 20 25 30
Mathematical model of surface roughness was built for
MQL cutting condition. Percentage improvement in surface
roughness expected to be occasioned by MQL was thereafter
quantified. Furthermore, optimization of the arising model
was carried out to determine the coordinate of minimum
surface roughness.
The required number of experimental points for four-factor
in the C.C.D with one replication of factorial and axial parts
Paper ID: SUB154684 2938

International Journal of Science and Research (IJSR) ISSN (Online): 2319-7064
Index Copernicus Value (2013): 6.14 | Impact Factor (2013): 4.438
Volume 4 Issue 5, May 2015
www.ijsr.net Licensed Under Creative Commons Attribution CC BY
having, factorial design is = 2f = 2
4 = 16, the axial point or
star point is = 2×f = 2×4 = 8, where f= number of factors,
the center point chosen for this experiment is 6, which is =
16+8+6 = 30. Therefore the thirty experiments are carried
out according to the blocked central composite design
(CCD).
3. Mathematical Models
The relationship between the surface roughness and cutting
independent variables can be represented by the following
equation (Sabahudin et al, 2011).
Ra=K.Nx.f
y.a
z.r
zr (3)
Where, K is constant, and x, y, z and r are the exponents.
Equation (3) can be represented in mathematical form as
follows: InRa = In K + x.In N + y.In f + z.In a + zr.In a (4)
The constant and exponents K, x, y, z, zr can be determined
by least squares method. The introduction of a replacement
gets the following expression:
Y = InRa, β0 = InK, x1 = InN, x2 = Inf, x3 = In a, x4=Inr, x =
β1, y = β2, z = β3, zr = β4 (5) Therefore, e
β0 = K (6)
Linear model developed from the equation can be
represented as follows:
Y = β0+ β1x1 + β2x2 + β3x3 + β4x4 (7)
Where, x1, x2, x3, x4, are logarithmic transformation of
factors: spindle speed, feed rate, axial depth of cut and radial
depth of cut and β values are the estimates of corresponding
parameters.
Table 4: Experimental result for MQL environment
Std
Run
Factor 1 A: Spindle
speed(rpm)
Factor 2 B: Feed rate
(mm/min)
Factor 3 C: Axial
depth of cut(mm)
Factor 4 D: Radial
depth of cut(mm)
Factor 5 E: Surface
roughness (Ra)(µm)
13 1 -1 -1 1 1 0.94
14 2 1 -1 1 1 0.85
8 3 1 1 1 -1 1.02
11 4 -1 1 -1 1 1.11
9 5 -1 -1 -1 1 0.92
24 6 0 0 0 2 1.1
1 7 -1 -1 -1 -1 0.9
25 8 0 0 0 0 1.01
5 9 -1 -1 1 -1 0.88
18 10 2 0 0 0 0.51
20 11 0 2 0 0 1.16
16 12 1 1 1 1 1.1
19 13 0 -2 0 0 0.5
4 14 1 1 -1 -1 0.98
22 15 0 0 2 0 1
23 16 0 0 0 -2 0.88
26 17 0 0 0 0 1.08
10 18 1 -1 -1 1 0.93
2 19 1 -1 -1 -1 0.74
27 20 0 0 0 0 1.08
17 21 -2 0 0 0 1.12
12 22 1 1 -1 1 1.07
15 23 -1 1 1 1 1.14
21 24 0 0 -2 0 0.92
30 25 0 0 0 0 0.96
3 26 -1 1 -1 -1 1.06
7 27 -1 1 1 -1 1.04
6 28 1 -1 1 -1 0.6
29 29 0 0 0 0 1.01
28 30 0 0 0 0 1.01
From equation (7), by minimizing the sum of the squares of
the residual,
We have
Solving the minimization, the resulting equations are as
follows nβ0+ β1∑x1 + β2∑x2 + β3∑x3 + β4∑x4 = ∑Yi
β0 ∑x1+ β1∑x12 + β2∑x1x2 + β3∑x1x3 + β4∑x1x4 = ∑x1Yi
β0 ∑x2+ β1∑x1x2 + β2∑x22 + β3∑x2x3 + β4∑x2x4 = ∑x2Yi
β0 ∑x3+ β1∑ x1x3 + β2∑ x2x3 + β3∑x32 + β4∑x3x4 = ∑x3Yi
β0 ∑x4+ β1∑ x1x4 + β2∑ x2x4 + β3∑ x3x4 + β4∑x42 = ∑x4Yi
Since the surface roughness from the experiment has been
established, the analysis for the multiple regressions using
equations above are done to obtain regression coefficient
and the sum values calculated for xi, with the following
results: ∑x1= 227.2231 ∑x1x2= 1212.728 ∑x2= 160.1149 ∑x1x3= 674.6051 ∑x3= 89.06798 ∑x1x4= 80.53167 ∑x4= 10.6339 ∑x1Yi= -15.7963 ∑Yi= -2.00772 ∑x2x3= 475.3713
Paper ID: SUB154684 2939
International Journal of Science and Research (IJSR) ISSN (Online): 2319-7064
Index Copernicus Value (2013): 6.14 | Impact Factor (2013): 4.438
Volume 4 Issue 5, May 2015
www.ijsr.net Licensed Under Creative Commons Attribution CC BY
∑x12=1722.695 ∑x2x4= 56.75883
∑x22= 857.8118 ∑x2Yi= -9.41013
∑x32=266.1206 ∑x3x4= 31.56074
∑x42=7.136489 ∑x3Yi= -5.98435
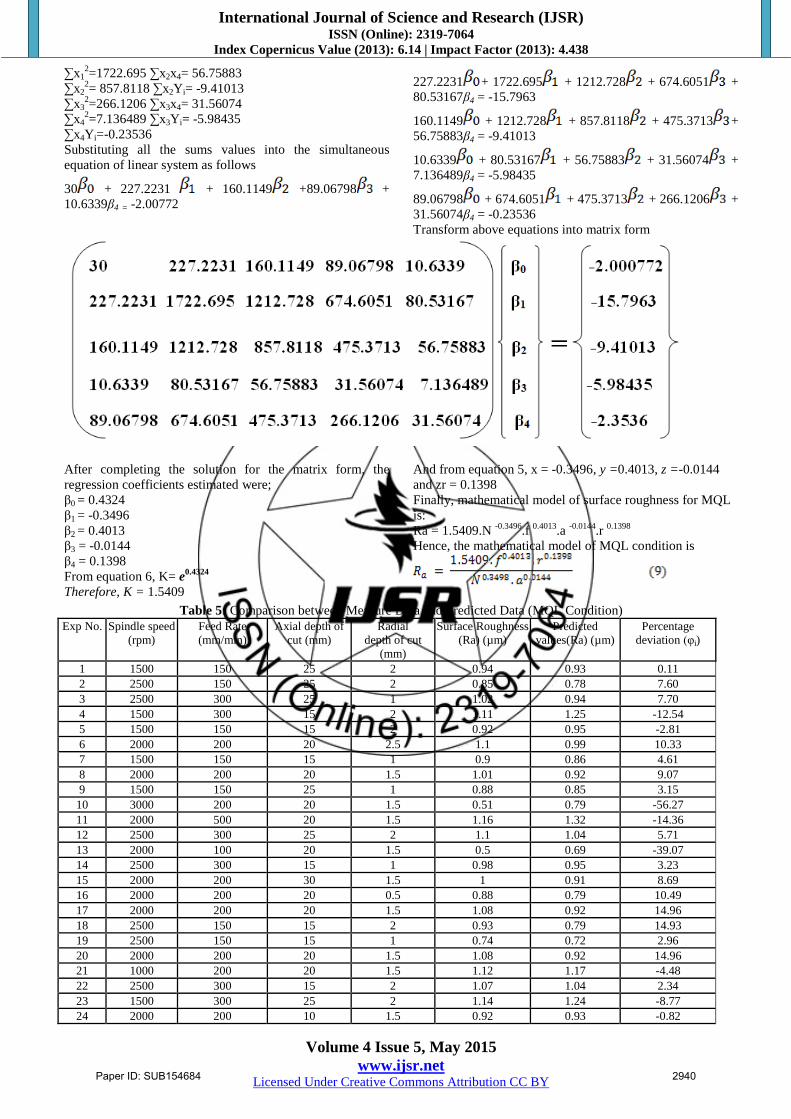
∑x4Yi=-0.23536 Substituting all the sums values into the simultaneous
equation of linear system as follows
30 + 227.2231 + 160.1149 +89.06798 +
10.6339β4 = -2.00772
227.2231 + 1722.695 + 1212.728 + 674.6051 +
80.53167β4 = -15.7963
160.1149 + 1212.728 + 857.8118 + 475.3713 +
56.75883β4 = -9.41013
10.6339 + 80.53167 + 56.75883 + 31.56074 +
7.136489β4 = -5.98435
89.06798 + 674.6051 + 475.3713 + 266.1206 +
31.56074β4 = -0.23536 Transform above equations into matrix form
After completing the solution for the matrix form, the
regression coefficients estimated were; β0 = 0.4324 β1 = -0.3496 β2 = 0.4013 β3 = -0.0144 β4 = 0.1398 From equation 6, K= e
0.4324
Therefore, K = 1.5409
And from equation 5, x = -0.3496, y =0.4013, z =-0.0144
and zr = 0.1398 Finally, mathematical model of surface roughness for MQL
is:
Ra = 1.5409.N -0.3496
.f 0.4013
.a -0.0144
.r 0.1398
Hence, the mathematical model of MQL condition is
Table 5: Comparison between Measure Data and Predicted Data (MQL Condition)
Exp No. Spindle speed
(rpm)
Feed Rate
(mm/min)
Axial depth of
cut (mm)
Radial
depth of cut
(mm)
Surface Roughness
(Ra) (µm)
Predicted
values(Ra) (µm)
Percentage
deviation (φi)
1 1500 150 25 2 0.94 0.93 0.11
2 2500 150 25 2 0.85 0.78 7.60
3 2500 300 25 1 1.02 0.94 7.70
4 1500 300 15 2 1.11 1.25 -12.54
5 1500 150 15 2 0.92 0.95 -2.81
6 2000 200 20 2.5 1.1 0.99 10.33
7 1500 150 15 1 0.9 0.86 4.61
8 2000 200 20 1.5 1.01 0.92 9.07
9 1500 150 25 1 0.88 0.85 3.15
10 3000 200 20 1.5 0.51 0.79 -56.27
11 2000 500 20 1.5 1.16 1.32 -14.36
12 2500 300 25 2 1.1 1.04 5.71
13 2000 100 20 1.5 0.5 0.69 -39.07
14 2500 300 15 1 0.98 0.95 3.23
15 2000 200 30 1.5 1 0.91 8.69
16 2000 200 20 0.5 0.88 0.79 10.49
17 2000 200 20 1.5 1.08 0.92 14.96
18 2500 150 15 2 0.93 0.79 14.93
19 2500 150 15 1 0.74 0.72 2.96
20 2000 200 20 1.5 1.08 0.92 14.96
21 1000 200 20 1.5 1.12 1.17 -4.48
22 2500 300 15 2 1.07 1.04 2.34
23 1500 300 25 2 1.14 1.24 -8.77
24 2000 200 10 1.5 0.92 0.93 -0.82
Paper ID: SUB154684 2940

International Journal of Science and Research (IJSR) ISSN (Online): 2319-7064
Index Copernicus Value (2013): 6.14 | Impact Factor (2013): 4.438
Volume 4 Issue 5, May 2015
www.ijsr.net Licensed Under Creative Commons Attribution CC BY
Exp No. Spindle speed
(rpm)
Feed Rate
(mm/min)
Axial depth of
cut (mm)
Radial
depth of cut
(mm)
Surface Roughness
(Ra) (µm)
Predicted
values(Ra) (µm)
Percentage
deviation (φi)
25 2000 200 20 1.5 0.96 0.92 4.34
26 1500 300 15 1 1.06 1.13 -6.96
27 1500 300 25 1 1.04 1.12 -8.22
28 2500 150 25 1 0.6 0.71 -18.81
29 2000 200 20 1.5 1.01 0.92 9.07
30 2000 200 20 1.5 1.01 0.92 9.07
Figure 2: Actual and Predicted Values of the Surface Roughness in MQL Condition
Similarly, the actual values gotten from the experiment and
the predicted values obtained from the developed
mathematical model are depicted in figure 2. It can be seen
that they have good agreement. Quantitatively, In order to
judge the accuracy of the experimental developed
mathematical models, percentage deviation φi and average
percentage deviation were used. The percentage
deviation φi is stated thus:
(10) Where φi: percentage deviation of single sample data, Ra(e):
measured, Ra(e): predicted Ra(m) generated by a multiple
regression equation.
Similarly, the average percentage deviation is stated thus:
Where : average percentage deviation of all sample data
n: the size of sample data.
For training data = = 10.54%
The result of average percentage deviation ( ) showed that
the training data set (n=30) was 10.54%. This means that the
statistical model could predict the surface roughness (Ra)
with about 89.5% accuracy of the training data set. For a full
test on the model created on the training data, table 6 shows
the predicted value for surface roughness and percentage
deviation from the measured or actual Ra values.
4. Effects of Cutting Parameters on Surface
Roughness under MQL Condition
The effects of cutting parameters on surface roughness in
end milling of aluminium were investigated using contour
plots of the results obtained in MQL conditions. The
graphical evaluation was obtained by plotting surface
roughness values against the various cutting parameters
(axial depth of cut, radial depth of cut, spindle speed and
feed rate). Surface roughness values are simultaneously
plotted against two cutting parameters while keeping the
other two constant. Figures 3-4 show the experimental
results obtained from the effect of cutting parameters on
surface roughness.
Figure 3: Surface Roughness Contour Plot for Spindle
Speed vs Feed Rate in MQL Condition
Paper ID: SUB154684 2941

International Journal of Science and Research (IJSR) ISSN (Online): 2319-7064
Index Copernicus Value (2013): 6.14 | Impact Factor (2013): 4.438
Volume 4 Issue 5, May 2015
www.ijsr.net Licensed Under Creative Commons Attribution CC BY
Figure 4: Surface Roughness Contour Plot for Axial Depth
of Cut vs Radial Depth of Cut in MQL Condition
Following conclusions can be deduced from figure 3 and
figure 4.
Spindle speed: An increase in spindle speed increases the
cutting force and eliminates the built-up edge (BUE)
tendency. At low spindle speed (rpm), the unstable larger
BUE is formed and also the chips fracture readily producing
the rough surface. As the spindle speed (rpm) increases, the
BUE vanishes, chip fracture decreases, and hence, the
roughness decreases. These findings were in line with
observations made by Tosun and Mesut (2010); Korkut and
Donertas (2007) in related studies. Feed rate: An increase in
feed rate significantly increases the surface roughness.
Increasing feed rate increases vibration and heat generated,
which courses an increase in surface roughness. As the feed
rate is increased, chips become discontinuous and are
deposited between work piece and tool leading to increased
coefficient of friction and more interruption resulting in poor
surface finish. This finding is also supported by Arokiadass
et al (2011). Radial depth of cut: increasing the radial depth
of cut will slightly increase the surface roughness. Axial
depth of cut: it has no significant effect on the surface
roughness. This is supported by observation.
5. Conclusion
Experimental work is carried out on aluminium metal in
MQL environments. Through experimentation, the system
proved it is capable of predicting the surface roughness (Ra)
with about 89.5% accuracy in MQL environment. The
important conclusions drawn from the present research are
summarized as follows:
• The quadratic second order models developed to predict
the surface roughness value for the MQL cutting condition
could provide predictive values for surface roughness
pretty close to the actual values by applying the values of
the control parameter on the model. • In the order of influence, spindle speed is the most
significant effect on the surface roughness, followed by
feed rate. However radial depth of cut has little effect on
the surface roughness and axial depth of cut has no
significant effect on the surface roughness. • From the experimental values of table 4, the optimum or
minimum surface roughness during cutting process occurs
at spindle speed of 2000rpm, feed rate of 100mm/min,
axial depth of cut 20mm and radial depth of cut 1.5mm for
these conditions, the minimum surface roughness was
0.50µm. • Interaction effect between spindle speed and feed rate also
possesses a major effect over the surface roughness,
followed by axial depth of cut and radial depth of cut.
References
[1] Arokiadass, R., Palaniradja, K., & Alagumoorthi, N.
(2011). Predictive modeling of surface roughness in end
milling of Al/SiCp metal matrix composite. Archive of
Applied Science Research, 3 (2) 228-236
[2] Benardos, P. G. & Vosniakos, G. C. (2002). Prediction
of surface roughness in CNC faces milling using neural
networks and taguchi's design of experiments. Robotics
and Computer-Integrated Manufacturing 18 (5-6): 343-
354.
[3] Chapra, S.C. & Canale, R.P. Numerical methods for
engineers 5th
edition. The Mcgraw-Hill Companies,
[4] Datta, u., Lanjewar, R., & Balamurugan, G. (Groover
2007). Development of Automatic CTC Roller Chasing
Machine. 13th
National Conference on Mechanisms and
Machines (NaCoMM07), IISc, Bangalore, India,
December 12-13, 2007 NaCoMM122
[5] Ginta, T.L., Nurul, A.K.M., Amin, H.C.D., Mohd Radzi
& Lajis, M.A. (2009).Development of surface
roughness models in end milling titanium alloy ti-6al-4v
using uncoated tungsten carbide inserts. European
Journal of Scientific Research, ISSN 1450-216X 28, 4,
542-551
[6] Korkut, I., & Donertas, M. A. (2007). The influence of
feed rate and cutting speed on the cutting forces, surface
roughness and tool–chip contact length during face
milling. Materials & Design, 28, 308–312.
[7] Sabahudin, E., Joan, V.C., Edin. B., & Nadja, O.A.
(2011). Experimental modeling of surface roughness
parameters during cutting steel 30NiMo8, 15th
International Research/Expert Conference, TMT.
[8] Tosun, N., & Huseyinoglu, M. (2010). Effect of MQL
on surface roughness in milling of AA7075-T6.
Materials and Manufacturing Processes, 25, 793-798.
[9] Wang, M.Y., & Chang, H.Y. (2004). Experimental study
of surface roughness in slot end milling, International
Journal of Machine Tools & Manufacture 44, 51–57.
Paper ID: SUB154684 2942