Effects of Crystallographic Orientation and Grain ...
31
Page 1 of 31 Effects of Crystallographic Orientation and Grain Morphology on Crack Tip Stress State and Plasticity M.E. Kartal 1 , M.A. Cuddihy 2, and F. P. E. Dunne 2 1 Department of Engineering Science, University of Oxford, Parks Road, Oxford OX1 3PJ, UK 2 Department of Materials, Imperial College London, London SW7 2AZ, UK Abstract The Sih, Paris and Irwin analytical solution for cracks in anisotropic elastic media has been developed for an hcp Ti single crystal and shown to lead to crack tip normal stresses which are independent of crystal orientation but other stress components which are dependent. Detailed finite element studies confirm that the stress intensity remains independent of crystal orientation but ceases to do so in an edge-cracked bi-crystal. The incorporation of crystallographic slip demonstrates that single-crystal crack tip stresses largely remain independent of crystal orientation but that the plastic zone size and shape depends greatly upon it. Significant differences result in both the magnitude and extent of the plasticity at the crack tip with crystallographic orientation which can be quite different to that predicted using Mises plasticity. For an edge crack terminating in a bi-crystal, the slip fields which result depend upon both crystal mis-orientation and morphology. Keywords: Stress intensity; crystal plasticity; anisotropy; titanium alloys; cold dwell fatigue; crystallographic slip. Corresponding author: [email protected]
Transcript of Effects of Crystallographic Orientation and Grain ...
Page 1 of 31
Effects of Crystallographic Orientation and Grain Morphology on
Crack Tip Stress State and Plasticity
M.E. Kartal1, M.A. Cuddihy2, and F. P. E. Dunne2
1Department of Engineering Science, University of Oxford, Parks Road, Oxford OX1 3PJ, UK
2Department of Materials, Imperial College London, London SW7 2AZ, UK
Abstract
The Sih, Paris and Irwin analytical solution for cracks in anisotropic elastic media has been
developed for an hcp Ti single crystal and shown to lead to crack tip normal stresses which
are independent of crystal orientation but other stress components which are dependent.
Detailed finite element studies confirm that the stress intensity remains independent of crystal
orientation but ceases to do so in an edge-cracked bi-crystal.
The incorporation of crystallographic slip demonstrates that single-crystal crack tip stresses
largely remain independent of crystal orientation but that the plastic zone size and shape
depends greatly upon it. Significant differences result in both the magnitude and extent of the
plasticity at the crack tip with crystallographic orientation which can be quite different to that
predicted using Mises plasticity. For an edge crack terminating in a bi-crystal, the slip fields
which result depend upon both crystal mis-orientation and morphology.
Keywords: Stress intensity; crystal plasticity; anisotropy; titanium alloys; cold dwell fatigue;
crystallographic slip.
Corresponding author: [email protected]

Page 2 of 31
Nomenclature
𝜎𝑖𝑗 = Stress in the direction indicated by the subscript, x-y Cartesian and r- for polar
𝜀𝑖𝑗 = Strain in the direction indicated by the subscript, x-y Cartesian and r- for polar
𝜑1,2 = Euler angle
𝑠𝑖𝑗 = Element of the compliance matrix
𝜇𝑗 = Roots of the characteristic equation, j = 1, 2, 3, 4
𝐾𝑗 = Stress intensity factor, j = I or II depending on mode
𝑹 = Rotation matrix
𝑻 = Transformation matrix
𝑺 = Rotated compliance matrix
𝑎, 𝑏 = Crack length and plate width, respectively
Page 3 of 31
1. Introduction
Since the 1950s, titanium has been the mainstay for critical rotating components such as discs
and blades, in the low to high pressure sections of the compressor of gas turbine engines [1].
Titanium alloys offer several key advantages including reduced density, high fracture
toughness, high strength and corrosion resistance. Indeed, the latter two qualities have led to
extensive titanium use in biomedical devices [2]. Particular alloys may be used throughout
aircraft production, such as landing gear, nacelles and fuselage [3]. The ‘workhorse’ of the
aerospace industry is the alloy Ti-6Al-4V which in some instances may make up 80-90% of
the titanium used on an aircraft [3], and accounts for approximately 56% of the market share
of all titanium production [2]. Commercially pure (CP) titanium only accounts for 26%, with
the remainder largely occupied by various alpha and alpha-beta alloys.
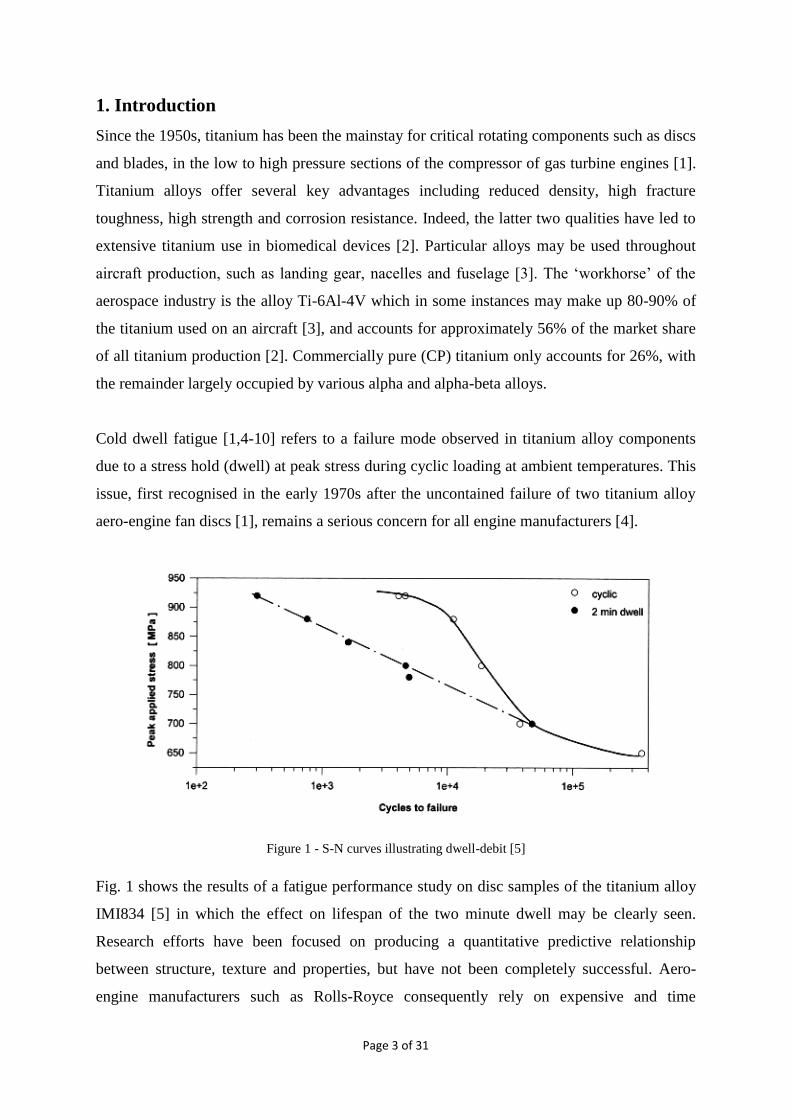
Cold dwell fatigue [1,4-10] refers to a failure mode observed in titanium alloy components
due to a stress hold (dwell) at peak stress during cyclic loading at ambient temperatures. This
issue, first recognised in the early 1970s after the uncontained failure of two titanium alloy
aero-engine fan discs [1], remains a serious concern for all engine manufacturers [4].
Figure 1 - S-N curves illustrating dwell-debit [5]
Fig. 1 shows the results of a fatigue performance study on disc samples of the titanium alloy
IMI834 [5] in which the effect on lifespan of the two minute dwell may be clearly seen.
Research efforts have been focused on producing a quantitative predictive relationship
between structure, texture and properties, but have not been completely successful. Aero-
engine manufacturers such as Rolls-Royce consequently rely on expensive and time
Page 4 of 31
consuming component tests which attempt to establish empirical relations that may be
incorporated in the design methodologies [6].
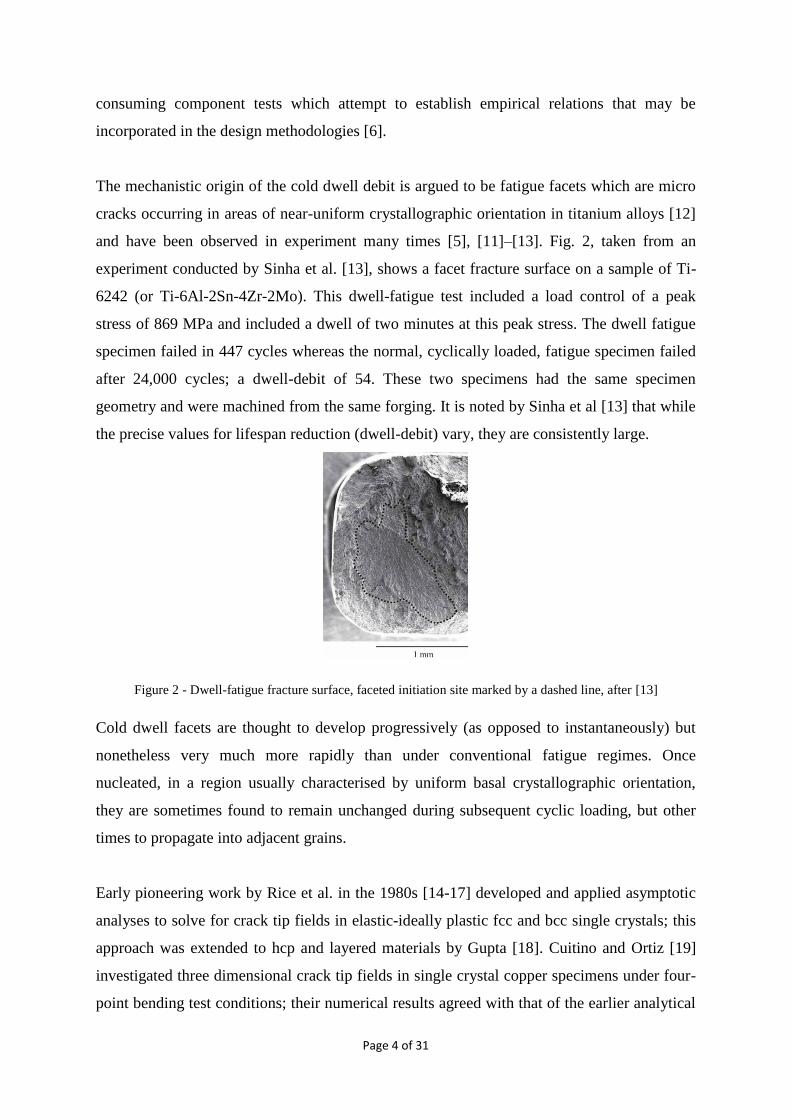
The mechanistic origin of the cold dwell debit is argued to be fatigue facets which are micro
cracks occurring in areas of near-uniform crystallographic orientation in titanium alloys [12]
and have been observed in experiment many times [5], [11]–[13]. Fig. 2, taken from an
experiment conducted by Sinha et al. [13], shows a facet fracture surface on a sample of Ti-
6242 (or Ti-6Al-2Sn-4Zr-2Mo). This dwell-fatigue test included a load control of a peak
stress of 869 MPa and included a dwell of two minutes at this peak stress. The dwell fatigue
specimen failed in 447 cycles whereas the normal, cyclically loaded, fatigue specimen failed
after 24,000 cycles; a dwell-debit of 54. These two specimens had the same specimen
geometry and were machined from the same forging. It is noted by Sinha et al [13] that while
the precise values for lifespan reduction (dwell-debit) vary, they are consistently large.
Figure 2 - Dwell-fatigue fracture surface, faceted initiation site marked by a dashed line, after [13]
Cold dwell facets are thought to develop progressively (as opposed to instantaneously) but
nonetheless very much more rapidly than under conventional fatigue regimes. Once
nucleated, in a region usually characterised by uniform basal crystallographic orientation,
they are sometimes found to remain unchanged during subsequent cyclic loading, but other
times to propagate into adjacent grains.
Early pioneering work by Rice et al. in the 1980s [14-17] developed and applied asymptotic
analyses to solve for crack tip fields in elastic-ideally plastic fcc and bcc single crystals; this
approach was extended to hcp and layered materials by Gupta [18]. Cuitino and Ortiz [19]
investigated three dimensional crack tip fields in single crystal copper specimens under four-
point bending test conditions; their numerical results agreed with that of the earlier analytical

Page 5 of 31
studies of Rice et al. The present work builds upon the analytical HRR-fields based research
of Rice et al by utilising the full computational power of crystal plasticity finite element
methods.
The first to address crack nucleation in a rigorous manner was Stroh [20]. Later studies have
addressed facet nucleation criteria (e.g. Kirane and Ghosh [21], and Dunne and Rugg [22]) in
particular, hypothesised the role of normal and shear stress relative to a basal plane in
nucleation. However, the mechanics of nucleated facets, either partially developed across a
region of uniform crystallographic orientation, or subsequently propagating into adjacent
grains, has not received attention. Particularly, the stresses and stress intensities and localised
(plastic) slip at the crack tip generated by a facet, and influenced by local crystallographic
details of morphology and orientation, leading to very strong elastic and plastic anisotropy,
have not been addressed.
This paper therefore presents a fundamental assessment of stress and stress intensity
generated by an existing facet within, initially, a single crystal in which the crystallographic
orientation is varied with respect to remote loading direction. The work is extended to
consider the presence of a facet within bi-crystals with specified and varied crystallographic
orientations and sizes in order to investigate the roles of grain constraint and crystallographic
orientation in stress and stress intensity local to the crack tip. Finally, the anisotropic nature
of the slip developed local to the facet tip is investigated with respect to crystallographic
orientation.
In the next section, the fundamental analysis of stress intensities in anisotropic media are
addressed, which are specialised for hexagonal close packed (hcp) elastic anisotropy. An
analytical analysis is presented of the stresses local to an edge crack in an elastically
anisotropic hcp single crystal and their dependence on crystallographic orientation is
investigated. An edge crack in an elastically anisotropic Ti hcp bi-crystal is then addressed
using a finite element model in order to investigate the role of the combination of
crystallographic orientation on stress and stress intensity at the crack tip. This is followed by
a brief description of the crystal plasticity slip model which is employed to investigate the
accumulated slip fields ahead of the crack tip, taking full account of the anisotropic nature of
the slip activity. We then address the nature of the crystal slip fields established at the crack
tip, and their dependence on crystallographic orientation and relative grain size. In passing,

Page 6 of 31
the slip fields so determined are compared with the plastic strain fields obtained from Mises
plasticity, but while maintaining the elastic anisotropy of the crystals. Finally, a quantitative
analysis of accumulated slip at the crack tip as a function of crystallographic orientation is
also presented.
2. Analytical Crack-tip Stress Fields in 2D Anisotropic Media
In this section, elastic anisotropy associated with hcp crystal structure is considered since this
is of importance in the context of Ti alloy facet nucleation. An edge crack is first considered
in a homogeneous single crystal with arbitrary crystallographic orientation with respect to the
crack direction and remote loading.
2.1 Stress Field Formulation
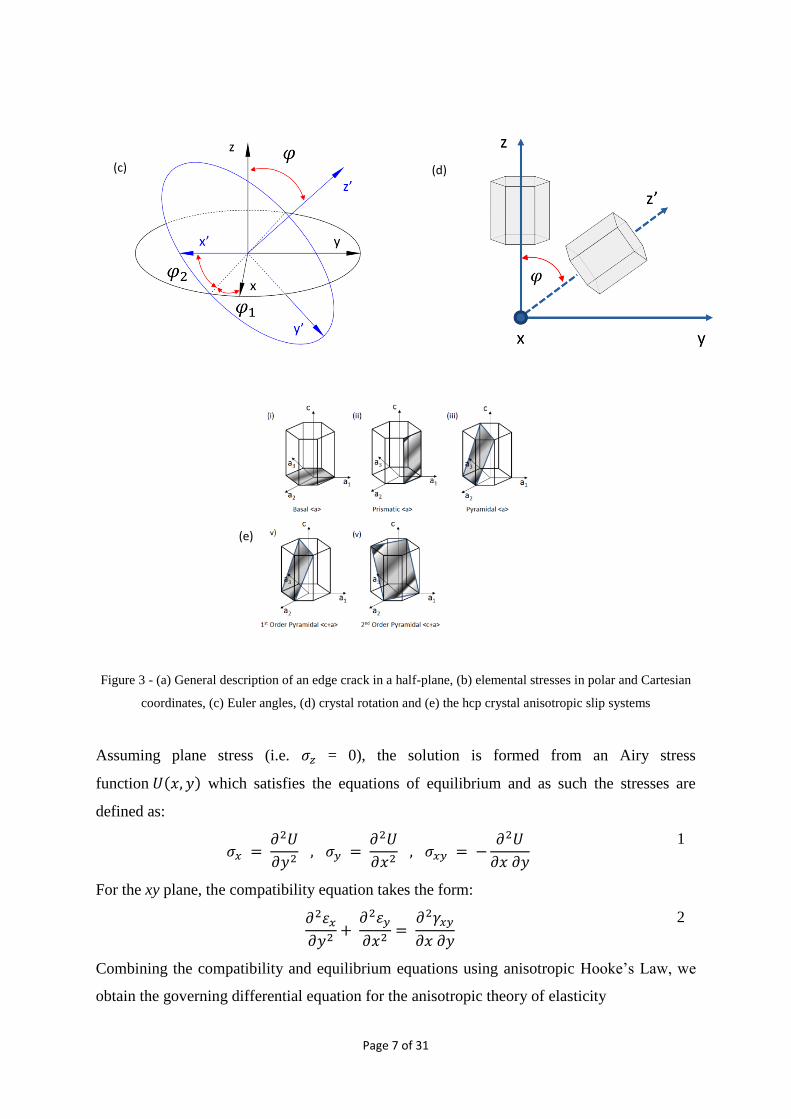
Consider a plate, with its major dimensions lying in the xy plane and the z-axis directed into
the page, as shown in Fig. 3(a). The x and y axes are parallel and normal to the crack surface
respectively.
(c) (a) (b)
Page 7 of 31
Figure 3 - (a) General description of an edge crack in a half-plane, (b) elemental stresses in polar and Cartesian
coordinates, (c) Euler angles, (d) crystal rotation and (e) the hcp crystal anisotropic slip systems
Assuming plane stress (i.e. 𝜎𝑧 = 0), the solution is formed from an Airy stress
function 𝑈(𝑥, 𝑦) which satisfies the equations of equilibrium and as such the stresses are
defined as:
𝜎𝑥 =
𝜕2𝑈
𝜕𝑦2 , 𝜎𝑦 =
𝜕2𝑈
𝜕𝑥2 , 𝜎𝑥𝑦 = −
𝜕2𝑈
𝜕𝑥 𝜕𝑦
1
For the xy plane, the compatibility equation takes the form:
𝜕2𝜀𝑥
𝜕𝑦2+
𝜕2𝜀𝑦
𝜕𝑥2=
𝜕2𝛾𝑥𝑦
𝜕𝑥 𝜕𝑦
2
Combining the compatibility and equilibrium equations using anisotropic Hooke’s Law, we
obtain the governing differential equation for the anisotropic theory of elasticity
(c) (d)
(e)

Page 8 of 31
𝑠22
𝜕4𝑈
𝜕𝑥4− 2𝑠26
𝜕4𝑈
𝜕𝑥3𝜕𝑦+ (2𝑠26 + 𝑠55)
𝜕4𝑈
𝜕𝑥2𝜕𝑦2− 2𝑠16
𝜕4𝑈
𝜕𝑥 𝜕𝑦3+ 𝑠11
𝜕4𝑈
𝜕𝑦4= 0
3
where, 𝑠𝑖𝑗 are the components of the stress-strain compliance matrix for an anisotropic
material (a similar equation may be obtained for plane strain). The 4th order differential
equation may be solved by means of a characteristic equation which is:
𝑠11𝜇𝑗4 − 2𝑠16𝜇𝑗
3 + (2𝑠12 + 𝑠55)𝜇𝑗2 − 2𝑠26𝜇𝑗 + 𝑠22 = 0 4
noting that 𝜇𝑗 are the roots of this equation and represent the material properties in the stress
field equations. Lekhnitskii [23] has shown that the roots of Eq.4 are complex conjugate pairs
of the form:
𝜇1 = 𝛼1 + 𝑖𝛽1, 𝜇2 = 𝛼2 + 𝑖𝛽2, 𝜇3 = 𝜇1, 𝜇4 = 𝜇
2 5
Further details of the derivation are available in Liebowitz [24], but the pertinent equations
for Mode I are:
𝜎𝑥𝑥 =
𝐾𝐼
√2𝑟𝑅𝑒 [
𝜇1𝜇2
𝜇1 − 𝜇2(
𝜇2
√(𝑐𝑜𝑠𝜃 + 𝜇2𝑠𝑖𝑛𝜃)−
𝜇1
√(𝑐𝑜𝑠𝜃 + 𝜇1𝑠𝑖𝑛𝜃))]
6
𝜎𝑦𝑦 =
𝐾𝐼
√2𝑟𝑅𝑒 [
1
𝜇1 − 𝜇2(
𝜇1
√(𝑐𝑜𝑠𝜃 + 𝜇2𝑠𝑖𝑛𝜃)−
𝜇2
√(𝑐𝑜𝑠𝜃 + 𝜇1𝑠𝑖𝑛𝜃))]
7
𝜎𝑥𝑦 =
𝐾𝐼
√2𝑟𝑅𝑒 [
𝜇1𝜇2
𝜇1 − 𝜇2(
1
√(𝑐𝑜𝑠𝜃 + 𝜇2𝑠𝑖𝑛𝜃)−
1
√(𝑐𝑜𝑠𝜃 + 𝜇1𝑠𝑖𝑛𝜃))]
8
The proceeding investigation utilises polar coordinates, see Fig. 3(b); this transformation
involves using the following equations:
𝜎𝑟𝑟 = 𝜎𝑥𝑥𝑐𝑜𝑠2𝜃 + 𝜎𝑥𝑥𝑠𝑖𝑛2𝜃 + 𝜎𝑥𝑦𝑠𝑖𝑛2𝜃 9
𝜎𝜃𝜃 = 𝜎𝑥𝑥𝑐𝑜𝑠2𝜃 + 𝜎𝑥𝑥𝑠𝑖𝑛2𝜃 − 𝜎𝑥𝑦𝑠𝑖𝑛2𝜃 10
𝜎𝑟𝜃 = (𝜎𝑦𝑦 − 𝜎𝑥𝑥)𝑠𝑖𝑛𝜃𝑐𝑜𝑠𝜃 + 𝜎𝑥𝑦𝑐𝑜𝑠2𝜃 11
This is the first study to apply the original Sih et al. [25] derived equations to the particular
case of a transversely isotropic material; Lempidaki et al. [26] investigated cubic materials.
In this paper we assess the effects of rotating the hcp crystal in 3D space on the crack-tip
stress state and investigate the effects of crystallographic orientation.

Page 9 of 31
Any rotation of a crystal in three-dimensional Euclidean space may be obtained by patterns of
successive rotations; indeed there are many possible approaches, such as Rodriguez
parameters or quaternions, but the approach used in this study follows the Bunge convention,
common in materials science [27]. This approach considers three rotations about the Z-X-Z’
axes, where Z’ is the new local Z-axis (refer to Fig. 3(c)). The product of these individual
rotations gives the overall rotation matrix R given by
𝑹 = 𝑹𝜑1𝑹𝜑𝑹𝜑2
12
Consider the rotation of the stress tensor
𝝈′ = 𝑹 𝝈 𝑹𝑇 13
Converting the stress tensors to vector form yields:
σ′ = 𝑻 𝜎 14
The T matrix now contains the details of the rotation applied to the stress vector so that the
compliance matrix, for example, is rotated using the following relation:
𝑺3𝐷 𝑅𝑜𝑡 = 𝑻−1𝑺 𝑻 15
The above procedure now allows the calculation of the compliance matrix for any specified
crystallographic rotation - further details of the rotation are provided in Appendix A.
It has been demonstrated by Sih et al. [25] that the stress intensity factors for isotropic and
anisotropic materials are identical under conditions of self-equilibrating loads. Therefore, if
the stress intensity factor is already known for a problem involving an isotropic medium, then
it may be applied to that of an anisotropic one. This is contrary to the results of Bao et al.
[28], in which it is shown that independence is lost, but this is due to notch geometry. For the
case of an infinitesimal crack, as Sih et al have shown, the stress intensity remains
independent of the elastic properties, be they anisotropic or isotropic.
As the above equations (6-8) describe the general stress state near a crack tip for a central
crack in an infinite medium [25], appropriate selection of stress intensity factor is necessary
to apply them the case of an edge crack. In this study the function for 𝐾𝐼 used is that which
was developed by Brown and Srawley [29]:
𝐾𝐼 = 𝜎0√𝜋𝑎 (1.12 − 0.23(𝑎 𝑏⁄ ) + 10.6(𝑎 𝑏⁄ )
2
− 21.7(𝑎 𝑏⁄ )3
+ 30.4(𝑎 𝑏⁄ )4
) 16
Page 10 of 31
2.2 Stresses at Crack Tip in hcp Single Crystal Titanium
The elastic anisotropic stress field theory allows for the calculation of the stress components
local to the crack tip in a single hcp crystal subject to remote uniaxial loading. The crystal is
200 x 200m in size, with an edge crack of length 10m, under a 100MPa tensile load, as
depicted in Fig. 3(a). The crystallographic orientation is specified as shown schematically in
Fig. 3(d). The anisotropic elastic properties used for a representative titanium alloy are given
in Appendix B; these properties are specified in the reference configuration. The rotation
scheme described in the previous section is used to generate the correct rotated 𝑠𝑖𝑗 values for
the characteristic equation (Eq. 4). Upon solving this quartic equation, the required 𝜇𝑗
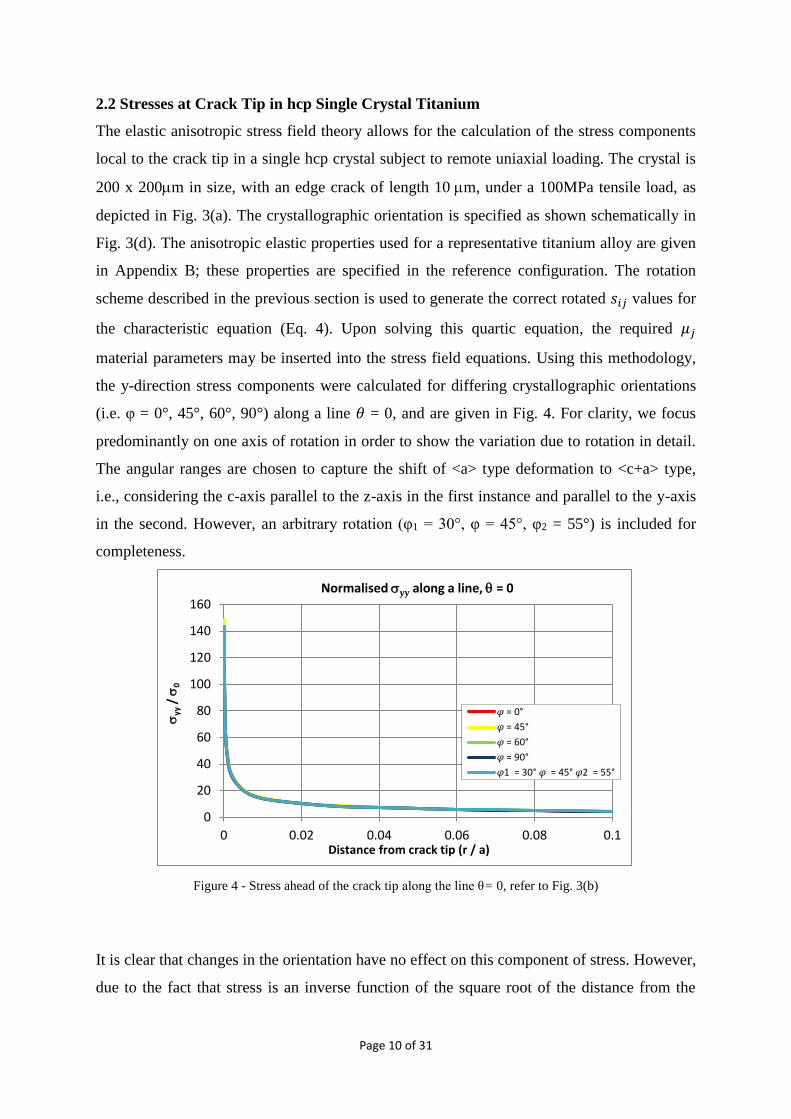
material parameters may be inserted into the stress field equations. Using this methodology,
the y-direction stress components were calculated for differing crystallographic orientations
(i.e. φ = 0°, 45°, 60°, 90°) along a line 𝜃 = 0, and are given in Fig. 4. For clarity, we focus
predominantly on one axis of rotation in order to show the variation due to rotation in detail.
The angular ranges are chosen to capture the shift of <a> type deformation to <c+a> type,
i.e., considering the c-axis parallel to the z-axis in the first instance and parallel to the y-axis
in the second. However, an arbitrary rotation (φ1 = 30°, φ = 45°, φ2 = 55°) is included for
completeness.
Figure 4 - Stress ahead of the crack tip along the line θ= 0, refer to Fig. 3(b)
It is clear that changes in the orientation have no effect on this component of stress. However,
due to the fact that stress is an inverse function of the square root of the distance from the
0
20
40
60
80
100
120
140
160
0 0.02 0.04 0.06 0.08 0.1
syy
/ s
0
Distance from crack tip (r / a)
Normalised syy along a line, = 0
𝜑 = 0°
𝜑 = 45°
𝜑 = 60°
𝜑 = 90°
𝜑1 = 30° 𝜑 = 45° 𝜑2 = 55°

Page 11 of 31
crack tip it was felt that calculations in polar co-ordinates would give a better description of
the stress state. As before, a varied series of crystallographic orientations (i.e. φ = 0°, 30°,
45°, 60°, 90°) were considered and polar stresses at a specified distance from (r = 0.5m) and
in a full circle around the crack tip were calculated (Eq. 9-11). The distance of 0.5 µm was
selected so as to be fully representative of the K-field. In Fig. 5(a)-(c), the polar components
of stress are shown against the circumferential distance around the crack tip. The radial
stresses in Fig. 5(a) show the biggest variation in magnitude for varying crystallographic
orientation, but remain modest; this is echoed by the shear stresses. The hoop stresses are
independent of crystallographic orientation.
0
1
2
3
4
5
6
7
8
-180 -150 -120 -90 -60 -30 0 30 60 90 120 150 180
s/ s
0
/degrees
Radial stresses at r = 0.5m
𝜑 = 0°𝜑 = 30°𝜑 = 45°𝜑 = 60°𝜑 = 90°𝜑1 = 30° 𝜑 = 45° 𝜑2 = 55°
0
1
2
3
4
5
6
7
-180 -150 -120 -90 -60 -30 0 30 60 90 120 150 180
s/ s
0
/degrees
Hoop stresses at r = 0.5m
𝜑 = 0°
𝜑 = 30°
𝜑 = 45°
𝜑 = 60°
𝜑 = 90°
𝜑1 = 30° 𝜑 = 45° 𝜑2 = 55°

Page 12 of 31
Figure 5 - Normalised radial (𝜎𝑟𝑟/𝜎0), circumferential (𝜎𝜃𝜃/𝜎0) and shear (𝜎𝑟𝜃/𝜎0) stress components at a
fixed distance from the crack tip, r=0.5 µm
Considered in parallel were the stress intensity factors for the elastic single crystal. These
were assessed by means of a finite element model, shown in Fig. 6. The hcp crystal
orientation was specified as in the above analytical study. The stress intensity factor was
calculated using the J-integral approach developed by Rice [30], which has been incorporated
within the ABAQUS finite element software. In ABAQUS, a ring of elements is used to
calculate the SIF, using the J-integral method. Twenty contours were considered to ensure
that the value calculated was stable and consistent.
Figure 6 - The finite element discretisation in the region of the crack
-3
-2
-1
0
1
2
3
-180 -150 -120 -90 -60 -30 0 30 60 90 120 150 180
s/ s
0
/degrees
Shear stresses at r = 0.5m
𝜑 = 0°
𝜑 = 30°
𝜑 = 45°
𝜑 = 60°
𝜑 = 90°
𝜑1 = 30° 𝜑 = 45° 𝜑2 = 55°

Page 13 of 31
Using this method, the stress intensity factors for three particular crystallographic orientations
(φ=0°, 60°, 90°) have been calculated and compared with that of a single crystal isotropic
elastic plate (which agrees with the Brown and Srawley solution [29]) over various crack
length to plate width aspect ratios (a/b). Results are shown in Fig. 7, and no variation is
apparent for the differing aspect ratios.
Figure 7 - Variations of the stress intensity factor KI versus crack length/plate width (a/b).
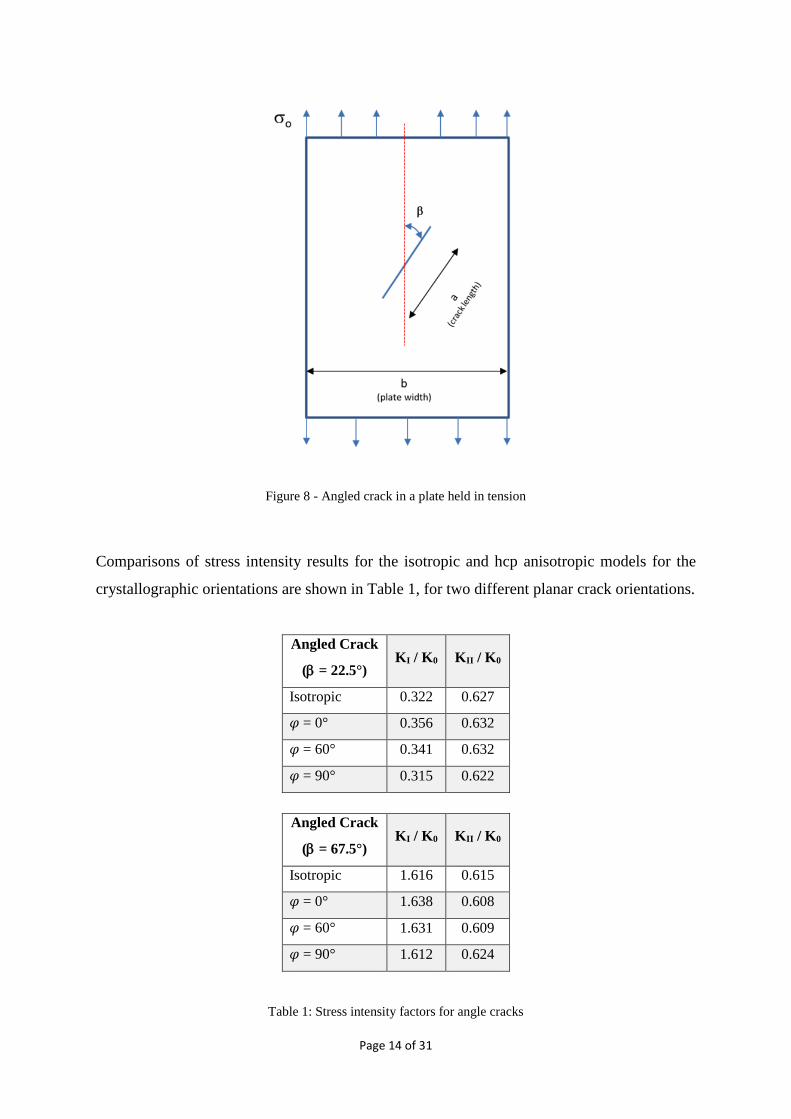
The second case is that of an angled central crack, shown in Fig. 8, in which the crack is
orientated at an angle β to the applied tensile stress direction. The angled crack is defined
such that the Mode I crack opening is orientated perpendicularly to the crack, and the Mode
II sliding is parallel to the crack.
Page 14 of 31
Figure 8 - Angled crack in a plate held in tension
Comparisons of stress intensity results for the isotropic and hcp anisotropic models for the
crystallographic orientations are shown in Table 1, for two different planar crack orientations.
Angled Crack
( = 22.5°) KI / K0 KII / K0
Isotropic 0.322 0.627
𝜑 = 0° 0.356 0.632
𝜑 = 60° 0.341 0.632
𝜑 = 90° 0.315 0.622
Angled Crack
( = 67.5°) KI / K0 KII / K0
Isotropic 1.616 0.615
𝜑 = 0° 1.638 0.608
𝜑 = 60° 1.631 0.609
𝜑 = 90° 1.612 0.624
Table 1: Stress intensity factors for angle cracks

Page 15 of 31
As with the edge crack model, the computational results confirm that the stress intensity
factor is indeed independent of the crystallographic orientation, first demonstrated
theoretically by Sih et al [19]. In both case, horizontal and angled crack, the results presented
are normalized as:
�̃�𝑖 =
𝐾𝑖
𝜎0√𝜋𝑎=
𝐾𝑖
𝐾0,
17
where i = I, II indicates intensity mode, σ0 is the remote applied stress and a the crack length
for an edge crack or half crack length for a centre crack.
Hence, in the context of edge- and centre-cracked elastically anisotropic hcp single crystal,
the stress intensity is independent of crystallography. However, it is anticipated that for a
facet crack contained within the bulk of a polycrystal, and terminating within a single grain,
that the surrounding grains and their crystallographic orientations likely play a role in the
stresses local to the crack tip and in the stress intensity. This is investigated in §2.3 with a
finite element bi-crystal model shown schematically in Fig. 9.
Page 16 of 31
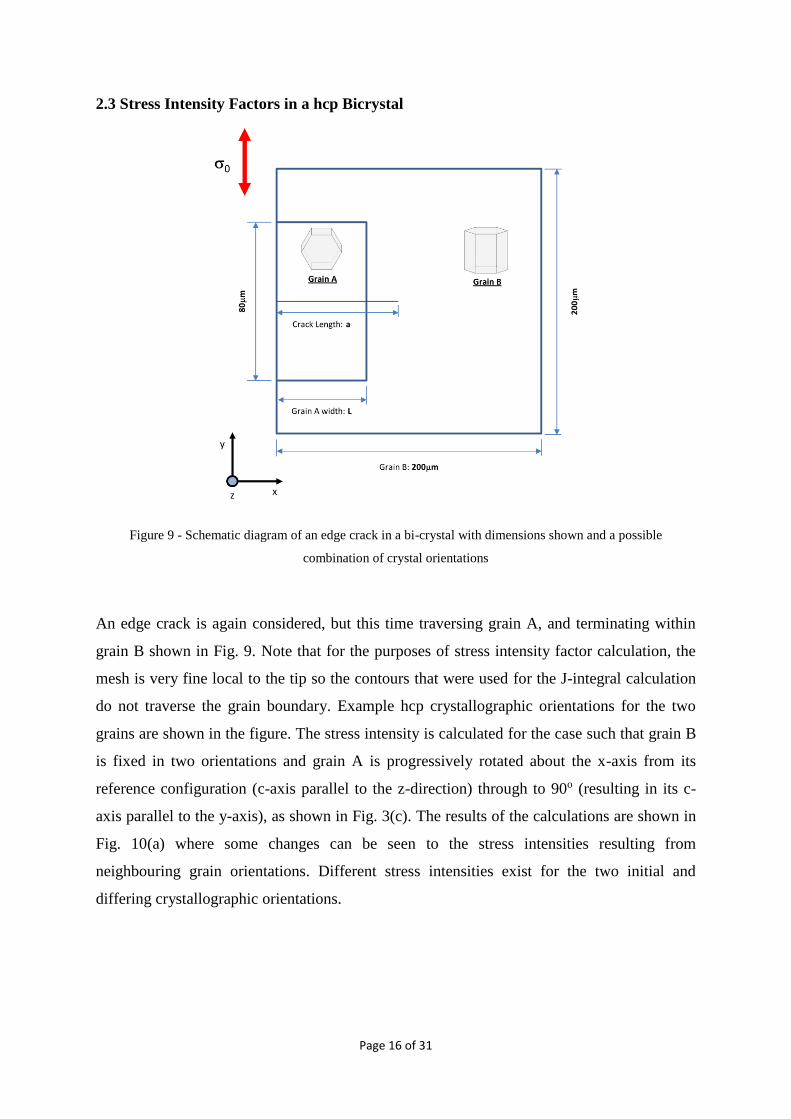
2.3 Stress Intensity Factors in a hcp Bicrystal
Figure 9 - Schematic diagram of an edge crack in a bi-crystal with dimensions shown and a possible
combination of crystal orientations
An edge crack is again considered, but this time traversing grain A, and terminating within
grain B shown in Fig. 9. Note that for the purposes of stress intensity factor calculation, the
mesh is very fine local to the tip so the contours that were used for the J-integral calculation
do not traverse the grain boundary. Example hcp crystallographic orientations for the two
grains are shown in the figure. The stress intensity is calculated for the case such that grain B
is fixed in two orientations and grain A is progressively rotated about the x-axis from its
reference configuration (c-axis parallel to the z-direction) through to 90o (resulting in its c-
axis parallel to the y-axis), as shown in Fig. 3(c). The results of the calculations are shown in
Fig. 10(a) where some changes can be seen to the stress intensities resulting from
neighbouring grain orientations. Different stress intensities exist for the two initial and
differing crystallographic orientations.

Page 17 of 31
Figure 10 - Effect of the crystallographic orientation on the stress intensity factor for bi-crystal model for (a) the
crystallographic orientation of grain A with 8 µm width while grain B has fixed orientation, and (b) the width of
grain A when both grains have fixed orientations
The size of grain A relative to B (Fig. 9) is investigated next for two differing
crystallographic orientation combinations. The resulting stress intensities are shown in Fig.
10(b). The variations are more substantial here showing the strong dependence of stress
intensity on local features of grain morphology. This is potentially important in the context
of facet fatigue crack growth (and to a lesser extent nucleation) in Ti alloys. Indeed, Kirane
and Ghosh [21] presented a stress-based criterion for facet nucleation which is mixed-mode
in nature, reflecting the contributions of both mode I and II, but these stresses and the
corresponding stress intensities (for microstructurally short crack growth) are needed at the
microstructural level (e.g. within a specific grain). Hence, the analyses above showing the
dependency of the stress intensities on local microstructural features such as grain
morphology and crystallographic orientation confirm that accurate stresses and corresponding
intensities can only be obtained by taking due account of key local microstructural features.
Facet fatigue nucleation is known to be a progressive process taking place over a number of
cycles as the crack which has nucleated at a hard grain – soft grain interface propagates
through the hard-orientated grain. Hence, the driving stress intensity is likely to be mixed
mode and dependent on the local morphology and crystallographic orientations, as shown
above.
So far, the analyses carried out have allowed for anisotropic elastic behaviour. We next wish
to investigate the crack tip stresses, and the effects of crystallographic orientation, when

Page 18 of 31
crystallographic slip also is allowed to develop at the crack tip, and for this reason, a brief
overview of the crystal plasticity model adopted is given in the next section.
3.0 Crystal Plasticity Model
Full details of the crystal plasticity model incorporating strain-gradient plasticity can be
found in Dunne et al [10]. The crystal plasticity framework used in this study is based on the
multiplicative kinematic decomposition of the deformation gradient into elastic (𝑭𝑒) and
plastic (𝑭𝑃) tensors such that
𝑭 =
𝜕𝒙
𝜕𝑿= 𝑭𝒆𝑭𝒑
18
Assuming crystallographic slip accounts for deformation, and for now considering just single
slip,
𝑭𝒑 = 𝑰 + 𝛾(𝒔𝒏) 19
in which s and n are slip direction and plane normal respectively, and is the magnitude of
the slip. Since the material properties at a point are time dependent, it is convenient to write
the plastic deformation gradient in rate form as
�̇�𝒑 = �̇�(𝒔𝒏) 20
For a spatially varying velocity field, the velocity gradient is defined and decomposed into
the symmetric and anti-symmetric parts as
𝑳 = �̇�(𝑭 )−1 = 𝑠𝑦𝑚(𝑳) + 𝑎𝑠𝑦𝑚(𝑳) 21
The plastic part of the velocity gradient takes the form
𝑳𝒑 = ∑�̇�𝑖𝒔𝑖 𝒏𝑖
𝑛
𝑖=1
22
which consists of contributions from all active slip systems, with normal vectors ni and slip
direction vectors si corresponding to the ith slip system, and is computed according to a
defined slip rule. The flow rule used to describe the slip rate on a slip system is given by
�̇�𝑖 = 𝜌𝑠
𝑚𝑏𝑖2𝜈𝑒𝑥𝑝 (−∆𝐹
𝑘𝑇) sinh (
(𝜏𝑖 − 𝜏𝑐𝑖)𝛾0∆𝑉𝑖
𝑘𝑇)
23
with
∆𝑉𝑖 = 𝑙𝑏𝑖2 where 𝑙 =
1
√𝜓𝜌𝑠𝑠
24
Page 19 of 31
in which 𝜌𝑠𝑚 and 𝜌𝑠
𝑠 are the mobile and sessile statistically-stored dislocation (SSD) densities,
bi the Burger’s vector magnitude for slip system i, 𝜈 the frequency of attempts (successful or
otherwise) by dislocations to jump the energy barrier, ΔF the Helmholtz free energy, k the
Boltzman constant, T the temperature in Kelvin (K), τi the resolved shear stress, 𝜏𝑐𝑖 the critical
resolved shear stress, γ0 the shear strain that is work conjugate to the resolved shear stress, ΔV
the activation volume, l the pinning distance, and ψ is a coefficient that indicates that not all
statistically stored dislocations (SSDs) necessarily act as pinning points. Note that each slip
system becomes active when the resolved shear stress is equal or greater than the critical
resolved shear stress (τi ≥ 𝜏𝑐𝑖 ). Further detail of the subsequent implicit integration of the
constitutive equations and the determination of the consistent elastic-plastic tangent stiffness
can be found in Dunne et al [10]. The crystal model is implemented within an ABAQUS
user-defined subroutine (UMAT) which facilitates finite element modelling of single and bi-
crystals in this study. The material properties used for the slip rule in the crystal plasticity
model are given in Appendix B where the <a> and <c+a> type systems are differentiated (a
c/a ratio of 1.593 is used), and the slip systems for an hcp single crystal are shown in Fig.
3(d). The critical resolved shear stresses for a representative near-alpha titanium alloy were
taken from the experimental results of Gong and Wilkinson [31] and nominal strain γ0 has
been fixed for simplicity. Burger’s vector magnitudes, frequency of dislocation jumps, and
initial density of SSDs are obtained from standard property data and included in Appendix B.
In some of the plasticity analyses carried out (which is made explicitly clear in the text),
Mises perfect plasticity is assumed, and in this case a yield stress of 462 MPa is employed
which corresponds to the critical resolved shear stress for single-crystal a-type slip.
3.1 Edge Crack Crystallographic Slip and its Crystal Orientation Dependence
We return to the edge crack problem in a homogeneous single crystal schematically shown in
Fig. 6 but now allow for the development of plasticity in two ways. Firstly, the crystal
plasticity model described above is employed which takes full account of the anisotropy of
slip in hcp crystals and secondly, by employing standard isotropic Mises plasticity (while in
both cases retaining the effects of elastic anisotropy). To begin, the x-direction stresses are
determined using both approaches, and in the case of the crystal model, the hcp grain is
orientated at φ=45°; that is, with its c-axis at 45o to the x-direction shown in Fig. 3(d). The
results are shown in Fig. 11 in which near-identical stresses are developed.

Page 20 of 31
Figure 11 - Comparison of normalized 𝜎𝑥𝑥 stresses obtained from crystal and Mises plasticity models along the
x-direction from the crack tip.
The behaviour is explored further in Fig. 12 in which field variations of the y-direction
stresses are shown for purely (anisotropic) elasticity, for crystal plasticity and for Mises
plasticity, for the four crystallographic orientations (φ=0°, 45°, 60°, 90°) shown in the figure.
The first (and expected) clear feature is the elimination of the highly localised stress
concentration by incorporation of plasticity. The second is that the incorporation of
anisotropic hcp crystal slip (as opposed to Mises plasticity) has limited effect on the resulting
crack tip stress distributions, even as the crystallographic orientation is varied. Note that the
width of the contour plots in Fig. 12 is 0.21 µm, so showing very local stresses.
0
5
10
15
20
25
30
35
40
0 0.02 0.04 0.06 0.08 0.1
No
rmal
ise
d s
tre
ss -
(sxx
/ s
0)
Normalised length from crack front (r / a)
Continuum model
Crystal model

Page 21 of 31
Figure 12 - Field variations of the direct stress component 𝜎𝑦𝑦 around the crack tip for the single crystal model
In order to provide more detailed and quantitative assessments of the stresses determined
using Mises elasto-plastic versus crystal plasticity, the normalized stress components
(𝜎𝑥𝑥/𝜎0) and (𝜎𝑦𝑦/𝜎0) along the x-direction from the crack tip are extracted and shown for
the crystallographic orientations (φ=0°, 45°, 60°, 90°) in Fig. 13 (a-b).

Page 22 of 31
Figure 13 - Comparison between Mises and crystal plasticity models along the x-direction from the crack tip for
the normalized stress components of (a) 𝜎𝑥𝑥 and (b) 𝜎𝑦𝑦

Page 23 of 31
Some differences in the stresses arise between the two models very close to the crack tip, but
largely they are near-identical remote from the crack tip in the elastic zone. The small
differences in the plastic region result from the hcp crystal anisotropy for which the differing
strengths of the <a>-type and <c+a>-type slip are accounted. However, much more
significant differences are anticipated in the plastic fields, and these are assessed next.
Fig. 14 shows the accumulated plastic strains calculated using the crystal and Mises plasticity
models respectively for the crystallographic orientations (φ=0°, 45°, 60°, 90°) shown. Here,
quite different distributions of plastic strain are observed resulting from the incorporation of
crystal slip, and a strong dependence on crystal orientation exists which naturally the Mises
model fails to capture. The crystal plasticity result for the particular asymmetric crystal
orientation (φ= 60°) shows the development of a correspondingly asymmetric plastic strain
field. It is also interesting to note the very different plastic fields developed for the two
extreme crystal orientations of φ=0° and 90°. For the former, the slip is accommodated by a-
type prismatic systems whereas in the latter, because of orientation, the slip occurs on the
pyramidal slip systems with a significantly higher strength than that for the prismatics. As a
result, the slip is much more localised and largely constrained to occur in a vertical band.
Figure 14 - Accumulated plastic strains obtained from the Mises and crystal plasticity models for the single
crystal crystallographic orientations shown (0.1m width plots).
Also, the highest values of the plastic strains are obtained for the reference crystal orientation
(φ=0°) in which the grain is well-orientated for a-type slip. The magnitude of the
accumulated plastic strain reduces with crystal orientation about the x-axis and takes the
minimum value at φ=90°. In fact, the Mises plasticity results show a somewhat similar trend
in plastic strain magnitude, but nothing like to the same extent. This follows from the effect

Page 24 of 31
of the elastic anisotropy influencing stress state at the crack tip as a result of the crystal
orientation.
Figure 15 - Comparison of accumulated plastic strains along the x-direction from the crack front for the single
crystal crystallographic orientations shown using the crystal plasticity model.
Fig. 15 shows the comparison of the effective plastic strains developed along the x-direction
for the crystal orientations shown from the crystal plasticity model. Again it can be seen that
the largest and smallest plastic strains at the crack front develop for the crystallographic
orientations φ=0° and 90° respectively. While for these two cases, the accumulated plastic
strains decay in a short distance from the crack front, the plastic strain field for φ=45° persists
considerably further resulting from the favourable crystal orientation facilitating prismatic
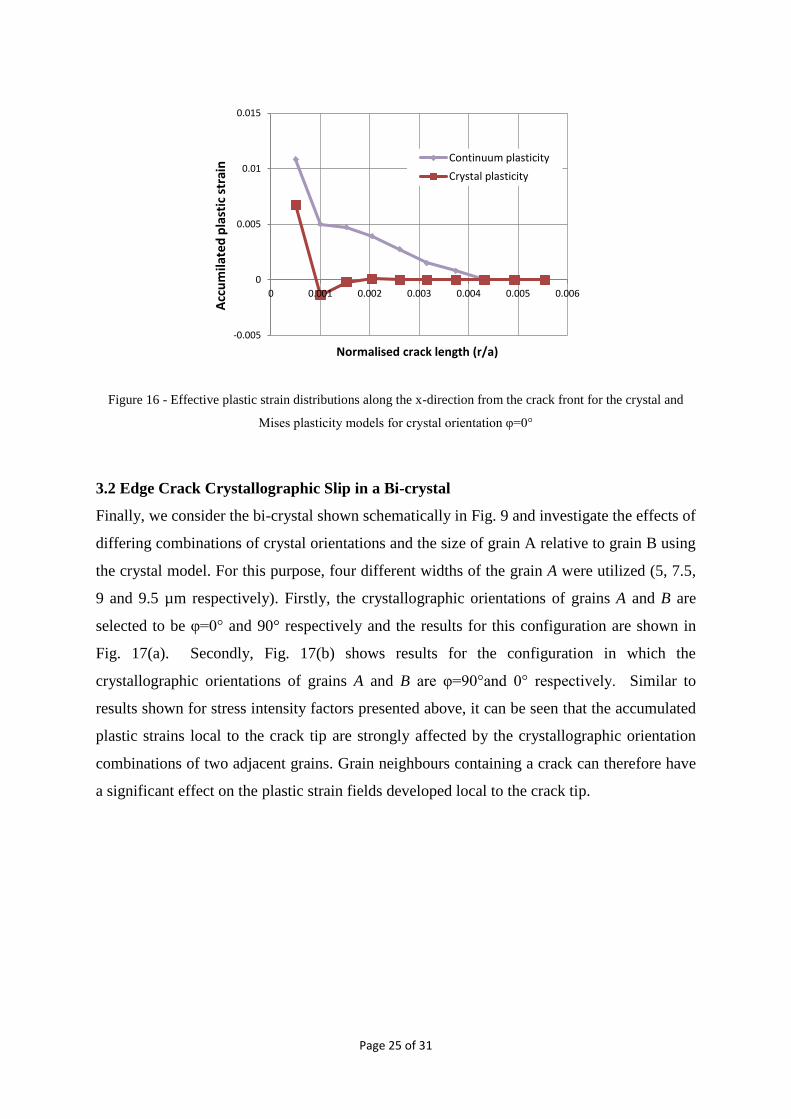
and basal slip. A comparison of the effective plastic strain distributions along the x-direction
from the crack front resulting from crystal and Mises plasticity for the case of the reference
crystal orientation (φ=0°) is shown in Fig. 16. Both models lead to similar trends of plastic
strain but the crystal model demonstrates more localisation and the Mises model
overestimates both the magnitude and extent of plasticity at the crack tip.
-0.005
0
0.005
0.01
0.015
0 0.001 0.002 0.003 0.004 0.005 0.006Effe
ctiv
e p
last
ic s
trai
n
Normalised crack length (r/a)
𝜑 = 0°
𝜑 = 45°
𝜑 = 60°
𝜑 = 90°
Page 25 of 31
Figure 16 - Effective plastic strain distributions along the x-direction from the crack front for the crystal and
Mises plasticity models for crystal orientation φ=0°
3.2 Edge Crack Crystallographic Slip in a Bi-crystal
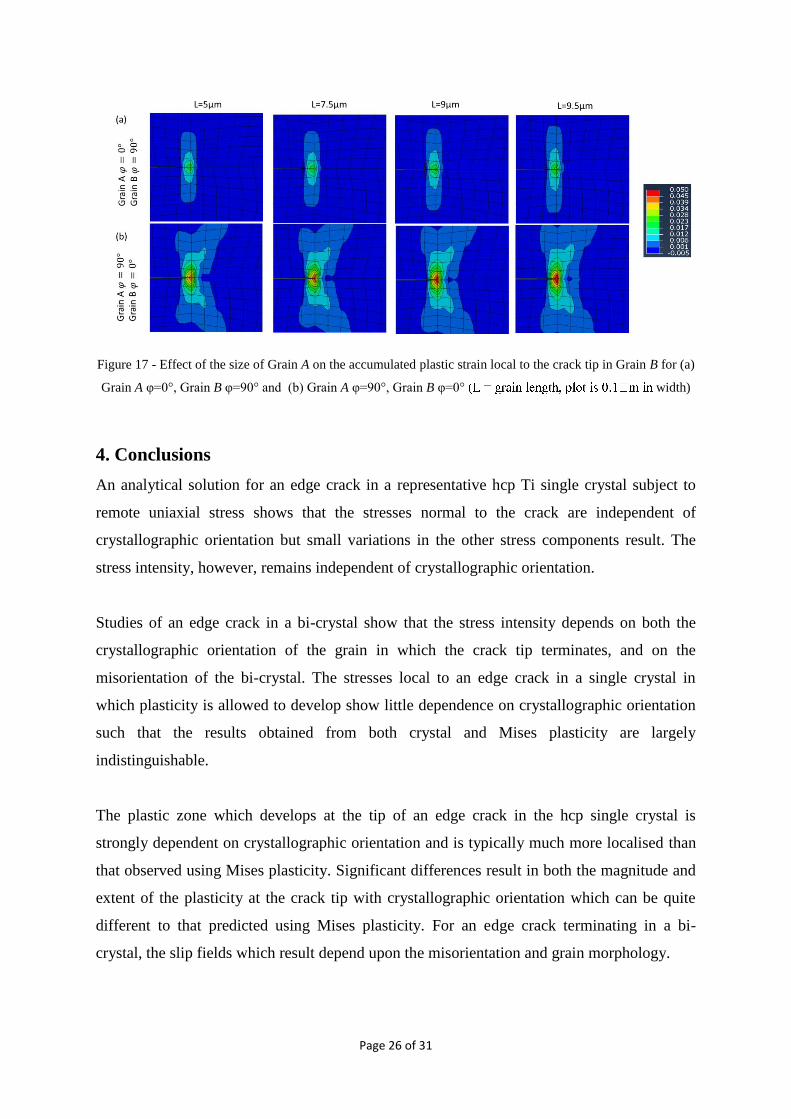
Finally, we consider the bi-crystal shown schematically in Fig. 9 and investigate the effects of
differing combinations of crystal orientations and the size of grain A relative to grain B using
the crystal model. For this purpose, four different widths of the grain A were utilized (5, 7.5,
9 and 9.5 µm respectively). Firstly, the crystallographic orientations of grains A and B are
selected to be φ=0° and 90° respectively and the results for this configuration are shown in
Fig. 17(a). Secondly, Fig. 17(b) shows results for the configuration in which the
crystallographic orientations of grains A and B are φ=90°and 0° respectively. Similar to
results shown for stress intensity factors presented above, it can be seen that the accumulated
plastic strains local to the crack tip are strongly affected by the crystallographic orientation
combinations of two adjacent grains. Grain neighbours containing a crack can therefore have
a significant effect on the plastic strain fields developed local to the crack tip.
-0.005
0
0.005
0.01
0.015
0 0.001 0.002 0.003 0.004 0.005 0.006
Acc
um
ilat
ed
pla
stic
str
ain
Normalised crack length (r/a)
Continuum plasticity
Crystal plasticity
Page 26 of 31
Figure 17 - Effect of the size of Grain A on the accumulated plastic strain local to the crack tip in Grain B for (a)
Grain A φ=0°, Grain B φ=90° and (b) Grain A φ=90°, Grain B φ=0° width)
4. Conclusions
An analytical solution for an edge crack in a representative hcp Ti single crystal subject to
remote uniaxial stress shows that the stresses normal to the crack are independent of
crystallographic orientation but small variations in the other stress components result. The
stress intensity, however, remains independent of crystallographic orientation.
Studies of an edge crack in a bi-crystal show that the stress intensity depends on both the
crystallographic orientation of the grain in which the crack tip terminates, and on the
misorientation of the bi-crystal. The stresses local to an edge crack in a single crystal in
which plasticity is allowed to develop show little dependence on crystallographic orientation
such that the results obtained from both crystal and Mises plasticity are largely
indistinguishable.
The plastic zone which develops at the tip of an edge crack in the hcp single crystal is
strongly dependent on crystallographic orientation and is typically much more localised than
that observed using Mises plasticity. Significant differences result in both the magnitude and
extent of the plasticity at the crack tip with crystallographic orientation which can be quite
different to that predicted using Mises plasticity. For an edge crack terminating in a bi-
crystal, the slip fields which result depend upon the misorientation and grain morphology.

Page 27 of 31
5. Acknowledgements
We are grateful to the Engineering and Physical Sciences Research Council (EP/G004676/1),
and Rolls-Royce plc for financial support.
6. References
[1] M. Bache, ‘A review of dwell sensitive fatigue in titanium alloys: the role of
microstructure, texture and operating conditions’, International Journal of Fatigue, vol. 25
(9–11), pp. 1079–1087, 2003.
[2] G. Lütjering and J. J. C. Williams, Titanium : Springer, 2007.
[3] R. R. Boyer, ‘An overview on the use of titanium in the aerospace industry’, Materials
Science and Engineering: A, vol. 213 (1–2), pp. 103–114, 1996.
[4] S. Ghosh, M. Mills, S. Rokhlin, V. Sinha, W. O. Soboyejo, and J. C. Williams, ‘The
evaluation of cold dwell fatigue in Ti-6242’, U.S. Dept. of Transportation / Federal
Aviation Authority report, DOT/FAA/AR-06/24, 2007.
[5] M. Bache, M. Cope, H. Davies, W. Evans, and G. Harrison, ‘Dwell sensitive fatigue in a
near alpha titanium alloy at ambient temperature’, International Journal of Fatigue, vol.
19 (93), pp. 83–88, 1997.
[6] D. Rugg, M. Dixon, and F. P. Dunne, ‘Effective structural unit size in titanium alloys’,
The Journal of Strain Analysis for Engineering Design, vol. 42 (4), pp. 269–279, 2007.
[7] V. Hasija, S. Ghosh, M. J. Mills, and D. S. Joseph, ‘Deformation and creep modeling in
polycrystalline Ti–6Al alloys’, Acta Materialia, vol. 51 (15), pp. 4533–4549, 2003.
[8] V. Sinha, M. J. Mills, and J. C. Williams, ‘Understanding the contributions of normal-
fatigue and static loading to the dwell fatigue in a near-alpha titanium alloy’,
Metallurgical and Materials Transactions A, vol. 35 (10), pp. 3141–3148, 2004.
[9] G. Venkataramani, D. Deka, S. Ghosh, and J. B. Nordholt, ‘Crystal plasticity based FE
model for understanding microstructural effects on creep and dwell fatigue in Ti-6242’,
ASME Journal of Engineering Materials and Technology, vol. 128 (3), pp. 356-365,
2006.
[10] F. P. E. Dunne, D. Rugg, and A. Walker, ‘Lengthscale-dependent, elastically
anisotropic, physically-based hcp crystal plasticity: Application to cold-dwell fatigue in
Ti alloys’, International Journal of Plasticity, vol. 23 (6), pp. 1061–1083, 2007.

Page 28 of 31
[11] D. L. Davidson and D. Eylon, ‘Titanium alloy fatigue fracture facet investigation by
selected area electron channeling’, Metallurgical Transactions A, vol. 11 (5), pp. 837–
843, 1980.
[12] W. J. Evans and M. R. Bache, ‘Dwell-sensitive fatigue under biaxial loads in the near-
alpha titanium alloy IMI685’, International Journal of Fatigue, vol. 16 (7), pp. 443–452,
1994.
[13] V. Sinha, J. E. Spowart, M. J. Mills, and J. C. Williams, ‘Observations on the faceted
initiation site in the dwell-fatigue tested Ti-6242 alloy: Crystallographic orientation and
size effects’, Metallurgical and Materials Transactions A, vol. 37 (5), pp. 1507–1518,
2006.
[14] J. R. Rice, “Tensile crack tip fields in elastic-ideally plastic crystals,” Mech. Mater.,
vol. 6, no. 4, pp. 317–335, Dec. 1987.
[15] J. R. Rice and M. Saeedvafa, “Crack tip singular fields in ductile crystals with taylor
power-law hardening. I: Anti-plane shear,” J. Mech. Phys. Solids, vol. 36, no. 2, pp. 189–
214, 1988.
[16] M. Saeedvafa and J. R. Rice, “Crack tip singular fields in ductile crystals with taylor
power-law hardening: II: Plane strain,” J. Mech. Phys. Solids, vol. 37, no. 6, pp. 673–
691, 1989.
[17] J. R. Rice, D. E. Hawk, and R. J. Asaro, “Crack tip fields in ductile crystals,” in Non-
Linear Fracture, W. G. Knauss and A. J. Rosakis, Eds. Springer Netherlands, 1990, pp.
301–321.
[18] V. Gupta, “Tensile crack-tip fields in elastic-ideally plastic hexagonal crystals and
layered materials,” Acta Met. Mater., vol. 41, no. 11, pp. 3223–3236, Nov. 1993.
[19] A. M. Cuitiño and M. Ortiz, “Three-dimensional crack-tip fields in four-point-
bending copper single-crystal specimens,” J. Mech. Phys. Solids, vol. 44, no. 6, pp. 863–
904, Jun. 1996.
[20] Stroh, AN, ‘The formation of cracks as a result of plastic flow’, Proceedings of Royal
Society A, vol. 223, pp. 404-414, 1954.
[21] K. Kirane and S. Ghosh, ‘A cold dwell fatigue crack nucleation criterion for
olycrystalline Ti-6242 using grain-level crystal plasticity FE model’, International
Journal of Fatigue, vol. 30, pp. 2127-2139, 2008.
[22] F.P.E. Dunne and D. Rugg, ‘On the mechanisms of fatigue facet nucleation in
titanium alloys’, Fatigue & Fracture of Engineering Materials & Structures, vol. 31, pp.
949-958, 2008.

Page 29 of 31
[23] S.G. Lekhnitskii, Theory of Elasticity of an Anisotropic Body, First English
Language. Mir, 1981.
[24] H. Liebowitz, Fracture, an advanced treatise. Academic Press, 1968.
[25] G.C. Sih, P.C. Paris, and G.R. Irwin, ‘On cracks in rectilinearly anisotropic bodies’,
International Journal Fracture, vol. 1 (3), pp. 189–203, 1965.
[26] D.E. Lempidaki, N.P. O’Dowd, and E.P. Busso, ‘Crack Tip Stress Fields for
Anisotropic Materials with Cubic Symmetry’, 15th European Conference of Fracture,
Stockholm, Sweden, 2004.
[27] H. J. Bunge, Texture analysis in materials science: mathematical methods.
Butterworths, 1982.
[28] G. Bao, S. Ho, Z. Suo, and B. Fan, “The role of material orthotropy in fracture
specimens for composites,” Int. J. Solids Struct., vol. 29, no. 9, pp. 1105–1116, 1992.
[29] W. F. Brown and J. E. Srawley, ‘Plane Strain Crack Toughness Testing of High
Strength Metallic Materials’. American Society for Testing and Materials, 1966.
[30] J.R. Rice, ‘A path independent integral and the approximate analysis of strain
concentration by notches and cracks’, Journal of Applied Mechanics, vol. 35, pp. 379-
386, 1968.
[31] J. Gong and A.J. Wilkinson, ‘Anisotropy in the plastic flow properties of single-
crystal alpha titanium determined from micro-cantilever beams’, Acta Materialia, vol. 57
(19), pp. 5693-5705, 2009.

Page 30 of 31
APPENDIX A – 3D Rotations
𝑹𝜑1= [
cos𝜑1 sin𝜑1 0−sin𝜑1 cos𝜑1 0
0 0 1] ; 𝑹𝜑 = [
1 0 00 cos𝜑 sin𝜑0 −sin𝜑 cos𝜑
]; 𝑹𝜑2= [
cos𝜑2 sin𝜑2 0−sin𝜑2 cos𝜑2 0
0 0 1]
Combining all three rotations:
𝑹 = 𝑹𝜑1𝑹𝜑𝑹𝜑2
A.1
such that the full rotation matrix is:
𝑹 = [
cos𝜑1 cos𝜑2 − sin𝜑1 sin𝜑2 cos𝜑 sin𝜑1 cos𝜑2 +cos𝜑1 sin𝜑2 cos𝜑 sin𝜑2 sin𝜑−cos𝜑1 sin𝜑2 −sin𝜑1 cos𝜑2 cos𝜑 −sin𝜑1 sin𝜑2 +cos𝜑1 cos𝜑2 cos𝜑 cos𝜑2 sin𝜑
sin𝜑1 sin𝜑 − cos𝜑1 sin𝜑 cos𝜑]
(In future entries from this matrix will be abbreviated as R11, R12 etc.)
And as before define stress rotations as:
𝝈′ = 𝑹 𝝈 𝑹𝑇
Such that:

Page 31 of 31
𝜎′ = [
𝑅11 𝑅12 𝑅13
𝑅21 𝑅22 𝑅23
𝑅31 𝑅32 𝑅33
] [
𝜎𝑥𝑥 𝜎𝑥𝑦 𝜎𝑥𝑧
𝜎𝑦𝑥 𝜎𝑦𝑦 𝜎𝑦𝑧
𝜎𝑧𝑥 𝜎𝑧𝑦 𝜎𝑧𝑧
] [
𝑅11 𝑅21 𝑅31
𝑅12 𝑅22 𝑅32
𝑅13 𝑅23 𝑅33
] A.2
Gathering the rotation terms and converting the stress tensors to vectors:
σ′ = 𝑻 𝜎 A.3
where:
𝑻 =
[
𝑅112 𝑅12
2 𝑅132 2𝑅12𝑅13 2𝑅11𝑅13 2𝑅11𝑅12
𝑅212 𝑅22
2 𝑅232 2𝑅22𝑅23 2𝑅21𝑅23 2𝑅21𝑅22
𝑅312 𝑅32
2 𝑅332 2𝑅32𝑅33 2𝑅31𝑅33 2𝑅31𝑅32
𝑅21𝑅31 𝑅22𝑅32 𝑅23𝑅33 𝑅23𝑅32 + 𝑅22𝑅33 𝑅23𝑅31 + 𝑅21𝑅33 𝑅22𝑅31 + 𝑅21𝑅32
𝑅11𝑅31 𝑅12𝑅32 𝑅13𝑅33 𝑅13𝑅32 + 𝑅12𝑅33 𝑅13𝑅31 + 𝑅11𝑅33 𝑅12𝑅31 + 𝑅11𝑅32
𝑅11𝑅21 𝑅12𝑅22 𝑅13𝑅23 𝑅13𝑅22 + 𝑅12𝑅23 𝑅13𝑅21 + 𝑅11𝑅23 𝑅12𝑅21 + 𝑅11𝑅22]
[𝑺]3𝐷 𝑅𝑜𝑡 = [𝑻]𝑇[𝑺][𝑻] A.4
This is the matrix used to calculate the rotated compliance matrix, its derivation may be found in
standard mechanics texts.
APPENDIX B – Material Properties
Elastic stiffness matrix
𝐶 =
(
162530 92000 70000 0 0 092000 162530 70000 0 0 070000 70000 181660 0 0 0
0 0 0 35270 0 00 0 0 0 46700 00 0 0 0 0 46700)
MPa
Slip rule material properties
𝜏𝑐
(MPa) b (µm) k (JK-1) ΔF (J)
v
(s-1)
𝜌𝑠𝑚 = 𝜌𝑠
𝑠
(µm-2`) γ0 𝜓
<a> slip
<c+a> slip
200
500
3.2x10⁻⁴
5.1x10⁻⁴ 1.38x10⁻²³ 3.456x10⁻²⁰ 1011 0.05 8.33x10⁻⁶ 1.5x10⁻⁴