EFFECTS OF COAL-MINE DISCHARGES ON THE … · effects of coal-mine discharges on the quality of the...
103
EFFECTS OF COAL-MINE DISCHARGES ON THE QUALITY OF THE STONYCREEK RIVER AND ITS TRIBUTARIES, SOMERSET AND CAMBRIA COUNTIES, PENNSYLVANIA U.S. GEOLOGICAL SURVEY Water-Resources Investigations Report 96-4133 prepared in cooperation with the SOMERSET CONSERVATION DISTRICT
Transcript of EFFECTS OF COAL-MINE DISCHARGES ON THE … · effects of coal-mine discharges on the quality of the...
EFFECTS OF COAL-MINE DISCHARGES ON THE QUALITYOF THE STONYCREEK RIVER AND ITS TRIBUTARIES,
SOMERSET AND CAMBRIA COUNTIES, PENNSYLVANIA
U.S. GEOLOGICAL SURVEYWater-Resources Investigations Report 96-4133
prepared in cooperation with the
SOMERSET CONSERVATION DISTRICT
EFFECTS OF COAL-MINE DISCHARGES ON THE QUALITYOF THE STONYCREEK RIVER AND ITS TRIBUTARIES,
SOMERSET AND CAMBRIA COUNTIES, PENNSYLVANIA
by Donald R. Williams, James I. Sams III, and Mary E. Mulkerrin
U.S. GEOLOGICAL SURVEYWater-Resources Investigations Report 96-4133
prepared in cooperation with the
SOMERSET CONSERVATION DISTRICT
Lemoyne, Pennsylvania1996

ii
U.S. DEPARTMENT OF THE INTERIOR
BRUCE BABBITT, Secretary
U.S. GEOLOGICAL SURVEY
Gordon P. Eaton, Director
For additional information Copies of this report may bewrite to: purchased from:
District Chief U.S. Geological SurveyU.S. Geological Survey Branch of Information Services840 Market Street Box 25286Lemoyne, Pennsylvania 17043-1586 Denver, Colorado 80225-0286

iii
Abstract. . . . . . . . . . . . . . . . . . . . . . . . . . . . . . . . . . . . . . . . . . . . . . . . . . . . . . . . . . . . . . . . . . . . . . . . . . . . . . . . . . . . 1
Introduction . . . . . . . . . . . . . . . . . . . . . . . . . . . . . . . . . . . . . . . . . . . . . . . . . . . . . . . . . . . . . . . . . . . . . . . . . . . . . . . . 2
Purpose and scope. . . . . . . . . . . . . . . . . . . . . . . . . . . . . . . . . . . . . . . . . . . . . . . . . . . . . . . . . . . . . . . . . . . . . 2Description of study area . . . . . . . . . . . . . . . . . . . . . . . . . . . . . . . . . . . . . . . . . . . . . . . . . . . . . . . . . . . . . . . 3Methods of study. . . . . . . . . . . . . . . . . . . . . . . . . . . . . . . . . . . . . . . . . . . . . . . . . . . . . . . . . . . . . . . . . . . . . . 7Previous investigations. . . . . . . . . . . . . . . . . . . . . . . . . . . . . . . . . . . . . . . . . . . . . . . . . . . . . . . . . . . . . . . . . 8Acknowledgments. . . . . . . . . . . . . . . . . . . . . . . . . . . . . . . . . . . . . . . . . . . . . . . . . . . . . . . . . . . . . . . . . . . . . 9
Coal-mine discharges . . . . . . . . . . . . . . . . . . . . . . . . . . . . . . . . . . . . . . . . . . . . . . . . . . . . . . . . . . . . . . . . . . . . . . . 10
Locations . . . . . . . . . . . . . . . . . . . . . . . . . . . . . . . . . . . . . . . . . . . . . . . . . . . . . . . . . . . . . . . . . . . . . . . . . . . . 10Water quality and contaminant discharges . . . . . . . . . . . . . . . . . . . . . . . . . . . . . . . . . . . . . . . . . . . . . . . 12Remediation-prioritization index . . . . . . . . . . . . . . . . . . . . . . . . . . . . . . . . . . . . . . . . . . . . . . . . . . . . . . . 18Remediation by passive-treatment systems . . . . . . . . . . . . . . . . . . . . . . . . . . . . . . . . . . . . . . . . . . . . . . 31
Surface-water-quality sampling sites . . . . . . . . . . . . . . . . . . . . . . . . . . . . . . . . . . . . . . . . . . . . . . . . . . . . . . . . . . 33
Locations . . . . . . . . . . . . . . . . . . . . . . . . . . . . . . . . . . . . . . . . . . . . . . . . . . . . . . . . . . . . . . . . . . . . . . . . . . . . 33Water quality and contaminant discharges . . . . . . . . . . . . . . . . . . . . . . . . . . . . . . . . . . . . . . . . . . . . . . . 36
Effects of coal-mine discharge on the quality of Stonycreek River and its tributaries . . . . . . . . . . . . . . . . . 41
Summary . . . . . . . . . . . . . . . . . . . . . . . . . . . . . . . . . . . . . . . . . . . . . . . . . . . . . . . . . . . . . . . . . . . . . . . . . . . . . . . . . 48
References cited . . . . . . . . . . . . . . . . . . . . . . . . . . . . . . . . . . . . . . . . . . . . . . . . . . . . . . . . . . . . . . . . . . . . . . . . . . . . 50
Appendix 1. Geographic information system (GIS) datasets . . . . . . . . . . . . . . . . . . . . . . . . . . . . . . . . . . . 542. Location coordinates and station numbers for sampled mine discharges in the
Stonycreek River Basin . . . . . . . . . . . . . . . . . . . . . . . . . . . . . . . . . . . . . . . . . . . . . . . . . . . . 563. Field data and laboratory analyses of mine discharges . . . . . . . . . . . . . . . . . . . . . . . . . . . . 624. Prioritization index (PI) for all mine discharges. . . . . . . . . . . . . . . . . . . . . . . . . . . . . . . . . . . 785. Field data and laboratory analyses for surface-water sites. . . . . . . . . . . . . . . . . . . . . . . . . . 88
CONTENTS
Page

iv
ILLUSTRATIONS
Page
Figure 1. Map showing the location of the Stonycreek River Basin. . . . . . . . . . . . . . . . . . . . . . . . . . . . 4
2. A generalized stratigraphic column of the geologic formations in the StonycreekRiver Basin . . . . . . . . . . . . . . . . . . . . . . . . . . . . . . . . . . . . . . . . . . . . . . . . . . . . . . . . . . . . . . . 5
3. Geologic map of the Stonycreek River Basin . . . . . . . . . . . . . . . . . . . . . . . . . . . . . . . . . . . . . . 6
4. Map showing locations of coal-mine-discharge sites in the Stonycreek River Basin . . . . 11
5. Graph showing coal-mine discharges that exceeded federal effluent limits for pHand concentrations of total iron and total manganese, and arbitrary indicatorlimits for sulfate and net acidity concentrations. . . . . . . . . . . . . . . . . . . . . . . . . . . . . . . 13
6-11. Maps showing:6. Location of the coal-mine-discharge sites in the Shade Creek Basin . . . . . . . . . . . . 25
7. Location of the coal-mine-discharge sites in the Paint Creek Basin . . . . . . . . . . . . . 26
8. Location of the coal-mine-discharge sites in the Wells Creek Basin . . . . . . . . . . . . . 27
9. Location of the coal-mine-discharge sites in the Quemahoning Creek Basin . . . . . 28
10. Location of the coal-mine-discharge sites in the Oven Run Basin . . . . . . . . . . . . . . 29
11. Location of the coal-mine-discharge sites in the Pokeytown Run Basin . . . . . . . . . 30
12. Diagram showing the layout of the Shade passive-treatment system in theStonycreek River Basin . . . . . . . . . . . . . . . . . . . . . . . . . . . . . . . . . . . . . . . . . . . . . . . . . . . . 32
13. Diagram showing a typical cross-sectional view of a successive alkalinity-producingsystem treatment component . . . . . . . . . . . . . . . . . . . . . . . . . . . . . . . . . . . . . . . . . . . . . . 32
14. Map showing surface-water-quality sampling sites in the Stonycreek River Basin . . . . . 35
Figures 15-21. Graphs showing:15. Specific conductance, pH, and concentrations and discharges of dissolved solids
measured in the mainstem and in tributary streams in the StonycreekRiver Basin on July 27 and 28, 1993. . . . . . . . . . . . . . . . . . . . . . . . . . . . . . . . . . . . . . 37
16. Concentrations and discharges of alkalinity and acidity measured in themainstem and in tributary streams in the Stonycreek River Basin onJuly 27 and 28, 1993 . . . . . . . . . . . . . . . . . . . . . . . . . . . . . . . . . . . . . . . . . . . . . . . . . . . 38
17. Concentrations and discharges of total iron and total manganese measured inthe mainstem and in tributary streams in the Stonycreek River Basin onJuly 27 and 28, 1993 . . . . . . . . . . . . . . . . . . . . . . . . . . . . . . . . . . . . . . . . . . . . . . . . . . . 39
18. Concentrations and discharges of total sulfate measured in the mainstem andin tributary streams in the Stonycreek River Basin on July 27 and 28, 1993 . . . . 40
19. Measured total sulfate discharges in tributary streams and measured and cal-culated total sulfate discharges in the mainstem of the Stonycreek Riveron July 27 and 28, 1993 . . . . . . . . . . . . . . . . . . . . . . . . . . . . . . . . . . . . . . . . . . . . . . . . 42
20. The effects of mine discharges 17 and 22 on Wells Creek on September 9, 1993 . . 45
21. The effects of Oven Run and Pokeytown Run on the Stonycreek River onSeptember 8, 1993. . . . . . . . . . . . . . . . . . . . . . . . . . . . . . . . . . . . . . . . . . . . . . . . . . . . . 47
v
TABLES
Page
Table 1. Federal effluent limitations for coal-mine drainage. . . . . . . . . . . . . . . . . . . . . . . . . . . . . . . . 10
2. Water-quality and quantity changes that occurred downstream of mine-dischargesites 17 and 22 on May 12, 1994. . . . . . . . . . . . . . . . . . . . . . . . . . . . . . . . . . . . . . . . . . . . . 14
3. Mine discharges that met federal effluent standards for pH and concentrations oftotal iron and total manganese . . . . . . . . . . . . . . . . . . . . . . . . . . . . . . . . . . . . . . . . . . . . . 15
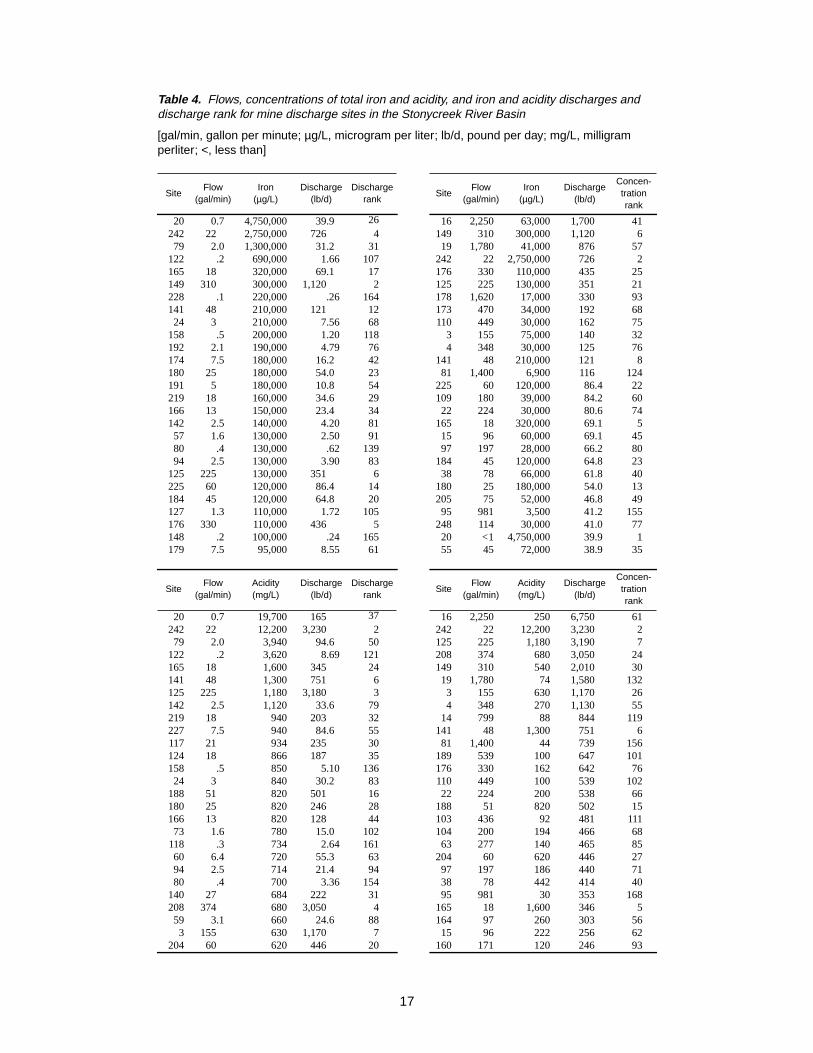
4. Flows, concentrations of total iron and acidity, and iron and acidity discharges anddischarge rank for mine discharge sites in the Stonycreek River Basin . . . . . . . . . . . 17
5. Unsorted total-iron data and sorted, ranked, and scored total-iron data used for thePrioritization Index (PI) calculations . . . . . . . . . . . . . . . . . . . . . . . . . . . . . . . . . . . . . . . . 19
6. Prioritization index (PI) for coal-mine discharges in the Shade Creek Basin. . . . . . . . . . . 21
7. Prioritization index (PI) for coal-mine discharges in the Paint Creek Basin . . . . . . . . . . . 22
8. Prioritization index (PI) for coal-mine discharges in the Wells Creek Basin . . . . . . . . . . . 23
9. Prioritization index (PI) for coal-mine discharges in the Quemahoning Creek Basin . . . 23
10. Prioritization index (PI) for coal-mine discharges in the Oven Run Basin. . . . . . . . . . . . . 24
11. Prioritization index (PI) for coal-mine discharges in the Pokeytown Run Basin . . . . . . . 24
12. Surface-water-quality sampling sites in the Stonycreek River Basin . . . . . . . . . . . . . . . . . 34
13. Water-quality data for five coal-mine discharges and the receiving streams . . . . . . . . . . 43
14. Water-quality data collected on September 8, 1993, for Oven Run, Pokeytown Run,and the Stonycreek River above and below where each of the runs flows intothe river. . . . . . . . . . . . . . . . . . . . . . . . . . . . . . . . . . . . . . . . . . . . . . . . . . . . . . . . . . . . . . . . . 44

vi
CONVERSION FACTORS, VERTICAL DATUM, AND ABBREVIATED WATER-QUALITY UNITS
Multiply By To obtain
Length
inch (in.) 25.4 millimeterfoot (ft) 0.3048 metermile (mi) 1.609 kilometerfoot per mile (ft/mi) 0.1894 meter per kilometer
Area
square mile (mi2) 2.590 square kimometer
Volume
gallon per minute (gal/min) 0.06309 liter per secondcubic foot per second (ft3/s) 0.02832 cubic meter per second
Mass
pound (lb) 454 gramston 0.9072 megagrams
Temperature
degree Fahrenheit (°F) °C=5/9 (°F-32) degree Celsius
Sea level: In this report, “sea level” refers to the National Geodetic Vertical Datum of 1929—a geodeticdatum derived from a general adjustment of the first-order level nets of the United States and Canada,formerly called Sea Level Datum of 1929.
Abbreviated water-quality units used in report:
micrograms per liter (µg/L) milligrams per liter (mg/L)

1
EFFECTS OF COAL-MINE DISCHARGES ON THE QUALITYOF THE STONYCREEK RIVER AND ITS TRIBUTARIES,
SOMERSET AND CAMBRIA COUNTIES, PENNSYLVANIA
By Donald R. Williams, James I. Sams III, and Mary E. Mulkerrin
ABSTRACT
This report describes the results of a study by the U.S. Geological Survey, done in cooperation withthe Somerset Conservation District, to locate and sample abandoned coal-mine discharges in theStonycreek River Basin, to prioritize the mine discharges for remediation, and to determine the effects of themine discharges on water quality of the Stonycreek River and its major tributaries. From October 1991through November 1994, 270 abandoned coal-mine discharges were located and sampled. Discharges from193 mines exceeded U.S. Environmental Protection Agency effluent standards for pH, discharges from122 mines exceeded effluent standards for total-iron concentration, and discharges from 141 minesexceeded effluent standards for total-manganese concentration. Discharges from 94 mines exceededeffluent standards for all three constituents. Only 40 mine discharges met effluent standards for pH andconcentrations of total iron and total manganese.
A prioritization index (PI) was developed to rank the mine discharges with respect to their loadingcapacity on the receiving stream. The PI lists the most severe mine discharges in a descending order for theStonycreek River Basin and for subbasins that include the Shade Creek, Paint Creek, Wells Creek,Quemahoning Creek, Oven Run, and Pokeytown Run Basins.
Passive-treatment systems that include aerobic wetlands, compost wetlands, and anoxic limestonedrains (ALD’s) are planned to remediate the abandoned mine discharges. The successive alkalinity-producing-system treatment combines ALD technology with the sulfate reduction mechanism of thecompost wetland to effectively remediate mine discharge. The water quality and flow of each minedischarge will determine which treatment system or combination of treatment systems would be necessaryfor remediation.
A network of 37 surface-water sampling sites was established to determine stream-water qualityduring base flow. A series of illustrations show how water quality in the mainstem deterioratesdownstream because of inflows from tributaries affected by acidic mine discharges. From the upstreammainstem site (site 801) to the outflow mainstem site (site 805), pH decreased from 6.8 to 4.2, alkalinity wascompletely depleted by inflow acidities, and total-iron discharges increased from 30 to 684 pounds per day.Total-manganese and total-sulfate discharges increased because neither constituent precipitates readily.Also, discharges of manganese and sulfate entering the mainstem from tributary streams have a cumulativeeffect.
Oven Run and Pokeytown Run are two small tributary streams significantly affected by acidic minedrainage (AMD) that flow into the Stonycreek River near the town of Hooversville. The Pokeytown Runinflow is about 0.5 mile downstream from the Oven Run inflow. These two streams are the first majorsource of AMD flowing into the Stonycreek River. Data collected on the Stonycreek River above the OvenRun inflow and below the Pokeytown Run inflow show a decrease in pH from 7.6 to 5.1, a decrease inalkalinity concentration from 42 to 2 milligrams per liter, an increase in total sulfate discharge from 18 to41 tons per day, and an increase in total iron discharge from 29 to 1,770 pounds per day. Data collected atthree mainstem sites on the Stonycreek River below Oven Run and Pokeytown Run show a progressivedeterioration in river water quality from AMD.
Shade Creek and Paint Creek are other tributary streams to the Stonycreek River that have asignificant negative effect on water quality of the Stonycreek River. One third the abandoned-minedischarges sampled were in the Shade Creek and Paint Creek Basins.
2
INTRODUCTION
Coal is Pennsylvania’s most important mineral resource. In 1993, coal production in Pennsylvaniawas more than 63 million tons and Somerset and Cambria Counties ranked second (5.6 million tons) andfifth (4.6 million tons), respectively, in the state for total coal produced (Pennsylvania Coal Association,1994). Much of the Stonycreek River Basin, which is primarily in Somerset County and part in CambriaCounty, is underlain by low-volatile bituminous coal deposits that are an important economic mineralresource. With the onset of the Industrial Revolution in the late 1800’s, extensive commercial mining ofthese coal resources began with almost no concern for the protection of the land surface and waterresources. Consequently, the water quality in the Stonycreek River and its tributaries has been severelydegraded for many decades by acid mine drainage (AMD) from abandoned coal mines and coal-refusepiles. The AMD problem has been recognized as one of the most serious and persistent water-qualityproblems not only in Pennsylvania, but in all of Appalachia, extending from New York to Alabama(Biesecker and George, 1966). Thousands of stream and river miles in Appalachia are currently affected bythe input of mine drainage from sites mined and abandoned before strict effluent regulations wereimplemented (Kleinmann and others, 1988).
Part of the Stonycreek River Basin received an AMD evaluation in the early 1970’s in the OperationScarlift studies (Carson Engineers, 1974). The evaluation indicated the cleanup cost (based on conventionaltreatment technologies) in that part of the basin would amount to several hundred million dollars, andannual operating costs also would be in the millions of dollars. However, new passive-treatmenttechnologies pioneered by the U.S. Bureau of Mines in the late 1970’s and first applied by the miningindustry in the 1980’s, offer effective, low-cost, low-maintenance remediation.
The Stonycreek-Conemaugh River Improvement Project (SCRIP) association is a coalition of grass-roots groups and local resource agencies seeking to restore water quality in the Upper Conemaugh RiverBasin. This will be accomplished by the combined efforts of government, industry, and the private sectorsand by use of new passive-treatment technologies. SCRIP was formed at the request of U.S CongressmanJohn P. Murtha. Its goal is to develop and implement solutions to the AMD problem in the ConemaughRiver Basin. SCRIP was instrumental in initiating the cooperative study of the Stonycreek River Basinbetween the U. S. Geological Survey (USGS) and the Somerset Conservation District.
Purpose and Scope
This report presents the results of a coal-mine-drainage study in the Stonycreek River Basin inSomerset and Cambria Counties, Pa., from 1992 to 1995. The report describes the locations andinstantaneous contaminant loads of 270 mine discharges sampled during low flow throughout the basinand shows the effect that the discharges had on the water quality of the Stonycreek River and its majortributary streams. The report also describes the method used to prioritize the mine discharges forremediation and gives methods for remediation by use of passive-treatment systems. Base-flow sampleswere collected at 5 mainstem sites and 32 tributary sites in September 1992, July 1993, and May 1994. All 37sites were sampled each year. To show the specific effect of mine discharges on the receiving streams, fivemine discharges were sampled at their point of discharge into the receiving streams, and the receivingstreams were sampled above and below these discharges. Also, two streams significantly affected byAMD, Oven Run and Pokeytown Run, were sampled at their point of discharge into the Stonycreek River,and the Stonycreek River was sampled above and below these tributary-stream inflows.

3
Description of Study Area
The Stonycreek River Basin is almost entirely in northern Somerset County in southwesternPennsylvania with only a small part of the basin in Cambria County (fig. 1). Stonycreek River drains anarea of 468 mi2. Stonycreek River Basin is in the Allegheny Mountain Section of the Appalachian PlateausPhysiographic Province (Berg and others, 1989). The eastern basin boundary is the Allegheny Front, whichis a crest forming the western edge of the Appalachian Mountains of the Ridge and Valley PhysiographicProvince. The western border of the Stonycreek River Basin is Laurel Ridge. The headwaters of theStonycreek River rise near the town of Berlin in central Somerset County and flow generally north toJohnstown in Cambria County where it joins the Little Conemaugh River to form the Conemaugh River.The Stonycreek River has a length of 43.4 mi and an average slope of 38 ft/mi (U.S. Army Corps ofEngineers, 1994). Elevations in the basin range from more than 2,900 ft above sea level on both theAllegheny Front and the Laurel Ridge to about 1,150 ft above sea level in the city of Johnstown. Reliefthroughout the basin is moderate to high. A wide, low flood plain exists at the headwaters of theStonycreek River. As the river meanders northward, it enters an area of steep flanking hills with relief of400 to 500 ft near the town of Hooversville; relief increases to a maximum of about 600 ft in Johnstown.
The Stonycreek River Basin contains a large resource of low-volatile bituminous coal. About 14 coalbeds of mineable thickness are in the basin. However, the Lower and Upper Kittanning and the UpperFreeport coals have been the most extensively mined. The earliest mining activity in the basin was duringthe middle to late 1800’s and was limited almost entirely to the Pittsburgh Coal bed in the southeasternmost part of the basin and the Lower Kittanning Coal bed in the central and northern part of the basin. Inthe early 1900’s, extensive mining of the Upper Kittanning Coal bed began. Surface-mining activitiesbegan between 1940 and 1950 and continue to be a major industry throughout the basin.
Rock in the Stonycreek River Basin is sedimentary in origin, and the rock types are primarilysandstone, siltstone, and shale with thin beds of limestone and coal. Folding along the Allegheny Front onthe east and Laurel Hill on the west exposes a considerable part of the geologic column, from theMississippian-Devonian age Rockwell Formation to the Pennsylvania age Monongahela Group. Ageneralized stratigraphic column showing the units present in the basin is shown in figure 2.
The rocks are divided into eight stratigraphic units: the Rockwell Formation of the Mississippian-Devonian System; the Burgoon sandstone, Loyalhanna Formation, and Mauch Chunk Formation of theMississippian System; and the Pottsville Group, Allegheny Group, Conemaugh Group, and MonongahelaGroup of the Pennsylvanian System. The distribution of stratigraphic units in the basin is shown infigure 3. The Rockwell Formation consists of sandstone, shale, and some red beds. The Burgoon sandstoneconsists of buff-nonmarine sandstone and conglomerate. The Loyalhanna Formation is a highly cross-bedded siliceous limestone. The Mauch Chunk Formation consists of red shale with subordinatesandstone and limestone. The Pottsville Group is composed of the Homewood, Mercer, andConnoquenessing Formations and consists predominantly of sandstone, conglomerate, and thin beds ofshale.
The Allegheny and Conemaugh Groups are the two most areally extensive stratigraphic units in thebasin. The Allegheny Group is composed of the Freeport, Kittanning, and Clarion Formations. The groupconsists of sandstone, shale, and discontinuous limestone and coal beds. The Conemaugh Group iscomposed of the Casselman and Glenshaw Formations and consists primarily of sandstone and shale andlesser amounts of limestone and coal. The Allegheny Group is the major coal-bearing unit in theStonycreek River Basin, containing the thick Freeport and Kittanning coal beds. In the basin, theMonongahela Group is composed only of the Pittsburgh Formation, which consists of sandstone,limestone, shale, and coal. The Monongahela Group is confined to the hilltops just north of Berlin. ThisGroup contains three workable coal beds—the Pittsburgh coal, the Blue Lick coal (local name), and theRedstone coal. However, in the Stonycreek River Basin, this Group is sparsely represented.

4
Figure 1. Location of the Stonycreek River Basin.

5
Figure 2. A generalized stratigraphic column ofthe geologic formations in the Stonycreek RiverBasin.
GENERALIZED STRATIGRAPHIC COLUMNSTONYCREEK RIVER BASIN
PE
NN
SY
LVA
NIA
N S
YS
TE
M
MO
NO
NG
AH
ELA
GR
OU
P
Sandstones, limestones,shales, and thin coal beds
CO
NE
MA
UG
HG
RO
UP
Pittsburgh Coal
Gray and red shales andsandstones, thin coal beds,and thin units of limestone
ALL
EG
HE
NY
GR
OU
P
Freeport coal
Kittanning coals
Sandstones, shales,limestones, and coals
PO
TT
SV
ILLE
GR
OU
P
Sandstone with shale andcoal beds
MIS
SIS
SIP
PIA
N S
YS
TE
M
MA
UC
H C
HU
NK
FO
RM
ATIO
N
Red shale with sandstoneand limestone
LOYA
LHA
NN
AF
OR
MAT
ION
Siliceous limestone
BU
RG
OO
NS
AN
DS
TON
E
Cross-bedded sandstonewith some basalconglomerate
RO
CK
WE
LLF
OR
MAT
ION
Sandstone andcarbonaceous shale
DE
VO
NIA
NS
YS
TE
M

6
Figure 3. Geologic map of the Stonycreek River Basin (Geology compiled by Berg and others, 1980)

7
The climate in the Stonycreek River Basin is humid continental, characterized by warm summersand cold winters. Prevailing winds are from the west and bring most major weather systems that affect thebasin. Air currents are mainly from the polar region, but during the summer, air currents from the Gulf ofMexico are frequent and result in warm, humid weather. Annual precipitation from 1926 to 1992 averaged45.5 in. at Johnstown and from 1960 to 1991 averaged 40.7 in. at Boswell (U.S. Army Corps of Engineers,1994). Snowfall and resulting snow on the ground throughout the basin tend to be much greater in areas ofhigher elevation. Average-annual snowfall at Johnstown (elevation approximately 1,200 ft) is 49.9 in. andat Boswell (elevation approximately 1,900 ft) is 64.9 in. The mean annual temperature at Johnstown duringthe period 1926-92 was 51.7°F. The average monthly temperature at Johnstown varies from a low of 27.9°Fin January to a high of 72.9°F in July. The last frost of the season at Johnstown usually occurs in mid-Aprilto early May; in higher elevations in the basin it could be from mid to late May. The first frost at Johnstowncan be expected about mid-September until mid-October, but at higher elevations it has occurred as earlyas late August.
Agricultural land and forest land collectively account for 90 percent of the total land use throughoutthe basin (Anderson, 1967). The eastern (Allegheny Front) and western (Laurel Ridge) parts of the basinare the most heavily forested. Surface-mining operations, which affect both agricultural and forest land,are major activities in the basin and account for 4.4 percent of the land use. Residential development,commercial areas, urban areas, light industrial areas, and community parks account for the remaining5.4 percent. The Stonycreek River Basin is sparsely populated and predominantly rural except near themouth of the river at Johnstown, where most of the population is concentrated. The largest communities inthe basin other than Johnstown and its suburbs include Windber, Berlin, Boswell, Paint, and Central City.
Methods of Study
One of the most significant challenges of the study was to physically locate the abandoned minedischarges throughout the basin. The mine-discharge locations were determined by four principalmethods: (1) from previously published reports and from abandoned mine land (AML) maps suppliedby the Bureau of Abandoned Mine Reclamation of the Pennsylvania Department of EnvironmentalProtection (PaDEP); (2) from information obtained from Mine Conservation Inspectors of the PaDEP andRiver Keepers of the SCRIP organization (River Keepers are local residents who volunteered periodicallyto walk a section of the banks of the Stonycreek River or its tributaries and provide written reports on thecondition of the selected stream segment and locations of mine discharges, sewage outflows, or any otherunnatural inflows to the stream); (3) from talking to local residents and farmers familiar with the area andaware of discharges on their property or adjacent properties, (4) and by physically walking along thestream banks of tributary streams and the mainstem in remote areas where mining was known to haveoccurred. When a mine discharge was found, its location was determined by use of a Global PositioningSystem (GPS) receiver to record the latitude and longitude of the site to the nearest one tenth of a second.Each mine discharge was sampled where it first came from the ground. At the end of each sampling year,all mine discharges were prioritized and ranked with respect to their loading of selected constituents tothe receiving stream. In the following year, the top 30 ranked discharges were resampled.
An initial field reconnaissance of the Stonycreek River Basin was conducted in October andNovember 1991 to determine the sampling locations of all stream sites. Five mainstem sites were selectedon the Stonycreek River and 32 additional sites were selected on tributary streams. All 37 stream sites weresampled during low base flow on September 1 and 2, 1991, and July 27 and 28, 1993, and during high baseflow on May 24 and 25, 1994.
The effect of mine discharges on receiving streams was determined by sampling five discharges attheir point of inflow to the receiving streams and sampling the receiving streams above and below themine discharges. The effect of Oven Run and Pokeytown Run on the Stonycreek River was determined bysampling the streams at their point of discharge into the river and sampling the river above and below thestream inflows.
8
All water-quality samples were collected and preserved according to USGS standard procedures(Ward and Harr, 1990). Water-quality field measurements for pH, specific conductance, and watertemperature were determined by methods described in Fishman and Friedman (1989). Streamflow andmine-discharge flow were measured by methods described in Rantz and others (1982). Laboratoryanalyses for all water samples included pH, specific conductance, acidity (hot), alkalinity, fluoride, sulfate,total inorganic carbon, total dissolved solids, total and dissolved iron, total and dissolved manganese, andtotal and dissolved aluminum. Mine discharges that had a field pH less than 4 were analyzed for ferrousiron. All laboratory analyses were done by the PaDEP laboratory in Harrisburg, Pa., by use of their currentmethods procedures (Pennsylvania Department of Environmental Resources, 1994a).
To organize the data for the Stonycreek River Basin and provide a means for viewing spatialrelations, 14 Geographic Information System (GIS) datasets were developed by use of ARC/INFO1
software. Datasets are in the export file format. These datasets include hydrography, roads, municipalboundaries, drainage basin boundaries, geology, land use/land cover, state game lands, special protectionwaters, wetlands, mine discharges, surface-water-quality data, ground-water site inventory (GWSI) data,Pennsylvania water well inventory (PWWI) data, and digital elevation model (DEM) data. All datasets arein the Universal Transverse Mercator (UTM), Zone 17 projection, have measurement units in meters, areclipped to the study-area boundary, and contain a metadata standard describing the dataset. All GIS data-sets are described in Appendix 1.
Previous Investigations
In 1971, the U.S. Environmental Protection Agency (USEPA) conducted a water-supply and water-quality-control study in the Conemaugh River Basin for the U.S. Army Corps of Engineers, PittsburghDistrict. The study was initiated to determine needs for flood protection, water supply, recreation, andwater-quality control (U.S. Environmental Protection Agency, 1971). The Stonycreek River Basin was onemajor basin studied within the Conemaugh River Basin.
The USEPA (1972) Wheeling Field Office, Wheeling, W. Va., published a Cooperative Mine DrainageSurvey of the Kiskiminetas River Basin that included the Stonycreek River Basin. In the survey, a total of199 active and abandoned mine-discharge sources were sampled in the Stonycreek River Basin fordischarge, total net acidity, total hardness, sulfate, total iron, manganese, and aluminum. Abandoned driftmines are the major source of mine drainage in the Stonycreek River Basin. Shaft mines and mine refusepiles also are major contributors. These three source types contributed a combined acid discharge of184,145 lb/d, about 86 percent of the total-acid discharge from all 199 sources. Stream water-qualitysamples were collected on the Stonycreek River and seven tributaries.
A benchmark watershed study of the upper 30 percent of the Stonycreek River Basin was preparedfor the Commonwealth of Pennsylvania under the Operation Scarlift program (Carson Engineers, 1974).The report described the origin of AMD in affected tributaries. The report made recommendations forpermanent abatement at the mine-discharge sources and gave cost estimates for carrying out eachreclamation measure.
From 1979 through 1981, the USGS measured streamflow and sampled water chemistry and aquaticinvertebrates at selected stream sites in the coal region that included the Stonycreek River Basin (Herb andothers, 1981). The report described information that was useful to surface mine owners, operators, andconsulting engineers for the preparation of permit applications, and to regulatory authorities in appraisingthe adequacy of the applications. From 1976 through 1981, the USGS collected and published water-quality data on Stonycreek River at Ferndale, Pa., for the PaDEP. Data were published annually in theUSGS Water-Data Reports PA 76-3 to PA 81-3 (U.S. Geological Survey, 1976-81).
1 The use of brand names in this report is for identification purposes only and does notconstitute endorsement by the U.S. Geological Survey.

9
In 1983-86, the USGS collected data on five headwater streams in the Laurel Hill area, three of whichwere in the Stonycreek River Basin, to determine the effect of acid precipitation on stream water quality(Barker and Witt III, 1990). Sulfate was the dominant precursor for acid formation in precipitation andstreamflow. Nitrate was more abundant in snowfalls and contributed to streamflow acidification onlyduring snowmelt.
Water-resources data, climatological data, and quality-assurance data were collected by the USGS inthe North Fork Bens Creek Basin, a small subbasin in the Stonycreek River Basin, from 1983 through 1988(Witt III, 1991).
In 1993, the U.S. Army Corps of Engineers, Pittsburgh District, completed a reconnaissance surveyon the lower 4-mi section of the flood-reduction channel on the Stonycreek River (U.S. Army Corps ofEngineers, 1993). The survey was conducted to examine the water quality, the channel sediments thatmight be removed or disturbed, and aquatic-life resources that might be affected by proposedrehabilitation in that section of the flood channel.
A Conemaugh River Basin Reconnaissance Study was published in 1994 by the U.S. Army Corps ofEngineers, Pittsburgh District. This study considered a broad array of basin problems, one of which waswater-quality degradation with respect to AMD. The study also recommended solutions for identifiedproblem conditions.
The PaDEP publishes a water-quality assessment for Pennsylvania waters on a biennial basis inresponse to Section 305(b) of the Federal Clean Water Act. The PaDEP 1994 Water-Quality Assessmentreport for subbasin 18, which includes the Conemaugh River Basin, indicates that the single biggest sourceof water degradation in the subbasin is coal mining and is responsible for more than 81 percent of thedegradation (Pennsylvania Department of Environmental Resources, 1994b).
Acknowledgments
The authors gratefully acknowledge the many individuals residing in the Stonycreek River Basinwho took an earnest interest in this project and provided information and assistance in finding manyabandoned-mine discharges. A special thanks goes to the Mine Conservation Inspectors of the PaDEP andto the River Keepers of SCRIP who provided information on the location of many mine discharges andassisted field personnel in physically locating the discharges. The authors also acknowledge the interestand cooperation of the many individual landowners, companies, and municipalities throughout theStonycreek River Basin who provided access to private and public property for the field data collection,and commonly, provided personal escorts for locating secluded mine discharges.

10
COAL-MINE DISCHARGES
Coal mining can result in drainages that have a low pH and are contaminated with elevatedconcentrations of iron, manganese, aluminum, sulfate, and acidity. At sites mined since May 4, 1984,drainage chemistry must meet strict effluent quality criteria (Code of Federal Regulations, 1994) (table 1).In an effort to meet these criteria, mining companies commonly treat contaminated drainage by use ofchemical methods. In most chemical-treatment systems, metal contaminants are removed through theaddition of alkaline chemicals (e.g., sodium hydroxide, calcium hydroxide, calcium oxide, sodiumcarbonate or ammonia). The chemicals used in these treatment systems can be expensive, especially whenrequired in large quantities. In addition, operation and maintenance costs are associated with aeration andmixing devices, and additional costs are associated with the disposal of metal-laden sludges thataccumulate in settling ponds. Water-treatment costs can exceed $10,000 per year at sites that are otherwisesuccessfully reclaimed (Hedin and others, 1994). The high costs of chemical water treatment place aserious financial burden on active mining companies and have contributed to bankruptcies of manyothers.
Although the mining industry throughout the United States spends more than $1 million every dayto treat effluent waters from active coal mines (Kleinmann, 1989), mine drainage continues to affect streamwater quality because of the adverse effects of discharges from abandoned mines, many of which havebeen inactive for over a century.
The rate and direction of water movement through abandoned mines can be influenced by factorsthat include precipitation, the structure of the mined coal beds, overburden structure, mine tunnels, airshafts, boreholes, and local collapses. When an underground mine is abandoned, water levels rise until thewater eventually overflows to another mine or at the land surface creating an abandoned mine discharge.Mine drainage from abandoned mines and coal refuse piles is the major source of water-qualitydegradation in the Stonycreek River. Most of the Stonycreek River and particularly the lower half of theriver and many of its major tributaries are currently affected by mine drainage from both undergroundand surface sites. Many sites were mined and abandoned before passage of the Surface Mining Controland Reclamation Act of 1977 (Office of Surface Mining Reclamation and Enforcement, 1993). This Act setsstrict compliance standards for surface coal-mining operations and for the surface effects of undergroundmining.
All mine discharges that were located and sampled for this study were abandoned mine discharges.Mine discharges from active mines are monitored regularly by the PaDEP to determine if the dischargescomply with the current Federal and State effluent limitations.
Locations
Locations of the 270 coal-mine discharges sampled during the study are shown in figure 4 and listedin appendix 2. Methods used to physically locate most of the mine discharges are defined in the Methodsof Study section on page 7. After reviewing the information from two previously published reports (U.S.Environmental Protection Agency, 1972; Carson Engineers, 1974) and the AML maps from PaDEP withmine-discharge locations, it was determined that a much more precise method than was used in previousstudies was needed to locate mine discharges. A Trimble Navigation GPS Pathfinder system was used toachieve a horizontal accuracy of 3 to 10 ft. The exact location coordinates of all 270 mine-dischargelocations are given in appendix 2.
Table 1. Federal effluent limitations for coal-mine drainage
[Code of Federal Regulations, 1994, Title 40, Part 434, Section 22;concentrations are in micrograms per liter]
Element or propertyMaximum for
any 1 day
Average of dailyvalues for 30
consecutive days
Iron, total 7,000 3,500Manganese, total 4,000 2,000pH Within the range of 6.0 and 9.0 at all times

11
Figure 4. Locations of coal-mine-discharge sites in the Stonycreek River Basin.

12
Water Quality and Contaminant Discharges
Surface and underground coal mining exposes many earth materials to weathering. The physical-chemical breakdown of some materials is accelerated by this weathering process. Pyrite, or iron sulfide(FeS2), is commonly present in coal and the adjacent rock strata and is the compound most associated withAMD. Water is also a principal component of the AMD problem, functioning as a reactant in pyriteoxidation, as a reaction medium, and as a transport medium for oxidation products. Pyrite oxidation isdescribed by the following reaction in which pyrite, oxygen, and water form sulfuric acid and ferroussulfate:
2FeS2 + 7O2 + 2H2O = 4H+ + 2Fe2+ + 4SO2-4 . (1)
Oxidation of ferrous iron (Fe2+) produces ferric ions (Fe3+) according to the following reaction:
2Fe2+ + 1/2 O2 + 2H+ = 2Fe3+ + H2O. (2)
When the ferric ions react with water, an insoluble ferric hydroxide [Fe(OH)3], also called “yellow boy,”and more acid are produced:
Fe3+ + 3H2O = Fe(OH)3 + 3H+. (3)
The above reactions produce elevated concentrations of the precipitate insoluble ferric hydroxide[Fe(OH)3], dissolved sulfate (SO2-
4 ), and acid (H+). Secondary reactions of the acidic water dissolve manyother constituents associated with coal deposits, including manganese, aluminum, zinc, and trace metalssuch as arsenic, cadmium, and mercury (Tolar, 1982).
High acidities of many mine discharges also can be attributed to the action of the bacteriumThiobacillus ferrooxidans on the pyrite associated with the coal. At near-neutral pH, the oxidation rates ofpyrite by air and by T. ferrooxidans are comparable. This stage is typical of freshly exposed coal or refuse,and despite the high concentration of pyrite, the oxidation rate either by oxygen or T. ferrooxidans is low.When a mine discharge is sufficiently alkaline, the acidic water may persist for only a short time beforeneutralization occurs. However, when the neutralization capacity of the discharge is exceeded, acid beginsto accumulate and the pH decreases. As the pH decreases, the rate of iron oxidation by oxygen alsodecreases, but T. ferrooxidans catalyze the pyrite oxidation and accelerate acid production, which serves tofurther lower pH. As the pH near the pyrite falls to less than 3, the increased solubility of iron and thedecreased rate of ferric hydroxide precipitation significantly increase the overall rate of acid production.Most sampled mine discharges throughout the Stonycreek River Basin that had a pH less than 3 also hadvery high acidities in addition to high concentrations of iron, manganese, aluminum, and sulfate. The fieldand laboratory analyses of all samples collected at the 270 mine discharge sites are listed in appendix 3.The number of sampled mine discharges that exceeded effluent limits for pH, total iron, and totalmanganese concentrations (Code of Federal Regulations, 1994) (table 1) and arbitrary limits for sulfate(U.S. Department of the Interior, 1968) and acidity are shown in figure 5. A pH less than 6.0 was measuredin 193 mine discharges, and a pH greater than 9.0 was measured in 1 discharge. Concentrations of totaliron greater than 7,000 µg/L were measured in 122 mine discharges, and 141 mine discharges containedconcentrations of total manganese greater than 4,000 µg/L. Effluent limits for pH and for concentrations oftotal iron and total manganese were all exceeded in 94 mine discharges. Effluent standards for 1 or 2 ofthose constituents were exceeded in 140 mine discharges. Sulfate is an excellent indicator of mine drainagebecause neutralization processes generally do not change the sulfate concentration and the sulfate ionremains in solution. The U.S. Department of Interior (1968) reported that 75 mg/L of sulfate is an indicatorof AMD in streams. Sulfate concentrations exceeded 75 mg/L in 263 mine discharges.

13
Figure 5. Coal-Mine discharges that exceeded Federal effluent limits for pH and concen-trations of total iron and total manganese, and arbitrary indicator limits for sulfate and net acidityconcentrations.
270
250
200
150
100
50
0
NU
MB
ER
OF
MIN
E-D
ISC
HA
RG
E S
AM
PLE
S
MINE-DISCHARGE-SITE SCALE
FEDERAL EFFLUENT LIMITS FOR pH ANDCONCENTRATIONS OF TOTAL IRON ANDTOTAL MANGANESE, AND ARBITRARY INDICATORLIMITS FOR SULFATE AND NET ACIDITYCONCENTRATIONS
263 SULFATE CONCENTRATION >75 mg/L
193 pH <6.0191 ACIDITY > ALKALINITY
141 TOTAL MANGANESE CONCENTRATION >4,000 µg/L
122 TOTAL IRON CONCENTRATION >7,000 µg/L
94 TOTAL IRON CONCENTRATION >7,000 µg/L, AND
1 pH >9.0
TOTAL MANGANESE CONCENTRATION >4,000 µg/L, ANDpH <6.0 OR >9.0

14
Acidity concentrations show the severity of a mine discharge. A discharge that is appreciably acidicwill be highly aggressive—that is, it will dissolve many minerals in coal mines. The acidity of coal-minedrainage generally arises from free hydrogen ions (H+) and mineral acidity from dissolved iron,manganese, and aluminum, which can undergo hydrolysis reactions that produce H+. When a minedischarge contains both mineral acidity and alkalinity, the discharge is net acidic if acidity is greater thanalkalinity or net alkaline if alkalinity is greater than acidity. Of the mine discharges sampled, 191 wereclassified as net acidic and the remaining 79 were classified as net alkaline.
Natural processes commonly ameliorate mine discharges and the toxic characteristics of thedischarges can decrease because of chemical and biological reactions and by dilution withuncontaminated water. Many of these processes occur as the mine discharge flows on the land surface andis exposed to the air. The data in table 2 show the changes that occurred in water quality and quantity oftwo mine discharges sampled on the same day at their point of discharge from the ground and at adistance downstream just before the discharges flowed into the receiving stream. Water quality of mine-discharge at site 17 showed slight improvement about 400 ft downstream. The flow of mine discharge atsite 17 was about the same at both sampling points. The quality of mine discharge at site 22 wasconsiderably improved about 1,000 ft downstream, but dilution appears to have been a significant cause.
Natural processes that ameliorate the quality of mine discharges also can occur before the dischargeflows from the ground. When mine water contacts oxygen in the mine voids, iron and manganese canprecipitate as hydroxides or oxides, and pH can increase if the discharge comes in direct contact withcarbonate rocks. Of the 270 abandoned-mine discharges sampled, 38 met effluent standards for pH andconcentrations of iron and manganese (table 3). Five of the 38 discharges met secondary drinking-waterstandards established by USEPA (1994) for pH, iron, manganese, aluminum, and fluoride.
Table 2. Water-quality and quantity changes that occurred downstreamof mine-discharge sites 17 and 22 on May 12, 1994
[mg/L, milligram per liter; µg/L, microgram per liter]
SiteDischarge(cubic feet
per second)
pH(units)
Iron,total (µg/L
as Fe)
Manganese,total (µg/L
as Mn)
Acidity,total heated
(µg/L asCaCO3)
Sulfate,total
(mg/L asSO4)
Site 17 at point of discharge from the ground 2.5 3.6 990 800 32 200Location approximately 400 feet downstream
of site 172.3 3.7 900 760 30 230
Site 22 at point of discharge from the ground 1.2 3.6 21,300 7,100 172 730Location approximately 1,000 feet downstream
of site 222.5 3.4 9,300 3,700 82 400

15
Table 3. Mine discharges that met Federal effluent standards for pH andconcentrations of total iron and total manganese
[U.S. Environmental Protection Agency, 1994; µg/L, microgram per liter;mg/L, milligrams per liter, <, less than]
Sitenumber
pH(units)
Manganese,total (µg/L)
Iron,total
(µg/L)
Aluminum,total (µg/L)
Fluoride(mg/L)
50 7.1 330 2461 6.7 2,000 15064 6.4 2,900 1,70066 6.8 500 26068 6.7 130 1,40086 6.6 610 50088 6.5 10 6091 6.8 120 8896 6.3 610 460
121 6.0 760 940123 6.4 170 50135 6.6 1,200 140136 6.6 1,800 170145 6.2 70 280146 6.7 1,600 120151 6.5 3,000 260152 6.5 40 100153 6.3 230 320171 6.6 950 510193 6.9 1,400 130
1195 7.1 100 10 <130 <0.21196 6.8 30 10 <130 <.2197 7.2 1,900 79199 7.1 230 170202 6.1 150 86211 6.6 1,200 1,600224 6.4 830 3,900229 6.2 2,200 380230 6.1 4,000 2,000243 6.3 2,000 43244 6.3 220 17245 6.0 210 120
1246 6.4 20 240 <130 <.21247 6.6 490 840 150 <.2257 6.9 570 33259 6.3 180 190268 6.3 700 680
1270 6.6 110 10 197 .21 Discharges that met U.S. Environmental Protection Agency secondary drinking
water standards for aluminum and fluoride.

16
The flow rate of a mine discharge is one of the most important factors when determiningcontaminant discharges. This is illustrated in table 4. The first set of data on the top left side of the tablerepresents the top 10 percent (27 discharges) of the 270 mine discharges with respect to the largest totaliron concentrations. The sites are sorted from highest concentration to lowest concentration of total iron.The “DISCHARGE RANK” column represents the rank of the corresponding discharge for each site fromhighest measured instantaneous discharge to lowest measured instantaneous discharge of all 270 minedischarges. For example, mine discharge at site 20 contained the highest measured total-iron concentration(4,750,000 µg/L) of all 270 mine discharges, but the iron discharge of 39.9 lb/d ranked 26th of all 270 minedischarges. Mine discharge at site 122 contained the fourth highest measured iron concentration(690,000 µg/L), but its discharge of only 1.66 lb/d ranked that mine discharge 107th of the 270 minedischarges.
On the top right side of table 4, the data are sorted with respect to total-iron discharges, with thehighest measured discharge at the top of the data group in the column marked “Discharge, lb/d” and thelowest measured discharge at the bottom. In this data group, mine discharge at site 16 contained thelargest total iron discharge (1,700 lb/d), but the concentration ranked only 41 of the 270 discharges. Thereason for the highest measured total iron discharge was because of the very large flow (2,250 gal/min) inaddition to a large concentration (63,000 µg/L). Mine discharges at sites 149 and 242 ranked very high inboth iron discharge rank and iron concentration rank because both mine discharges contained high total-iron concentrations and high flows.
The bottom half of table 4 shows discharge ranks and concentration ranks for acidities that weresorted on the basis of acidity concentrations and acidity discharges. Site 242 ranked second of all 270 sitesin acidity discharge rank and acidity concentration rank. The iron and acidity columns labeled “Discharge,lb/d” on the right side of table 4 gives the 27 mine discharges that are contributing most of thecontaminant discharges of total iron and total acidity to the receiving streams.
The next section in this report integrates discharges of total iron, total manganese, dissolvedaluminum, acidity, and sulfate to prioritize all sampled mine discharges for remediation.
17
Table 4. Flows, concentrations of total iron and acidity, and iron and acidity discharges anddischarge rank for mine discharge sites in the Stonycreek River Basin
[gal/min, gallon per minute; µg/L, microgram per liter; lb/d, pound per day; mg/L, milligramperliter; <, less than]
SiteFlow
(gal/min)Iron
(µg/L)Discharge
(lb/d)Discharge
rankSite
Flow(gal/min)
Iron(µg/L)
Discharge(lb/d)
Concen-trationrank
20 0.7 4,750,000 39.9 26 16 2,250 63,000 1,700 41242 22 2,750,000 726 4 149 310 300,000 1,120 679 2.0 1,300,000 31.2 31 19 1,780 41,000 876 57
122 .2 690,000 1.66 107 242 22 2,750,000 726 2165 18 320,000 69.1 17 176 330 110,000 435 25149 310 300,000 1,120 2 125 225 130,000 351 21228 .1 220,000 .26 164 178 1,620 17,000 330 93141 48 210,000 121 12 173 470 34,000 192 6824 3 210,000 7.56 68 110 449 30,000 162 75
158 .5 200,000 1.20 118 3 155 75,000 140 32192 2.1 190,000 4.79 76 4 348 30,000 125 76174 7.5 180,000 16.2 42 141 48 210,000 121 8180 25 180,000 54.0 23 81 1,400 6,900 116 124191 5 180,000 10.8 54 225 60 120,000 86.4 22219 18 160,000 34.6 29 109 180 39,000 84.2 60166 13 150,000 23.4 34 22 224 30,000 80.6 74142 2.5 140,000 4.20 81 165 18 320,000 69.1 557 1.6 130,000 2.50 91 15 96 60,000 69.1 4580 .4 130,000 .62 139 97 197 28,000 66.2 8094 2.5 130,000 3.90 83 184 45 120,000 64.8 23
125 225 130,000 351 6 38 78 66,000 61.8 40225 60 120,000 86.4 14 180 25 180,000 54.0 13184 45 120,000 64.8 20 205 75 52,000 46.8 49127 1.3 110,000 1.72 105 95 981 3,500 41.2 155176 330 110,000 436 5 248 114 30,000 41.0 77148 .2 100,000 .24 165 20 <1 4,750,000 39.9 1179 7.5 95,000 8.55 61 55 45 72,000 38.9 35
SiteFlow
(gal/min)Acidity(mg/L)
Discharge(lb/d)
Dischargerank
SiteFlow
(gal/min)Acidity(mg/L)
Discharge(lb/d)
Concen-trationrank
20 0.7 19,700 165 37 16 2,250 250 6,750 61242 22 12,200 3,230 2 242 22 12,200 3,230 279 2.0 3,940 94.6 50 125 225 1,180 3,190 7
122 .2 3,620 8.69 121 208 374 680 3,050 24165 18 1,600 345 24 149 310 540 2,010 30141 48 1,300 751 6 19 1,780 74 1,580 132125 225 1,180 3,180 3 3 155 630 1,170 26142 2.5 1,120 33.6 79 4 348 270 1,130 55219 18 940 203 32 14 799 88 844 119227 7.5 940 84.6 55 141 48 1,300 751 6117 21 934 235 30 81 1,400 44 739 156124 18 866 187 35 189 539 100 647 101158 .5 850 5.10 136 176 330 162 642 7624 3 840 30.2 83 110 449 100 539 102
188 51 820 501 16 22 224 200 538 66180 25 820 246 28 188 51 820 502 15166 13 820 128 44 103 436 92 481 11173 1.6 780 15.0 102 104 200 194 466 68
118 .3 734 2.64 161 63 277 140 465 8560 6.4 720 55.3 63 204 60 620 446 2794 2.5 714 21.4 94 97 197 186 440 7180 .4 700 3.36 154 38 78 442 414 40
140 27 684 222 31 95 981 30 353 168208 374 680 3,050 4 165 18 1,600 346 559 3.1 660 24.6 88 164 97 260 303 563 155 630 1,170 7 15 96 222 256 62
204 60 620 446 20 160 171 120 246 93

18
Remediation-Prioritization Index
A primary goal of the Stonycreek River Basin project was to prioritize individual mine discharges bya method that would show their relative severity with respect to all sampled discharges throughout thebasin. If applicable, this method also could be used in other subbasins that are severely affected by minedrainage. A priority numbering system, or prioritization index (PI), was developed to identify the minedischarges that have the greatest effect on the receiving streams and that should be given a high priority forremediation. The remediation work would be designed to improve water quality in tributary streams andin the Stonycreek River. The PI was based on a site-to-site comparison of discharges of selected water-quality constituents. Discharges of the specific constituents were determined by multiplying theconcentration in milligrams per liter or micrograms per liter times the flow rate in gallons per minute timesa constant of 0.012 (for milligrams per liter) or 0.000012 (for micrograms per liter). The constant was used toconvert concentration (in milligrams per liter or micrograms per liter) per flow rate (in gallons per minute)to pounds per day. Most mine discharge samples were collected during base-flow conditions. Because offunding limitations, sampling all 270 mine discharges at different flow conditions was not feasible.However, approximately 48 of the mine discharges were resampled 1 to 5 times and the data in appendix 3show that the flow rate and constituent concentrations varied at the resampled sites. Data from the firstsample collected at each mine discharge site were used for the PI calculations. When water-resourcemanagers consider remediation at specific sites on the basis of these first-sample comparisons, they can takeinto consideration all data collected at each site and may want to consider collecting additional data atdifferent flows and in different seasons to design treatment systems properly. The water-qualityconstituents used to calculate the PI included total iron, total manganese, dissolved aluminum, acidity, andtotal sulfate. The pH was indirectly used in the PI as a tie breaker for constituent discharges that wereidentical. These factors are related either directly or indirectly to the effects of coal-mine drainage on waterquality. Low pH and high acidities are common to the most severe mine discharges. Total iron, totalmanganese, and pH in coal-mine drainage are limited by Federal regulations. The sulfate discharge is areliable indicator of mine drainage because the neutralization processes that can occur in a mine dischargeor stream do not greatly affect sulfate concentrations. Dissolved aluminum in waters having low pH affectsfish and some other forms of aquatic life (Driscoll and others, 1980). Flow of a mine discharge is verysignificant because the flow and the concentration of a constituent determine the constituent discharge.
A computerized spreadsheet of the water-quality data at all sites was used to simplify the PIcalculations. The spreadsheet was used to complete a primary sort on the discharges of each constituent inorder of ascending or improving water quality. Table 5 shows how total-iron discharges were sorted,ranked, and scored for the PI calculations. The left four columns of table 5 show the unsorted total-iron datafor sites 1 through 56. The right six columns of table 5 show how the 56 sites of all 270 sites with the highesttotal-iron discharges were sorted, ranked, and scored. The text below refers to the sorted total-iron data intable 5. A rank number was assigned to each total-iron discharge in a descending order, with a rank 1 forthe largest total-iron discharge (1,700 lb/d), and a rank 56 for the smallest total-iron discharge (10.2 lb/d).Each discharge was then given a score based on the rank. A score of 1 to 10 was assigned to each dischargeby subdividing the 270 sites into 10 percent groups. The first 10 percent group (rank 1-27) received a scoreof 10. The next 10 percent group (rank 28-54) received a score of 9, and so on. If sites had identicaldischarges, a secondary sort was conducted on the discharges to break the tie, using pH as the tie breaker.The discharge with the lower pH received the lower rank number. Sites 165 and 15 both had total-irondischarges of 69.1 lb/d. The pH at site 165 was 2.7 and the pH at site 15 was 3.6, so site 165 received thelower rank number. Discharges for all five water-quality constituents were sorted, ranked, and scored bythis method. The final score for each site was then calculated by adding the scores for the five water-qualityconstituents. The final rank or PI was determined by assigning the largest final score the number 1, thesecond largest score the number 2, and so forth through all 270 sites. Flow was used as a tie breaker foridentical final scores. The site with the largest flow received the lower rank number. The final rank or PIshows which mine discharges have the greatest potential effect on the water quality of the receivingstreams, in a descending order. The complete spreadsheet showing the individual ranks and scores for eachwater-quality constituent at all sampled discharges and the final PI for each mine discharge is given inappendix 4.

19
Table 5. Unsorted total-iron data and sorted, ranked, and scored total-iron data used for the Prioritization Index (PI)calculations
[gal/min, gallons per minute; µg/L, micrograms per liter; lb/d, pounds per day]
Unsorted total-iron data Sorted, ranked, and scored total-iron data
Sitenumber
Flow(gal/min)
Total-ironconcentration
(µg/L)
Total-irondischarge
(lb/d)
Sitenumber
Flow(gal/min)
Total-ironconcentration
(µg/L)
Total-irondischarge
(lb/d)Rank Score
1 16 46,000 8.83 16 2250 63,000 1,700 1 102 9.0 3,800 .410 149 310 300,000 1,120 2 103 155 75,000 140 19 1780 41,000 876 3 104 348 30,000 125 242 22 2,750,000 726 4 105 341 40 .164 176 330 110,000 436 5 106 306 9,900 36.4 125 225 130,000 351 6 107 91 11,000 12.0 178 1620 17,000 330 7 108 5.8 62,000 4.32 173 470 34,000 192 8 109 6.7 38,000 3.06 110 449 30,000 162 9 10
10 122 750 1.10 3 155 75,000 140 10 1011 136 5,800 9.47 4 348 30,000 125 11 1012 86 13,000 13.42 141 48 210,000 121 12 1013 52 8,300 5.18 81 1400 6,900 116 13 1014 799 880 8.44 225 60 120,000 86.4 14 1015 96 60,000 69.1 109 180 39,000 84.2 15 1016 2,250 63,000 1,700 22 224 30,000 80.6 16 1017 284 3,400 11.6 165 18 320,000 69.1 17 1018 11 6,600 .871 15 96 60,000 69.1 18 1019 1,780 41,000 876 97 197 28,000 66.2 19 1020 .7 4,760,000 40.0 184 45 120,000 64.8 20 1021 46 6,900 3.81 38 78 66,000 61.8 21 1022 224 30,000 80.6 180 25 180,000 54.0 22 1023 12 300 .043 205 75 52,000 46.8 23 1024 3.0 210,000 7.56 95 981 3,500 41.2 24 1025 3.9 68,000 3.18 248 114 30,000 41.0 25 1026 1.5 23,000 .414 20 .7 4,760,000 40.0 26 1027 1.0 30,000 .360 55 45 72,000 38.9 27 1028 84 1,200 1.21 6 306 9,900 36.4 28 929 19 30 .007 219 18 160,000 34.6 29 930 4.4 2,100 .111 204 60 48,000 34.6 30 931 155 2,000 3.72 79 2 1,300,000 31.2 31 932 18 1,100 .238 164 97 26,000 30.3 32 933 8.4 330 .033 144 185 13,000 28.9 33 934 42 32,000 16.1 166 13 150,000 23.4 34 935 48 5,200 3.00 140 27 70,000 22.7 35 936 43 13,000 6.71 58 35 47,000 19.7 36 937 6.8 1,100 .090 188 51 31,000 19.0 37 938 78 66,000 61.8 249 41 36,000 17.7 38 939 63 820 .620 208 374 3,700 16.6 39 940 75 4,800 4.32 170 142 9,700 16.5 40 941 9.0 78,000 8.42 104 200 6,800 16.3 41 942 36 5,400 2.33 174 7.5 180,000 16.2 42 943 .5 27,000 .162 34 42 32,000 16.1 43 944 133 140 .223 121 1510 760 13.8 44 945 .04 290 .000 63 277 4,100 13.6 45 946 20 7,500 1.80 12 86 13,000 13.4 46 947 1.6 38,000 0.730 169 15 74,000 13.32 47 9

20
A PI also was established for all mine discharges in certain subbasins that were moderately toseverely effected by mine drainage. This was done so that water-resource managers could work on asubbasin approach in designing remediation plans. The subbasins prioritized included Shade Creek, PaintCreek, Wells Creek, Quemahoning Creek, Oven Run, and Pokeytown Run. The subbasin data are listed intables 6-11. Locations of the subbasin sites are shown in figures 6-11
The GIS data base containing the site locations and PI provides an effective means for viewing thespatial distribution and magnitude of each sampled mine discharge throughout the basin. The GIS wasalso useful in viewing spatial relations of mine discharges with high quality streams, population centers,existing wetlands, land use, and land slope.
48 8.0 6,400 .614 190 60 18,000 12.96 48 949 3.4 4,800 .196 160 171 5,900 12.11 49 950 1.0 330 .004 7 91 11,000 12.01 50 951 18 300 .065 17 284 3,400 11.59 51 952 .2 9,500 .023 187 36 26,000 11.23 52 953 4.6 1,200 .066 207 221 4,200 11.14 53 954 111 7,900 10.523 191 5 180,000 10.80 54 955 45 72,000 38.880 54 111 7,900 10.52 55 856 20 240 .058 124 18 47,000 10.15 56 8
Table 5. Unsorted total-iron data and sorted, ranked, and scored total-iron data used for the Prioritization Index (PI)calculations—Continued
[gal/min, gallons per minute; µg/L, micrograms per liter; lb/d, pounds per day]
Unsorted total-iron data Sorted, ranked, and scored total-iron data
Sitenumber
Flow(gal/min)
Total-ironconcentration
(µg/L)
Total-irondischarge
(lb/d)
Sitenumber
Flow(gal/min)
Total-ironconcentration
(µg/L)
Total-irondischarge
(lb/d)Rank Score

21
Table 6. Prioritization index (PI) for coal-mine discharges in the Shade Creek Basin
[gal/min, gallon per minute; lb/d, pound per day; <, less than]
Sitenumber
pH(units)
Iron,total(lb/d
as Fe)
Acidity,total heated
(lb/d asCaCO3)
Sulfate,total
(lb/d asSO4)
Aluminum,dissolved
(lb/das Al)
Manganese,total(lb/d
as Mn
Discharge,instantaneous
(gal/min)
Finalscore
PI
16 3.3 1,700 6,750 29,700 486 232 2250 50 119 5.1 876 1580 10,300 25.6 85.4 1780 50 215 3.6 69.1 256 1,130 18.4 19.6 96 50 314 3.6 8.44 844 7,000 93.0 64.2 799 49 438 3.0 61.8 414 796 38.4 6.08 78 49 542 3.1 2.33 86.4 562 6.05 11.2 36 45 640 3.1 4.32 148 378 12.6 4.86 75 44 776 3.4 7.14 52.9 239 4.12 1.34 35 44 8
221 3.2 2.09 47.5 612 3.31 1.73 60 43 9231 3.4 .92 62.2 478 3.28 5.76 48 43 1020 2.4 39.9 165 227 1.34 .50 .7 42 1175 3.3 1.98 28.8 176 1.22 1.22 30 40 12
234 3.5 3.22 13.8 104 .10 1.14 7.9 38 13236 5.4 .02 25.9 421 .39 .39 45 34 1441 5.5 8.42 13.0 52.9 .01 .44 9 34 15
215 3.0 .35 9.46 53.4 .38 .58 7.3 34 16214 3.1 .13 8.35 63.4 .85 .29 12 33 17232 2.7 1.08 6.58 29.6 .02 .36 1.3 32 18247 6.6 .39 <.01 675 .10 .68 67 31 19235 3.7 .06 5.69 6.7 .18 .71 7.9 31 20216 5.5 6.27 9.65 39.4 .01 .33 6.7 31 2139 6.2 .62 <.01 159 .08 .46 63 30 22
233 2.7 .49 4.03 20.4 .05 .28 1 29 2337 3.6 .09 2.94 21.2 .19 .25 6.8 28 2427 3.0 .36 5.04 10.6 .50 .14 1 28 25
229 6.2 .63 <.01 97.9 .04 .11 24 27 26230 6.1 .35 <.01 25.1 .01 .17 7.2 23 27238 5.3 .01 4.03 119 .04 .01 14 22 2843 3.5 .16 .83 2.16 .05 .06 .5 22 29
245 6.0 .03 <.01 67.7 .02 .02 12 21 30200 4.6 .02 2.16 12.6 .05 .05 7.5 21 31265 6.3 1.04 .46 6.91 <.01 .08 1.2 21 3286 6.6 .07 <.01 15.1 .01 .05 9 17 33
243 6.3 .19 <.01 12.3 .01 <.01 7.9 17 3485 4.6 .06 .33 8.40 <.01 .08 2.5 17 35
246 6.4 <.01 <.01 32.3 <.01 .01 3.9 14 36201 4.2 <.01 .50 2.11 .01 .01 1.6 14 37237 3.6 .12 .20 1.73 <.01 <.01 .2 13 38244 6.3 .01 <.01 6.34 <.01 <.01 4.8 11 39266 6.8 .06 <.01 4.61 <.01 <.01 .8 10 40267 6.6 .07 <.01 .02 <.01 .01 .4 10 41239 6.0 .05 .02 .11 <.01 <.01 .1 10 42222 5.6 <.01 <.01 4.18 <.01 <.01 1.2 9 43240 5.8 .01 .03 .98 <.01 <.01 .2 9 44

22
Table 7. Prioritization index (PI) for coal-mine discharges in the Paint Creek Basin
[gal/min, gallon per minute; lb/d, pounds per day; <, less than]
Sitenumber
pH(units)
Iron,total(lb/d
as Fe)
Acidity,total heated
(lb/d asCaCO3)
Sulfate,total
(lb/d asSO4)
Aluminum,dissolved
(lb/das Al)
Manganese,total(lb/d
as Mn
Discharge,instantaneous
(gal/min)
Finalscore
PI
81 4.8 116 739 12,100 31.9 47.0 1400 50 1125 2.4 351 3,180 8,640 232 178 225 50 2141 2.7 121 751 864 42.6 63.4 48 49 3188 2.6 19.0 502 1,470 61.2 25.7 51 48 4103 3.2 7.85 481 5,760 34.0 25.6 436 47 5104 3.0 16.3 466 3,840 31.2 33.6 200 47 6184 2.8 64.8 242 1,240 13.0 2.27 45 43 7140 2.5 22.7 222 648 10.4 15.6 27 43 8117 3.1 8.32 235 605 27.7 17.1 21 43 9124 2.6 10.2 187 648 19.2 11.4 18 42 1031 3.2 3.72 182 670 16.9 10.6 155 41 11
219 2.4 34.6 203 518 2.59 6.70 18 40 12101 3.2 2.39 132 1100 6.60 2.53 117 38 13187 2.4 11.2 164 562 9.50 1.34 36 38 1444 3.6 .22 99.0 1150 8.62 3.99 133 37 1528 3.1 1.21 101 433 9.98 5.85 84 37 16
139 2.6 9.20 73.0 250 3.12 6.08 13 36 17126 2.9 1.22 86.1 253 8.74 7.49 26 35 1846 3.2 1.80 50.4 118 5.28 1.18 20 32 19
142 2.2 4.20 33.6 102 1.47 2.79 2.5 31 20100 5.8 .21 5.07 1770 1.86 2.91 352 30 21111 3.4 .19 29.5 216 3.06 2.34 30 30 2279 2.2 31.2 94.6 149 2.38 .24 2 29 2332 3.4 .24 13.8 207 1.32 .93 18 27 2477 3.8 .10 24.3 100 3.10 2.69 3.8 27 2578 4.5 .02 21.8 679 .63 .94 65 25 26
116 3.6 .16 13.7 178 1.15 1.19 15 25 27112 3.5 .06 10.7 132 1.15 .75 12 23 28185 2.7 1.39 13.2 54.7 .62 .09 1.9 21 2929 4.1 <.01 11.9 141 1.62 .32 19 20 30
113 3.3 .04 8.72 94.8 .91 .58 7.9 20 3196 6.3 .38 <.01 437 .08 .29 52 19 32
217 2.9 1.32 10.7 29.7 .54 .09 2.5 19 33268 6.3 .34 <.01 326 .14 .33 40 18 34127 2.6 1.72 7.58 25.0 .02 .50 1.3 18 3533 3.9 .03 4.44 86.7 .50 .57 8.4 17 36
114 3.5 .04 5.94 79.2 .58 .48 5.5 17 3730 3.1 .11 7.39 24.8 .74 .40 4.4 17 38
220 3.5 .03 5.57 54.7 .47 .59 8.6 16 39115 3.6 .05 4.31 56.2 .37 .51 3.9 16 40138 2.7 .33 4.11 16.7 .21 .44 1.6 15 41218 5.6 .27 <.01 265 .06 .01 33 14 4280 2.7 .62 3.36 6.24 .12 .03 .4 12 43
118 2.6 .22 2.64 6.84 .23 .12 .3 12 44102 4.7 .01 2.16 14.6 .06 .08 15 6 4545 9.7 <.01 <.01 .41 <.01 <.01 .04 5 46

23
Table 8. Prioritization index (PI) for coal-mine discharges in the Wells Creek Basin
[gal/min, gallon per minute; lb/d, pounds per day; <, less than]
Sitenumber
pH(units)
Iron,total(lb/d
as Fe)
Acidity,total heated
(lb/d asCaCO3)
Sulfate,total
(lb/d asSO4)
Aluminum,dissolved
(lb/das Al)
Manganese,total(lb/d
as Mn
Discharge,instantaneous
(gal/min)
Finalscore
PI
22 3.0 80.6 538 2,020 25.5 20.2 224 49 117 3.3 11.6 198 1,260 17.0 6.48 284 44 210 3.5 1.10 35.1 571 2.78 133 122 38 311 4.4 9.47 32.6 588 1.31 2.61 136 35 4210 5.8 9.43 <.01 524 .35 5.35 97 29 523 3.4 .04 14.4 51.8 1.58 1.30 12 24 6223 5.6 .75 1.74 78.0 .06 .90 25 21 79 6.1 3.06 <.01 30.6 .01 .21 6.7 17 818 6.4 .87 <.01 31.7 .01 .11 11 13 9
Table 9. Prioritization index (PI) for coal-mine discharges in the Quemahoning Creek Basin
[gal/min, gallon per minute; lb/d, pounds per day; <, less than]
Sitenumber
pH(units)
Iron,total(lb/d
as Fe)
Acidity,total heated
(lb/d asCaCO3)
Sulfate,total
(lb/d asSO4)
Aluminum,dissolved
(lb/das Al)
Manganese,total(lb/d
as Mn
Discharge,instantaneous
(gal/min)
Finalscore
PI
208 6.2 16.6 3,050 5,830 539 58.3 374 49 1
176 5.9 436 642 1,780 .40 24.2 330 46 2
172 2.8 2.38 93.6 342 8.64 5.04 30 43 3
173 6.2 192 <.01 4,570 1.13 24.8 470 41 4
259 6.3 1.87 <.01 4,580 1.35 1.98 867 35 5
174 5.0 16.2 30.6 83.7 .07 1.17 7.5 35 6
175 3.2 2.22 7.20 28.8 .32 .66 5 33 7
209 3.5 6.68 <.01 230 .15 .92 64 31 8
48 4.5 .61 4.80 53.8 .27 .87 8 31 9
258 3.8 1.51 6.42 38.4 .21 .33 3.3 30 10
54 6.7 10.5 <.01 129 .19 .84 111 28 11
53 3.6 .07 3.97 28.2 .43 .04 4.6 25 12
171 6.6 .79 <.01 124 .11 .42 69 23 13
47 3.2 .73 3.69 14.8 .17 .27 1.6 23 14
183 4.2 .05 1.44 7.56 .14 .10 3 20 15
92 5.8 .02 .24 22.4 <.01 .02 1.7 16 16
182 5.2 .18 .20 1.44 <.01 .03 1 15 17
52 3.8 .02 .12 1.32 <.01 <.01 .2 11 18
256 5.8 <.01 .05 .30 <.01 <.01 .8 8 19
257 6.9 <.01 <.01 4.09 <.01 <.01 1.1 7 20

24
Table 10. Prioritization index (PI) for coal-mine discharges in the Oven Run Basin
[gal/min, gallon per minute; lb/d, pounds per day]
Sitenumber
pH(units)
Iron,total(lb/d
as Fe)
Acidity,total heated
(lb/d asCaCO3)
Sulfate,total(lb/d
as SO4)
Aluminum,dissolved
(lb/das Al)
Manganese,total(lb/d
as Mn)
Discharge,instantaneous
(gal/min)
Finalscore
PI
3 2.8 140 1,170 2,980 100 42.8 155 50 160 2.9 .38 55.3 384 6.60 10.8 6.4 39 2
227 3.0 1.89 84.6 144 9.90 1.71 7.5 35 324 3.0 7.56 30.2 122 2.23 4.68 3.0 34 472 3.7 .08 45.4 144 5.78 4.54 8.6 30 559 2.9 2.72 24.6 100 2.05 2.90 3.1 28 671 3.8 .10 24.3 100 3.10 2.69 3.8 22 773 3.5 1.73 15.0 76.8 1.09 2.30 1.6 19 8
158 3.8 1.20 5.10 21.6 .44 .72 .5 12 9159 4.6 .09 2.54 21.2 .36 .66 2.3 6 10
Table 11. Prioritization index (PI) for coal-mine discharges in the Pokeytown Run Basin
[gal/min, gallon per minute; lb/d, pounds per day; <, less than]
Sitenumber
pH(units)
Iron,total(lb/d
as Fe)
Acidity,total heated
(lb/d asCaCO3)
Sulfate,total
(lb/d asSO4)
Aluminum,dissolved
(lb/das Al)
Manganese,total(lb/d
as Mn
Discharge,instantaneous
(gal/min)
Finalscore
PI
242 2.3 726 3,230 5,280 259 7.39 22 49 14 2.8 125 1,130 4,010 83.5 21.7 348 46 2
34 2.7 16.1 156 605 10.6 7.06 42 40 31 2.8 8.83 73.0 288 6.14 5.76 16 35 4
94 3.0 3.90 21.4 51.0 .75 4.50 2.5 28 535 6.0 3.00 <.01 173 .12 1.84 48 24 62 3.1 .41 9.94 107 .56 .95 9 23 7
87 6.4 .24 <.01 12.7 <.01 .09 1.8 15 8

25
.
Figure 6. Location of the coal-mine-discharge sites in the Shade Creek Basin.

26
Figure 7. Location of the coal-mine-discharge sites in the Paint Creek Basin.

27
Figure 8. Location of the coal-mine-discharge sites in the Wells Creek Basin.

28
Figure 9. Location of the coal-mine-discharge sites in the Quemahoning Creek Basin.

29
Figure 10. Location of the coal-mine-discharge sites in the Oven Run Basin.

30
Figure 11. Location of the coal-mine-discharge sites in the Pokeytown Run Basin.

31
Remediation by Passive-Treatment Systems
Within the last decade, passive-treatment systems have developed from an experimental concept tofull-scale field implementation at hundreds of sites (Hedin and others, 1994). Passive technologies takeadvantage of natural chemical and biological processes that improve the quality of contaminated water.Passive-treatment systems use contaminant removal processes that are slower than conventionaltreatment systems. Passive-treatment systems must retain contaminated mine water long enough todecrease contaminant concentrations to acceptable levels. The retention time for a particular minedischarge is limited by available land area, and therefore, the sizing of passive-treatment systems is acrucial design aspect. Baseline water quality and flow must be known to design AMD-treatment systemsproperly.
Three principal types of passive technologies are currently in use for the treatment of coal-minedrainage: aerobic wetland systems, wetlands that contain an organic substrate (compost wetlands), andALD’s. In aerobic wetland systems, oxidation reactions occur and metals precipitate primarily as oxidesand hydroxides. Most aerobic wetlands contain cattails (Typha latifolia) growing in clay or spoil substrate.Plantless systems also have been constructed and function similarly to those containing plants if theinfluent water is alkaline. However, it is recommended that plants be included because they may helpfilter particulates, prevent flow channelization, and benefit wildlife. The water depth in a typical aerobicsystem is approximately 6 to 18 in.
Compost wetlands are similar to aerobic wetlands in form but also contain a thick layer of organicsubstrate. This substrate promotes chemical and microbial processes that generate alkalinity andneutralize acidic components of mine drainage. Typical substrates used in compost wetlands includespent mushroom compost, Sphagnum peat, hay bales, and manure.
ALD’s are commonly used to treat AMD before it flows into a constructed wetland. The ALD raisesthe pH of the water to circumneutral levels (pH 6 to 7) and introduces bicarbonate alkalinity thatneutralizes the acidity. When water exits the ALD, the circumneutral pH level promotes metalprecipitation (Hedin and Narin, 1993). The limestone and mine water in an ALD are kept anoxic by sealingthe drain to atmospheric oxygen to avoid armoring of the limestone with ferric hydroxide.
Each of the three passive technologies is most appropriate for a particular type of mine-waterproblem, but commonly, they are most effectively used in combination with each other. Examples areshown in figures 12 and 13. A passive-treatment system in which three ALD’s, a constructed wetland, andtwo limestone cells are used in series to treat mine drainage from reclaimed surface mine spoils that wereapproximately 10 years old is shown in figure 12. This passive-treatment system is at an experimental siteof the U.S. Bureau of Mines in the Shade Creek Basin, a subbasin of the Stonycreek River Basin. Kepler andMcCleary (1994) have conducted research on a system called a successive alkalinity-producing system(SAPS) that combines ALD technology with the sulfate reduction mechanism of the compost wetland. Atypical cross-sectional view of a SAPS treatment component is shown in figure 13. This system can be usedto treat mine drainage that is extremely acidic (acidity concentration greater than 300 mg/L as CaCO3) andhas high concentrations of ferric iron (concentrations greater than 1.0 mg/L). A series of SAPS iscommonly utilized until the AMD either meets effluent criteria or the quality of the AMD improves to thedegree proportional to the area available for treatment. Passive treatment technology is still evolving anddeveloping as researchers continue to work on perfecting these treatment systems. Although the effluentfrom these treatment systems at abandoned mine sites may not meet compliance standards, passivetreatment may provide the only practical means of improving the quality of the mine discharge. Hedinand Narin (1992) provide an extensive listing of passive-treatment literature for water-resource managerswho may be involved in the passive treatment of contaminated mine discharges.

32
CONSTRUCTEDWETLAND
LIMESTONECELL
LIMESTONECELL FLUME
WEIR
WEIR
ANOXICLIMESTONE DRAINS
Figure 12. Layout of the Shade passive-treatment system in the Stonycreek River Basin(Modification from Narin and others, 1991).
NOT TO SCALENOT TO SCALE
Figure 13. A typical cross-sectional view of asuccessive alkalinity-producing system treatmentcomponent (Kepler and McCleary, 1994, p. 198).
PONDEDWATER
DIRECTIONOF FLOW
ORGANICCOMPOST
LIMESTONE
IMPERMEABLE BARRIER
EFFLUENT PIPE

33
SURFACE-WATER-QUALITY SAMPLING SITES
Locations
The 37 surface-water-quality sampling sites selected for this study are listed in table 12, and theirlocations are shown in figure 14. The sites were selected to include a variety of stream-quality conditions.The sites consisted of mainstem sites, tributary sites, sites affected by varying degrees of mine drainage,sites designated as high quality or exceptional value streams by the PaDEP, inflows to reservoirs, reservoiroutflows, and sites where historical data are available. Five sites were established on the Stonycreek River(sites 801-805) and 32 sites were on tributary streams (sites 806-837). Sites 805 and 833 are streamflow-gaging stations where continuous streamflow data and periodic water-quality data are collected. Site 805(Stonycreek River at Ferndale, Pa.) is 5.2 mi upstream from the confluence with the Little ConemaughRiver and has been a streamflow-gaging station since 1913. This site was established as the outflow site forthe Stonycreek River Basin because of its proximity to the river mouth and the availability of long-termstreamflow data and periodic water-quality data. Ninety-seven percent of the Stonycreek River Basin ismonitored at site 805. Site 833 (North Fork Bens Creek at North Fork Reservoir) is the main inflow to theNorth Fork Reservoir, a water-supply reservoir serving the greater Johnstown area. Data were collected atthis site from 1984 to 1993 as part of a nationwide network to determine long-term effects of acidprecipitation on base-flow stream quality (Aulenbach and others, 1996). Data collection was continued atthis site in 1994 for this investigation. Site 801 is a mainstem site in the headwaters of the Stonycreek Riverand is, for the most part, unaffected by mine drainage. Sites 802-804 are mainstem sites at the towns ofKantner, Blough, and near Windber, respectively, and are affected by varying degrees of mine drainage.Eight tributary sites (sites 813, 814, 818, 824, 826, 829, 832 and 834) were previously sampled by the USGSduring 1979-81 (Herb and others, 1981) as part of a monitoring network to collect hydrologic data in coal-bearing areas. Site 831 was previously sampled by the USGS from 1983 to 1986 to determine the effect ofacid precipitation on stream-water quality (Barker and Witt III, 1990). Site 808 is a discontinuedstreamflow-gaging station on Clear Run operated by the USGS from 1961 to 1978. The remaining siteswere near the mouth of tributary streams in the Stonycreek River Basin and at inflows to theQuemahoning Reservoir (sites 818-823), Indian Lake (sites 808 and 809), and Lake Stonycreek (site 807).Site 817 was at the outflow of the Quemahoning Reservoir and site 810 was at the outflow of LakeStonycreek and Indian Lake.

34
Table 12. Surface-water-quality sampling sites in the Stonycreek River Basin
[°, degrees; ', minutes; ", seconds; --, no drainage area available]
Sitenumber
Stationnumber1
Location
Station nameDrainage
areaLatitude Longitude
801 40°00'14" 078°54'02" Stonycreek River at Shanksville802 40°06'11" 078°55'58" Stonycreek River at Kantner --803 40°10'18" 078°54'29" Stonycreek River at Blough --804 40°14'37" 078°53'02" Stonycreek River near Windber --805 03040000 40°17'08" 078°55'15" Stonycreek River at Ferndale 451806 39°58'36" 078°55'49" Glades Creek near Shanksville --807 40°00'33" 078°51'16" Boone Run near Shanksville --808 03039200 40°02'50" 078°49'58" Clear Run near Buckstown 3.68809 40°03'37" 078°51'37" Calendars Run at Bucktown --810 40°00'56" 078°54'05" Rhoads Creek at Shanksville 26.1811 40°00'58" 078°55'23" Shrock Run near Shanksville --812 40°04'14" 078°54'51" Lamberts Run at Lambertsville --813 03039300 40°04'11" 078°56'45" Wells Creek at Mostoller 16.8814 03039340 40°05'35" 078°57'16" Beaverdam Creek at Stoystown 18.5815 40°07'06" 078°55'28" Oven Run at Rowena --816 40°08'41" 078°54'49" Fallen Timber Run at Hooversville 2.48817 40°11'21" 078°56'28" Quemahoning Creek at Quemahoning
Reservoir Outflow98.2
818 03039440 40°09'54" 079°01'51" Quemahoning Creek at Boswell 58.5819 40°09'54" 079°04'05" Beaverdam Creek at Jennerstown --820 40°08'22" 079°03'59" N Br Quemahoning Ck near Coal Junction --821 40°10'17" 079°00'53" Roaring Run at Pilltown --822 40°09'08" 078°58'57" Twomile Run near Boswell 5.52823 40°08'26" 078°58'04" Higgins Run near Boswell 5.81824 03039700 40°06'18" 078°47'55" Dark Shade Creek at Central City 8.51825 40°07'01" 078°48'16" Laurel Run at Central City 10.0826 03039750 40°08'03" 078°48'53" Dark Shade Creek at Reitz 35.8827 40°08'54" 078°49'02" Clear Shade Creek at Reitz 31.4828 40°10'59" 078°49'52" Roaring Fork near Hillsboro --829 03039930 49 14'46" 078°50'49" Little Paint Creek at Scalp Level 12.4830 40°14'41" 078°53'02" Paint Creek near Windber 36.8831 03039930 40°23'41" 079°02'49" South Fork Bens Creek near Thomasdale 3.28832 03039950 40°15'02" 078°58'20" South Fork Bens Creek near Ferndale 18.1833 03039925 40°15'58" 079°01'01" North Fork Bens Creek at North Fork Res 3.45834 03039957 40°16'58" 078°56'10" Bens Creek at Ferndale 41.6835 40°18'21" 078°54'36" Solomon Run at Johnstown 8.47836 40°12'43" 078°53'55" Shade Creek at Seanor 96.7837 40°07'38" 078°55'28" Pokeytown Run at Wilbur --
1 For sites that have no station number listed, the station number is the 15 digit number that includes the latitude,longitude, and a 01 identifier at the end. For example, the station number for site 801 would be 400014078540201.

35
Figure 14. Surface-water-quality sampling sites in the Stonycreek River Basin.

36
Water Quality and Contaminant Discharges
In order to determine base-flow stream quality and contaminant discharges, synoptic-sampling wasconducted each year from 1992 through 1994 at the surface-water sites. Because no precipitation occurredwithin 5 days of each sampling period, any effects of direct surface runoff to the streams were eliminated.Consequently, the data provide a basinwide coverage of base-flow water quality. Low-base-flow sampleswere collected on September 1 and 2, 1992, and July 27 and 28, 1993, at the 63- and 76-percent flowdurations at the Stonycreek River at Ferndale, Pa., respectively. High-base-flow samples were collected onMay 23 and 24, 1994, at the 35-percent flow duration. Surface-water-quality analyses are presented inappendix 5. Samples collected on July 27 and 28, 1993, were during the lowest base-flow conditions of thethree synoptic runs and are used to describe base-flow water quality throughout the basin. Specificconductance, pH, and concentrations and discharges of dissolved solids, alkalinity, acidity, total iron, totalmanganese, and sulfate in the mainstem and tributary streams in the Stonycreek River Basin are shown onfigures 15-18.
The pH at mainstem sites 801 and 802 was near neutral, but at mainstem sites 803-805, the pH was4.2 or less (fig. 15). The pH from the mainstem corresponds with changes in the alkalinity and acidity onthe mainstem (fig. 16). As the pH decreased, the alkalinity decreased and the acidity increased. Alkalinityat mainstem site 801 and tributary streams between 801 and 802 effectively neutralizes most acidity in themainstem at site 802. However, the extremely high acidities at tributary sites 815 and 837 eliminate theneutralizing capability in the mainstem, and the mainstem remains acidic from site 803 to outflow site 805.Tributary sites 836 and 830 also contribute significant acid discharges to the mainstem. Specificconductance and dissolved-solids concentrations do not significantly change from mainstem site 801 tomainstem site 805 because of dilution from tributary streams (fig. 15). However, specific conductance anddissolved-solids concentrations vary in the tributary streams. Dissolved-solids discharges graduallyincrease from mainstem sites 801 to 803 and then increase significantly at mainstem sites 804 and 805. Thelarge increases at sites 804 and 805 are the result of large dissolved-solids discharges entering themainstem from tributary sites 830 and 836 and the increase in streamflow from site 804 to 805.
Total-iron concentrations vary considerably spacially in both the mainstem and in the tributarystreams (fig. 17). Chemical reactions occurring within the stream, which promote the oxidation andprecipitation of iron, contribute to the variation in concentrations of iron. The discharge of total ironincreased from 30 lb/d at mainstem site 801 to 684 lb/d at mainstem site 805. The slight decrease in total-iron discharge from mainstem site 803 to site 804 was probably because of the precipitation of iron.Concentrations of total manganese also varied considerably in the mainstem and in the tributary streams(fig. 17). However, the discharge of total manganese increased considerably from mainstem site 802 to site805. Very large discharges of manganese entered the mainstem from tributary sites 836 and 830.Manganese oxidation reactions and precipitation are strongly affected by pH and are very slow below pH8.5. Therefore, the manganese entering the mainstem from the tributary streams did not precipitate andhad an additive affect on mainstem discharges.
Sulfate concentrations are particularly high at tributary sites 812, 815, 830, and 837 (fig. 18).Mainstem sulfate concentrations gradually increase from sites 801 to 803 and then gradually decrease fromsites 803 to 805. Neutralization reactions occurring in a stream generally do not change sulfateconcentrations. The attenuation of the sulfate concentrations from mainstem sites 803 to 805 is probablybecause of dilution. Sulfate discharges gradually increase from mainstem sites 801 to 803 and significantlyincrease from sites 803 to 805 (fig. 18). The streamflow at sites 804 and 805 exceeded the streamflow at site803 by 3.4 and 5.5 times, respectively, accounting for the large increase in sulfate discharges.

37
Figure 15. Specific conductance, pH, and concentrations and discharges of dissolved solids measured in themainstem and in tributary streams in the Stonycreek River Basin on July 27 and 28, 1993.
2
8
2
4
6
PH
, IN
UN
ITS
0
4,000
0
1,000
2,000
3,000
DIS
SO
LVE
D S
OLI
DS
0
300
0
100
200
DIS
SO
LVE
D S
OLI
DS
DIS
CH
AR
GE
,IN
TO
NS
PE
R D
AY
ST
ON
YC
RE
EK
RIV
ER
, 801
RH
OD
ES
CR
EE
K, 8
10
SC
HR
OC
K R
UN
, 811
LAM
BE
RT
S R
UN
, 812
WE
LLS
CR
EE
K, 8
13
BE
AV
ER
DA
M C
RE
EK
, 814
ST
ON
YC
RE
EK
RIV
ER
, 802
OV
EN
RU
N, 8
15
PO
KE
YT
OW
N R
UN
, 837
FA
LLE
N T
IMB
ER
RU
N, 8
16
ST
ON
YC
RE
EK
RIV
ER
, 803
QU
EM
AH
ON
ING
CR
EE
K, 8
17
SH
AD
E C
RE
EK
, 836
ST
ON
YC
RE
EK
RIV
ER
, 804
PA
INT
CR
EE
K, 8
30
BE
NS
CR
EE
K, 8
34
ST
ON
YC
RE
EK
RIV
ER
, 805
SITES, IN DOWNSTREAM ORDER FROM LEFT TO RIGHT
0
3,000
0
1,000
2,000
SP
EC
IFIC
CO
ND
UC
TA
NC
E,
IN M
ICR
OS
IEM
EN
S
MAINSTEM
CO
NC
EN
TR
AT
ION
,IN
MIL
LIG
RA
MS
PE
R L
ITE
RP
ER
CE
NT
IME
TE
R
DOWNSTREAM TREND AT MAINSTEM SITES
MAINSTEM SITE
TRIBUTARY SITE

38
Figure 16. Concentrations and discharges of alkalinity and acidity measured in the mainstem and in tributarystreams in the Stonycreek River Basin on July 27 and 28, 1993.
0
100
0
20
40
60
80 A
LKA
LIN
ITY
CO
NC
EN
TR
AT
ION
,IN
MIL
LIG
RA
MS
PE
R L
ITE
R
0
150
0
50
100
AC
IDIT
Y C
ON
CE
NT
RA
TIO
N,
IN M
ILLI
GR
AM
S P
ER
LIT
ER
0
30,000
0
10,000
20,000
AC
IDIT
Y D
ISC
HA
RG
E,
IN P
OU
ND
S P
ER
DA
Y
ST
ON
YC
RE
EK
RIV
ER
, 801
RH
OD
ES
CR
EE
K, 8
10
SC
HR
OC
K R
UN
, 811
LAM
BE
RT
S R
UN
, 812
WE
LLS
CR
EE
K, 8
13
BE
AV
ER
DA
M C
RE
EK
, 814
ST
ON
YC
RE
EK
RIV
ER
, 802
OV
EN
RU
N, 8
15
PO
KE
YT
OW
N R
UN
, 837
FA
LLE
N T
IMB
ER
RU
N, 8
16
ST
ON
YC
RE
EK
RIV
ER
, 803
QU
EM
AH
ON
ING
CR
EE
K, 8
17
SH
AD
E C
RE
EK
, 836
ST
ON
YC
RE
EK
RIV
ER
, 804
PA
INT
CR
EE
K, 8
30
BE
NS
CR
EE
K, 8
34
ST
ON
YC
RE
EK
RIV
ER
, 805
SITES, IN DOWNSTREAM ORDER FROM LEFT TO RIGHT
0
6,000
0
2,000
4,000
ALK
ALI
NIT
Y D
ISC
HA
RG
E,
IN P
OU
ND
S P
ER
DA
YMAINSTEM
1,740480
DOWNSTREAM TREND AT MAINSTEM SITES
MAINSTEM SITE
TRIBUTARY SITE
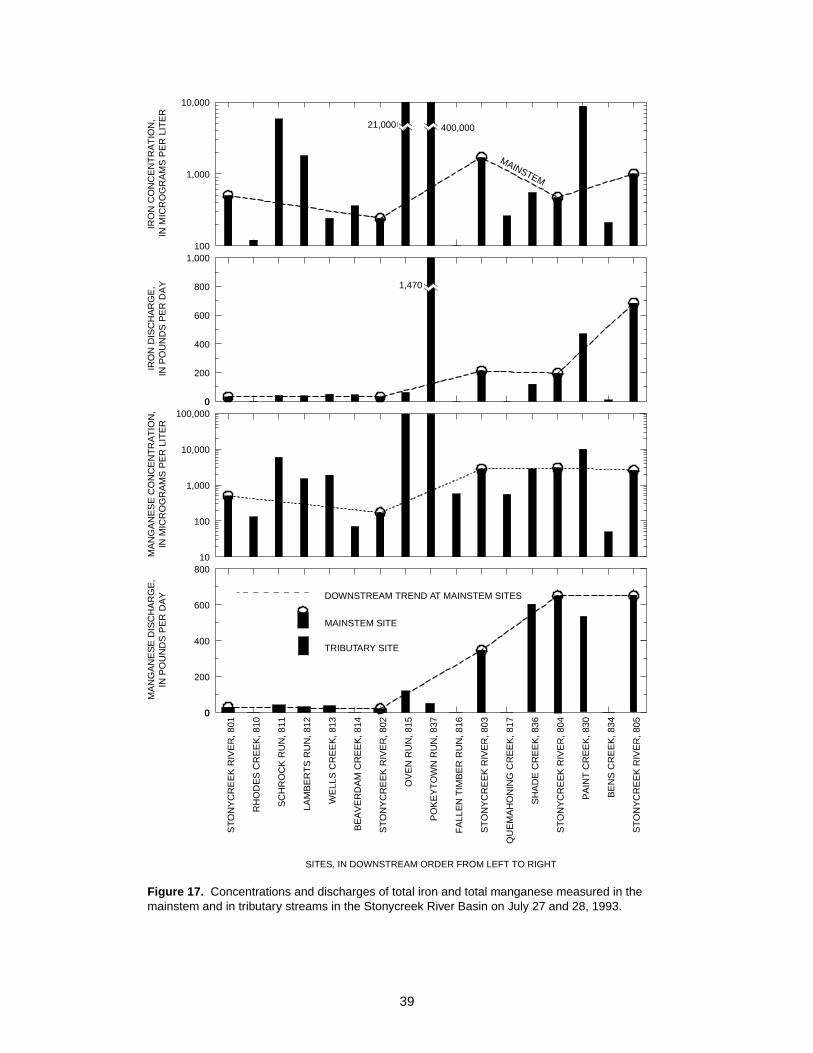
39
Figure 17. Concentrations and discharges of total iron and total manganese measured in themainstem and in tributary streams in the Stonycreek River Basin on July 27 and 28, 1993.
100
10,000
1,000
IRO
N C
ON
CE
NT
RA
TIO
N,
IN M
ICR
OG
RA
MS
PE
R L
ITE
R
0
1,000
0
200
400
600
800
IRO
N D
ISC
HA
RG
E,
IN P
OU
ND
S P
ER
DA
Y
10
100,000
100
1,000
10,000
MA
NG
AN
ES
E C
ON
CE
NT
RA
TIO
N,
IN M
ICR
OG
RA
MS
PE
R L
ITE
R
0
800
0
200
400
600
MA
NG
AN
ES
E D
ISC
HA
RG
E,
IN P
OU
ND
S P
ER
DA
Y
ST
ON
YC
RE
EK
RIV
ER
, 801
RH
OD
ES
CR
EE
K, 8
10
SC
HR
OC
K R
UN
, 811
LAM
BE
RT
S R
UN
, 812
WE
LLS
CR
EE
K, 8
13
BE
AV
ER
DA
M C
RE
EK
, 814
ST
ON
YC
RE
EK
RIV
ER
, 802
OV
EN
RU
N, 8
15
PO
KE
YT
OW
N R
UN
, 837
FA
LLE
N T
IMB
ER
RU
N, 8
16
ST
ON
YC
RE
EK
RIV
ER
, 803
QU
EM
AH
ON
ING
CR
EE
K, 8
17
SH
AD
E C
RE
EK
, 836
ST
ON
YC
RE
EK
RIV
ER
, 804
PA
INT
CR
EE
K, 8
30
BE
NS
CR
EE
K, 8
34
ST
ON
YC
RE
EK
RIV
ER
, 805
SITES, IN DOWNSTREAM ORDER FROM LEFT TO RIGHT
21,000 400,000
1,470
MAINSTEM
DOWNSTREAM TREND AT MAINSTEM SITES
MAINSTEM SITE
TRIBUTARY SITE
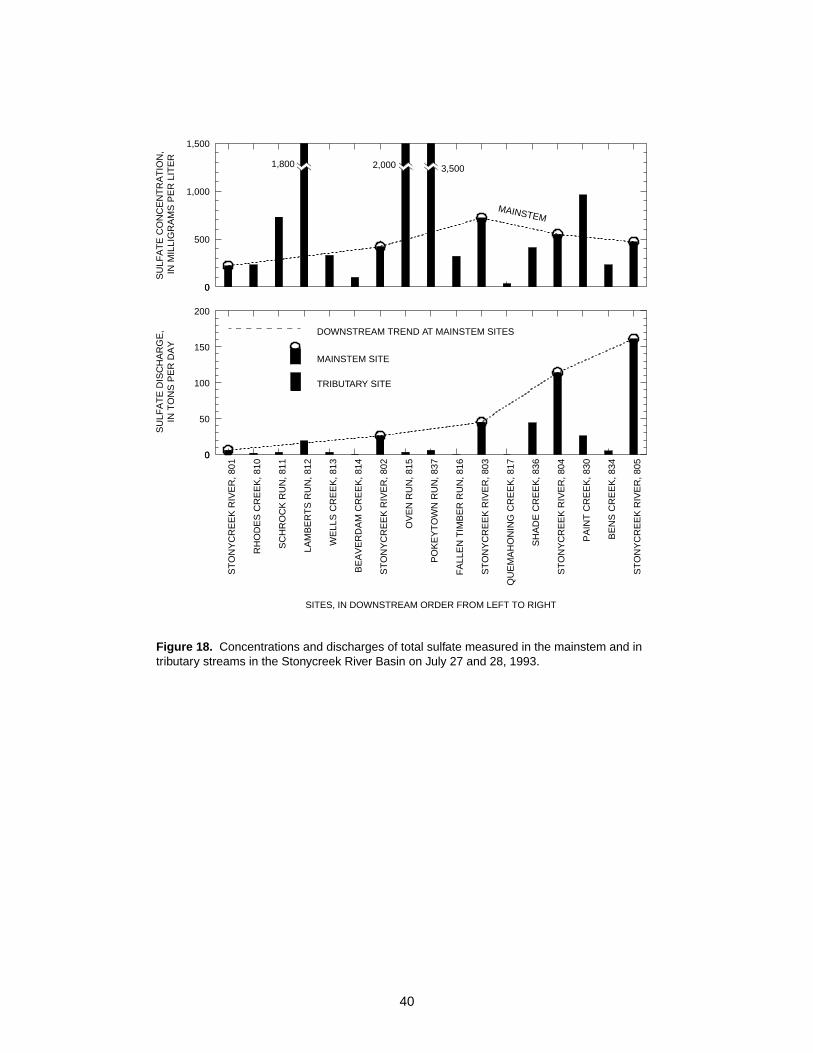
40
Figure 18. Concentrations and discharges of total sulfate measured in the mainstem and intributary streams in the Stonycreek River Basin on July 27 and 28, 1993.
0
1,500
0
500
1,000
SU
LFA
TE
CO
NC
EN
TR
AT
ION
,IN
MIL
LIG
RA
MS
PE
R L
ITE
R
0
200
0
50
100
150
SU
LFA
TE
DIS
CH
AR
GE
,IN
TO
NS
PE
R D
AY
ST
ON
YC
RE
EK
RIV
ER
, 801
RH
OD
ES
CR
EE
K, 8
10
SC
HR
OC
K R
UN
, 811
LAM
BE
RT
S R
UN
, 812
WE
LLS
CR
EE
K, 8
13
BE
AV
ER
DA
M C
RE
EK
, 814
ST
ON
YC
RE
EK
RIV
ER
, 802
OV
EN
RU
N, 8
15
PO
KE
YT
OW
N R
UN
, 837
FA
LLE
N T
IMB
ER
RU
N, 8
16
ST
ON
YC
RE
EK
RIV
ER
, 803
QU
EM
AH
ON
ING
CR
EE
K, 8
17
SH
AD
E C
RE
EK
, 836
ST
ON
YC
RE
EK
RIV
ER
, 804
PA
INT
CR
EE
K, 8
30
BE
NS
CR
EE
K, 8
34
ST
ON
YC
RE
EK
RIV
ER
, 805
SITES, IN DOWNSTREAM ORDER FROM LEFT TO RIGHT
MAINSTEM
1,800 2,000 3,500
DOWNSTREAM TREND AT MAINSTEM SITES
MAINSTEM SITE
TRIBUTARY SITE

41
EFFECTS OF COAL-MINE DISCHARGE ON THE QUALITYOF STONYCREEK RIVER AND ITS TRIBUTARIES
Coal-mine discharges affected surface-water quality throughout all of Appalachia. AMD continuesto flow from some underground mines and coal refuse piles that are already a century old. In 1967, theFederal Water Pollution Control Administration (U. S. Department of the Interior, 1967) estimated that78 percent of Appalachia’s mine-drainage problems were from inactive and abandoned mines and coalrefuse piles. However, with the enactment of the Surface Mining Control and Reclamation Act of 1977 andthe establishment of effluent limitations for coal mining (Code of Federal Regulations, 1994), the totalstream miles affected by mine drainage have decreased and inactive and abandoned mine sites nowaccount for 99 percent of AMD problems in streams (Kleinman and others, 1988). This assessment isprobably accurate for streams in the Stonycreek River Basin because effluents from all active miningoperations must meet current effluent limitations (table 1).
When mine spoils containing sulfides are exposed to air and water, the sulfide minerals are oxidizedby a series of microbial and chemical processes. The products of these reactions are carried into surfacewaters where they degrade water quality via acidification, metal contamination, and sedimentation. AMDwaters are characterized by high metal and sulfate concentrations, high conductivity, and low pH (Mills,1985).
Physical properties and chemical constituents varied during low-base flow on tributary streams andmainstem sites in the Stonycreek River Basin (figs. 15-18). Mine drainage flowing into a stream will affectmost of those constituents. However, because of various physical and chemical processes such asprecipitation, neutralization, and adsorption, changes in concentrations of stream constituents can occurthat are not related to mine drainage. Sulfate is not affected by neutralization and precipitation processesand therefore, sulfate concentrations and discharges can be used as a reliable indicator of mine drainage instreams (Tolar, 1982, p.8). Bencala and others (1987) found that sulfate was an excellent conservative tracerof AMD in a stream system in Colorado. Very few processes act to remove sulfate from solution in streamwater. The concentration of sulfate in streams depends on the amount produced at the source (a minedischarge) and the subsequent dilution in the stream. Dilution depends on streamflow, which can varywith factors such as precipitation and drainage area. Because of the dilution factor, sulfate concentrationscannot be compared from stream to stream as a reliable index of mine drainage. However, the resultantsulfate discharges can be compared from stream to stream or within a stream as a reliable indicator ofmine drainage. The measured sulfate discharges of tributary streams and the measured and calculatedsulfate discharges of the mainstem sites are shown in figure 19. The calculated mainstem discharges weredetermined by adding the upstream mainstem discharge with the measured downstream tributarydischarges to determine the next mainstem discharge. For example, the sulfate discharge measured atmainstem site 801 (6 ton/d) was added to the discharges from tributary site 810 (2 ton/d), tributary site811 (3 ton/d), tributary site 812 (19 ton/d), tributary site 813 (3 ton/d), and tributary site 814 (1 ton/d) toarrive at a calculated sulfate discharge of 34 ton/d at mainstem site 802. The measured sulfate discharge atmainstem site 802 was 26 ton/d. A good correlation between the measured mainstem sulfate dischargesand the calculated sulfate discharges is shown in figure 19. The calculated sulfate discharges at mainstemsites 803-805 were less than the measured discharges because sulfate discharges from some minedischarges that flow directly into the Stonycreek River were not measured. Sulfate discharges from ShadeCreek (site 836) (44 ton/d) and Paint Creek (site 830) (26 ton/d) had the largest effect on sulfate dischargesin the Stonycreek River.
Water-quality analyses from five mine discharges and the receiving streams above and below themine discharges are presented in table 13. The water quality at mine-discharge site 14 did not affect DarkShade Creek, primarily because that section of Dark Shade Creek was already severely affected by minedrainage.

42
Figure 19. Measured total sulfate discharges in tributary streams and measured and calculated total sulfatedischarges in the mainstem of the Stonycreek River on July 27 and 28, 1993.
0
170
0
10
20
30
40
50
60
70
80
90
100
110
120
130
140
150
160
SU
LFA
TE
DIS
CH
AR
GE
, IN
TO
NS
PE
R D
AY
ST
ON
YC
RE
EK
RIV
ER
, 801
RH
OD
ES
CR
EE
K, 8
10
SC
HR
OC
K R
UN
, 811
LAM
BE
RT
S R
UN
, 812
WE
LLS
CR
EE
K, 8
13
BE
AV
ER
DA
M C
RE
EK
, 814
ST
ON
YC
RE
EK
RIV
ER
, 802
OV
EN
RU
N, 8
15
PO
KE
YT
OW
N R
UN
, 837
FA
LLE
N T
IMB
ER
RU
N, 8
16
ST
ON
YC
RE
EK
RIV
ER
, 803
QU
EM
AH
ON
ING
CR
EE
K, 8
17
SH
AD
E C
RE
EK
, 836
ST
ON
YC
RE
EK
RIV
ER
, 804
PA
INT
CR
EE
K, 8
30
BE
NS
CR
EE
K, 8
34
ST
ON
YC
RE
EK
RIV
ER
, 805
SITES, IN DOWNSTREAM ORDER FROM LEFT TO RIGHT
MA
INS
TEM
(ME
AS
UR
ED
)
MA
INS
TEM
(CA
LCU
LATE
D)
DOWNSTREAM TREND AT MAINSTEM SITES
MAINSTEM SITE
TRIBUTARY SITE

43
Table 13. Water-quality data for five coal-mine discharges and the receiving streams
[µg/L, microgram per liter; mg/L, milligram per liter]
Site
Discharge,instantaneous
(cubic feetper second)
pH(units)
Iron,total(µg/Las Fe
Manganese,total(µg/L
as Mn)
Alkalinity(mg/L asCaCO3)
Acidity,total
heated(mg/L asCaCO3)
Sulfate,total
(mg/Las SO4)
October 6, 1992
Dark Shade Creek above site 14 15.2 3.9 21,200 2,620 0 84 334Site 14 1.51 3.7 1,980 6,860 0 100 678Dark Shade Creek below site 14 17.5 3.9 19,200 2,910 0 82 342
October 6, 1992
Laurel Run above site 15 3.60 5.4 358 338 2.0 16 24Site 15 .12 3.5 57,400 13,300 0 230 799Laurel Run below site 15 4.30 4.9 1,840 695 2.0 22 45
September 8, 1993
South Fork Bens Creek above site 178 1.68 7.4 681 454 46 0 89Site 178 2.14 6.5 3,460 484 162 0 606South Fork Bens Creek below site 178 3.82 6.8 2,650 468 110 0 344
September 9, 1993
Wells Creek above site 17 1.22 7.2 199 462 26 0 233Site 17 .32 3.4 1,860 1,740 0 58 499Wells Creek below site 17 1.54 6.4 804 742 12 0 243
May 12, 1994
Wells Creek above site 17 19.1 6.8 1,050 303 11 0 83Site 17 2.34 3.7 908 762 0 30 226Wells Creek below site 17 21.4 6.4 1,030 358 7.4 .8 90
September 9, 1993
Wells Creek above site 22 1.52 6.3 806 752 10 3.6 243Site 22 .30 2.9 24,400 7,410 0 174 880Wells Creek below site 22 1.82 3.9 5,160 1,930 0 32 406
May 12, 1994
Wells Creek above site 22 23.4 6.4 1,330 378 7.4 4.4 91Site 22 2.47 3.4 9,280 3,740 0 82 399Wells Creek below site 22 25.8 5.3 2,240 733 2.2 6.2 115

44
Mine discharge 15 did affect Laurel Run even though the flow of the mine discharge was only3 percent of the flow in Laurel Run. Concentrations of total iron, total manganese, total sulfate, and acidityincreased and pH decreased.
Mine discharge 178 is a treated mine discharge that had a significant effect on the South Fork BensCreek. One positive effect was the addition of alkalinity to the stream. The discharge accounted for56 percent of the streamflow in South Fork Bens Creek.
Mine discharges 17 and 22 flow into Wells Creek and were sampled during low- and high-base flow.Mine discharge 22 enters Wells Creek about 900 ft downstream from where site 17 enters Wells Creek.These two discharges significantly affect the water quality of Wells Creek at both low- and high-base flow(table 13). Figure 20 graphically shows how these two mine discharges affect Wells Creek during low-baseflow. The pH in Wells Creek decreased from 7.2 to 3.9. Stream alkalinity was completely depleted by theacidity of the two mine discharges. Sulfate discharges increased from 0.76 to 2.0 ton/d. Discharges of totaliron increased from 1.3 to 51 lb/d. Plots of the data from sites 17 and 22 collected on May 12, 1994 (notshown), show that the two mine discharges had a similar effect on Wells Creek during high-base flow as isshown on figure 20 for low-base flow. The discharges and concentrations were different, but the trendswere similar. The PI in Appendix 4 shows that sites 17 and 22 are ranked 28th and 7th, respectively, formine-discharge remediation in the Stonycreek River Basin. The PI in table 8 shows that sites 17 and 22 areranked second and first, respectively, for mine-discharge remediation in the Wells Creek Basin.
Surface-water-quality data collected from the mouth of Oven Run (site 815) and Pokeytown Run(site 837) and from the Stonycreek River above and below where each of those runs flow into the river aregiven in table 14. Oven Run flows into the Stonycreek River near the town of Rowena. Pokeytown Runflows into the Stonycreek River approximately 0.5 mi downstream from the Oven Run inflow. Both OvenRun and Pokeytown Run are severely affected by AMD, and each significantly deteriorates StonycreekRiver water quality. The Oven Run outflow is the first source of highly degraded water from AMD into theStonycreek River. Both have many mine discharges but a major discharge in each basin is responsible formost of the AMD in the two streams. Mine discharge site 3 has a significant effect on Oven Run, and minedischarge site 4 has a similar effect on Pokeytown Run. Mine discharges 3 and 4 ranked 8th and 5th,respectively, on the PI for the Stonycreek River Basin (Appendix 4). The flows at mine-discharge sites 3and 4 on August 18, 1993, were 0.23 and 0.20 ft3/s, respectively. The streamflows in Oven Run andPokeytown Run on September 8, 1993, at low-base flow were 0.56 and 0.41 ft3/s, respectively. If thedischarges at the mine-discharge sites and the streamflow in the streams were similar on both days, mine-discharge site 3 accounted for 41 percent of the streamflow in Oven Run and mine-discharge site 4accounted for 49 percent of the streamflow in Pokeytown Run.
Table 14. Water-quality data collected on September 8, 1993, for Oven Run, Pokeytown Run, and the StonycreekRiver above and below where each of the runs flows into the river
[µg/L, microgram per liter; mg/L, milligram per liter]
Site
Discharge,instantaneous
(cubic feetper second)
pH(units)
Iron,total(µg/Las Fe
Manganese,total(µg/L
as Mn)
Alkalinity(mg/L asCaCO3)
Acidity,total
heated(mg/L asCaCO3)
Sulfate,total
(mg/Las SO4)
Stonycreek River above Oven Run 17.4 7.6 309 296 42 0 382Oven Run .56 2.8 15,900 28,000 0 354 1,390Stonycreek River below Oven Run 18.0 7.2 769 1,310 38 0 415Stonycreek River above Pokeytown Run 23.0 6.3 599 1,410 32 0 472Pokeytown Run .41 2.7 490,000 13,600 0 2,180 4,120Stonycreek River below Pokeytown Run 23.4 5.1 14,000 1,860 2 50 644

45
Figure 20. The effects of mine discharges 17 and 22 on Wells Creek onSeptember 9,1993.
2
8
2
4
6P
H, I
N U
NIT
S
0
200
0
50
100
150
ALK
ALI
NIT
Y D
ISC
HA
RG
E,
IN P
OU
ND
S P
ER
DA
Y
0
3
0
1
2
SU
LFA
TE
DIS
CH
AR
GE
,IN
TO
NS
PE
R D
AY
0
60
0
20
40
IRO
N D
ISC
HA
RG
E,
IN P
OU
ND
S P
ER
DA
Y
WE
LLS
CR
EE
K,
SIT
E 1
7
WE
LLS
CR
EE
K,
WE
LLS
CR
EE
K,
SIT
E 2
2
WE
LLS
CR
EE
K,
SITES, IN DOWNSTREAM ORDER FROM LEFT TO RIGHT
MAINSTEM
AB
OV
E S
ITE
17
BE
LOW
SIT
E 1
7
AB
OV
E S
ITE
22
BE
LOW
SIT
E 2
2
DOWNSTREAM TREND IN WELLS CREEK
WELLS CREEK SITES
MINE DISCHARGE SITE

46
The pH in the Stonycreek River decreased from 7.6 above Oven Run to 5.1 below Pokeytown Run(fig. 21). The alkalinity in the Stonycreek River was adequate to neutralize the acidity from Oven Run, butthe large acidity discharges from Pokeytown Run almost eliminated the available alkalinity in the river.Alkalinity in the Stonycreek River decreased from 42 mg/L above Oven Run to 2 mg/L below PokeytownRun. Sulfate discharges in the Stonycreek River were 18 ton/d above Oven Run and 41 ton/d belowPokeytown Run. Total-iron discharges increased slightly in the Stonycreek River from the Oven Runinflow, but dramatically increased in the river because of the Pokeytown Run inflow. Total-iron dischargesincreased from 29 lb/d above Oven Run to 1,770 lb/d below Pokeytown Run.
The U.S. Department of Agriculture, Natural Resources Conservation Service, in cooperation withthe Somerset Conservation District, the Somerset County Commissioners, and SCRIP as a supportingsponsor, plans to design and construct passive-treatment systems for the remediation of mine dischargesin the Oven Run and Pokeytown Run Basins. A watershed plan includes six specific mine-drainageabatement projects. The design phase for the projects will be from 1994 to 1997, and the construction phasewill be from 1995 to 1998. Preliminary plans suggest that SAPS, settling ponds, and chambered passive-treatment-wetlands that use composted mushroom spoil and cattails will be used to treat the minedischarges. The treatment measures are expected to improve the water quality in the Stonycreek River in a4-mi reach from Oven Run to the Borough of Hooversville. Residents in the borough of Hooversville andsurrounding areas will benefit from this project because the Hooversville Water Authority obtains itswater supply from the Stonycreek River.
The effects of Oven Run and Pokeytown Run on the water quality of the Stonycreek River are shownin figures 15-19 and figure 21. Shade Creek and Paint Creek had an even greater effect on the water qualityin the Stonycreek River (figs. 15-19) and these two streams contribute more acid mine-affected water to theStonycreek River than any other tributaries in the Stonycreek River Basin. The Shade Creek and PaintCreek Basins have been heavily mined and have many abandoned-mine discharges. Water-resoucemanagers are considering remediation action in these two basins after the completion of the remediationwork in the Oven Run and Pokeytown Run Basins.

47
Figure 21. The effects of Oven Run and Pokeytown Run on the Stonycreek River onSeptember 8, 1993.
2
8
2
4
6P
H, I
N U
NIT
S
0
3
0
1
2
ALK
ALI
NIT
Y D
ISC
HA
RG
E,
IN T
ON
S P
ER
DA
Y
0
60
0
20
40
SU
LFA
TE
DIS
CH
AR
GE
,IN
TO
NS
PE
R D
AY
0
2,000
0
500
1,000
1,500
IRO
N D
ISC
HA
RG
E,
IN P
OU
ND
S P
ER
DA
Y
ST
ON
YC
RE
EK
RIV
ER
OV
EN
RU
N
ST
ON
YC
RE
EK
RIV
ER
ST
ON
YC
RE
EK
RIV
ER
PO
KE
YT
OW
N R
UN
ST
ON
YC
RE
EK
RIV
ER
SITES, IN DOWNSTREAM ORDER FROM LEFT TO RIGHT
MAINSTEM
AB
OV
E O
VE
N R
UN
BE
LOW
OV
EN
RU
N
AB
OV
E P
OK
EY
TO
WN
RU
N
BE
LOW
PO
KE
YT
OW
N R
UN
DOWNSTREAM TREND AT MAINSTEM SITES
MAINSTEM SITE
TRIBUTARY SITE
48
SUMMARY
The Stonycreek River Basin drains an area 468 mi2 in Somerset and Cambria Counties insouthwestern Pennsylvania. Fourteen different coal beds throughout the basin are of mineable thickness,however, the Lower and Upper Kittanning and the Upper Freeport coals are the three coal beds that havebeen most extensively mined. Commercial mining of the coal resources began in the late 1800’s withalmost no concern for the protection of the land surface or water resources. Consequently, the waterquality of the Stonycreek River and its tributaries has been severely degraded for many decades by acidiccoal-mine drainage. From October 1991 through November 1994, the USGS, in cooperation with theSomerset Conservation District, conducted an investigation throughout the Stonycreek River Basin tolocate and sample abandoned mine discharges, to prioritize the discharges for remediation, and todetermine the effects of the mine discharges on the water quality of the Stonycreek River and its majortributaries. The location of the 270 mine discharges that were sampled were determined by use of a GPSreceiver with a horizontal accuracy of 3 to 10 ft.
The water quality of the mine discharges varied considerably from discharges that were extremelyacidic with high concentrations of iron, manganese, aluminum, and sulfate to discharges whose waterquality met USEPA drinking water standards for most constituents. Of the 270 mine discharges sampled,193 discharges exceeded effluent standards for pH, 122 discharges exceeded effluent standards for total-iron concentration, and 141 discharges exceeded effluent standards for total-manganese concentration.Ninety-four mine discharges exceeded effluent standards for pH and concentrations of total iron and totalmanganese; 38 mine discharges met effluent standards for all three constituents. Secondary drinking waterstandards for pH, iron, manganese, aluminum, and fluoride were met at five mine discharges.
Streamflow was an important factor when determining the contaminant discharges of the minedischarges. Mine discharge at site 20 contained a total-iron concentration of 4,760 mg/L, highest of all 270mine discharges, but a streamflow of only 0.7 gal/min ranked it 26th of all 270 discharges with respect tototal-iron discharge. The mine discharges that contained high concentrations of contaminants in additionto large streamflows were the discharges that contributed most of the contaminant discharges to thereceiving streams.
A primary goal of the Stonycreek River Basin study was to develop a system that would prioritizeall mine discharges for remediation. A PI was developed that ranked the severity of each mine dischargeby use of seven specific constituents. The constituents included pH, streamflow, and discharges of totaliron, total manganese, total heated acidity, total sulfate, and dissolved aluminum. The PI can be used bywater-resource managers as a guide to determine which mine discharges have the greatest effect onstream-water quality and should be considered for remediation. A PI was developed for all minedischarges throughout the Stonycreek River Basin and for mine discharges in six subbasins that weremoderately to severely effected by mine drainage. The subbasins were the Shade Creek, Paint Creek, WellsCreek, Quemahoning Creek, Oven Run, and Pokeytown Run Basins.
Water-resource managers propose to remediate the abandoned mine discharges by constructingpassive-treatment systems that include aerobic wetlands, compost wetlands, and ALD’s. Each of the threepassive technologies is most appropriate for a particular type of mine water, but commonly, they are mosteffectively used in combination with each other. For mine discharges that are extremely acidic (acidityconcentration greater than 300 mg/L as CaCO3) with high concentrations of ferric iron (concentrationsgreater than 1.0 mg/L), the use of a SAPS would be most effective in treating the AMD. A SAPS combinesALD technology with the sulfate reduction mechanism of the compost wetland. A series of SAPS iscommonly necessary until the AMD either meets effluent criteria or the limit of the area available fortreatment is reached.

49
A network of 37 surface-water sampling sites was established to identify stream water qualityduring base flow. Water samples collected on July 27 and 28, 1993, are used to describe base-flow qualitythroughout the basin. From mainstem site 801 to mainstem site 805, water-quality degradation occurredthat is attributed to the inflows of acidic mine discharges from affected tributaries in addition to inflows ofmine discharges directly into the river. Shade Creek, Paint Creek, Oven Run, and Pokeytown Run aretributaries that significantly affect river water quality. From mainstem site 801 to 805, pH decreased from6.8 to 4.2, alkalinity was completely depleted, and discharges of total iron increased from 30 to 684 lb/d.Very large discharges of manganese entered the mainstem from Shade Creek and Paint Creek. Manganeseoxidation reactions and precipitation are strongly affected by pH and are very slow below pH 8.5. Themanganese entering the mainstem from the tributary streams did not precipitate and had an additiveaffect on mainstem discharges. The attenuation of sulfate concentrations from mainstem sites 803 to 805 isbecause of dilution, but the significant increase in sulfate discharges from sites 803 to 805 is the result ofincreased streamflow. A good correlation existed between the measured mainstem sulfate discharges andthe calculated mainstem sulfate discharges. The sulfate discharges were calculated by adding the sulfatedischarges of the previous upstream mainstem site to the sulfate discharges of all sampled tributarystreams entering the river between the two mainstem sites.
Mine discharges 17 and 22 had a major effect on the water quality of Wells Creek. Mine discharge 22enters Wells Creek about 900 ft downstream from where mine discharge 17 enters Wells Creek. Datacollected in Wells Creek above mine discharge 17 inflow and below mine discharge 22 inflow onSeptember 9, 1993, show that pH decreased from 7.2 to 3.9, stream alkalinity was completely depleted bythe two mine discharge acidities, sulfate discharges increased from 0.76 to 2.0 ton/d, and total-irondischarges increased from 1.3 to 51 lb/d. The PI for mine discharges 17 and 22 rank them 28th and 7th,respectively, for mine-discharge remediation in the Stonycreek River Basin. Oven Run and PokeytownRun had a similar effect on the water quality of the Stonycreek River. Both streams are significantlyaffected by AMD and are the first major sources of AMD flowing into the Stonycreek River. ThePokeytown Run inflow is about 0.5 mi downstream from the Oven Run inflow. Both basins contain manymine discharges, but one major discharge in each basin is responsible for much of the AMD in each stream.Mine discharge at site 3 has a large effect on Oven Run, and mine discharge at site 4 has a similar effect onPokeytown Run. Mine discharges at sites 3 and 4 ranked 8th and 4th, respectively, on the PI for theStonycreek River Basin. Data collected in the Stonycreek River above Oven Run and below PokeytownRun during low-base flow on September 8, 1993, show a decrease in pH from 7.6 to 5.1, a decrease inalkalinity from 42 to 2 mg/L, an increase in sulfate discharges from 18 to 41 ton/d, and an increase intotal-iron discharges from 29 to 1,770 lb/d. The U.S. Department of Agriculture, Natural ResourcesConservation Service, in cooperation with the Somerset Conservation District, the Somerset CountyCommissioners, and SCRIP as a supporting sponsor, plans to design and construct passive-treatmentsystems for the remediation of mine discharges in the Oven Run and Pokeytown Run Basins. The designphase for the projects will occur during 1994-97, and the construction phase will occur during 1995-98.

REFERENCES CITED
50
Anderson, J.R., 1967, Major land uses in the United States, in U.S. Geological Survey, 1970, National atlasof the United States of America: Washington, D.C., U.S. Geological Survey, p. 158-159.
Aulenbach, B.T., Hooper, R.P., and Bricker, O.P., 1996, Trends in the chemistry of precipitation and surfacewater in a national network of small watersheds: Hydrological processes.
Barker, J.L., and Witt III, E.C., 1990 , Effects of acidic precipitation on the water quality of streams in theLaurel Hill area, Somerset County, Pennsylvania, 1983-86: U.S. Geological Survey Water-ResourcesInvestigations Report 89-4113, 72 p.
Bencala, K.E., McKnight, D.M., and Zellweger, G.W., 1987, Evaluation of natural tracers in an acidic andmetal rich stream: Water Resources Research, v. 23, no. 5, p. 827-836.
Berg, T.M., Barnes, J.H., Sevon, W.D., Skema, V.W., Wilshusen, J.P., and Yannacci, D.S., 1989, Physiographicprovinces of Pennsylvania: Pennsylvania Geological Survey, 4th ser., Map 13, 1 p.
Berg, T.M., Edmunds, W.E., Geyer, A.R., and others, comps., 1980, Geologic map of Pennsylvania:Pennsylvania Geological Survey, 4th ser., Map 1, scale 1:250,000, 3 sheets.
Biesecker, J.E., and George, J.R., 1966, Stream quality in Appalachia as related to coal-mine drainage, 1965:U.S. Geological Survey Circular 526, 27 p., 1 pl.
Carson Engineers, 1974, Operation Scarlift, Stony Creek Mine Drainage Pollution Abatement Project,SL-179.
Code of Federal Regulations, 1994, Title 40, Part 434, Section 22.
Driscoll, C.T., Baker, J.P., Bisogni, J.J., Jr., and Schofield, C.L., 1980, Effect of aluminum speciation on fish indilute acidified water: Nature, v. 284, p. 161-164.
Fishman, M.J., and Friedman, L.C., eds., 1989, Methods for determination of inorganic substances in waterand fluvial sediments: U.S. Geological Survey Techniques of Water Resources Investigations, book5, chap. A1, 545 p.
Hedin, R.S., and Narin, R.W., 1992, Designing and sizing passive mine drainage treatment systems, inProceedings, Thirteenth annual West Virginia surface mine drainage task force symposium:Morgantown, W. Va., 11 p.
_____1993, Contaminant removal capabilities of wetlands constructed to treat coal mine drainage, in G.A.Moshiri, ed., Constructed wetlands for water quality improvement: Boca Raton, Fla., LewisPublishers, p. 187-195.
Hedin, R.S., Narin, R.W., and Kleinmann, R.L.P., 1994, Passive treatment of coal mine drainage:U.S. Bureau of Mines Information Circular 9389, 35 p.
Herb, W.J., Shaw, L.C., and Brown, D.E., 1981, Hydrology of area 3, eastern coal province, Pennsylvania:U.S. Geological Survey Water-Resources Investigations Report 81-537, 88 p.
Kepler, D.A., and McCleary, E.C., 1994, Successive alkalinity-producing systems (SAPS) for the treatmentof acid mine drainage: International Land Reclamation and Mine Drainage Conference and ThirdInternational Conference on the Abatement of Acidic Drainage [Proceedings], v. 1, Mine Drainage,p. 195-204.

REFERENCES CITED—Continued
51
Kleinmann, R.L.P., 1989, Acid Mine Drainage: Engineering Mining Journal, v. 190, p. 16I-16N.
Kleinmann, R.L.P., Jones, J.R., and Erickson, P.M., 1988, An assessment of the coal mine drainageproblem: 10th Annual Conference of the Association of Abandoned Mine Land Programs,Pennsylvania Bureau of Abandoned Mine Lands Reclamation {Proceedings}, p. 1-9.
Mills, A.L., 1985, Soil Reclamation Processes, in Klein, D., Tate, R.L., eds.: New York, Marcel Dekker, Inc.,p. 35-81.
Nairn, R.W., Hedin, R.S., and Watzlaf, G.R., 1991, A preliminary review of the use of anoxic limestonedrains in the passive treatment of acid mine drainage, in 12th Annual West Virginia Surface MineDrainage Task Force Symposium: West Virginia University [Proceedings], 15 p.
Office of Surface Mining Reclamation and Enforcement, 1993, Surface mining control and reclamation actof 1977: Public law 95-87, 239 p.
Pennsylvania Coal Association, Pennsylvania Coal Data 1994, table 16.
Pennsylvania Department of Environmental Resources, 1994a, Methods manual: [Harrisburg, Pa.],Bureau of Laboratories, v. 1, [n.p.].
_____1994b, Commonwealth of Pennsylvania 1994 water quality assessment: Harrisburg, Pa., 186 p.
Rantz, S.E., and others, 1982, Measurement and computation of streamflow, vol. 1 and 2: U.S. GeologicalSurvey Water-Supply Paper 2175, 631 p.
Toler, L.G., 1982, Some chemical characteristics of mine drainage in Illinois: U.S. Geological SurveyWater-Supply Paper 1078, 47 p.
U.S. Army Corps of Engineers, 1993, Johnstown, Pennsylvania local flood protection project,reconnaissance report on water and sediment quality and aquatic life resources pertinent torehabilitation of the flood reduction channel: Pittsburgh District, 67 p.
_____1994, Conemaugh River Basin Pennsylvania, Reconnaissance Study: Pittsburgh District, 67 p.
U.S. Department of the Interior, 1967, Stream pollution by coal mine drainage in Appalachia: FederalWater Pollution Control Administration, prepared in 1967 and revised in 1969, 261 p.
_____1968, Stream pollution by coal mine drainage upper Ohio River Basin: Federal Water PollutionControl Administration, p. 110.
U.S. Environmental Protection Agency, 1971, Water supply and water quality control study, ConemaughRiver Basin, Pennsylvania: Wheeling Field Office.
_____1972, Cooperative mine drainage survey, Kiskiminetas River Basin: Wheeling Field Office,p. 251-313.
_____1994, Drinking water regulations and health advisories: Washington, D.C., Office of Water, 11 p.
U.S. Geological Survey, 1976-81, Water resources data for Pennsylvania, v. 3, Ohio River and St. LawrenceRiver Basins: U.S. Geological Survey Water-Data Reports PA 76-3 to PA 81-3 (published annually).

REFERENCES CITED—Continued
52
Ward, J.R., and Harr, C.A., eds., 1990, Methods for collection and processing of surface-water and bed-material samples for physical and chemical analyses: U.S. Geological Survey Open-File Report90-140, 71 p.
Witt III, E.C., 1991, Water-resources data for North Fork Bens Creek, Somerset County, Pennsylvania,August 1983 through September 1988: U.S. Geological Survey Open-File Report 89-584, 61 p.

REFERENCES CITED—Continued
53
APPENDIXES
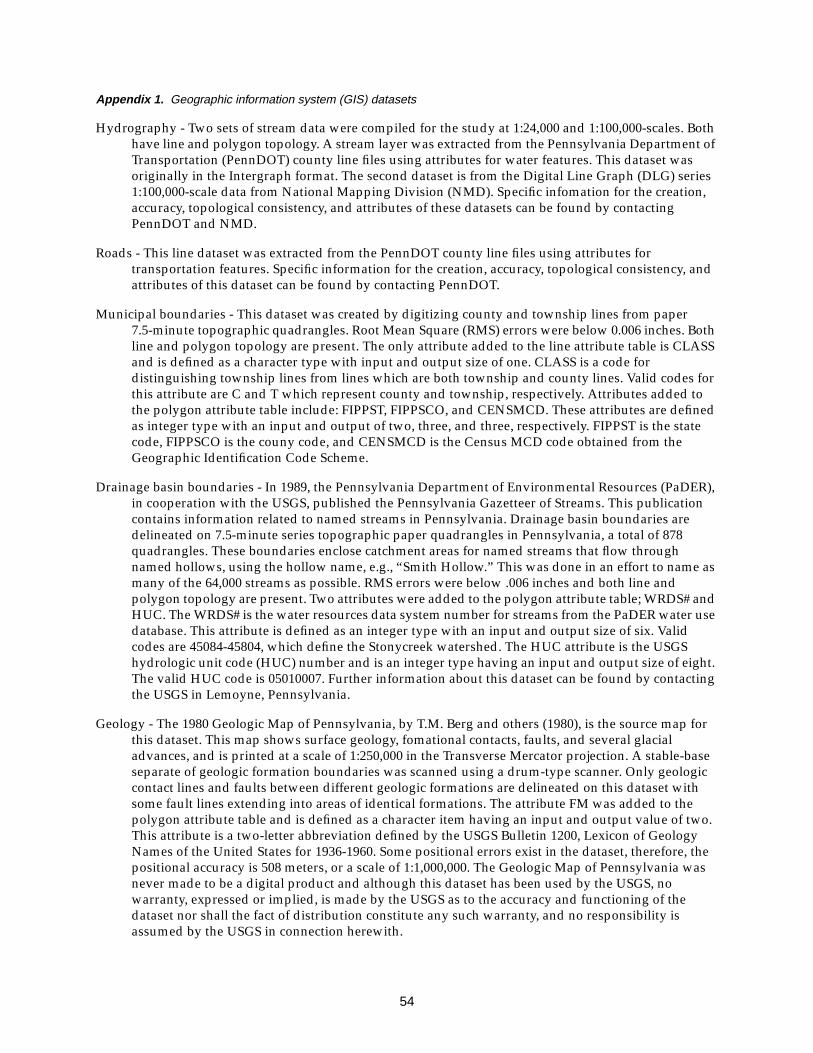
54
Appendix 1. Geographic information system (GIS) datasets
Hydrography - Two sets of stream data were compiled for the study at 1:24,000 and 1:100,000-scales. Bothhave line and polygon topology. A stream layer was extracted from the Pennsylvania Department ofTransportation (PennDOT) county line files using attributes for water features. This dataset wasoriginally in the Intergraph format. The second dataset is from the Digital Line Graph (DLG) series1:100,000-scale data from National Mapping Division (NMD). Specific infomation for the creation,accuracy, topological consistency, and attributes of these datasets can be found by contactingPennDOT and NMD.
Roads - This line dataset was extracted from the PennDOT county line files using attributes fortransportation features. Specific information for the creation, accuracy, topological consistency, andattributes of this dataset can be found by contacting PennDOT.
Municipal boundaries - This dataset was created by digitizing county and township lines from paper7.5-minute topographic quadrangles. Root Mean Square (RMS) errors were below 0.006 inches. Bothline and polygon topology are present. The only attribute added to the line attribute table is CLASSand is defined as a character type with input and output size of one. CLASS is a code fordistinguishing township lines from lines which are both township and county lines. Valid codes forthis attribute are C and T which represent county and township, respectively. Attributes added tothe polygon attribute table include: FIPPST, FIPPSCO, and CENSMCD. These attributes are definedas integer type with an input and output of two, three, and three, respectively. FIPPST is the statecode, FIPPSCO is the couny code, and CENSMCD is the Census MCD code obtained from theGeographic Identification Code Scheme.
Drainage basin boundaries - In 1989, the Pennsylvania Department of Environmental Resources (PaDER),in cooperation with the USGS, published the Pennsylvania Gazetteer of Streams. This publicationcontains information related to named streams in Pennsylvania. Drainage basin boundaries aredelineated on 7.5-minute series topographic paper quadrangles in Pennsylvania, a total of 878quadrangles. These boundaries enclose catchment areas for named streams that flow throughnamed hollows, using the hollow name, e.g., “Smith Hollow.” This was done in an effort to name asmany of the 64,000 streams as possible. RMS errors were below .006 inches and both line andpolygon topology are present. Two attributes were added to the polygon attribute table; WRDS# andHUC. The WRDS# is the water resources data system number for streams from the PaDER water usedatabase. This attribute is defined as an integer type with an input and output size of six. Validcodes are 45084-45804, which define the Stonycreek watershed. The HUC attribute is the USGShydrologic unit code (HUC) number and is an integer type having an input and output size of eight.The valid HUC code is 05010007. Further information about this dataset can be found by contactingthe USGS in Lemoyne, Pennsylvania.
Geology - The 1980 Geologic Map of Pennsylvania, by T.M. Berg and others (1980), is the source map forthis dataset. This map shows surface geology, fomational contacts, faults, and several glacialadvances, and is printed at a scale of 1:250,000 in the Transverse Mercator projection. A stable-baseseparate of geologic formation boundaries was scanned using a drum-type scanner. Only geologiccontact lines and faults between different geologic formations are delineated on this dataset withsome fault lines extending into areas of identical formations. The attribute FM was added to thepolygon attribute table and is defined as a character item having an input and output value of two.This attribute is a two-letter abbreviation defined by the USGS Bulletin 1200, Lexicon of GeologyNames of the United States for 1936-1960. Some positional errors exist in the dataset, therefore, thepositional accuracy is 508 meters, or a scale of 1:1,000,000. The Geologic Map of Pennsylvania wasnever made to be a digital product and although this dataset has been used by the USGS, nowarranty, expressed or implied, is made by the USGS as to the accuracy and functioning of thedataset nor shall the fact of distribution constitute any such warranty, and no responsibility isassumed by the USGS in connection herewith.

55
Land use/land cover - This dataset is a product of NMD and is called the Geographic InformationRetrieval and Analysis System (GIRAS). This dataset has been attributed with the Anderson Level-IIland use/land cover classifications for 1973-1977 and has line and polygon topology. Specificinformation for the creation, accuracy, topological consistency, and attributes of this dataset can befound by contacting NMD.
State game lands - This dataset was created by digitizing state game land lines from paper 7.5-minutetopographic quadrangles. Root Mean Square (RMS) errors were below .006 inches. Both line andpolygon topology are present. Attributes were not added to the dataset.
Special protection waters - Using the existing 1:24,000 and 1:100,000-scale hydrography layers, linearfeatures were manually split and attributes were added to the line attribute tables. The only attributeadded, QUAL, a character type with an input and output value of two, defines the stream reacheswith a special protection code. Valid entries are HQ, for High Quality, and EV, for Exceptional Value.Since the linear topology has been altered, this dataset is a separate layer from the hydrographydatasets. Only line topology is present.
Wetlands - This dataset was created by digitizing 7.5-minute quadrangles delineated with areasdesignated by the U.S. Fish and Wildlife Service (USFWS) for wetlands and combining existing7.5-minute quadrangle datasets already digitized by USFWS into a single layer. Only eight quadswere digitized by USGS: Bakerstown, Boswell, Johnstown, Ogletown, Rachelwood, Somerset,Stoystown, and Windber. RMS errors were below .006 inches. Both line and polygon topology arepresent. Attributes were not added to the line attribute table. Attributes added to the polygonattribute table are MAJOR1 and MINOR1, defined as integers with inputs and outputs of six foreach. Valid codes and definitions are numerous and range in order, but can be obtained from theUSFWS.
Mine discharges - This dataset contains information on all mine discharges sampled from April 1992through November 1994 throughout the Stonycreek River Basin. Only point topology is present inthe dataset. The point location was determined in the field using a Global Positioning System (GPS)receiver with differential correction from base station data. Attributes added to the dataset include:PRI_SCORE, PRI_RANK, and PRI_INDEX. These numeric values were determined by a programdesigned to prioritize the mine discharge sites for remediation based on comparative water qualitydata.
Surface-water-quality data - This dataset contains information on surface-water sites sampled on themainstem of the Stonycreek River and major tributaries. Only point topology is present. Thelocations of the sites were determined from paper 7.5-minute topographic quadrangles. Attributesinclude all water quality data collected during the investigation.
Ground water site inventory (GWSI) data - The GWSI data for the Stonycreek River drainage system wasretrieved from the GWSI database and imported to ARC/INFO. The dataset contains pointinformation only, neither line nor polygon topology are present.
Pennsylvania water well inventory (PWWI) data - The PWWI data for the Stonycreek River drainagesystem was retrieved from the PWWI database and imported to ARC/INFO. The dataset containspoint information only, neither line nor polygon topology are present.
DEM - DEM data for the project area were obtained from the NMD and clipped to the basin boundary.Specific information regarding the DEM data can be obtained by contacting NMD.

56
Appendix 2. Location coordinates and station numbers forsampled mine discharges in the Stonycreek River Basin
Sitenumber
USGStopographicquadrangle
Latitude LongitudeStationnumber
1 Hooversville 400731.1 785504.8 4007310785505012 Hooversville 400734.6 785516.2 4007350785516013 Stoystown 400648.0 785441.9 4006480785442014 Hooversville 400749.4 785522.1 4007490785522015 Hooversville 400900.0 785425.6 4009000785426016 Hooversville 400849.0 785318.6 4008490785319017 Hooversville 400930.2 785439.4 4009300785439018 Hooversville 400927.4 785441.3 4009270785441019 Somerset 400105.3 790046.4 400105079004601
10 Somerset 400121.8 790039.5 40012207900400111 Somerset 400124.1 790041.8 40012407900420112 Central City 400103.7 785056.0 40010407850560113 Central City 400028.9 785112.4 40002907851120114 Central City 400718.8 784824.7 40071907848250115 Central City 400702.0 784809.6 40070207848100116 Central City 400626.4 784816.3 40062607848160117 Stoystown 400159.1 785947.7 40015907859480118 Stoystown 400222.7 785928.5 40022207859280119 Central City 400648.1 784847.3 40064807848470120 Central City 400522.7 784756.4 40052307847560121 Stoystown 400416.1 785332.5 40041607853320122 Stoystown 400208.3 785927.8 40020807859280123 Stoystown 400125.9 785823.9 40012607858240124 Stoystown 400525.0 785450.8 40052507854510125 Stoystown 400412.9 785449.6 40041307854500126 Stoystown 400357.0 785337.1 40035707853370127 Central City 400308.8 784744.2 40030907847440128 Windber 401242.9 784924.5 40124307849240129 Windber 401301.9 784945.0 40130207849450130 Windber 401218.9 784924.4 40121907849240131 Windber 401221.3 784929.0 40122107849290132 Windber 401420.2 785125.5 40142007851260133 Windber 401428.8 785132.6 40142907851330134 Stoystown 400704.8 785358.2 40070507853580135 Stoystown 400718.1 785343.1 40071807853430136 Stoystown 400653.1 785530.0 40065307855300137 Central City 400714.3 785034.8 40071407850350138 Central City 400407.1 784814.6 40040707848150139 Windber 400737.0 785125.3 40073707851250140 Windber 400920.1 784914.4 40092007849140141 Windber 400944.2 784914.7 40094407849150142 Windber 401038.9 784936.6 40103907849370143 Windber 401044.4 785008.5 40104407850090144 Windber 401413.3 784824.2 40141307848240145 Ogletown 401402.5 784356.8 401402078435701

57
46 Ogletown 401417.9 784408.0 40141807844080147 Hooversville 400906.2 785945.5 40090607859460148 Hooversville 400903.2 785926.8 40090307859270149 Hooversville 400823.5 785612.7 40082407856130150 Hooversville 400819.0 785539.9 40081907855400151 Somerset 400537.4 790130.9 40053707901310152 Boswell 400815.9 790337.7 40081607903380153 Boswell 400820.9 790332.5 40082107903330154 Boswell 400733.3 790646.5 40073307906460155 Berlin 395750.9 785240.1 39575107852400156 Berlin 395751.7 785238.0 39575207852380157 Berlin 395745.3 785242.9 39574507852430158 New Baltimore 395817.3 785217.2 39581707852170159 Stoystown 400528.5 785450.4 40052807854500160 Stoystown 400532.0 785449.4 40053207854490161 Stoystown 400059.8 785524.8 40010007855250162 Stoystown 400029.6 785624.0 40003007856240163 Stoystown 400019.8 785604.8 40002007856050164 Stoystown 400118.8 785512.3 40011907855120165 Stoystown 400130.0 785451.4 40013007854510166 Stoystown 400122.7 785502.5 40012307855020167 Stoystown 400553.4 785634.2 40055307856340168 Stoystown 400540.2 785554.2 40054007855540169 Stoystown 400500.2 785555.2 40050007855550170 Stoystown 400451.9 785557.6 40045207855580171 Stoystown 400452.6 785432.3 40045307854320172 Stoystown 400452.8 785434.3 40045307854340173 Stoystown 400508.0 785445.3 40050807854450174 Stoystown 400405.7 785449.4 40040607854490175 Central City 401428.8 785049.6 40142907850490176 Central City 400706.1 785038.1 40070607850380177 Windber 401238.2 784844.0 40123807848440178 Windber 401423.1 785114.8 40142307851150179 Geistown 401507.3 785000.9 40150707850010180 Windber 401502.5 785154.2 40150307851540181 Windber 401428.8 785049.6 40142907850500182 Central City 400249.6 784957.6 40025007849580183 Central City 400116.9 785214.6 40011707852150184 Central City 400236.1 785027.2 40023607850270185 Windber 400733.7 785124.0 40073407851240186 Windber 400752.0 784900.0 40075207849000187 Stoystown 400707.8 785402.7 40070807854030188 Hooversville 400914.2 785525.6 40091407855260189 Hooversville 400916.8 785529.1 40091707855290190 Hooversville 400918.0 785539.0 400918078553901
Appendix 2. Location coordinates and station numbers forsampled mine discharges in the Stonycreek River Basin—Continued
Sitenumber
USGStopographicquadrangle
Latitude LongitudeStationnumber

58
91 Hooversville 401218.5 785553.3 40121907855530192 Hooversville 400939.3 785845.7 40093907858460193 Hooversville 400900.0 785419.7 40090007854200194 Hooversville 400746.9 785520.7 40074707855210195 Hooversville 401311.6 785332.9 40131207853330196 Windber 401408.2 785022.9 40140807850230197 Hooversville 401335.8 785422.3 40133607854220198 Central City 400248.1 785005.5 40024807850050199 Central City 400245.8 785007.9 400246078500801
100 Windber 401417.6 784849.8 401418078485001101 Windber 401415.1 784849.9 401415078485001102 Windber 401400.4 784735.6 401400078473601103 Windber 401356.1 784741.2 401356078474101104 Windber 401351.5 784749.7 401352078475001105 Stoystown 400124.3 785514.1 400124078551401106 Central City 400323.0 785202.8 400323078520301107 Johnstown 401847.6 785344.3 401848078534401108 Johnstown 401846.2 785348.2 401846078534801109 Johnstown 401844.0 785257.4 401844078525701110 Geistown 401848.2 785224.5 401848078522401111 Windber 401359.4 784646.5 401359078464601112 Windber 401403.3 784647.6 401403078464801113 Windber 401401.9 784643.0 401402078464301114 Windber 401409.2 784648.1 401409078464801115 Windber 401408.6 784638.3 401409078463801116 Windber 401414.7 784641.5 401415078464101117 Beaverdale 401516.5 784414.6 401516078441501118 Beaverdale 401517.6 784413.6 401518078441401119 Hooversville 400857.4 785403.2 400857078540301120 Hooversville 400859.7 785414.1 400900078541401121 Hooversville 400855.2 785340.4 400855078534001122 Hooversville 400856.3 785344.8 400856078534501123 Hooversville 400850.6 785242.5 400851078524201124 Windber 401449.0 784615.4 401449078461501125 Windber 401449.7 784613.5 401450078461301126 Windber 401451.4 784612.5 401451078461201127 Windber 401500.0 784552.0 401500078455201128 Stoystown 400521.0 785613.2 400521078561301129 Stoystown 400519.6 785614.1 400520078561401130 Johnstown 401527.7 785248.5 401528078524801131 Johnstown 401532.8 785242.3 401533078524201132 Stoystown 400512.0 785620.2 400512078562001133 Stoystown 400517.9 785621.4 400518078562101134 Stoystown 400522.8 785625.1 400523078562501135 Stoystown 400520.6 785759.5 400521078575901
Appendix 2. Location coordinates and station numbers forsampled mine discharges in the Stonycreek River Basin—Continued
Sitenumber
USGStopographicquadrangle
Latitude LongitudeStationnumber

59
136 Hooversville 400828.0 785536.7 400828078553701137 Hooversville 400841.9 785449.5 400842078545001138 Geistown 401502.3 784540.6 401502078454101139 Geistown 401503.1 784539.9 401503078454001140 Geistown 401504.7 784538.1 401505078453801141 Geistown 401458.1 784520.5 401458078452001142 Geistown 401500.0 784521.9 401500078452201143 New Baltimore 395906.6 785228.4 395907078522801144 Stoystown 395953.3 785236.5 395953078523601145 Central City 400120.1 785158.6 400120078515901146 Stoystown 400552.5 785632.3 400552078563201147 Johnstown 401947.7 785533.0 401948078553301148 Johnstown 401932.7 785534.2 401933078553401149 Johnstown 401941.9 785534.1 401942078553401150 Johnstown 401840.9 785459.2 401841078545901151 Stoystown 400521.3 785757.6 400521078575801152 Stoystown 400533.4 785712.4 400533078571201153 Stoystown 400534.4 785709.2 400534078570901154 Stoystown 400524.1 785622.7 400524078562301155 Stoystown 400532.4 785557.3 400532078555701156 Stoystown 400541.4 785556.6 400541078555701157 Stoystown 400548.3 785555.2 400548078555501158 Stoystown 400530.2 785450.6 400530078545101159 Stoystown 400510.6 785447.5 400511078544801160 Stoystown 400603.3 785613.4 400603078561301161 Stoystown 400620.4 785546.0 400620078554601162 Stoystown 400627.5 785530.3 400627078553001163 Stoystown 400626.0 785537.8 400626078553801164 Hooversville 400835.3 785525.8 400835078552601165 Johnstown 401627.9 785412.3 401628078541201166 Hooversville 401328.4 785914.3 401328078591401167 Berlin 395752.4 785236.2 395752078523601168 New Baltimore 395821.3 785218.4 395821078521801169 New Baltimore 395920.4 785139.8 395920078514001170 Berlin 395950.8 785241.3 395951078524101171 Boswell 400802.0 790104.9 400802079010501172 Boswell 400833.2 790044.9 400833079004501173 Boswell 400947.3 790215.7 400947079021601174 Boswell 401026.3 790102.8 401026079010301175 Boswell 401013.0 790046.1 401013079004601176 Boswell 400840.2 790246.2 400840079024601177 Hooversville 401319.1 785926.9 401319078592601178 Hooversville 401321.4 785924.1 401321078592401179 Hooversville 401330.9 785915.7 401331078591601180 Hooversville 401320.0 785959.0 401320078595901
Appendix 2. Location coordinates and station numbers forsampled mine discharges in the Stonycreek River Basin—Continued
Sitenumber
USGStopographicquadrangle
Latitude LongitudeStationnumber

60
181 Hooversville 401450.9 785331.3 401451078533101182 Ligonier 400731.3 790746.0 400731079074601183 Ligonier 400731.3 790746.0 400731079074602184 Windber 401443.9 785132.0 401444078513201185 Windber 401442.4 785134.9 401442078513501186 Johnstown 401839.3 785459.2 401839078545901187 Windber 401500.0 784637.7 401500078463801188 Windber 401441.6 784617.7 401442078461801189 Johnstown 401807.1 785426.9 401807078542701190 Johnstown 401729.0 785454.1 401729078545401191 Johnstown 401718.6 785436.7 401719078543701192 Johnstown 401717.8 785436.5 401718078543601193 Johnstown 401712.3 785434.2 401712078543401194 Johnstown 401711.0 785434.0 401711078543401195 Johnstown 401710.0 785434.0 401710078543401196 Johnstown 401709.0 785433.8 401709078543401197 Johnstown 401704.9 785434.5 401705078543401198 Johnstown 401810.5 785519.8 401810078552001199 Johnstown 401741.9 785510.3 401742078551001200 Windber 400817.2 784957.7 400817078495801201 Windber 400825.9 784927.4 400826078492701202 Central City 400130.5 785151.1 400130078515101203 Central City 400145.2 785021.9 400145078502201204 Hooversville 401244.7 785434.0 401245078543401205 Hooversville 401239.5 785512.1 401240078551201206 Hooversville 401229.2 785451.0 401229078545101207 Hooversville 401228.5 785454.8 401229078545501208 Hooversville 400524.7 790451.4 400525079045101209 Somerset 400644.4 790427.3 400644079042701210 Stoystown 400231.1 785911.6 400231078591201211 Berlin 395912.4 785707.8 395912078570801212 New Baltimore 395901.0 785230.9 395901078523101213 Central City 400032.6 785117.7 400033078511801214 Windber 400815.9 784831.6 400816078483201215 Windber 400826.1 784834.8 400826078483501216 Windber 400942.7 784931.9 400943078493201217 Windber 401332.4 784939.6 401332078494001218 Windber 401406.0 785019.0 401406078501901219 Ogletown 401331.6 784428.9 401332078442901220 Windber 401249.4 784757.0 401249078475701221 Windber 401031.2 785222.0 401031078522201222 Windber 401100.2 785151.2 401100078515101223 Somerset 400044.0 790035.1 400044079003501224 Stoystown 400011.3 785525.8 400011078552601225 Stoystown 400121.9 785516.6 400122078551701
Appendix 2. Location coordinates and station numbers forsampled mine discharges in the Stonycreek River Basin—Continued
Sitenumber
USGStopographicquadrangle
Latitude LongitudeStationnumber

61
226 Stoystown 400559.5 785539.3 400600078553901227 Stoystown 400642.2 785444.7 400642078544501228 Hooversville 400901.0 785416.3 400901078541601229 Windber 401058.1 785204.6 401058078520501230 Windber 401054.9 785208.9 401055078520901231 Windber 401044.8 784906.4 401045078490601232 Windber 401053.7 784935.6 401054078493601233 Windber 401056.9 784935.2 401057078493501234 Windber 401043.0 784937.0 401043078493701235 Windber 401040.8 784938.3 401041078493801236 Windber 401245.2 785140.1 401245078514001237 Windber 401246.5 785139.8 401246078514001238 Windber 401248.7 785135.9 401249078513601239 Windber 401243.9 785147.9 401244078514801240 Windber 401237.5 785147.1 401237078514701241 Hooversville 401104.0 785425.8 401104078542601242 Hooversville 400739.7 785522.2 400740078552201243 Hooversville 401146.8 785306.7 401147078530701244 Hooversville 401153.6 785252.0 401154078525201245 Hooversville 401203.7 785228.5 401204078522801246 Windber 401206.6 785224.7 401207078522501247 Windber 401213.0 785219.0 401213078521901248 Johnstown 401906.8 785450.5 401907078545001249 Hooversville 400944.1 785450.1 400944078545001250 Hooversville 400941.2 785446.7 400941078544701251 Hooversville 400940.9 785446.5 400941078544601252 Hooversville 400931.1 785448.1 400931078544801253 Hooversville 401054.2 785424.7 401054078542501254 Hooversville 401039.8 785423.3 401040078542301255 Hooversville 401052.3 785436.6 401052078543701256 Somerset 400651.0 790413.0 400651079041301257 Somerset 400707.5 790410.4 400708079041001258 Somerset 400706.2 790318.4 400706079031801259 Hooversville 400838.7 785908.1 400839078590801260 Hooversville 401122.7 785446.3 401123078544601261 Stoystown 400609.6 785554.4 400610078555401262 Stoystown 400113.0 785507.5 400113078550801263 Stoystown 400419.9 785341.4 400420078534101264 Stoystown 400547.9 785554.6 400548078555401265 Central City 400709.9 784828.3 400710078482801266 Central City 400715.0 784828.3 400715078482801267 Windber 400742.4 785026.5 400742078502601268 Geistown 401507.1 785038.4 401507078503801269 Hooversville 401238.1 785424.2 401238078542401270 Hooversville 401231.2 785519.8 401231078552001
Appendix 2. Location coordinates and station numbers forsampled mine discharges in the Stonycreek River Basin—Continued
Sitenumber
USGStopographicquadrangle
Latitude LongitudeStationnumber

62
Appendix 3. Field data and laboratory analyses of mine discharges
[ft3/s, cubic foot per second; gal/min, gallon per minute; °C, degrees Celsius; µS/cm, microsiemen percentimeter at 25 degrees Celsius; mg/L, milligram per liter; <, less than; --, no data available]
Appendix 3. Field data and laboratory analyses of mine discharges—Continued
Sitenumber
Localidentifier
(Topographicquadrangle)
Date Time
Discharge,instan-
taneous(ft3/s)
Flow rate,instan-taneous(gal/min)
Temper-ature,water(°C)
Specificconduc-tance
(µS/cm)
pH, waterwholefield
(standardunits)
Alkalinity,water
(mg/L asCaCO3)
Residue at105 °C,
dissolved(mg/L)
Carbon,inorganic,
total(mg/Las C)
1 Hooversville 06-17-92 0845 .04 16 11.0 2,580 2.8 0 2,360 1.308-18-93 1405 .01 3.3 21.5 2,240 3.4 0 2,180 1.0
2 Hooversville 06-17-92 1030 .02 9.0 14.5 1,680 3.1 0 1,390 <1.0 3 Stoystown 06-17-92 1130 .35 155 11.0 2,570 2.8 0 2,890 <1.0
08-18-93 1135 .23 105 11.0 2,580 3.4 0 3,160 1604-21-94 1100 1.1 501 10.5 2,220 2.7 0 2,360 16
4 Hooversville 06-17-92 1330 .78 348 11.5 1,750 2.8 0 1,540 <1.008-18-93 1340 .20 90 12.0 1,800 3.3 0 1,740 7.005-09-94 1520 .95 429 11.5 1,310 2.7 0 1,140 13
5 Hooversville 06-17-92 1430 .76 341 9.5 708 4.5 4 602 1.0 6 Hooversville 06-17-92 1530 .68 306 11.0 1,040 4.4 5 1,000 <1.0
08-19-93 1325 .23 105 11.0 1,020 5.0 40 930 3005-09-94 1415 1.7 756 11.0 853 5.1 22 918 30
7 Hooversville 06-17-92 1620 .20 91 10.5 1,170 3.0 0 1,090 <1.009-01-93 1310 .15 67 10.5 1,820 2.8 0 1,980 1705-09-94 1330 .69 312 10.0 866 2.9 0 798 19
8 Hooversville 06-17-92 1700 .01 5.8 16.5 2,290 2.8 0 2,640 <1.0 9 Somerset 06-18-92 0730 .02 6.7 10.5 836 6.1 62 688 2.8
10 Somerset 06-18-92 0815 .27 122 10.0 805 3.5 0 628 1.0 11 Somerset 06-18-92 0845 .30 136 10.5 710 4.4 2 628 1.1 12 Central City 06-24-92 1400 .19 86 15.0 2,750 6.4 130 3,020 37 13 Central City 06-24-92 1515 .12 52 10.5 1,970 6.0 30 1,890 8.2 14 Central City 06-24-92 1645 1.8 799 10.0 1,110 3.6 0 980 8.3
10-06-92 1635 1.5 678 10.5 1,160 3.6 0 948 5.510-06-92 1140 1.5 678 10.5 1,160 3.7 0 960 4.710-07-92 0615 1.5 678 9.0 1,180 3.5 0 958 5.208-18-93 1530 1.3 584 10.5 1,170 3.6 0 1,190 4105-03-94 1215 5.1 2,300 10.0 880 3.5 0 792 29
15 Central City 06-24-92 1745 .21 96 10.5 1,410 3.6 0 1,290 1010-06-92 0945 .12 56 9.5 1,380 3.5 0 1,120 1510-06-92 1545 .12 56 10.5 1,390 3.2 0 1,080 3.710-07-92 0555 .12 56 9.0 1,410 3.2 0 1,090 1208-18-93 1610 .11 47 11.0 1,380 3.4 0 1,620 5705-03-94 1120 .27 120 10.0 853 3.0 0 684 37
16 Central City 06-24-92 1840 5.0 2,250 11.0 1,600 3.3 0 1,540 4.108-18-93 1710 3.4 1,510 11.0 1,780 3.1 0 1,850 2705-03-94 1040 8.3 3,750 10.5 1,760 2.9 0 1,630 23
17 Stoystown 06-25-92 0840 .63 284 9.5 728 3.3 0 544 2.509-09-93 0920 .33 146 10.5 780 3.4 0 606 <1.008-31-93 0840 .34 151 9.5 774 3.3 0 596 1105-12-94 1125 2.5 1,120 9.0 438 3.6 0 302 6.9
18 Stoystown 06-25-92 0930 .02 11 9.5 515 6.4 46 404 12 19 Central City 06-29-92 1100 4.0 1,780 10.0 900 5.1 14 808 21
10-06-92 1800 4.5 2,000 9.5 840 5.0 10 670 1610-07-92 0655 4.5 2,000 9.0 850 5.1 11 662 14

63
Appendix 3. Field data and laboratory analyses of mine discharges—Continued
[ft3/s, cubic foot per second; gal/min, gallon per minute; °C, degrees Celsius; µS/cm, microsiemen percentimeter at 25 degrees Celsius; mg/L, milligram per liter; <, less than; --, no data available]
Appendix 3. Field data and laboratory analyses of mine discharges—Continued
Date
Sulfate,dissolved
(mg/Las SO4)
Fluoride,total
(mg/L as F)
Iron, totalrecoverable
(µg/Las Fe
Iron,dissolved
(µg/Las Fe
Iron,ferrous,
dissolved(µg/Las Fe
Manganese,total
recoverable(µg/Las Mn
Manganese,dissolved
(µg/Las Mn)
Aluminum,total
recoverable(µg/Las Al)
Aluminum,dissolved
(µg/Las Al)
Acidity,total
heated(mg/L asCaCO3)
Acidity,mineral(methylorange)(mg/L asCaCO3)
06-17-92 1,500 1.1 46,000 39,000 -- 30,000 25,000 38,000 32,000 380 13008-18-93 1,400 .7 10,000 10,000 680 20,000 20,000 22,000 22,000 272 12606-17-92 990 .4 3,800 3,600 -- 8,800 8,800 5,200 5,200 92 4206-17-92 1,600 1.4 75,000 75,000 -- 23,000 23,000 55,000 54,000 630 28008-18-93 1,400 1 98,000 97,000 7,500 23,000 23,000 56,000 56,000 742 30604-21-94 1,700 .9 64,000 64,000 2,900 21,000 21,000 48,000 48,000 524 22206-17-92 960 .8 30,000 30,000 -- 5,200 5,200 20,000 20,000 270 14008-18-93 1,200 .8 23,000 23,000 1,000 3,900 3,800 22,000 22,000 258 11405-09-94 880 .6 19,000 18,000 330 3,000 3,000 14,000 14,000 204 8406-17-92 390 .2 40 30 -- 2,600 2,600 800 800 9.4 006-17-92 630 .7 9,900 70 -- 3,500 3,200 9,500 6,100 34 008-19-93 640 .6 6,000 500 -- 2,900 2,800 7,100 4,300 26 --05-09-94 540 .5 3,200 51 170 4,100 4,100 4,900 1,000 17 --06-17-92 660 .7 11,000 11,000 -- 2,400 2,400 20,000 20,000 180 5809-01-93 1,300 1.0 26,000 26,000 840 4,400 4,400 43,000 42,000 364 10405-09-94 610 .6 6,600 6,200 320 1,600 1,600 13,000 12,000 138 3406-17-92 1,500 2.2 62,000 62,000 -- 8,200 8,200 62,000 62,000 560 21006-18-92 380 <.2 38,000 38,000 -- 2,600 2,600 280 170 0 006-18-92 390 .2 750 700 -- 91,000 900 2,000 1,900 24 506-18-92 360 <.2 5,800 5,000 -- 1,600 1,400 1,000 800 20 006-24-92 1,700 <.2 13,000 5,400 -- 17,000 17,000 250 200 0 006-24-92 1,200 .3 8,300 4,800 -- 2,900 2,800 1,500 400 0 006-24-92 730 .3 880 800 -- 6,700 6,500 10,000 9,700 88 710-06-92 680 .4 2,100 1,800 -- 7,200 7,100 12,000 11,000 100 710-06-92 680 .3 2,000 1,700 -- 6,900 6,900 11,000 11,000 100 810-07-92 700 .3 2,100 1,700 -- 7,100 7,100 11,000 11,000 98 808-18-93 850 .4 760 610 220 7,200 7,200 12,000 12,000 96 805-03-94 610 .2 360 200 110 4,600 4,600 6,500 6,500 76 --06-24-92 980 .6 60,000 60,000 -- 17,000 17,000 16,000 16,000 222 6810-06-92 800 .5 57,000 56,000 -- 13,000 13,000 12,000 12,000 230 7010-06-92 800 .6 57,000 57,000 -- 13,000 13,000 14,000 14,000 222 7010-07-92 800 .5 55,000 55,000 -- 13,000 13,000 12,000 12,000 228 5608-18-93 1,000 .5 58,000 57,000 47,000 14,000 14,000 15,000 15,000 208 5605-03-94 540 .3 12,000 12,000 10,000 6,500 6,500 6,300 6,200 96 1406-24-92 1,100 .4 63,000 63,000 -- 8,600 8,600 18,000 18,000 250 13008-18-93 1,300 .4 71,000 7,0,000 52,000 8,200 8,200 20,000 20,000 280 11605-03-94 1,300 .3 39,000 38,000 22,000 8,700 8,600 19,000 19,000 286 11606-25-92 370 <.2 3,400 3,400 -- 1,900 1,900 5,000 5,000 58 2009-09-93 500 .2 1,900 1,700 -- 1,700 1,700 4,400 4,400 58 1608-31-93 480 .2 2,200 1,900 400 1,800 1,800 4,400 4,400 60 1605-12-94 200 <.2 990 880 240 800 780 1,700 1,700 32 806-25-92 240 <.2 6,600 1,800 -- 870 730 <100 <100 0 006-29-92 480 .3 41,000 38,000 -- 4,000 3,800 1,700 1,200 74 --10-06-92 450 .4 35,000 35,000 -- 3,700 3,700 2,000 1,800 86 010-07-92 460 .3 37,000 37,000 -- 3,900 3,900 1,800 1,600 82 0

64
05-03-94 1315 9.2 4,130 9.5 632 4.8 8 536 23 20 Central City 06-29-92 1300 .71 .7 29.0 12,900 2.4 0 35,100 <1.0 21 Stoystown 06-29-92 1400 .10 46 21.0 1,170 3.3 0 1,480 <1.0 22 Stoystown 06-30-92 0845 .50 224 10.0 1,410 3.0 0 1,100 2.5
09-09-93 1025 .30 135 12.0 950 2.9 0 1,090 <1.008-31-93 0940 .34 151 10.5 1,510 2.8 0 1,310 4.305-12-94 1250 1.2 553 9.5 1,170 3.2 0 966 9.3
23 Stoystown 06-30-92 0930 .03 12 10.0 660 3.4 0 588 5.6 24 Stoystown 07-01-92 1000 .01 3.0 11.0 4,290 3.0 0 5,420 18 25 Stoystown 07-01-92 1045 .01 3.9 9.5 745 5.9 17 650 15 26 Stoystown 07-01-92 1130 <.01 1.5 15.0 3,000 3.1 0 3,900 3.2 27 Central City 07-01-92 1600 <.01 1.0 21.0 1,360 3.0 0 1,400 <1.0 28 Windber 07-13-92 1045 .19 84 10.5 838 3.1 0 800 4.9
09-01-93 1500 .27 120 10.5 953 3.0 0 852 6.1 29 Windber 07-13-92 1215 .04 19 12.0 1,040 4.1 0 950 2.9 30 Windber 07-13-92 1400 .01 4.4 10.5 1,100 3.1 0 860 4.5
09-01-93 1600 .02 6.7 11.0 990 3.0 0 812 5.4 31 Windber 07-13-92 1430 .35 155 24.5 818 3.2 0 618 <1.0
09-01-93 1545 .01 <.1 26.0 688 3.3 0 534 <1.0 32 Windber 07-14-92 0930 .04 18 10.5 1,610 3.4 0 1,510 6.2 33 Windber 07-14-92 1020 .02 8.4 17.5 1,410 3.9 0 1,350 1.6 34 Stoystown 07-15-92 1130 .09 42 11.0 2,230 2.7 0 2,040 8.9
08-18-93 1536 .10 45 11.0 2,530 3.4 0 2,650 1004-21-94 0930 .35 156 10.0 1,390 3.1 0 1,300 15
35 Stoystown 07-15-92 1225 .11 48 15.5 810 6.0 30 540 9.9 36 Stoystown 07-15-92 1330 .09 43 19.0 2,830 3.0 0 2,700 <1.0
08-18-93 1050 .09 39 19.0 2,970 3.4 0 3,240 <1.004-20-94 0800 .20 90 7.5 2,380 3.2 0 2,410 2.5
37 Central City 07-15-92 1445 .02 6.8 10.0 560 3.6 0 2,880 12 38 Central City 07-15-92 1620 .17 78 10.0 1,610 3.0 0 1,440 11
05-03-94 0930 .37 167 10.5 1,380 2.6 0 1,210 19 39 Windber 07-16-92 1035 .14 63 13.0 560 6.2 64 462 16 40 Windber 07-16-92 1235 .17 75 17.5 1,020 3.1 0 796 6.6
08-30-93 1500 <.01 .2 20.5 727 3.2 0 566 <1.0 41 Windber 07-16-92 1405 .10 42 15.5 460 3.6 0 374 1.1
08-30-93 1500 <.01 .2 20.5 727 3.2 0 566 <1.0 42 Windber 07-16-92 1455 .08 36 13.5 2,130 3.1 0 2,070 11
08-30-93 1540 <.01 .5 18.5 1,300 3.3 0 1,340 1505-03-94 1400 .67 300 10.0 1,450 3.0 0 1,220 36
43 Windber 07-16-92 1620 <.01 .5 27.5 943 3.5 0 670 7.7 44 Windber 07-17-92 0900 .30 133 10.5 1,240 3.6 0 1,270 3.6 45 Ogletown 07-17-92 1015 <.01 .04 21.5 1,950 9.7 198 1,300 33 46 Ogletown 08-18-93 1100 12 -- 11.5 934 6.1 30 824 15
07-17-92 1100 .05 20 16.0 955 3.2 0 856 2.3 47 Hooversville 08-13-92 1015 <.01 1.6 14.5 1,420 3.2 0 1,200 <1.0 48 Hooversville 08-13-92 1040 .02 8.0 15.5 960 4.5 0 796 2.1 49 Hooversville 08-13-92 1340 .01 3.4 11.5 760 6.7 140 548 40 50 Hooversville 08-13-92 1445 <.01 1.0 13.5 533 7.1 66 370 14 51 Somerset 09-14-92 1140 .04 18 11.5 450 4.3 0 346 2.0 52 Boswell 09-14-92 1415 <.01 .2 17.0 993 3.8 0 778 1.5
Appendix 3. Field data and laboratory analyses of mine discharges—Continued
Sitenumber
Localidentifier
(Topographicquadrangle)
Date Time
Discharge,instan-
taneous(ft3/s)
Flow rate,instan-taneous(gal/min)
Temper-ature,water(°C)
Specificconduc-tance
(µS/cm)
pH, waterwholefield
(standardunits)
Alkalinity,water
(mg/L asCaCO3)
Residue at105 °C,
dissolved(mg/L)
Carbon,inorganic,
total(mg/Las C)

65
05-03-94 370 0.2 16,000 14,000 220 2,700 2,700 1,400 910 52 --06-29-92 27,000 4.2 4,760,000 4,360,000 -- 60,000 60,000 160,000 160,000 19,688 8,17006-29-92 630 <.2 6,900 7,600 -- 7,100 7,700 1,100 1,200 62 3806-30-92 750 .4 30,000 30,000 -- 7,500 7,500 9,600 9,500 200 13009-09-93 880 .4 24,000 23,000 -- 7,400 7,200 9,500 9,200 174 9408-31-93 930 .3 34,000 33,000 660 8,700 8,700 11,000 11,000 230 12605-12-94 730 .3 21,000 21,000 610 7,100 7,100 12,000 11,000 172 8006-30-92 360 .3 300 280 -- 9,000 8,700 12,000 11,000 100 1707-01-92 3,400 1.8 210,000 190,000 -- 130,000 120,000 63,000 62,000 840 19007-01-92 420 <.2 68,000 67,000 -- 4,000 4,000 <100 <100 100 007-01-92 2,200 1.1 23,000 23,000 -- 56,000 56,000 55,000 55,000 490 10007-01-92 880 .4 30,000 30,000 -- 12,000 12,000 42,000 42,000 420 12007-13-92 430 .3 1,200 1,200 -- 5,800 5,700 10,000 9,900 100 3209-01-93 690 .3 1,700 1,700 170 5,700 5,700 12,000 12,000 114 2807-13-92 620 .2 30 30 -- 1,400 1,400 7,100 7,100 52 007-13-92 470 .4 2,100 2,100 -- 7,600 7,600 14,000 14,000 140 4009-01-93 680 .4 2,100 2,100 290 7,500 7,500 15,000 15,000 124 3607-13-92 360 .3 2,000 2,000 -- 5,700 5,600 9,200 9,100 98 3009-01-93 430 .3 2,400 2,400 1,300 4,300 4,300 6,100 6,100 68 2407-14-92 960 .4 1,100 900 -- 4,300 4,200 6,300 6,100 64 1207-14-92 860 .3 330 290 -- 5,700 5,700 5,000 5,000 44 007-15-92 1,200 .8 32,000 32,000 -- 14,000 14,000 21,000 21,000 310 15008-18-93 1,600 .9 45,000 44,000 2,800 16,000 16,000 28,000 28,000 404 20404-21-94 900 .5 12,000 11,000 1,100 6,500 6,500 10,000 10,000 -- 5207-15-92 300 .2 5,200 4,800 -- 3,200 3,200 1,600 200 0 007-15-92 1,800 .2 13,000 13,000 -- 42,000 42,000 2,900 2,900 160 8408-18-93 2,600 .2 25,000 22,000 7,900 46,000 45,000 2,700 2,700 248 9404-20-94 1,900 .6 16,000 15,000 13,000 37,000 37,000 9,100 9,000 232 007-15-92 260 .2 1,100 970 -- 3,100 2,800 2,300 2,300 36 707-15-92 850 -- 66,000 66,000 -- 6,500 6,500 42,000 41,000 442 7805-03-94 840 .2 34,000 34,000 25,000 4,400 4,400 31,000 31,000 384 11207-16-92 210 <.2 820 390 -- 610 600 <100 <100 0 007-16-92 420 .6 4,800 4,800 -- 5,400 5,400 14,000 14,000 164 4408-30-93 450 .4 3,400 3,200 400 13,000 13,000 8,600 8,300 102 2807-16-92 200 .4 3,000 1,200 -- 3,200 3,200 6,400 4,500 62 907-07-93 490 <.2 78,000 76,000 -- 4,100 4,100 290 <130 120 --07-16-92 1,300 .6 5,400 5,300 -- 26,000 26,000 14,000 14,000 200 5608-30-93 850 .3 2,600 2,000 600 12,000 12,000 5,000 4,900 74 2205-03-94 930 .3 2,300 2,200 280 15,000 15,000 7,100 7,100 142 3007-16-92 360 <.2 27,000 26,000 -- 9,700 9,700 7,800 7,800 138 3407-17-92 720 .3 140 140 -- 2,500 2,500 5,400 5,400 62 607-17-92 860 .3 290 <10 -- 5,500 1,500 4,200 730 0 --08-18-93 480 <.2 57,000 41,000 -- 4,700 4,600 <130 <130 56 --07-17-92 490 .4 7,500 7,300 -- 4,900 4,900 22,000 22,000 210 4608-13-92 770 .6 38,000 37,000 -- 14,000 14,000 9,200 8,900 192 6608-13-92 560 .2 6,400 5,300 -- 9,100 9,100 3,200 2,800 50 008-13-92 270 <.2 4,800 2,600 -- 830 760 <130 <130 0 --08-13-92 200 <.2 330 31 -- 24 14 <130 <130 0 --09-14-92 200 <.2 300 230 -- 410 410 2,300 2,100 24 009-14-92 550 <.2 9,500 6,600 -- 2,600 2,600 4,200 800 50 12
Appendix 3. Field data and laboratory analyses of mine discharges—Continued
Date
Sulfate,dissolved
(mg/Las SO4)
Fluoride,total
(mg/L as F)
Iron, totalrecoverable
(µg/Las Fe
Iron,dissolved
(µg/Las Fe
Iron,ferrous,
dissolved(µg/Las Fe
Manganese,total
recoverable(µg/Las Mn
Manganese,dissolved
(µg/Las Mn)
Aluminum,total
recoverable(µg/Las Al)
Aluminum,dissolved
(µg/Las Al)
Acidity,total
heated(mg/L asCaCO3)
Acidity,mineral(methylorange)(mg/L asCaCO3)

66
53 Boswell 09-14-92 1450 .01 4.6 14.5 900 3.6 0 780 <1.0 54 Boswell 09-14-92 1615 .25 111 11.0 333 6.7 72 212 10 55 Berlin 05-19-93 1020 .10 45 8.0 1,080 5.7 46 864 38 56 Berlin 05-19-93 1045 <.10 20 10.0 439 4.2 0 372 19 57 Berlin 05-19-93 1115 <.01 1.6 14.0 937 5.5 42 1,140 26 58 New Baltimore 05-19-93 1330 .08 35 9.5 1,300 5.9 52 1,240 23 59 Stoystown 05-19-93 1645 .01 3.1 12.0 4,190 2.9 0 4,420 11 60 Stoystown 05-19-93 1730 .01 6.4 14.0 5,410 2.9 0 8,060 5.8 61 Stoystown 05-20-93 0920 .13 60 12.5 305 6.7 96 214 22 62 Stoystown 05-25-93 1015 .12 52 8.0 506 3.5 0 324 5.0 63 Stoystown 05-25-93 1130 .62 277 14.5 977 3.4 0 742 9.3
04-20-94 0940 1.8 805 9.5 881 3.1 0 562 4.8 64 Stoystown 05-25-93 1300 .04 19 18.5 608 6.4 26 494 7.8 65 Stoystown 05-26-93 0830 .13 58 10.5 345 5.8 11 284 6.4 66 Stoystown 05-26-93 0920 .13 58 15.0 343 6.8 38 200 8.6 67 Stoystown 06-01-93 1030 <.01 2.0 14.0 1,170 4.2 3 1,240 2.2 68 Stoystown 06-01-93 1145 .01 4.6 11.0 1,920 6.7 270 2,930 1.0 69 Stoystown 06-01-93 1245 <.01 .4 16.0 1,310 3.7 0 1,330 <1.0 70 Stoystown 06-01-93 1330 .09 41 10.0 699 4.0 0 1,240 6.3 71 Stoystow 06-01-93 1530 .01 3.8 20.5 1,520 3.8 0 3,090 3.5 72 Stoystown 06-01-93 1600 .02 8.6 12.0 1,900 3.7 0 2,320 3.9 73 Stoystown 06-01-93 1700 <.01 1.6 11.0 4,200 3.5 0 5,430 <1.0 74 Stoystown 06-02-93 0830 .01 2.4 9.5 359 6.5 30 394 9.9 75 Central City 07-12-93 1000 .07 30 24.0 830 3.3 0 628 1.3 76 Central City 07-12-93 1030 .08 35 12.5 776 3.4 0 740 30 77 Stoystown 06-01-93 1530 .01 3.8 20.5 1,520 3.8 0 3,090 3.5 78 Windber 07-12-93 1530 .14 65 11.5 1,070 4.5 12 1,400 11 79 Geistown 07-12-93 1630 <.01 2.0 31.0 4,660 2.2 0 9,240 4.5 80 Windber 07-13-93 0840 <.01 .4 22.0 2,520 2.7 0 1,860 2.0 81 Windber 07-13-93 1010 3.1 1400 11.5 1,020 4.8 3 954 6.0 82 Central City 08-18-93 1100 .03 12 11.5 934 6.1 30 824 15 83 Central City 08-18-93 1310 <.01 .8 14.0 2,080 4.5 0 2,310 2.7 84 Central City 08-30-93 1050 <.01 .5 9.0 2,490 6.1 84 3,230 33 85 Windber 08-30-93 1230 .01 2.5 14.0 505 4.6 0 462 2.4 86 Windber 08-30-93 1345 .02 9.0 18.0 336 6.6 15 284 3.2 87 Stoystown 08-30-93 1640 <.01 1.8 20.5 1,160 6.4 48 1,090 15 88 Hooversville 09-22-93 1015 <.01 1.2 11.5 570 6.5 20 496 5.1 89 Hooversville 09-22-93 1050 <.01 1.5 12.5 993 3.5 0 908 8.5 90 Hooversville 09-22-93 1200 <.01 1.9 10.0 1,160 2.9 0 744 5.2 91 Hooversville 09-22-93 1600 <.01 1.5 15.5 665 6.8 96 534 21 92 Hooversville 09-22-93 1700 <.01 1.7 14.5 1,820 5.8 3 1,920 <1.0 93 Hooversville 09-23-93 0915 <.01 2.2 9.5 860 3.6 0 720 20 94 Hooversville 09-23-93 1020 <.01 2.5 16.5 3,670 3.0 0 4,630 <1.0 95 Hooversville 05-11-94 0830 2.2 981 10.0 1,060 4.6 0 986 5.6 96 Windber 05-17-94 1315 .12 52 10.0 1,120 6.3 26 1,070 7.5 97 Hooversville 05-17-94 1650 .44 197 11.0 1,530 3.2 0 1,460 2.3
11-17-94 0900 .12 54 11.0 1,310 4.1 0 1,410 22 98 Central City 05-24-94 1730 .01 2.4 14.0 726 6.1 28 594 11 99 Central City 05-24-94 1820 <.01 .4 15.0 1,620 6.2 18 2,000 6.6
100 Windber 05-25-94 0900 .79 352 10.0 720 5.8 12 622 8.3
Appendix 3. Field data and laboratory analyses of mine discharges—Continued
Sitenumber
Localidentifier
(Topographicquadrangle)
Date Time
Discharge,instan-
taneous(ft3/s)
Flow rate,instan-taneous(gal/min)
Temper-ature,water(°C)
Specificconduc-tance
(µS/cm)
pH, waterwholefield
(standardunits)
Alkalinity,water
(mg/L asCaCO3)
Residue at105 °C,
dissolved(mg/L)
Carbon,inorganic,
total(mg/Las C)

67
09-14-92 510 0.3 1,200 1,200 -- 680 650 7,800 7,700 72 1109-14-92 97 <.2 7,900 7,700 -- 630 620 <140 <140 0 005-19-93 630 <.1 72,000 72,000 -- 10,000 10,000 <130 <130 94 --05-19-93 230 <.2 240 220 -- 5,300 5,300 3,600 3,500 32 --05-19-93 630 <.2 130,000 120,000 -- 20,000 19,000 <130 <130 204 --05-19-93 790 .6 47,000 46,000 -- 4,400 4,400 540 510 46 --05-19-93 2,700 1.4 73,000 73,000 72,000 78,000 78,000 55,000 55,000 660 14205-19-93 5,000 2.2 18,000 18,000 4,400 140,000 140,000 86,000 86,000 720 12205-20-93 21 <.2 2,000 1,500 -- 150 140 <130 <130 0 --05-25-93 260 .3 360 230 140 4,900 4,900 9,000 9,000 64 805-25-93 260 .4 4,100 4,100 3,000 7,800 7,800 19,000 19,000 140 2604-20-94 460 .3 2,300 2,300 1,600 5,600 5,600 17,000 17,000 176 2605-25-93 300 <.2 2,900 1,400 -- 1,700 1,600 <100 <100 0 005-26-93 140 <.2 170 <10 -- 120 120 <130 <130 0 --05-26-93 120 <.2 500 110 -- 260 250 <130 <130 0 --06-01-93 770 <.2 3,000 1,500 -- 9,000 8,300 2,200 1800 36 --06-01-93 1,900 <.2 130 110 0 1,400 1,400 <100 <100 0 006-01-93 870 .4 620 580 360 11,000 11,000 23,000 23,000 190 2806-01-93 800 .5 210 190 130 16,000 16,000 17,000 17,000 146 1306-01-93 2,200 .8 2,200 2,200 1,400 59,000 59,000 68,000 68,000 532 3406-01-93 1,400 .7 800 600 520 44,000 44,000 56,000 56,000 440 3206-01-93 4,000 1.3 90,000 90,000 260 120,000 120,000 57,000 57,000 780 21606-02-93 150 <.2 11,000 11,000 0 3,800 3,700 200 <130 8.0 007-12-93 490 .2 5,500 3,900 -- 3,400 3,400 3,400 3,400 80 2407-12-93 570 .2 17,000 17,000 8,000 3,200 3,100 9,800 9,800 126 3606-01-93 2,200 .8 2,200 2,200 1,400 59,000 59,000 68,000 68,000 532 3407-12-93 870 <.2 30 10 -- 1,200 1,200 810 810 28 --07-12-93 6,200 .2 1,300,000 -- -- 10,000 9,800 100,000 99,000 3,940 2,94007-13-93 1,300 <.2 130,000 130,000 46,000 6,100 6,100 26,000 26,000 700 44007-13-93 720 <.2 6,900 6,900 -- 2,800 2,700 2,600 1,900 44 --08-18-93 480 <.2 57,000 41,000 -- 4,700 4,600 <130 <130 56 --08-18-93 1,500 .2 620 490 -- 1,500 1,500 1,100 1,100 18 --08-30-93 2,100 <.2 40,000 38,000 -- 9,900 9,900 240 <130 0 --08-30-93 280 <.2 1,900 1,200 -- 2,600 2,300 130 <130 11 --08-30-93 140 <.2 610 52 -- 500 490 <130 <130 0 --08-30-93 590 <.2 11,000 8,400 -- 4,300 4,200 150 150 0 --09-22-93 260 .2 <10 <10 -- 60 60 210 <130 0 --09-22-93 600 .2 19,000 19,000 13,000 4,300 4,300 3,400 3,400 82 2209-22-93 560 .3 4,700 4,700 320 1,200 1,200 7,300 7,300 124 6409-22-93 230 .2 120 18 -- 88 83 440 <130 0 --09-22-93 1,100 <.2 1,000 <10 -- 1,200 1,200 480 240 12 --09-23-93 460 .3 490 470 150 2,400 2,300 1,100 1,000 34 709-23-93 1,700 .7 130,,000 130,000 96,000 150,000 150,000 26,000 25,000 714 20005-11-94 690 .3 3,500 2,300 -- 2,000 2,000 3,000 2,900 30 --05-17-94 700 <.2 610 530 -- 460 450 230 <130 0 --05-17-94 1,000 .3 28,000 28,000 23,000 1,400 1,400 15,000 15,000 186 4411-17-94 700 .2 53,000 53,000 53,000 1,300 1,300 6,100 6,100 204 --05-24-94 470 <.2 8,900 4,500 -- 2,000 1,600 220 <130 0 --05-24-94 1,400 <.2 20,000 18,000 -- 12,000 12,000 160 150 26 --05-25-94 420 <.2 50 23 -- 690 690 700 440 1.2 --
Appendix 3. Field data and laboratory analyses of mine discharges—Continued
Date
Sulfate,dissolved
(mg/Las SO4)
Fluoride,total
(mg/L as F)
Iron, totalrecoverable
(µg/Las Fe
Iron,dissolved
(µg/Las Fe
Iron,ferrous,
dissolved(µg/Las Fe
Manganese,total
recoverable(µg/Las Mn
Manganese,dissolved
(µg/Las Mn)
Aluminum,total
recoverable(µg/Las Al)
Aluminum,dissolved
(µg/Las Al)
Acidity,total
heated(mg/L asCaCO3)
Acidity,mineral(methylorange)(mg/L asCaCO3)

68
101 Windber 05-25-94 1000 .26 117 10.5 1,310 3.2 0 1,180 3.5 102 Windber 05-25-94 1230 .03 15 13.0 186 4.7 0 270 1.5 103 Windber 05-25-94 1310 .97 436 10.5 1,350 3.2 0 1,250 3.3
11-17-94 1045 .07 33 10.0 3,110 2.7 0 3,780 2.4 104 Windber 05-25-94 1400 .44 200 11.0 2,400 3.0 0 2,270 3.6
11-17-94 1110 .05 22 10.0 2,990 3.3 0 3,190 2.0 105 Stoystown 05-26-94 0840 .01 6.0 12.5 328 3.7 0 222 4.0 106 Central City 06-07-94 1305 .11 51 16.5 210 7.1 78 180 6.4 107 Johnstown 06-14-94 0950 .02 9.2 11.5 715 5.2 4 528 5.9 108 Johnstown 06-14-94 1030 .13 60 11.0 810 7.0 48 642 12 109 Johnstown 06-14-94 1120 .40 180 15.5 1,230 5.9 44 1,200 2.3 110 Geistown 06-14-94 1300 1.0 449 13.0 1,220 4.5 0 1,310 4.6
11-21-94 1250 .88 396 12.5 1,420 3.0 0 1,260 11 111 Windber 06-20-94 1050 .07 30 12.0 992 3.4 0 1,000 2.1 112 Windber 06-22-94 1115 .03 12 10.0 1,430 3.5 0 1,530 3.1 113 Windber 06-22-94 1140 .02 7.9 10.0 1,610 3.3 0 1,590 3.3 114 Windber 06-22-94 1215 .01 5.5 17.5 1,620 3.5 0 1,780 <1.0 115 Windber 06-22-94 1430 .01 3.9 18.0 1,840 3.6 0 2,090 <1.0 116 Windber 06-22-94 1500 .03 15 18.0 1,410 3.6 0 1,490 <1.0 117 Beaverdale 06-27-94 1110 .05 21 15.5 2,470 3.1 0 4,360 3.2 118 Beaverdale 06-27-94 1130 <.01 .3 19.0 2,380 2.6 0 3,150 1.4 119 Hooversville 06-27-94 1550 .01 4.0 15.5 177 5.0 3 140 5.9 120 Hooversville 06-27-94 1645 .02 7.5 20.0 810 3.2 0 474 1.0 121 Hooversville 06-28-94 0810 3.4 1,510 12.0 718 6.0 18 662 9.4 122 Hooversville 06-28-94 0840 <.01 .2 18.0 5,010 2.9 0 10,880 2.7 123 Hooversville 06-28-94 0930 .55 248 10.0 804 6.4 68 728 20 124 Windber 07-06-94 0945 .04 18 14.5 3,350 2.6 0 4,260 4.2
11-17-94 1240 <.01 .7 13.0 3,060 3.2 0 3,380 9.0 125 Windber 07-06-94 1030 .50 225 23.0 3,670 2.4 0 5,070 <1.0
11-17-94 1300 .02 10 9.5 3,030 2.6 0 3,630 1.3 126 Windber 07-06-94 1100 .06 26 17.5 1,430 2.9 0 1,370 <1.0 127 Windber 07-06-94 1150 <.01 1.3 22.5 2,340 2.6 0 2,370 1.2 128 Stoystown 07-06-94 1620 .06 28 12.5 1,520 3.6 0 1,690 8.0 129 Stoystown 07-06-94 1700 .04 17 14.5 2,060 3.7 0 2,550 7.5 130 Johnstown 07-07-94 0840 .56 250 12.0 1,170 3.9 0 1,150 1.2 131 Johnstown 07-07-94 0750 .01 3.1 11.5 864 3.3 0 760 3.1 132 Stoystown 07-13-94 1300 .01 4.3 19.0 1,100 5.9 8 1,200 2.2 133 Stoystown 07-13-94 1400 <.01 .4 15.0 1,720 3.8 0 1,990 7.8 134 Stoystown 07-13-94 1450 .01 4.0 18.5 1,140 4.1 0 1,310 <1.0 135 Stoystown 07-13-94 1730 .13 60 11.5 731 6.6 176 668 15 136 Hooversville 07-14-94 0750 .02 7.5 10.0 288 6.6 86 234 5.6 137 Hooversville 07-14-94 0840 .40 180 9.5 360 5.3 6 352 5.5 138 Geistown 07-21-94 1010 <.01 1.6 18.0 1,280 2.7 0 1,360 5.3 139 Geistown 07-21-94 1100 .03 13 16.5 2,520 2.6 0 2,600 4.6 140 Geistown 07-21-94 1130 .06 27 16.5 3,090 2.5 0 3,270 5.6
11-17-94 1500 .04 20 7.5 2,600 3.0 0 3,640 <1.0 141 Geistown 07-21-94 1230 .11 48 21.5 3,820 2.7 0 5,520 4.0
11-17-94 1420 .04 18 9.0 3,360 2.9 0 5,250 <1.0 142 Geistown 07-21-94 1300 .01 2.5 22.0 4,280 2.2 0 5,530 8.1 143 New Baltimore 08-01-94 1010 <.01 1.4 13.5 1,650 3.9 0 2,310 8.4
Appendix 3. Field data and laboratory analyses of mine discharges—Continued
Sitenumber
Localidentifier
(Topographicquadrangle)
Date Time
Discharge,instan-
taneous(ft3/s)
Flow rate,instan-taneous(gal/min)
Temper-ature,water(°C)
Specificconduc-tance
(µS/cm)
pH, waterwholefield
(standardunits)
Alkalinity,water
(mg/L asCaCO3)
Residue at105 °C,
dissolved(mg/L)
Carbon,inorganic,
total(mg/Las C)

69
05-25-94 780 0.2 1,700 1,700 170 1,800 1,800 4,800 4,700 94 4005-25-94 81 <.2 60 48 -- 440 420 330 310 12 --05-25-94 1,100 .3 1,500 1,500 250 4,900 4,900 6,500 6,500 92 2611-17-94 1,900 .7 12,000 12,000 920 20,000 20,000 28,000 27,000 350 12205-25-94 1,600 .4 6,800 6,500 500 14,000 14,000 14,000 13,000 194 7211-17-94 1,800 .7 9,300 9,200 840 22,000 20,000 24,000 24,000 314 10805-26-94 240 <.2 9,700 7,800 -- 4,000 3,700 1,000 930 34 1206-07-94 5.1 <.2 2,000 640 -- 630 570 <130 <130 0 --06-14-94 330 <.2 490 22 -- 280 230 670 260 19 --06-14-94 430 <.2 90 45 -- 44 41 200 <130 0 --06-14-94 650 <.2 39,000 39,000 -- 2,100 2,100 170 170 62 --06-14-94 780 <.2 30,000 28,000 -- 2,300 2,300 3,800 3,500 100 --11-21-94 1,200 <.2 45,000 39,000 43,000 3,000 2,700 4,800 4,200 102 --06-20-94 600 .4 530 510 410 6,500 6,300 8,700 8,500 82 1906-22-94 920 .4 380 330 150 5,200 5,000 8,300 8,,000 74 1206-22-94 1,000 .4 450 410 -- 6,100 6,000 9,900 9,600 92 1806-22-94 1,200 .5 640 640 -- 7,200 7,200 8,800 8,800 90 1406-22-94 1,200 .6 990 950 400 11,000 11,000 8,000 8,000 92 1506-22-94 990 .5 870 870 370 6,600 6,600 6,400 6,400 76 1306-27-94 2,400 .9 33,000 30,000 24,000 68,000 64,000 120,000 110,000 934 24806-27-94 1,900 .7 60,000 54,000 32,000 33,000 33,000 67,000 65,000 734 26006-27-94 74 <.2 150 56 -- 330 310 180 <130 32 --06-27-94 350 <.2 5,700 5,400 840 2,100 1,900 770 770 112 6006-28-94 400 .3 760 71 -- 940 880 2,400 330 7.6 --06-28-94 6,100 2.0 690,000 650,000 230,000 37,000 36,000 320,000 310,000 3,620 1,58006-28-94 420 <.2 170 85 -- 50 50 190 <130 .0 --07-06-94 3,000 1.1 47,000 47,000 1,500 53,000 53,000 89,000 89,000 866 --11-17-94 1,800 .7 12,000 11,000 1,200 27,000 26,000 54,000 52,000 512 11807-06-94 3,200 1.4 130,000 130,000 6,900 66,000 65,000 87,000 86,000 1,176 --11-17-94 1,800 1.0 83,000 83,000 5,200 44,000 44,000 57,000 57,000 908 33807-06-94 810 .5 3,900 3,900 770 24,000 24,000 28,000 28,000 276 --07-06-94 1,600 1.6 110,000 110,000 27,000 32,000 32,000 1,200 1,200 486 --07-06-94 1,000 .4 230 220 200 11,000 11,000 6,400 6,400 66 --07-06-94 1,500 .5 810 880 430 18,000 18,000 8,600 8,600 92 --07-07-94 640 .2 80 60 60 1,600 1,500 2,500 2,500 30 --07-07-94 420 <.2 25,000 15,000 15,000 4,900 4,900 1,500 1,500 62 --07-13-94 740 <.2 8,600 8,600 -- 8,500 8,400 250 180 58 --07-13-94 1,100 .4 470 420 250 16,000 16,000 11,000 11,000 152 1407-13-94 810 <.2 510 430 260 9,600 9,600 2,200 2,200 72 --07-13-94 250 <.2 1,200 840 -- 140 140 <130 <130 0 --07-14-94 58 <.2 1,800 1,300 -- 170 160 <130 <130 0 --07-14-94 170 .2 50 17 -- 310 300 1,300 1,000 30 --07-21-94 870 .3 17,000 17,000 1,700 23,000 23,000 11,000 11,000 214 12607-21-94 1,600 .4 59,000 59,000 2,500 39,000 39,000 20,000 20,000 468 30607-21-94 2,000 .5 70,000 70,000 3,300 48,000 48,000 33,000 32,000 684 38811-17-94 1,500 .5 140,000 140,000 3,700 39,000 39,000 23,000 23,000 782 39607-21-94 1,500 1.9 210,000 200,000 110,000 110,000 110,000 75,000 74,000 1,304 55011-17-94 2,900 1.4 230,000 230,000 190,000 72,000 71,000 63,000 63,000 1,332 33607-21-94 3,400 1.3 140,000 140,000 5,900 93,000 93,000 49,000 49,000 1,120 70008-01-94 1,300 1.6 390 350 380 51,000 51,000 37,000 37,000 258 --
Appendix 3. Field data and laboratory analyses of mine discharges—Continued
Date
Sulfate,dissolved
(mg/Las SO4)
Fluoride,total
(mg/L as F)
Iron, totalrecoverable
(µg/Las Fe
Iron,dissolved
(µg/Las Fe
Iron,ferrous,
dissolved(µg/Las Fe
Manganese,total
recoverable(µg/Las Mn
Manganese,dissolved
(µg/Las Mn)
Aluminum,total
recoverable(µg/Las Al)
Aluminum,dissolved
(µg/Las Al)
Acidity,total
heated(mg/L asCaCO3)
Acidity,mineral(methylorange)(mg/L asCaCO3)

70
144 Stoystown 08-01-94 1150 .41 185 11.0 1,590 6.0 100 1,850 9.4 145 Central City 08-01-94 1415 .01 4.9 13.0 2,600 6.2 140 3,410 12 146 Stoystown 08-01-94 1050 <.01 1.1 25.0 1,030 6.7 38 956 6.7 147 Johnstown 08-10-94 0920 <.01 .5 21.0 1,350 6.8 88 1,300 4.6 148 Johnstown 08-10-94 1010 <.01 .2 21.5 1,480 6.3 70 1,770 3.0 149 Johnstown 08-10-94 1115 .69 310 14.0 2,480 5.7 48 2,840 3.8
11-21-94 1000 2.0 884 13.0 2,840 5.7 66 3,210 31 150 Johnstown 08-10-94 1245 <.01 1.0 20.5 2,390 7.3 232 2,360 6.4 151 Stoystown 07-21-92 1145 .28 126 10.5 725 6.5 190 640 44 152 Stoystown 07-21-92 1230 .64 289 10.5 870 6.5 96 792 30 153 Stoystown 07-21-92 1320 <.01 .3 9.5 700 6.3 26 676 12 154 Stoystown 07-21-92 1435 .06 28 17.0 1,640 3.5 0 1,170 1.2 155 Stoystown 07-21-92 1600 .04 20 14.0 2,200 3.2 0 2,390 1.1 156 Stoystown 07-22-92 1130 .08 36 12.5 2,200 3.5 0 2,210 31
08-17-93 1135 .10 45 14.0 2,220 3.8 0 2,420 14 157 Stoystown 07-22-92 1305 .01 3.6 15.5 2,200 6.7 370 3,090 94 158 Stoystown 07-22-92 1410 <.01 .5 15.5 4,020 3.8 0 6,000 20 159 Stoystown 07-22-92 1545 .01 2.3 15.5 1,210 4.6 3 1,330 4.4 160 Stoystown 07-22-92 1545 .38 171 10.5 1,830 3.1 0 1,460 11
08-17-93 1220 .24 110 11.0 1,810 3.4 0 1,670 9.705-09-94 1635 .60 272 10.5 1,370 2.9 0 1,180 10
161 Stoystown 07-22-92 1620 .04 20 15.5 1,380 3.2 0 1,160 <1.0 162 Stoystown 07-23-92 0945 .01 5.0 16.0 2,170 3.1 0 2,170 <1.0 163 Stoystown 07-23-92 1025 <.01 2.0 16.0 1,990 3.0 0 1,860 2.7 164 Hooversville 07-23-92 1130 .22 97 11.0 1,680 2.8 0 1,500 2.9
08-18-93 1315 .20 90 11.0 2,220 3.4 0 2,370 6.805-03-94 1710 1.2 540 10.5 1,640 2.8 0 1,530 7.4
165 Johnstown 07-23-92 1500 .03 18 20.0 3,090 2.7 0 5,020 1.209-01-93 1400 .07 33 19.0 4,910 2.5 0 9,650 <1.004-19-94 1600 .07 33 12.5 4,980 2.4 0 5,680 14
166 Hooversville 07-24-92 0940 .03 13 12.0 2,270 2.7 0 2,420 1.609-01-93 1000 .01 4.0 16.0 2,520 2.6 0 2,660 <1.005-09-94 1100 .17 77 10.5 1,960 2.5 0 1,710 5.9
167 Berlin 08-03-92 1025 .03 5.0 12.0 665 3.5 0 574 4.8 168 New Baltimore Qua 08-03-92 -- .01 2.3 12.5 1,180 6.0 38 1,070 18
08-03-92 1110 .01 2.3 12.5 1,180 7.0 38 1,070 18 169 New Baltimore Qua 08-03-92 1255 .03 15 10.0 1,210 6.0 28 1,250 16 170 Berlin 08-03-92 1500 .32 142 12.0 1,790 6.2 130 2,040 17 171 Boswell 05-11-94 1200 .15 69 14.0 366 6.6 19 288 5.4 172 Boswell 08-05-92 1000 .07 30 14.0 1,710 2.8 0 1,640 <1.0
09-02-93 0830 <.01 <.1 18.0 1,460 2.9 0 1,070 8.1 173 Boswell 08-05-92 1115 1.0 470 10.5 1,460 6.2 100 1,180 23 174 Boswell 08-05-92 1155 .02 7.5 13.0 1,450 5.0 12 1,200 13 175 Boswell 08-05-92 1315 .01 5.0 15.5 1,060 3.2 0 708 5.7 176 Boswell 08-05-92 1530 .73 330 11.0 890 5.9 34 760 15
09-02-93 0920 .09 39 11.0 967 5.9 28 988 1705-10-94 0820 .22 101 11.0 1,000 6.2 20 1,020 14
177 Hooversville 08-06-92 0920 .02 7.0 11.5 2,000 2.7 0 1,750 1.9 178 Hooversville 08-06-92 0940 3.6 1,620 12.5 1,350 5.9 160 1,070 26
09-08-93 1820 2.1 962 12.5 1,320 6.5 162 1,120 30
Appendix 3. Field data and laboratory analyses of mine discharges—Continued
Sitenumber
Localidentifier
(Topographicquadrangle)
Date Time
Discharge,instan-
taneous(ft3/s)
Flow rate,instan-taneous(gal/min)
Temper-ature,water(°C)
Specificconduc-tance
(µS/cm)
pH, waterwholefield
(standardunits)
Alkalinity,water
(mg/L asCaCO3)
Residue at105 °C,
dissolved(mg/L)
Carbon,inorganic,
total(mg/Las C)

71
08-01-94 1,000 <0.2 13,000 12,000 -- 35,000 35,000 150 <130 0 --08-01-94 2,000 <.2 70 29 -- 280 260 170 160 0 --08-01-94 600 .4 1,600 79 -- 120 120 300 140 0 --08-10-94 610 .3 81,000 60,000 -- 1,600 1,200 260 <130 0 --08-10-94 1,100 .5 100,000 98,000 -- 2,000 2,000 390 <130 92 --08-10-94 1,600 <.2 300,000 300,000 -- 3,000 2,900 790 580 540 --11-21-94 3,100 <.2 390,000 330,000 -- 4,400 4,100 650 400 634 --08-10-94 1,300 .4 6,400 1,200 -- 1,200 1,100 890 150 0 --07-21-92 190 <.2 3,000 2,000 -- 260 240 <100 <100 0 007-21-92 360 <.2 40 20 -- 100 100 200 <100 0 007-21-92 330 <.2 230 <10 -- 320 300 2,600 <100 0 007-21-92 690 <.2 2,200 2,200 -- 8,000 8,000 700 700 50 1507-21-92 1,400 1.2 3,900 3,900 -- 5,000 5,000 13,000 13,000 150 4407-22-92 1,400 .8 4,400 4,400 -- 2,800 2,800 12,000 12,000 100 1408-17-93 1,400 .7 3,100 2,800 660 2,500 2,500 9,200 9,200 98 1007-22-92 1,700 <.2 3,000 2,500 -- 17,000 16,000 300 300 0 007-22-92 3,600 1.7 200,000 200,000 -- 120,000 120,000 74,000 73,000 850 907-22-92 770 .5 3,100 2,900 -- 24,000 24,000 13,000 13,000 92 007-22-92 960 <.2 5,900 5,700 -- 13,000 13,000 7,200 7,100 120 5408-17-93 1,100 <.2 6,100 6,100 1,000 12,000 12,000 7,300 7,100 124 4805-09-94 900 <.2 4,400 4,400 1,000 11,000 11,000 5,600 5,600 104 3007-22-92 770 <.2 3,600 3,500 -- 11,000 11,000 2,600 2,600 82 4007-23-92 1,400 .8 2,500 2,400 -- 17,000 17,000 12,000 12,000 130 4207-23-92 1,200 .3 7,100 7,100 -- 21,000 21,000 7,000 7,000 140 6407-23-92 840 .8 26,000 25,000 -- 5,100 4,900 17,000 16,000 260 13008-18-93 1,400 1.0 64,000 63,000 1,000 6,600 6,600 39,000 39,000 504 24205-03-94 1,000 .6 37,000 36,000 680 5,000 5,000 23,000 23,000 338 16007-23-92 2,200 .8 320,000 300,000 -- 5,700 5,700 97,000 97,000 1,600 77009-01-93 5,800 1 760,000 750,000 300,000 8,600 8,600 210,000 210,000 2,760 1,19004-19-94 4,700 1.0 630,000 570,000 440,000 6,600 6,000 170,000 150,000 2,342 62807-24-92 1,500 .4 150,000 150,000 -- 1,900 1,900 45,000 45,000 820 44009-01-93 2,100 .4 140,000 130,000 130,000 2,400 2,300 58,000 58,000 806 43605-09-94 1,100 -- 120,000 120,000 44,000 1,500 1,500 34,000 34,000 596 33208-03-92 280 .3 1,700 940 -- 6,600 6,600 7,300 7,200 76 1708-03-92 670 <.2 33,000 21,000 -- 3,400 2,300 <130 <130 19 --08-03-92 670 <.2 33,000 21,000 -- 3,400 2,300 <130 <130 19 --08-03-92 720 .2 74,000 73,000 -- 12,000 12,000 300 300 120 008-03-92 1,000 <.2 9,700 9200 -- 35,000 35,000 300 200 0 005-11-94 150 <.2 950 570 -- 510 500 140 <130 0 --08-05-92 950 .6 6,600 6,700 -- 14,000 14,000 24,000 24,000 260 7009-02-93 910 .2 110,000 110,000 88,000 11,000 11,000 2,000 2,000 284 11008-05-92 810 <.2 34,000 34,000 -- 4,400 4,400 <100 200 0 008-05-92 930 <.2 180,000 180,000 -- 13,000 13,000 1,000 800 340 008-05-92 480 .3 37,000 37,000 -- 11,000 11,000 5,400 5,300 120 6808-05-92 450 <.2 110,000 110,000 -- 6,100 6,100 <100 <100 162 009-02-93 620 <.2 120,000 120,000 120,000 7,300 7,300 <130 <130 186 --05-10-94 640 <.2 130,000 130,000 -- 8,100 7,800 <130 <130 232 --08-06-92 1,000 .5 59,000 58,000 -- 1,700 1,700 40,000 39,000 520 24008-06-92 640 <.2 17,000 1,800 -- 620 620 8,500 200 0 009-08-93 610 <.2 3,500 1,700 -- 480 480 1,000 <130 0 --
Appendix 3. Field data and laboratory analyses of mine discharges—Continued
Date
Sulfate,dissolved
(mg/Las SO4)
Fluoride,total
(mg/L as F)
Iron, totalrecoverable
(µg/Las Fe
Iron,dissolved
(µg/Las Fe
Iron,ferrous,
dissolved(µg/Las Fe
Manganese,total
recoverable(µg/Las Mn
Manganese,dissolved
(µg/Las Mn)
Aluminum,total
recoverable(µg/Las Al)
Aluminum,dissolved
(µg/Las Al)
Acidity,total
heated(mg/L asCaCO3)
Acidity,mineral(methylorange)(mg/L asCaCO3)

72
179 Hooversville 05-11-94 1050 .02 7.5 10.5 1,180 3.8 0 1,020 3.6 180 Hooversville 08-06-92 1115 .06 25 11.0 2,350 2.7 0 2,420 3.1
09-01-93 1100 .07 30 11.0 2,590 2.4 0 2,480 <1.005-09-94 1145 .38 171 11.0 1,630 2.3 0 1,350 3.3
181 Hooversville 07-14-93 1535 .01 5.0 8.5 1,220 3.3 0 1,110 <1.0 182 Ligonier 07-14-93 1730 <.01 1.0 15.0 232 5.2 16 160 8.3 183 Ligonier 07-14-93 1740 .01 3.0 17.5 353 4.2 0 210 1.7 184 Windber 07-15-93 0850 .10 45 13.5 2,700 2.8 0 2790 18
04-19-94 1210 .17 75 13.5 2,710 2.5 0 2,490 23 185 Windber 07-15-93 0930 <.01 1.9 18.0 3,420 2.7 0 3,050 1.6 186 Johnstown 08-10-94 1330 .05 22 15.5 2,350 4.8 4 2,520 10 187 Windber 07-15-93 1140 .08 36 11.5 1,740 2.4 0 1,630 1.6
04-19-94 1430 1.0 470 11.5 1,940 2.5 0 1,390 <1.0 188 Windber 07-15-93 1240 .11 51 18.0 2,270 2.6 0 3,070 1.3
04-19-94 1330 .05 24 16.0 1,770 2.8 0 1,620 <1.0 189 Johnstown 08-10-94 1500 1.2 539 12.0 1,200 3.4 0 1,080 3.9
11-21-94 1150 1.2 554 11.5 1,270 3.1 0 980 4.6 190 Johnstown 08-15-94 1000 .13 60 12.0 2,130 3.1 0 2,380 30
11-21-94 1100 .10 47 11.5 2,370 3.0 0 2,110 14 191 Johnstown 08-15-94 1115 .01 5.0 16.5 3,020 2.8 0 4,140 5.6 192 Johnstown 08-15-94 1200 <.01 2.1 15.0 3,120 3.3 0 4,280 20 193 Johnstown 08-15-94 1245 <.01 2.0 15.5 1,110 6.9 194 1,060 34 194 Johnstown 08-15-94 1340 .03 13 11.5 1,720 6.8 132 1,740 30 195 Johnstown 08-15-94 1400 .01 6.4 14.5 765 7.1 168 580 32 196 Johnstown 08-15-94 1445 .03 12 12.5 903 6.8 224 704 40 197 Johnstown 08-15-94 1525 .13 60 12.0 780 7.2 134 656 29 198 Johnstown 08-15-94 1700 <.01 .3 17.5 1,020 4.0 0 968 <1.0 199 Johnstown 08-15-94 1800 <.01 .5 20.0 965 7.1 156 744 29 200 Windber 08-22-94 1100 .02 7.5 8.5 305 4.6 2 316 22 201 Windber 08-22-94 1210 <.01 1.6 11.5 258 4.2 0 260 18 202 Central City 08-03-92 1200 .12 54 14.0 2,090 6.1 138 2,350 18 203 Central City 08-03-92 1540 <.01 <.1 15.0 3,100 3.8 0 4,100 16 204 Hooversville 08-04-92 1110 .13 60 12.0 2,450 2.7 0 2,510 7.0
05-09-94 0945 .35 158 10.5 620 3.1 0 382 5.1 205 Hooversville 08-04-92 1445 .17 75 11.5 1,280 6.3 150 1,080 44 206 Hooversville 10-11-94 1630 .02 7.2 10.5 516 7.1 102 438 30 207 Hooversville 08-04-92 1600 .49 221 11.0 907 4.9 2 926 3.9
09-01-93 1210 .35 156 11.0 975 4.2 1 918 2.7 208 Somerset 08-05-92 1050 .83 374 11.0 694 6.2 0 2,270 <1.0
08-19-93 1115 .55 248 11.5 730 6.0 56 606 3005-04-94 0820 1.1 475 10.0 625 5.8 40 464 24
209 Somerset 08-05-92 1130 .14 64 19.5 1,670 3.5 46 534 15 210 Berlin 08-05-92 1535 .22 97 10.5 872 5.8 38 746 19 211 Berlin 08-06-92 1000 1.2 487 16.5 1090 6.6 84 744 17 212 New Baltimore 07-07-93 0945 .66 26 18.5 1,940 3.3 0 1,950 <1.0 213 Central City 07-07-93 1110 .01 2.3 18.5 1,780 3.0 0 1,710 4.1 214 Windber 07-07-93 1300 .03 12 19.0 814 3.1 0 624 <1.0 215 Windber 07-07-93 1420 .02 7.3 22.5 1,080 3.0 0 694 <1.0 216 Windber 07-07-93 1520 .02 6.7 17.5 584 5.5 17 608 <1.0 217 Windber 07-08-93 0835 .01 2.5 13.5 1,750 2.9 0 1,380 2.1
Appendix 3. Field data and laboratory analyses of mine discharges—Continued
Sitenumber
Localidentifier
(Topographicquadrangle)
Date Time
Discharge,instan-
taneous(ft3/s)
Flow rate,instan-taneous(gal/min)
Temper-ature,water(°C)
Specificconduc-tance
(µS/cm)
pH, waterwholefield
(standardunits)
Alkalinity,water
(mg/L asCaCO3)
Residue at105 °C,
dissolved(mg/L)
Carbon,inorganic,
total(mg/Las C)

73
05-11-94 800 <0.2 95,000 85,000 80,000 6,000 5,900 700 700 172 208-06-92 1,400 .5 180,000 170,000 -- 2,000 2,000 44,000 43,000 820 47009-01-93 2,000 .4 120,000 120,000 1,400 2,400 2,400 51,000 51,000 780 43805-09-94 960 .3 80,000 79,000 900 1,100 1,100 25,000 25,000 476 27607-14-93 900 <.2 28,000 26,000 900 13,000 12,000 3,300 3,200 146 9607-14-93 120 <.2 15,000 14,000 -- 2,200 2,100 <130 <130 17 --07-14-93 210 .2 1,400 1,100 -- 2,700 3,100 3,900 3,900 40 407-15-93 2,300 <.2 120,000 120,000 110,000 4,200 4,200 24,000 24,000 448 11404-19-94 2,100 .4 150,000 150,000 150,000 3,400 3,300 30,000 29,000 640 17807-15-93 2,400 .3 61,000 54,000 2,400 4,000 4,000 28,000 27,000 580 38608-10-94 1,600 .5 15,000 8,000 -- 3,800 3,800 13,000 6,100 80 --07-15-93 1,300 .3 26,000 25,000 980 3,100 3,000 22,000 22,000 380 21604-19-94 1,100 .4 33,000 33,000 680 2,500 2,500 15,000 15,000 306 17207-15-93 2,400 .6 31,000 31,000 7,000 42,000 42,000 100,000 100,000 820 16804-19-94 1,400 .6 5,900 5,500 1,500 23,000 23,000 65,000 65,000 512 6808-10-94 690 .2 1,300 1,200 180 700 690 6,400 6,200 100 1511-21-94 1,100 .2 1,800 1,500 170 810 740 7,300 6,600 70 1708-15-94 1,600 .6 18,000 17,000 5,400 4,100 4,100 3,400 3,400 140 5811-21-94 3,200 .6 26,000 23,000 5,700 5,000 4,600 3,900 3,600 140 8408-15-94 3,000 1.3 180,000 97,000 180,000 8,500 8,400 8,900 8,700 478 31408-15-94 2,900 1.4 190,000 190,000 160,000 9,500 9,400 12,000 12,000 526 10008-15-94 470 .2 1,400 980 -- 130 100 <130 <130 0 --08-15-94 960 .3 28,000 26,000 -- 2,900 2,900 <130 <130 0 --08-15-94 120 <.2 100 <10 -- 10 <10 <130 <130 0 --08-15-94 220 <.2 30 <10 -- <10 <10 <130 <130 0 --08-15-94 250 .2 1,900 <10 -- 79 12 340 <130 0 --08-15-94 370 <.2 3,800 2,600 2,300 720 720 10,000 10,000 78 --08-15-94 160 .3 230 22 -- 170 150 160 <130 0 --08-22-94 140 .3 240 50 -- 520 490 680 610 24 --08-22-94 110 .3 350 130 -- 630 570 670 580 26 --08-03-92 1,300 <.2 150 150 -- 86 41 640 220 0 --08-03-92 2,100 .7 7,000 6,400 -- 24,000 22,000 17,000 16,000 160 708-04-92 1,400 .3 48,000 48,000 -- 3,100 3,100 55,000 54,000 620 25605-09-94 320 <.2 1,900 1,900 200 270 270 4,800 4,800 80 2808-04-92 610 .3 52,000 51,000 -- 1,100 1,100 200 <100 0 010-11-94 180 <.2 420 <10 -- 23 <10 190 <130 0 --08-04-92 550 .3 4,200 560 -- 950 940 6,200 4,000 42 009-01-93 710 .2 4,400 750 900 1,200 1,200 9,000 8,000 56 --08-05-92 1,300 .7 3,700 3,700 -- 13,000 13,000 120,000 120,000 680 3008-19-93 350 .2 9,500 4,800 -- 1,300 1,300 3,500 370 0 --05-04-94 330 .3 6,100 2,100 -- 1,100 1,100 2,300 440 0 --08-05-92 300 .3 8,700 3,700 -- 1,200 1,200 3,600 200 0 008-05-92 450 <.2 8,100 7,500 -- 4,600 4,300 200 300 0 008-06-92 430 .2 1,200 50 -- 1,600 1,600 <130 <130 0 --07-07-93 1,300 .6 2,400 2,000 990 53,000 51,000 33,000 32,000 252 2407-07-93 1,200 .6 35,000 32,000 7,100 11,000 10,000 39,000 36,000 396 14207-07-93 440 .4 870 840 220 2,000 2,000 5,900 5,900 58 1107-07-93 610 .4 4,000 2,600 540 6,600 6,500 4,700 4,300 108 6207-07-93 490 <.2 78,000 76,000 -- 4,100 4,100 290 <130 120 --07-08-93 990 .3 44,000 43,000 3,000 3,100 3,000 19,000 18,000 356 214
Appendix 3. Field data and laboratory analyses of mine discharges—Continued
Date
Sulfate,dissolved
(mg/Las SO4)
Fluoride,total
(mg/L as F)
Iron, totalrecoverable
(µg/Las Fe
Iron,dissolved
(µg/Las Fe
Iron,ferrous,
dissolved(µg/Las Fe
Manganese,total
recoverable(µg/Las Mn
Manganese,dissolved
(µg/Las Mn)
Aluminum,total
recoverable(µg/Las Al)
Aluminum,dissolved
(µg/Las Al)
Acidity,total
heated(mg/L asCaCO3)
Acidity,mineral(methylorange)(mg/L asCaCO3)

74
218 Windber 07-08-93 1010 0.07 33 10.5 1,350 5.6 80 1,100 28 219 Ogletown 07-08-93 1130 .04 18 27.0 3,270 2.4 0 3,530 1.0
05-03-94 1530 .15 68 11.0 1,500 2.6 0 1,310 1.0 220 Windber 07-08-93 1300 .02 8.6 10.0 782 3.5 0 514 1.4 221 Windber 07-08-93 1440 .13 60 16.5 1,280 3.2 0 1,190 1.1 222 Windber 07-08-93 1523 .00 1.2 13.0 572 5.6 24 662 8.7 223 Somerset 08-16-94 1100 .06 25 16.0 460 5.6 10 508 5.1 224 Windber 08-16-93 1420 .07 30 15.0 1,510 6.4 180 1,490 54 225 Stoystown 08-17-93 1525 .02 -- 12.5 1,180 5.5 40 -- 7.9
08-16-93 1620 .13 60 12.5 995 6.3 26 946 13 226 Stoystown 08-17-93 1525 .02 7.5 12.5 1,180 5.5 40 364 7.9 227 Stoystown 08-18-93 1200 .02 7.5 19.5 2,590 3.0 0 2,990 <1.0
04-21-94 1015 .19 85 9.0 1,890 2.8 0 1,760 <1.0 228 Hooversville 08-19-93 1115 <.01 <.1 10.0 1,760 5.5 24 1,990 25 229 Windber 08-22-94 1600 .05 24 15.0 628 6.2 20 638 3.8 230 Windber 08-22-94 1700 .02 7.2 16.5 605 6.1 34 534 11 231 Windber 09-06-94 1045 .11 48 10.5 1,010 3.4 0 1,010 2.8 232 Windber 09-06-94 1210 <.01 1.3 20.0 2,270 2.7 0 2,060 3.0 233 Windber 09-06-94 1250 <.01 1.0 20.0 1,920 2.7 0 1,780 <1.0 234 Windber 09-06-94 1350 .02 7.9 16.5 1,430 3.5 0 1,030 5.4 235 Windber 09-06-94 1420 .02 7.9 15.0 700 3.7 0 672 1.3 236 Windber 09-12-94 1015 .10 45 9.5 1,120 5.4 15 1,130 18 237 Windber 09-06-94 1420 .02 7.9 15.0 700 3.7 0 672 1.3
09-12-94 1115 <.01 .2 10.5 938 3.6 0 884 6.3 238 Windber 09-12-94 1215 .03 14 10.0 1,060 5.3 40 1,080 24 239 Windber 09-12-94 1310 <.01 .1 11.0 266 6.0 44 196 20 240 Windber 09-12-94 1515 <.01 .2 14.0 595 5.8 10 616 1.5 241 Hooversville 09-13-94 0845 .01 3.4 10.5 302 5.5 3 250 7.1 242 Hooversville 09-13-94 1000 .05 22 18.5 11,600 2.3 0 27,340 2.2
11-21-94 1415 .04 18 17.5 9,700 2.2 0 20,320 3.3 243 Hooversville 09-19-94 1320 .02 7.9 11.0 353 6.3 28 268 8.6 244 Hooversville 09-19-94 1400 .01 4.8 10.0 313 6.3 32 316 12 245 Hooversville 09-19-94 1730 .30 12 16.5 834 6.0 36 788 8.3 246 Windber 09-19-94 1750 .01 3.9 15.5 1,120 6.4 30 1,180 6.9 247 Windber 09-19-94 1820 .15 67 15.5 1,350 6.6 54 1,500 12 248 Johnstown 09-20-94 0900 .25 114 11.5 1,840 6.2 58 1,810 23 249 Hooversville 09-21-94 1130 .09 41 13.0 1,260 4.8 1 1,390 4.0 250 Hooversville 09-21-94 1200 <.01 1.4 14.0 1,420 3.1 0 1,420 <1.0 251 Hooversville 09-21-94 1230 <.01 .7 14.5 1,780 2.9 0 1,590 <1.0 252 Hooversville 09-21-94 1340 <.01 .8 13.5 1,650 3.3 0 2,110 3.6 253 Hooversville 09-21-94 1500 <.01 1.9 16.5 1,430 3.7 0 1,920 <1.0 254 Hooversville 09-21-94 1600 <.01 1.0 16.5 820 3.4 0 690 <1.0 255 Hooversville 09-21-94 1740 .05 24 10.5 560 5.7 64 480 30 256 Somerset 09-26-94 1030 <.01 .8 10.0 133 5.8 28 102 9.4 257 Somerset 09-26-94 1200 <.01 1.1 14.0 671 6.9 84 576 21 258 Somerset 09-26-94 1300 .01 3.3 14.5 1,310 3.8 0 1,380 5.0 259 Hooversville 09-26-94 1450 1.9 867 11.5 878 6.3 98 748 24 260 Hooversville 09-27-94 0900 .04 18 10.0 353 6.0 38 296 7.4 261 Stoystown 10-03-94 1100 .21 96 11.5 1,120 4.6 1 1,000 2.1 262 Stoystown 10-03-94 1300 .01 3.0 11.5 367 6.4 16 296 7.0
Appendix 3. Field data and laboratory analyses of mine discharges—Continued
Sitenumber
Localidentifier
(Topographicquadrangle)
Date Time
Discharge,instan-
taneous(ft3/s)
Flow rate,instan-taneous(gal/min)
Temper-ature,water(°C)
Specificconduc-tance
(µS/cm)
pH, waterwholefield
(standardunits)
Alkalinity,water
(mg/L asCaCO3)
Residue at105 °C,
dissolved(mg/L)
Carbon,inorganic,
total(mg/Las C)
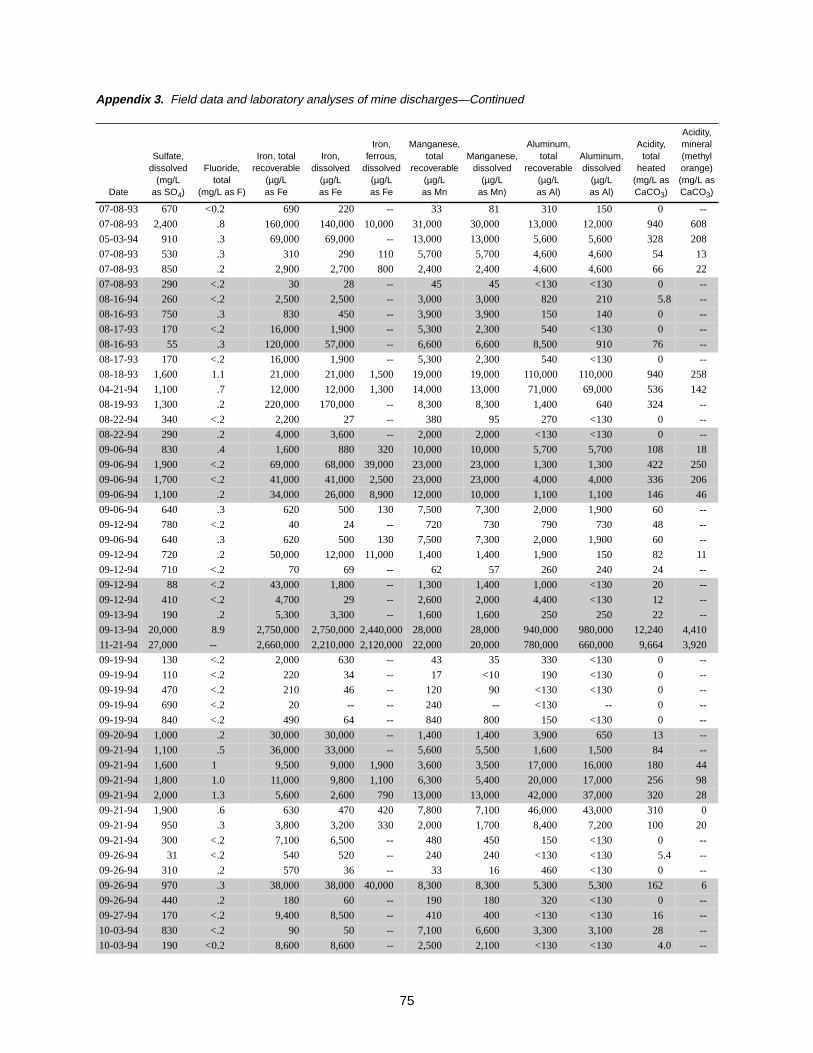
75
07-08-93 670 <0.2 690 220 -- 33 81 310 150 0 --07-08-93 2,400 .8 160,000 140,000 10,000 31,000 30,000 13,000 12,000 940 60805-03-94 910 .3 69,000 69,000 -- 13,000 13,000 5,600 5,600 328 20807-08-93 530 .3 310 290 110 5,700 5,700 4,600 4,600 54 1307-08-93 850 .2 2,900 2,700 800 2,400 2,400 4,600 4,600 66 2207-08-93 290 <.2 30 28 -- 45 45 <130 <130 0 --08-16-94 260 <.2 2,500 2,500 -- 3,000 3,000 820 210 5.8 --08-16-93 750 .3 830 450 -- 3,900 3,900 150 140 0 --08-17-93 170 <.2 16,000 1,900 -- 5,300 2,300 540 <130 0 --08-16-93 55 .3 120,000 57,000 -- 6,600 6,600 8,500 910 76 --08-17-93 170 <.2 16,000 1,900 -- 5,300 2,300 540 <130 0 --08-18-93 1,600 1.1 21,000 21,000 1,500 19,000 19,000 110,000 110,000 940 25804-21-94 1,100 .7 12,000 12,000 1,300 14,000 13,000 71,000 69,000 536 14208-19-93 1,300 .2 220,000 170,000 -- 8,300 8,300 1,400 640 324 --08-22-94 340 <.2 2,200 27 -- 380 95 270 <130 0 --08-22-94 290 .2 4,000 3,600 -- 2,000 2,000 <130 <130 0 --09-06-94 830 .4 1,600 880 320 10,000 10,000 5,700 5,700 108 1809-06-94 1,900 <.2 69,000 68,000 39,000 23,000 23,000 1,300 1,300 422 25009-06-94 1,700 <.2 41,000 41,000 2,500 23,000 23,000 4,000 4,000 336 20609-06-94 1,100 .2 34,000 26,000 8,900 12,000 10,000 1,100 1,100 146 4609-06-94 640 .3 620 500 130 7,500 7,300 2,000 1,900 60 --09-12-94 780 <.2 40 24 -- 720 730 790 730 48 --09-06-94 640 .3 620 500 130 7,500 7,300 2,000 1,900 60 --09-12-94 720 .2 50,000 12,000 11,000 1,400 1,400 1,900 150 82 1109-12-94 710 <.2 70 69 -- 62 57 260 240 24 --09-12-94 88 <.2 43,000 1,800 -- 1,300 1,400 1,000 <130 20 --09-12-94 410 <.2 4,700 29 -- 2,600 2,000 4,400 <130 12 --09-13-94 190 .2 5,300 3,300 -- 1,600 1,600 250 250 22 --09-13-94 20,000 8.9 2,750,000 2,750,000 2,440,000 28,000 28,000 940,000 980,000 12,240 4,41011-21-94 27,000 -- 2,660,000 2,210,000 2,120,000 22,000 20,000 780,000 660,000 9,664 3,92009-19-94 130 <.2 2,000 630 -- 43 35 330 <130 0 --09-19-94 110 <.2 220 34 -- 17 <10 190 <130 0 --09-19-94 470 <.2 210 46 -- 120 90 <130 <130 0 --09-19-94 690 <.2 20 -- -- 240 -- <130 -- 0 --09-19-94 840 <.2 490 64 -- 840 800 150 <130 0 --09-20-94 1,000 .2 30,000 30,000 -- 1,400 1,400 3,900 650 13 --09-21-94 1,100 .5 36,000 33,000 -- 5,600 5,500 1,600 1,500 84 --09-21-94 1,600 1 9,500 9,000 1,900 3,600 3,500 17,000 16,000 180 4409-21-94 1,800 1.0 11,000 9,800 1,100 6,300 5,400 20,000 17,000 256 9809-21-94 2,000 1.3 5,600 2,600 790 13,000 13,000 42,000 37,000 320 2809-21-94 1,900 .6 630 470 420 7,800 7,100 46,000 43,000 310 009-21-94 950 .3 3,800 3,200 330 2,000 1,700 8,400 7,200 100 2009-21-94 300 <.2 7,100 6,500 -- 480 450 150 <130 0 --09-26-94 31 <.2 540 520 -- 240 240 <130 <130 5.4 --09-26-94 310 .2 570 36 -- 33 16 460 <130 0 --09-26-94 970 .3 38,000 38,000 40,000 8,300 8,300 5,300 5,300 162 609-26-94 440 .2 180 60 -- 190 180 320 <130 0 --09-27-94 170 <.2 9,400 8,500 -- 410 400 <130 <130 16 --10-03-94 830 <.2 90 50 -- 7,100 6,600 3,300 3,100 28 --10-03-94 190 <0.2 8,600 8,600 -- 2,500 2,100 <130 <130 4.0 --
Appendix 3. Field data and laboratory analyses of mine discharges—Continued
Date
Sulfate,dissolved
(mg/Las SO4)
Fluoride,total
(mg/L as F)
Iron, totalrecoverable
(µg/Las Fe
Iron,dissolved
(µg/Las Fe
Iron,ferrous,
dissolved(µg/Las Fe
Manganese,total
recoverable(µg/Las Mn
Manganese,dissolved
(µg/Las Mn)
Aluminum,total
recoverable(µg/Las Al)
Aluminum,dissolved
(µg/Las Al)
Acidity,total
heated(mg/L asCaCO3)
Acidity,mineral(methylorange)(mg/L asCaCO3)

76
263 Stoystown 10-03-94 1630 0.01 4.8 15.5 1,290 6.5 54 1,340 14 264 Stoystown 10-03-94 1710 <.01 1.6 13.5 2,570 6.4 340 3,090 97 265 Central City 10-11-94 0930 <.01 1.2 9.5 1,270 6.3 84 -- 9.2 266 Central City 10-11-94 1010 <.01 .8 8.0 2,160 6.8 168 1,650 44 267 Windber 10-11-94 1110 <.01 .4 10.5 210 6.6 90 148 26 268 Geistown 10-11-94 1330 .09 40 11.5 1,200 6.3 64 1,230 19 269 Hooversville 10-11-94 1745 .01 4.8 10.0 1,010 3.7 0 1,020 >2.7 270 Hooversville 10-11-94 1840 .18 80 9.5 713 6.6 112 682 28
Appendix 3. Field data and laboratory analyses of mine discharges—Continued
Sitenumber
Localidentifier
(Topographicquadrangle)
Date Time
Discharge,instan-
taneous(ft3/s)
Flow rate,instan-taneous(gal/min)
Temper-ature,water(°C)
Specificconduc-tance
(µS/cm)
pH, waterwholefield
(standardunits)
Alkalinity,water
(mg/L asCaCO3)
Residue at105 °C,
dissolved(mg/L)
Carbon,inorganic,
total(mg/Las C)

77
10-03-94 910 <0.2 16,000 14,000 -- 1,700 1,500 <130 <130 0 --10-03-94 1,400 <.2 2,900 2,400 -- 14,000 13,000 <130 <130 0 --10-11-94 480 .3 72,000 63,000 -- 5,400 5,100 480 <130 32 --10-11-94 480 .2 6,500 4,200 -- 310 310 <130 <130 0 --10-11-94 4.5 <.2 15,000 12,000 -- 3,000 3,000 <130 <130 0 --10-11-94 680 <.2 700 280 -- 680 680 880 300 0 --10-11-94 980 <.2 290 180 100 500 500 12,000 12,000 80 510-11-94 310 .2 110 13 -- 10 <10 200 <130 0 --
Appendix 3. Field data and laboratory analyses of mine discharges—Continued
Date
Sulfate,dissolved
(mg/Las SO4)
Fluoride,total
(mg/L as F)
Iron, totalrecoverable
(µg/Las Fe
Iron,dissolved
(µg/Las Fe
Iron,ferrous,
dissolved(µg/Las Fe
Manganese,total
recoverable(µg/Las Mn
Manganese,dissolved
(µg/Las Mn)
Aluminum,total
recoverable(µg/Las Al)
Aluminum,dissolved
(µg/Las Al)
Acidity,total
heated(mg/L asCaCO3)
Acidity,mineral(methylorange)(mg/L asCaCO3)

78
Appendix 4. Prioritization index (PI) for all mine discharges
[lb/d, pounds per day; gal/min, gallons per minute; <, less than]Appendix 4. Prioritization index (PI) for all mine discharges—Continued
Sitenumber
pH(units)
Iron,total(lb/d
as Fe)
Rank Score
Acidity,total
heated(lb/d asCaCO3)
Rank Score
Sulfate,total
(lb/d asCaCO3)
Rank Score
Aluminum,dissolved
(lb/das Al)
Rank Score
Manganese,total(lb/d
as Mn)
Rank Score
Discharge,instan-
taneous,(gal/min)
Finalscore
PI
16 3.3 1,700 1 10 6,750 1 10 29,700 1 10 486 2 10 232 1 10 2,250 50 1
19 5.1 876 3 10 1,580 6 10 10,300 4 10 25.6 20 10 85.4 4 10 1,780 50 2
81 4.8 116 13 10 739 11 10 12,100 3 10 31.9 17 10 47.0 10 10 1,400 50 3
95 4.6 41.2 24 10 353 23 10 8,120 6 10 34.1 15 10 23.5 19 10 981 50 4
4 2.8 125 11 10 1,130 8 10 4,010 17 10 83.5 7 10 21.7 20 10 348 50 5
125 2.4 351 6 10 3,180 3 10 8,640 5 10 232 4 10 178 2 10 225 50 6
22 3.0 80.6 16 10 538 15 10 2,016 24 10 25.5 21 10 20.2 22 10 224 50 7
3 2.8 140 10 10 1,170 7 10 2,976 19 10 100 5 10 42.8 11 10 155 50 8
110 4.5 162 9 10 539 14 10 4,200 16 10 18.9 26 10 12.4 30 9 449 49 9
208 6.2 16.6 39 9 3,050 4 10 5,830 10 10 539 1 10 58.3 9 10 374 49 10
104 3.0 16.3 41 9 466 18 10 3,840 18 10 31.2 18 10 33.6 12 10 200 49 11
141 2.7 121 12 10 751 10 10 864 49 9 42.6 10 10 63.4 7 10 48 49 12
242 2.3 726 4 10 3,230 2 10 5,280 12 10 259 3 10 7.39 42 9 22 49 13
14 3.6 8.44 62 8 844 9 10 7,000 8 10 93.0 6 10 64.2 6 10 799 48 14
103 3.2 7.85 67 8 481 17 10 5,760 11 10 34.0 16 10 25.6 16 10 436 48 15
63 3.4 13.6 45 9 465 19 10 864 48 9 63.2 8 10 25.9 14 10 277 48 16
97 3.2 66.2 19 10 440 21 10 2,360 21 10 35.5 14 10 3.31 67 8 197 48 17
160 3.1 12.1 49 9 246 27 10 1,970 25 10 14.6 31 9 26.7 13 10 171 48 18
15 3.6 69.1 18 10 256 26 10 1,130 42 9 18.4 28 9 19.6 23 10 96 48 19
38 3.0 61.8 21 10 414 22 10 796 51 9 38.4 13 10 6.08 47 9 78 48 20
188 2.6 19.0 37 9 502 16 10 1,470 32 9 61.2 9 10 25.7 15 10 51 48 21
121 6.0 13.8 44 9 138 41 9 7,250 7 10 5.98 52 9 17.0 26 10 1,510 47 22
149 5.7 1116 2 10 2010 5 10 5,950 9 10 2.16 76 8 11.2 34 9 310 47 23
6 4.4 36.4 28 9 125 45 9 2310 22 10 22.4 22 10 12.9 29 9 306 47 24
164 2.8 30.3 32 9 303 25 10 978 45 9 18.6 27 10 5.94 48 9 97 47 25
189 3.4 8.41 64 8 647 12 10 4460 15 10 40.1 11 10 4.53 61 8 539 46 26
176 5.9 436 5 10 642 13 10 1780 27 10 .40 126 6 24.2 18 10 330 46 27
17 3.3 11.6 51 9 198 33 9 1260 36 9 17.0 29 9 6.48 45 9 284 45 28
7 3.0 12.0 50 9 197 34 9 721 53 9 21.8 23 10 2.62 78 8 91 45 29
204 2.7 34.6 30 9 446 20 10 1010 44 9 38.9 12 10 2.23 85 7 60 45 30
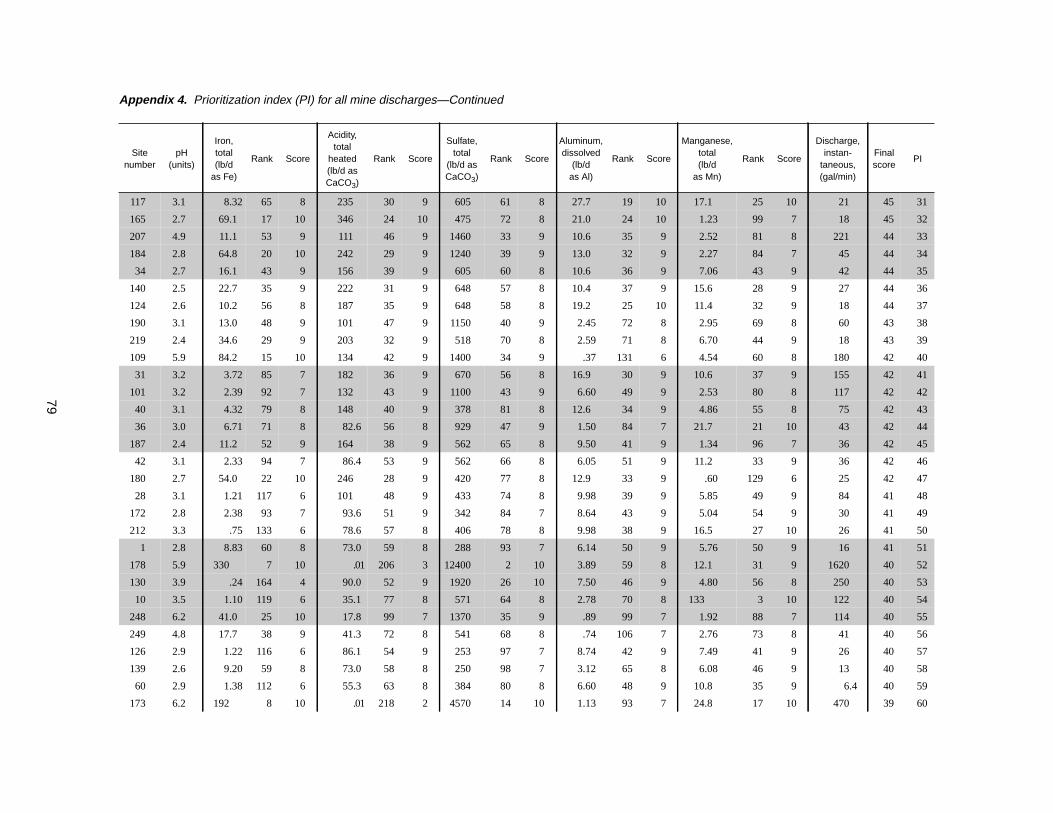
79
117 3.1 8.32 65 8 235 30 9 605 61 8 27.7 19 10 17.1 25 10 21 45 31
165 2.7 69.1 17 10 346 24 10 475 72 8 21.0 24 10 1.23 99 7 18 45 32
207 4.9 11.1 53 9 111 46 9 1460 33 9 10.6 35 9 2.52 81 8 221 44 33
184 2.8 64.8 20 10 242 29 9 1240 39 9 13.0 32 9 2.27 84 7 45 44 34
34 2.7 16.1 43 9 156 39 9 605 60 8 10.6 36 9 7.06 43 9 42 44 35
140 2.5 22.7 35 9 222 31 9 648 57 8 10.4 37 9 15.6 28 9 27 44 36
124 2.6 10.2 56 8 187 35 9 648 58 8 19.2 25 10 11.4 32 9 18 44 37
190 3.1 13.0 48 9 101 47 9 1150 40 9 2.45 72 8 2.95 69 8 60 43 38
219 2.4 34.6 29 9 203 32 9 518 70 8 2.59 71 8 6.70 44 9 18 43 39
109 5.9 84.2 15 10 134 42 9 1400 34 9 .37 131 6 4.54 60 8 180 42 40
31 3.2 3.72 85 7 182 36 9 670 56 8 16.9 30 9 10.6 37 9 155 42 41
101 3.2 2.39 92 7 132 43 9 1100 43 9 6.60 49 9 2.53 80 8 117 42 42
40 3.1 4.32 79 8 148 40 9 378 81 8 12.6 34 9 4.86 55 8 75 42 43
36 3.0 6.71 71 8 82.6 56 8 929 47 9 1.50 84 7 21.7 21 10 43 42 44
187 2.4 11.2 52 9 164 38 9 562 65 8 9.50 41 9 1.34 96 7 36 42 45
42 3.1 2.33 94 7 86.4 53 9 562 66 8 6.05 51 9 11.2 33 9 36 42 46
180 2.7 54.0 22 10 246 28 9 420 77 8 12.9 33 9 .60 129 6 25 42 47
28 3.1 1.21 117 6 101 48 9 433 74 8 9.98 39 9 5.85 49 9 84 41 48
172 2.8 2.38 93 7 93.6 51 9 342 84 7 8.64 43 9 5.04 54 9 30 41 49
212 3.3 .75 133 6 78.6 57 8 406 78 8 9.98 38 9 16.5 27 10 26 41 50
1 2.8 8.83 60 8 73.0 59 8 288 93 7 6.14 50 9 5.76 50 9 16 41 51
178 5.9 330 7 10 .01 206 3 12400 2 10 3.89 59 8 12.1 31 9 1620 40 52
130 3.9 .24 164 4 90.0 52 9 1920 26 10 7.50 46 9 4.80 56 8 250 40 53
10 3.5 1.10 119 6 35.1 77 8 571 64 8 2.78 70 8 133 3 10 122 40 54
248 6.2 41.0 25 10 17.8 99 7 1370 35 9 .89 99 7 1.92 88 7 114 40 55
249 4.8 17.7 38 9 41.3 72 8 541 68 8 .74 106 7 2.76 73 8 41 40 56
126 2.9 1.22 116 6 86.1 54 9 253 97 7 8.74 42 9 7.49 41 9 26 40 57
139 2.6 9.20 59 8 73.0 58 8 250 98 7 3.12 65 8 6.08 46 9 13 40 58
60 2.9 1.38 112 6 55.3 63 8 384 80 8 6.60 48 9 10.8 35 9 6.4 40 59
173 6.2 192 8 10 .01 218 2 4570 14 10 1.13 93 7 24.8 17 10 470 39 60
Appendix 4. Prioritization index (PI) for all mine discharges—Continued
Sitenumber
pH(units)
Iron,total(lb/d
as Fe)
Rank Score
Acidity,total
heated(lb/d asCaCO3)
Rank Score
Sulfate,total
(lb/d asCaCO3)
Rank Score
Aluminum,dissolved
(lb/das Al)
Rank Score
Manganese,total(lb/d
as Mn)
Rank Score
Discharge,instan-
taneous,(gal/min)
Finalscore
PI

80
11 4.4 9.47 57 8 32.6 80 8 588 63 8 1.31 89 7 2.61 79 8 136 39 61
44 3.6 .22 170 4 99.0 49 9 1150 41 9 8.62 44 9 3.99 63 8 133 39 62
231 3.4 .92 125 6 62.2 62 8 478 71 8 3.28 62 8 5.76 51 9 48 39 63
5 4.5 .16 180 4 38.5 75 8 1560 31 9 3.27 64 8 10.6 36 9 341 38 64
221 3.2 2.09 96 7 47.5 68 8 612 59 8 3.31 61 8 1.73 92 7 60 38 65
55 5.7 38.9 27 10 50.8 66 8 340 85 7 .07 182 4 5.40 52 9 45 38 66
156 3.5 1.90 100 7 43.2 71 8 605 62 8 5.18 56 8 1.21 101 7 36 38 67
76 3.4 7.14 69 8 52.9 65 8 239 99 7 4.12 58 8 1.34 95 7 35 38 68
166 2.7 23.4 34 9 128 44 9 234 100 7 7.02 47 9 .30 164 4 13 38 69
20 2.4 40.0 26 10 165 37 9 227 103 7 1.34 87 7 .50 138 5 .7 38 70
144 6.0 28.9 33 9 .01 208 3 2220 23 10 .29 139 5 77.7 5 10 185 37 71
261 4.6 .10 195 3 32.3 81 8 956 46 9 3.57 60 8 8.18 39 9 96 37 72
70 4.0 .10 196 3 71.8 60 8 394 79 8 8.36 45 9 7.87 40 9 41 37 73
227 3.0 1.89 101 7 84.6 55 8 144 118 6 9.90 40 9 1.71 93 7 7.5 37 74
24 3.0 7.56 68 8 30.2 83 7 122 124 6 2.23 74 8 4.68 58 8 3 37 75
142 2.2 4.20 81 8 33.6 79 8 102 132 6 1.47 85 7 2.79 72 8 2.5 37 76
211 6.6 7.01 70 8 .01 243 2 2510 20 10 .76 102 7 9.35 38 9 487 36 77
225 6.3 86.4 14 10 54.7 64 8 39.6 171 4 .66 110 6 4.75 57 8 60 36 78
21 3.3 3.81 84 7 34.2 78 8 348 83 7 .66 109 6 3.92 64 8 46 36 79
155 3.2 .94 123 6 36.0 76 8 336 86 7 3.12 66 8 1.20 102 7 20 36 80
46 3.2 1.80 103 7 50.4 67 8 118 126 6 5.28 55 8 1.18 104 7 20 36 81
8 2.8 4.32 80 8 39.0 74 8 104 130 6 4.32 57 8 .57 134 6 5.8 36 82
59 2.9 2.72 90 7 24.6 88 7 100 133 6 2.05 78 8 2.90 71 8 3.1 36 83
79 2.2 31.2 31 9 94.6 50 9 149 116 6 2.38 73 8 .24 172 4 2 36 84
170 6.2 16.5 40 9 .01 220 2 1700 30 9 .34 136 5 59.6 8 10 142 35 85
12 6.4 13.4 46 9 .01 228 2 1750 29 9 .21 148 5 17.5 24 10 86 35 86
62 3.5 .23 169 4 39.9 73 8 162 113 6 5.62 54 9 3.06 68 8 52 35 87
58 5.9 19.7 36 9 19.3 97 7 332 88 7 .21 145 5 1.85 89 7 35 35 88
186 4.8 3.96 82 7 21.1 95 7 422 75 8 1.61 82 7 1.00 109 6 22 35 89
100 5.8 .21 173 4 5.07 137 5 1770 28 9 1.86 79 8 2.91 70 8 352 34 90
Appendix 4. Prioritization index (PI) for all mine discharges—Continued
Sitenumber
pH(units)
Iron,total(lb/d
as Fe)
Rank Score
Acidity,total
heated(lb/d asCaCO3)
Rank Score
Sulfate,total
(lb/d asCaCO3)
Rank Score
Aluminum,dissolved
(lb/das Al)
Rank Score
Manganese,total(lb/d
as Mn)
Rank Score
Discharge,instan-
taneous,(gal/min)
Finalscore
PI

81
210 5.8 9.43 58 8 <0.01 205 3 524 69 8 0.35 134 6 5.35 53 9 97 34 91
75 3.3 1.98 99 7 28.8 85 7 176 111 6 1.22 90 7 1.22 100 7 30 34 92
161 3.2 .86 129 6 19.7 96 7 185 106 7 .62 112 6 2.64 77 8 20 34 93
129 3.7 .17 179 4 18.8 98 7 306 91 7 1.75 80 8 3.67 66 8 17 34 94
72 3.7 .08 205 3 45.4 69 8 144 117 6 5.78 53 9 4.54 59 8 8.6 34 95
191 2.8 10.8 54 9 28.7 86 7 180 107 7 .52 118 6 .51 137 5 5 34 96
259 6.3 1.87 102 7 .01 227 2 4580 13 10 1.35 86 7 1.98 87 7 867 33 97
111 3.4 .19 175 4 29.5 84 7 216 104 7 3.06 69 8 2.34 82 7 30 33 98
154 3.5 .74 134 6 16.8 100 7 232 101 7 .24 143 5 2.69 76 8 28 33 99
128 3.6 .08 206 3 22.2 91 7 336 87 7 2.15 77 8 3.70 65 8 28 33 100
177 2.7 4.96 75 8 43.7 70 8 84.0 141 5 3.28 63 8 .14 184 4 7 33 101
94 3.0 3.90 83 7 21.4 94 7 51.0 167 4 .75 103 7 4.50 62 8 2.5 33 102
73 3.5 1.73 104 7 15.0 102 7 76.8 147 5 1.09 94 7 2.30 83 7 1.6 33 103
137 5.3 .11 192 3 64.8 61 8 367 82 7 2.16 75 8 .67 126 6 180 32 104
13 6.0 5.18 74 8 .01 210 3 749 52 9 .25 142 5 1.81 91 7 52 32 105
169 6.0 13.3 47 9 21.6 93 7 130 121 6 .05 192 3 2.16 86 7 15 32 106
174 5.0 16.2 42 9 30.6 82 7 83.7 143 5 .07 181 4 1.17 105 7 7.5 32 107
71 3.8 .10 198 3 24.3 90 7 100 135 6 3.10 68 8 2.69 74 8 3.8 32 108
77 3.8 .10 199 3 24.3 89 7 100 134 6 3.10 67 8 2.69 75 8 3.8 32 109
32 3.4 .24 167 4 13.8 105 7 207 105 7 1.32 88 7 .93 113 6 18 31 110
116 3.6 .16 184 4 13.7 106 7 178 110 6 1.15 92 7 1.19 103 7 15 31 111
234 3.5 3.22 86 7 13.8 104 7 104 131 6 .10 169 4 1.14 106 7 7.9 31 112
205 6.3 46.8 23 10 .01 221 2 549 67 8 .09 176 4 .99 110 6 75 30 113
78 4.5 .02 235 2 21.8 92 7 679 54 9 .63 111 6 .94 112 6 65 30 114
179 3.8 8.55 61 8 15.5 101 7 72.0 150 5 .06 185 4 .54 135 6 7.5 30 115
209 3.5 6.68 72 8 .01 199 3 230 102 7 .15 156 5 .92 114 6 64 29 116
2 3.1 .41 148 5 9.94 115 6 107 128 6 .56 116 6 .95 111 6 9 29 117
181 3.3 1.68 106 7 8.76 119 6 54.0 161 5 .19 149 5 .78 119 6 5 29 118
162 3.1 .15 185 4 7.80 124 6 84.0 142 5 .72 107 7 1.02 107 7 5 29 119
192 3.3 4.79 76 8 13.3 107 7 73.1 149 5 .30 138 5 .24 173 4 2.1 29 120
Appendix 4. Prioritization index (PI) for all mine discharges—Continued
Sitenumber
pH(units)
Iron,total(lb/d
as Fe)
Rank Score
Acidity,total
heated(lb/d asCaCO3)
Rank Score
Sulfate,total
(lb/d asCaCO3)
Rank Score
Aluminum,dissolved
(lb/das Al)
Rank Score
Manganese,total(lb/d
as Mn)
Rank Score
Discharge,instan-
taneous,(gal/min)
Finalscore
PI

82
26 3.1 0.41 147 5 8.82 118 6 39.6 170 4 0.99 96 7 1.01 108 7 1.5 29 121
236 5.4 .02 238 2 25.9 87 7 421 76 8 .39 127 6 .39 153 5 45 28 122
56 4.2 .06 216 3 7.68 125 6 55.2 158 5 .84 101 7 1.27 98 7 20 28 123
82 6.1 8.21 66 8 8.06 123 6 69.1 151 5 .02 211 3 .68 124 6 12 28 124
175 3.2 2.22 95 7 7.20 128 6 28.8 187 4 .32 137 5 .66 128 6 5 28 125
151 6.5 4.54 77 8 .01 238 2 287 94 7 .15 157 5 .39 152 5 126 27 126
35 6.0 3.00 89 7 .01 207 3 173 112 6 .12 164 4 1.84 90 7 48 27 127
23 3.4 .04 226 2 14.4 103 7 51.8 166 4 1.58 83 7 1.30 97 7 12 27 128
112 3.5 .06 219 2 10.7 113 6 132 120 6 1.15 91 7 .75 120 6 12 27 129
215 3.0 .35 152 5 9.46 117 6 53.4 163 4 .38 129 6 .58 132 6 7.3 27 130
258 3.8 1.51 108 7 6.42 131 6 38.4 174 4 .21 147 5 .33 160 5 3.3 27 131
213 3.0 .97 122 6 10.9 111 6 33.1 178 4 .99 95 7 .30 163 4 2.3 27 132
185 2.7 1.39 111 6 13.2 108 7 54.7 159 5 .62 114 6 .09 198 3 1.9 27 133
152 6.5 .14 186 4 .01 236 2 1250 38 9 .35 135 6 .35 158 5 289 26 134
123 6.4 .51 143 5 .01 231 2 1250 37 9 .39 128 6 .15 182 4 248 26 135
54 6.7 10.5 55 8 .01 251 1 129 122 6 .19 151 5 .84 118 6 111 26 136
29 4.1 .01 254 1 11.9 110 6 141 119 6 1.62 81 8 .32 162 5 19 26 137
214 3.1 .13 188 4 8.35 122 6 63.4 154 5 .85 100 7 .29 165 4 12 26 138
41 5.5 8.42 63 8 13.0 109 6 52.9 164 4 .01 213 3 .44 146 5 9 26 139
48 4.5 .61 141 5 4.80 139 5 53.8 162 5 .27 141 5 .87 116 6 8 26 140
113 3.3 .04 227 2 8.72 120 6 94.8 138 5 .91 98 7 .58 131 6 7.9 26 141
158 3.8 1.20 118 6 5.10 136 5 21.6 196 3 .44 123 6 .72 122 6 .5 26 142
122 2.9 1.66 107 7 8.69 121 6 14.6 215 3 .74 104 7 .09 200 3 .2 26 143
223 5.6 .75 132 6 1.74 169 4 78.0 146 5 .06 186 4 .90 115 6 25 25 144
220 3.5 .03 232 2 5.57 134 6 54.7 160 5 .47 121 6 .59 130 6 8.6 25 145
235 3.7 .06 215 3 5.69 133 6 60.7 155 5 .18 152 5 .71 123 6 7.9 25 146
216 5.5 6.27 73 8 9.65 116 6 39.4 172 4 .01 225 2 .33 159 5 6.7 25 147
217 2.9 1.32 114 6 10.7 112 6 29.7 184 4 .54 117 6 .09 196 3 2.5 25 148
247 6.6 .39 149 5 .01 244 1 675 55 8 .10 168 4 .68 125 6 67 24 149
268 6.3 .34 156 5 .01 226 2 326 89 7 .14 158 5 .33 161 5 40 24 150
Appendix 4. Prioritization index (PI) for all mine discharges—Continued
Sitenumber
pH(units)
Iron,total(lb/d
as Fe)
Rank Score
Acidity,total
heated(lb/d asCaCO3)
Rank Score
Sulfate,total
(lb/d asCaCO3)
Rank Score
Aluminum,dissolved
(lb/das Al)
Rank Score
Manganese,total(lb/d
as Mn)
Rank Score
Discharge,instan-
taneous,(gal/min)
Finalscore
PI

83
224 6.4 0.30 160 5 <0.01 229 2 270 95 7 0.05 194 3 1.40 94 7 30 24 151
33 3.9 .03 231 2 4.44 143 5 86.7 139 5 .50 120 6 .57 133 6 8.4 24 152
114 3.5 .04 228 2 5.94 132 6 79.2 145 5 .58 115 6 .48 142 5 5.5 24 153
30 3.1 .11 191 3 7.39 127 6 24.8 193 3 .74 105 7 .40 150 5 4.4 24 154
232 2.7 1.08 120 6 6.58 130 6 29.6 185 4 .02 206 3 .36 157 5 1.3 24 155
127 2.6 1.72 105 7 7.58 126 6 25.0 192 3 .02 209 3 .50 140 5 1.3 24 156
39 6.2 .62 140 5 .01 216 3 159 114 6 .08 180 4 .46 143 5 63 23 157
96 6.3 .38 150 5 .01 223 2 437 73 8 .08 178 4 .29 167 4 52 23 158
194 6.8 4.37 78 8 .01 255 1 150 115 6 .02 207 3 .45 145 5 13 23 159
120 3.2 .51 142 5 10.1 114 6 31.5 182 4 .07 183 4 .19 176 4 7.5 23 160
115 3.6 .05 224 2 4.31 145 5 56.2 157 5 .37 130 6 .51 136 5 3.9 23 161
159 4.6 .09 204 3 2.54 162 5 21.3 197 3 .36 132 6 .66 127 6 2.3 23 162
163 3.0 .17 178 4 3.36 155 5 28.8 186 4 .17 154 5 .50 139 5 2 23 163
253 3.7 .01 242 2 7.07 129 6 43.3 168 4 .98 97 7 .18 180 4 1.9 23 164
138 2.7 .33 157 5 4.11 146 5 16.7 206 3 .21 146 5 .44 147 5 1.6 23 165
47 3.2 .73 135 6 3.69 151 5 14.8 214 3 .17 153 5 .27 169 4 1.6 23 166
171 6.6 .79 131 6 .01 247 1 124 123 6 .11 166 4 .42 149 5 69 22 167
135 6.6 .86 130 6 .01 242 2 180 108 7 .09 170 4 .10 192 3 60 22 168
202 6.1 .10 200 3 .01 212 3 842 50 9 .14 160 5 .06 218 2 54 22 169
255 5.7 2.05 97 7 .01 203 3 86.4 140 5 .04 199 3 .14 185 4 24 22 170
260 6.0 2.03 98 7 3.46 153 5 36.7 176 4 .03 203 3 .09 202 3 18 22 171
51 4.3 .07 212 3 5.18 135 6 43.2 169 4 .45 122 6 .09 201 3 18 22 172
167 3.5 .10 197 3 4.56 142 5 16.8 205 3 .43 124 6 .40 151 5 5 22 173
27 3.0 .36 151 5 5.04 138 5 10.6 230 2 .50 119 6 .14 183 4 1 22 174
218 5.6 .27 161 5 .01 202 3 265 96 7 .06 188 4 .01 241 2 33 21 175
9 6.1 3.06 88 7 .01 215 3 30.6 183 4 .01 215 3 .21 175 4 6.7 21 176
269 3.7 .02 241 2 4.61 141 5 56.5 156 5 .69 108 7 .03 228 2 4.8 21 177
132 5.9 .44 146 5 2.99 158 5 38.2 175 4 .01 229 2 .44 148 5 4.3 21 178
25 5.9 3.18 87 7 4.68 140 5 19.7 200 3 .01 237 2 .19 177 4 3.9 21 179
131 3.3 .93 124 6 2.31 164 4 15.6 207 3 .06 189 4 .18 178 4 3.1 21 180
Appendix 4. Prioritization index (PI) for all mine discharges—Continued
Sitenumber
pH(units)
Iron,total(lb/d
as Fe)
Rank Score
Acidity,total
heated(lb/d asCaCO3)
Rank Score
Sulfate,total
(lb/d asCaCO3)
Rank Score
Aluminum,dissolved
(lb/das Al)
Rank Score
Manganese,total(lb/d
as Mn)
Rank Score
Discharge,instan-
taneous,(gal/min)
Finalscore
PI

84
143 3.9 <0.01 256 1 4.33 144 5 21.8 195 3 0.62 113 6 0.86 117 6 1.4 21 181
250 3.1 .16 183 4 3.02 157 5 26.9 189 4 .27 140 5 .06 212 3 1.4 21 182
64 6.4 .66 137 5 .01 233 2 68.4 152 5 .02 205 3 .39 154 5 19 20 183
37 3.6 .09 203 3 2.94 159 5 21.2 198 3 .19 150 5 .25 171 4 6.8 20 184
105 3.7 .70 136 5 2.45 163 4 17.3 204 3 .07 184 4 .29 166 4 6 20 185
53 3.6 .07 210 3 3.97 149 5 28.2 188 4 .43 125 6 .04 223 2 4.6 20 186
134 4.1 .02 234 2 3.46 152 5 38.9 173 4 .11 167 4 .46 144 5 4 20 187
57 5.5 2.50 91 7 3.92 150 5 12.1 225 2 .01 245 1 .38 156 5 1.6 20 188
233 2.7 .49 144 5 4.03 147 5 20.4 199 3 .05 195 3 .28 168 4 1 20 189
252 3.3 .05 221 2 3.07 156 5 19.2 201 3 .36 133 6 .12 186 4 .8 20 190
118 2.6 .22 172 4 2.64 161 5 6.84 237 2 .23 144 5 .12 187 4 .3 20 191
197 7.2 1.37 113 6 .01 268 1 180 109 6 .09 173 4 .06 217 2 60 19 192
66 6.8 .35 153 5 .01 259 1 83.5 144 5 .09 175 4 .18 179 4 58 19 193
229 6.2 .63 138 5 .01 217 2 97.9 136 5 .04 200 3 .11 189 4 24 19 194
18 6.4 .87 128 6 .01 235 2 31.7 180 4 .01 216 3 .11 188 4 11 19 195
226 5.5 1.44 109 6 .01 200 3 15.3 210 3 .01 219 2 .48 141 5 7.5 19 196
80 2.7 .62 139 5 3.36 154 5 6.24 241 2 .12 162 5 .03 227 2 .4 19 197
65 5.8 .12 190 3 .01 204 3 97.4 137 5 .09 174 4 .08 203 3 58 18 198
157 6.7 .13 187 4 .01 249 1 73.4 148 5 .01 217 2 .73 121 6 3.6 18 199
168 6.0 .91 127 6 .52 180 4 18.5 202 3 .01 242 2 .09 195 3 2.3 18 200
89 3.5 .34 155 5 1.48 171 4 10.8 229 2 .06 187 4 .08 207 3 1.5 18 201
108 7.0 .07 213 3 .01 262 1 310 90 7 .09 172 4 .03 225 2 60 17 202
61 6.7 1.44 110 6 .01 252 1 15.1 213 3 .09 171 4 .11 191 3 60 17 203
106 7.1 1.22 115 6 .01 264 1 3.06 253 1 .08 179 4 .39 155 5 51 17 204
230 6.1 .35 154 5 .01 211 3 25.1 191 3 .01 221 2 .17 181 4 7.2 17 205
263 6.5 .92 126 6 .01 239 2 52.4 165 4 .01 231 2 .10 193 3 4.8 17 206
67 4.2 .07 208 3 .86 177 4 18.5 203 3 .04 197 3 .22 174 4 2 17 207
90 2.9 .11 193 3 2.83 160 5 12.8 219 2 .17 155 5 .03 230 2 1.9 17 208
251 2.9 .09 202 3 2.15 167 4 15.1 211 3 .14 159 5 .05 220 2 .7 17 209
270 6.6 .11 194 3 .01 245 1 298 92 7 .12 163 4 .01 246 1 80 16 210
Appendix 4. Prioritization index (PI) for all mine discharges—Continued
Sitenumber
pH(units)
Iron,total(lb/d
as Fe)
Rank Score
Acidity,total
heated(lb/d asCaCO3)
Rank Score
Sulfate,total
(lb/d asCaCO3)
Rank Score
Aluminum,dissolved
(lb/das Al)
Rank Score
Manganese,total(lb/d
as Mn)
Rank Score
Discharge,instan-
taneous,(gal/min)
Finalscore
PI
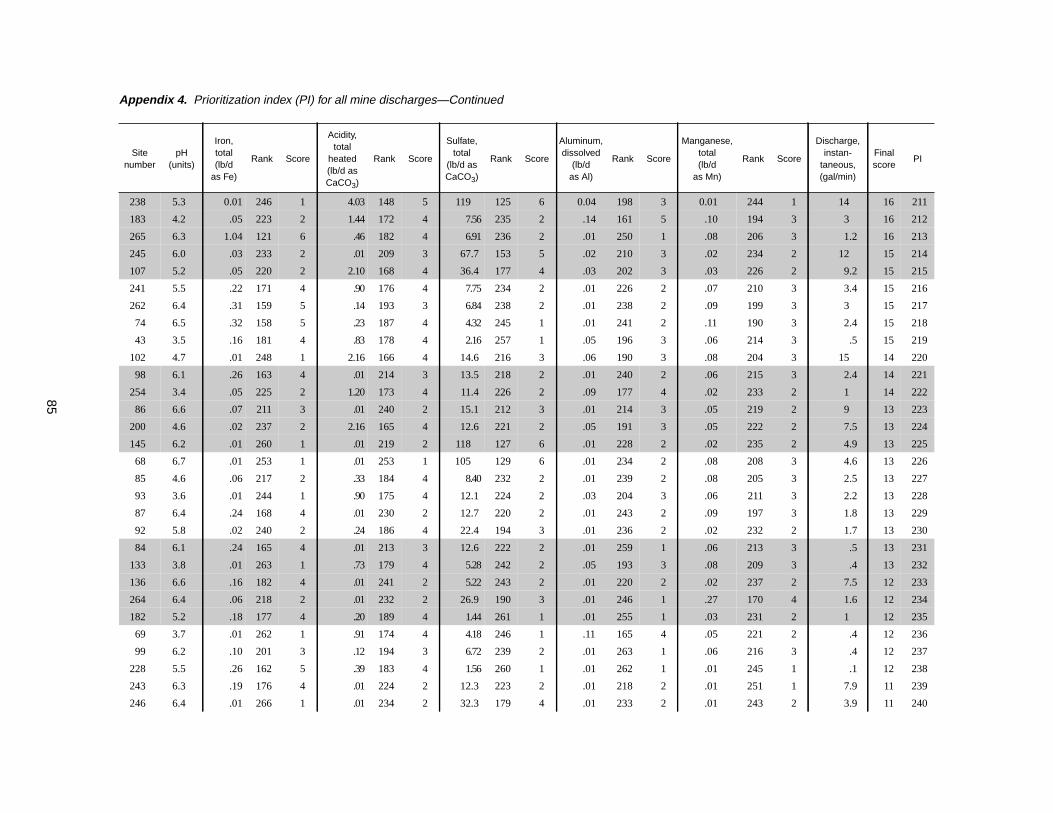
85
238 5.3 0.01 246 1 4.03 148 5 119 125 6 0.04 198 3 0.01 244 1 14 16 211
183 4.2 .05 223 2 1.44 172 4 7.56 235 2 .14 161 5 .10 194 3 3 16 212
265 6.3 1.04 121 6 .46 182 4 6.91 236 2 .01 250 1 .08 206 3 1.2 16 213
245 6.0 .03 233 2 .01 209 3 67.7 153 5 .02 210 3 .02 234 2 12 15 214
107 5.2 .05 220 2 2.10 168 4 36.4 177 4 .03 202 3 .03 226 2 9.2 15 215
241 5.5 .22 171 4 .90 176 4 7.75 234 2 .01 226 2 .07 210 3 3.4 15 216
262 6.4 .31 159 5 .14 193 3 6.84 238 2 .01 238 2 .09 199 3 3 15 217
74 6.5 .32 158 5 .23 187 4 4.32 245 1 .01 241 2 .11 190 3 2.4 15 218
43 3.5 .16 181 4 .83 178 4 2.16 257 1 .05 196 3 .06 214 3 .5 15 219
102 4.7 .01 248 1 2.16 166 4 14.6 216 3 .06 190 3 .08 204 3 15 14 220
98 6.1 .26 163 4 .01 214 3 13.5 218 2 .01 240 2 .06 215 3 2.4 14 221
254 3.4 .05 225 2 1.20 173 4 11.4 226 2 .09 177 4 .02 233 2 1 14 222
86 6.6 .07 211 3 .01 240 2 15.1 212 3 .01 214 3 .05 219 2 9 13 223
200 4.6 .02 237 2 2.16 165 4 12.6 221 2 .05 191 3 .05 222 2 7.5 13 224
145 6.2 .01 260 1 .01 219 2 118 127 6 .01 228 2 .02 235 2 4.9 13 225
68 6.7 .01 253 1 .01 253 1 105 129 6 .01 234 2 .08 208 3 4.6 13 226
85 4.6 .06 217 2 .33 184 4 8.40 232 2 .01 239 2 .08 205 3 2.5 13 227
93 3.6 .01 244 1 .90 175 4 12.1 224 2 .03 204 3 .06 211 3 2.2 13 228
87 6.4 .24 168 4 .01 230 2 12.7 220 2 .01 243 2 .09 197 3 1.8 13 229
92 5.8 .02 240 2 .24 186 4 22.4 194 3 .01 236 2 .02 232 2 1.7 13 230
84 6.1 .24 165 4 .01 213 3 12.6 222 2 .01 259 1 .06 213 3 .5 13 231
133 3.8 .01 263 1 .73 179 4 5.28 242 2 .05 193 3 .08 209 3 .4 13 232
136 6.6 .16 182 4 .01 241 2 5.22 243 2 .01 220 2 .02 237 2 7.5 12 233
264 6.4 .06 218 2 .01 232 2 26.9 190 3 .01 246 1 .27 170 4 1.6 12 234
182 5.2 .18 177 4 .20 189 4 1.44 261 1 .01 255 1 .03 231 2 1 12 235
69 3.7 .01 262 1 .91 174 4 4.18 246 1 .11 165 4 .05 221 2 .4 12 236
99 6.2 .10 201 3 .12 194 3 6.72 239 2 .01 263 1 .06 216 3 .4 12 237
228 5.5 .26 162 5 .39 183 4 1.56 260 1 .01 262 1 .01 245 1 .1 12 238
243 6.3 .19 176 4 .01 224 2 12.3 223 2 .01 218 2 .01 251 1 7.9 11 239
246 6.4 .01 266 1 .01 234 2 32.3 179 4 .01 233 2 .01 243 2 3.9 11 240
Appendix 4. Prioritization index (PI) for all mine discharges—Continued
Sitenumber
pH(units)
Iron,total(lb/d
as Fe)
Rank Score
Acidity,total
heated(lb/d asCaCO3)
Rank Score
Sulfate,total
(lb/d asCaCO3)
Rank Score
Aluminum,dissolved
(lb/das Al)
Rank Score
Manganese,total(lb/d
as Mn)
Rank Score
Discharge,instan-
taneous,(gal/min)
Finalscore
PI

86
49 6.7 0.20 174 4 <0.01 250 1 11.0 228 2 <0.01 235 2 0.03 224 2 3.4 11 241
198 4.0 .01 243 2 .28 185 4 1.33 262 1 .04 201 3 <.01 256 1 .3 11 242
148 6.3 .24 166 4 .22 188 4 2.64 254 1 <.01 269 1 <.01 250 1 .2 11 243
196 6.8 <.01 259 1 <.01 258 1 31.7 181 4 .02 212 3 <.01 262 1 12 10 244
119 5.0 <.01 252 1 1.54 170 4 3.55 252 1 <.01 232 2 .02 236 2 4 10 245
201 4.2 <.01 255 1 .50 181 4 2.11 258 1 .01 223 2 .01 242 2 1.6 10 246
150 7.3 .08 207 3 <.01 269 1 15.6 208 3 <.01 253 1 .01 240 2 1 10 247
83 4.5 <.01 257 1 .17 192 3 14.4 217 2 .01 224 2 .01 238 2 .8 10 248
237 3.6 .12 189 4 .20 190 3 1.73 259 1 <.01 266 1 <.01 252 1 .2 10 249
203 3.8 <.01 249 1 .19 191 3 2.52 255 1 .02 208 3 .03 229 2 .1 10 250
206 7.1 .04 229 2 <.01 266 1 15.6 209 3 .01 222 2 <.01 258 1 7.2 9 251
147 6.8 .49 145 5 <.01 254 1 3.66 251 1 <.01 260 1 <.01 247 1 .5 9 252
244 6.3 .01 245 1 <.01 222 2 6.34 240 2 <.01 230 2 <.01 265 1 4.8 8 253
267 6.6 .07 209 3 <.01 246 1 .02 270 1 <.01 264 1 .01 239 2 .4 8 254
52 3.8 .02 236 2 .12 195 3 1.32 263 1 <.01 248 1 <.01 248 1 .2 8 255
239 6.0 .05 222 2 .02 198 3 .11 269 1 .01 270 1 .01 261 1 .1 8 256
195 7.1 .01 250 1 .01 263 1 9.22 231 2 .01 227 2 .01 267 1 6.4 7 257
193 6.9 .03 230 2 .01 261 1 11.3 227 2 .01 244 1 .01 253 1 2 7 258
222 5.6 .01 268 1 .01 201 3 4.18 247 1 .01 249 1 .01 268 1 1.2 7 259
146 6.7 .02 239 2 .01 248 1 7.92 233 2 .01 252 1 .01 259 1 1.1 7 260
256 5.8 .01 258 1 .05 196 3 .30 268 1 .01 257 1 .01 257 1 .8 7 261
266 6.8 .06 214 3 .01 257 1 4.61 244 1 .01 258 1 .01 254 1 .8 7 262
240 5.8 .01 247 1 .03 197 3 .98 265 1 .01 268 1 .01 249 1 .2 7 263
88 6.5 .01 269 1 .01 237 2 3.74 250 1 .01 251 1 .01 266 1 1.2 6 264
153 6.3 <.01 267 1 <.01 225 2 1.19 264 1 <.01 265 1 <.01 263 1 0.3 6 265
91 6.8 <.01 264 1 <.01 256 1 4.14 248 1 <.01 247 1 <.01 260 1 1.5 5 266
257 6.9 <.01 251 1 <.01 260 1 4.09 249 1 <.01 254 1 <.01 269 1 1.1 5 267
50 7.1 <.01 261 1 <.01 267 1 2.40 256 1 <.01 256 1 <.01 270 1 1 5 268
199 7.1 <.01 265 1 <.01 265 1 0.96 266 1 <.01 261 1 <.01 264 1 0.5 5 269
45 9.7 <.01 270 1 <.01 270 1 0.41 267 1 <.01 267 1 <.01 255 1 0.04 5 270
Appendix 4. Prioritization index (PI) for all mine discharges—Continued
Sitenumber
pH(units)
Iron,total(lb/d
as Fe)
Rank Score
Acidity,total
heated(lb/d asCaCO3)
Rank Score
Sulfate,total
(lb/d asCaCO3)
Rank Score
Aluminum,dissolved
(lb/das Al)
Rank Score
Manganese,total(lb/d
as Mn)
Rank Score
Discharge,instan-
taneous,(gal/min)
Finalscore
PI

87

88
Appendix 5. Field data and laboratory analyses for surface-water sites
[ft3/s, cubic foot per second; °C, degrees Celsius; µS/cm, microsiemen per centimeter at 25 degrees Celsius;mg/L, milligram per liter; ug/L, micrograms per liter; <, less than; --, no data available]
Appendix 5. Field data and laboratory analyses for surface-water sites—Continued
Date TimeDischarge,
instantaneous(ft3/s)
Temperature,water(°C)
Specificconductance
(µS/cm)
pH(standard
units)
Alkalinity,total
(mg/L asCaCO3)
Residueat 105 °C,dissolved
(mg/L)
Carbon,inorganic,
total(mg/Las C)
Sulfate,total
(mg/Las SO4)
03039200 Clear Run near Buckstown, Pa., Site 808 (LAT 40 02 49N LONG 078 50 00W)
September 1, 1992 1510 1.8 15.0 1,200 6.7 42 982 9.2 600
July 27, 1993 1715 .78 21.5 2,320 6.2 50 1,770 8.2 1,200
May 23, 1994 1820 3.2 15.0 620 6.0 26 490 5.5 280
03039300 Wells Creek at Mostoller, Pa., Site 813 (LAT 40 04 11N LONG 078 56 45W)
September 2, 1992 0820 2.6 12.0 665 6.1 15 564 3.1 200
July 27, 1993 1015 3.9 19.5 689 4.8 2 556 <1.0 330
May 24, 1994 0840 12 13.0 385 5.9 3 -- <1.0 160
03039340 Beaverdam Creek at Stoystown, Pa., Site 814 (LAT 40 05 35N LONG 078 57 16W)
September 2, 1992 0910 2.5 12.5 397 6.4 96 336 19 79
July 27, 1993 0845 2.3 19.5 460 7.7 100 336 25 100
May 24, 1994 0930 9.9 14.0 311 7.4 66 216 6.9 71
03039440 Quemahoning Creek at Boswell, Pa., Site 818 (LAT 40 09 54N LONG 079 01 51W)
September 1, 1992 1130 19 15.0 400 6.1 34 362 9.6 140
July 28, 1993 1130 10 20.0 650 5.8 42 504 14 280
May 23, 1994 1150 67 16.0 290 6.6 20 246 4.7 100
03039700 Dark Shade Creek at Central City, Pa., Site 824 (LAT 40 06 18N LONG 078 47 55W)
September 1, 1992 1610 3.1 18.5 209 3.8 0 140 <1.0 65
July 28, 1993 1315 1.4 23.5 231 3.7 0 152 <1.0 160
May 23, 1994 1435 13 16.5 125 4.1 0 94 <1.0 45
03039750 Dark Shade Creek at Reitz, Pa., Site 826 (LAT 40 08 03N LONG 078 48 53W)
September 2, 1992 0815 21 11.0 682 3.8 0 612 1.6 350
July 28, 1993 1015 13 15.0 1,130 3.3 0 990 1.4 770
May 23, 1994 1050 53 13.0 550 3.8 0 468 2.6 330
03039920 Little Paint Creek at Scalp Level, Pa., Site 829 (LAT 40 14 46N LONG 078 50 49W)
September 1, 1992 1450 1.9 23.5 410 5.5 4 360 <1.0 170
July 28, 1993 1820 1.1 28.5 490 5.7 2 426 <1.0 260
May 24, 1994 0915 10 13.0 236 6.7 7 200 2.3 87
03039925 North Fork Bens Creek at North Fork, Pa., Site 833 (LAT 40 15 58N LONG 079 01 01W)
September 1, 1992 0910 1.3 13.0 61 6.7 3 90 <1.0 9.0
July 27, 1993 1350 .86 18.0 64 7.0 3 78 <1.0 7.7
May 23, 1994 1215 6.4 11.5 50 6.9 3 58 <1.0 9.2
03039930 South Fork Bens Creek near Thomasdale, Pa., Site 831 (LAT 40 13 41N LONG 079 02 49W)
September 1, 1992 0805 8.9 13.0 44 6.4 8 80 1.5 8.0
July 27, 1993 1250 3.5 19.0 490 7.2 7 88 1.8 7.7
May 23, 1994 1015 7.7 11.5 330 5.8 4 52 <1.0 8.0
03039950 South Fork Bens Creek near Ferndale, Pa., Site 832 (LAT 40 15 02N LONG 078 58 20W)
September 1, 1992 1015 7.0 13.5 773 5.6 92 668 19 320
July 27, 1993 1035 6.6 18.0 840 7.3 100 654 23 320
May 23, 1994 1430 33 16.0 383 6.9 46 312 10 140

89
Appendix 5. Field data and laboratory analyses for surface-water sites—Continued
[ft3/s, cubic foot per second; °C, degrees Celsius; µS/cm, microsiemen per centimeter at 25 degrees Celsius;mg/L, milligram per liter; ug/L, micrograms per liter; <, less than; --, no data available]
Appendix 5. Field data and laboratory analyses for surface-water sites—Continued
Date
Fluoride,total
(mg/Las F)
Iron, totalrecoverable
(µg/Las Fe)
Iron,dissolved
(µg/Las Fe)
Manganese,total
recoverable(µg/L
as Mn)
Manganese,dissolved
(µg/Las Mn)
Aluminum,total
recoverable(µg/Las Al)
Aluminum,dissolved
(µg/Las Al
Acidity,total
heated(mg/L asCaCO3)
Acidity,mineral(methylorange)(mg/L asCaCO3)
03039200 Clear Run near Buckstown, Pa., Site 808 (LAT 40 02 49N LONG 078 50 00W)
September 1, 1992 <0.2 1,800 150 290 200 940 <130 0 0
July 27, 1993 <.2 6,100 4,800 600 600 140 <130 0 --
May 23, 1994 <.2 360 120 610 560 370 300 0 --
03039300 Wells Creek at Mostoller, Pa., Site 813 (LAT 40 04 11N LONG 078 56 45W)
September 2, 1992 <.2 320 31 800 780 <130 <130 0 0
July 27, 1993 <.2 240 90 1,900 1,900 1,400 1,400 14 --
May 24, 1994 <.2 770 150 1,000 950 1,000 150 5.2 --
03039340 Beaverdam Creek at Stoystown, Pa., Site 814 (LAT 40 05 35N LONG 078 57 16W)
September 2, 1992 <.2 430 78 41 23 220 <130 0 0
July 27, 1993 <.2 360 20 70 50 400 400 0 --
May 24, 1994 <.2 460 24 47 31 <130 <130 0 --
03039440 Quemahoning Creek at Boswell, Pa., Site 818 (LAT 40 09 54N LONG 079 01 51W)
September 1, 1992 <.2 3,300 2,400 720 720 <130 <130 0 0
July 28, 1993 <.2 4,500 2,700 1,700 1,600 190 <130 0 --
May 23, 1994 <.2 3,100 2,100 940 900 <130 <130 0 --
03039700 Dark Shade Creek at Central City, Pa., Site 824 (LAT 40 06 18N LONG 078 47 55W)
September 1, 1992 <.2 1,500 1,400 530 530 2,500 2,500 34 3
July 28, 1993 <.2 1,000 980 680 660 3,000 3,000 36 4
May 23, 1994 <.2 1,000 980 320 330 1,800 1,800 22 0
03039750 Dark Shade Creek at Reitz, Pa., Site 826 (LAT 40 08 03N LONG 078 48 53W)
September 2, 1992 .3 18,000 16,000 3,100 3,100 4,900 4,600 70 8
July 28, 1993 .2 24,000 21,000 5,000 4,900 8,800 8,600 120 42
May 23, 1994 .2 8,300 5,500 2,500 2,400 4,400 4,100 54 4
03039920 Little Paint Creek at Scalp Level, Pa., Site 829 (LAT 40 14 46N LONG 078 50 49W)
September 1, 1992 <.2 6,100 1,600 410 360 7,100 <130 12 0
July 28, 1993 <.2 7,600 5,300 460 450 3,600 200 19 --
May 24, 1994 <.2 8,700 6,300 200 220 3,700 510 15 --
03039925 North Fork Bens Creek at North Fork, Pa., Site 833 (LAT 40 15 58N LONG 079 01 01W)
September 1, 1992 <.2 20 <10 <10 <10 <130 <130 6.0 0
July 27, 1993 <.2 2,300 20 460 <50 3,100 <130 2.4 --
May 23, 1994 <.2 30 <10 32 22 <130 <130 5.6 --
03039930 South Fork Bens Creek near Thomasdale, Pa., Site 831 (LAT 40 13 41N LONG 079 02 49W)
September 1, 1992 <.2 190 <10 29 <10 180 <130 2.4 0
July 27, 1993 <.2 2,300 50 280 210 1,900 200 0 --
May 23, 1994 <.2 110 20 25 16 <130 130 5.0 --
03039950 South Fork Bens Creek near Ferndale, Pa., Site 832 (LAT 40 15 02N LONG 078 58 20W)
September 1, 1992 <.2 900 <10 230 230 370 <130 0 0
July 27, 1993 .2 950 490 -- -- -- -- 0 --
May 23, 1994 <.2 1,300 120 200 200 510 <130 0 --

90
03039957 Bens Creek at Ferndale, Pa., Site 834 (LAT 40 16 58N LONG 078 56 10W)
September 1, 1992 1120 10 15.5 525 6.1 66 454 14 190
July 28, 1993 1245 8.0 23.5 630 7.4 76 478 16 230
May 23, 1994 1615 58 17.5 260 7.8 32 226 11 85
03040000 Stonycreek River at Ferndale, Pa., Site 805 (LAT 40 17 08N LONG 078 55 15W)
September 1, 1992 1140 198 19.5 498 5.4 2 414 <1.0 240
July 27, 1993 0920 127 23.0 820 4.2 0 802 <1.0 470
May 23, 1994 1700 541 19.5 411 4.8 2 362 <1.0 190
395836078554901 Glades Creek near Shanksville, Pa., Site 806 (LAT 39 58 36N LONG 078 55 49W)
September 1, 1992 0740 3.2 13.0 554 6.9 74 428 15 160
July 27, 1993 0810 3.9 19.5 761 6.7 100 678 20 250
May 24, 1994 1325 6.6 18.0 588 6.1 66 500 14 190
400014078540201 Stonycreek River at Shanksville, Pa., Site 801 (LAT 40 00 14N LONG 078 54 02W)
September 1, 1992 0850 11 16.0 557 6.8 58 532 10 190
July 27, 1993 1245 11 23.5 740 6.8 100 596 19 220
May 24, 1994 1225 21 18.0 446 6.4 50 360 11 140
400033078511601 Boone Run near Shanksville, Pa., Site 807 (LAT 40 00 33N LONG 078 51 16W)
September 1, 1992 1400 3.2 15.0 161 6.8 5 134 1.3 61
July 27, 1993 1400 .84 22.5 490 5.0 10 506 2.7 270
May 23, 1994 1900 5.1 14.5 141 6.0 2 134 1.0 60
400056078540501 Rhoads Creek at Shanksville, Pa., Site 810 (LAT 40 00 56N LONG 078 54 05W)
September 1, 1992 1030 14 18.5 610 6.8 24 540 5.1 280
July 27, 1993 1110 2.5 22.5 535 6.3 48 538 6.4 230
May 24, 1994 1045 23 16.5 412 6.6 15 352 3.4 170
400058078552301 Schrock Run near Shanksville, Pa., Site 811 (LAT 40 00 58N LONG 078 55 23W)
September 1, 1992 0945 2.2 12.5 1,220 6.8 64 1,010 15 610
July 27, 1993 0950 1.3 19.5 1,390 5.8 28 1,110 9.1 730
May 24, 1994 1135 3.4 15.0 825 6.4 26 684 6.8 440
400337078513701 Calendars Run at Buckstown, Pa., Site 809 (LAT 40 03 37N LONG 078 51 37W)
September 1, 1992 1300 .11 13.0 224 7.1 30 180 3.6 30
July 28, 1993 1440 <.01 18.5 250 6.1 20 190 5.3 19
May 23, 1994 1715 .87 15.5 160 7.1 10 144 2.1 40
400414078545101 Lamberts Run at Lambertsville, Pa., Site 812 (LAT 40 04 14N LONG 078 54 51W)
September 1, 1992 1135 2.6 14.0 2,330 6.7 28 2,360 5.9 1,500
July 27, 1993 1420 3.9 20.5 2,550 6.6 14 2,450 3.1 1,800
May 23, 1994 2000 7.2 18.0 2,350 6.1 30 2,450 6.5 1,800
400611078555801 Stonycreek River at Kantner, Pa., Site 802 (LAT 40 06 11N LONG 078 55 58W)
September 2, 1992 1000 35 13.5 650 6.0 42 564 8.3 260
July 27, 1993 1140 23 23.5 884 7.2 42 678 9.1 420
May 23, 1994 1620 91 20.0 567 7.6 22 470 4.5 260
400701078481601 Laurel Run at Central City, Pa., Site 825 (LAT 40 07 01N LONG 078 48 16W)
September 1, 1992 1710 7.2 17.5 137 6.1 8 144 2.0 44
July 28, 1993 1200 2.0 20.5 229 5.0 3 192 1.9 120
May 23, 1994 1400 10 16.0 99 5.1 2 106 <1.0 38
Appendix 5. Field data and laboratory analyses for surface-water sites—Continued
Date TimeDischarge,
instantaneous(ft3/s)
Temperature,water(°C)
Specificconductance
(µS/cm)
pH(standard
units)
Alkalinity,total
(mg/L asCaCO3)
Residueat 105 °C,dissolved
(mg/L)
Carbon,inorganic,
total(mg/Las C)
Sulfate,total
(mg/Las SO4)
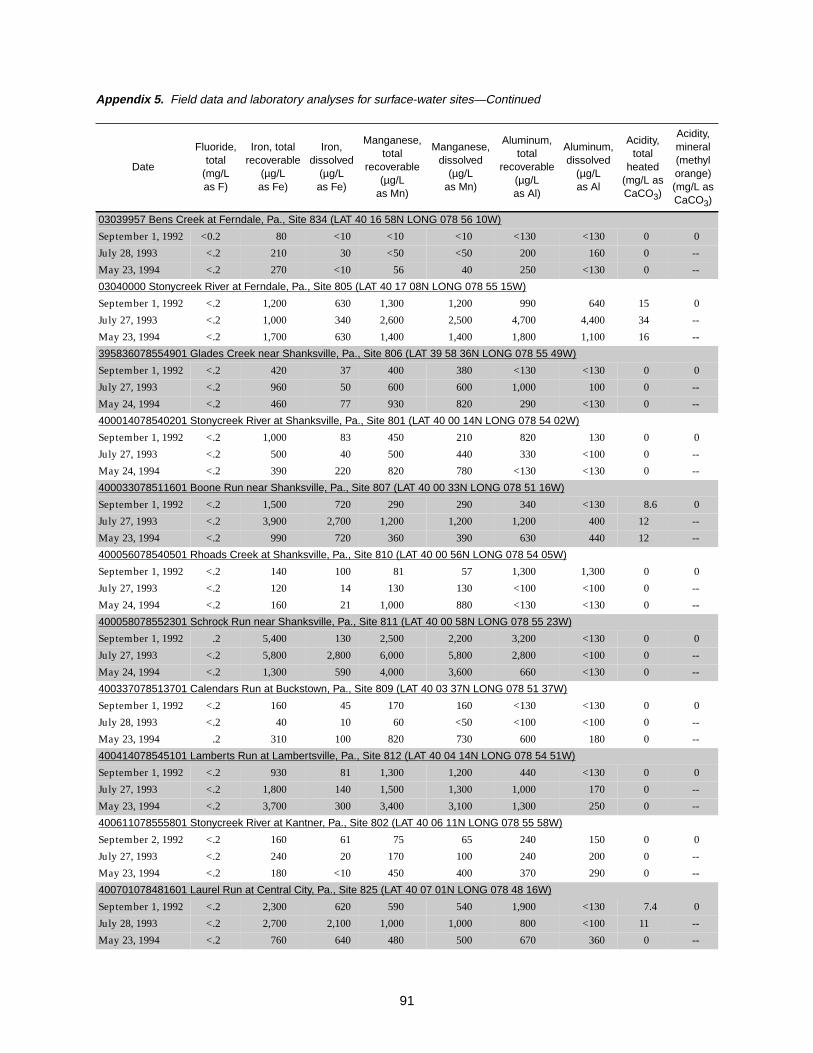
91
03039957 Bens Creek at Ferndale, Pa., Site 834 (LAT 40 16 58N LONG 078 56 10W)
September 1, 1992 <0.2 80 <10 <10 <10 <130 <130 0 0
July 28, 1993 <.2 210 30 <50 <50 200 160 0 --
May 23, 1994 <.2 270 <10 56 40 250 <130 0 --
03040000 Stonycreek River at Ferndale, Pa., Site 805 (LAT 40 17 08N LONG 078 55 15W)
September 1, 1992 <.2 1,200 630 1,300 1,200 990 640 15 0
July 27, 1993 <.2 1,000 340 2,600 2,500 4,700 4,400 34 --
May 23, 1994 <.2 1,700 630 1,400 1,400 1,800 1,100 16 --
395836078554901 Glades Creek near Shanksville, Pa., Site 806 (LAT 39 58 36N LONG 078 55 49W)
September 1, 1992 <.2 420 37 400 380 <130 <130 0 0
July 27, 1993 <.2 960 50 600 600 1,000 100 0 --
May 24, 1994 <.2 460 77 930 820 290 <130 0 --
400014078540201 Stonycreek River at Shanksville, Pa., Site 801 (LAT 40 00 14N LONG 078 54 02W)
September 1, 1992 <.2 1,000 83 450 210 820 130 0 0
July 27, 1993 <.2 500 40 500 440 330 <100 0 --
May 24, 1994 <.2 390 220 820 780 <130 <130 0 --
400033078511601 Boone Run near Shanksville, Pa., Site 807 (LAT 40 00 33N LONG 078 51 16W)
September 1, 1992 <.2 1,500 720 290 290 340 <130 8.6 0
July 27, 1993 <.2 3,900 2,700 1,200 1,200 1,200 400 12 --
May 23, 1994 <.2 990 720 360 390 630 440 12 --
400056078540501 Rhoads Creek at Shanksville, Pa., Site 810 (LAT 40 00 56N LONG 078 54 05W)
September 1, 1992 <.2 140 100 81 57 1,300 1,300 0 0
July 27, 1993 <.2 120 14 130 130 <100 <100 0 --
May 24, 1994 <.2 160 21 1,000 880 <130 <130 0 --
400058078552301 Schrock Run near Shanksville, Pa., Site 811 (LAT 40 00 58N LONG 078 55 23W)
September 1, 1992 .2 5,400 130 2,500 2,200 3,200 <130 0 0
July 27, 1993 <.2 5,800 2,800 6,000 5,800 2,800 <100 0 --
May 24, 1994 <.2 1,300 590 4,000 3,600 660 <130 0 --
400337078513701 Calendars Run at Buckstown, Pa., Site 809 (LAT 40 03 37N LONG 078 51 37W)
September 1, 1992 <.2 160 45 170 160 <130 <130 0 0
July 28, 1993 <.2 40 10 60 <50 <100 <100 0 --
May 23, 1994 .2 310 100 820 730 600 180 0 --
400414078545101 Lamberts Run at Lambertsville, Pa., Site 812 (LAT 40 04 14N LONG 078 54 51W)
September 1, 1992 <.2 930 81 1,300 1,200 440 <130 0 0
July 27, 1993 <.2 1,800 140 1,500 1,300 1,000 170 0 --
May 23, 1994 <.2 3,700 300 3,400 3,100 1,300 250 0 --
400611078555801 Stonycreek River at Kantner, Pa., Site 802 (LAT 40 06 11N LONG 078 55 58W)
September 2, 1992 <.2 160 61 75 65 240 150 0 0
July 27, 1993 <.2 240 20 170 100 240 200 0 --
May 23, 1994 <.2 180 <10 450 400 370 290 0 --
400701078481601 Laurel Run at Central City, Pa., Site 825 (LAT 40 07 01N LONG 078 48 16W)
September 1, 1992 <.2 2,300 620 590 540 1,900 <130 7.4 0
July 28, 1993 <.2 2,700 2,100 1,000 1,000 800 <100 11 --
May 23, 1994 <.2 760 640 480 500 670 360 0 --
Appendix 5. Field data and laboratory analyses for surface-water sites—Continued
Date
Fluoride,total
(mg/Las F)
Iron, totalrecoverable
(µg/Las Fe)
Iron,dissolved
(µg/Las Fe)
Manganese,total
recoverable(µg/L
as Mn)
Manganese,dissolved
(µg/Las Mn)
Aluminum,total
recoverable(µg/Las Al)
Aluminum,dissolved
(µg/Las Al
Acidity,total
heated(mg/L asCaCO3)
Acidity,mineral(methylorange)(mg/L asCaCO3)

92
400706078552801 Oven Run at Rowena, Pa., Site 815 (LAT 40 07 06N LONG 078 55 28W)
September 2, 1992 1100 0.57 13.0 1,930 2.7 0 2,130 <1.0 1,100
July 27, 1993 1700 .55 23.5 2,350 2.8 0 2,740 <1.0 2,000
May 24, 1994 1020 3.1 12.5 1,320 3.2 0 1,240 <1.0 820
400738078552801 Pokeytown Run at Wilbur Pa., Site 837 (LAT 40 07 38N LONG 078 55 28W)
July 27, 1993 1610 .68 19.0 2,960 2.9 0 3,970 <1.0 3,500
SEP 08... 1100 .40 15.0 3,510 2.7 0 6,370 <1.0 4,100
May 24, 1994 1100 2.0 14.5 1,670 3.1 0 2,090 1.0 1,400
400822079035901 North Branch Quemahoning Creek near Coal Junction, Pa., Site 820 (LAT 40 08 22N LONG 079 03 59W)
September 1, 1992 0830 6.9 15.0 124 6.4 13 148 3.3 30
July 27, 1993 0845 1.8 21.0 135 6.3 15 116 4.7 35
May 23, 1994 0840 30 13.0 87 5.5 6 90 2.0 25
400826078580401 Higgins Run near Boswell, Pa., Site 823 (LAT 40 08 26N LONG 078 58 04W)
September 1, 1992 1640 2.0 14.5 970 6.6 86 828 16 460
July 28, 1993 1430 3.0 17.5 910 6.3 86 736 18 420
May 23, 1994 1500 6.3 15.5 620 7.4 60 514 2.3 250
400841078544901 Fallen Timber Run at Hooversville, Pa., Site 816 (LAT 40 08 41N LONG 078 54 49W)
September 1, 1992 1815 .32 13.5 502 5.3 3 498 1.6 270
July 27, 1993 1500 .30 17.0 457 5.0 2 422 1.0 320
May 24, 1994 1200 1.2 12.0 310 5.5 4 294 2.9 160
400854078490201 Clear Shade Creek at Reitz, Pa., Site 827 (LAT 40 08 54N LONG 078 49 02W)
September 2, 1992 0915 34 12.5 42 5.9 4 90 <1.0 10
July 28, 1993 0850 7.1 20.5 57 6.3 10 94 2.4 8.4
May 23, 1994 1140 75 14.5 40 5.4 4 48 <1.0 93
400908078585701 Twomile Run near Boswell, Pa., Site 822 (LAT 40 09 08N LONG 078 58 57W)
September 1, 1992 1600 .52 16.0 510 5.4 3 514 <1.0 240
July 28, 1993 1315 .48 21.0 662 6.2 12 592 <1.0 320
May 23, 1994 1410 4.3 18.0 490 6.7 6 458 1.2 230
400954079040501 Beaverdam Creek at Jennerstown, Pa., Site 819 (LAT 40 09 54N LONG 079 04 05W)
September 1, 1992 1000 2.3 13.5 97 6.5 28 124 6.2 10
July 28, 1993 1015 1.5 19.5 208 6.1 34 156 8.3 43
May 23, 1994 1025 9.8 12.5 86 6.9 12 64 3.1 21
401017079005301 Roaring Run at Pilltown, Pa., Site 821 (LAT 40 10 17N LONG 079 00 53W)
September 1, 1992 1200 3.5 16.5 282 6.1 24 292 5.6 97
July 28, 1993 1230 1.0 22.5 872 6.1 46 706 12 430
May 23, 1994 1250 17 19.5 250 6.8 20 206 5.5 91
401018078542901 Stonycreek River at Blough, Pa., Site 803 (LAT 40 10 18N LONG 078 54 29W)
September 1, 1992 1745 51 21.5 660 5.4 11 576 <1.0 310
July 27, 1993 1310 23 27.0 1,100 3.8 0 896 <1.0 720
May 23, 1994 1730 122 20.5 617 6.8 5 498 1.2 310
401059078495201 Roaring Fork near Hillsboro, Pa., Site 828 (LAT 40 10 59N LONG 078 49 52W)
September 2, 1992 1025 4.8 13.5 142 4.5 0 162 <1.0 50
July 28, 1993 0730 1.8 19.0 203 3.5 0 142 <1.0 120
May 23, 1994 1240 13 13.5 80 5.0 1 74 <1.0 28
Appendix 5. Field data and laboratory analyses for surface-water sites—Continued
Date TimeDischarge,
instantaneous(ft3/s)
Temperature,water(°C)
Specificconductance
(µS/cm)
pH(standard
units)
Alkalinity,total
(mg/L asCaCO3)
Residueat 105 °C,dissolved
(mg/L)
Carbon,inorganic,
total(mg/Las C)
Sulfate,total
(mg/Las SO4)

93
400706078552801 Oven Run at Rowena, Pa., Site 815 (LAT 40 07 06N LONG 078 55 28W)
September 2, 1992 0.8 23,000 23,000 21,000 21,000 26,000 26,000 350 124
July 27, 1993 .5 21,000 19,000 39,000 36,000 46,000 42,000 450 136
May 24, 1994 .5 15,000 15,000 15,000 15,000 19,000 18,000 190 66
400738078552801 Pokeytown Run at Wilbur Pa., Site 837 (LAT 40 07 38N LONG 078 55 28W)
July 27, 1993 1.1 400,000 400,000 14,000 14,000 140,000 140,000 1,740 670
SEP 08... 1.7 490,000 520,000 14,000 13,000 190,000 180,000 2,180 650
May 24, 1994 .6 100,000 100,000 6,700 6,700 55,000 55,000 528 166
400822079035901 North Branch Quemahoning Creek near Coal Junction, Pa., Site 820 (LAT 40 08 22N LONG 079 03 59W)
September 1, 1992 <.2 1,100 40 380 370 210 <130 0 0
July 27, 1993 <.2 1,700 160 320 320 200 <100 0 --
May 23, 1994 <.2 580 250 330 350 180 <130 4.0 --
400826078580401 Higgins Run near Boswell, Pa., Site 823 (LAT 40 08 26N LONG 078 58 04W)
September 1, 1992 <.2 160 <10 52 33 <130 <130 0 0
July 28, 1993 <.2 210 24 110 59 200 <100 0 --
May 23, 1994 <.2 440 <10 160 130 260 140 0 --
400841078544901 Fallen Timber Run at Hooversville, Pa., Site 816 (LAT 40 08 41N LONG 078 54 49W)
September 1, 1992 .3 490 50 710 670 1,300 720 20 0
July 27, 1993 .3 100 90 570 570 1,200 600 9.6 --
May 24, 1994 <.2 250 52 280 240 740 260 1.4 --
400854078490201 Clear Shade Creek at Reitz, Pa., Site 827 (LAT 40 08 54N LONG 078 49 02W)
September 2, 1992 <.2 140 48 53 43 170 <130 7.2 0
July 28, 1993 <.2 140 100 <50 <50 <100 <100 0 --
May 23, 1994 <.2 140 85 88 80 190 <130 6.2 --
400908078585701 Twomile Run near Boswell, Pa., Site 822 (LAT 40 09 08N LONG 078 58 57W)
September 1, 1992 <.2 120 50 2,900 2,800 860 730 13 0
July 28, 1993 <.2 140 40 2,200 2,200 760 700 7.6 --
May 23, 1994 <.2 390 <10 2,100 2,100 800 <130 6.2 --
400954079040501 Beaverdam Creek at Jennerstown, Pa., Site 819 (LAT 40 09 54N LONG 079 04 05W)
September 1, 1992 <.2 290 130 90 84 140 <130 0 0
July 28, 1993 <.2 600 28 330 290 200 <100 0 --
May 23, 1994 <.2 450 80 190 160 170 <130 0 --
401017079005301 Roaring Run at Pilltown, Pa., Site 821 (LAT 40 10 17N LONG 079 00 53W)
September 1, 1992 <.2 2,600 1,500 820 820 180 <130 0 0
July 28, 1993 .2 4,500 1,200 2,200 2,200 200 <130 0 --
May 23, 1994 <.2 2,100 890 620 600 370 <130 0 --
401018078542901 Stonycreek River at Blough, Pa., Site 803 (LAT 40 10 18N LONG 078 54 29W)
September 1, 1992 <.2 1,200 270 1,100 1,100 710 140 7.0 0
July 27, 1993 .2 1,700 490 2,800 2,800 7,500 7,500 62 5
May 23, 1994 <.2 2,700 410 1,300 1,300 1,800 <130 7.8 --
401059078495201 Roaring Fork near Hillsboro, Pa., Site 828 (LAT 40 10 59N LONG 078 49 52W)
September 2, 1992 <.2 500 380 1,100 1,100 680 680 15 0
July 28, 1993 <.2 1,000 750 1,400 1,400 700 700 16 --
May 23, 1994 <.2 240 170 440 450 540 510 11 --
Appendix 5. Field data and laboratory analyses for surface-water sites—Continued
Date
Fluoride,total
(mg/Las F)
Iron, totalrecoverable
(µg/Las Fe)
Iron,dissolved
(µg/Las Fe)
Manganese,total
recoverable(µg/L
as Mn)
Manganese,dissolved
(µg/Las Mn)
Aluminum,total
recoverable(µg/Las Al)
Aluminum,dissolved
(µg/Las Al
Acidity,total
heated(mg/L asCaCO3)
Acidity,mineral(methylorange)(mg/L asCaCO3)

94
401121078562801 Quemahoning Creek at Quemahoning Reservoir Outflow, Site 817 (LAT 40 11 21N LONG 078 56 28W)
September 1, 1992 1500 13 25.0 266 5.5 18 260 3.4 84
July 27, 1993 1900 .09 26.0 206 7.1 50 146 11 35
May 23, 1994 1915 74 20.0 201 7.2 12 192 2.3 64
401243078535501 Shade Creek at Seanor, Pa., Site 836 (LAT 40 12 43N LONG 078 53 55W)
September 1, 1992 1610 80 18.5 322 4.5 0 282 <1.0 140
July 28, 1993 1700 40 27.5 670 3.5 0 474 <1.0 410
May 24, 1994 1030 137 13.5 300 3.8 0 228 <1.0 130
401437078530201 Stonycreek River near Windber, Pa., Site 804 (LAT 40 14 37N LONG 078 53 02W)
September 2, 1992 1220 122 17.5 456 5.5 2 402 <1.0 210
July 28, 1993 1520 77 27.5 840 3.9 0 654 <1.0 550
May 24, 1994 1330 386 17.0 390 5.2 2 334 <1.0 170
401441078530201 Paint Creek near Windber, Pa., Site 830 (LAT 40 14 41N LONG 078 53 02W)
September 2, 1992 1105 14 14.0 1,220 3.6 0 1,210 <1.0 720
July 28, 1993 1420 9.9 24.5 1,380 3.4 0 1,210 <1.0 960
May 24, 1994 1400 43 17.0 800 3.6 0 732 3.0 510
401821078543601 Solomon Run at Johnstown, Pa., Site 835 (LAT 40 18 21N LONG 078 54 36W)
September 1, 1992 1320 22 23.0 1,080 6.0 5 1,020 1.3 550
July 27, 1993 1515 2.6 27.0 1,150 6.6 7 914 2.7 560
May 23, 1994 1845 6.8 18.0 770 6.8 24 690 9.1 330
Appendix 5. Field data and laboratory analyses for surface-water sites—Continued
Date TimeDischarge,
instantaneous(ft3/s)
Temperature,water(°C)
Specificconductance
(µS/cm)
pH(standard
units)
Alkalinity,total
(mg/L asCaCO3)
Residueat 105 °C,dissolved
(mg/L)
Carbon,inorganic,
total(mg/Las C)
Sulfate,total
(mg/Las SO4)

95
401121078562801 Quemahoning Creek at Quemahoning Reservoir Outflow, Site 817 (LAT 40 11 21N LONG 078 56 28W)
September 1, 1992 <0.2 40 16 <10 <10 <130 <130 0 0
July 27, 1993 <.2 260 260 550 120 600 <100 0 --
May 23, 1994 <.2 100 <10 300 280 <130 <130 0 --
401243078535501 Shade Creek at Seanor, Pa., Site 836 (LAT 40 12 43N LONG 078 53 55W)
September 1, 1992 <.2 1,800 1,500 1,200 1,200 1,600 1,600 28 1
July 28, 1993 <.2 550 340 2,800 2,800 4,200 4,000 48 12
May 24, 1994 <.2 1,600 860 1,300 1,200 2,000 1,900 19 --
401437078530201 Stonycreek River near Windber, Pa., Site 804 (LAT 40 14 37N LONG 078 53 02W)
September 2, 1992 <.2 850 500 1,100 1,100 1,200 1,100 14 0
July 28, 1993 <.2 470 380 3,000 2,900 4,500 4,400 40 3
May 24, 1994 <.2 1,200 410 970 910 1,100 340 6.2 --
401441078530201 Paint Creek near Windber, Pa., Site 830 (LAT 40 14 41N LONG 078 53 02W)
September 2, 1992 .3 14,000 8,100 6,700 6,700 15,000 15,000 138 22
July 28, 1993 .2 8,800 5,200 10,000 10,000 13,000 13,000 104 9
May 24, 1994 .2 7,200 3,600 5,100 4,800 9,100 8,200 70 3
401821078543601 Solomon Run at Johnstown, Pa., Site 835 (LAT 40 18 21N LONG 078 54 36W)
September 1, 1992 <.2 31,000 17,000 1,600 1,600 840 <130 40 0
July 27, 1993 <.2 17,000 8,200 2,700 2,700 1,800 <100 11 --
May 23, 1994 <.2 11,000 4,200 820 780 1,100 <130 0 --
Appendix 5. Field data and laboratory analyses for surface-water sites—Continued
Date
Fluoride,total
(mg/Las F)
Iron, totalrecoverable
(µg/Las Fe)
Iron,dissolved
(µg/Las Fe)
Manganese,total
recoverable(µg/L
as Mn)
Manganese,dissolved
(µg/Las Mn)
Aluminum,total
recoverable(µg/Las Al)
Aluminum,dissolved
(µg/Las Al
Acidity,total
heated(mg/L asCaCO3)
Acidity,mineral(methylorange)(mg/L asCaCO3)

96