
EFFECTS OF CARBON SOURCE AMENDMENT ON THE · PDF fileeffects of carbon source amendment on the...
20
EFFECTS OF CARBON SOURCE AMENDMENT ON THE ANAEROBIC DEGRADATION OF 1,1,1-TRICHLOROETHANE (TCA) IN A CONTAMINATED AQUIFER R. LOOKMAN ∗ , B. BORREMANS, T. DE CEUSTER, J. GEMOETS and L. DIELS Flemish Institute for Technological Research (Vito), Division of Environmental & Process Technology – Boeretang 200, B-2400 Mol, Belgium ( ∗ author for correspondence, e-mail: [email protected], Fax: +32.14.32.65.86) (Received 3 February 2005; accepted 8 May 2005) Abstract. We conducted a 10-month anaerobic microcosm test and a 15-month field test to investi- gate the effects of carbon source addition on the in-situ 1,1,1-trichloroethane (TCA) degradation in a polluted aquifer at an industrial site near Antwerp, Belgium. In the microcosms TCA decreased from 15000 µg/L to 1500 µg/L. 1,1-Dichloroethane (DCA) end-concentrations were about the same as the concentrations at the start of the tests (1500 µg/L). 1,1-Dichloroethene (DCE) decreased from 1200 µg/L to 800 µg/L. Carbon source unamended and amended microcosms showed equal concentration trends. Neither chloroethane (CA) nor vinyl chloride (VC) were produced in the microcosms. In the field test TCA dropped from 15000 µg/L to below 2000 µg/L. Upstream, TCA levels remained elevated proving that the C-source injection had stimulated degradation. Sulphate reducing bacteria were stimulated; FeS was produced in the microcosms and aquifer. Dehalococcoides species were stimulated in some microcosms and in the HRC-amended aquifer. Neither sulphate reducers nor De- halococcoides species are however believed to be responsible for the observed TCA degradation. The carbon source injection however did yield environmental conditions that increased TCA degradation. Keywords: TCA, trichloroethane, pollution, groundwater, aquifer, degradation, remediation, micro- cosm test, field test Notations Bgl: Below ground level CA: Chloroethane CAHs: Chlorinated aliphatic hydrocarbons Cis-DCE: Cis-1,2-dichloroethene DCA: 1,1-dichloroethane DCE: 1,1-dichloroethene DIC: Dissolved inorganic carbon DOC: Dissolved organic carbon EC: Electrical conductivity HRC ® : Hydrogen release compounds MW: Monitoring well ORP: Oxidation-reduction potential PCR: Polymerase chain reaction Water, Air, and Soil Pollution (2005) 166: 197–216 C Springer 2005
Transcript of EFFECTS OF CARBON SOURCE AMENDMENT ON THE · PDF fileeffects of carbon source amendment on the...

EFFECTS OF CARBON SOURCE AMENDMENT ON THE ANAEROBICDEGRADATION OF 1,1,1-TRICHLOROETHANE (TCA) IN A
CONTAMINATED AQUIFER
R. LOOKMAN∗, B. BORREMANS, T. DE CEUSTER, J. GEMOETS and L. DIELSFlemish Institute for Technological Research (Vito), Division of Environmental & Process
Technology – Boeretang 200, B-2400 Mol, Belgium(∗author for correspondence, e-mail: [email protected], Fax: +32.14.32.65.86)
(Received 3 February 2005; accepted 8 May 2005)
Abstract. We conducted a 10-month anaerobic microcosm test and a 15-month field test to investi-gate the effects of carbon source addition on the in-situ 1,1,1-trichloroethane (TCA) degradation in apolluted aquifer at an industrial site near Antwerp, Belgium. In the microcosms TCA decreased from15000 µg/L to 1500 µg/L. 1,1-Dichloroethane (DCA) end-concentrations were about the same as theconcentrations at the start of the tests (1500 µg/L). 1,1-Dichloroethene (DCE) decreased from 1200µg/L to 800 µg/L. Carbon source unamended and amended microcosms showed equal concentrationtrends. Neither chloroethane (CA) nor vinyl chloride (VC) were produced in the microcosms. Inthe field test TCA dropped from 15000 µg/L to below 2000 µg/L. Upstream, TCA levels remainedelevated proving that the C-source injection had stimulated degradation. Sulphate reducing bacteriawere stimulated; FeS was produced in the microcosms and aquifer. Dehalococcoides species werestimulated in some microcosms and in the HRC-amended aquifer. Neither sulphate reducers nor De-halococcoides species are however believed to be responsible for the observed TCA degradation. Thecarbon source injection however did yield environmental conditions that increased TCA degradation.
Keywords: TCA, trichloroethane, pollution, groundwater, aquifer, degradation, remediation, micro-cosm test, field test
Notations
Bgl: Below ground levelCA: ChloroethaneCAHs: Chlorinated aliphatic hydrocarbonsCis-DCE: Cis-1,2-dichloroetheneDCA: 1,1-dichloroethaneDCE: 1,1-dichloroetheneDIC: Dissolved inorganic carbonDOC: Dissolved organic carbonEC: Electrical conductivityHRC®: Hydrogen release compoundsMW: Monitoring wellORP: Oxidation-reduction potentialPCR: Polymerase chain reaction
Water, Air, and Soil Pollution (2005) 166: 197–216 C© Springer 2005
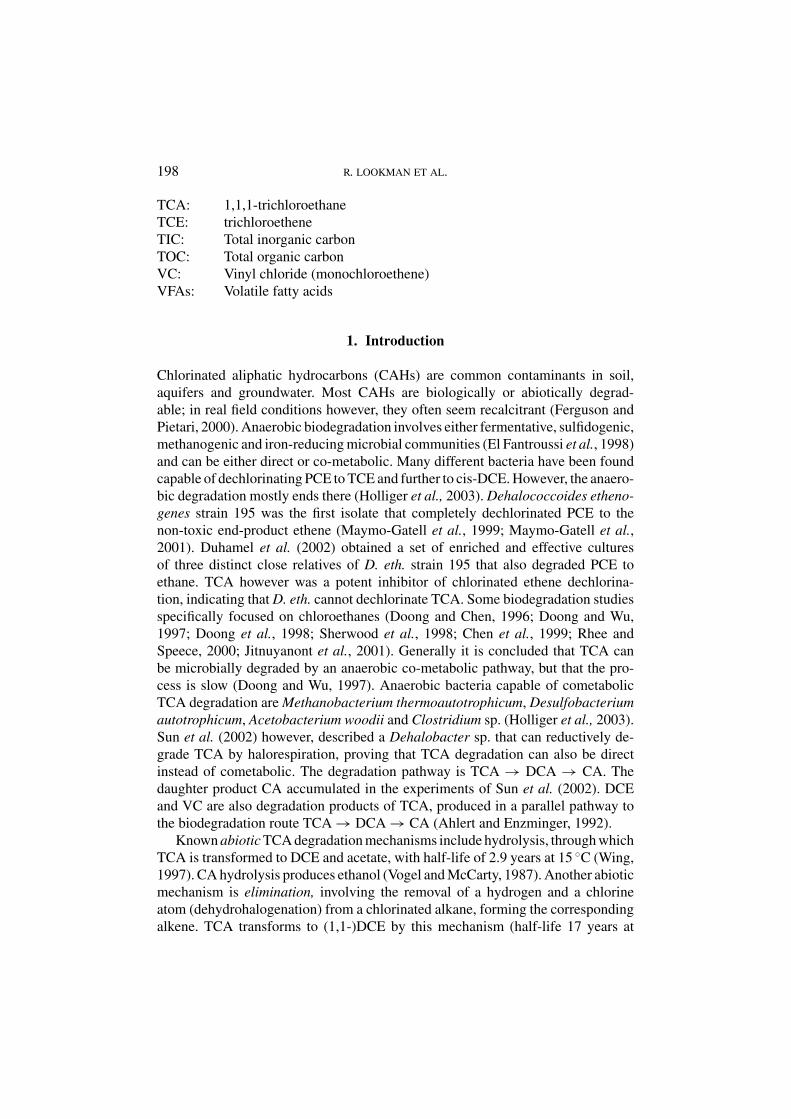
198 R. LOOKMAN ET AL.
TCA: 1,1,1-trichloroethaneTCE: trichloroetheneTIC: Total inorganic carbonTOC: Total organic carbonVC: Vinyl chloride (monochloroethene)VFAs: Volatile fatty acids
1. Introduction
Chlorinated aliphatic hydrocarbons (CAHs) are common contaminants in soil,aquifers and groundwater. Most CAHs are biologically or abiotically degrad-able; in real field conditions however, they often seem recalcitrant (Ferguson andPietari, 2000). Anaerobic biodegradation involves either fermentative, sulfidogenic,methanogenic and iron-reducing microbial communities (El Fantroussi et al., 1998)and can be either direct or co-metabolic. Many different bacteria have been foundcapable of dechlorinating PCE to TCE and further to cis-DCE. However, the anaero-bic degradation mostly ends there (Holliger et al., 2003). Dehalococcoides etheno-genes strain 195 was the first isolate that completely dechlorinated PCE to thenon-toxic end-product ethene (Maymo-Gatell et al., 1999; Maymo-Gatell et al.,2001). Duhamel et al. (2002) obtained a set of enriched and effective culturesof three distinct close relatives of D. eth. strain 195 that also degraded PCE toethane. TCA however was a potent inhibitor of chlorinated ethene dechlorina-tion, indicating that D. eth. cannot dechlorinate TCA. Some biodegradation studiesspecifically focused on chloroethanes (Doong and Chen, 1996; Doong and Wu,1997; Doong et al., 1998; Sherwood et al., 1998; Chen et al., 1999; Rhee andSpeece, 2000; Jitnuyanont et al., 2001). Generally it is concluded that TCA canbe microbially degraded by an anaerobic co-metabolic pathway, but that the pro-cess is slow (Doong and Wu, 1997). Anaerobic bacteria capable of cometabolicTCA degradation are Methanobacterium thermoautotrophicum, Desulfobacteriumautotrophicum, Acetobacterium woodii and Clostridium sp. (Holliger et al., 2003).Sun et al. (2002) however, described a Dehalobacter sp. that can reductively de-grade TCA by halorespiration, proving that TCA degradation can also be directinstead of cometabolic. The degradation pathway is TCA → DCA → CA. Thedaughter product CA accumulated in the experiments of Sun et al. (2002). DCEand VC are also degradation products of TCA, produced in a parallel pathway tothe biodegradation route TCA → DCA → CA (Ahlert and Enzminger, 1992).
Known abiotic TCA degradation mechanisms include hydrolysis, through whichTCA is transformed to DCE and acetate, with half-life of 2.9 years at 15 ◦C (Wing,1997). CA hydrolysis produces ethanol (Vogel and McCarty, 1987). Another abioticmechanism is elimination, involving the removal of a hydrogen and a chlorineatom (dehydrohalogenation) from a chlorinated alkane, forming the correspondingalkene. TCA transforms to (1,1-)DCE by this mechanism (half-life 17 years at

EFFECTS OF CARBON SOURCE AMENDMENT ON THE ANAEROBIC DEGRADATION 199
20 ◦C; Vogel and McCarty, 1987). The reaction has shown to be greatly acceleratedin the presence of microbially reduced ferruginous smectite (Cervini-Silva et al.,2003). Microbially produced iron sulphides may also chemically reduce TCA toDCA, with rates depending on TCA concentration and FeS surface area (Ganderet al., 2002).
Natural biodegradation of CAHs is often limited by insufficient availability ofa carbon source (Major et al., 2002). Bioremediation of a CAH-contaminated sitemay thus be induced by carbon source injection. The success of such an approachhowever depends on the presence of suitable microbes and on potentially limit-ing factors (e.g. unsuitable hydrogeological conditions; redox buffering by largequantities of e.g. iron(III) minerals, nitrate or sulphate; low temperature; a high orlow pH or the presence of co-contaminants). Before full-scale bioremediation isattempted, it is therefore necessary to test the success chances at smaller scale, byeither a field pilot or laboratory tests (microcosms). Microcosm studies (Fennelland Gossett, 2003) have the advantage that they allow to simultaneously study theeffect of various electron donors, nutrients and/or other factors that may influencedechlorination. Several laboratory microcosm degradation studies on chloroethenesare available (a.o. Davis et al., 2002; Clement et al., 2002), but less studies seemto be available on chloroethane degradation.
Recently several PCR primer sets were developed for the specific detection ofdifferent species or groups of micro-organisms based on their 16S rRNA or basedon the genes coding for specific enzymes involved in pollutant degradation. Bycombining hydrogeochemical and microbiological investigations a better insightinto contaminant biodegradation can be acquired (Lorah and Voytek, 2004).
In this work we studied the potential to bioremediate a TCA-contaminated siteby a combination of a microcosm test, a field pilot and additional microbiologicalcharacterisation. In the lab study we tested the effect of the addition of lactate, lac-tate+yeast extract and molasses on observed TCA degradation and the productionof daughter products. In the field test we injected a poly-lactate ester (HRC: hy-drogen release compounds©R, Regenesis inc. U.S.A.) into the aquifer and monitoredTCA degradation in the field by measuring multiple parameters in five monitoringwells. Once injected, HRC hydrolyzes slowly, releasing lactate into the groundwa-ter (Koenigsberg and Norris, 1999; Koenigsberg, 2000). The goal of this study wasto establish if carbon source injection into the contaminated aquifer stimulates TCAdegradation and if so, to investigate the extent of the dechlorination to harmlessend-products and the processes involved.
2. Materials and Methods
2.1. STUDY SITE AND SAMPLE COLLECTION
The contaminated groundwater and aquifer material was sampled at an industriallocation in Kontich, near Antwerp, Belgium. The soil pollution at this site had been

200 R. LOOKMAN ET AL.
studied extensively for more than 5 years prior to the start of the tests reported in thispaper. The soil consists mainly of fine to medium-fine silty sand. A sandy clay layerbegins at approximately 5 m bgl. The groundwater level fluctuates around 1-2 mbgl.; groundwater head gradients are 0.001-0.003 m/m and the hydraulic conductiv-ity was estimated to be about 1 m/d (slug tests). The TCA plume in the groundwaterextends over a total length of approximately 120 m and has a width of 30 m. Thearea with the highest concentrations is about 20 × 20 m. Details on groundwaterand soil analyses are given elsewhere (Lookman et al., 2004). Over the 5-yearmonitoring period, little changes occurred in the intensity of the CAH pollution.
Five monitoring wells (MW) were installed with screen depths of 3–5 m bgl.and undisturbed aquifer samples were taken at a depth of 3–4 m bgl. These wereanaerobically packed (N2-gas) and transported to the laboratory. The aquifer ma-terial and groundwater sampled from MW201 were used for the preparation ofmicrocosms (see below). HRC injection was performed using Geoprobe injectionequipment, at 2 injection points approximately 1.5 m apart, after sampling of allmonitoring wells. The injection depth was 5 to 2 m bgl; in total 30 kg of HRC wasinjected. Prior to injection, the HRC fluid was spiked with 10 g sodium bromide asa tracer.
2.2. FIELD TEST MONITORING
The effects of the HRC injection on the evolution of CAH concentrations and otherparameters in the groundwater were monitored at 5 time points within a 15-monthperiod. Measured parameters were CAHs, Fe, Mn, NO−
3 , NO−2 , SO2−
4 , DOC,chloride and bromide. These analyses were performed by the certified commer-cial laboratory Analytico, Barneveld, The Netherlands. O2 concentrations, ORP,pH, EC, T were measured on-site (using a flow-through cell equipped with elec-trodes). Ethane, ethene, CH4and H2 were measured on-site using a portable GC(RGA5 Process Gas Analyzer, Trace Analytical), following procedures describedby Wiedmeier et al. (1998). After finishing the field test, new aquifer material wassampled in both the HRC injection zone as well as 7 m upstream. These sampleswere analyzed on CAHs, TIC, TOC, acid volatile S2−, iron, Kjeldahl-N and totalphosphorus concentrations, using standard certified procedures (for details we referto http://vito.be/milieu/milieumetingen8a1.htm).
2.3. LABORATORY MICROCOSM PREPARATION
Stock-solutions were prepared as summarized in Table I. All stock-solutions werede-gassed by N2 flushing after preparation. Microcosms were then prepared in ananaerobic glove-box using 150 mL glass vials with butyl/PFTE grey septum andcrimp-cap seal. Seven vials were prepared per test condition, as given in Table I.After preparation, the microcosm vials were air-tightly capped and incubated at am-bient temperatures. They were monitored on CAHs, ORP, pH, DOC, Fe, Mn, NO−
3 ,
EFFECTS OF CARBON SOURCE AMENDMENT ON THE ANAEROBIC DEGRADATION 201
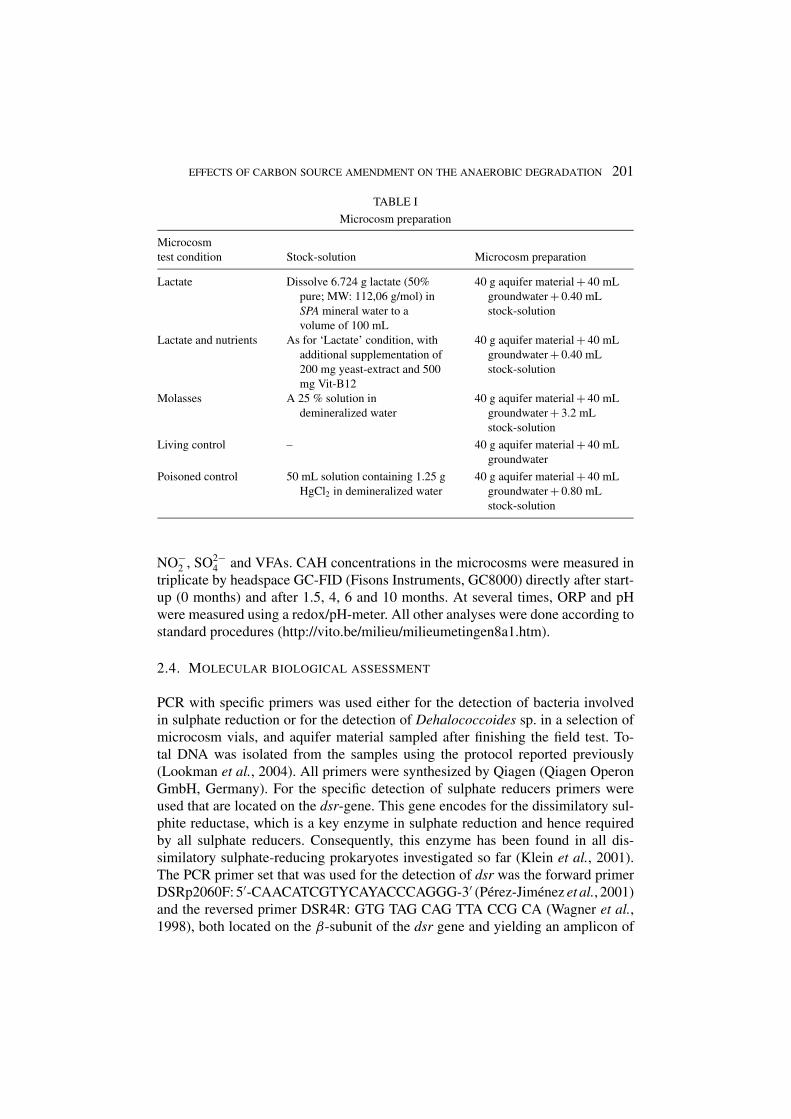
TABLE I
Microcosm preparation
Microcosmtest condition Stock-solution Microcosm preparation
Lactate Dissolve 6.724 g lactate (50%pure; MW: 112,06 g/mol) inSPA mineral water to avolume of 100 mL
40 g aquifer material + 40 mLgroundwater + 0.40 mLstock-solution
Lactate and nutrients As for ‘Lactate’ condition, withadditional supplementation of200 mg yeast-extract and 500mg Vit-B12
40 g aquifer material + 40 mLgroundwater + 0.40 mLstock-solution
Molasses A 25 % solution indemineralized water
40 g aquifer material + 40 mLgroundwater + 3.2 mLstock-solution
Living control – 40 g aquifer material + 40 mLgroundwater
Poisoned control 50 mL solution containing 1.25 gHgCl2 in demineralized water
40 g aquifer material + 40 mLgroundwater + 0.80 mLstock-solution
NO−2 , SO2−
4 and VFAs. CAH concentrations in the microcosms were measured intriplicate by headspace GC-FID (Fisons Instruments, GC8000) directly after start-up (0 months) and after 1.5, 4, 6 and 10 months. At several times, ORP and pHwere measured using a redox/pH-meter. All other analyses were done according tostandard procedures (http://vito.be/milieu/milieumetingen8a1.htm).
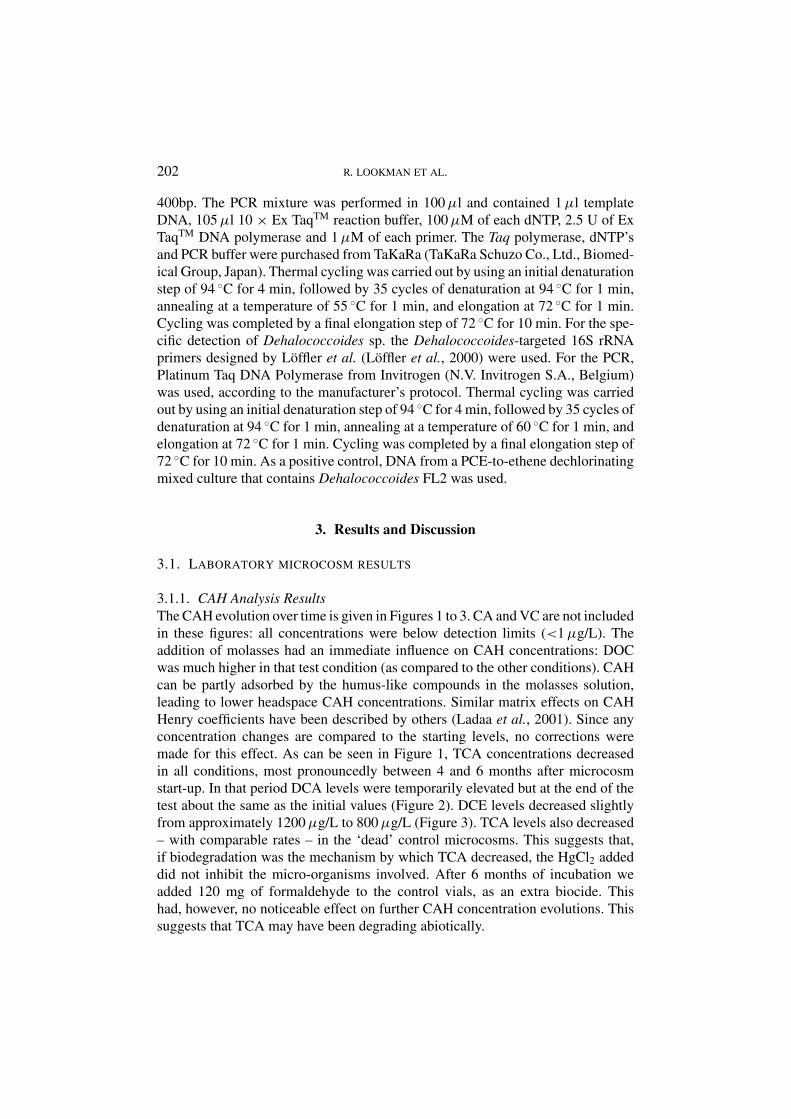
2.4. MOLECULAR BIOLOGICAL ASSESSMENT
PCR with specific primers was used either for the detection of bacteria involvedin sulphate reduction or for the detection of Dehalococcoides sp. in a selection ofmicrocosm vials, and aquifer material sampled after finishing the field test. To-tal DNA was isolated from the samples using the protocol reported previously(Lookman et al., 2004). All primers were synthesized by Qiagen (Qiagen OperonGmbH, Germany). For the specific detection of sulphate reducers primers wereused that are located on the dsr-gene. This gene encodes for the dissimilatory sul-phite reductase, which is a key enzyme in sulphate reduction and hence requiredby all sulphate reducers. Consequently, this enzyme has been found in all dis-similatory sulphate-reducing prokaryotes investigated so far (Klein et al., 2001).The PCR primer set that was used for the detection of dsr was the forward primerDSRp2060F: 5′-CAACATCGTYCAYACCCAGGG-3′ (Perez-Jimenez et al., 2001)and the reversed primer DSR4R: GTG TAG CAG TTA CCG CA (Wagner et al.,1998), both located on the β-subunit of the dsr gene and yielding an amplicon of
202 R. LOOKMAN ET AL.
400bp. The PCR mixture was performed in 100 µl and contained 1 µl templateDNA, 105 µl 10 × Ex TaqTM reaction buffer, 100 µM of each dNTP, 2.5 U of ExTaqTM DNA polymerase and 1 µM of each primer. The Taq polymerase, dNTP’sand PCR buffer were purchased from TaKaRa (TaKaRa Schuzo Co., Ltd., Biomed-ical Group, Japan). Thermal cycling was carried out by using an initial denaturationstep of 94 ◦C for 4 min, followed by 35 cycles of denaturation at 94 ◦C for 1 min,annealing at a temperature of 55 ◦C for 1 min, and elongation at 72 ◦C for 1 min.Cycling was completed by a final elongation step of 72 ◦C for 10 min. For the spe-cific detection of Dehalococcoides sp. the Dehalococcoides-targeted 16S rRNAprimers designed by Loffler et al. (Loffler et al., 2000) were used. For the PCR,Platinum Taq DNA Polymerase from Invitrogen (N.V. Invitrogen S.A., Belgium)was used, according to the manufacturer’s protocol. Thermal cycling was carriedout by using an initial denaturation step of 94 ◦C for 4 min, followed by 35 cycles ofdenaturation at 94 ◦C for 1 min, annealing at a temperature of 60 ◦C for 1 min, andelongation at 72 ◦C for 1 min. Cycling was completed by a final elongation step of72 ◦C for 10 min. As a positive control, DNA from a PCE-to-ethene dechlorinatingmixed culture that contains Dehalococcoides FL2 was used.
3. Results and Discussion
3.1. LABORATORY MICROCOSM RESULTS
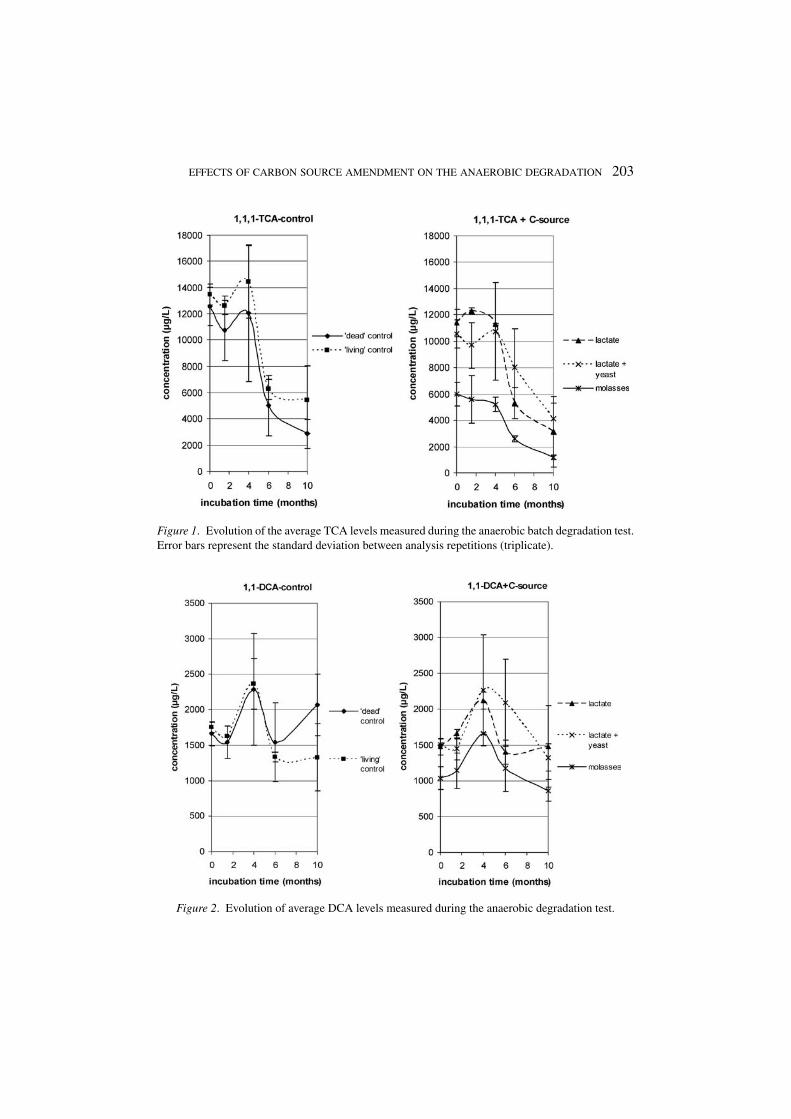
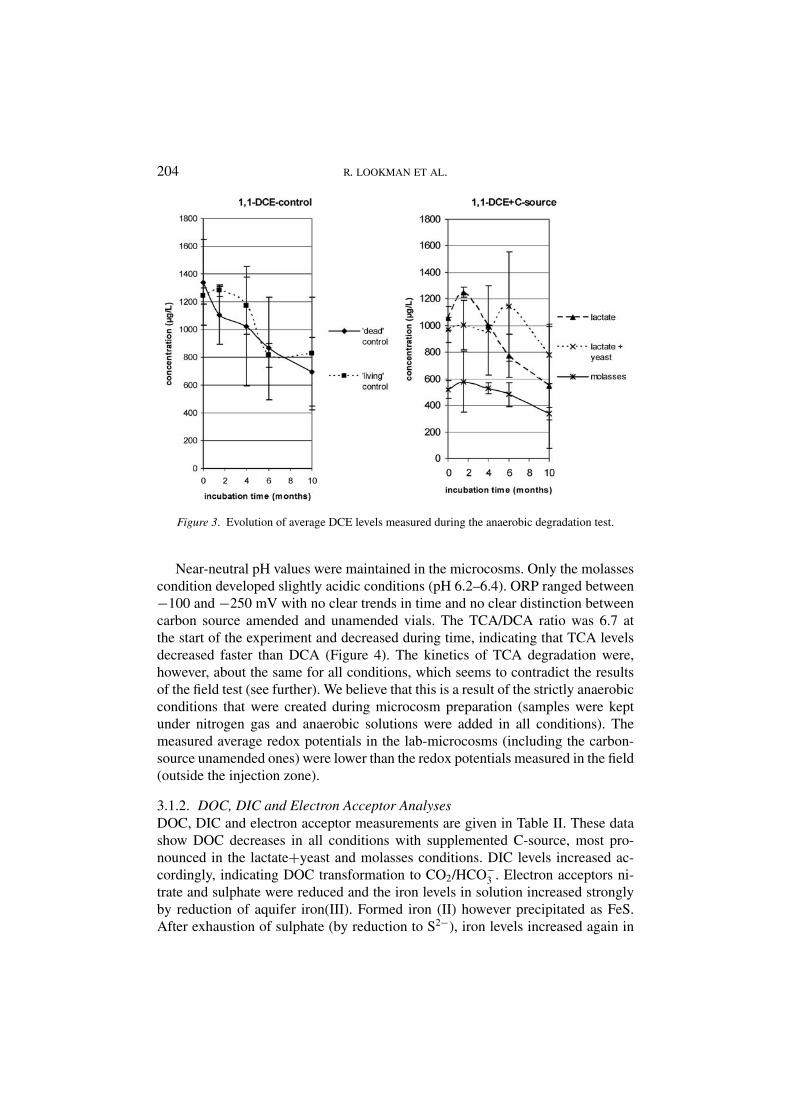
3.1.1. CAH Analysis ResultsThe CAH evolution over time is given in Figures 1 to 3. CA and VC are not includedin these figures: all concentrations were below detection limits (<1 µg/L). Theaddition of molasses had an immediate influence on CAH concentrations: DOCwas much higher in that test condition (as compared to the other conditions). CAHcan be partly adsorbed by the humus-like compounds in the molasses solution,leading to lower headspace CAH concentrations. Similar matrix effects on CAHHenry coefficients have been described by others (Ladaa et al., 2001). Since anyconcentration changes are compared to the starting levels, no corrections weremade for this effect. As can be seen in Figure 1, TCA concentrations decreasedin all conditions, most pronouncedly between 4 and 6 months after microcosmstart-up. In that period DCA levels were temporarily elevated but at the end of thetest about the same as the initial values (Figure 2). DCE levels decreased slightlyfrom approximately 1200 µg/L to 800 µg/L (Figure 3). TCA levels also decreased– with comparable rates – in the ‘dead’ control microcosms. This suggests that,if biodegradation was the mechanism by which TCA decreased, the HgCl2 addeddid not inhibit the micro-organisms involved. After 6 months of incubation weadded 120 mg of formaldehyde to the control vials, as an extra biocide. Thishad, however, no noticeable effect on further CAH concentration evolutions. Thissuggests that TCA may have been degrading abiotically.
EFFECTS OF CARBON SOURCE AMENDMENT ON THE ANAEROBIC DEGRADATION 203
Figure 1. Evolution of the average TCA levels measured during the anaerobic batch degradation test.Error bars represent the standard deviation between analysis repetitions (triplicate).
Figure 2. Evolution of average DCA levels measured during the anaerobic degradation test.
204 R. LOOKMAN ET AL.
Figure 3. Evolution of average DCE levels measured during the anaerobic degradation test.
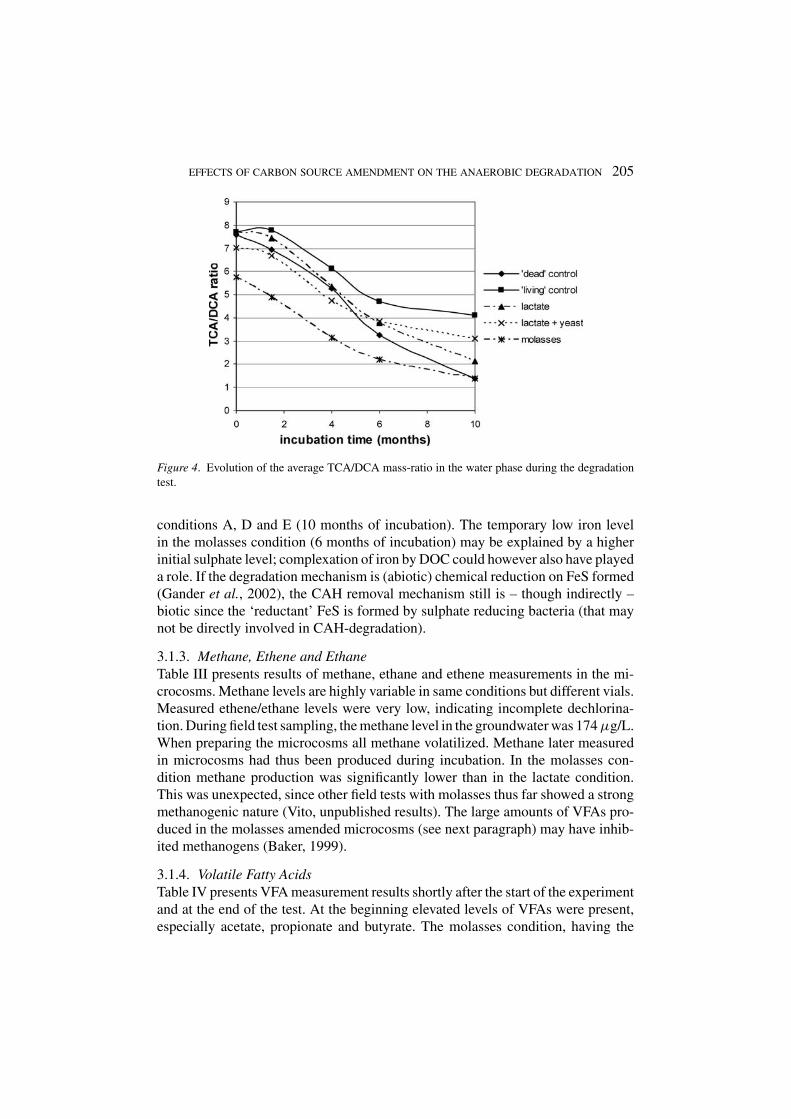
Near-neutral pH values were maintained in the microcosms. Only the molassescondition developed slightly acidic conditions (pH 6.2–6.4). ORP ranged between−100 and −250 mV with no clear trends in time and no clear distinction betweencarbon source amended and unamended vials. The TCA/DCA ratio was 6.7 atthe start of the experiment and decreased during time, indicating that TCA levelsdecreased faster than DCA (Figure 4). The kinetics of TCA degradation were,however, about the same for all conditions, which seems to contradict the resultsof the field test (see further). We believe that this is a result of the strictly anaerobicconditions that were created during microcosm preparation (samples were keptunder nitrogen gas and anaerobic solutions were added in all conditions). Themeasured average redox potentials in the lab-microcosms (including the carbon-source unamended ones) were lower than the redox potentials measured in the field(outside the injection zone).
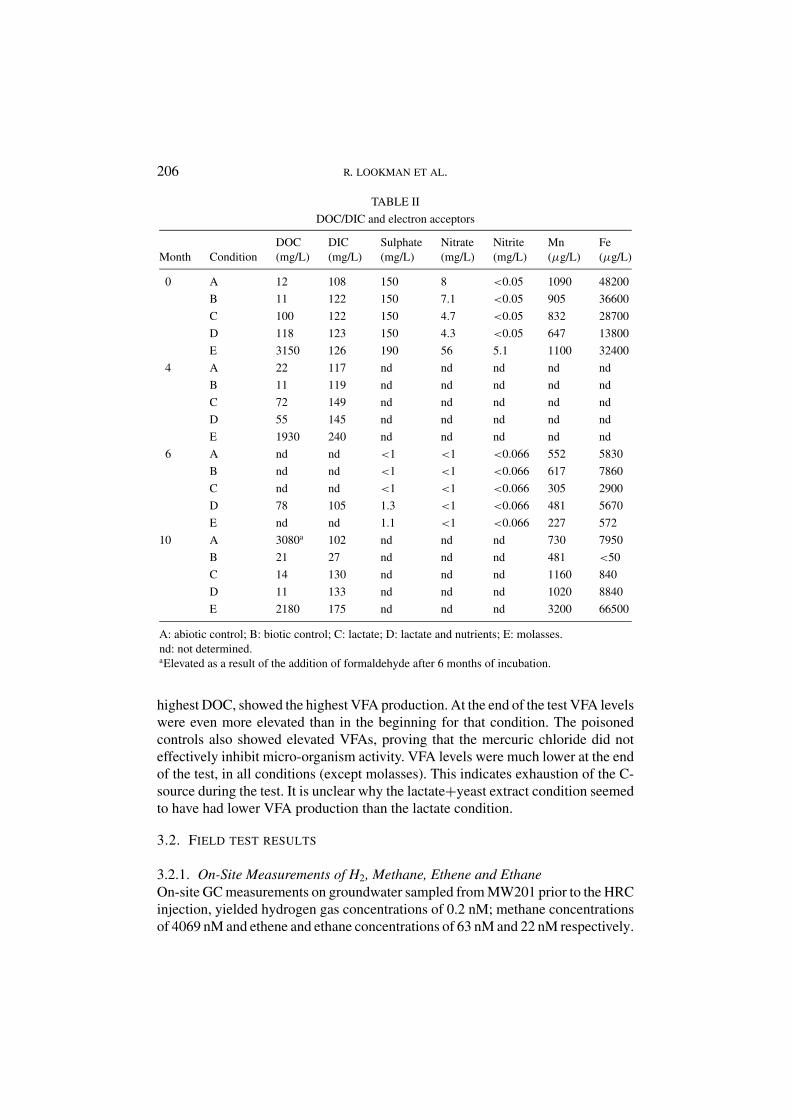
3.1.2. DOC, DIC and Electron Acceptor AnalysesDOC, DIC and electron acceptor measurements are given in Table II. These datashow DOC decreases in all conditions with supplemented C-source, most pro-nounced in the lactate+yeast and molasses conditions. DIC levels increased ac-cordingly, indicating DOC transformation to CO2/HCO−
3 . Electron acceptors ni-trate and sulphate were reduced and the iron levels in solution increased stronglyby reduction of aquifer iron(III). Formed iron (II) however precipitated as FeS.After exhaustion of sulphate (by reduction to S2−), iron levels increased again in
EFFECTS OF CARBON SOURCE AMENDMENT ON THE ANAEROBIC DEGRADATION 205
Figure 4. Evolution of the average TCA/DCA mass-ratio in the water phase during the degradationtest.
conditions A, D and E (10 months of incubation). The temporary low iron levelin the molasses condition (6 months of incubation) may be explained by a higherinitial sulphate level; complexation of iron by DOC could however also have playeda role. If the degradation mechanism is (abiotic) chemical reduction on FeS formed(Gander et al., 2002), the CAH removal mechanism still is – though indirectly –biotic since the ‘reductant’ FeS is formed by sulphate reducing bacteria (that maynot be directly involved in CAH-degradation).
3.1.3. Methane, Ethene and EthaneTable III presents results of methane, ethane and ethene measurements in the mi-crocosms. Methane levels are highly variable in same conditions but different vials.Measured ethene/ethane levels were very low, indicating incomplete dechlorina-tion. During field test sampling, the methane level in the groundwater was 174 µg/L.When preparing the microcosms all methane volatilized. Methane later measuredin microcosms had thus been produced during incubation. In the molasses con-dition methane production was significantly lower than in the lactate condition.This was unexpected, since other field tests with molasses thus far showed a strongmethanogenic nature (Vito, unpublished results). The large amounts of VFAs pro-duced in the molasses amended microcosms (see next paragraph) may have inhib-ited methanogens (Baker, 1999).
3.1.4. Volatile Fatty AcidsTable IV presents VFA measurement results shortly after the start of the experimentand at the end of the test. At the beginning elevated levels of VFAs were present,especially acetate, propionate and butyrate. The molasses condition, having the
206 R. LOOKMAN ET AL.
TABLE II
DOC/DIC and electron acceptors
DOC DIC Sulphate Nitrate Nitrite Mn FeMonth Condition (mg/L) (mg/L) (mg/L) (mg/L) (mg/L) (µg/L) (µg/L)
0 A 12 108 150 8 <0.05 1090 48200
B 11 122 150 7.1 <0.05 905 36600
C 100 122 150 4.7 <0.05 832 28700
D 118 123 150 4.3 <0.05 647 13800
E 3150 126 190 56 5.1 1100 32400
4 A 22 117 nd nd nd nd nd
B 11 119 nd nd nd nd nd
C 72 149 nd nd nd nd nd
D 55 145 nd nd nd nd nd
E 1930 240 nd nd nd nd nd
6 A nd nd <1 <1 <0.066 552 5830
B nd nd <1 <1 <0.066 617 7860
C nd nd <1 <1 <0.066 305 2900
D 78 105 1.3 <1 <0.066 481 5670
E nd nd 1.1 <1 <0.066 227 572
10 A 3080a 102 nd nd nd 730 7950
B 21 27 nd nd nd 481 <50
C 14 130 nd nd nd 1160 840
D 11 133 nd nd nd 1020 8840
E 2180 175 nd nd nd 3200 66500
A: abiotic control; B: biotic control; C: lactate; D: lactate and nutrients; E: molasses.nd: not determined.aElevated as a result of the addition of formaldehyde after 6 months of incubation.
highest DOC, showed the highest VFA production. At the end of the test VFA levelswere even more elevated than in the beginning for that condition. The poisonedcontrols also showed elevated VFAs, proving that the mercuric chloride did noteffectively inhibit micro-organism activity. VFA levels were much lower at the endof the test, in all conditions (except molasses). This indicates exhaustion of the C-source during the test. It is unclear why the lactate+yeast extract condition seemedto have had lower VFA production than the lactate condition.
3.2. FIELD TEST RESULTS
3.2.1. On-Site Measurements of H2, Methane, Ethene and EthaneOn-site GC measurements on groundwater sampled from MW201 prior to the HRCinjection, yielded hydrogen gas concentrations of 0.2 nM; methane concentrationsof 4069 nM and ethene and ethane concentrations of 63 nM and 22 nM respectively.

EFFECTS OF CARBON SOURCE AMENDMENT ON THE ANAEROBIC DEGRADATION 207
TABLE III
Methane, ethene and ethane measurements in the microcosms
C (µg/l)
Condition CH4 C2H4 C2H6
6 months of incubationA 192 4.7 7.8
A′a 155 nd nd
B 96 3.7 8.9
B′ 155 nd nd
C 132 2.3 4.5
C′ 133 gnd nd
D nd 0.9 1.2
D′ 191 nd nd
D′′ 115 nd nd
E 59 1.3 2.7
E′ 45 nd nd
10 months of incubationA 147 3.31 5.40
A′ 348 5.04 8.58
B 715 3.38 7.22
B′ 3.5 0.45 0.13
C 226 2.63 5.94
C′ 110 2.23 3.69
D 117 2.05 5.02
D′ 118 2.73 3.89
E 39 1.65 2.85
E′ 54 1.76 3.32
A: abiotic control; B: biotic control; C: lactate; D: lactate and nutrients;E: molasses.nd: not determined.aSame condition but another vial.
The hydrogen gas concentration can be considered as very low. The methane con-centration is more elevated, indicating reduced conditions. Ethene and ethane (endproducts of anaerobic CAH degradation) were present in detectable amounts butconcentrations were very low with respect to the TCA and DCA groundwater con-centrations.
3.2.2. CAH and Other Parameter Monitoring ResultsResults are presented in Figures 5 and 6. The evolution of the TCA/DCA concen-tration ratio is depicted in Figure 7. The TCA concentration in MW201 dropped
208 R. LOOKMAN ET AL.
TABLE IV
VFA measurement results in the microcosms
Control Control Lactate Lactate Molasses‘dead’ (mg/L) ‘living’ (mg/L) (mg/L) + yeast (mg/L) (mg/L)Condition:
Incubationtime (months): 0 10 0 10 0 10 0 10 0 10
Acetate 165.1 3.9 415.1 2.4 203.9 11.5 96.6 7.0 905.8 1431.8
Propionate 28.1 4.0 51.9 4.4 132.3 7.0 13.2 4.0 376.0 713.2
Iso-butyrate 4.8 3.9 4.9 3.8 4.6 12.1 – 4.8 20.6 49.8
Butyrate 10.3 4.0 5.6 6.9 51.8 8.3 6.6 – 1875.6 4258.0
Iso-valeriate 4.3 4.2 4.2 4.2 4.8 14.6 5.3 7.6 22.9 21.3
Valeriate 2.3 2.2 – 2.1 2.6 5.1 – 2.7 14.0 18.1
Iso-capronate 1.4 1.4 – 1.4 1.4 6.3 – 1.7 2.0 –
Capronate 1.3 0.8 0.8 1.1 – 4.5 1.7 0.9 146.2 172.9
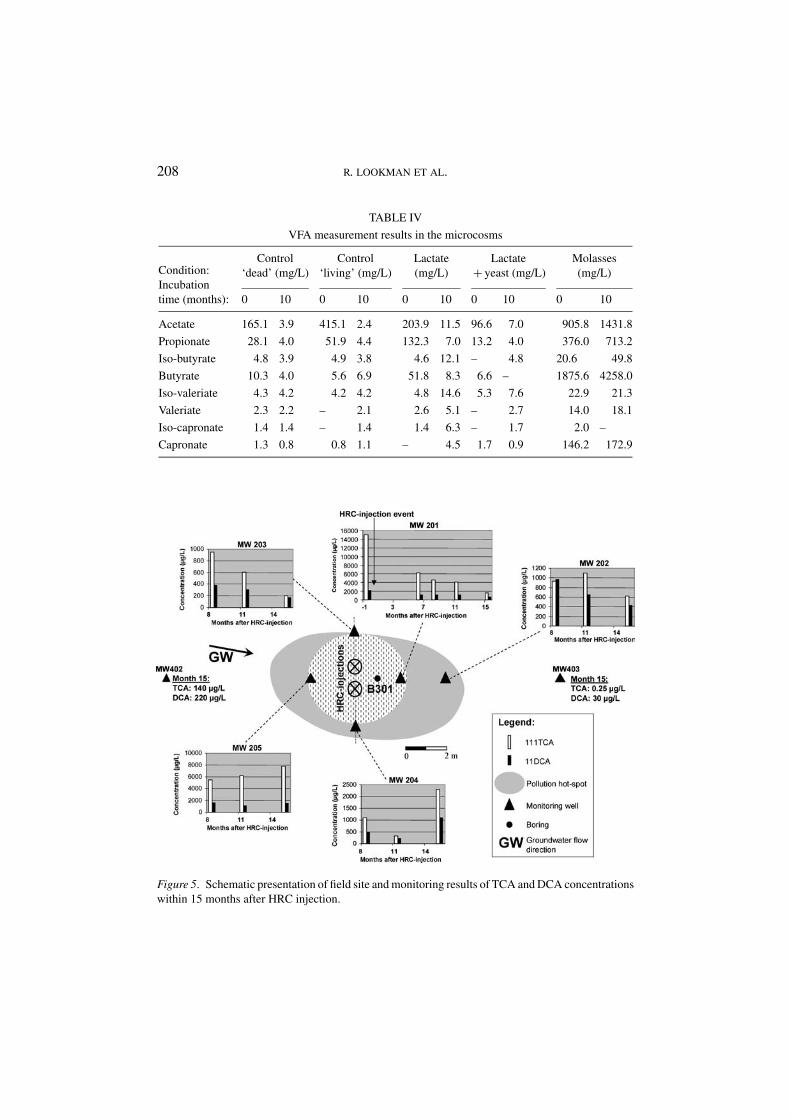
Figure 5. Schematic presentation of field site and monitoring results of TCA and DCA concentrationswithin 15 months after HRC injection.

EFFECTS OF CARBON SOURCE AMENDMENT ON THE ANAEROBIC DEGRADATION 209
Figure 6. Observed concentration evolutions of nitrate, sulphate, iron, manganese, DOC, chlorideand bromide in monitoring wells.
significantly over time (appr. 90% decrease in 15 months). DCA levels evolvedless drastically than TCA (appr. 60% decrease), which indicates that DCA is morerecalcitrant.
DCA concentrations were relatively highest in the downstream well MW202,indicating conversion of TCA to DCA. The TCA decrease was not a result
210 R. LOOKMAN ET AL.
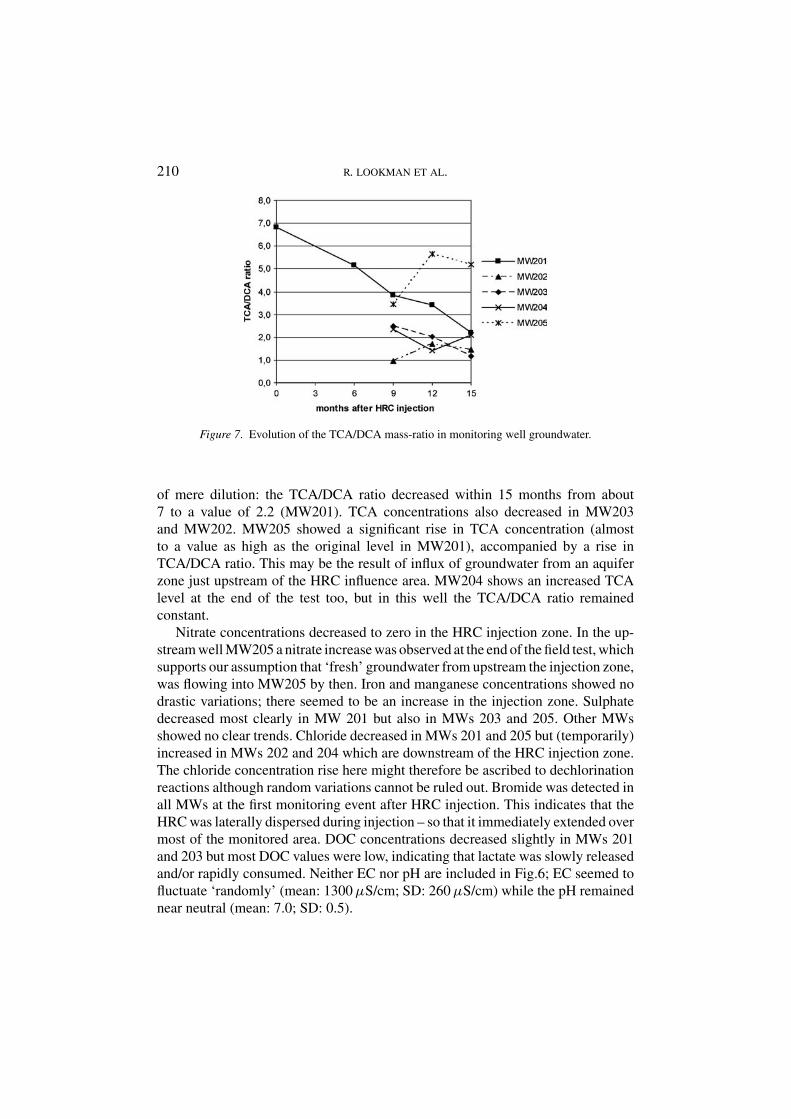
Figure 7. Evolution of the TCA/DCA mass-ratio in monitoring well groundwater.
of mere dilution: the TCA/DCA ratio decreased within 15 months from about7 to a value of 2.2 (MW201). TCA concentrations also decreased in MW203and MW202. MW205 showed a significant rise in TCA concentration (almostto a value as high as the original level in MW201), accompanied by a rise inTCA/DCA ratio. This may be the result of influx of groundwater from an aquiferzone just upstream of the HRC influence area. MW204 shows an increased TCAlevel at the end of the test too, but in this well the TCA/DCA ratio remainedconstant.
Nitrate concentrations decreased to zero in the HRC injection zone. In the up-stream well MW205 a nitrate increase was observed at the end of the field test, whichsupports our assumption that ‘fresh’ groundwater from upstream the injection zone,was flowing into MW205 by then. Iron and manganese concentrations showed nodrastic variations; there seemed to be an increase in the injection zone. Sulphatedecreased most clearly in MW 201 but also in MWs 203 and 205. Other MWsshowed no clear trends. Chloride decreased in MWs 201 and 205 but (temporarily)increased in MWs 202 and 204 which are downstream of the HRC injection zone.The chloride concentration rise here might therefore be ascribed to dechlorinationreactions although random variations cannot be ruled out. Bromide was detected inall MWs at the first monitoring event after HRC injection. This indicates that theHRC was laterally dispersed during injection – so that it immediately extended overmost of the monitored area. DOC concentrations decreased slightly in MWs 201and 203 but most DOC values were low, indicating that lactate was slowly releasedand/or rapidly consumed. Neither EC nor pH are included in Fig.6; EC seemed tofluctuate ‘randomly’ (mean: 1300 µS/cm; SD: 260 µS/cm) while the pH remainednear neutral (mean: 7.0; SD: 0.5).

EFFECTS OF CARBON SOURCE AMENDMENT ON THE ANAEROBIC DEGRADATION 211
TABLE V
Aquifer analyses at the end of the monitoring period
Parameter B301 MW402
Dry matter (%) 81.8% 83.0%
Acid volatile S2− (mg/kg dm) 30.7 <1.5
Total inorganic C (% dm) 0.51 0.68
Total C (% dm) 0.75 1.10
Total organic C (% dm) 0.24 0.42
Irona (mg/kg dm) 1616 771
Total P (mg/kg dm) <150 205
Kjeldahl-N (mg N/kg dm) 62.2 140
DCE (mg/kg dm) 0.16 <0.10
DCA (mg/kg dm) 0.13 0.13
TCA (mg/kg dm) 0.28 0.22
a Extractable in 1 M HCl.
3.2.3. Final Aquifer AnalysesAfter the 15-month monitoring period following HRC injection, the aquifer materialwas resampled, both inside the injection area and upstream of it (indicated on Fig. 5as B301 and MW402 respectively). Sampling was at 3 to 4 m bgl. The aquiferanalysis results are reported in Table V. These results indicate that FeS was formedin the injection area. This was also observed during sampling: the aquifer materialfrom B301 had a more blackish colour than the material from MW402. Otherworkers recently related TCA dechlorination to FeS production (Gander et al.,2002). Total C, Kjeldahl-N as well as total phosphorus were lower in the injectionzone than 7 m upstream. This suggests that all injected C and part of the native C,N and P were consumed in the injection zone so that these concentrations droppedto values lower than upstream of the injection zone. Measured CAH levels werequite low on both sampling locations as compared to the concentrations measuredprior to HRC injection (DCA: 0.96 mg/kg dm and TCA: 8.8 mg/kg dm (Lookmanet al., 2004).
3.3. MOLECULAR BIOLOGICAL ASSESSMENT
3.3.1. Sulphate ReducersPCR results with the dsr-primers (indicating presence or absence of sulphate re-ducers) are shown in Figure 8. For the aquifer material sampled after finishing thefield test (lanes 14 and 15), only the HRC injection zone shows a positive PCRand thus contains detectable amounts of sulphate reducing bacteria. The aquifer

212 R. LOOKMAN ET AL.
Figure 8. PCR results with dsr-primers (sulphate reducers). Lanes 2–13 are results for microcosmvials, lanes 14–15 are results for field samples collected 15 months after HRC injection. Lanes 1and 17 are 100bp ladders. Lane 2–3: abiotic controls; lanes 4–6: biotic controls; lanes 7–8: lactateconditions; lanes 9–11: lactate + nutrient conditions; lanes 12–13: molasses conditions; lane 14: B301(HRC injection zone); lane 15: MW403 (upstream HRC injection zone). Lane 16: negative control(no template).
material sampled upstream of the HRC injection zone shows no detectable sul-phate reducers. This, coupled to the fact that TCA concentrations dropped in theHRC injection zone and not upstream of it, seems to indicate that FeS productionand TCA degradation indeed are related processes; thus that TCA may be bioticallydegraded by sulphate reducers or by chemical reduction on FeS. This is howevercontradicted by our PCR results for the microcosms. The abiotic controls (lanes2 and 3 in Figure 8) were neither blackishly coloured nor had positive PCR forsulphate reducers. The biotic controls did show weak but positive PCR resultsfor sulphate reducers. All microcosms amended with carbon sources developed
Figure 9. PCR results with Dehalococcoides sp. specific primers. Lanes 2–13 are results for micro-cosm vials, lanes 14–15 are results for field samples collected 15 months after HRC injection. Lane 1:100bp ladder. Lane 2–3: abiotic controls; lanes 4–6: biotic controls; lanes 7–8: lactate conditions;lanes 9–11: lactate + nutrient conditions; lanes 12–13: molasses conditions; lane 14: B301 (HRCinjection zone); lane 15: MW403 (upstream HRC injection zone). Lane 16: positive control.

EFFECTS OF CARBON SOURCE AMENDMENT ON THE ANAEROBIC DEGRADATION 213
an intense blackish colour and showed strongly positive PCR signals for sulphatereducers. TCA concentrations however decreased in all microcosms to about thesame extent and no equal amounts of DCA were produced. This contradicts thatthe mechanism is biotic and that sulphate reducers are responsible for the decreasein TCA-concentrations.
3.3.2. Dehalococcoides SpeciesPCR results using Dehalococcoides specific primers are given in Figure 9. Theabiotic and biotic control microcosms do not show positive signals. Some lactate(lane 7) and lactate+nutrient (lane 11) conditions show the correct amplicon in-dicating the presence of Dehalococcoides sp. The HRC injection seems to havestimulated the growth of these bacteria, since it is detected in the HRC injectionzone (lane 14) but not upstream of it (lane 15).
4. Conclusions
In the microcosms, TCA concentrations decreased by 90% in ten months (all con-ditions). DCA starting and end levels were about the same and DCE end levelswere slightly lower than the starting levels. Neither CA nor VC was formed in themicrocosms. Since TCA disappeared in all conditions and no significant amountsof daughter products (DCA, DCE, CA, VC) were formed, TCA removal most likelywas abiotic. The pollution as measured in the field had maintained about the sameintensity over a period of more than 5 years of monitoring befor the start of our tests.After the carbon source injection in the field test, TCA concentrations decreasedby 90% in 15 months. This seems to contradict the microcosm results that indicatethat TCA concentrations decreased in both carbon source amended and unamendedvials. We believe that this observation is related to the strictly anaerobic conditionsthat were created during microcosm preparation as compared to the redox con-ditions of the original field situation: starting redox potentials measured in themicrocosms were lower than the redox potentials measured in the field outside thecarbon-source injection zone. Our results show that the HRC injection had stimu-lated sulphate reducing bacteria and had caused FeS formation. This, and the TCAdecrease in the HRC injection zone as compared to the upstream concentration,seems to indicate that FeS production and TCA degradation are related processes.In the microcosms however, all TCA concentrations decreased to about the sameextent. The microcosms amended with carbon sources showed positive PCR sig-nals for sulphate reducers but the abiotic controls had no positive PCR for sulphatereducers. This leads to the conclusion that sulphate reducers and the FeS formed,are not responsible for the decrease in TCA concentrations. Dehalococcoides typebacteria were below detection limit in the abiotic and biotic control microcosmsbut were detected in some lactate and lactate+nutrient amended microcosms. Theywere also detected in the HRC injection zone but not upstream of it. Again, the
214 R. LOOKMAN ET AL.
presence or absence of detectable quantities of Dehalococcoides sp. seems to be re-lated to TCA degradation when regarding the results in the field. When focusing onthe microcosms however, the presence of detectable amounts of Dehalococcoidessp. did not seem prerequisite for TCA degradation, since TCA disappeared in allmicrocosms, carbon source amended or not. The carbon-source injection howeverdid yield environmental conditions that increased TCA degradation in the field.The exact degradation mechanisms however remain unclear.
Acknowledgements
We thank Nicole Hermans, Carine Gielen and Diane Van Houtven for laboratoryassistance, Redevco for admittance to the study site, Kristel Lauryssen (Soresma,Belgium) for co-ordinating part of the monitoring and Steve Camerlynck (DEC,Belgium) for organizing the HRC injection. RL thanks Dirk Springael for his con-structive comments on an earlier version of this manuscript. This study was co-financed by OVAM (Public Flemish Waste Agency, Belgium).
References
Ahlert, R. C. and Enzminger, J. D.: 1992, ‘Anaerobic processes for the dechlorination of 1,1,1-trichloroethane’, J. Environ. Sci. Heal. A 27, 1675–1699.
Baker, S. K.: 1999, ‘Rumen methanogens, and inhibition of methanogenesis’, Austral. J. Agr. Res.50, 1293–1298.
Cervini-Silva, J., Kostka, J. E., Larson, R. A., Stucki, J. W. and Wu, J.: 2003, ‘Dehydrochlorinationof 1,1,1-trichloroethane and pentachloroethane by microbially reduced ferruginous smectite’,Environ. Toxicol. Chem. 22, 1046–1050.
Chen, C., Ballapragada, B. S., Puhakka, J. A., Strand, S. E. and Ferguson, J. F.: 1999, ‘Anaerobictransformation of 1,1,1-trichloroethane by municipal digester sludge’, Biodegradation 10, 297–305.
Clement, T. P., Truex, M. J. and Lee, P.: 2002, ‘A case study for demonstrating the application ofUS EPA’s monitored natural attenuation screening protocol at a hazardous waste site’, J. Contam.Hydrol. 59, 133–162.
Davis, J. W., Odom, J. M., DeWeerd, K. A., Stahl, D. A., Fishbain, S. S., West, R. J., Klecka, G. M.and DeCarolis J. G.: 2002, ‘Natural attenuation of chlorinated solvents at Area 6, Dover Air ForceBase: characterization of microbial community structure’, J. Contam. Hydrol. 57, 41–59.
Doong, R. A. and Chen, T. F.: 1996, ‘Anaerobic degradation of 1,1,1-trichloroethane with the amend-ment of different substrate and microbial concentrations’, Chemosphere 32, 2003–2014.
Doong, R. A. and Wu, Y. W.: 1997, ‘Enhanced biodegradation of 1,1,1-trichloroethane under lowbiomass conditions’, Chemosphere 34, 1653–1662.
Doong, R. A., Wu, S. C. and Chen, T. F.: 1998, ‘Modeling transport and fate of chlorinated hydrocar-bons governed by biotic transformation in porous media’, Water Res. 32, 39–46.
Duhamel, M., Wehr, S. D., Yu, L., Rizvi, H., Seepersad, D., Dworatzek, S., Cox, E. E. and Edwards,E. A.: 2002, ‘Comparison of anaerobic dechlorinating enrichment cultures maintained on tetra-chloroethene, trichloroethene, cis-dichloroethene and vinyl chloride’, Water Res. 36, 4193–4202.
EFFECTS OF CARBON SOURCE AMENDMENT ON THE ANAEROBIC DEGRADATION 215
El Fantroussi, S., Naveau, H. and Agathos S. N.: 1998, ‘Anaerobic Dechlorinating Bacteria’, Biotech-nol. Prog. 14, 167–188.
Fennell, D. E. and Gossett, J. M.: 2003, ‘Microcosms for site-specific evaluation of enhanced bio-logical reductive dehalogenation’, in M. M. Haggblom and I. D. Bossert (eds.), Dehalogenation:Microbial Processes and Environmental Applications, Kluwer Academic, Boston, 2003; pp. 385–420.
Ferguson, J. F. and Pietari, J. M. H.: 2000, ‘Anaerobic transformations and bioremediation of chlori-nated solvents’, Environ. Pollut. 107, 209–215.
Gander, J. W., Parkin, G. F. and Scherer, M. M.: 2002, ‘Kinetics of 1,1,1-trichloroethane trans-formation by iron sulfide and a methanogenic consortium’, Environ. Sci. Technol. 36, 4540–4546.
Holliger, C., Regeard, C. and Diekert, G.: 2003, ‘Dehalogenation by anaerobic bacteria’, in M. M.Haggblom and I. D. Bossert (eds.), Dehalogenation: Microbial Processes and EnvironmentalApplications, Kluwer Academic, Boston, 2003; pp. 115–158.
Jitnuyanont, P., Sayavedra-Soto, L. A. and Semprini, L.: 2001, ‘Bioaugmentation of butane-utilizingmicroorganisms to promote cometabolism of 1,1,1-trichloroethane in groundwater microcosms’,Biodegradation 12, 11–22.
Klein, M., Friedrich, M., Roger, A. J., Hugenholtz, P., Fishbain, S., Abicht, H., Blackall, L. L.,Stahl, D. A. and Wagner, M.: 2001, ‘Multiple lateral transfers of dissimilatory sulphite reduc-tase genes between major lineages of sulphate-reducing prokaryotes’, J. Bacteriol. 183, 6028–6035.
Koenigsberg, S. S. and Norris, R. D.: 1999, ‘Accelerated bioremediation using slow release com-pounds’, Selected Batelle Conference Papers 1993–1999, Regenesis Bioremediation Products.
Koenigsberg, S. S.: 2000, ‘Accelerated bioremediation of chlorinated compounds in groundwater’,Selected Batelle Conference Papers 1999–2000, Regenesis Bioremediation Products.
Ladaa, T. I., Lee, C. M., Coates, J. T. and Falta Jr., R. W.: 2001, ‘Cosolvent effects of alcohols onthe Henry’s law constant and aqueous solubility of tetrachloroethylene (PCE)’, Chemosphere 44,1137–1143.
Loffler, F. E., Sun, Q., Li, J. R. and Tiedje, J. M.: 2000, ‘16S rRNA gene-based detection oftetrachloroethene-dechlorinating Desulfuromonas and Dehalococcoides species’, Appl. Environ.Microbiol. 66, 1369–1374.
Lookman, R., Bastiaens, L., Borremans, B., Maesen, M., Gemoets, J. and Diels, L.: 2003, ‘Batch-teststudy on the dechlorination of 1,1,1-trichloroethane (TCA) in contaminated aquifer material byzero-valent iron’, J. Contam. Hydrol. 74, 133–144.
Lorah, M. M. and Voytek, M. A.: 2004, ‘Degradation of 1,1,2,2-tetrachloro ethane and accumulationof vinyl chloride in wetland sediment microcosms and in situ porewater: Biogeochemical controlsand associations with microbial communities’, J. Contam. Hydrol. 70, 117–145.
Major, D. W., McMaster M. L., Cox E. E., Edwards E. A., Dworatzek S. M., Hendrickson E. R., StarrM. G., Payne J. A. and Buonamici L. W.: 2002, ‘Field demonstration of successful bioaug-mentation to achieve dechlorination of tetrachloroethene to ethane’, Environ. Sci. Technol. 36,5106–5116.
Maymo-Gatell, X., Anguish, T. and Zinder, S. H.: 1999, ‘Reductive dechlorination of chlorinatedethenes and 1,2-dichloroethane by “Dehalococcoides ethenogenes” 195’, Appl. Environ. Micro-biol. 65, 3108–3113.
Maymo-Gatell, X., Nijenhuis, I. and Zinder S. H.: 2001, ‘Reductive dechlorination of cis-1,2-dichloroethene and vinyl chloride by “Dehalococcoides ethenogenes”’, Environ. Sci. Technol.35, 516–521.
Perez-Jimenez, J. R., Young, L. Y. and Kerkhof, L. J.: 2001, ‘Molecular characterization of sulphate-reducing bacteria in anaerobic hydrocarbon-degrading consortia and pure cultures using the dis-similatory sulphite reductase (dsr AB) genes’, FEMS Microbiol. Ecol. 35, 145–150.

216 R. LOOKMAN ET AL.
Rhee, E. and Speece, R. E.: 2000, ‘Probing of maximal biodegradation rates of methylene chloride,carbon tetrachloride, and 1,1,1-trichloroethane in methanogenic processes’, Environ. Technol. 21,147–156.
Sherwood, J. L., Petersen, J. N. and Skeen, R. S.: 1998, ‘Biodegradation of 1,1,1-trichloroethane bya carbon tetrachloride-degrading denitrifying consortium’, Biotechnol. Bioeng. 59, 393–399.
Sun, B. L., Griffin, B. M., Ayala-del-Rio, H. L., Hashsham, S. A. and Tiedje, J. M.: 2002, ‘Microbialdehalorespiration with 1,1,1-trichloroethane’, Science 298, 1023–1025.
Vogel, T. M. and McCarty, P. L.: 1987, ‘Abiotic and biotic transformations of 1,1,1-trichloroethaneunder methanogenic conditions’, Environ. Sci. Technol. 21, 1208–1213.
Wagner, M., Roger, A. J., Flax, J. L., Brusseau, G. A. and Stahl, D. A.: 1998, ‘Phylogeny of dis-similatory sulphite reductases supports an early origin of sulphate respiration’, J. Bacteriol. 180,2975–2982.
Wiedmeier, T. H., Swnason, M. A., Moutoux, D. E., Gordon, E. K., Wilson, J. T., Wilson, B. H.,Kampbell, D. H., Hass, P. E., Miller, R. N., Hansen, J. E. and Chapelle, F. H.:1998, ‘Technicalprotocol for evaluating natural attenuation of chlorinated solvents in ground water’, Office ofResearch and Development, EPA/600/R–98/128.
Wing, M. R.: 1997, ‘Apparent first-order kinetics in the transformation of 1,1,1-trichloroethane ingroundwater following a transient release’, Chemosphere 34, 771–781.