EFFECTS OF CAPITAL STRUCTURE ON FINANCIAL …
74
EFFECTS OF CAPITAL STRUCTURE ON FINANCIAL PERFORMANCE OF COMMERCIAL BANKS IN KENYA DORIS KANINI SAMUEL A RESEARCH PROJECT REPORT SUBMITTED TO THE DEPARTMENT OF BUSINESS AND ENTREPRENEURSHIP, IN THE SCHOOL OF BUSINESS AND ECONOMICS IN PARTIAL FULFILMENT OF THE REQUIREMENT FOR THE AWARD OF THE DEGREE OF MASTERS IN BUSINESS ADMINISTRATION, OF SOUTH EASTERN KENYA UNIVERSITY. 2016
Transcript of EFFECTS OF CAPITAL STRUCTURE ON FINANCIAL …

EFFECTS OF CAPITAL STRUCTURE ON FINANCIAL
PERFORMANCE OF COMMERCIAL BANKS IN KENYA
DORIS KANINI SAMUEL
A RESEARCH PROJECT REPORT SUBMITTED TO THE
DEPARTMENT OF BUSINESS AND ENTREPRENEURSHIP, IN
THE SCHOOL OF BUSINESS AND ECONOMICS IN PARTIAL
FULFILMENT OF THE REQUIREMENT FOR THE AWARD OF
THE DEGREE OF MASTERS IN BUSINESS ADMINISTRATION,
OF SOUTH EASTERN KENYA UNIVERSITY.
2016

ii
DECLARATION
This research project report is my original work and has never been submitted for a
degree or any other award in any other university.
…………………………….. …………………………………..
Doris Kanini Samuel Date
D61/KIT/20505/2014
This report has been submitted for examination with our approval as appointed
University Supervisors
Signed…………………………………..Date ………………………………….
Dr. Jared Ariemba
Department of Business and Entrepreneurship
School of Business and Economics
South Eastern Kenya University
Signed…………………………………Date ……………………………………
Mr. Samuel Kinuthia
Department of Business and Entrepreneurship
School of Business and Economics
South Eastern Kenya University

iii
DEDICATION
I dedicate this work to my lovely mum Mrs. Priscillah Samuel, my daughter Victoria
and my son Vincent. They have been my biggest inspiration, their undying support and
encouragement helped me realize my academic pursuit of an MBA.

iv
ACKNOWLEDGMENT
This Research Project would not have been possible without the cooperation and
support of a number of people, who in one way or the other steered me towards my
ultimate goal. I would like to express my appreciation to them and especially to the
following:-
I wish to express my sincere gratitude to my project supervisors, led by Dr. Jared
Ariemba, for his tireless guidance, assisted by Mr. Samuel Kinuthia for his insights and
encouragement in making this project a reality. I also wish to acknowledge the
contribution of the rest of South Eastern Kenya University, Kitui Campus fraternity
especially the library staff, the campus administration office which coordinates the
MBA program and moderators to the success of this project.
Most important of all I extend my gratitude to the Almighty God for strength, good
health, knowledge and vitality that helped make this project a reality.

v
TABLE OF CONTENTS
DECLARATION.......................................................................................................... ii
DEDICATION............................................................................................................ iii
ACKNOWLEDGMENT ............................................................................................ iv
LIST OF TABLES ...................................................................................................... ix
LIST OF FIGURES ..................................................................................................... x
DEFINITION OF TERMS......................................................................................... xi
ABSTRACT .............................................................................................................. xiii
CHAPTER ONE .......................................................................................................... 1
INTRODUCTION........................................................................................................ 1
1.1 Background of the study ...................................................................................... 1
1.2 Statement of problem ........................................................................................... 6
1.3 Objectives ............................................................................................................. 6
1.3.1 Specific Objectives ........................................................................................ 6
1.4 Research questions ............................................................................................... 7
1.5 Justification .......................................................................................................... 7
1.6 Scope .................................................................................................................... 8
1.7 Limitation and delimitation of the study .............................................................. 8
CHAPTER TWO ......................................................................................................... 9
LITERATURE REVIEW ........................................................................................... 9
2.1 Introduction .......................................................................................................... 9
2.2 Theoretical Review .............................................................................................. 9

vi
2.2.1 Franco Modigliani and Merton Miller Theorem ........................................... 9
2.2.2 The Trade-Off Theory ................................................................................. 11
2.2.3 Static trade-off theory .................................................................................. 13
2.2.4 The Dynamic Trade-off Theory .................................................................. 13
2.2.5 The Market timing theory ............................................................................ 16
2.3 Empirical Literature ........................................................................................... 18
2.3.1 Conceptual Framework................................................................................ 21
2.4 Literature overview and Research gaps ............................................................. 23
CHAPTER THREE ................................................................................................... 25
RESEARCH METHODOLOGY ............................................................................. 25
3.1 Introduction ........................................................................................................ 25
3.2 Research design .................................................................................................. 25
3.3 Target Population ............................................................................................... 25
3.4 Sample size and sampling technique .................................................................. 26
3.5 Data collection procedure................................................................................... 26
3.6 Data Processing and analysis ............................................................................. 27
CHAPTER FOUR ...................................................................................................... 28
DATA ANALYSIS AND INTERPRETATION ...................................................... 28
4.1 Introduction ........................................................................................................ 28
4.2 Descriptive Statistics .......................................................................................... 28
4.3 Correlation Analysis ........................................................................................... 29

vii
4.4 Regression Analysis ........................................................................................... 30
4.4.1 Regression Output ....................................................................................... 30
4.4.2 Statistical Significance of the Model ........................................................... 31
4.4.3 Estimated Model Coefficients ..................................................................... 32
4.5 Variables summary ............................................................................................. 34
4.5.1 Debt and financial performance of commercial banks ................................ 34
4.5.2 Internal equity and financial performance of commercial banks ................ 34
4.5.3 External equity and financial performance of commercial banks ............... 35
4.5.4 Preference shares and financial performance of commercial banks ............ 35
CHAPTER FIVE ....................................................................................................... 36
SUMMARY CONCLUSION AND RECOMMENDATIONS .............................. 36
5.1 Introduction ........................................................................................................ 36
5.2 Summary of Findings ......................................................................................... 36
5.3 Conclusion .......................................................................................................... 38
5.4 Recommendations .............................................................................................. 39
5.5 Suggestion for Further Studies ........................................................................... 40
REFERENCES ........................................................................................................... 41
APPENDICES ............................................................................................................ 50
Appendix I: Introduction letter ................................................................................. 50
Appendix II: Introduction letter from University ..................................................... 51
Appendix III: Data collection sheet ......................................................................... 52

viii
Appendix IV: List of commercial banks in Kenya ................................................. 57
Appendix V: Mergers ............................................................................................... 60
Appendix VI: Acquisitions....................................................................................... 61

ix
LIST OF TABLES
Table 4.1 Descriptive Statistics …………………………………………….28
Table 4.2 Correlation Analysis…………………………………………..29
Table 4.3 Summary Regression Output………………………………….30
Table 4.4 Analysis of Variance (ANOVA)………………………………31
Table 4.5 Model Coefficients…………………………………………….32

x
LIST OF FIGURES
Figure 2.1: Conceptual Framework………………………………………………….23

xi
DEFINITION OF TERMS
EBIT – Earnings Before Interests and Taxes, (Nirajini, 2013).
Residual claim – Claim last on profits, claim last on assets, (Myers, 2001).
Liquidation – Closure of a firm where properties are converted to cash,
(Baker & Wurgler, 2002)
Preference shares – The investor of this shares has a greater claim on the
company’s assets than common stockholder
(Graham & Harvey, 2001).
Ordinary shares – Ownership of a limited company, Margaritis &Psillaki
(2010).
Retained earnings - Percentage of net earnings not paid out as dividends, but
retained by the company to be reinvested in its core business, or
to pay debt, (Amidu, 2007)
Gearing - The act of borrowing money at fixed interest which is then
used to produce more money than the interest paid. It’s also a
measure of a company’s financial leverage and shows the
extent to which its operations are funded by lenders versus
shareholders, (Akerlof, 1970)
The gearing ratio - Measures the proportion of a company's borrowed funds to its
equity, (Nirajini, 2013).

xii
Financial leverage - According to financial leverage is the proportion of capital that
is financed by debt as opposed to own equity, (Ward and Price,
2006).
Equity -It is the total assets minus total liabilities thus the networth(Stephen,2001)
Debt -It is a liability whereby a firm borrows a certain amount of money at an
interest, Staking & Babbel, (1995).
Capital structure –It is the way a firm finances its sources of funds for investment mostly
through assets by use of debt and equity combination (Saad, 2010).
According to Ahmadpour and Yahyazadehfar, (2010) Capital
Structure is combination of debt and equity that makes up the sources
of corporate assets.
Capital Reserves - It is raised by selling shares at a premium or through revaluation
of the company’s assets, (Sulaiman, 2001)
Revenue Reserves - They are undistributed earnings which are retained to make up
for the fall in profits so as to sustain acceptable risks and to sustain
growth through plough backs, (Barton, Hill, & Srinivasan, 1989)
Receivership /liquidation – It is a remedy available to secured creditors to recover
amounts outstanding under a secured loan in the event the
company defaults on its loan payments. A Receiver may also be
appointed in a shareholder dispute to complete a project,
liquidate assets or sell a business. (Ongore, 2011)

xiii
ABSTRACT
The rationale of this study was to provide insights into the relationship between capital
structure and financial performance of Kenya’s banking industry. The pioneer work on
capital structure by Modigliani and Miller (1958) despite of the unrealistic assumptions
has been source of inspirations for scholars. Their propositions state that the market
value of any firm and its cost of capital are independent of its capital structure in
presence of perfect market conditions. The general objective of this study was to assess
the effect of capital structure on financial performance of commercial banks in Kenya.
The Specific Objectives was to assess the effect of debt on financial performance of
commercial banks in Kenya, to assess the effect of internal equity on financial
performance of commercial banks in Kenya, to assess the effect of external equity on
financial performance of commercial banks in Kenya and to assess the effect of
preference share on financial performance of commercial banks in Kenya. The financial
performance was measured using EBIT (earnings before interest and tax). The target
population was the banking industry. A census was conducted. Secondary data was
used. Data was drawn from a sample of the registered banks by the Central Bank of
Kenya in Kenya. According to the central bank of Kenya, there were 43 licensed
commercial banks in Kenya. The study also used annual reports that were available
from their websites and in the Central bank of Kenya website. Data was obtained for a
ten year period from 2005 to 2014. Data analysis was done using SPSS software version
21 for efficient data representation. The model equation shows that growth in debt
would affect financial performance positively leading to improvement in profitability.
If there is an increase in debt levels, the EBIT is expected to increase by 17.6% per unit
measure. The study also shows similar effect on retained earnings and preference shares
on commercial banks’ financial performance. If there is a unit increase in retained
earnings and preference shares, the EBIT will tend to increase by 21.8% and 0.8%
respectively, indicating that debt and retained earnings are more significant in
predicting financial performance than preference shares which have insignificant factor
at 95% confidence level. On the other hand, ordinary shares show different effect, that
a unit increase would affect financial performance negatively by decreasing
performance at a rate of -1%.

1
CHAPTER ONE
INTRODUCTION
This chapter examines the background to the study, the research problem and the
purpose of the study. The research objectives, research questions, justification of the
study, and scope are also discussed. The limitations and delimitation of the study are
also discussed.
1.1 Background of the study
A firm’s capital structure is the mix of its’ financial resources available for carrying on
the business and is a major determinant on how the business operates. The capital
structure of a firm is described as the components of its sources of financing, broadly
categorized as equity and debt finance, Brockington (1990).In general, commercial
banks can choose among many alternative capital structures. According to finance
theory, the capital structure affect firm’s cost of capital and consequently financial
performance, (Abor, 2005).
Capital Structure is referred to as the ratio of different kinds of securities raised by a
firm as long-term finance and debt. These securities include external equity (Ordinary
shares), internal equity (Retained earnings), and preference shares, (Margaritis
&Psillaki, 2010). Ordinary share capital is raised from the public from the sale of
ordinary shares to the shareholders. This finance is available to limited companies. It is
a permanent finance as the owner/shareholder cannot recall this money except under
liquidation. It is thus a base on which other finances are raised. Ordinary share capital
carries a return that is variable that is the ordinary dividends. These shares carry voting
rights and can influence the company’s decision making process at the AGM. The

2
ordinary shares carry the highest risk in the company (high securities) because of
uncertainty of return. Ordinary shares cannot ensure refund and have residual claims.
Amidu, (2007) claims retained earnings is the percentage of net earnings not paid out
as dividends, but retained by the company to be reinvested in its core business, or to
pay debt. It is recorded under shareholders’ equity on the balance sheet. Retained
earnings include revenue reserves and capital reserves. Revenue Reserves are
undistributed earnings. Such reserves are retained to make up for the fall in profits so
as to sustain acceptable risks and to sustain growth through plough backs. They are a
cheap source of finance and are used to boost the company’s credit rating so that they
enable further finance to be obtained. It lowers the company’s gearing ratio and reduces
chances of receivership/liquidation. Sulaiman, (2001) argues that Capital Reserves is
raised by selling shares at a premium. (The difference between the market price less
floatation costs and par value is credited to the capital reserve) or through revaluation
of the company’s assets. This leads to a fictitious entry which is of the nature of a capital
reserve, or by creation of a sinking fund. Preference share is also called quasi-equity
according to (Graham & Harvey, 2001) because it combines features of equity and
those of debt. Preference share is preferred to ordinary share capital because it is paid
dividends first and it is paid asset proceeds first. Unlike ordinary share capital, it has a
fixed return and carries no voting rights. It is an unsecured finance and it increases the
company’s gearing ratio. (Myers, 2001)
Debt finance as suggested by Staking & Babbel, (1995) is a fixed return finance as the
cost (interest) is fixed on the par value (face value of debt). It is ideal to use if there’s a
strong equity base. It is raised from external sources to qualifying companies and is
available in limited quantities. It is limited to value of security and liquidity situation in

3
a given country. It is ideal for companies where gearing allows them to raise more debt
and thus gearing level.
Financial performance is a subjective measure of how well a firm can use assets from
its primary mode of business and generate revenues. It is a general measure of a firms
overall financial health over a given period of time and can be used to compare similar
firms across the same industry. Kaplan and Norton (1992) argues that, performance can
also be assessed on a balanced scorecard of critical success factors through four
perspectives financial, customers, internal business processes and learning and growth.
Financial performance of commercial banks can be measured through variety of ratios
of which Return on Asset, Return on Equity and Net Interest Margin are the major ones
(Murthy and Sree, 2003; Alexandru et al., 2008). Return On Equity (ROE) is a financial
ratio that refers to how much profit a company earned compared to the total amount of
shareholder equity invested or found on the balance sheet. ROE is what the shareholders
look in return for their investment. A business that has a high return on equity is more
likely to be one that is capable of generating cash internally. Thus, the higher the ROE
the better the company is in terms of profit generation. It is further explained by
Khrawish (2011) that ROE is the ratio of Net Income after Taxes divided by Total
Equity Capital. It represents the rate of return earned on the funds invested in the bank
by its stockholders. ROE reflects how effectively a bank management is using
shareholders’funds. Thus, it can be deduced from the above statement that the better
the ROE the more effective the management in utilizing the shareholders capital.
Return On Asset, (ROA) is also another major ratio that indicates the profitability of a
bank. It is a ratio of Income to its total asset (Khrawish, 2011). It measures the ability
of the bank management to generate income by utilizing company assets at their

4
disposal. In other words, it shows how efficiently the resources of the company are used
to generate the income. It further indicates the efficiency of the management of a
company in generating net income from all the resources of the institution (Khrawish,
2011). Wen (2010), state that a higher ROA shows that the company is more efficient
in using its resources.
Net Interest Margin is a measure of the difference between the interest income
generated by banks and the amount of interest paid out to their lenders (for example,
deposits), relative to the amount of their assets. It is usually expressed as a percentage
of what the financial institution earns on loans in a specific time period and other assets
minus the interest paid on borrowed funds divided by the average amount of the assets
on which it earned income in that time period (the average earning assets).
The NIM variable is defined as the net interest income divided by total earnings assets
(Gul et al., 2011). Net interest margin measures the gap between the interest income
the bank receives on loans and securities and interest cost of its borrowed funds. It
reflects the cost of bank intermediation services and the efficiency of the bank. The
higher the net interest margin, the higher the bank's profit and the more stable the bank
is. Thus, it is one of the key measures of bank profitability. However, a higher net
interest margin could reflect riskier lending practices associated with substantial loan
loss provisions (Khrawish, 2011).
In a study on the effect of capital structure on firm performance across different banks
in Jordan, statistically, capital structure is not a major determinant of firm performance.
(Titman and Wessels, 1988). It recommends that managers of manufacturing
companies should exercise caution while choosing the amount of debt to use in their
capital structure as it affects their performance negatively. Ibrahim (2009) examined

5
the impact of capital structure choice on firm performance in Egypt, using a multiple
regression analysis in estimating the relationship between leverage level and firm’s
performance. The result revealed that capital structure choice decision in general, has a
weak-to-no impact on firm’s performance. Capital structure has been found to have
impact on firm performance in Nigeria, (Olayinka, 2011).
Bank consolidation in Nigeria has increased bank equity capital against debt. Bank debt
has a positive and significant effect on the financial performance of banks in Nigeria.
Additionally, bank equity has a positive and significant relationship with bank financial
performance; and bank debt and equity positively affect bank financial performance,
(Olayinka, 2011). Amidu (2007) conducted a study to investigate the dynamics
involved in the determination of the capital structure of the Ghana banks and the result
was a negative relationship between profitability and leverage. The results of prior
studies showed that higher profits increase the level of internal financing. In Kenya,
Kiogora (2000), found a positive relationship between capital structure and value of the
firm.
Cost of capital serves as the benchmark for firm’s capital budgeting decisions therefore
the optimal mix of debt and equity is imperative to outperform. Shareholders’ wealth
maximization concept also dictates that institutions choose the optimal mix of debt and
equity financing that best serve the ultimate objective of the firm. Capital structure
theory in response suggests that institutions establish what is often referred to as a target
debt ratio, which is based on various trades-offs between the costs and benefits of debt
versus equity, (Kochhar, 1997)

6
1.2 Statement of problem
Studies on the impact of capital structure on profitability have mostly been carried out
in developed economies on commercial banks. In the developing economies, Chiang
Yat Hung, Chan Ping Chuen Albert & Hui Chi Man Eddie (2002) concluded that while
high gearing is positively related to asset, it’s negatively related to profit margins in
Hong Kong. Kyereboah-Coleman (2007) finds that a high debt level is positively
related to performance of micro-finance institutions in sub-Saharan Africa.
In Kenya, Kiogora (2000), found a positive relationship between capital structure and
value of the firm. Titman & Wessels (1988) contend that firms with high profit levels,
all things being equal, would maintain relatively lower debt levels since they can realize
such funds from internal sources. Furthermore, Kester (1986) found a significantly
negative relation between profitability and debt/asset ratios. Rajan & Zingalas (1995)
also confirmed a significantly negative correlation between profitability and leverage
in their work. Different authors have different opinion over the effect of capital
structure on the profitability. This has led to the desire to establish whether the capital
structure of commercial banks in Kenya has an influence on their profitability using
time series analysis.
1.3 Objectives
The general objective was to assess the effect of capital structure on financial
performance of commercial banks in Kenya.
1.3.1 Specific Objectives
i. To determine the effect of debt on financial performance of commercial banks
in Kenya
7
ii. To assess the effect of internal equity on financial performance of commercial
banks in Kenya
iii. To determine the effect of external equity on financial performance of
commercial banks in Kenya
iv. To assess the effect of preference share on financial performance of commercial
banks in Kenya.
1.4 Research questions
i. Does debt have effect on financial performance of commercial banks in Kenya?
ii. Does internal equity have effect on financial performance of commercial banks
in Kenya?
iii. Does external equity have effect on financial performance of commercial banks
in Kenya?
iv. Do preference share have effect on financial performance of commercial banks
in Kenya?
1.5 Justification
The findings of this study will form part of the action plans that will help the
commercial banks in Kenya in enhancing the banking sector countrywide. The results
of the study can be used to develop policies, practices, and strategies that would enable
higher levels of financial performance and create greater efficiencies in meeting
strategic objectives of the commercial banks .The findings of this study will be expected
to be of value to researchers and students with an interest in this field of study since it
will provide literature that can be used for reference for future research and studies.

8
1.6 Scope
The study used an empirical study design. The reasons for Using Empirical research
methods is that traditional knowledge has been trusted for too long and that empirical
research method help integrating research and practice, and also educational process or
instructional science needs to progress. Empirical study design provide respect to
contextual differences, help to build upon what is already known and provide
opportunity to meet standards of professional research. Secondary data was used. Data
was drawn from a sample of the registered banks by the Central Bank of Kenya in
Kenya. According to the central bank of Kenya, there are 43 licensed commercial banks
in Kenya. The study also used annual reports that were available from their websites
and in the Central bank of Kenya website. Data was obtained for a ten year period from
2005 to 2014, considering banks that were there for the mentioned last years.
1.7 Limitation and delimitation of the study
Some of the challenge faced was that the Managers of banks found it hard to give
information as they were afraid that their information may be leaked out and that any
information they gave out will bring them problems in the future. This limitation of
fear was eliminated by giving out a letter from the university showing clearly that the
information given out was solely used for academic purpose. The study relied on data
collected from secondary sources and any error in the original data could not be
avoided. However all data was collected from the Central Bank of Kenya and
therefore reliable.

9
CHAPTER TWO
LITERATURE REVIEW
2.1 Introduction
This chapter review the documented theories and studies by other researchers in the
field of capital structure that provide foundation to the study. The specific area cover
provided basis of developing an understanding and established appropriate scope in
aligning objectives to the existing theories.
2.2 Theoretical Review
The theoretical framework of a research project relates to the philosophical basis on
which the research takes place, and forms the link between the theoretical aspects and
practical components of the investigation undertaken.
2.2.1 Franco Modigliani and Merton Miller Theorem
In 1958, the two financial researchers developed Modigliani and Miller contributed
widely to capital structure by Proposition I Theorem showed that under certain
restrictive assumptions the value of the firm is unaffected by the debt. Later they
developed Proposition II that relaxed the assumptions under Proposition I and further
considered corporate taxes. In 1977 Miller advanced the two propositions and
developed a model that recognized personal taxes.
Proposition I also known as net operating income, they argued that the capital structure
is irrelevant in determining the value of the firm. Capital structure decisions do not
affect the value of the firm since firm value is independent of its leverage there is no
10
advantage of using debt since there are no corporate taxes, the weighted average cost
of capital of a levered firm and unlevered firm is independent of the capital structure,
the cost of equity increases as the gearing increases and the cost of debt remain
unchanged as level of gearing increases hence irrelevance of capital structure decision
on the value of the firm. Under restrictive assumptions of a perfect market, tax free
economy, no transaction costs and homogeneous expectation of investors, capital
structure is irrelevant in determining the firm value.
According to Modigliani and Miller if the assumptions do not hold, the arbitrage
process shall take place where investors take advantage of the market imperfections
and opt to sell the shares in the overvalued firms and buy the shares in the undervalued
firms resulting to arbitrage gain realized.
They supported their argument that capital structure is irrelevant in determining the
value of the firm by applying the arbitrage process to two companies identical in every
As investors take advantage of arbitrage opportunities, the market will reach
equilibrium when the prices of overvalued shares fall and the undervalued shares rise
(Ryan, 2007; Watson and Head, 2007; Welch, 2009 & Pandey, 2010). Modigliani and
Miller (1958) respect except for their leverage levels have equal cost of capital and
therefore should not have different market values (Welch, 2009). Studies carried out
thereafter concludes that these assumptions do no hold and have led to researchers to
rationalize the MM proposition I and its underlying assumptions to prove that capital
structure affects firm value and performance.
Watson and Head (2007) concludes that the theory had serious flows based on their
restrictive assumptions. Firstly, the assumption that individuals and companies can
borrow at the same rate can be challenged, since borrowing by individuals are riskier
and costly. Secondly, presence of no transaction cost is untrue since borrowing cost

11
exists and eliminate risk free profit thus affecting arbitrage gain, Thirdly, investors have
a variant in expectation and finally a perfect market do not exist.
Later they developed a second paper, Proposition II also known as net income approach
that relaxed the unrealistic assumptions under proposition I (Net operating income) and
recognized that corporate tax exists and tax shield benefit associated with debt capital
exists. They concluded that as companies take more debt, they shield more of their
profit from corporation tax. They further argued that the value of a levered firm will
always be higher than that of unlevered by an amount equal to the interest on tax shield
(Watson and Head, 2007; Pandey, 2010 and Welch, 2009).
In 1977 Merton Miller extended the proposition I and II and introduced the personal
taxes and its effect to the value of the firm. Miller developed a model that incorporates
gearing levels, corporation taxation, personal taxation on debt and equity returns and
amount of debt and equity available to investors. He argued that investors choose
investment in companies that are in line with their personal taxation preference,
considering company’s capital structure that is debt and equity levels.
Investors who pay income tax will be inclined to invest in equity to take advantage of
capital gain tax allowance avoiding debt (Welch, 2009). US and UK have changed their
tax regime to ensure that minimal difference in personal tax treatment into capital
structure; this however does not eliminate corporation tax associated with increased
gearing (Watson and Head, 2007).
2.2.2 The Trade-Off Theory
The term trade-off theory is used by different authors to describe a family of related
theories. In all of these theories, a decision maker running a firm evaluates the various

12
costs and benefits of alternative leverage plans. Often it is assumed that an interior
solution is obtained so that marginal costs and marginal benefits are balanced. The
original version of the trade-off theory grew out of the debate over the Modigliani-
Miller theorem.
When corporate income tax was added to the original irrelevance, this created a benefit
for debt in that it served to shield earnings from taxes. Since the firm's objective
function is linear, and there is no offsetting cost of debt, this implied 100% debt
financing. Several aspects of Myers' definition of the trade-off merit discussion,
(Myers, 2010). First, the target is not directly observable. It may be imputed from
evidence, but that depends on adding a structure. Different papers add that structure in
different ways.
Second, the tax code is much more complex than that assumed by the theory.
Depending on which features of the tax code are included, different conclusions
regarding the target can be reached. Graham (2001) provides a useful review of the
literature on the tax effects.
Third, bankruptcy costs must be deadweight costs rather than transfers from one
claimant to another. The nature of these costs is important too. Haugen and Senbet
(1978) provide a useful discussion of bankruptcy costs. Fourth, transaction costs must
take a specific form for the analysis to work. For the adjustment to be gradual rather
than abrupt, the marginal cost of adjusting must increase when the adjustment is larger.
Leary and Roberts (2005) describe the implications of alternative adjustment cost
assumptions.

13
2.2.3 Static trade-off theory
The static trade-off theory affirms that firms have optimal capital structures, which they
determine by trading off the costs against the benefits of the use of debt and equity. One
of the benefits of the use of debt is the advantage of a debt tax shield. One of the
disadvantages of debt is the cost of potential financial distress, especially when the firm
relies on too much debt. Already, this leads to a trade-off between the tax benefit and
the disadvantage of higher risk of financial distress. But there are more cost and benefits
involved with the use of debt and equity.
One other major cost factor consists of agency costs. Agency costs stem from conflicts
of interest between the different stakeholders of the firm and because of ex post
asymmetric information (Jensen and Meckling, 1976). Hence, incorporating agency
costs into the static trade-off theory means that a firm determines its capital structure
by trading off the tax advantage of debt against the costs of financial distress of too
much debt and the agency costs of debt against the agency cost of equity.
Many other cost factors have been suggested under the trade-off theory, and it would
lead to far to discuss them all. Therefore, this discussion ends with the assertion that an
important prediction of the static trade-off theory is that firms target their capital
structures, i.e. if the actual leverage ratio deviates from the optimal one, the firm will
adapt its financing behaviour in a way that brings the leverage ratio back to the optimal
level.
2.2.4 The Dynamic Trade-off Theory
Constructing models that recognize the role of time requires specifying a number of
aspects that are typically ignored in a single-period model. Of particular importance are

14
the roles of expectations and adjustment costs. In a dynamic model, the correct
financing decision typically depends on the financing margin that the firm anticipates
in the next period. Some firms expect to pay out funds in the next period, while others
expect to raise funds. If funds are to be raised, they may take the form of debt or equity.
More generally, a firm undertakes a combination of these actions.
An important precursor to modern dynamic trade-off theories was Stiglitz (1973), who
examines the effects of taxation from a public finance perspective. Stiglitz's model is
not a trade-off theory since he took the drastic step of assuming away uncertainty. The
first dynamic models to consider the tax savings versus bankruptcy cost trade-off are
Kane et al. (1984) and Brennan and Schwartz (1984). Both analyzed continuous time
models with uncertainty, taxes, and bankruptcy costs, but no transaction costs. Since
firms react to adverse shocks immediately by rebalancing costlessly, firms maintain
high levels of debt to take advantage of the tax savings.
Dynamic trade-off models can also be used to consider the option values embedded in
deferring leverage decisions to the next period. Goldstein et al. (2001) observe that a
firm with low leverage today has the subsequent option to increase leverage. Under
their assumptions, the option to increase leverage in the future serves to reduce the
otherwise optimal level of leverage today.
Strebulaev (2007) analyzed a model quite similar to that of Fischer et al. (1989) and
Goldstein et al. (2001). Again, if firms optimally finance only periodically because of
transaction costs, then the debt ratios of most firms will deviate from the optimum most
of the time. In the model, the firm's leverage responds less to short-run equity
fluctuations and more to long-run value changes.

15
Certain ideas are fairly general in dynamic models. The optimal financial choice today
depends on what is expected to be optimal in the next period. In the next period, it may
be optimal to raise funds or to pay them out. If raising new funds, it might be optimal
to raise them in the form of debt or in the form of equity. In each case, what is expected
to be optimal in the next period will help to pin down the relevant comparison for the
firm in the current period.
Much of the work on dynamic trade-off models is fairly recent and so any judgements
on their results must be somewhat tentative. This work has already fundamentally
altered our understanding of mean reversion, the role of profits, the role of retained
earnings, and path dependence. As a result, the trade-off class of models now appears
to be much more promising than it did even just a few years ago.
2.3.4 The Pecking Order Theory
The pecking order theory does not take an optimal capital structure as a starting point,
but instead asserts the empirical fact that firms show a distinct preference for using
internal finance (as retained earnings or excess liquid assets) over external finance. If
internal funds are not enough to finance investment opportunities, firms may or may
not acquire external financing, and if they do, they will choose among the different
external finance sources in such a way as to minimize additional costs of asymmetric
information.
The latter costs basically reflect the “lemon premium” (Akerlof, 1970) that outside
investors ask for the risk of failure for the average firm in the market. The resulting
pecking order of financing is as follows: internally generated funds first, followed by
respectively low-risk debt financing and share financing.

16
In Myers and Majluf model (1984), outside investors rationally discount the firm's stock
price when managers issue equity instead of riskless debt. To avoid this discount,
managers avoid equity whenever possible. The Myers and Majluf model predicts that
managers will follow a pecking order, using up internal funds first, then using up risky
debt, and finally resorting to equity. In the absence of investment opportunities, firms
retain profits and build up financial slack to avoid having to raise external finance in
the future.
The pecking order theory regards the market-to-book ratio as a measure of investment
opportunities. With this interpretation in mind, both Myers (1984) and Fama and French
(2000) note that a contemporaneous relationship between the market-to-book ratio and
capital structure is difficult to reconcile with the static pecking order model. Iteration
of the static version also suggests that periods of high investment opportunities will
tend to push leverage higher toward a debt capacity.
To the extent that high past market-to-book actually coincides with high past
investment, however, results suggest that such periods tend to push leverage lower.
Empirical evidence supports both the pecking order and the trade-off theory. Empirical
tests to see whether the pecking order or the trade-off theory is a better predictor of
observed capital structures find support for both theories of capital structure (Shyam -
Sunder and Myers, 1999; Fama and French, 2002).
2.2.5 The Market timing theory
The market timing theory of capital structure argues that firms time their equity issues
in the sense that they issue new stock when the stock price is perceived to be
overvalued, and buy back own shares when there is undervaluation. Consequently,
17
fluctuations in stock prices affect firm’s capital structures. There are two versions of
equity market timing that lead to similar capital structure dynamics.
The first assumes economic agents to be rational. Companies are assumed to issue
equity directly after a positive information release which reduces the asymmetry
problem between the firm’s management and stockholders. The decrease in information
asymmetry coincides with an increase in the stock price. In response, firms create their
own timing opportunities.
The second theory assumes the economic agents to be irrational (Baker and Wurgler,
2002). Due to irrational behaviour there is a time-varying mispricing of the stock of the
company. Managers issue equity when they believe its cost is irrationally low and
repurchase equity when they believe its cost is irrationally high. It is important to know
that the second version of market timing does not require that the market actually be
inefficient.
It does not ask managers to successfully predict stock returns. The assumption is
simply that managers believe that they can time the market. In a study by Graham and
Harvey (2001), managers admitted trying to time the equity market, and most of those
that have considered issuing common stock report that "the amount by which our stock
is undervalued or over- valued" was an important consideration.
This study supports the assumption in the market timing theory mentioned above which
is that managers believe they can time the market, but does not immediately distinguish
between the mispricing and the dynamic asymmetric information version of market
timing. Baker and Wurgler (2002) provide evidence that equity market timing has a
persistent effect on the capital structure of the firm. They define a market timing
measure, which is a weighted average of external capital needs over the past few years,

18
where the weights used are market to book values of the firm. They find that leverage
changes are strongly and positively related to their market timing measure, so they
conclude that the capital structure of a firm is the cumulative outcome of past attempts
to time the equity market.
2.3 Empirical Literature
Lu Jingwen, Zhushu Fang (2008), 234 listed companies in our country for the study of
the relationship between listed companies' capital structure and corporate performance
empirical analysis, the study result: the company's capital structure and corporate
performance of listed negatively correlated. Lijia Juan (2010), 11 listed company's
capital structure and performance of the empirical analysis, the result is the relationship
between China Aerospace listed company's capital structure and corporate performance
also showed a more significant negative correlation. Foreign scholars Jesen, Solberg
and Zorn (1992), on the relationship between managers and debt analysis, the results
show that the business performance and debt ratio is negatively correlated.
A similar study was carried out by Velnampy & Aloy (2012), who investigated the
relationship between capital structure and profitability of ten listed Srilankan banks
over the past 8 year period from 2002 to 2009.The data was been analyzed by using
descriptive statistics and correlation analysis to find out the association between the
variables. Results of the analysis showed that there was a negative association between
capital structure and profitability except the association between debt to equity and
return on equity. Further the results suggested that 89% of total assets in the banking
sector of Sri Lanka were represented by debt, confirming the fact that banks are highly
geared institutions.

19
Song Li, Zhang Bingbing (2010), on the state-owned holding company in Liaoning
Province were analyzed from continuing operations, performance and business results
showed a positive correlation between capital structures. Juan, Yang Fenglin (1998),
461 listed companies in Shanghai Stock Exchange for the study, empirical study of its
capital structure condition, capital structure and performance studies show a positive
correlation.
To study the relationship between capital structure and corporate performance, Long
Ying, Zhang Jialin (2003) in China's power industry, listed companies as the research
object, its empirical research, the results also show a positive correlation between the
two. Foreign scholars Masulis (1983) analyzed the relationship between capital
structure and corporate performance; enterprise performance level obtained positive
correlation between its liabilities conclusions.
Du liwen, Jiang Yong (2009), Shanghai and Shenzhen listed companies are selected for
the study, results showed the existence of no significant negative correlation between
capital structure and corporate performance. Cheng Taiyou (2004) also made a related
study, the results showed that between capital structure and corporate performance
relationship is not significant, and increase or decrease the asset-liability ratio has little
effect on the company's performance.
Lu Jingwen, Zhushu Fang (2008) ,China's listed companies as the research object,
select the 234 listed companies from 2003 to 2006 data, the relationship between listed
companies' capital structure and performance of the empirical analysis found that the
capital structure of listed companies; In addition to corporate performance was
negatively correlated, there is a secondary linear correlation.

20
Long Ying, Zhang World Bank (2009), 39 listed companies in Anhui Province as
samples to study relationship between capital structure and corporate performance to
establish panel data model, the result of the relationship between capital structure and
performance of both the performance of the graph was inverted "U" shape. Zhu Haiyan
(2010),the 2008 A-share companies in Shandong Province as samples, empirical
analysis of the relationship between the two was found, Shandong Province, the capital
structure of listed companies and corporate performance inverted "U" relationship. That
reached a critical point before the two are positively correlated over the critical point is
a negative correlation between the two.
In summary, the studies on the capital structure and performance between domestic and
foreign divergent conclusions. Between them there is no uniform conclusion. As the
impact of the social environment and time, at different times, different backgrounds
and different regions, select a different research methods and indicators to study the
relationship between performance and capital structure will there is a big difference.
However, the above literature, mostly through research sectional data to data from a
year of study, that is, from a horizontal perspective, explore the relationship between
capital structure and performance, which mainly reflected the relationship between the
static aspects. This statistical method allows conclusions timeliness affected, yet few
scholars have come from a longitudinal study of the relationship between capital
structure and financial performance, and that is, long-term relationships between them,
the last time the variable itself is also considered the impact come.
In general, the current capital structure will be affected prior period capital structure,
or performance is also affected by the capital structure of the previous period. At the
same time, the causal relationship between capital structure and performance is not

21
necessarily occur simultaneously, in the process, there may be a lag time. Thus, long-
term relationship between research performance and capital structure is particularly
important.
2.3.1 Conceptual Framework
A conceptual framework is used to identify the concepts, assumptions, expectations,
beliefs or theories that support a research. The conceptual framework for this study is
based on the relationship between the independent and dependent variables identified
in the study.
2.3.1.1 Debt
Any money owed to a company, or other organization is debt. An organization acquires
debt when it borrows money. In business and government, debt is often issued in the
form of bonds, which are tradable securities entitling the bearer to repayment at the
appropriate time. Debt finance is a fixed return finance as the cost (interest) is fixed on
the par value (face value of debt). It is ideal to use if there’s a strong equity base. It is
raised from external sources to qualifying companies and is available in limited
quantities. It is limited to value of security and liquidity situation in a given country. It
is ideal for companies where gearing allows them to raise more debt and thus gearing
level, Kinsman and Newman, (1998)
2.3.1.2 Internal Equity (Retained Earnings)
Retained earnings are profits not paid out as dividends but retained to financial future
investment needs. The cost of retained earnings is the foregone benefits/dividends by
ordinary shareholders. If the cost of retained earnings is low compared to the cost of

22
new ordinary share capital, the firm will retain more and pay less dividend,
(Ilhomovich, 2009).
Additionally, the use of retained earnings as an internal source of finance is preferred
because it does not involve any floatation costs and does not dilute ownership and
control of the firm, since no new shares are issued. Retained earnings are an internal
source of finance thus, when they are high there is low gearing, lower financial risk and
thus highest market price share. It assumes that retained earnings is the best source of
long term capital since it is readily available and cheap. This is because no floatation
cash are involved in use of retained earnings to finance new investments.
2.3.1.3 External Equity (Ordinary Shares)
Ordinary share capital is raised from the public from the sale of ordinary shares to the
shareholders. This finance is available to limited companies. It is a permanent finance
as the owner/shareholder cannot recall this money except under liquidation. It is thus a
base on which other finances are raised. Ordinary share capital carries a return that is
variable (ordinary dividends). These shares carry voting rights and can influence the
company’s decision making process at the Annual General Meetings, (Kochhar, 1997).
2.3.1.4 Preference Share Capital (Quasi-Equity)
It is also called quasi-equity because it combines features of equity and those of debt.
It is preference because it is preferred to ordinary share capital that is it is paid dividends
first and it is paid asset proceeds first. Unlike ordinary share capital, it has a fixed return.
It carries no voting rights. It is an unsecured finance and it increases the company’s
gearing ratio. The preference share capital are classified as follows; Redeemable
preferential shares which are bought back by issuing company after minimum
redemption period but before expiring of maximum redemption period after which they

23
become creditors. Irredeemable Preference Shares which are perpetual preference
shares as they will not be redeemed in the company’s lifetime unless it is under
liquidation, (Margaritis, 2010).
Independent variables Dependent Variable
Fig 2.1 Conceptual framework
Source: (Author, 2016)
2.4 Literature overview and Research gaps
In the seminal article, presented by MM’s (1958) irrelevance theory, they argued that
capital structure is unrelated to firm’s value. In the presence of corporate income tax
and the cost of capital in MM’s (1963) they argued that the market value of the firm is
positively related to the amount of long term debt used in its capital structure. The
relationship between capital structure and profitability is one that received considerable
attention in the finance literature. The study regarding the effects of capital structure on
Debt
- Total amount of debt
Internal equity
- Retained
earnings
Financial performance
- Earnings
Before
Interest and
Tax
External equity
- Ordinary share
capital
Preference shares
-Preference share
capital

24
financial performance will help us to know the potential problems in performance and
capital structure.
Research methods and the results of theoretical research have some significance to the
capital structure, while banks work in practice how to determine the capital structure
has a certain reference value. This paper confirms the capital structure and performance
with the correlation between capital structures and may have a lag effect on
performance. Therefore, an enterprise to enhance profitability and maximize corporate
value, then only need to consider the impact of capital structure, but also the need to
consider the capital structure over the years.

25
CHAPTER THREE
RESEARCH METHODOLOGY
3.1 Introduction
This chapter outlines the general methodology used to conduct the study. The chapter
comprises of the research design, target population, sampling and sampling procedure,
data collection method and data collection tools, data analyzing instruments and the
description of applied model.
3.2 Research design
Empirical research method was used. It used panel data of ten years due to the
advantage that it has. It helps to study the behaviour of each bank over time and across
space, Baltagi, (2005). The reasons for using Empirical research methods is that
empirical research method help integrating research and practice, and also educational
process needs to progress, Mugenda and Mugenda, (2003). Empirical study design
provide respect to contextual differences, help to build upon what is already known and
provide opportunity to meet standards of professional research. This empirical study
was based on secondary data obtained from published statements of accounts of the
licensed commercial banks in Kenya, CBK, IMF and World Bank publications for five
years from 2009 to 2014, considering banks that were in existence for the mentioned
last years, Bryman & Bell, (2011).
3.3 Target Population
According to Bryman & Bell, (2011), population refers to the complete set of counts
derived from objects possessing one or more common characteristics. In this study, the

26
population consisted of all the commercial banks registered by the Central Bank of
Kenya in Kenya. According to the central bank of Kenya, there are 43 licensed
commercial banks in Kenya. In this study, the population considered the commercial
banks which were in existence for the period of 2004 to 2015.
3.4 Sample size and sampling technique
According to the Central Bank of Kenya, there are 43 licensed commercial banks in
Kenya. In this study, the population consisted of the banks which were in existence in
the period of 2005 to 2014. The commercial banks which had since gone under or on
receivership were not included in the study. Four banks had undergone acquisition as
shown in appendix four. Five banks had undergone mergers as indicated in the appendix
three. Family bank was fully fledged a commercial Bank in 2006, Charter house Bank
was closed in 2006 due to tax evasion and money laundering and Dubai Bank placed
under receivership in 2013. This brought the population total from 43 to 33. Hence a
census was conducted.
3.5 Data collection procedure
This empirical study was based on secondary data obtained from published statements
of accounts of the licensed commercial banks in Kenya, CBK, IMF and World Bank
publications for ten years from 2005 to 2014, considering banks that were there for the
mentioned last years. The data to be collected for each variable includes; for financial
performance, the data to be collected was EBIT for the 33 commercial banks, the data
that was collected for debt was the total amount of debt. The data collected for ordinary
shares was the ordinary share capital. The data was collected for total retained earnings
for each bank, and the data collected for the preference shares was the preference share
capital. Upon receipt of all available and reliable publications, the researcher embarked
on data analysis as guided by the research objectives.

27
3.6 Data Processing and analysis
The data collected was analyzed using SPSS software version 21. Descriptive statistics
was used such as mean, standard deviation, variance, median, mode, maximum,
minimum values, kurtosis and skewness. Multiple regression analysis and correlation
analysis was used to predict and explain the nature and significance of relationship
between dependent and independent variables.
Karl Pearson correlation coefficient –one tailed, was used because the distribution of
the data was parametric i.e. normal distribution. This was tested using a normality test
called Kologorov – Smirov, Dimitris & Maria, (2010). The regression model of Bertha
and Melody (2013) comprised Earnings Before Interest and Taxes (EBIT) as the
dependent variable. The independent variables included Debt (D), Retained Earnings
(RE), Ordinary Shares (OS), and Preference shares (PS).
EBIT = 𝜶 + 𝜷1D + 𝜷2RE+ 𝜷𝟑OS + 𝜷𝟒PS + 𝜺
Where:
𝜶 = constant
𝜷1, 𝜷2, 𝜷𝟑, 𝜷𝟒 = regression coefficients
D = Debt
RE = Retained Earnings
OS= Ordinary Shares
PS = Preference Shares
𝜺 = Error term
This model was used to test whether the independent variables was capable of
predicting relationship between capital structure and financial performance.

28
CHAPTER FOUR
DATA ANALYSIS AND INTERPRETATION
4.1 Introduction
This chapter presents the research findings on the relationship between capital structure
and financial performance of Commercial Banks in Kenya. The output analysis was
carried out for a period of 10 years from year 2005 to 2014. Regression analysis was
used in the data analysis.
4.2 Descriptive Statistics
This section discusses the descriptive statistics of the data analysed for the ten year
duration. The descriptive statistics for the both dependent variable (EBIT) and the four
independent variables show the results indicated in the summarized in the table below;
Table 4.1 Descriptive Statistics
EBIT DEBT RETAINED
EARNINGS
ORDINARY
SHARES
PREFERENCE
SHARES
Mean 0.4744 0.8637 6.4186 0.6761 10.3489
Standard Error 0.0435 0.0512 0.0362 0.3182 0.2519
Median 0.3277 0.6031 6.3394 0.1520 10.2800
Mode 0.0000 1.7375 6.6680 2.8616 5.6000
Standard Deviation 0.5836 0.6870 0.4859 4.2687 3.3792
Sample Variance 0.3406 0.4720 0.2361 18.2222 11.4193
Kurtosis 2.7399 1.6209 0.6755 142.75 -1.5242

29
Skewness 0.9516 1.3803 0.2944 11.5193 -0.0914
Range 4.2752 3.7124 3.4049 55.3744 8.6800
Minimum -1.7578 0.0471 4.6068 -0.9681 5.6000
Maximum 2.5174 3.7595 8.0117 54.4063 14.2800
From the output, the cross-section data on the 33 commercial banks over the ten years
comprised of observations for each of the four variables incorporated in the analysis.
The results show positive means for all variables. The range of the variables is identified
by the median row and the table further shows the maximum and minimum values of
the variables. The mean for EBIT is 47.44% for the commercial banks over the period
of study, with a standard deviation of 58.36%. The mean for Debt is 86.37% with a
standard deviation of 68.7%. The retained earnings for the commercial banks stand at
6.4 with a maximum value of 8.0 and minimum value of 4.6 indicating that most
commercial banks’ retained earnings vary. That is the data is clustered within the mean.
4.3 Correlation Analysis
Table 4.2 Correlation Analysis
EBIT D RE OS PS
EBIT 1
D 0.334701 1
RE 0.327386 0.524352 1
OS -0.01509 0.077182 0.106355 1
PS 0.307248 -0.163181 0.182115 -0.127738 1
30
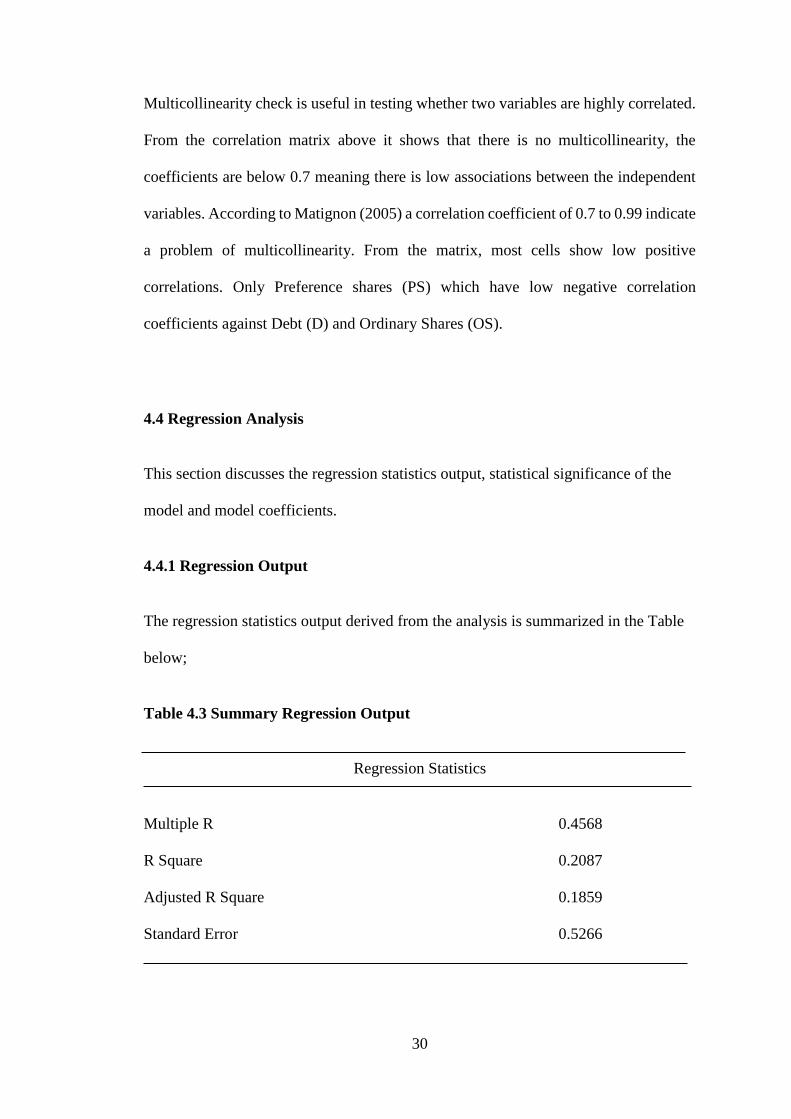
Multicollinearity check is useful in testing whether two variables are highly correlated.
From the correlation matrix above it shows that there is no multicollinearity, the
coefficients are below 0.7 meaning there is low associations between the independent
variables. According to Matignon (2005) a correlation coefficient of 0.7 to 0.99 indicate
a problem of multicollinearity. From the matrix, most cells show low positive
correlations. Only Preference shares (PS) which have low negative correlation
coefficients against Debt (D) and Ordinary Shares (OS).
4.4 Regression Analysis
This section discusses the regression statistics output, statistical significance of the
model and model coefficients.
4.4.1 Regression Output
The regression statistics output derived from the analysis is summarized in the Table
below;
Table 4.3 Summary Regression Output
Regression Statistics
Multiple R 0.4568
R Square 0.2087
Adjusted R Square 0.1859
Standard Error 0.5266

31
The table above provides the model summary results whereby it gives values of R, R2,
Adjusted R2 and standard error. This shows how well the regression model fits the data
analysed. The R2 represents the correlational coefficient which measures the quality of
dependent variables; in this case, the value of R2 is 20.87% which shows a weak level
of prediction at 5% significance level. However, Adjusted R2 which is a coefficient of
determination shows the variation in the dependent variable due to changes in the
independent variables. From the findings, the value of adjusted R2 is 0.1859 an
indication that there was variation of 18.59% on financial performance of commercial
banks due to changes in the independent variables; Debt, Retained Earnings, Ordinary
Shares and Preference Shares, the other 81.5% is not explained by the model. This
shows that financial performance of commercial banks in Kenya is not affected much
by these variables. This means that they are other factors that affect financial
performance of commercial banks in Kenya.
4.4.2 Statistical Significance of the Model
The significance of the estimated model can be summarized in the ANOVA table
below;
Table 4.4 Analysis of Variance (ANOVA)
ANOVA
df SS MS F Significance F
Regression 5 12.72289035 2.544578071 9.177280321 0
Residual 174 48.24485783 0.277269298
Total 179 60.96774819

32
In this output, the test statistic, F, is reported in the analysis of variance table, F (5,174)
= 9.177. The p-value for this statistics is p< 0.001. This shows that there is evidence
that there are differences in the means across variables indicating there is significant
effect of independent variables to financial performance.
4.4.3 Estimated Model Coefficients
The regression model coefficient derived from the analysis in the table below;
Table 4.5 Model Coefficients
Coefficients Standard Error t Stat P-value Lower 95% Upper 95%
Intercept -1.367 0.593 -2.305 0.022 -2.539 -0.196
D 0.176 0.068 2.603 0.010 0.043 0.310
RE 0.218 0.096 2.267 0.025 0.028 0.407
OS -0.010 0.009 -1.093 0.276 -0.029 0.008
PS 0.008 0.012 0.659 0.511 -0.016 0.031
The equation derived is
Y = -1.367 + 0.176X1 + 0.218X2 – 0.010X3 + 0.008X4
Where:
X1 = Debt
X2 = Retained Earnings
X3= Ordinary Shares
X4 = Preference Shares
33
In this model, it can be observed that holding Debt, Retained Earnings, Ordinary Shares
and Preference Shares to a constant zero, EBIT would be -1.367. Further, it can be
observed that there is a positive relationship between financial performance and Debt,
Retained Earnings and Preference Shares and negative relationship on between
financial performance and Ordinary Shares.
A unit increase in debt would lead to an increase in EBIT by a significant factor of
17.6%, a unit increase in retained earnings would lead to an increase in EBIT by a factor
of 21.8%, and a unit increase in preference shares would lead to an increase in EBIT by
an insignificant factor of 0.8%. Further a negative relationship is observed between
financial performance and ordinary shares, a unit increase in ordinary shares would lead
to a decrease in EBIT by an insignificant factor of 0.010.
From the above analysis, it is found that the effect of capital structure on the
performance of commercial banks in Kenya is relatively small. This has been indicated
in the model whereby the variables which were used in the analysis can only explain
18.6% of the performance of commercial banks in Kenya the other 81.4% cannot be
explained. Therefore, it is observed that the model is not very strong predictor of
financial performance in the banking industry in Kenya.
Further analysis of the model shows that the coefficients of the model debt, internal
equity and preference shares affect financial performance positively whereas change in
the ordinary shares affects financial performance negatively. From the model results,
debt and internal equity have a significant effect in predicting financial performance
ordinary shares which have an insignificant factor. There was a fairly strong
relationship between the financial performance of commercial banks and the debt,
internal equity and preference shares. The coefficient on ordinary shares was negative,

34
an indication that there existed a negative relationship between financial performance
and ordinary shares.
4.5 Variables summary
After data collection, the secondary data was tabulated, edited, processed and analysed.
The following were the answers to the research questions. The answers were
summarised from the different analysis done using SPSS version 21.
4.5.1 Debt and financial performance of commercial banks
The model equation shows that growth in debt would affect financial performance
positively leading to improvement in profitability. If there is an increase in debt levels,
the EBIT is expected to increase by 17.6% per unit measure. According to ANOVA,
The p-value for this statistics is p< 0.001. This shows that there is evidence that there
are differences in the means across variables indicating there is significant effect of debt
to financial performance.
4.5.2 Internal equity and financial performance of commercial banks
In respect to the model equation, a unit increase in internal equity would lead to an
increase in EBIT by a factor of 21.8%. From the findings, the value of adjusted R2 is
0.1859, an indication that there was variation of 18.59% on financial performance of
commercial banks due to changes in the internal equity. In respect to the ANOVA, The
p-value for this statistics is p< 0.001. This shows that there is evidence that there are
differences in the means across variables indicating there is significant effect of internal
equity to financial performance.
35
4.5.3 External equity and financial performance of commercial banks
A negative relationship is observed between financial performance and external equity,
a unit increase in external equity would lead to a decrease in EBIT by an insignificant
factor of 0.010, from the model. From the correlation analysis, external equity is -
0.01509 correlated with the financial performance. The value of adjusted R2 is 0.1859,
an indication that there was variation of 18.59% on financial performance of
commercial banks due to changes in the external equity.
4.5.4 Preference shares and financial performance of commercial banks
With respect to the correlation analysis preferences shares have a positive correlation
of 0.307248 with the financial performance. The value of adjusted R2 is 0.1859, an
indication that there was variation of 18.59% on financial performance of commercial
banks due to changes in the preferences shares. With regard to the model, a unit
increase in preference shares would lead to an increase in EBIT by an insignificant
factor of 0.8%.

36
CHAPTER FIVE
SUMMARY CONCLUSION AND RECOMMENDATIONS
5.1 Introduction
This chapter summarizes the findings from chapter four. Summary, conclusions and
recommendations were based on the objective of the study i.e. to determine the
relationship between capital structure and financial performance of commercial banks
in Kenya. The study used secondary data from Central Bank of Kenya for 33 firms for
year 2005 to year 2014. First, focus is placed on the summary of the findings and
addressing of the study questions confirmation as derived from this study. Additionally,
policy and further study recommendations which should be of interest to both
management and investors are covered. Suggestions for further study are also captured
as a way of filling the gaps identified in the study.
5.2 Summary of Findings
From the analysis in Chapter Four, it can be observed that capital structure have some
effect on financial performance of commercial banks in Kenya. The model equation
shows that growth in debt would affect financial performance positively leading to
improvement in profitability. If there is an increase in debt levels, the EBIT is expected
to increase. The study also shows similar effect on retained earnings and preference
shares on commercial banks’ financial performance. If there is a unit increase in
retained earnings and preference shares, the EBIT will tend to increase, indicating that
debt and retained earnings are more significant in predicting financial performance than
preference shares which have insignificant factor. On the other hand, ordinary shares

37
show different effect, that a unit increase would affect financial performance negatively
by decreasing performance at a negative rate.
The findings shows that commercial banks that increase their debt ratio, retained
earnings and preference shares, will improve financial performance since their EBIT
will tend to rise. However, ordinary shares will affect performance negatively hence
reducing their profitability.
The study further found the four independent variables formed a statistically significant
model from the analysis of variance (ANOVA). This implies that the variables provided
a good fit in explaining capital structure. The regression results showed that a positive
relationship exists between the independent variables except ordinary shares which
showed a negative relationship which was minimal with financial performance. Debt
was found to influence financial performance more immensely compared to the other
variables.
A similar study was carried out by Velnampy & Aloy (2012), who investigated the
relationship between capital structure and profitability of ten listed Srilankan banks
over the past 8 year period from 2002 to 2009.The data was been analyzed by using
descriptive statistics and correlation analysis to find out the association between the
variables. Results of the analysis showed that there was a negative association between
capital structure and profitability except the association between debt to equity and
return on equity. Further the results suggested that 89% of total assets in the banking
sector of Sri Lanka were represented by debt, confirming the fact that banks are highly
geared institutions.
Kuria (2010) analysed seven years (2003 – 2009) data of listed firms in NSE using
multiple regression and correlational analysis asserts financial performance, have a

38
significant relationship with financial leverage, that is profitable firms do not often
finance their investments from debt source but use retained earnings supporting pecking
order theory. Other variables by Kuria (2010) that were consistent with the findings are
size of a firm and asset structure affect leverage ratios supporting static trade off theory.
Also, Orua (2009) who concluded that capital structure influences the performance of
corporate entities. This was study of the relationship between capital structure and
financial performance of micro institutions in Kenya. Therefore it can be concluded
that capital structure do affect the performance of the commercial banks but not
significantly. The performance of the commercial banks is influenced majorly by other
factors besides the capital structure of the firm. The impact of capital structure cannot
be rated as a major effect since it is very insignificant.
5.3 Conclusion
The general objective was to determine whether capital structure had effect on financial
performance of the commercial banks in Kenya. It was concluded that debt affects the
commercial bank’s financial performance positively and thus an increase in the debt
ratio of the commercial bank would result in increased financial performance whereas
a reduction in the debt levels of the commercial bank would lead to a reduced financial
performance of the commercial bank.
It was concluded that retained earnings affects the commercial bank’s financial
performance positively and thus an increase in the retained earnings of the commercial
bank would result in increased financial performance whereas a reduction in the
retained earnings of the commercial bank would lead to a reduced financial
performance of the commercial bank.

39
It was also concluded that preference shares affects the commercial bank’s financial
performance positively, and thus an increase in the preference shares of the commercial
bank would result in increased financial performance. Whereas a reduction in the
preference shares of the commercial bank would lead to a reduced financial
performance of the commercial bank.
Lastly but not least, it was concluded that, ordinary shares affects the commercial
bank’s financial performance negatively, and thus an increase in the ordinary shares of
the commercial bank would result in increased financial performance. Whereas a
reduction in the ordinary shares of the commercial bank would lead to a reduced
financial performance of the commercial bank.
The findings of adjusted R2 revealed that there exist a variation on EBIT of commercial
banks due to changes in debt. Therefore, It can be concluded that capital structure do
have an effect on financial performance of the commercial banks in Kenya, although
the effect is minimal. It is also observed that there are other major factors which affect
the performance of the commercial banks more than its capital structure. These other
factors may include level of advertising and promotion, marketing strategies adopted,
corporate governance, management among others. These factors should be included in
other studies relating to financial performance of commercial banks in Kenya.
5.4 Recommendations
The management of commercial banks will be able to make informed decision on
borrowings to influence financial performance positively. From the findings, financial
leverage was observed to be a key contributor to improvement of financial performance.
Therefore, the finance managers in the commercial banks need to maintain an optimal

40
capital structure that will help improve financial performance as long as the debt does
not exceed the industry expected optimum level. Investing in retained earnings and
preference share capital is desirable, and profitable. But due diligence should be taken
before making decisions of increasing ordinary share capital since ordinary shares
impacts the financial performance negatively.
It is recommended that the investors should use the results obtained from the research,
to choose profitable commercial banks to make good investment decision, thereby
creating more wealth.
5.5 Suggestion for Further Studies
The study advocates that further studies in this area incorporating other financial
performance measures such as return on equity and incorporating different variables
from those which have been used in this study like impact on level of advertising and
promotion, marketing strategies adopted, insurance products innovations, management
actions and new product development.

41
REFERENCES
A, S., & Ross, R. W. (2001). Corporate Finance. New York: Mc Graw Hill.
Abor, J. (2005). The effect of capital structure on profitability; empirical analysis of
listed firms in Ghana. Journal of risk finance, 438-445.
Akerlof, G. A. (1970). The Market for 'emons': Quality Uncertainity and the Market
Mechanism. Quarterly Journal of Economics, 488-500.
Alexandru, C., Genu, G., & Romanescu, M. (2008). The assessment of banking
performance - indicators of performance in bank area. MPRA.
Alti, A. (2003). How persistent is the impact of market timing on capital structure?
Amidu, M. (2007). Determinants of capital structure of banks in Ghana: an empirical
approach. Baltic journal of management, 67-69.
Baker, M., & Wurgler, J. (2002). Market timing and capital structure. Journal of
Finance, 57.
Baltagi, B. H. (2005). Econometric Analysis of panel data. New york: John Willy and
Sons.
Barton, S. L., Hill, N., & Srinivasan, S. (1989). An empirical test of stakeholder
theory predictions of capital. Financial Management, 36-44.
Bertha, H., & Melody, G. (2013). Multivariate or Multivariate regression? American
Journal of Public Health(1), 39-40.
Brander, J. A., & Lewis, T. R. (1986). Oligopoly and financial structure: the limited
liability effect. American economic review, 95-970.

42
Brenan, M. J., & Schwartz, E. S. (1984). Optimal financial policy and firm valuation.
Journal of finance, 39.
Brockington, R. (1990). Financial Management. London, UK: ELBS.
Bryman, A., & Bell, E. (2011). Business research methods. Oxford University press.
Chen, G., Firth, M., & Zhang, W. (2008). The efficiency and probability efects of
China's modern enterprise restructuring programme. Asian review of
accounting, 16, 74-91.
Chiang, Y. H., Chan, P. C., & Hui, C. M. (2002). Capital Structure of the Property
and Construction Sectors in Hong Kong. Journal of Property Investment and
Finance, 434-454.
Diamond, D., & Raghuram, A. (2000). A theory of bank capital. journal of finance,
12-23.
Dimitris, M., & Maria, P. (2010). Capital structure, equity ownership and firm
performance. Journal of Bank Finance, 621-632.
Dittmar, A. (2004). Capital structure in corporate spinoffs. Journal of business, 77.
Ebaid, E. I. (2009). The impact of capital structure choice on firm performance:
empirical evidence from Egypt. The Journal of Risk Finance, 477-487.
Fama, E., & French, K. R. (2002). Testing trade-off and Pecking order predictions
about dividends and debt. Review of financial studies, 1-33.
Fischer, E., Robert, H., & osef, Z. (1989). Dynamic capital structure choices. Journal
of Accounting, 19-20.

43
Goldstein, R., Negjiu, J., & Hayne, L. (2001). An EBIT based model of dynamic
capital structure. Journal of business, 483-512.
Graham, J. & Harvey, C. (2001). The theory and practice of corporate finance:
evidence from the field. Journal of financial economics, 50, 187-243.
Gujarati, D. N. (2003). Basic Econometric. United states Military Academy: Mc Graw
Hill.
Gul, S., Faiza, I., & Khalid, Z. (2011). Factors affecting bank profitability in Pakistan.
The Romanian Economic Journal(3), 6-9.
Haugen, Robert, A., Lemma, W., & Senbet. (1988). Bankruptcy and agency costs:
Their significance to the theory of optimal capital structure. Journal of
Financial and Quantitative Analysis, 27-38.
Hung, C. Y. (2002). Capital structure and profitability of the property and
construction sectors in Hong Kong. Journal of Property Investment and
Finance, 434-453.
Ibrahim, E.-S. E. (2009). The Impact of Capita-Structure Choice on Firm
Performance: Empirical Evidence from Egypt. The Journal of Risk Finance,
10, 477-487.
Ilhomovich. (2009). Factors affecting the performance of foreign banks in malaysia.
Malaysia.
Jensen, M., & Meckling, W. (1976). Theory of the Firm : Managerial Behavior,
Agency Cost and Ownership Structure. Journal of Financial Economics, 305-
360.

44
Jiajuan, L. (2010). China's space types of the capital structure and corporate
performance of listed companies empirical research. Industrial technology
economy.
Jingwen, L., & Shufang, Z. (2008). Empirical study on capital structure and corporate
performance. Accounting communications.
Jou, D. G. (1999). Interest rate risk, surplus, leverage and market reward: an empirical
study of Tawian life insurance industry. Journal of management & systems,
281-300.
Juan, Y. (2002). Governance of Chinese listed companies Effect of financial structure.
Journal of Accounting, 37-45.
Kane, A., Marcus, A., & McDonald, L. (1984). How big is the tax advantage to debt?
Journal of Finance, 841-853.
Kaplan, R., & Norton, D. (1992). The balance Scorecard; Measures that drive
performance. Harvard business review, 71-79.
Kester. (1986). Capital Ownership Structure; A Comparison of United States and
Japanese Manufacturing Corporations. Journal of property Investment and
Finance, 20.
Kharwish, H. (2011). Determinants of Commercial Banks performance in Jordan.
International Research Journal of Finance and Economics, 19-45.
Kinsman, M., & Newman, J. (1998). Debt tied to lower firm performance. Pepperdine
University.
Kochhar, R. (1997). Strategic assets, capital structure and firm performance. Journal
of financial and strategic decisions, 10, 23-36.
45
Kothari, C. R. (2004). Research Methodology Methods & Techniques.
Kuria, R. (2010). Determinants of capital structure of companies quoted at the NSE.
University of Nairobi: Unpublished MBA project.
Kyereboah-Coleman, A. (2007). The Impact of Capital Structure on the Performance
of Microfinance Institution. The Journal of Risk Finance, 56-71.
Li, S., & Bingbing, Z. (2010). State-wned Holding Company capital structure and
corporate performance study. Journal of Accounting.
Liwen, D., & Yong, J. (2009). Correlation between capital structure and corporate
performance of listed companies empirical research. Journal of accounting.
Long, & Malitz. (1986). The investing financing nexus: Empirical evidence. Midland
corporate finance Journal, 3.
Margaritis, D. &. (2010). Capital structure, equity ownership and firm performance.
Journal of Banking & Finance, 621-632.
Marshall, & J. (2009, 09 28). The financial crisis in the US; key events, causes and
responses. Retrieved from Research paper: http://www.parliament.uk
Masulis, R. (1983). The impact of capital structure change on firm value: some
estimates. Journal of Finance(38), 107-126.
Matgnon, R. (2005). Neural Networking Modelling using SAS entreprise miner.
London: Author House.
Missaka, W. (2008). Research and development, profit and firm value. Board of
Governors of the Federal Reserve System.

46
Modigliani, F., & Miller, M. H. (1958). The Cost of Capital, Corporate Finance and
the Theory of Investment.
Mugenda, & Mugenda. (2003). Research methods: Quantitative and qualitative
approach. Nairobi Acts press.
Murthy, Y., & Sree, R. (2003). A study on financial ratios of major commercial
banking . Sultanate of Oman: College of Banking & Financial studies.
Myers. (1984). Corporate financin and investment decisions when firms have
information that investors do not have. Journal of financial Economics, 187-
221.
Myers. (1984). The capital structure puzzle. Journal of Financial Economics, 39.
Myers, S. C. (2001). Capital structure. Journal of Economics Perspectives, 81-102.
Myers, S. C., & Majluf, N. S. (1984). Corporate financing and investment decisions
when firms have information that investors do not have. Journal of Financial
Economics, 187-221.
N, S. (2010). Corporate Governance Compliance and the Effects of Capital Structure.
International Journal of Economic and Finance, 105-114.
Nirajini, A. &. (2013). Impact of capital structure on financial performance of the
listed trading companies in Sri Lanka. International Journal of Scientific and
Research Publications, 2250-3153.
Olayinka, A. (2011). Determinants of Capital Structures: Evidence from Nigeria
Panel Data. Nigeria: African Economic Business Review.
47
Ongore, V. O. (2011). The relationship between ownership structure and firm
performance; An empirical analysis of listed companies in kenya. African
Journal of business management, 2120-2128.
Ooi, J. (1999). The determinants of capital structure. Journal of Property Investment
and Finance, 464-480.
Orua, E. (2009). The relationship between capital structure and financial
performance of micro finance institutions in Kenya. Nairobi: University of
Nairobi.
Pandey, I. M. (2009). Capital structure planning and policy. financial management,
332-333.
Polit, D. F., & Beck, C. (2004). Nursing Research: Principle and methods.
Philadelphia: Lippincott and Wilkins.
Pratheepkanth, P. (2011). Capital structure and financial performance: Evidence from
selected business companies in colombo stock exchange sri lanka. Journal of
arts, Science & commerce.
Rajan, G., & Zingales, L. (1995). What do we know about capital structure? some
evidence from international data. The Journal of Finance, 1421-1460.
Ryan, B. (2007). Corporate Finance and Valuation. Cengage Learning EMEA.
Said, R., & Mohd, H. (2011). performance and financial ratios of commercial banks
in Malaysian and China. Finance Journal.
Scott, F., Vladik, K., Janos, H., William, O., & Lev, G. (2013). Applied
Biomathematics. New york: North Country Setauket.

48
Shyam-Sunder, & Myers. (1999). Testing static trade-off against pecking order
models of capital structure. Journal of Financial Economics, 51.
Song, L., & Zhang, B. (2010). State-Owned Holding Company Capital Structure and
corporate performance study. Journal of Accounting(3).
Staking, K. B., & Babbel, D. F. (1995). The relation between capital structure, interest
rate sensivity and market value in the property-liabilty insurance industry.
Journal of risk and insurance, 690-718.
Stiglitz, J. (1973). Taxation, corporate financial policy, and the cost of capital.
Journal of Public Economics, 1-34.
Strebulaev, I. (2007). Do teste of capital structure theory mean what they say? Journal
of Finance, 1747-1787.
Sulaiman, A. A.-S. (2001). Leverage Determinants in the Absence of Corporate Tax
System: The Case of non-Financial Publicly Traded Corporations in Saudi
Arabia. Managerial Finance, 27.
Taub, A. J. (1975). Determinants of the firms capital structure. Review of Economics
and statistics, 57, 410-416.
Titman, & Wessels. (1988). The determinants of Capital Structure choice. Journal of
Finance, 43.
Titman, S. (1984). The effect of capital structure on a firm's liquidation decisions.
Journal of Financial economics, 13, 137-151.
Velnampy, T., & Aloy, J. (2012). The relationship between capital structure and
profitability. Global Journal of Management and Business Research, 12(13).

49
Watson, D., & Head, A. (2007). Corporate finance, principles and practices. New
york: Pearson Education Limited.
Welch, I. (2009). Corporate finance, principles and practices. Prentice Hall: IBM.
Wen, W. (2010). Ownership structure and banking performance. China: Universitat
Autonoma de Barcelona Department D' economia de L' empresa.
Zhang, L. (2010). The RMB real exchange rate fluctuations and the empirical study of
currency substitution. Journal of financial research.

50
APPENDICES
Appendix I: Introduction letter
Doris Kanini Samuel
South Eastern Kenya University
P.O BOX 170
Kitui
11th January 2016
Dear Sir/ Madam
RE: REQUEST FOR DATA
I am a Master of Business Administration student in the School of Business and
Economics carrying out research on Effects of capital structure on financial
performance of commercial banks in Kenya. The purpose of this letter is therefore to
kindly request your voluntary participation in this study by providing us with
publications made by your entity containing information on financial reports. The
information gathered shall be treated confidentially and shall be used for this research
only. Kindly sign this form if you agree to participate in this study.
Yours sincerely,
Doris Kanini Samuel
Email: [email protected]
Mobile No: 0720602705

51
Appendix II: Introduction letter from University

52
Appendix III: Data collection sheet
I. EBIT
SN
O
NAME 20
05
20
06
20
07
20
08
20
09
20
10
20
11
20
12
20
13
20
14
1 African Banking
Corporation,
Nairobi
2 Bank of Baroda,
Nairobi
3 Bank of India,
Nairobi
4 Barclays Bank
of Kenya,
Nairobi
5 Chase Bank Ltd,
Nairobi
6 Citibank,
Nairobi
7 City Finance
Bank, Nairobi
8 Co-operative
Bank of Kenya,
Nairobi

53
9 Consolidated
Bank of Kenya
Ltd, Nairobi
10 Credit Bank Ltd,
Nairobi
11 Development
Bank of Kenya,
Nairobi
12 Diamond Trust
Bank, Nairobi
13 Equity Bank,
Nairobi
14 Fidelity
(Commercial)
Bank Ltd,
Nairobi
15 Fina Bank Ltd,
Nairobi
16 First
Community
Bank Ltd,
Nairobi
17 Giro
Commercial

54
Bank Ltd,
Nairobi
18 Guardian Bank,
Nairobi
19 Gulf African
Bank Ltd,
Nairobi
20 Habib Bank
A.G. Zurich,
Nairobi
21 Habib Bank Ltd,
Nairobi
22 Housing
Finance Co. Ltd,
Nairobi
23 I&M Bank Ltd
Nairobi
24 Middle East
Bank, Nairobi
25 National Bank
of Kenya,
Nairobi
26 National
Industrial Credit
Bank Ltd

55
27 Oriental
Commercial
Bank Ltd,
Nairobi
28 Paramount
Universal Bank
Ltd, Nairobi
29 Southern Credit
Banking Corp.
Ltd, Nairobi
30 Standard
Chartered Bank,
Nairobi
31 Trans-National
Bank Ltd,
Nairobi
32 UBA Kenya
Bank Ltd,
Nairobi
33 Victoria
Commercial
Bank Ltd,
Nairobi
Source: (Author, 2016)

56
II. INDEPENDENT VARIABLES FOR EACH BANK
SN
O
VARIABLES 20
05
20
06
20
07
20
08
20
09
20
10
20
11
20
12
20
13
20
14
1 DEBT
2 RETAINED
EARNINGS
3 ORDINARY
SHARES
4 PREFERENCE
SHARES
Source: (Author, 2016)

57
Appendix IV: List of commercial banks in Kenya
1. African Banking Corporation, Nairobi
2. Bank of Africa Kenya, Nairobi
3. Bank of Baroda, Nairobi
4. Bank of India, Nairobi
5. Barclays Bank of Kenya, Nairobi
6. CFC Stanbic Bank, Nairobi
7. Charterhouse Bank Ltd, Nairobi
8. Chase Bank Ltd, Nairobi
9. Citibank, Nairobi
10. City Finance Bank, Nairobi
11. Co-operative Bank of Kenya, Nairobi
12. Commercial Bank of Africa, Nairobi
13. Consolidated Bank of Kenya Ltd, Nairobi
14. Credit Bank Ltd, Nairobi
15. Development Bank of Kenya, Nairobi
16. Diamond Trust Bank, Nairobi
17. Dubai Bank Kenya Ltd, Nairobi
18. Equatorial Commercial Bank Ltd, Nairobi

58
19. Equity Bank, Nairobi
20. Family Bank, Nairobi
21. Fidelity (Commercial) Bank Ltd, Nairobi
22. Fina Bank Ltd, Nairobi
23. First Community Bank Ltd, Nairobi
24. Giro Commercial Bank Ltd, Nairobi
25. Guardian Bank, Nairobi
26. Gulf African Bank Ltd, Nairobi
27. Habib Bank A.G. Zurich, Nairobi
28. Habib Bank Ltd, Nairobi
29. Housing Finance Co. Ltd, Nairobi
30. I&M Bank Ltd, Nairobi
31. K-Rep Bank Ltd, Nairobi
32. Kenya Commercial Bank Ltd, Nairobi
33. Middle East Bank, Nairobi
34. National Bank of Kenya, Nairobi
35. National Industrial Credit Bank Ltd
36. Oriental Commercial Bank Ltd, Nairobi
37. Paramount Universal Bank Ltd, Nairobi
38. Prime Bank Ltd, Nairobi

59
49. Southern Credit Banking Corp. Ltd, Nairobi
40. Standard Chartered Bank, Nairobi
41. Trans-National Bank Ltd, Nairobi
42. UBA Kenya Bank Ltd, Nairobi
43. Victoria Commercial Bank Ltd, Nairobi
Source: (CBK, 2016)

60
Appendix V: Mergers
SNO INSTITUTION MERGED
WITH
CURRENT
NAME
DATE
APPROVED
1 First American
Bank
Commercial
Bank of Africa
Commercial
Bank of Africa
01.07.2005
2 Prime Capital &
Credit Ltd
Prime Bank Ltd Prime Bank Ltd 01.01.2008
3 CFC Bank Stanbic Bank CFC Stanbic
Bank
01.06.2008
4 Savings & Loan
Ltd
Kenya
Commercial
Bank Ltd
Kenya
Commercial
Bank Ltd
01.02.2010
5 Equitorial
Commercial
Bank Ltd
Southern Credit
Banking
Corporation
Equitorial
Commercial
Bank Ltd
01.06.2010
Source: (CBK, 2016)

61
Appendix VI: Acquisitions
SNO INSTITUTION ACQUIRED
BY
CURRENT
NAME
DATE
APPROVED
1 Credit Agricole
Indosuez Ltd
Bank of Africa
Bank Ltd
Bank of Africa
Bank Ltd
30.04.2004
2 EABS Bank Ltd Eco Bank
Kenya Ltd
Eco Bank
Kenya Ltd
16.06.2008
3 K-Rep Bank Ltd Centum Ltd K-Rep Bank
Ltd
29.10.2014
4 Equitorial
Commercial Bank
Ltd
Mwalimu
Sacco Society
Ltd
Equitorial
Commercial
Bank Ltd
31.12.2014
Family bank was fully fledged a commercial Bank in 2006
Charter house Bank was closed in 2006 due to tax evasion and money laundering
Dubai Bank placed under receivership in 2013
Source: (CBK, 2016)