Effects Of Alkaline And Acid Solutions On Glass/Epoxy ... Of... · Accepted Manuscript Effects Of...
36
Accepted Manuscript Effects Of Alkaline And Acid Solutions On Glass/Epoxy Composites A.M. Amaro, P.N.B. Reis, M.A. Neto, C. Louro PII: S0141-3910(13)00005-0 DOI: 10.1016/j.polymdegradstab.2012.12.029 Reference: PDST 6896 To appear in: Polymer Degradation and Stability Received Date: 26 June 2012 Revised Date: 24 October 2012 Accepted Date: 27 December 2012 Please cite this article as: Amaro AM, Reis PNB, Neto MA, Louro C, Effects Of Alkaline And Acid Solutions On Glass/Epoxy Composites, Polymer Degradation and Stability (2013), doi: 10.1016/ j.polymdegradstab.2012.12.029. This is a PDF file of an unedited manuscript that has been accepted for publication. As a service to our customers we are providing this early version of the manuscript. The manuscript will undergo copyediting, typesetting, and review of the resulting proof before it is published in its final form. Please note that during the production process errors may be discovered which could affect the content, and all legal disclaimers that apply to the journal pertain.
Transcript of Effects Of Alkaline And Acid Solutions On Glass/Epoxy ... Of... · Accepted Manuscript Effects Of...

Accepted Manuscript
Effects Of Alkaline And Acid Solutions On Glass/Epoxy Composites
A.M. Amaro, P.N.B. Reis, M.A. Neto, C. Louro
PII: S0141-3910(13)00005-0
DOI: 10.1016/j.polymdegradstab.2012.12.029
Reference: PDST 6896
To appear in: Polymer Degradation and Stability
Received Date: 26 June 2012
Revised Date: 24 October 2012
Accepted Date: 27 December 2012
Please cite this article as: Amaro AM, Reis PNB, Neto MA, Louro C, Effects Of Alkaline And AcidSolutions On Glass/Epoxy Composites, Polymer Degradation and Stability (2013), doi: 10.1016/j.polymdegradstab.2012.12.029.
This is a PDF file of an unedited manuscript that has been accepted for publication. As a service toour customers we are providing this early version of the manuscript. The manuscript will undergocopyediting, typesetting, and review of the resulting proof before it is published in its final form. Pleasenote that during the production process errors may be discovered which could affect the content, and alllegal disclaimers that apply to the journal pertain.
MANUSCRIP
T
ACCEPTED
ACCEPTED MANUSCRIPT
EFFECTS OF ALKALINE AND ACID SOLUTIONS ON
GLASS/EPOXY COMPOSITES
A. M. Amaro 1*, P. N. B. Reis 2, M. A. Neto 1; C. Louro 1
1 CEMUC, Department of Mechanical Engineering, University of Coimbra, Rua Luís Reis
Santos, Pinhal de Marrocos, 3030-788 Coimbra, Portugal
Tel: 00351239790700; Fax: 00351239790701
[email protected]; [email protected]; [email protected] 2 Department of Electromechanical Engineering, University of Beira Interior, Covilhã,
Portugal; [email protected]
Abstract Composite structures can be exposed to a range of corrosive environments during
their in-service life, which causes degradation in terms of material properties. The effect of
alkaline and acid solutions on the GRP mechanical properties can be found in open
literature, but the studies presented are not sufficient to establish a full knowledge of this
subject. In this paper the flexural properties and the impact strength of a glass fibre/epoxy
composite after immersion in hydrochloric acid (HCl) and sodium hydroxide (NaOH) were
analyzed. Independently of the solution, the flexural strength and the flexural modulus
decrease with the exposure time. However, alkaline solution promotes higher decrease of
the flexural properties than the acid solution. The same tendency was observed for impact
strength.
Keywords: Composites; Environmental Degradation; Failure; Hardness Measurement;
Mechanical Characterization
*Corresponding author
MANUSCRIP
T
ACCEPTED
ACCEPTED MANUSCRIPT
1 - Introduction
The interest in glass-reinforced plastics (GRP) components for highly corrosive
environments, as an alternative to stainless or coated steel ones, is becoming common.
They offer an attractive potential for reducing the weight, as consequence of their high
specific strength and stiffness, competitive cost, good static and dynamic properties, good
resistance to corrosion and simplified fabrication.
Nowadays, composite pipes are largely used in the chemical industry, building and
infrastructures [1]. On the other hand the use of the GRP tanks in hydrometallurgical
process plants or other components is becoming common [2]. However GRP tanks and
pipes may be degraded due to abrasion, change in brittleness or hardness, delamination or
separation of fibre from matrix and degradation of matrix due to high speed flow of hard
particles, cyclic loading and unloading of tanks, diffusion of acid solutions and so on [2].
The effect of alkaline and acid solutions on the GRP mechanical properties can be
found in open literature, but the studies presented are not sufficient to establish a full
knowledge of this subject. Mahmoud et al [3] shows that the change in the flexural
strength, hardness and Charpy impact resistance depends upon the type of acids and the
period of immersion. For example, relatively to HCl, flexural strength was found to be
insensitive until 30 days of immersion and, after this period, a decrease can be observed
around 10%. In terms of hardness, they showed that the Barcol hardness of the polyester
drops around 15% after 90 days of exposure. However, for external pipe surface the
hardness was found to be insensitive until 30 days of immersion, while for internal surface
this phenomenon was verified until 60 days. In terms of Charpy impact resistance a slight
decrease, around 5%, can be observed until 60 days of immersion and in last 30 days
(between 60 and 90 days) a significant drop of 10% occurs. Combining the HCl effect with
MANUSCRIP
T
ACCEPTED
ACCEPTED MANUSCRIPT
temperature, all properties above mentioned decreased significantly. Polyester and
bisphenol A epoxy vinyl ester resins were exposed to two different acidic solutions (1M
H2SO4, Co spent electrolyte), at two different temperatures (25 ºC, 75 ºC) and for two
exposure durations (1 week, 4 weeks) by Banna et al [2]. They concluded that the polyester
resin had lower modulus values when exposed to higher temperature solutions or higher
exposure duration compared to the bisphenol A epoxy vinyl ester resin. For both resins the
average hardness increased after 2 weeks of exposition and then decreased after 4 weeks
exposure (but still higher than the unexposed). Finally, the microstructure of the polyester
degraded more under acid and higher temperature exposure as indicated by increased
surface roughness, cracks and diffusion of sulphur into the cracks. On the other hand,
Stamenovic et al [1] studied the effect of alkaline and acid solutions on the tensile
properties of glass-polyester composites. They concluded that the alkaline solution
decreases the tensile properties (ultimate tensile strength and modulus) and this tendency
increases with the pH value. Concerning the acid solutions, they increase the tensile
properties and this tendency was more relevant when the pH value decreases. For both
solutions, Stamenovic et al [1] concluded that the changes observed on the tensile
properties are proportional with the exposure time (number of days in liquid). The effects
of sulphuric acid concentration and the sequential layup of glass fibre reinforcements on the
diffusion behaviour glass/epoxy laminates were studied by Pai et al [4]. The results showed
that composite specimens with chopped strand mat as the skins layers exhibited higher
weight gain than those with woven roving mat as the skin layers. Material degradation is
more pronounced with the increase of sulphuric acid concentration, which can be explained
by hydrolytic dissolving of the matrix in contact with this acid [1, 4]. Degradation studies
were carried out in different solvents like 10% NaOH, 1 N HCl and 10% NaCl by Sindhu et
MANUSCRIP
T
ACCEPTED
ACCEPTED MANUSCRIPT
al [5] and its influence on mechanical properties was analyzed. It was observed that the
tensile strength and the modulus (E) increases in acid environments and decreases for the
other solvents. Finally, several studies were performed on GRP under stress corrosion
cracking conditions [6-11]. According with Kawada and Srivastava [11] stress-corrosion
cracking in GRP occurs as a result of a combination of loads and exposure to a corrosive
environment. Sharp cracks initiate and propagate through the material as a direct
consequence of the weakening of the glass fibres by the acid. The strength of the fibre
reduces dramatically as a result of diffusion of acid and chemical attack of the fibre surface
at the crack tip, which causes a highly planar fracture with a much reduced failure stress.
The aim of this work is study the flexural and low velocity impact response of a
glass fibre/epoxy composite after immersion in hydrochloric acid (HCl) and sodium
hydroxide (NaOH). Intends to increase the knowledge of the material degradation by two
different solutions, an acid and an alkaline solution, in terms of flexural and impact
strength. The bending test was selected because, according with Banna et al [2], is the most
sensitive to the change of exposure conditions. On the other hand, impact damage is
considered the primary cause of in-service delamination in composites, which are very
dangerous because they have severe effects on the performance of those materials [12-17].
This subject, low velocity impact associated with highly corrosive environments, is not
reported in bibliography yet and the low velocity impact is the most serious problem, given
the difficulty of its visual detection [18, 19].
2 - Material and experimental procedure
Composite laminates were prepared in the laboratory from glass fibre Prepreg

MANUSCRIP
T
ACCEPTED
ACCEPTED MANUSCRIPT
TEXIPREG® ET443 (EE190 ET443 Glass Fabric PREPREG from SEAL, Legnano, Italy)
and processed in agreement with the manufacturer recommendations, using the
autoclave/vacuum-bag moulding process. The laminates were manufactured with the
stacking sequence [452, 902, -452, 02]s. The processing setup consisted of several steps:
make the hermetic bag and apply 0.05 MPa vacuum; heat up to 125º C at a 3-5º C/min rate;
apply a pressure of 0.5 MPa when a temperature of 120-125º C is reached; maintaining
pressure and temperature for 60 min; cool down to room temperature maintaining pressure
and finally get the part out from the mould. The plates were manufactured in a useful size
of 300x300x2.1 mm3.
The specimens used in the experiments were cut from these thin plates, using a
diamond saw and a moving speed chosen to reduce the heat in the specimen. The static
three point bending tests were performed using specimens cut nominally to 100x14x2.1
mm3. On the other hand, the samples used in the impact tests were cut from those thin
plates to square specimens with 100 mm side and 2.1 mm thickness (100x100x2.1 mm3).
Before corrosive exposure the impact samples were subjected to an impact of 8 J, by an
impactor with diameter of 10 mm and mass of 3.4 kg.
The specimens were completely submerged into hydrochloric acid (HCl) and
sodium hydroxide (NaOH). Both solutions presented a concentration of 10% in weight
(wt.%) and the pH level is 13.0 and 1.5, respectively, for NaOH and HCl [20]. The
exposure temperature was 25ªC (room temperature) and the exposure durations were 12, 24
and 36 days. It is important to note that the both faces of composites were exposed to acid
and alkaline environments, however, in real conditions only one face of composite
structures is exposed. Afterwards, they were washed with clean water and dried at room
temperature.
MANUSCRIP
T
ACCEPTED
ACCEPTED MANUSCRIPT
The bending tests were performed according to ASTM D790-2, using a Shimadzu
AG-10 universal testing machine equipped with a 5kN load cell and TRAPEZIUM
software at a displacement rate of 5 mm/min. All 3PB tests were also carried out at room
temperature, with a span of 34 mm and, for each condition, 5 specimens were used.
Bending strength was calculated as the nominal stress at middle span section
obtained using maximum value of the load. The nominal bending stress was calculated
using:
2h b 2
L P 3=σ
(1)
being P the load, L the span length, b the width and h the thickness of the specimen. The
stiffness modulus was calculated by the linear elastic bending beams theory relationship
Iu
LPE
⋅∆⋅∆=
48
3
(2)
where: I is the moment of inertia of the cross-section and ∆P and ∆u are, respectively, the
load range and flexural displacement range at middle span for an interval in the linear
region of the load versus displacement plot. The stiffness modulus was obtained by linear
regression of the load-displacement curves considering the interval in the linear segment
with a correlation factor greater than 95%.
The low velocity impact tests were made using a drop weight-testing machine
Instron-Ceast 9340. An impactor with a diameter of 10 mm and mass of 3.4 kg was used.
The tests were performed on circular section samples of 70 mm and the impactor stroke at
the centre of the samples obtained by centrally supporting the 100x100 mm specimens. The

MANUSCRIP
T
ACCEPTED
ACCEPTED MANUSCRIPT
impact energy used for the first impact was 8 J, which corresponds to an impact velocity of
2.16 ms-1. All the other multi impacts were performed using impact energy of 4 J, which
corresponds to an impact velocity of 1.53 ms-1. For each condition, five specimens were
tested at room temperature. After impact tests, all the specimens were inspected in order to
evaluate the size and shape of the delaminations. As the glass-laminated plates are
translucent it is possible to obtain the image of the damage using photography. To achieve
the best possible definition of the damaged area, the plates were photographed in counter-
light using a powerful light source. Plates were framed in a window so that all the light
could fall upon them.
In order to obtain the solvents absorption it was used the following procedure, in
accordance with BS EN ISO 62:1999. The samples were placed in an oven at 40 ºC for 6
hours, then cooled and weighed in order to obtain the dry weight (DW). Afterwards, a
series of samples were immersed in the respective solutions (HCl and NaOH) and
periodically weighted to obtain the current wet weight (CWW). The water absorption in
weight percentage (W%) was calculated from equation (3):
x100DW
DWCWWW%
−= (3)
After exposition to the corrosive environments, the roughness profiles were
obtained by a Mitutoyo equipment, model SJ-500. In order to obtain the roughness
parameters several measures were performed in different zones of all samples (relative to
each condition). The surface topology was also observed in a scanning electron microscope
(SEM). All specimens were sputtered coated with a 10 nm layer of gold prior to SEM
observation. The morphology was evaluated using Philips XL30 equipment.

MANUSCRIP
T
ACCEPTED
ACCEPTED MANUSCRIPT
The hardness was evaluated by ultramicroindentation using Fisherscope H100
equipment and a load of 500 mN. The hardness values were corrected for the geometrical
imperfections of the Vickers indenter, the thermal drift of the equipment and the
uncertainty in the zero position according with reference [20]. The hardness, H, is defined
as the maximum applied load during the indentation test, Pmax, divided by the contact area
of the indentation immediately before unloading, AC.
3 - Results and Discussion
3.1 – Bending Loads
The material degradation, in terms of static properties, was analyzed by bending
tests. Banna et al [2] studied the degradation of composite materials using tensile and
bending tests and they concluded that the last one (bending tests) was the most sensitive to
the change of exposure conditions. Figure 1 shows a representative example of the load
versus flexural displacement curves for control samples and samples exposed at HCl and
NaOH solutions during 36 days. These curves show, also, the typical behaviour observed
for the other ones immersed during 12 and 24 days. Both curves illustrate a linear elastic
behaviour, in an early stage, with a non-linear region that starts around 80 MPa. After peak
the load decreases and the drop observed is similar in all curves, which reveals that the
damage mechanisms are very close. Typical pictures of the failure mechanisms are
presented in Figure 2, where the exposure time of 36 days is representative of the others
ones. For all laminates, solutions and time of immersion the main damage observed occurs
by the fibres fracture in the tensile surface followed by delaminations between the layers.
These delaminations, independently of the solution, increases with the time of immersion

MANUSCRIP
T
ACCEPTED
ACCEPTED MANUSCRIPT
but, for all exposure duration studied, they are higher in alkaline solutions than in acid ones.
Comparing Figure 2b and 2c is possible to observe that the failure mechanisms are very
similar, however, the delamination’s size is bigger for samples exposed to alkaline
solutions (Figure 2b). The delamination’s size was statistically verified on five samples
tested, for each condition, and values around 6.1% higher were found for NaOH solution.
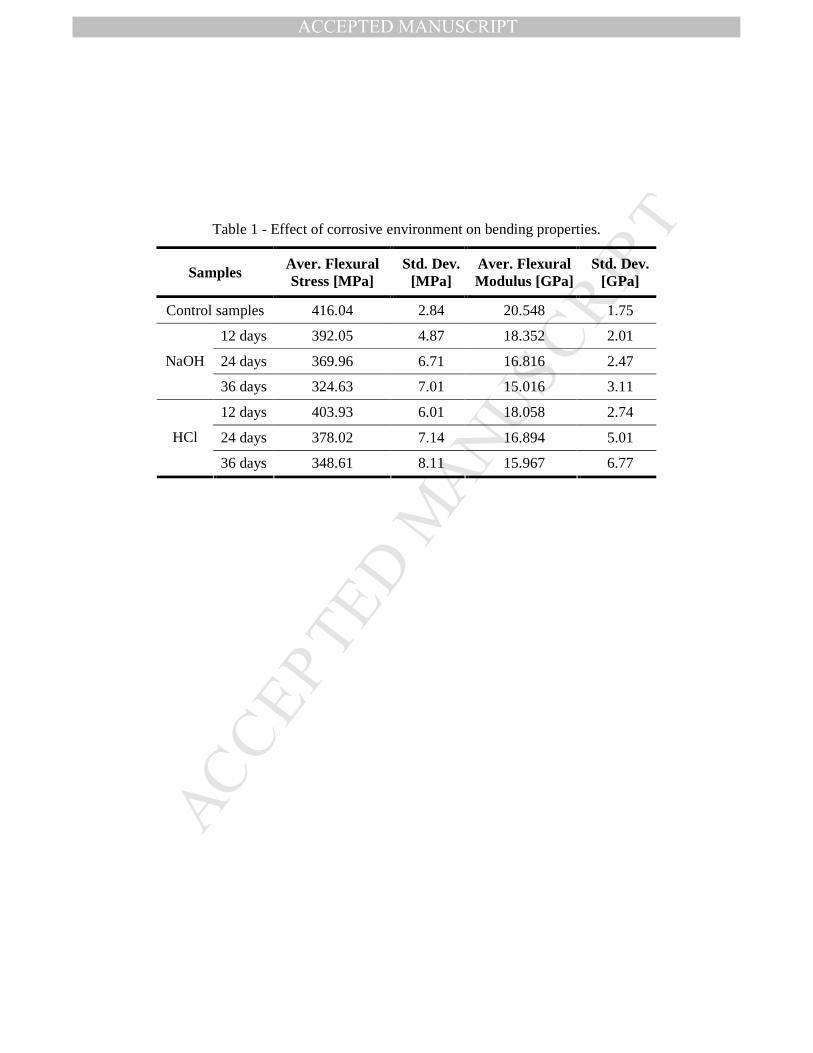
Five specimens were tested, for each condition, and the average values with the
respective standard deviations are presented in Table 1. The bending strength is calculated
as the maximum bending stress at middle span with the maximum loading obtained from
the load-displacement plots (equation 1) and the bending stiffness modulus is calculated
using equation (2). It is possible to observe that, independently of the solution, the flexural
strength and the flexural modulus decreases with the exposure time. For sodium hydroxide
(NaOH) the flexural strength decreases around 5.8%, 11.1% and 22% for 12, 24 and 36
days of exposure, respectively. Relatively to the hydrochloric acid solution (HCl) the
flexural strength decreases, respectively for the same exposure time, around 2.9 %, 9.0%
and 16.2%. Similar tendency was observed for the flexural modulus with values around
10.7%, 18.2% and 26.9% for sodium hydroxide (NaOH) and 12.1%, 17.8% and 22.3% for
hydrochloric acid solution (HCl), respectively, for 12, 24 and 36 days of exposure duration.
The obtained results lead to the conclusion that the alkaline solution promotes higher
decrease of the flexural properties than the acid solution. In fact alkaline solutions are
highly corrosives [1, 21] and, according studies developed by Stamenovic et al [1], the
influences of alkaline solution on mechanical properties increase with the pH value.
Finally, the discussion done before agrees with the literature [2, 3] but disagree with
reference [1] where was observed a decrease of the tensile properties for alkaline solutions
and an increase of these properties with acid solutions.
MANUSCRIP
T
ACCEPTED
ACCEPTED MANUSCRIPT
In order to explain this decrease of mechanical properties some additional tests were
done. The absorption curves were obtained and Figure 3 shows the results obtained for the
sodium hydroxide (NaOH) and hydrochloric acid (HCl). It is possible to observe a weight
gain up to 36 days (864 hours), with values relatively close, and the same trend is expected
after this value. Therefore, this absorption leads to matrix expansion, with the consequent
occurrence of pits [22] and/or development of microstresses in the composites [23, 24].
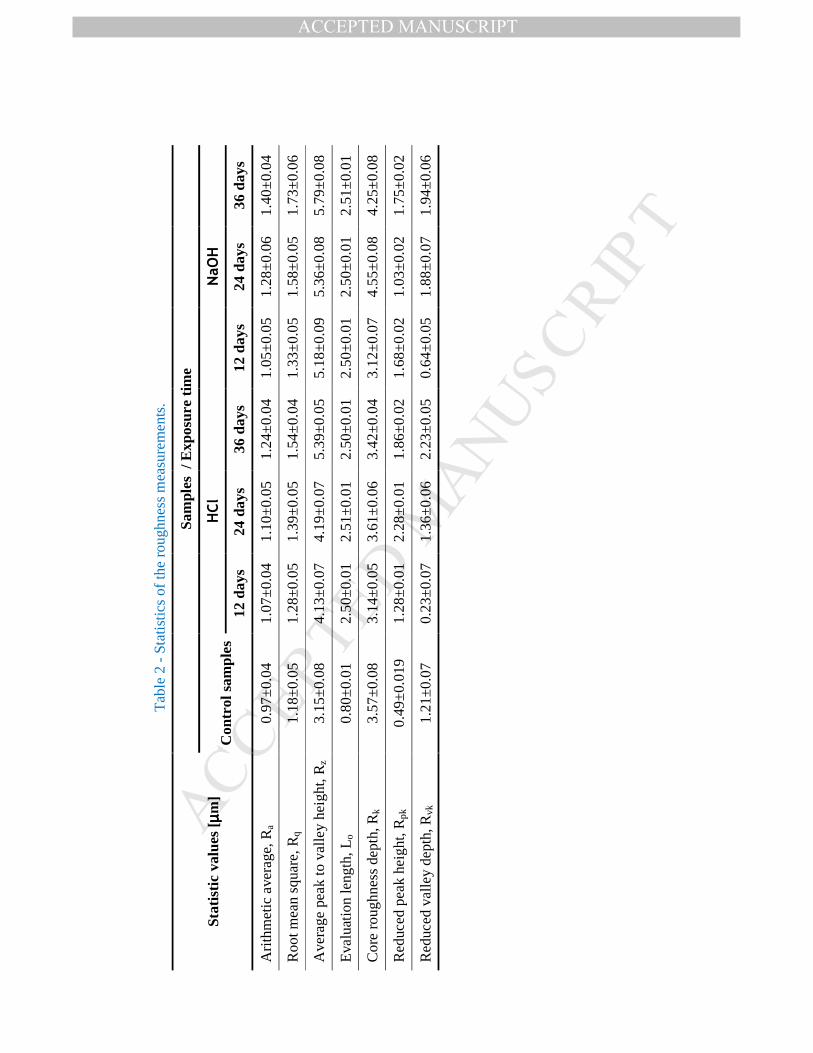
The presence of micro-cracks was analyzed and Table 2 present the statistic of the
roughness measurements, where is evident the effect of the solutions on surface topology
and the exposure time. For example, in terms of RZ (average peak to valley height), it is
possible to observe that roughness increase with the exposure time, 4.13 to 5.39 µm for
HCl and 5.18 to 5.79 µm for NaOH, but after 36 days of exposure RZ is slightly higher
(7.4%) for sodium hydroxide.
In order to confirm the findings obtained from roughness profile, the surface
topology was observed in a scanning electron microscope (SEM). Figure 4 shows the
typical pictures obtained, where it is possible to observe that the unexposed samples
(control samples) are characterized by a smooth surface, Figure 4a, and when the exposure
time increases the laminates present a significant increase of micro-cracks. Studies
developed by Hammami and Al-Ghilani [22] show, for example, that the combined action
of water and corrosive fluids leads to matrix expansion and the occurrence of pits. After
longer immersion time occur blisters, which may start growing by swelling (pressure) until
final collapse [22]. Therefore, it is evident that the smooth unexposed surface becomes
rougher with the time exposure, which is according with Table 2 and Banna et al [2].
Comparing Figures 4d and 4g, it is possible to observe that the major damages occur for
samples exposed to the sodium hydroxide (NaOH). For example, Figure 4d shows long
MANUSCRIP
T
ACCEPTED
ACCEPTED MANUSCRIPT
cracks and the fibres exposition (there are zones where the fibres are completely visible) as
consequence of the matrix's dissolution by the solution (NaOH). On the other hand, in
Figure 4g the fibres are not visible but, in terms of matrix, major damages occur. In this
case, HCl promotes multiple cracks on the matrix.
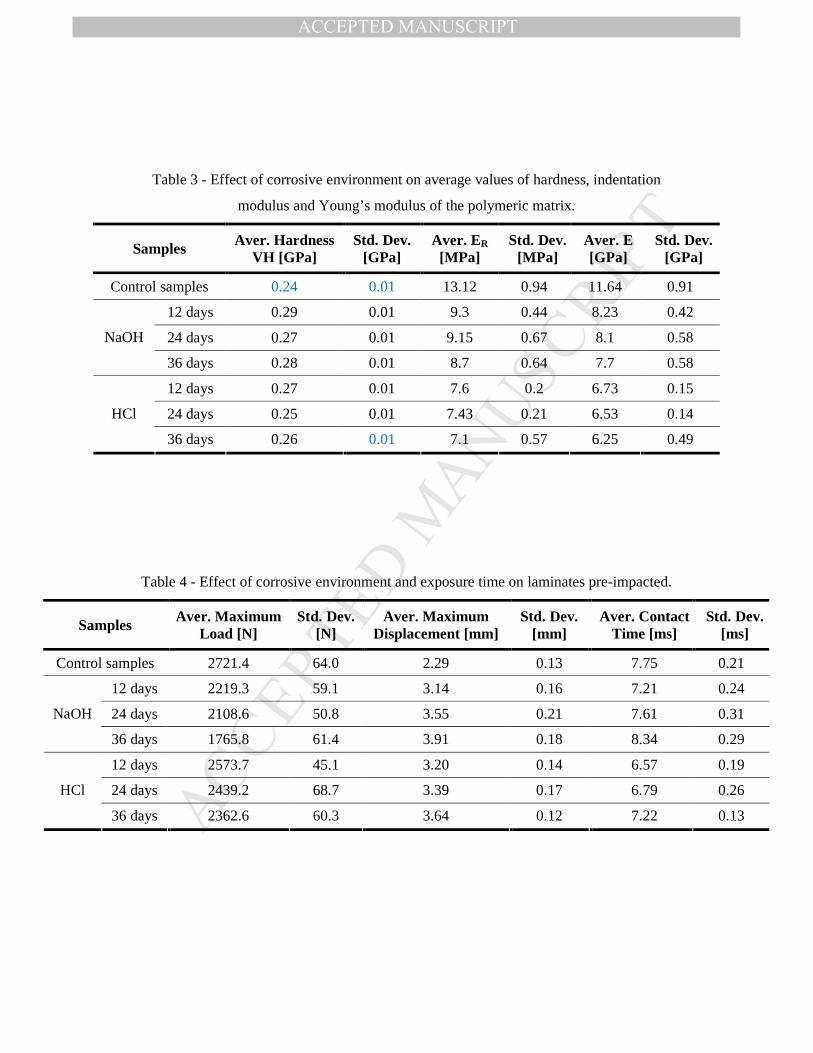
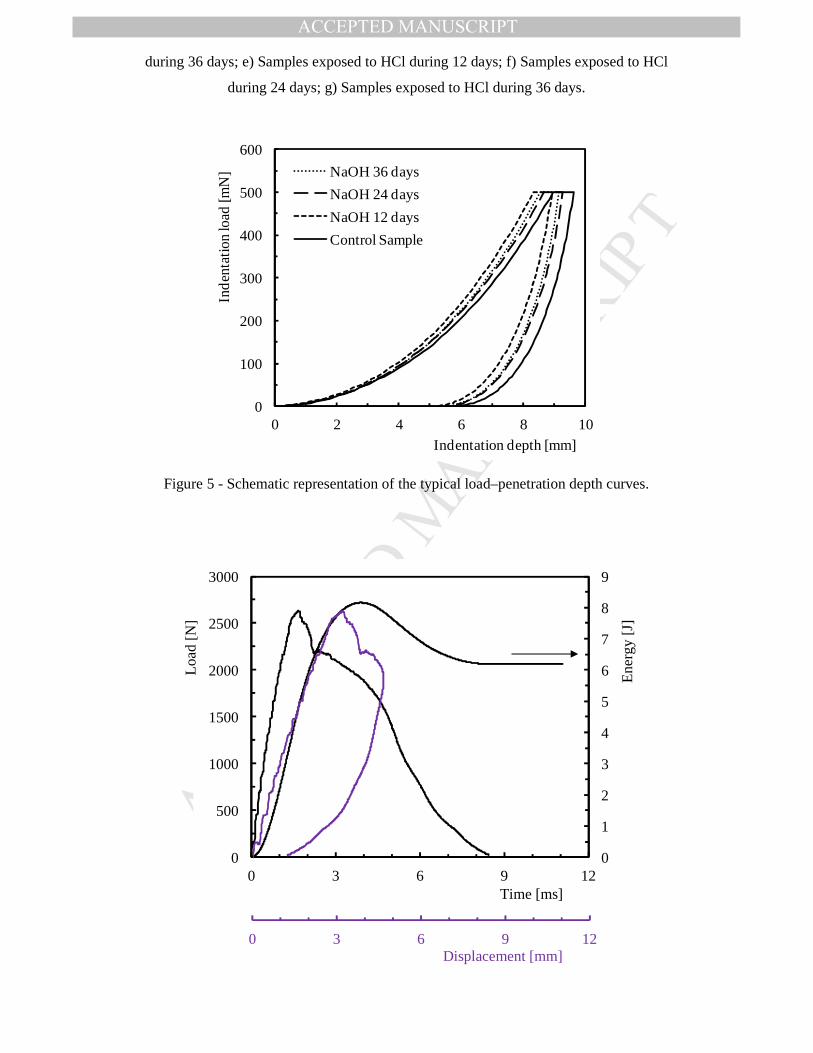
Finally the hardness was evaluated by ultramicroindentation and Figure 5 shows the
schematic representation of the typical load–penetration depth curves for control samples
and laminates exposed to NaOH solution. These curves are representative of the load–
penetration depth curves obtained for laminates immersed in HCl during 12, 24 and 36
days. It is possible to conclude that the curves are agreeing with other ones presented in the
literature [20] and the important quantities in this loading–unloading cycle are maximum
load, maximum depth, final depth after unloading and the slope of the upper portion of the
unloading curve known as the elastic contact stiffness. According with Figure 5 it is
possible to observe that the maximum depth occurs for control samples and, when the
specimens are exposed to the NaOH solution, this value decreases. Higher time of
immersion contributes for a slight decrease of the maximum depth. Table 3 presents the
average values of hardness, indentation modulus (ER) and Young’s modulus of the matrix.
It is possible to conclude that the measured hardness of the polymeric matrix increases after
immersion in both solutions, in comparison with the control samples (≈ 0.24 GPa). The
higher average value of hardness is achieved during the first stage of immersion, 12 days,
leading to hardness increases of around 20.8 % for laminates immersed in NaOH and 12.5
% for laminates immersed in HCl. Higher exposure time, for both solutions, does not
promote any significant change in terms of the matrix hardness values. This tendency
agrees with Banna et al [2] where the similar tendency was observed. According with these
authors the hardness increases for 1 week exposure but later decreases with time. Finally,
MANUSCRIP
T
ACCEPTED
ACCEPTED MANUSCRIPT
the indentation modulus (ER) and Young’s modulus of the matrix was obtained according
with Antunes et al [20], where the indentation modulus (ER) is a function of the Young’s
modulus (E) and the Poisson ratio (ν) of the specimen and the indenter. It is possible to
conclude that, for both solutions, these values (ER and E) decrease compared with the
results obtained for control samples. The drop occurred in terms of Young’s modulus
promoted by the corrosive solutions, and exposure time, can explain the lower flexural
properties associated with the matrix/fibre interface degradation.
All these analysis agree with the bibliography and explain the drops observed on
mechanical properties with the exposure to aggressive solutions. Mahmoud et al [3], for
example, associated the drop of mechanical properties with the absorption, penetration and
reaction that occur between the solutions and the composite constituents (matrix and
fibres). In terms of matrix, the solution penetrates through the resin and separates out in
micro-cracks [11]. On the other hand, the degradation of the fibre/matrix interface is caused
by the dehydration of the matrix and penetration of solutions through micro-cracks [1, 25],
crazes or similar voids in the matrix [11]. For Hammami and Al-Ghilani [22] the
degradation takes place via two stages. In the first stage resin is attacked under the
combined action of water diffusion and the presence of H+. In the second stage the fibre
itself is attacked and cracks appear on the fibre surface. This affects significantly the
composite resistance to loading stresses [22]. However, according with Stamenovic et al
[1], the most significant influence is on the fibre-matrix connection where this influence
promotes the weakness of the load carrying capacity of material. This conclusion explain
clearly the damage mechanisms observed in Figure 2b and 2c where the larger
delamination, relatively to the control samples, are consequence of the poor interface
fibre/matrix promoted by the aggressive environments.
MANUSCRIP
T
ACCEPTED
ACCEPTED MANUSCRIPT
3.2 – Impact Loads
Low velocity impact events can occur in-service or during maintenance activities
promoting various types of damages, which are very dangerous because they are not easily
detected visually, but, affect significantly the residual properties [12-19]. In this context,
intends to obtain the residual life (until full perforation) of laminates subjected to multi-
impacts after a first impact with higher energy and how can be affected, the residual life, by
the aggressive environments. For this purpose the laminates were pre-impacted with energy
of 8 J, followed by multi-impacts of 4 J.
Figure 6 shows the typical load-time, load-displacement and energy-time curves for
the first impact carried out with energy of 8 J and before corrosive exposure. These
diagrams represent a typical behaviour and are in agreement with those reported on
literature [26-29]. The load-time and load-displacement curves are characterized by an
increasing of the load up to a maximum value, Pmax, followed by a drop after the peak load.
In all tests the impactor sticks into specimens and rebound always, which means that the
maximum impact energy was not high enough to infiltrate full penetration [29]. In terms of
average values the maximum load (Pmax), maximum displacement and impact time is,
respectively, around 2636 N (St. Dev. ≈ 49 N), 4.73 mm (St. Dev. ≈ 0.1 mm) and 8.42 ms
(St. Dev. ≈ 0.2 ms). From the curves that represent the evolution of the energy with time,
the beginning of the plateau of the curve coincides with the loss of contact between the
striker and the specimen. This energy coincides with that absorbed by the specimen and the
elastic energy can be calculated as the difference between the absorbed energy and the
energy at peak load [29]. For the present condition the elastic energy was around 22.5 %
(St. Dev. ≈ 1.54 %). Finally, Figure 7 shows typical damages occurred on laminates after
impact loads and the average damage size is around 398.9 mm2 (St. Dev. ≈ 21.4 mm2). It is
MANUSCRIP
T
ACCEPTED
ACCEPTED MANUSCRIPT
possible to observe that the delamination shape is oriented on the fibres direction of the
adjacent lower ply (45º) and the crack is also aligned with the fibres direction of this lowest
ply. Some matrix cracking induced by shear can also be identified in the middle group of
layers (90º/-45º), which demonstrates an interaction phenomenon between matrix cracking
and delamination, thus constituting a complex damage mechanism. More details about the
damages promoted by impact loads can be found in [30-31].
These pre-impacted laminates were divided into three groups, where two of them
were immersed in HCl and NaOH solutions, and all specimens were subjected to impacts
with energy of 4 J. The curves obtained are similar to those presented in Figure 6, but with
different average values. Table 4 shows the effect of the aggressive environment and
exposure time on maximum load (Pmax), maximum displacement and elastic energy in
terms of average values and respective standard deviation. As expected, for the control
samples, practically all these results obtained for 4 J are lower than the values obtained for
8 J. It is possible to observe also that the corrosive environments present significant effects
in load, displacement and contact time. For example, comparing the control samples with
samples immersed on NaOH solution during 12 days, the load and contact time decrease
around 18.5% and 7%, respectively, while the displacement increases around 37.1%. On
the other hand, comparing the values obtained between control samples and samples
immersed on HCl solution during 12 days, it was obtained decreases around 5.4% and
15.2% for load and contact time, respectively, while the displacement increases 39.7 %.
The exposure time present a considerable effect, occurring decreases in terms of maximum
load around 20.4% for NaOH and 8.2% for HCl, when compared the values obtained
between 12 days and 36 days of exposition time. In terms of maximum displacement and
contact time it was observed an increasing around 24.5% and 15.7%, respectively, for

MANUSCRIP
T
ACCEPTED
ACCEPTED MANUSCRIPT
NaOH solution. The same tendency was observed for HCl solution with an increasing of
12.1% and 9.9%, respectively.
Figure 8 shows the effect of the aggressive solutions, and exposure time, on elastic
energy and damage area after first impact at 4 J. The elastic energy was calculated as the
difference between the absorbed energy and the energy at peak load [29]. It is possible to
observe that the elastic energy decreases when the samples are exposed to corrosive
environments and this tendency shows be highly dependent with the exposition time. For
example, a decrease of 12.6 % occurs for HCl solution and 26.5 % for NaOH solution when
it is compared the exposition time between 12 and 36 days. As expected the damaged area
increases with the decreasing of elastic energy. Comparing with the control samples, the
samples immersed in HCl and NaOH solutions, during 36 days, present an increasing of the
damaged areas around 20.8 % and 24.7 %, respectively. Therefore, the alkaline solution
promotes more damaged area than observed for acid solution, because alkaline solutions
are highly corrosives [1, 21], and this tendency agrees with the bending results presented in
last section.
A more significant effect of NaOH compared to HCl on load, displacement, elastic
energy and damage area was observed. In fact, according with Figure 4 and Table 2, the
major damages occur for samples exposed to the sodium hydroxide (NaOH) and it is
known that there is an interaction mechanism between matrix cracking and delamination
for composite plates submitted to low velocity impact. This crack interacts with
delamination, thus contributing to increase the damaged area (consequently the elastic
energy decreases) [32]. On the other hand, according for Stamenovic et al [1], the poor
fibre-matrix connection promotes the weakness of the load carrying capacity of material.
An important effect of the defect size on the maximum force (which decreases with
MANUSCRIP
T
ACCEPTED
ACCEPTED MANUSCRIPT
increasing defect dimension) was found by Amaro et al [16] and the plate deflection is
proportional to the bending stiffness [32].
According with David-West et al [33] the impact bending stiffness has been known
as an important property to assess the damage resistance of a composite, in particular
delaminations. The slope of the ascending section of the load-displacement plot is the
bending stiffness, however, more details to determine this property can be found in [33].
Table 5 presents the impact bending stiffness, after first impact at 4 J, showing the effect of
the corrosive environment and exposure time on the damage resistance. For both solutions,
it is possible to observe that the impact bending stiffness decreases relatively to the value
obtained for the control samples. The impact bending stiffness is also highly dependent of
exposure time, according with the values presented in Table 5. Therefore, this analysis
confirms the tendency observed on Figure 8, where the damaged area increases with the
presence of corrosive solutions and time exposure.
The effect of multi impacts was studied and Table 6 shows the impact resistance for
the different corrosive solutions and exposure time. The laminates were considered failed,
when full perforation (FP) occurs. Full perforation (FP) is defined when the impactor
completely moves through the samples. It is possible to observe that the resistance of the
laminates to repeated low velocity impacts is very dependent of the corrosive environment
and the exposure time. After 36 days of immersion, for example, the impact resistance
decrease around 64.3 % for the sodium hydroxide solution (NaOH) and 35.7 % for the
hydrochloric acid solution (HCl), when compared with the control samples. This tendency
was expected, because the major damages occurred for the sodium hydroxide solution as
consequence of its highly corrosive effect.
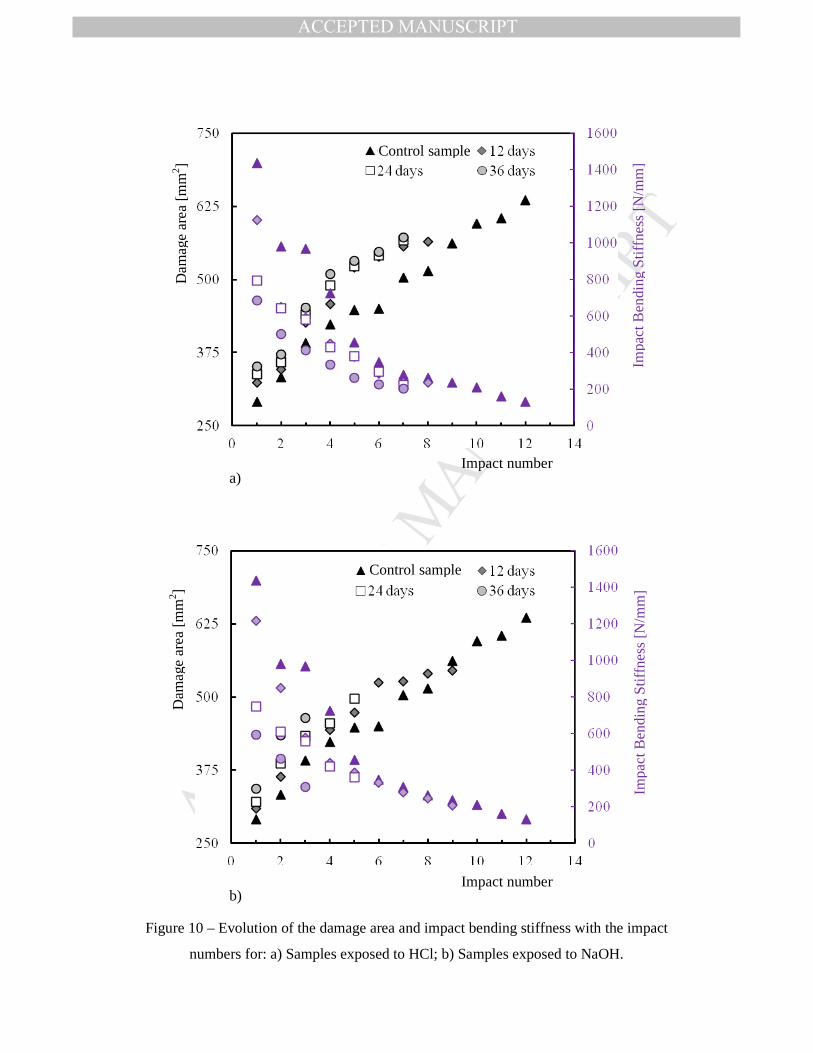
Figure 9 presents the evolution of the elastic energy with the impact number, where
MANUSCRIP
T
ACCEPTED
ACCEPTED MANUSCRIPT
the last impact it is not represented because occurs full penetration (Elastic energy = 0). As
expected, the elastic energy decreases when the number of impacts increases and this
tendency shows to be very dependent of the solution type and exposure time. A major
decrease in terms of elastic energy occurs for specimens immersed in alkaline solutions. On
the other hand, lower elastic energy means that the damage area is major and this
relationship can be observed in Figure 10. From this figure, it is evident that the damaged
area increases with the number of impacts (which agrees with Figure 9 in terms of lower
elastic energy) and, this tendency, is inverse of the occurred for impact bending stiffness.
Figure 11 shows, for example, the pictures that show the evolution of the damage with the
impact numbers for specimens immersed on HCl solution. They are representative of the
specimens immersed on NaOH solution. In terms of impact bending stiffness, Figure 10,
the results agree with David-West et al [33] and prove that is an important property to
assess the damage resistance of composites. In this context, following the procedures of
continuum damage mechanics [34-36] a damage parameter can be proposed, according
with the equation:
ibs
*
E1D ibsE−= (4)
where E* ibs is the current impact bending stiffness and Eibs the impact bending stiffness for
undamaged specimen. It is expected that the limiting values of D are 0 (for undamaged
material) and 1 (for failed material). Therefore, this parameter (D) can be used to estimate
the degradation level of the composite laminates subjected to impact loads.
MANUSCRIP
T
ACCEPTED
ACCEPTED MANUSCRIPT
4 - Conclusions
This work studied the flexural and low velocity impact response of a glass
fibre/epoxy composite after immersion in hydrochloric acid (HCl) and sodium hydroxide
(NaOH).
It was concluded that the corrosive environmental affects significantly the flexural
strength and flexural modulus. The exposure time was determinant on the mechanical
properties degradation. The alkaline solution shows to be more aggressive than the acid
solution, promoting the lowest flexural properties. Complementary tests were carried and
the ultramicroindentation shows a decrease of the matrix mechanical properties. The
roughness increases with the exposure time and is higher for the samples immersed in
NaOH solutions.
In terms of impact it was concluded that the resistance of the laminates to repeated
low velocity impacts is very dependent of the corrosive environment and the exposure time.
The alkaline solution shows to be more aggressive than the acid solution, promoting the
lowest impact resistance. The maximum load decreases with the impact numbers, however,
the contact time and displacement presents the inverse tendency. The elastic energy
decreases also with the impact numbers and, consequently, the damaged area increases. The
impact bending stiffness showed to be an important property to assess the damage
resistance of composites.
MANUSCRIP
T
ACCEPTED
ACCEPTED MANUSCRIPT
References
[1] Stamenovic M, Putic S, Rakin M, Medjo B, Cikara D. Effect of alkaline and acid
solutions on the tensile properties of glass-polyester pipes. Mater Design 2011; 32:
2456-2461.
[2] Banna MH, Shirokoff J, Molgaard J. Effects of two aqueous acid solutions on
polyester and bisphenol A epoxy vinyl ester resins. Mat Sci Eng A-Struct 2011; 528:
2137-2142.
[3] Mahmoud MK, Tantawi SH. Effect of strong acids on mechanical properties of
glass/polyester GRP pipe at normal and high temperatures. Polym Plast Technol Eng
2003; 42: 677-688.
[4] Pai R, Kamath MS, Rao RMVGK. Acid resistance of glass fibre composites with
different layup sequencing: Part I – Diffusion studies. J Reinf Plast Compos 1997; 16:
1002-1012.
[5] Sindhu K, Joseph K, Joseph JM, Mathew TV. Degradation studies of coir
fiber/polyester and glass fiber/polyester composites under different conditions. J
Reinf Plast Compos 2007; 26: 1571-1585.
[6] Friedrich K. Stress corrosion crack propagation in glass fibre
reinforced/thermoplastic PET. J Mater Sci 1981; 16: 3292-3302.
[7] Jones FR, Rock JW, Wheatley AR. Stress corrosion cracking and its implications for
the long-term durability of E-glass fibre composites. Composites 1983; 14: 262-269.
[8] Hogg PJ. Factors affecting the stress corrosion of GRP in acid environments.
Composites 1983; 14: 254-261.
[9] Norwood LS, Hogg PJ. GRP in contact with acidic environments - a case study.
Compos Sci Technol 1984; 2: 1-22.
[10] Tanaka H, Kuraoka K, Yamanaka H, Yazawa T. Development and disappearance of
microporous structure in acid treated E-glass fiber. J Non-Cryst Soliids 1997; 215:
262-270.
[11] Kawada H, Srivastava VK. The effect of an acidic stressenvironment on the stress-
intensity factor for GRP laminates. Compos Sci Technol 2001; 61: 1109-1114.
[12] Caprino G. Residual Strength Prediction of Impacted CFRP Laminates. J Compos
Mater 1984; 18: 508-518.

MANUSCRIP
T
ACCEPTED
ACCEPTED MANUSCRIPT
[13] Davies GAO, Hitchings D, Zhou G. Impact damage and residual strengths of woven
fabric glass/polyester laminates. Compos Part A-Appl S 1996; 27: 1147-1156.
[14] de Moura MFSF, Marques AT. Prediction of low velocity impact damage in carbon-
epoxy laminates. Compos Part A-Appl S 2002; 33: 361-368.
[15] Amaro AM, de Moura MFSF, Reis PNB. Residual strength after low velocity impact
in carbon-epoxy laminates. Mater Sci Forum 2006; 514-516: 624-628.
[16] Amaro AM, Reis PNB, de Moura MFSF. Delamination effect on bending behaviour
in carbon–epoxy composites. Strain, Vol. 47, pp. 203-208, 2011.
[17] Reis PNB, Ferreira JAM, Antunes FV, Richardson MOW. Effect of Interlayer
Delamination on Mechanical Behavior of Carbon/Epoxy Laminates. J Compos Mater
2009; 43: 2609-2621.
[18] Adams RD, Cawley PD. A Review of Defects Types and Non-Destructive Testing
Techniques for Composites and Bonded Joints. NDT Int 1998; 21: 208-222.
[19] Amaro AM, Reis PNB, de Moura MFSF, Santos JB. Damage detection on laminated
composite materials using several NDT techniques. Insight 2012; 54: 14-20.
[20] Antunes JM, Cavaleiro A, Menezes LF, Simões MI, Fernandes JV. Ultra-
microhardness testing procedure with Vickers indenter. Surf Coat Technol 2002; 149:
27-35.
[21] Griffiths R, Ball A. An assessment of the properties and degradation behaviour of
glass-fibre-reinforced polyester polymer concrete. Compos Sci Technol 2000; 60:
2747-2753.
[22] Hammami A, Al-Ghuilani N. Durability and environmental degradation of glass-
vinylester composites. Polym Composite 2004; 16:609-616.
[23] Adams DF, Miller AK. Hydrothermal microstresses in a unidirectional composite
exhibiting inelastic material behavior. J Compos Mater 1977; 11: 285-299.
[24] Arun KV, Basavarajappa S, Sherigara BS. Damage characterisation of glass/textile
fabric polymer hybrid composites in sea water environment. Mater Design 2010; 31:
930-939.
[25] Stamenovic M, Putic S, Drmanic S, Rakin M, Medjo B. The influence of service
solutions on the longitudinal and circumferential tensile properties of glass-polyester
composite pipes. Mater Sci 2011; 47: 61-69.
[26] Aslan Z, Karakuzu R, Okutan B. The response of laminated composite plates under
MANUSCRIP
T
ACCEPTED
ACCEPTED MANUSCRIPT
low-velocity impact loading. Compos Struct 2003, 59: 119-127.
[27] Hosur MV, Adbullah M, Jeelani S. Studies on the low-velocity impact response of
woven hybrid composites. Compos Struct 2005, 67: 253-262.
[28] Iqbal K, Khan S-U, Munir A, Kim J-K. Impact damage resistance of CFRP with
nanoclay-filled epoxy matrix. Compos Sci Technol 2009; 69: 1949-1957.
[29] Reis PNB, Ferreira JAM, Santos P, Richardson MOW, Santos JB. Impact Response
of Kevlar composites with filled epoxy matrix. Compos Struct 2012; 94: 3520-3528.
[30] de Moura MFSF, Gonçalves JPM. Modelling the Interaction between Matrix
Cracking and Delamination in Carbon-epoxy Laminates under Low Velocity Impact.
Compos Sci Technol 2004; 64: 1021-1027.
[31] de Moura MFSF, Silva MAL, Morais AB, Morais JJL. Equivalent Crack based Mode
II Fracture Characterization of Wood. Eng Fract Mech 2006; 73: 978-993.
[32] Amaro AM, Reis PNB, de Moura MFSF, Santos JB. Influence of the specimen
thickness on low velocity impact behavior of composites. J Polym Eng 2012; 32: 53-
58.
[33] David-West OS, Nash DH, Banks WM. An experimental study of damage
accumulation in balanced CFRP laminates due to repeated impact. Compos Struct
2008; 83: 247-258.
[34] Newaz GM, Walsh DJ. Interrelationship of damage and strain in particulate
composites. J Comp Mater 1989; 23: 326-336.
[35] Chow CL, Wang J. An anisotropic theory of elasticity for continuum damage
mechanics. Int J Fract 1987; 33: 3-16.
[36] Morais WA, Monteiro SN, d’Almeida JRM. Evaluation of repeated low energy
impact damage in carbon-epoxy composite laminates. Compos Struct 2005; 67: 307-
315.

MANUSCRIP
T
ACCEPTED
ACCEPTED MANUSCRIPT
Table 1 - Effect of corrosive environment on bending properties.
Table 2 - Statistics of the roughness measurements.
Table 3 - Effect of corrosive environment on average values of hardness, indentation
modulus and Young’s modulus of the polymeric matrix.
Table 4 - Effect of corrosive environment and exposure time on laminates pre-impacted.
Table 5 - Impact bending stiffness after first impact at 4 J.
Table 6 - Impact resistance.
MANUSCRIP
T
ACCEPTED
ACCEPTED MANUSCRIPT
Table 1 - Effect of corrosive environment on bending properties.
Samples Aver. Flexural Stress [MPa]
Std. Dev. [MPa]
Aver. Flexural Modulus [GPa]
Std. Dev. [GPa]
Control samples 416.04 2.84 20.548 1.75
12 days 392.05 4.87 18.352 2.01
24 days 369.96 6.71 16.816 2.47 NaOH
36 days 324.63 7.01 15.016 3.11
12 days 403.93 6.01 18.058 2.74
24 days 378.02 7.14 16.894 5.01 HCl
36 days 348.61 8.11 15.967 6.77
MANUSCRIP
T
ACCEPTED
ACCEPTED MANUSCRIPT
36 d
ays
1.40
±0.0
4
1.73
±0.0
6
5.79
±0.0
8
2.51
±0.0
1
4.25
±0.0
8
1.75
±0.0
2
1.94
±0.0
6
24 d
ays
1.28
±0.0
6
1.58
±0.0
5
5.36
±0.0
8
2.50
±0.0
1
4.55
±0.0
8
1.03
±0.0
2
1.88
±0.0
7
NaOH
12 d
ays
1.05
±0.0
5
1.33
±0.0
5
5.18
±0.0
9
2.50
±0.0
1
3.12
±0.0
7
1.68
±0.0
2
0.64
±0.0
5
36 d
ays
1.24
±0.0
4
1.54
±0.0
4
5.39
±0.0
5
2.50
±0.0
1
3.42
±0.0
4
1.86
±0.0
2
2.23
±0.0
5
24 d
ays
1.10
±0.0
5
1.39
±0.0
5
4.19
±0.0
7
2.51
±0.0
1
3.61
±0.0
6
2.28
±0.0
1
1.36
±0.0
6
HCl
12 d
ays
1.07
±0.0
4
1.28
±0.0
5
4.13
±0.0
7
2.50
±0.0
1
3.14
±0.0
5
1.28
±0.0
1
0.23
±0.0
7
Sam
ples
/ E
xpos
ure
tim
e
Con
trol
sam
ples
0.97
±0.0
4
1.18
±0.0
5
3.15
±0.0
8
0.80
±0.0
1
3.57
±0.0
8
0.49
±0.0
19
1.21
±0.0
7
Ta
ble
2 -
Sta
tistic
s of
the
rou
ghne
ss m
easu
rem
ent
s.
Stat
isti
c va
lues
[ µµ µµm
]
A
rithm
etic
ave
rage
, R a
R
oot m
ea
n sq
uare
, R
q
A
vera
ge p
ea
k to
va
lley
heig
ht,
Rz
E
valu
atio
n le
ngth
, L o
C
ore
roug
hne
ss d
ept
h, R k
R
edu
ced
pea
k he
ight
, R pk
R
edu
ced
valle
y de
pth,
R vk
MANUSCRIP
T
ACCEPTED
ACCEPTED MANUSCRIPT
Table 3 - Effect of corrosive environment on average values of hardness, indentation
modulus and Young’s modulus of the polymeric matrix.
Samples Aver. Hardness VH [GPa]
Std. Dev. [GPa]
Aver. ER [MPa]
Std. Dev. [MPa]
Aver. E [GPa]
Std. Dev. [GPa]
Control samples 0.24 0.01 13.12 0.94 11.64 0.91
12 days 0.29 0.01 9.3 0.44 8.23 0.42
24 days 0.27 0.01 9.15 0.67 8.1 0.58 NaOH
36 days 0.28 0.01 8.7 0.64 7.7 0.58
12 days 0.27 0.01 7.6 0.2 6.73 0.15
24 days 0.25 0.01 7.43 0.21 6.53 0.14 HCl
36 days 0.26 0.01 7.1 0.57 6.25 0.49
Table 4 - Effect of corrosive environment and exposure time on laminates pre-impacted.
Samples Aver. Maximum
Load [N] Std. Dev.
[N] Aver. Maximum
Displacement [mm] Std. Dev.
[mm] Aver. Contact
Time [ms] Std. Dev.
[ms]
Control samples 2721.4 64.0 2.29 0.13 7.75 0.21
12 days 2219.3 59.1 3.14 0.16 7.21 0.24
24 days 2108.6 50.8 3.55 0.21 7.61 0.31 NaOH
36 days 1765.8 61.4 3.91 0.18 8.34 0.29
12 days 2573.7 45.1 3.20 0.14 6.57 0.19
24 days 2439.2 68.7 3.39 0.17 6.79 0.26 HCl
36 days 2362.6 60.3 3.64 0.12 7.22 0.13

MANUSCRIP
T
ACCEPTED
ACCEPTED MANUSCRIPT
Table 5 - Impact bending stiffness after first impact at 4 J.
Sample Impact Bending stiffness [N/mm]
St Dev [N/mm]
Variation relatively to control samples [%]
Control 1435.7 48.9
12 days 1217.1 51.1 -15.2
24 days 747.6 60.5 -47.9 NaOH
36 days 593.3 69.4 -58.7
12 days 1125.7 54.7 -21.6
24 days 792.6 61.1 -44.8 HCl
36 days 684.1 63.4 -52.4
Table 6 - Impact resistance.
Sample Number of impacts to failure
Control 14
12 days 11
24 days 7 NaOH
36 days 5
12 days 10
24 days 9 HCl
36 days 9

MANUSCRIP
T
ACCEPTED
ACCEPTED MANUSCRIPT
Figures
Figure 1 - Typical load-displacement curves for control samples, HCl and NaOH
samples immersed during 36 days.
Figure 2 - Failure mechanisms: a) Control samples; b) Samples exposed to NaOH
during 36 days; c) Samples exposed to HCl during 36 days.
Figure 3 - Weight gain versus exposure duration.
Figure 4 - SEM pictures for: a) Control samples, b) Samples exposed to NaOH during
12 days; c) Samples exposed to NaOH during 24 days; d) Samples exposed
to NaOH during 36 days
Figure 5 - Schematic representation of the typical load–penetration depth curves.
Figure 6 - Typical load-time, load-displacement and energy-time curves for laminates
impacted at 8 J before corrosive exposure.
Figure 7 - Typical picture of the damaged laminates impacted at 8 J.
Figure 8 - Effect of the aggressive solutions on elastic energy and damage area after
first impact at 4 J.
Figure 9 - Evolution of the elastic energy with the impact numbers for: a) Samples
exposed to HCl; b) Samples exposed to NaOH.
Figure 10 - Evolution of the damage area and impact bending stiffness with the impact
numbers for: a) Samples exposed to HCl; b) Samples exposed to NaOH.
Figure 11 - Typical damages occurred for samples immersed on HCl during 36 days: (a)
2nd Impact; (b) 5th Impact; (c) 8th Impact.

MANUSCRIP
T
ACCEPTED
ACCEPTED MANUSCRIPT
Figure 1 - Typical load-displacement curves for control samples, HCl and NaOH
samples immersed during 36 days.
.
a) b)
c)
Figure 2 - Failure mechanisms: a) Control samples; b) Samples exposed to NaOH
during 36 days; c) Samples exposed to HCl during 36 days.
2 mm
2 mm
2 mm

MANUSCRIP
T
ACCEPTED
ACCEPTED MANUSCRIPT
Figure 3 – Weight gain versus exposure duration (SD=Standard Deviation).
1.83 (SD=6.7%)
1.23 (SD=7.4%)
4.15 (SD=7.9%)
3.26 (SD=9.1%)
4.74 (SD=10.1%)
4.17 (SD=9.8%)

MANUSCRIP
T
ACCEPTED
ACCEPTED MANUSCRIPT
(a)
(b)
(c)
(d)
(e)
(f)
(g)
Figure 4 – SEM pictures for: a) Control samples, b) Samples exposed to NaOH during
12 days; c) Samples exposed to NaOH during 24 days; d) Samples exposed to NaOH
MANUSCRIP
T
ACCEPTED
ACCEPTED MANUSCRIPT
during 36 days; e) Samples exposed to HCl during 12 days; f) Samples exposed to HCl
during 24 days; g) Samples exposed to HCl during 36 days.
0
100
200
300
400
500
600
0 2 4 6 8 10
Ind
enta
tion
load
[mN
]
Indentation depth [mm]
NaOH 36 days
NaOH 24 days
NaOH 12 days
Control Sample
Figure 5 - Schematic representation of the typical load–penetration depth curves.
0
1
2
3
4
5
6
7
8
9
0
500
1000
1500
2000
2500
3000
0 3 6 9 12
0 3 6 9 12
Ene
rgy
[J]
Time [ms]
Displacement [mm]
Loa
d [N
]

MANUSCRIP
T
ACCEPTED
ACCEPTED MANUSCRIPT
Figure 6 – Typical load-time, load-displacement and energy-time curves for laminates
impacted at 8 J before corrosive exposure.
Figure 7 – Typical picture of the damaged laminates impacted at 8 J.
250
300
350
400
30
40
50
60
70
0 12 24 36 48
Control Sample NaOH
HCl Control Sample
NaOH HCl
Figure 8 – Effect of the aggressive solutions on elastic energy and damage area after
first impact at 4 J.
Ela
stic
Ene
rgy
[%]
Exposure time [days]
Da
ma
ge a
rea
[mm2 ]
10 mm

MANUSCRIP
T
ACCEPTED
ACCEPTED MANUSCRIPT
0
20
40
60
80
0 2 4 6 8 10 12 14
Control sample
12 days
24 days
36 days
a)
b)
Figure 9 – Evolution of the elastic energy with the impact numbers for: a) Samples
exposed to HCl; b) Samples exposed to NaOH.
Impact number
Ela
stic
Ene
rgy
[%]
Impact number
Ela
stic
Ene
rgy
[%] Control sample
MANUSCRIP
T
ACCEPTED
ACCEPTED MANUSCRIPT
a)
b)
Figure 10 – Evolution of the damage area and impact bending stiffness with the impact
numbers for: a) Samples exposed to HCl; b) Samples exposed to NaOH.
Control sample
Impact number
Da
ma
ge a
rea [m
m2 ]
Impa
ct B
end
ing
Stif
fne
ss [
N/m
m]
Impact number
Da
ma
ge a
rea [m
m2 ]
Impa
ct B
end
ing
Stif
fne
ss [N
/mm
]
Control sample

MANUSCRIP
T
ACCEPTED
ACCEPTED MANUSCRIPT
(a) (b) (c)
Figure 11 - Typical damages occurred for samples immersed on HCl during 36 days:
(a) 2nd Impact; (b) 5th Impact; (c) 8th Impact.