EFFECTS OF 2008 GLOBAL FINANCIAL CRISIS ON THE …
141
i EFFECTS OF 2008 GLOBAL FINANCIAL CRISIS ON THE PERFORMANCE OF BANKS SHARES TRADED IN STOCK EXCHANGE MARKET IN NIGERIA. BY AMINU YAKUBU ABUBAKAR (HND, PGDBF, (MSc Banking and Finance) REG NO D86F/CTY/25312/2011 A THESIS SUBMITTED TO THE SCHOOL OF BUSINESS STUDIES IN PARTIAL FULFILLMENT OF THE REQUIREMENT FOR THE AWARD OF THE DEGREE OF DOCTOR OF PHILOSOPHY IN BUSINESS ADMINISTRATION (FINANCE OPTION) KENYATTA UNIVERSITY JUNE, 2014
Transcript of EFFECTS OF 2008 GLOBAL FINANCIAL CRISIS ON THE …
i
EFFECTS OF 2008 GLOBAL FINANCIAL CRISIS ON THE PERFORMANCE
OF BANKS SHARES TRADED IN STOCK EXCHANGE MARKET IN NIGERIA.
BY
AMINU YAKUBU ABUBAKAR (HND, PGDBF, (MSc Banking and Finance)
REG NO D86F/CTY/25312/2011
A THESIS SUBMITTED TO THE SCHOOL OF BUSINESS STUDIES IN
PARTIAL FULFILLMENT OF THE REQUIREMENT FOR THE AWARD OF
THE DEGREE OF DOCTOR OF PHILOSOPHY IN BUSINESS
ADMINISTRATION (FINANCE OPTION) KENYATTA UNIVERSITY
JUNE, 2014
ii
DECLARATION
I certify that this research is my original work and has not been presented for a diploma
or degree award in any other University. The copy right of this research rests with the
author and the authority of Kenyatta University. No part of this work should be
reproduced, stored in any retrieval system or transmitted without prior written approval
of the author and/or Kenyatta University.
Signature-------------------------- Date-------------------------
Aminu Yakubu Abubakar Reg No: D86F/CTY/25312/2011
We confirmed that the work reported in this thesis was carried out by the candidate under
our supervision as the University Supervisors.
Signature--------------------------- Date-------------------------------
Dr. Jagongo Ambrose.
Department of Accounting and Finance,
School of Business Studies, Kenyatta University, Kenya
Signature---------------------------- Date-------------------------
Prof. Obere Almadi John.
Department of Econometrics and Statistics,
Maasai Mara University, Kenya.
Signature………………………… Date……………………………
Prof. Badayi Sani Muktar.
Department of Economics,
Bayero University Kano, Nigeria.

iii
DEDICATION
I dedicate this research work to my late father Alhaji Yakubu Abubakar and my
immediate family.

iv
ACKNOWLEDGEMENT
I am really grateful to ALLAH Almighty God for his grace, favour and provision of
health and peace in my life in pursuit of this study. My heartfelt gratitude goes to all who
contributed to the success of this research. Special thanks to my three committed
supervisors Dr Jagongo Ambrose, Professor Obere Almadi and Prof Badayi Sani Muktar
for their unquantifiable contributions to the success of this research. I owe gratitude to
Kenyatta University for giving me the opportunity to under take my PhD programme. My
sincere gratitude to my brother Alhaji Mikhail Y. Abubakar (Ajiyan Burra), Chairmen of
the two departments Mr Fredrick Ndede Accounting and Finance and Dr Muathe S M A.
Business Administration My appreciation also goes to all the lectures in the School of
Business Studies specifically to Mr Atheru the Dean of the school Mr Paul Associate
Dean, Dr Mary Ofafa, Dr Namsonge, Dr Hannah Bula, Dr James Kilika and Dr David
Nzuki. Iam also indebted to appreciate the contributions of my other lectures like Dr
Kivunge, Dr George Kosimbei, Dr Julius Koori, Professor Gravenial, Dr Sheik Abdullah
Khahri, Dr Hamish Bambusa and the entire non academic staff of Accounting and
Finance, Business Administration and Econometrics and Statistics for their support
during the program all in Kenyatta University
I also wish to recognize Mrs Esther Adebitan, my immediate Registrar of the polytechnic
Alhaji Labaran Ibrahim, my present H.O.D Abdullah Garba Bulkachuwa, Mal Suleiman
Yahuza, Musa Idi Batari, His Royal Highness Dr Rilwanu Suleiman Adamu the Emir of
Bauchi, Dr Mr and Mrs Tumuti and my Kenyan, Ghanaians, Gambian, Sudan and
Liberian friends as well as classmates and Nigerian colleagues. There are many others

v
who helped me in one way or another during my studies due to time and space limitation
i cannot name them all. I pray may ALLAH reward them abundantly.
vi
TABLE OF CONTENTS
DECLARATION ............................................................................................................ II
ACKNOWLEDGEMENT ............................................................................................. IV
TABLE OF CONTENTS ............................................................................................... VI
OPERATIONAL DEFINITION OF TERMS ................................................................ IX
LIST OF ABBREVIATIONS AND ACRONYMS ......................................................... X
ABSTRACT ................................................................................................................... XI
CHAPTER ONE ............................................................................................................... 1
INTRODUCTION............................................................................................................. 1
1.1 BACKGROUND OF THE STUDY ..................................................................................... 1
1.2 STATEMENT OF THE PROBLEM .................................................................................... 8
1.3 OBJECTIVES OF THE STUDY ....................................................................................... 10
1.3.1 Specific objectives ............................................................................................. 10
1.4 RESEARCH HYPOTHESIS ........................................................................................... 11
1.5 SIGNIFICANCE OF THE STUDY ................................................................................... 12
1.6 SCOPE OF THE STUDY ................................................................................................ 14
1.7 LIMITATIONS OF THE STUDY ..................................................................................... 14
1.8 ORGANIZATION OF THE STUDY ................................................................................. 16
1.9 RESEARCH ETHICAL PROCEDURE AND CONSIDERATION ............................................ 16
CHAPTER TWO ............................................................................................................ 18
LITERATURE REVIEW .............................................................................................. 18
2.1 INTRODUCTION ......................................................................................................... 18
2.2 EMPIRICAL LITERATURE ........................................................................................... 18
2.2.1Concept of Financial Crisis ............................................................................... 18
2.2.2Evolutionary Trend of the Global Financial Crisis........................................... 22
2.2.3 Effects of the crisis to the world economy ........................................................ 26
2.2.4 Nigeria banking sector after the pronouncement of the 2008 GFC ................. 27
2.3 THEORETICAL LITERATURES ON MODELS ................................................................. 34
2.3.1 Walter James Approach Model ........................................................................ 34
2.3.2 Gordon Growth Model ..................................................................................... 36
2.3.3 Modigliani and Miller (MM hypothesis Model) ............................................... 37
2.3.4 Event Study Model ............................................................................................ 39
2.4 EMPIRICAL LITERATURE ON GLOBAL FINANCIAL CRISIS.......................................... 40
2.6 CONCEPTUAL FRAME WORK ..................................................................................... 47
vii
CHAPTER THREE ........................................................................................................ 49
RESEARCH METHODOLOGY .................................................................................. 49
3.1 INTRODUCTION ......................................................................................................... 49
3.2 STUDY DESIGN ......................................................................................................... 49
3.3 RESEARCH PHILOSOPHY ........................................................................................... 50
3.4 TARGET POPULATION ............................................................................................... 51
3.4.1 Data sources ..................................................................................................... 51
3.4.2 Data Collection Instrument .............................................................................. 51
3.5 DATA COLLECTION PROCEDURE .............................................................................. 52
3.6 TESTING OF VALIDITY AND RELIABILITY OF THE INSTRUMENT ................................ 52
3.7 OPERATIONALIZATION OF THE VARIABLES .............................................................. 53
3.8 MODELLING AND DATA ANALYSIS PROCEDURE ........................................................ 56
3.8.1 Average Returns ............................................................................................... 57
3.8.2 Sign Test ......................................................................................................... 57
3.9 DATA ANALYSIS PROCEDURE AND INTERPRETATION ................................................ 57
CHAPTER FOUR ........................................................................................................... 59
RESEARCH FINDING AND DISCUSSION ............................................................... 59
4.1 INTRODUCTION ......................................................................................................... 59
4.2 DESCRIPTIVE STATISTICS ......................................................................................... 59
4.3 EMPIRICAL FINDING ................................................................................................. 60
4.4 LIQUIDITY CRISIS ..................................................................................................... 61
4.4.1 Saving Deposit .................................................................................................. 63
4.4.3 Cash Repatriation (cash due from other Banks and to other Banks) ............. 71
4.5 CURRENCY CRISIS .................................................................................................... 73
4.5.1 MONEY IN CIRCULATION ....................................................................................... 75
4.5.2 Exchange Rate ................................................................................................ 77
4.5.3 Transfer of funds (investment in Security) ...................................................... 82
4.6 FLUCTUATION OF SHARE PRICE ................................................................................ 85
4.6.1 Price Index ...................................................................................................... 85
4.6.2 Volatility (Volume of bank share) ................................................................... 89
4.5.3 Volatility (Value of bank share)...................................................................... 92
4.7 FLUCTUATION OF RISK IN BUSINESS WITH THE BANK .............................................. 94
4.6.1 Interest Rate ...................................................................................................... 95
4.6.2 Banks Shares as Security Collateral for Loan.................................................. 99
4.8 PERFORMANCE OF BANKS SHARES PRICES IN NSEM ............................................. 103
viii
CHAPTER FIVE .......................................................................................................... 111
SUMMARY, CONCLUSION AND RECOMMENDATION ................................... 111
5.0 INTRODUCTION ....................................................................................................... 111
5.1 SUMMARY .............................................................................................................. 111
5.2 CONCLUSION .......................................................................................................... 114
5.3 POLICY RECOMMENDATIONS .................................................................................. 116
5.4 RECOMMENDATIONS FOR FURTHER RESEARCH ....................................................... 118
5.5 STUDY CONTRIBUTION TO KNOWLEDGE ................................................................ 119
REFERENCES .............................................................................................................. 121
APPENDICES ............................................................................................................. 129
LIST OF MONEY DEPOSIT BANKS IN NIGERIA (APPENDIX A) .......................... 129
DOCUMENTED GUIDE LINE (APPENDIX B)........................................................... 130
ix
OPERATIONAL DEFINITION OF TERMS
Shares: Shares are units of ownership in a company and can
be defined as representation of an investor interest
in a company, while the bundles of the shares are
referred to as stock. It also entitles the holder to
claim a fraction of the profit that the company
generate and rights to express opinion on how that
company run if affairs.
Global Financial Crisis: This a period of economic controversy were larger
and small financial and non financial institutions
faced serious financial problem across the world
Stock Exchange Market: This is a market were quoted economic securities
(equities) of both financial and non financial firms
are traded either at primary or secondary market.
Bank Shares: This is a unit of investment which an investor invests
in a firm which expected to attract interest at a
given period of time, normally end of financial year
if the company perform well enough to earn this
interest.
Performance: This is an average range of company transactions which
can be used to determine it financial condition after
a particular period of time usually at end of the year
and also to rate its contributions to the economy
x
LIST OF ABBREVIATIONS AND ACRONYMS
AIG _ American International Group
CBN – Central Bank of Nigeria
CF – Credit Facilities
CIEN - Character Institute of Economy of Nigeria
CRR – Cash Reserved Requirement
CSS – Capital Structure Substitution Theory
DWO – Discount Window Operation
FDI – Foreign Direct Investment
FHLMC – Federal Home Loan Mortgage Corporation
GDP - Gross Domestic Product
GFC - Global Financial Crisis
GFR _ Global Financial Recession
ICB - India Central Bank
ICU – Intensive Care Unit
MDB - Money Deposit Banks
MPR - Monetary Rate of Policy
NBS – Nigeria Banking Sector
NSEM – Nigeria Stock Exchange Market
OSBN - Organizations of Stock Brokers of Nigeria
P & L Account _ Profit and Loss Account
SEC - Security and Exchange Commission
SMI – Stock Market Index
USA - United State of America
xi
ABSTRACT
The global financial crisis of 2008 is an event that affected the entire world economic
cycle, the consumers, producers, financers and other parties that constitute the economy.
The crisis was as a result of liquidity, currency, fluctuations of Banks Share Prices and
risks in business with Banks, which started from major financial institutions of the US
and spilt over to the rest of the world. These gave birth to the same situations in Nigeria
where investors, Bank customers and other citizens were looking at the problems in the
financial sector from either political dimensions or from misconceptions about Western
economic policies that had dominated Nigeria economic system. The general objective of
this study was to investigate the effects of the global financial crisis of 2008 on the
performance of bank shares traded in the Stock Exchange Market of Nigeria. The
specific objectives were to establish the effects of the GFC on liquidity performance,
currency performance, price fluctuations and risk fluctuations in business with banks and
measure the price performance of the industry. The study used documented guide line
review as instrument in collecting secondary data from audited financial statements of all
the 18 money deposit Banks operating 2006 and 2010. Other data collected using same
instrument were stock price index reports, control interest rate prices reports, exchange
rate reports, value of shares price used for loans collateral reports, annual activity reports
on market transaction and other relevant financial policy information from the controlling
authorities, such as Central Bank of Nigeria (CBN), Security and exchange Commission
(SEC) and Nigeria Stock Exchange Market (NSEM). Data was analyzed using
comparison of two sample t test means and variance and sign test was used for testing the
hypothesis on each supportive independent variable at a 0.05 level of significance. The
results indicated that all the null hypotheses are rejected meaning that 2008 GFC had
impact on performance of bank share traded in NSEM. The following recommendations
were given as solutions. It is advised that the Federal Government of Nigeria through its
control agency mandate all the money deposit banks to keep one quarter of their saving
deposits with CBN. This should be different from cash deposit reserved deposit and
strictly applicable to saving accounts redeemable bi-annually and should attract a
reasonable interest accruable. Another recommendation is that of raising of reserved
deposit with at least 50% from it present status at corporate finance level of all the money
deposit banks; CBN should also increase in it inspections excises to at least four times in
a year which will cover each quarter. Also CBN were advised to reduce the interest rate
and improve the interest rate given on saving deposit and many more recommendations
.Finally the following can be further exploit by other researchers. For example the term
performance from financial perspective is not restricted to above independent variables
neither it is not from the supportive, therefore other areas of performance like banks
capital strength, branch networking level of technology, assets strength and others can be
study.
1
CHAPTER ONE
INTRODUCTION
1.1 Background of the study
Historical evidence shows that the financial crisis in the world economy is not a new
issue but an event that recurs after a long period of time. Characteristically this crisis
directly or indirectly affects banks and manufacturing firms financially, and cripples their
production and consumption level (Sanusi, 2012), Kwanashie, (2008) holds a similar
opinion to Sanusi (2012) but also believes that global financial crisis is an event, which
lead to the downfall of larger firms and producers while its effects spill over to multi-
national companies with businesses across the globe. These effects are reflected by
company shares performance in stock exchange markets across the globe.
Bush (2008) described global financial crisis as an economic controversial period where
value and volume of economic activities in explicably and rapidly dropped down to an
unexpected level, especially quoted equities prices, of which bank shares are inclusive. In
his acknowledgment, Oguz (2012) recognized the following factors as global financial
crisis; fragility of banking system, inflation trend, devaluation of local currency,
Foreign trade deficit, bad loan recorded by the financial institutions, increased in
money supply without taking other economic factors in to consideration, excess
spending on unprofitable business in the short (e.g spending on war in other countries
by super powers) poor economic policy, intervention in the internal politics of other
countries and other factors that threatening the world economy, through various ways of
which stock exchange market activities is one of them.
2
According to Tobat and Akbar (2008) the global financial crisis of 2008 was the worst of
its kind since the Great Depression of the 1830s and 1930s. It became prominently visible
in September, 2008 with the failure; merger and conservatorship attitude of several large
United States based financial firms. The underlying causes leading to the crisis had been
reported in various business journals for many months before September 2008, with
commentaries about the falling of banks stock prices, lower production capacity by firms
and higher cost of goods due to higher level of demand by the society being some of the
causes cited. (McClure 2008, Morton 2008).
The financial instability of leading USA and European investment banks, insurance firms
and mortgage banks, consequent to the subprime mortgage crisis are the root of the event
from a global perspective (Evans-Pritchard and Ambrose, 2007). Beginning with failures
of large financial institutions like banks, insurance companies, brokerage firms and
others in the United State, it rapidly evolved into a global crisis resulting in a numbers of
European banks failing as well as decline of various stocks indices, and large reductions
in the market value of equities (stocks) and commodities worldwide (Norris, 2008)
The crisis led to a liquidity problems and the de-leveraging of financial institutions
especially in the United States and Europe, which further accelerated the downfall in
banks savings deposit profile, and forced banks to withdraw excess cash from their cash
reserved deposit accounts in Central Banks. It also increased cash request level
commercial banks, which financial experts and monitory economies considered a
liquidity crisis. World political leaders, national Ministers of Finance and Central Bank
3
Directors coordinated their efforts to reduce fears of the crisis but the problems
continued, evolving at the close of October, 2007 into a currency crisis with investors
transferring vast capital resources (through money circulation at local level and foreign
exchange at international level) into stronger currencies such as the Japanese yen, China
Yuan, India rupees Brazilian Real, the dollar and the Swiss franc. These lead many
emergent economies to seek aid from the international Monetary Fund (Frank, 2008)
There is concerned that those responsible for the financial problems are normally the
ones being bailed out; a global financial meltdown will affect the lives of everyone in an
increasing inter-connected world. The problems could have been avoided, if ideologues
supporting the current economic models were not so vocal, influential and inconsiderate
of others‟ views (Anup, 2008). The economic slowdowns in the United States and Europe
were dragging on Asia‟s biggest economies like Japan, China, and South Korea. The
worry was it could get worse. The fears highlighted were the growing realisation that
Asian economies could not cope because of their long term dependence on the US market
(Andrew, 2008).
Although there are a number of credible pointers to the decline of America‟s global
economic hegemony, the now nearly global reach of what was essentially an American
financial crisis suggests that America still remains one of the most powerful economies in
the world, and that its performance is still the single most-important heath barometer of
the global economy. Against the background of intimate and complex interdependences
between United States of America and developing countries of the world from
4
contemporary era, it seems that the post-second world war popular adage which says that
“when America sniffs, the rest of the world catches a cold” is still relevant and very valid.
The developing and under developing world in general and Nigeria in particular have
always been hard hit by almost every global economic crisis that has occurred in recent
history, including the global energy and debt crunch of the 1970s. Fears are therefore rife
that “when America‟s sniffing causes a cold in the rest of the world, the developing world
generally, and Africa in particular, risks finding itself in intensive care unit (ICU) Brenda
(2006), as cited in Francis (2008)
The global financial crisis has no immediate impact on the developing countries
including those of Asia and some part of Africa. It is conceptually noticeable that this
time around, the industrialized economies of the Brazil, China, India, Japan, South Africa
and Kenya appear to have borne the greater brunt of the crisis prior to it occurrence by
introducing an emerging economic policies that blocked the courses of the crisis from
United State of America (USA) and European countries. This notwithstanding, there is
consensus that even those countries mentioned were affected by the crisis but indirectly
because of their Asian rather than European international linkages more of Asian than
Europe. Countries in Africa, and Nigeria specifically, would not escape the global
financial squeeze, particularly in light of the administrative policies, fragile economic,
social and political realities that prevail in Nigeria; continued dependence on USA in
terms of development assistance, technology import and the fact that it is a favoured
destination of the European exports. Hence, the need to interrogate the social and
5
economic impact of the global financial crisis on developing countries generally,
specifically Nigeria (Francis, 2008)
The current financial depression has evolved differently from other major crises that hit
the developing world in recent decades. Firstly, it is occurring in a world of
unprecedented financial globalization, where the financial sector and banking industry in
Nigeria plays a historically large role in economic activity. The crisis also comes on the
heels of a major global shocked from high food and fuel prices across the globe that has
imposed a heavy economic burden on many countries in Africa that faced internal
problems and Nigeria specifically, and this has is significantly increased the incidence of
poverty, insecurity and political vulnerability. Sao (2008)
There was panic in almost all the financial markets across the globe where investors
began to take their money out of risky mortgage bonds. All these happenings worked
together to bring about credit squeeze ravaging not only the economy of the United
States, but the global economy as well. The situations in Nigeria created a deleterious
impact on the country‟s economy, and especially on the financial system which is of
second important to oil exploration in the country economy. Ujunwa (2011) is of the
opinion that most of these problems were reflective of panic reaction by the policy
makers and politician‟s, however he could not explain the degree to which this affected
the banking sector and the economy which is what this research will investigate.
6
Nigeria Stock Exchange Market (NSE) witnessed unprecedented growth in total market
capitalization and value of shares traded between 2004 up to the second quarter of 2008,
immediately the crisis was pronounced in July, 2008 in USA, the Nigerian stock market
started experiencing a serious downturn, activities. Udeme (2009) said the market
capitalizations of listed equities is more than 303 number with value of more than 10.18
trillion Naira in 2004 and continued to appreciate to 12.4 trillion in march 2007 which is
the higher record achieved within 48years of the market operation but this drastically
dropped down to 3.2 trillion Naira by the end of the year 2008. Similarly the share index
dropped from 63,016.60 margins before the crisis was pronounced to 31,450.78 during
last trading week of 2008.One of the reasons for this was the slow implementation of the
Economic Reconstruction Committee Report given to Federal Government on how to
improve the general economic status of the nation (Badayi, 2009)
It is also observed that, investors were pulling out their resources which made the stock
prices generally to go down in particular bank stocks. Onafonokon (2009) also said “apart
from bank‟s investments in the stock market through their subsidiaries some of the banks
also have direct exposure to the market because they have given out facilities and loans
backed up by the banks shares as collateral, then the value of the shares collapsed. This
meant that collateral was and the security cannot unable to cover the loans.
According to Dalhat (2009) “as the security collapsed and capital been invested in that
direction, if there is no additional collateral that can support the existing once then the
firm is likely to fail” that is why some banks have no option but to be acquired by, or
7
merged with others for survival. As the crisis in Nigerian continued to worse due to huge
and past withdrawals of cash and selling of stocks by the internal and external investors,
who feared for their future due to negative reports by financial analysts and expert. This
drew the attentions of the government, which reacted quickly by injecting more capital
into stock market and banks as an interim measure to restore investors confidence
(Bayagbon, 2009 And Oluseyi, 2009). In early 2010 government instructed the NSE
through SEC to reduce their operations cost by 50% as a measure to deal with the crisis.
Sanusi (2009b) further lamented that, the hit of GFC in Nigerian banking sector exposed
the weakness‟ of most of the Nigerian Banks in an area of risk management and
corporate governance because more than half of Nigerian Banks have a high level of non
performing loans accounts which draw unrealistic interest in to their P&L account which
is a trap to attract investors and improved in their stock price value. Eventually the
present crisis came and exposed the bank syndicates which finally led to a complete crash
of the stock prices. Investors in banks stocks and the SEC were highly affected as well as
the economy in general. As a result of this calamity, the government and its Central Bank
came up with several measures, including some unconventional once to deal with the
crisis. The aim was to bring financial institutions and market to a stage where public
confidence would be restored and banks would to resume their intermediation role
through normal lending activities within the legal financial of operations framework.
Noticeable effect of the crisis in Nigerian banks are lower deposit commitment by the
customers, lower capital flows through lending activities, poor foreign exchange
8
earnings and general shortage of cash volume for banks. This situation nearly obliterates
the financial system because of limited integration with the global financial market. The
crisis caused Nigeria‟s financial controllers decisively intervention to mitigate the
emerging crisis effects on the public, because banks shares were no longer
valuable.(Sanusi, 2009).
Al- faki (2008) a financial analyst said “there is great improvement in NSEM in the
first and second quarter of 2008 financial stock trading with capitalizations of over 13.0
trillion in January to June, 2008, but within short time the figure suddenly dropped to 7.2
trillion before the end the year 2008.The continued depressions of the capital market led
to greater loss by the banks, owing to the significant exposure through merging lending
and share backed collateral lending thereby depressing profitability and weakening
lending ability. In the researcher opinion this is gaps need to be address.
1.2 Statement of the Problem
According to Tobat and Akbar (2008), the global financial crisis of 2008, which was
pronouncement on July 2008, was the worst of its kind since the Great Depression of the
1830s and 1930s. It became prominently visible in September, 2008 with the failure;
merger or conservatorship attitude of several large United States financial firms.
According to McClure (2008) and Morton (2008) the underlying causes leading to the
crisis had been reported in various business journals for many months before September
2008 (Chicago Stock trading Journal Volume 5(2) of 2008 and American Bulk Journal
Volume 4(18) of 2007 and weekly Trading Journal Vol1(12) of 2008), such articles also
9
provide commentaries about the falling of banks stocks prices, lower production capacity
by firms and higher cost of goods due to higher demand by the society as arising from
the crisis.
The financial instability of leading United States and European investment banks,
insurance firms and mortgage banks, consequent to the subprime mortgage crisis was the
root of the event (Evans-Pritchard and Ambrose, 2007). Beginning with failures of large
financial institutions like banks, insurance companies, brokerage firms and other
businesses in the United States, it rapidly evolved into a global crisis resulting the failure
of in a number of European banks, decline in various stock indices, and large reductions
in the market value of equities (stocks) and commodities worldwide (Norris, 2008) .
Ujunwa (2011) is of the opinion that the crisis was a result of panic reaction by the
policy makers and politicians who were under pressure. However, he could not explain
the degree of the effect to the economy. Nigeria Stock Exchange Market witnessed
unprecedented growth in total market capitalization and value of shares traded between
2004 to the second quarter of 2008, immediately the crisis was pronounced in July, 2008
the market started experiencing a serious downturn in its activities. Udeme (2009) said
that the market capitalization of listed equities are more than 303 in number with value of
10.18 trillion Naira in 2004, which continued to appreciate to 12.4 trillion Naira in
March, 2007; the highest record achieved in 48 years of the market operation. He
however noted that the market capitalization dropped to 3.2 Trillion Naira by the end of
the year 2008. Similarly the share index dropped to 31,450.78 margins within the same
10
year. Sanusi, (2009b) further lamented that, the Global Financial Crisis (GFC) added
value by exposing the general weaknesses of most of the Nigerian Banks in terms of risk
management and corporate governance. One of the noticeable effects of the crisis in
Nigerian banks was lower level of savings deposit, lower capital flows through lending
activities, poor foreign exchange earnings and general shortage of cash volume for banks
primary obligations .This situations nearly obliterated the entire financial system because
of the limited integration with the global financial market.
According to Anup (2008), Nigeria as one of the largest economies in Africa and indeed
the world, with direct and indirect connections in terms of banking business, had to must
be a victim of the crisis. However the nature, extend and consequences may not be fully
understood. Yet effects on banks activities trickle down to the entire economy. The
effects of 2008 global financial crisis in European countries have been documented
through research yet, not much evidence of systematic documentation exists about the
African market in general and Nigeria in specific
1.3 Objectives of the study
The general objective of this study was to determine the effects of 2008 global financial
crisis on the performance of banks shares traded in stock exchange market in Nigeria
1.3.1 Specific objectives
The specific objectives were-:
(1) To establish the effects of the liquidity crisis on the performance of banks shares
traded in NSEM
11
(2) To determine the effects of the currency crisis on the performance of banks
shares traded in NSEM
(3) To establish the fluctuations of share prices on the performance of banks shares
traded in NSEM
(4) To determine the risk taken in business with banks shares traded in NSEM
(5) To examine the banks share price performance before and after the crisis in
NSEM
1.4 Research Hypothesis
The following research hypothesis were tested in the context of the statement of problems
and objectives using Ho and Ha as symbol representing the null and alternative
hypothesis respectively Osoala, (1990)
(i) Ho: Liquidity crisis in Nigeria banking sector during 2008 GFC has no effects on
the performance of bank shares traded in NSEM
Ha: Liquidity crisis in Nigeria banking sector during 2008 GFC has effects on the
performance of Bank shares traded in NSEM
(ii) Ho: Currency crisis in Nigeria banking sector during 2008 GFC has no effects on
the performance of the banks share traded in NSEM
Ha: Currency crisis in Nigeria banking sector during 2008 GFC has effects on the
performance of the bank shares traded in NSEM
(iii) Ho The fluctuations of banks Shares Prices during 2008 GFC has no effects on the
performance of the bank shares traded in NSEM
12
Ha: The fluctuations of banks shares prices during 2008 GFC has effects on
performance of banks Shares Prices traded in NSEM
(iv) Ho: Risk taken in business with banks during 2008 GFC has no effects on
performance of banks shares traded in NSEM
Ha: Risk taken in business with banks during 2008 GFC has effects on
performance of banks shares traded in NSEM
(v) Ho: There is no relationship between price of banks shares before and after the 2008
GFC traded in NSEM
Ha: there is relationship between price of banks shares before and after the 2008 GFC
traded in NSEM
1.5 Significance of the study
The research is significant to both financial and non financial institutions at national and
international level as the crisis touches an every aspects of human life. For example
multinational companies that operate directly or indirectly across the globe will realise
the negative effects coursed by the crisis and guard against it in future by diversifying
their resource portfolio and respecting of ethics and professionalism to reduce or
mitigate against the a complete loss in the event of future occurrence. Again, the lesson
leaned from the crisis will open eyes of the management of multinational and national
firms to develop a policy and strategy to reduce the effects and put in place controls in
business operations for sustainability present and the future purposes.
13
In the case of government, this research will be significant to government policy makers
as well as implementers such as Ministries of Finance, Budget and economic planning,
Commerce and Trade and other government agencies like Central Bank, Security and
Exchange Commission, Deposit Insurance companies state securities and investment
companies and others to revisit there existing policies with a view to reconstructing or
updating some, so as to managed the present day challenges of any event of this nature.
For investors, the research will add to their knowledge about the nature and the possible
modalities they can undertake in the event of such situations as well as help them
appreciate the concept of portfolio management of assets rather than putting all their eggs
in one basket. There is also possibility for more research in to global financial crisis as a
result of this research.
The financial institutions in Nigeria including banks on which this study was built will
benefit greatly by understanding the practical consequences of the crisis and develop
guide lines strict moderate operations, in particular the legal frame work related to
lending to avoid lapse in to crisis situations. Researches proves that poor lending
management is one of the major factors that brought about financial the crisis. Similarly
non financial sectors will also benefit from the research by understanding the causes of
such crisis and role that all can play in avoiding them. They will no longer be in the
darkness about such issues.
14
1.6 Scope of the study
The research work concentrated in Abuja and Lagos which are the present and former
country capitals respectively, where all the banks Head offices are located. The study
data covered five (5) years period beginning from January, 2006 to December 2010. Two
(2) years (2006 and 2007) are considered as the period before the event and 2007, 2008
as a window period while 2009 and 2010 as period after the event. This period is enough
to used panel data during the analysis which gives room for the applications of two
sample t- test of comparison. The reasons for using five (5) years as a scope was to
determine the changes that occurred in banks stocks prices.
1.7 Limitations of the study
The study is limited to the performance of banks stocks that are traded in stock exchange
market of Nigeria. The measures of performance are further restricted to liquidity,
currency, fluctuation of banks shares prices and risk taken in business with banks. Again
those measurements are further broken in to small units which formed the bases of the
supportive variables. However the used of the term performance of bank in this research
is restricted to those variables but it does not mean those are the only scale of measuring
performance there are others like capital strength, assets strength, branch network, level
of technology and host of other which are not fully exploit.
Another limitation is that since the methodology of the analysis is modified event study,
limited data was used to avoid interferences from other events. While in the other hand
the researcher also experienced a lot of challenges in obtaining relevant data information
15
for long period of time which forced the research model to be modify from ordinary
event study which concerned about cumulative average returns of normal and abnormal
to modify event study that capture the average cumulative returns of means and
variances‟ before and after the crisis period. Similarly during data collection the
researcher faced difficulties from the target populations which included serious
investigations on the purpose of the research. These investigations were carried out by the
respective authorities including Nigeria Stock Exchange, security and exchange
commission, Central Bank of Nigeria and the respective money deposit banks that the
study focus as on. According to them such investigation is a legal procedure requirement
before approval of the research so that ethical values of the professions are respected in
additions to the current securities challenges and market competitions.
The personality of the researcher was also investigated caution from his employer and
two of his supervisors, just to re confirmed the sources and bases of the research. In
addition there were also not time and financial constraints, which slowed the rate of the
data collection and indeed the whole work as the researcher does not reside in any of the
cities where the data was collected therefore adequate arrangement had to be made for
accommodation within the period of the data collections. This proved to be expensive
coupled with the insecurity of the nation as at the moment. Not only that in almost all the
banks visited responsible for the provision of information‟s were also same officers
handling other sensitive responsibilities within the bank which demand no compromised
for individual benefits against the over roll organisational benefits since profit
maximisation and customers satisfactions are the key focus of all modern bank‟s .
16
1.8 Organization of the study
This study is organized in five (5) chapters. The foregoing chapter introduced the study
background, statement of problem general and specific objectives, hypothesis, significant
of the study scope, limitations of the study and organization of the study. Chapter two
reviewed the relevant literatures which coverers theoretical, and concept framework of
the global financial crisis, evolutionary trend of the global financial crisis, effects of the
crisis to the world economy and Nigeria banking sector before and after the
pronouncement of the 2008 GFC four (4) theoretical models were discussed models but
one (1) anchors the research. Empirical literatures were also discussed and a conceptual
frame was presented to depict the research in a diagrammatical form. Chapter three
highlights the study design, target populations, data sources, data collection instrument,
data collection procedure, testing of validity and reliability of the instrument, the
operationalization of the variables, modelling and analysis procedure and testing of the
hypothesis. Chapter Four present results and discussion of the results and finally chapter
Five cover the study summary, conclusion, policy recommendations and suggestions on
areas of further research.
1.9 Research ethical procedure and consideration
Ethical procedure consideration seems to be new concept in theory of research, but old
concept in research application which differed from one place to another due to
differences of legal framework that guide the application of the ethical procedures. This
procedure served as guidance to the researcher before during and even after the research.
17
It helped provide a check and balances to the integrity of the researcher as well as the
institutions in which the research was carry out in case of human error or misconceptions
as well as ensuring proper channels were followed according to the law
A research of this nature required an introductory letter from a supervisor or the Post-
graduate school on behalf of the institution which introduced the researcher to the
organizations the letter was signed and stamped by a higher officer of the institution
contained all the details of the researcher and the topic of his research. It was addressed
specifically to the target audience. In some instances the photograph of the researcher is
attached on the letter with signature and stamp across the photograph. Another letter was
required from Ministry of Science and Technology Kenya as well as a is a good letter of
Testimonial character if the research is financially, security or any nature that is so
complicated in Nigeria; through email telephone or fax the legality and authenticity of
the letters as well as the need for the research were verified.
18
CHAPTER TWO
LITERATURE REVIEW
2.1 Introduction
This chapter reviewed works that are from academics in nature from the same field of the
study. These works covered the following: Concept of financial crisis, meaning and
definitions of the term GFC, evolutionary trend of the crisis to date, effects of the crisis to
the world economy, as well as the Nigerian banking sector after the crisis
pronouncements. Under empirical review, studies from across the globe in the relevant
field of 2008 GFC reviewed and the conceptual frame work summarizes the ideas. In the
theoretical review, various models related to the study are also reviewed.
2.2 Empirical Literature
In this part, past studies carried out by academics and non- academics on the issues
relevant to this research weather directly or indirectly relevant was reviewed.
2.2.1Concept of Financial Crisis
It has been observed by academics and non academics, that the term global financial
crisis (GFC) is a new and complicated concept. This has led to the development of
different meanings and applications to qualify and describe the concept .For example
non- financial experts look at the term GFC as an increase in the prices of goods and
services. Which is otherwise known as inflation? However, they forget that the increase
in prices of goods and services results from economic, social and other factors including:
19
change of taste, fashion, quantity, quality, packaging, devaluations of the currency and
others which may not be easy to capture. The researcher holds opinion that the belief that
GFC is merely increase in the price of goods and services is a misconception.
Politicians view GFC as something created by the ruling to block free movement of
liquid cash from financial institutions to the society especially during election campaigns.
Ali (2011) others believe that GFC is a natural calamity that affects the world at one time
(Fantami, 2009). These definitions are based on religion and politics and are therefore
unacceptable in the academic world, Nigerian where empirical evidence is fundamental
and foundational to developing definition in research. Politician‟s views are subjective
rather than objective and the religious views on GFC are held by Muslims and Christians
alike, as both faiths believe in the existence of natural
In wider perspectives, the world financial crisis can be described as a period of economic
difficulty experienced by producers and consumers in macro form, where liquid cash is
below normal level for a certain period of time (Kyawa 2008) Rose (2003) focused on
liquidity shortfalls in the United States banking system. Dieter (2003) as cited in Francis,
(2008) remarked that, the spectre of global recession and the potential contagion impacts
on the real economy, not only on the industrialized and emerging economies, but also on
the developing world. This raises questions about the decoupling thesis that was
popularized in the aftermath of the financial crisis that hit emerging markets in the 1990s
.This idea can be attributed to the existence of GFC of 21st July, 2008 which started from
USA financial institutions where bank‟s stocks prices continued to drop by
20
approximately 25% due foreign investors selling large Portions of their stocks. They
quickly sold off their stocks due to their observation of the future and information they
gathered using related to the current transaction information market trading using
(Babson 2008).
Erdad (2002) emphasised the economic effects of the global financial crisis where both
consumers and producers faced severe hardship due to high cost of goods and services as
a result of their poor financial position. This was caused by the liquidity problem faced
by banks and other financial institutions as research has been done to establish the effects
of the crisis from banks liquidity position. Many researchers focus on macro and micro
economic points of view for example in Nigeria, Nickolas and Alexander (2012)
suggested that effects of the crisis are based on a macroeconomic imbalance, intense
competition among the financial institutions, poor implementation of financial
deregulation, the credit boom, poor risk asset management by the banks and lack of
transparency in banks financial reports. They state that these are the major keys elements
that affected the banking sector in Nigeria which resulted in huge capital withdrawals by
the investors, which further brought about devaluations of the banks stocks price. This
helped identify features of the crisis but, he failed to address the level of damage the
crisis on the specific sectors of the economy. This research endeavours to fill that gap in
knowledge‟s
Amusa, (1994) defined bank as institutions in an economy that enhance and promote the
economic activities. Essang and Olayide (2011) described banks as government or private
21
owned monetary institutions owned of profit making. They state that, in pursuit of profit,
banks perform a number of functions, one of which is the acceptance of deposit from
individuals surplus in the economy known as credit and channel it to the deficit site of the
economy known as debit through the mediation of credit facilities (CF) for re-investment
in to the economy known as circularization. However, the reversed was true in Nigeria
within the period under review, because instead of collecting deposit, customers were
withdrawing their deposits from the banks. This behaviour became a topic of concerned
that attracted the attention of this research to investigate and document the effect of such
action of customers on the banks shares performance. Prior to the above situation,
Nigeria banking sector was doing very well. However, due to the global financial crisis
of 2008 the financial sector faced many challenges (financial time magazine dated
16/10/2008).
Danjuma, (2009) describes what took place after GFC announcement and the reaction to
it in particular Nigeria “Exactly two weeks after the stock price dropped down in USA,
the situation was reflected in Nigerian stock market. Investors created a serious panic
which worsened the general price level of banks shares which was as below sea level”.
He further lamented that the effects of 2008 crisis were physically visible on 30 March,
2009 where most of banks in Nigerian banks financial reports indicated a drop in their
cash deposit level and liquidity profile. This can be further justified by the World Bank
report of the last quarter of 2008 financial year, where they reported that banks and
financial companies‟ failure are the basis that triggered the financial crisis and halted the
22
global credit market which made unprecedented government intervention in USA and the
rest of the world.
2.2.2Evolutionary Trend of the Global Financial Crisis
According to Olusegun (2009) there had been three major economic crises in the history
of the World. The earliest one occurred in the 1830s, which was largely restricted due to
limited communication facilities; however, the depression still sneaked across the United
States (US) borders to some European countries. One hundred years later, in the 1930s,
another economic crisis stroked the United States of America (USA).
The 1930s economic crisis was regarded as the most vicious and therefore referred to as
the Great Depression. The 1930s depression was more global in spread, partly because
the world was more closely knitted through advancements in communication technology,
such as using telegram, telephone and both private and public postal service as mean of
communication. Again in 2008, nearly another one hundred years, later another economic
crisis has hit the United States and is fast spreading to other parts of the world. This is
because the world has become a „global village‟ as predicted by Marshall Mac Lucan,
one of the great philosophers of the century. Globalization according to Soludo (2009)
has consequently resulted in a global market built on an international financial system.
Now it is the syndrome of the crisis that ripples across one economy to another and is
referred to as a global crisis. Soludo, (2009), shows that the causes of the two previous
depressions and the existing one are similar. They all have their roots from careless
lending by banks and unsound risk management policy and implementation.
23
In 1832, after President Jackson had destroyed the Bank of the United States which the
people had regarded as an enemy of the country economy, his action provided the
country with a stable currency and prevented banks from lending freely as well as
selfishness without collateral. This initiated a solid foundational procedure of statutory
unconditional assessment require before the advancement of bank loans in US; this
procedure is currently been used globally as a control measure in local and international
bank activities. This situation led to land speculation in the 1830s, and the land
speculators had little trouble persuading local banks to lend them money.
Consequently, sales of public lands and the advantage of using it as collateral raised the
value of land from four (4) million acres in 1834 to twenty (20) in 1836. This caused the
disastrous panic in 1837. Banks and business houses closed their doors for given out
loans and introduced additional tide conditions on loan which resulted in thousands of
farmers losing their farms through mortgage foreclosure. There was almost total
unemployment among Eastern factory workers that worked on canals and the new
fangled railroads that linked almost all parts of Europe and even extended to some parts
of Asian countries as work almost grounded to a halt. This was described as most severe
depression in the history of America. It was labelled a financial tragedy in the late 18 and
early 19 century a mismatch between financial firms and regulatory agencies, against the
social and political institutional right Kaldor, 2008
24
One hundred years later, a more disastrous economic crisis hit the USA again via
careless lending. Between 1925 and 1929, the market value of securities on the New
York, Stock Exchange more than tripled, increasing from $27 billion to $87 billion. Most
of the funds raised were as a result of a wave of speculation similar to land speculation in
the 1830s. Gamblers in the great bull market who bought „on margin‟ took loans from
brokers without proper collateral on condition that the loans were paid on demand. In
those days, securities could be sold for as much as (50) fifty times their earning power.
Stocks in companies that never paid dividends were said to have raised as much as $40 to
$50 per share, which is a good signal of positive market volatility, but very dangerous
practice to the firms and the economy in general.
Torbat and Sao (2008) and Soludo (2009) said that the present financial crisis in America
could be traced to the collapse of the housing market and the high default experienced on
subprime mortgages, Soludo affirms that subprime lending is the giving of loans to
borrowers who do not qualify for the credits. These borrowers got the loans based on
their income levels, down payment, or due to the virtue of their credit history. They have
been borrowing and paying back, so it is assumed that they always pay backs this
created excess liquidity which the Federal Reserve Bank made possible by establishing a
global commodity bubble. It also created a housing bubble which gave birth to two
government-sponsored enterprises, which is Fannie Mac (Federal National Mortgage)
and Freddie Mac (Federal Home Loan Mortgage Corporation) with clear mandate to
create and provides liquidity for the housing market. These came to dominate the
financing of housing. Half of the mortgages in the United States, over five (5) trillion
25
dollars are either owned or guaranteed by these two entities, which gave emphasis to
buildings. They have since been placed into conservatorship and that is why when the
financial bubble busted in 2008 it had disastrous consequences on the entire economies of
the USA, Europe and the world. This is what was tagged as the GFC
The US government has formally taken over Freddie and Fannie. (Pualsol, 2008)
(Lockhart, 2008) (Fact Sheet, 2008) Bajaj (2008) Independent (2008) and Norris (2008)
show that in March 2007, subprime mortgages went as high as $1.3 trillion dollars in the
United States and about 25 percent of its finances turned out to be bad loans (that is 3.25
billion dollar) by June 2008. In all, 9.5 percent of all mortgage loans were reported to be
delinquent. These risks was extensively distributed, affecting many investors,
corporations, commercial and investment banks, lenders and real estate investment firms,
shippers and since borrowers could no longer pay back. To compound the problem,
housing prices declined drastically daily, affecting the stock markets. The financial
institutions lent to subprime borrowers in droves. They granted what was referred to as a
Ninja loan, which slacked the world economy and by August, 2008 the stock market in
America was in turmoil. There was panic in almost all the financial markets across the
globe where investors began to remove their money out of risky mortgage bonds. All
these issues jointly form the credit squeeze ravaging not only to the economy of the
United States, but the global economy.
The warnings of a few financial analysts, practice bankers, brokers, and economists who
saw danger were not heeded, and the government saw nothing wrong with great increase
26
in broker‟s loans, since it was benefiting from the 10% interest rate and 5% management
processing fees and other charges, which added value to their profit and loss account at
the end of the financial year, the government also benefit from also direct tax payment.
Later, the Federal Revenue Board advised member banks to stop loaning money to
investors who might use it for margin buying of stocks. But the Board warnings were
ignored and by September 1929, the market began to weaken. By late October another
GFC disaster struck, large-scale farmers panic, sales of stocks collapsed banks loss of
direction and loss of confidence in the American economy cause a cut in the average
price of securities by mid-November 1929 and investors lost almost $30 billion dollars.
Thousands of investors lost their life by October 1929 even the formerly wealthy group
were heavily in debt Some people who lost money committed suicide, while others up till
today were not fund, banks officials were sent to jail. That was the Great Depression.
2.2.3 Effects of the crisis to the world economy
Tobat and Akbar (2008) said the financial crisis of 20 centaury is the worst of its kind in
the history of the world economic depressions they are supported by Norris (2008) who
states that a liquidity problem of banks and other financial institutions in USA which
created a serious problem to the world economies, the Ministers of Finance and the
Central Banks Directors across the globe came together and to determine how to reduce
the degree of the effect and investors fear, as well as restored investors and prevent them
from withdrawing huge amount of their cash deposits from banks. Investors were
choosing to keep their money outside the bank as a precautionary measure. Because of
the interconnectedness of the world, the ramifications of the investor‟s choices affected
the global service.
27
It has been noticed the challenges caused by the crisis right from 1830- 2008 affected
nation and individuals lending the US financial Secretary to state in his address to the
European Congress of Finance “therefore something must be done at global and
individual level to heal the injury” Assessing the effects to the financial crisis on
individuals has been carried out effectively, and this research endeavours to fill this gap
in knowledge. The current financial depression behaved differently from other major
world crisis. In the world of unprecedented financial globalization, where the financial
sector plays a historically large role in economic activity at same countries this crisis
comes on the heels of a major global shock from high food and fuel prices which have
imposed a heavy economic burden on many countries and significantly increased the
incidence of poverty, insecurity and political vulnerability Sao (2008) In fact the
economies of countries around the world were affected directly or indirectly,
significantly or otherwise, even as government leaders refuse to face the truth concerning
their actual financial position.
2.2.4 Nigeria banking sector after the pronouncement of the 2008 GFC
The Nigeria banking sector was considered one of the most vibrant in Nigeria as it
contributed to the development of the economy by more than 14 billion naira annually,
after the sharp falling of crude oil prices, with the financial crisis period. However, the
sector was hardest hit by the crisis, and the capital market recorded serious divestment of
foreign investors, who investor divested to meet their obligations back home in the face
of the credit squeeze. These situations continue to lead to the drop in banks shares index
as well as the volume of traded securities in the Nigerian stock exchange. There is
28
evidence that banks shares index in NSEM dropped but no explanations were given by
the authorities concerned on the degree of the effects of the crisis. This research hopes to
contribute to this knowledge.
Tella (2010) looked at the GFC of 2008 as an inductive or calculated virus which came
about from over reliance on the Market mechanism of the USA at a macroeconomic
level. This re-affirmed his Market philosophy in the Nigerian context where he states that
in Nigeria specifically the unregulated credit expansion trend in the financial sector, the
spill over effect of international financial firms conditions of loans like World Bank,
International Monetary Fund (IMF) and others the major factors that gave birth to GFC
through a free Market and Structural Adjustment Program (SAP)
The researcher disagreed with Tella because IMF loan and SAP programs conditions
existed long time in Nigeria before the recent GFC and the economy without the adverse
effects experienced to day IMF and SAP conditions are quite parallel to the factors
responsible for GFC of 2008 in Nigeria. More so, those international financial conditions
are directly associated to the entire economy of the country (Nigeria) while my research
is basically restricted to only one sector of the economy which is the banks, so it is un fair
to make a general conclusion or assumption that IMF and SAP programs are the bases of
GFC of 2008 in Nigeria.
Statistical evidence proved that prior to the economic meltdown in 2008, the Nigerian
Stock market experienced a fast expansion in Market index reflecting a record 66,371.20
29
percentage points which show an increase of 1,070 percentage points in 2008 was
achieved. However, immediately after the pronouncement of the US Subprime Mortgage
crash in July, 2008 the Nigerian Stock market recorded a dropped index of 45.8 percent
which is 26,539.44 points down to close it transaction as at the end of financial year 2008
(Amedu, 2010) Welter, (2010) laments that in 2007 up to the beginning of 2008, is a
significant amount of foreign money flowed in to Nigeria‟s financial market from
different financial institutions abroad. Banks in Nigeria collected loans from foreign
business partners and gave out the same loans to their customers. The loans were for cars,
housing shares, and agricultural community development saving schemes, industrial
development, personal just to mentioned but few, unfortunately it is the same loans that
customers stacked in to stock market, therefore the ability to borrow, the size of the loan
nature of the loan and the institutions to borrow from became a subtle Marketing point
with banks using this as a sign of strength and advertising this in various news papers.
As the Global Financial Crisis (GFC) intensified, most foreign financial lenders was
shacked and began to call for their funds back from Nigerian Banks. These actions
greatly affected the liquidity position of several banks that were exposed to the stock
market. Secondly CBN financial report to the President indicated that over 1.8 trillion
dollars were hedged in investment Banks. These entities were considered as an important
cause of the Currency problems to investment banks and investors. Investors withdrew
their deposits without taking in to consideration the financial sector risk which further
directly affects business. At the same time such calamity creates a deleveraging selling of
banks stocks at depressed prices. Other factors his paper highlights are suspension of
30
credit to market operators and investors undervalue bank stocks, deluge of public offers
and private placement, exit of foreign portfolio investors and the Central Bank Policy on
a common accounting year end for all operators of banks among others factors. In the
researchers opinion I absolutely agreed with Welter and Amedu in areas where they
portray the remote causes of the crisis in Nigeria Stock Market in particular the banking
sector, but the paper could not address the second part of it caption, instate they only left
it as open ended question as “what lessons for market players and regulation This
research endeavours to fill this gap in knowledge since the crisis affected the
performance of the banks shares traded in the Nigeria stock exchange market.
Okereke (2009) comments on the impact of GFC of 2008 from second quarter of 2008
where equity market capitalizations dropped from 12.64 trillion naira on May 30 to 6.21
Trillion Naira on 16 December before finally closing at 9.56 trillion on 31 December in
the same year This can be attributed to the poor position of banks liquidity, shortage of
currency flow arising from declined public sector, excess withdrawal and losses in stocks
values by the public that necessitated the profit of the banks to decline as reflect in
financial report. The statistics by Okereke below clearly indicator how the GFC of
2008 affected the Nigeria Stock Market, in particular the banking sector, since the sector
covered more than 50% percentages of the total shares traded in the stock market.
Below is the list of the top twenty (20) stocks most from banks with the volume of their
stock traded in NSE, these, dropped from 28.21% in 2007 to 21.86% in 2008
31
Table 2.0 (Top 20 performing stock firms value before crisis)
S/No Company Name Value in(million)
1 Investment Allied Assurance PLC 26.74
2 Universal Insurance company PLC 12.4
3 Spring Bank PLC 8.3
4 Lasaco Assurance Company PLC 5.4
5 Intercontinental Bank PLC 5.32
6 Transactional Corporations of Nig PLC 5.16
7 Fidelity Bank PLC 5.15
8 Equity Assurance PLC 4.9
9 Africa Bank Nigeria PLC 4.83
10 Access Bank PLC 4.8
11 Oceanic Bank PLC 4.8
12 First Bank of Nigeria PLC 4.74
13 NEM Insurance PLC 4.4
14 First City Monument Bank 4.3
15 United Bank For Africa PLC 4.0
16 First Inland Bank PLC 3.61
17 Continental Reinsurance PLC 3.60
18 Guaranty Trust Bank PLC 3.2
19 Bank PHB PLC 3.14
20 Mutual Benefits Assurance PLC 3.10
Source: NSE Facts and Figure 2007/2008
Similarly, Okereke observed the serious downward effects of the GFC syndrome on
stocks capitalization in NSEM, where another statistical table on the top (20) most
capitalized companies out of which (15) are banks shows how capitalization dropped
comparatively.
32
Table 2.1 (Banks and other firms best capitalization comparative table)
S/
No
Company Market cap b/4
GFC billion Naira
Market Cap after GFC
billion Naira
Diff
billion
Naira
1 First Bank of Nigeria 923,524 524,848 (398,676)
2 Zenith Bank 892,471 368,385 (524,086)
3 Nigeria Breweries 700,251 308,931 (391,320)
4 United Bank For Africa 411,221 283,467 (127,754)
5 Eco Bank incorporated 379,782 273,396 (106,386)
6 Oceanic Bank 410,221 267,767 (142,454)
7 Intercontinental Bank 342,991 243,055 (99,936)
8 African Petroleum 311,001 241,888 (68,113)
9 Bank PHB 397,421 206,387 (191,034)
10 Stanbic IBTC Bank 504,261 204,375 (299,886)
11 E co Bank Nigeria plc 553,214 201,817 (351,397)
12 Guaranty Trust Bank 399,201 194,907 (204,294)
13 Dangote Sugar
Refinery
341,550 186,000 (155,550)
14 Union Bank 339,410 179,012 (160,398)
15 Guinness Nigeria plc 300,111 146,755 (153,356)
16 Wema Bank plc 297,421 145,562 (151,859)
17 Fidelity Bank plc 284,510 135,837 (148,673)
18 Afri Bank Nigeria plc 270,550 129,801 (140,749)
19 Nestle Nigeria plc 250,012 126,455 (123,557)
20 Access Bank plc 230,550 116,211 (114,339)
Source: NSE Facts and Figures 2007/2008
The above twenty (20) most capitalized companies‟ accounts for 50% of the market
capitalization. Changes in the price of these stocks impact substantially on the total
market capitalization and on the entire shares index.
33
With reference to the 2005 consolidations policy on the Nigeria banking sector
pronounced by the CBN Head Soludo, he said “one of the aims of the policy is to
reposition the Nigerian banks to compete internationally, by increasing the capital base
from (2) billion to (25) billion Naira”. Other advantages arising from the policy are the
fact that Nigerian banks are exposed to global business with foreign banks, which came
up with conditions of downsizing bank staffs demoting staff with low educational
qualifications like Teachers Colleges and general certificate of education (TC and GCE,
retrenchment of staff on age, health or simple mistakes. Some banks branches where
closed due to not making profit or break even profit consistently and many more. The
spill over effects of such policies are further reported in the chartered institute of Nigeria
banker‟s publications of the second quarter of 2008 where most of the banks recording a
high volume of bad lending, and lowered prices of bank‟s stocks among others factors.
This forced the regulatory authority to intervene and take qualitative measures to enable
the banks to cope with the effects of the crisis. Some of the measures include: reduction
of (MPR) monetary rate policy from 10.25% to 6.0%, reduction in cash reserve
requirements (CRR) from 4.0% to1.0%, and reduction in liquidity Ratios (LR) from
40.0% to 25.0%.
The apex bank also gave money deposit banks the option to restructure margin loans.
While the lending facilities period was also expanded up to 180-360 days and the
discount window operations (DWO) are implicit guaranty to bank deposits as well as
interbank. All these measures were aimed at restoring the glory of the banks as a solution
34
to their shares and cash crash which resulted in the folding of some banks due to
liquidations problems; which meant that some banks had margin trading loans of about
900.0 billion naira at the end of 2008. The amount represented about 12.0% of the credit
aggregate of the industry and 31.0% of shareholder funds. (Sanusi, 2009)
2.3 Theoretical literatures on Models
Theoretical models in research show the best model that fits in to current one from a
mathematical approach and help determine the research analysis. Theories related to firm
dividend payment were used in the past to determine the status of the banks by
customers. Dividends were associated with the banks performance before the global
crisis. In this study four models were discussed relating to the measurement of a firm‟s
performance with regards to its public (customers) for example ,the study looks at Walter
James‟s approach to dividend payment, Gordon Growth‟s dividend model, Modigliani
and Miller‟s and Event study model. This research modernized the event study model to a
comparative event study model and adopted it because it take care of all the variables in
the study and is more closely related to the nature of this study.
2.3.1 Walter James Approach Model
Walter is basically concerned with the maximization of wealth of equity holders. He
argues that in the long run, the share price reflects only the present value of expected
dividends and the retention that influence stock prices only through their effects on future
dividends. He also considered different market prices in different situations. For example,
35
internal rate of return, market capitalizations and dividend pay out ratio, before
determining the market value of the shares. The model was presented quantitatively as -:
Vc= D+Ra/Rc (E-D)/Rc ................................................2.1
Where, Vc = Market value of the ordinary/share of the firm, Ra = Return on internal
retention (earning profit), Rc = Cost of capital investment, E = is the earning per share
and D=Dividend per share. Two major factors influence Walter‟s analysis i.e. dividend
per share and the relationship between the internal rate of earnings returns and the market
expectations by the firm. Walter established his conditions of the model operation as
when the internal rate (I.R) of retained earning is higher than the market capitalization
rate, the values of the shares would be higher even if dividend is low. But if the I.R
within the business is lower than what the market expects, the value of the shares will be
low. Then share holders will prefer a higher dividend so that they can bridge the
difference between capitals invested and expected returns and channel it to more
profitable business.
In the researcher‟s opinion, the model did not take in to consideration other factors that
affect the dividend policy and the shares prices of the firms. For example, the model did
not consider whether the firm is growing or not, meaning that the firm can be developed.
Also other factors need to be taken in to consideration, such as the nature of the dividend
policy applicable to the firm accounting principles (whether it is cash or stock dividend
in form of bonus), firm‟s investment opportunities, the operation‟s environment,
government economic policies, natural disasters and overhead operation expenses, which
are dynamic in nature. Therefore the model can not fit in to this analysis.
36
2.3.2 Gordon Growth Model
This is another model that supports the Walter model. It states that dividend payment
determines shares prices. The model has (7) seven assumptions which include: firms are
all equity and have no debt, no external finance was used, investment programs are
financed exclusively from retained earnings, the internal rate of return(r) of the firm is
constant, the appropriate discount rate (Ke) for the firm remains constant, the firm has a
perpetual life span, the retention income once decided upon is constant, the growth rate
(g=br) is constant and the discount rate is greater than the growth rate (Ke>br), Myron
Gordon also argues that what is available to day is better than what is going to be
available in future. Therefore all investors are rational and risk and uncertainty.
Based on these assumptions, rational investors always buy stock which has higher price
value that give current and constant dividend payment, rather than lower stock price with
uncertainty of payment. In addition a rational investor will discount the value of the stock
that postpones dividend payments depending on the retention rate and utilize the income
in another business sector. The model was presented as follows:-
Ve= [do (1+g)/Ke-g].............................................................2.2
Where, Ve= Market price per share (ex-dividend), Do= current rate dividend, g= constant
annual growth rate of dividend, and ke = cost of equity capital (expected rate of return).
The model operates on three conditions when the rate of returns is greater than the
discount rate, the price per share increases and the dividend ratio decreases, when the rate
of returns is less than discount rate, the price per share decrease, while the dividend ratio
37
increases and when the return is equal, to the discount rate, the price per share remains
unchanged and the dividend ratio also be the same as it was.
In researcher‟s opinion, the model left so many questions unanswered. For example, the
model was built upon a hypothesis which was not tested and proved practically.
Therefore the assumptions are subjective not objective. Additionally, none of the
assumptions can be acceptable by investors in practical application and it seems there are
contradictions within them. For example firms can never all be equity in status and at the
same time be debt free, if this were possible, who would finance the operations of the
firm at the initial stage? Therefore the model has short comings and can not be adopted in
this analysis.
2.3.3 Modigliani and Miller (MM hypothesis Model)
The MM model opposed to the relevancy of the dividend payment as a yardstick for
measurement of the firms performance. The proponents of the theory argue that the
firm‟s dividend policy has no effect on its shares value under perfects capital markets. A
rational investor is placed in between dividend payment and capital appreciation given
the firms investment policy. Its dividend policy may not influence the market prices of
its shares. The model was built upon the following hypothesis. The firms operate in a
perfect capital markets in which all investors are rational and information is freely
available. There are also no taxes. Alternatively, there is no difference in the tax rates
applicable to capital gains and dividends, firm has any fixed investment policy, there is
no floatation or transaction cost and the risk of uncertainty does not exist. (Investors are
38
able to forecast future price and dividend with certainty and one discount rate is
appropriate for all securities and all time periods (r=k=Kt for all)
The MM model is primarily based on an arbitrage argument, that the values of the firm
remain the same whether the firm pays dividends or not, and the value is on its earnings
and is not affected by the pattern of its income distributions. More so, dividend policy
does not affect the share holder‟s wealth. This means that payment of the dividend is
offset by external financing because money is borrowed t finance the new investment.
Another point is that the value of the share declines when dividends are paid therefore the
present value per share after dividend and external financing is equal to the present value
per share before the payment of dividend. In this case the share holders are indifferent to
the payment of dividend and retention of earnings. The model is presented as:-
Po= p1+D1/1+Ke ............................................................2.3
Where, Po= the prevailing market price of a share, Ke= the cost of equity capital,
D1=dividend to be receive at the end of period one and P1= market price of a share at the
end of one period. It seems the model is basically a theoretical are because in under
developed and developing countries, all the assumptions can not be attainable. In fact,
even in the developed countries, their capital markets can not operate in a settings where
information‟s are perfect, rational, free and available, or in an environment where free of
taxes or where there exists a fixed investment policy and non existence of uncertainty.
Therefore the model is theoretical practical applicable.
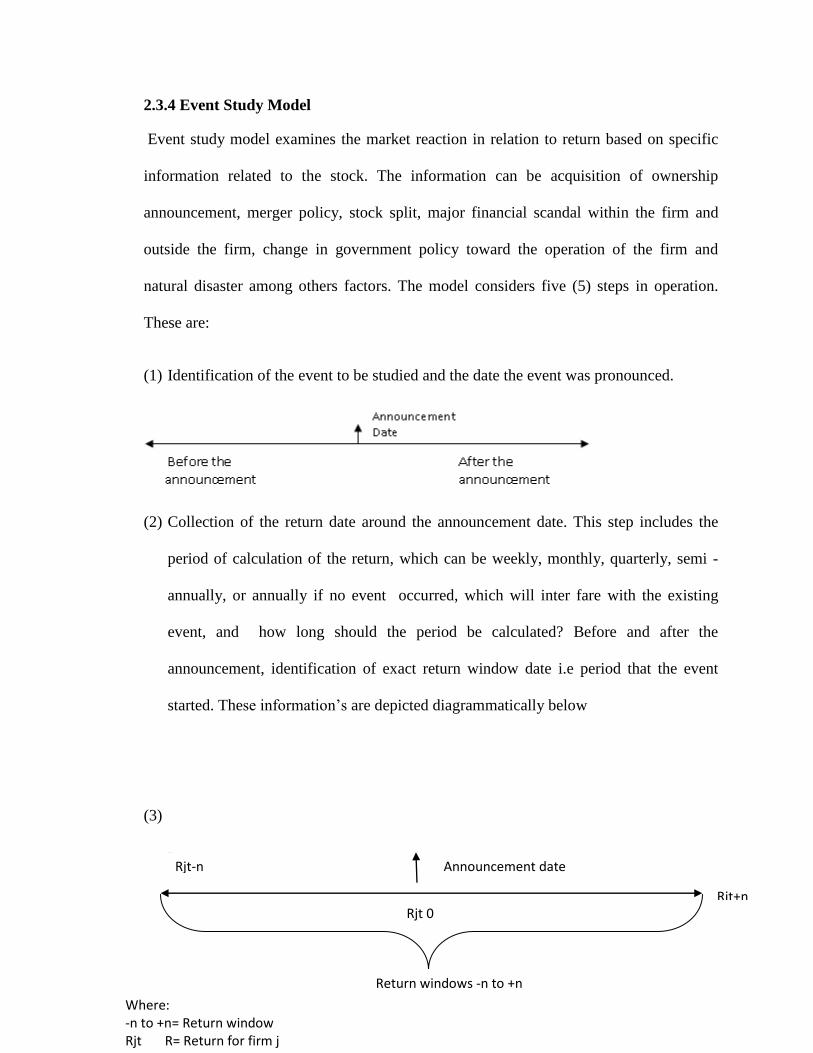
39
2.3.4 Event Study Model
Event study model examines the market reaction in relation to return based on specific
information related to the stock. The information can be acquisition of ownership
announcement, merger policy, stock split, major financial scandal within the firm and
outside the firm, change in government policy toward the operation of the firm and
natural disaster among others factors. The model considers five (5) steps in operation.
These are:
(1) Identification of the event to be studied and the date the event was pronounced.
(2) Collection of the return date around the announcement date. This step includes the
period of calculation of the return, which can be weekly, monthly, quarterly, semi -
annually, or annually if no event occurred, which will inter fare with the existing
event, and how long should the period be calculated? Before and after the
announcement, identification of exact return window date i.e period that the event
started. These information‟s are depicted diagrammatically below
(3)
-
Rjt-n Announcement date
Rjt 0 Rjt+n
Return windows -n to +n
Where: -n to +n= Return window Rjt R= Return for firm j j= is the firm
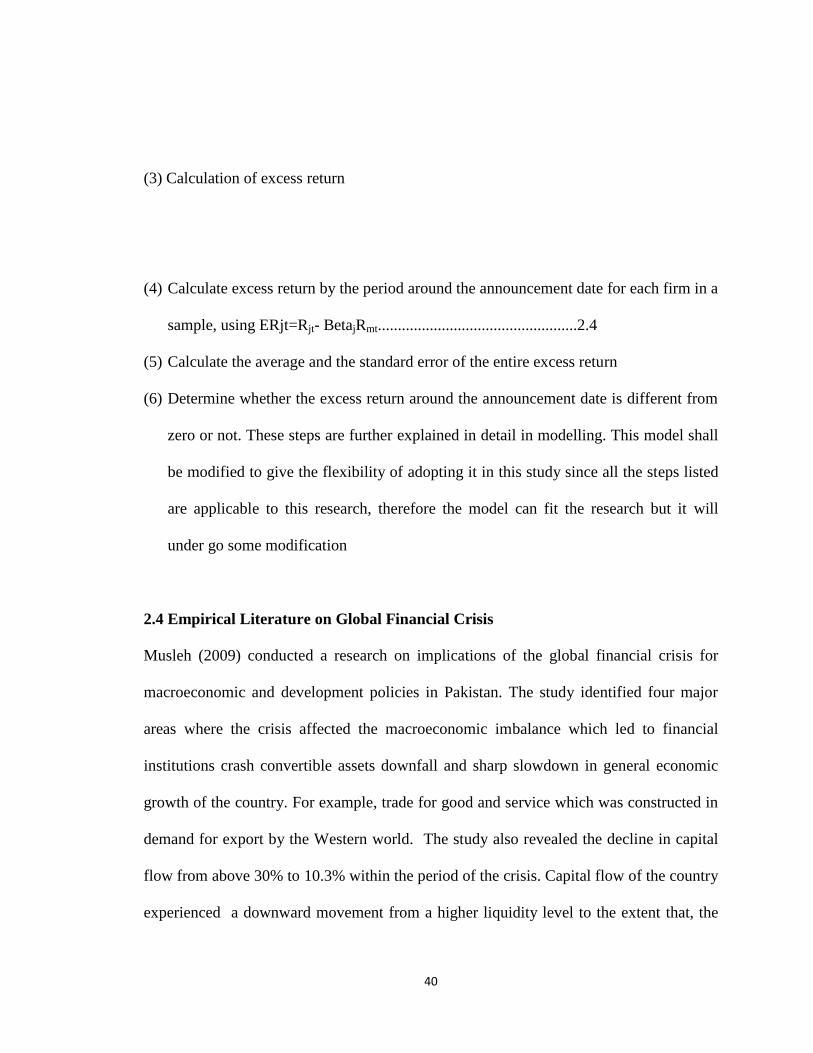
40
(3) Calculation of excess return
(4) Calculate excess return by the period around the announcement date for each firm in a
sample, using ERjt=Rjt- BetajRmt..................................................2.4
(5) Calculate the average and the standard error of the entire excess return
(6) Determine whether the excess return around the announcement date is different from
zero or not. These steps are further explained in detail in modelling. This model shall
be modified to give the flexibility of adopting it in this study since all the steps listed
are applicable to this research, therefore the model can fit the research but it will
under go some modification
2.4 Empirical Literature on Global Financial Crisis
Musleh (2009) conducted a research on implications of the global financial crisis for
macroeconomic and development policies in Pakistan. The study identified four major
areas where the crisis affected the macroeconomic imbalance which led to financial
institutions crash convertible assets downfall and sharp slowdown in general economic
growth of the country. For example, trade for good and service which was constructed in
demand for export by the Western world. The study also revealed the decline in capital
flow from above 30% to 10.3% within the period of the crisis. Capital flow of the country
experienced a downward movement from a higher liquidity level to the extent that, the
41
foreign deposit investment (FDI) dropped from USD 5,410 million to USD 3,720 million
from 2008 to 2009.This situations created panic which affected the general out flow of
the foreign investment portfolio to record a negative (510.4) in 2009 against positive of
19.0 in 2008.This literature is an eye opener to my study, even though the scholar
considered the entire country economy as his target whereas this study has as its target
the mediations sector in Nigeria.
Similarly the crisis affects the remittance of the foreign inflow of capital which is
expected in the macroeconomic perspective to act as an indicator that reduces poverty
and increase government income, but due to the effects of the crisis the result was
negative. This can be attributed to the fact that majority the migrant of labour workers in
Middle Eastern countries have now significantly reduced their economic activities.
Similarly there was a reduction in the repatriation of monies saved by those in the
Diaspora. Other factors related to the decline in remittance was increased consumptions
and reduced investment, falling asset prices, rising of interest rate and depreciations of
the local currency; of which shares prices index of the country exchange market dropped
from 8.7 to 4.7 trillion, with market capitalizations of Rsl (Pakistan currency) 1.85 trillion
in December, 2008 to Rsl 1.27 trillion in 2009.In summary Pakistan‟s experience on GFC
is a true reflection of Nigerian experience.
According to the National statistical data bureau of India, India is another country that
suffered from the effects of GFC even though not as widely as other countries within the
Asia. This is because their financial system had little to do with investment in structured
42
financial instruments carved out of the US subprime mortgage, whose failure had set off
the chain of events culminating in a global crisis. Notwithstanding, the economic growth
was decelerated between 2008 and 2009 to 6.7% which represent 2.1% average growth
rate compared to 8.8% before the pronouncement of the crisis. To counter the negative
fall out of the crisis the government implemented a policy of tax relief to investors,
produces and other economic agents in order to boost productions and increase
expenditure in public projects. This created more employment and added value to public
assets. The government also used Central Bank reserves to salvage the liquidity position
of the commercial banks. The Indian Central Bank (ICB) enhanced the flow of funds in
by injecting more funds to financial system to meet the need of produces.
This measure placed Indians economy as one of the best economies which that
experienced the least affects of the global crisis, even though their GDP declined from
8.6% to 7.0% within the period. In 2010 and 2011 however, it appreciated to nearly the
same level as it was in before the crisis that is (8.6%). These remarkable efforts of the
government and economist of India placed the country as one of the fastest growing
economies after China. In spite of the remarkable achievements recorded by the Indian
economy, the crisis syndrome reflected on their stocks exchange market where shares
values declined from USD 51.4 billion to USD 19.0 billion from September, 2008 to
January 2009. This explained the 63% decline as a result of withdrawals of the foreign
institutional investors, lower external borrowing and short term trade credit by the banks.
In the researcher opinion, all the literature that covered Pakistan and India are more of
43
general analysis of the economy. None of the scholars examine individual sector of the
economy as focused on in this study.
According to Mac, J, Washington, D and Maria, P, the situation in Australia is not per
from other countries, even though the effects of the crisis seemed severe. The crisis in hit
on securities that are related to prime mortgage and the credit market in Australia where
the, were value and volume of the mortgage stocks had been thought by the investors to
be low-risk. This resulted in sharp losses. This situation made banks to become
considerably less willing to lead money, which resulted in to increases in interest rates
and a drop in the credit market in terms of the volume of transactions. This gave room for
the share prices to fall especially the banks shares. This eventually led to a collapse of
the US securities company Lehman Brothers, and larger insurance company (AIG).
Mortgage agencies like Fannie Mae and Freddie Mac were all deemed bankrupt.
The financial market recorded huge losses due to fear its effects on the financial system,
until the government through the Central Banks responded with policies to salvage the
situation such as :- sizeable fiscal stimulus, large reductions in interest rates a, guarantee
of bank‟s deposits, bank debt issuance, and government ownership of some troubled
financial institutions. This situations is similar to Nigeria‟s even though the analysis of
the individual sector was not shown in detail unlike in this study that, the effects shall be
treated in detail from banking a point of view
44
In African continent, Nabaho (2009), comments on this from an employment and labour
market perspective. He summarised the economic effects from the banking sector where
he emphasized the prophesy statement of Dominique Strauss Kahn (2009) which he said”
even though the global economic crisis has been slow in reaching Africa‟s shores, we all
know it is coming and its impact will be severe in one way or the other” this prophesy
become true regarding employment and labour in some African countries especially poor
countries that solely depend on foreign financial assistance. However, there was less of a
negative effect in other part of the continent financial sector and in deed banking industry
example Kenya in Eastern and South African. Nabaho further said some of the reason
that the effect is not severe on some African countries banks are due to peripheral
position in the global economy which shields the countries from the disruptive effects of
the crisis compared to other countries across the continent. Ikome (2008) attribute the
economic weaknesses of African to some factors which include, excessive regulation,
conservatism of the majority of African banking system inherited fro their colonial
masters for example rigid controls of foreign exchange, limited foreign ownership of
banks shares, and direct business linkage with other banks in Europe and America
The proponents of the perspective which appeared as a form of counter
productive financial de-linkage from the world financial banking system before the crisis,
now paradoxically stands out as a useful shield against the brunt of the crisis in the
countries banking sector ( The Economist, 2008) However, most banks in African
countries suffered seriously from the crisis Nigerian banks included. Why is this so?
Any attempt to answer this question will provide a solution that fills gap knowledge of
45
the Western world crisis and Africa. Therefore research of this nature is just the
beginning of filling the gap
2.5 Research Gap
With reference to Musleh, D (2009) work title global financial crisis: Implication for
macroeconomic and development policies in Pakistan were he used empirical
econometrical approach to describe his research result; it was found that, the crisis
brought about downfall of convertible assets, sharp slowdown in general economic
growth, downfall of trade for good and services rate, falling down of local currency
value, increased in consumption and reduced in investment, falling of assets price
(equities) rising of interest rate dropped on share price index and high cost of living.
However it is my opinions that the paper was basically relating the crisis from
macroeconomic point of view and the findings are not sufficient to make general
statement about the crisis effects on individual sector of the India economy which form
the bases of microeconomic analysis as this paper intend to go about.
Indian National Bureau for statistic and data published a report on global financial crisis,
effects and solution on Indian economic policies, the report used explanatory and
statistical method in analyzing the data were it was discovered that there was a decline in
general economic growth in all aspect of live. This situation provide the opportunity of
introduction tax relief to both local and foreign investors, reductions of capital
expenditure, creating more job opportunity, increased in money supply to salvage the
liquidity position of commercial banks and many other macro and micro economic
policies as a solution to the crisis effects.
46
It is my opinion that the study is more of economic policies approach to macro and micro
economic problem rather than using the policies to solve the financial problem, in
addition to that the paper could not point at the specific area were the crisis affected the
economy as individual sector instated it concern about economy in general. Therefore the
finding may be relevant to economic perspective but not logical from financial angle.
Mac Jonas and et.al (2009)” reviewed Australian economic policies and its relationship
with USA focus on financial intermediation in a period of economic controversy” The
study used comparison analysis using Pearson correlation and regression, were the result
reveal that share prices in general and bank specifically was effected, there was an
increased in banks interest rate, stock market value and volume dropped and many
commercial banks that are not very financial sound in terms of capital and assets base
collapsed thereby making the financial institutions to a semi crave yard for business
investors, however the fact that the study focused on financial institutions in Australia yet
it does not provide the direction on the same industry because financial institutions are
made up of many firms.
From the above studies it seems there are more of economic approach rather than
financial and almost all the study focused on either general economic policies or the
entire financial institutions without been specific of which this study viewed it as a gap
by taking one complete aspect i.e banking industry as part of important firms that played
a greater role in nations economic focusing on Nigeria been one of the most vibrant
economic nation in Africa and role played by the banking firms in economic
development.
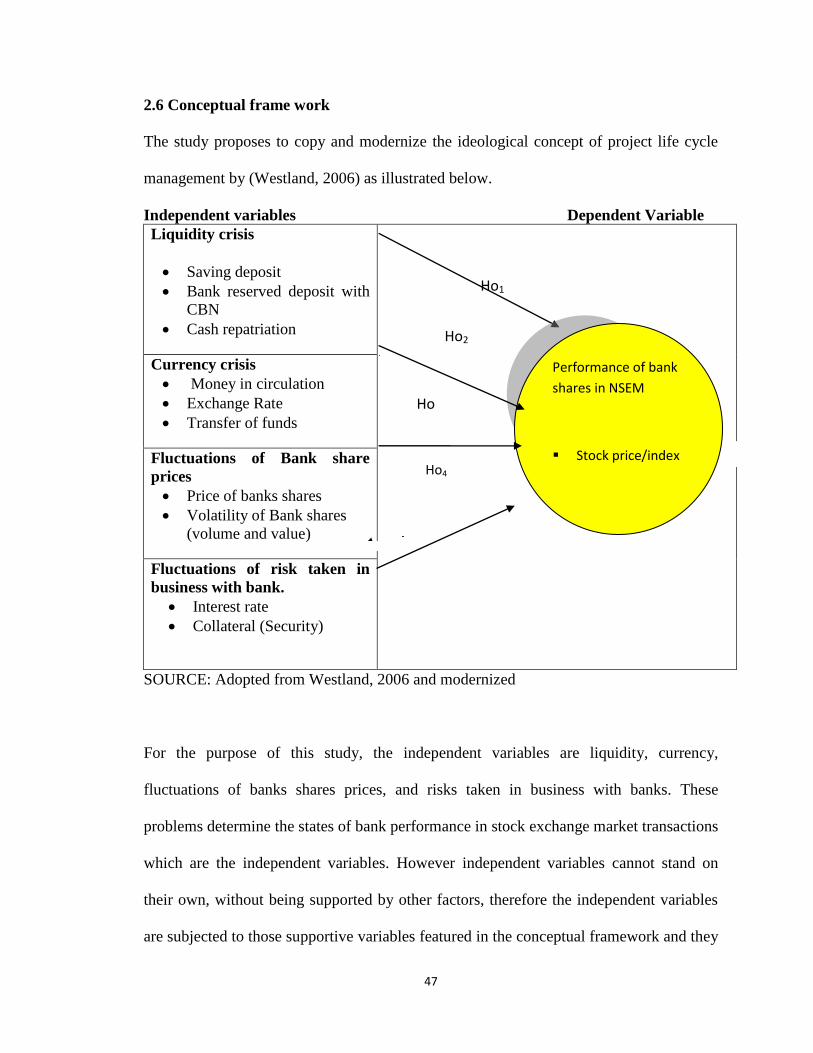
47
2.6 Conceptual frame work
The study proposes to copy and modernize the ideological concept of project life cycle
management by (Westland, 2006) as illustrated below.
Independent variables Dependent Variable
Liquidity crisis
Saving deposit
Bank reserved deposit with
CBN
Cash repatriation
Currency crisis
Money in circulation
Exchange Rate
Transfer of funds
Fluctuations of Bank share
prices
Price of banks shares
Volatility of Bank shares
(volume and value)
Fluctuations of risk taken in
business with bank.
Interest rate
Collateral (Security)
SOURCE: Adopted from Westland, 2006 and modernized
For the purpose of this study, the independent variables are liquidity, currency,
fluctuations of banks shares prices, and risks taken in business with banks. These
problems determine the states of bank performance in stock exchange market transactions
which are the independent variables. However independent variables cannot stand on
their own, without being supported by other factors, therefore the independent variables
are subjected to those supportive variables featured in the conceptual framework and they
Ho4
Ho2
Ho1
Ho
33
33
33
33
33
33
33
Performance of bank
shares in NSEM
Stock price/index
48
also serve as a measure between the dependent and independent variables. All the
supportive variables in the conceptual framework diagram (under independent variables)
are few therefore it is possible in the process of data collection that other factors may be
discovered which they will take care of the lapses that may be discovered from those
mentioned in case there is failure in anyone of them during the data collections process.
49
CHAPTER THREE
RESEARCH METHODOLOGY
3.1 Introduction
This chapter describes the research design, research philosophy, target population, data
sources and procedure adopted in data collection. It also explains the instrument used in
collection of the data, testing the validity and reliability of the instrument used,
operationalization of the variables and models used and the during the data analysis.
3.2 Study Design
Generally research design is considered to be conceptual structure that portrays an
accurate profile of the study (Cooper and Schindler,2008) This structure constitutes what
Kothari, (2010) referred to as the blueprint for the collections, measurement and analysis
of the data within the research parameter in relation to the characteristic of a particular
phenomenon the independent and dependent variables. The design of this research is
descriptive in nature, because it describes the behavioural pattern of a comparative event
study of a n incident that occurred within a particular period of time considered and
called a crisis to a particular aspect of life known as finance, across the world, which
further affected the individual sector of the economy in which this study focuses with
particular reference to the bank‟s stock price performance in Nigeria
50
3.3 Research Philosophy
The research philosophy is an important aspect in social science research. The philosophy
is basically attached to the subjective researcher‟s assumption about the way and the
method the researcher strategized his work, in such a way that the assumptions
established at the beginning justify at the end of the research. (Johnson and Clack, 2006)
cited in Sounders,( 2009). According to Cooper and Schindler (2008) there is a strong
relationship between individual philosophy that is the way they think and the knowledge
of a subject matter, which influences the result of the research. Therefore research
philosophy is classified in to three paradigms; positivism, interpretivism and realism.
From research conducted in the past, evidence shows that the out come of each paradigm
presents a different view on how knowledge is developed and judged as acceptable.
Remenyi (1998) cited in Sounders (2008) further explained the three paradigms as
positivism which prefers working with observable social reality whose end result can be
generalized. Interpretivism philosophers argued that a social science research is unique
therefore it depends on circumstantial situations and the understanding of the researcher
that determine the result. And realism is based on the belief on the reality which defers
from one individual to one another. This study considered positivism and adopted the
philosophy of it because the philosophy is attached to a subjective researcher‟s
assumptions about the way people are looking at the event global financial crisis and their
experience witness during and after the event. This result reveals a correlation between
GFC of 2008 and the banks shares prices performance traded in the NSEM.
51
3.4 Target Population
The target populations of the study were the 24 Money Deposit Banks (MDB) CBN, SEC
and NSEM. A total of 27 organisations in the financial sector of Nigeria, with the
headquarters in the capital city Abuja and annex offices of some in Lagos
Here annex is a term referred to office that equally played a role of head office in
financial term
3.4.1 Data sources
Considering the relevance of the data required in a research of this nature all the target
populations mentioned were expected to provide specific data. For example information
about liquidity and currency positions of all the 24 money deposit banks are expected to
be extracted from their audited annual financial reports covering the period of the
research scope 2006-2010. Other sources include CBN, SEC, and NSEM financial
reports, published monthly, quarterly or annually as well as, stock trading rating reports
and others.
3.4.2 Data Collection Instrument
This refers to instruments the researcher used in collecting the data. In this case the
instrument used is the documented review guide line. Summary of the instrument is
attached as Appendix b. The guide lines contain five (5) Colum tables where each
variable is represented according to the objectives and the information extracted. Details
of the tables are presented in chapter four (4) before the analysis.
52
3.5 Data Collection Procedure
The method adopted in collection the data are in stages; first stage is making direct
contact with the organizational administrative officers were introduction and presentation
of letter of introduction took place and later, the administrative procedure was followed.
Stage two in the Central Bank of Nigeria there was orientations about their data where
the researcher together with the officer in-charge of the documents identied the relevant
data required. As a policy one is not allowed to go out of the Bank‟s research unit with
any document without the consent of the officer in-change. Therefore, information like
policy statements, how interest rate is controlled, monetary policy mechanism
information, are not allowed to be removed out of the bank, but financial statement of
account, interest rate tables are allowed to be taken out of the bank copied on to
electronic devices. While in SEC and NSEM almost all the information required is
available on CDs and in hard copy; some copies are sold while others are given some are
free of change. Most of the information used is collected in electronic form were flash
disks, CD are used in addition to websites and publications of the target organizations.
3.6 Testing of Validity and Reliability of the Instrument
Cooper and Schindler (2006) classified three methods of testing reliability and Validity of
data collected using any type of instrument. These are objectivity, reliability and validity
test.
The objectivity test concerned with the relationships that exist between on the result and
the criteria used in the study. Acceptable and reliable test most provide 90% of the same
or similar results, even when the instrument was used by a different scholar, at a different
53
time and environment (Sounders, 2008). The instrument used in this research was already
used by many scholars in different environment for example Obere (2009), Anthony
(2006) and Bernard and Thomas (1990) and the out come of the research proved the
validity and the reliability of the instrument in an objective manner. Again the reliability
of the instrument depends on the consistency obtained in the results. The three cases cited
also proved the reliability of the instrument at various point and time in the research
environment.
Similarly the objectivity of the instrument is to prove the correctness of the result beyond
any reasonable doubt which Saunders (2009) emphasizes in his research book. Therefore
this research will not be exceptional since the bases of the data used are secondary in
nature and the instrument is recognized as one of the most suitable for collecting the data,
thus, the instrument is said to be valid, reliable and acceptable.
3.7 Operationalization of the Variables
The concept of operationalization of the study variables is to highlight how each variable
can be measured (Saunders, 2009). In this study, the dependent and independent variables
were formulated from supportive variables to account for their operation in relation or to
the analysis required. See the three-column Table no3.1
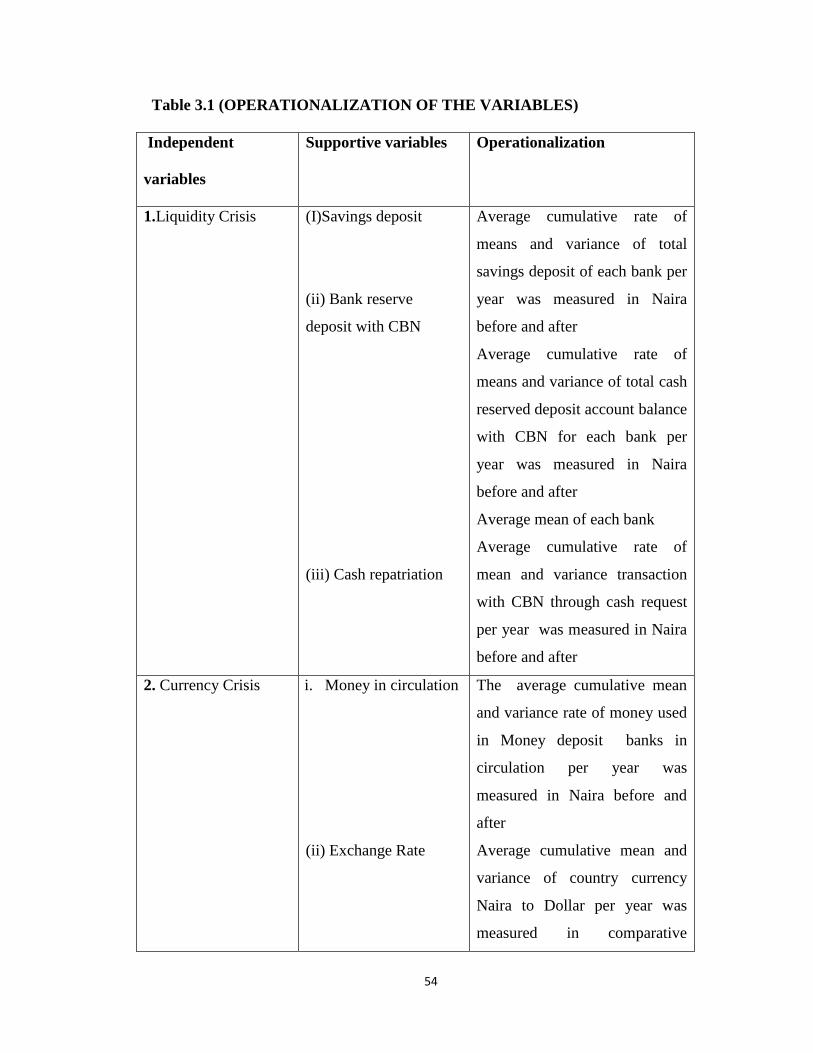
54
Table 3.1 (OPERATIONALIZATION OF THE VARIABLES)
Independent
variables
Supportive variables Operationalization
1.Liquidity Crisis (I)Savings deposit
(ii) Bank reserve
deposit with CBN
(iii) Cash repatriation
Average cumulative rate of
means and variance of total
savings deposit of each bank per
year was measured in Naira
before and after
Average cumulative rate of
means and variance of total cash
reserved deposit account balance
with CBN for each bank per
year was measured in Naira
before and after
Average mean of each bank
Average cumulative rate of
mean and variance transaction
with CBN through cash request
per year was measured in Naira
before and after
2. Currency Crisis i. Money in circulation
(ii) Exchange Rate
The average cumulative mean
and variance rate of money used
in Money deposit banks in
circulation per year was
measured in Naira before and
after
Average cumulative mean and
variance of country currency
Naira to Dollar per year was
measured in comparative
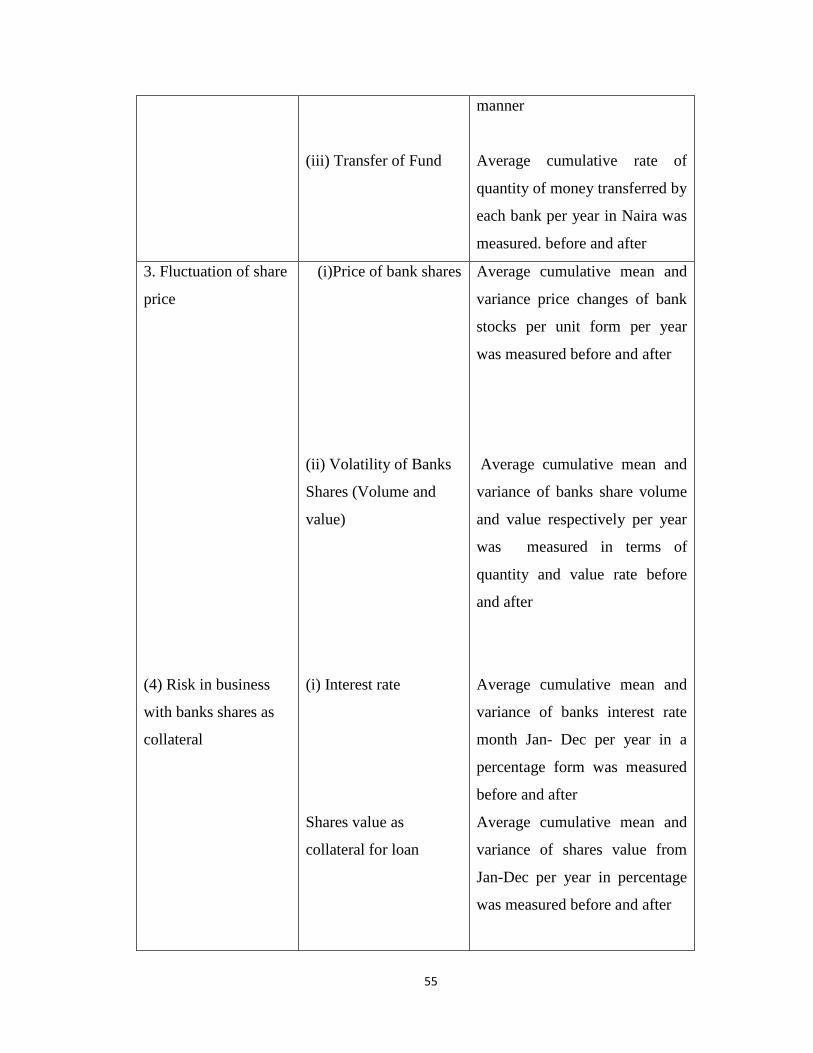
55
(iii) Transfer of Fund
manner
Average cumulative rate of
quantity of money transferred by
each bank per year in Naira was
measured. before and after
3. Fluctuation of share
price
(4) Risk in business
with banks shares as
collateral
(i)Price of bank shares
(ii) Volatility of Banks
Shares (Volume and
value)
(i) Interest rate
Shares value as
collateral for loan
Average cumulative mean and
variance price changes of bank
stocks per unit form per year
was measured before and after
Average cumulative mean and
variance of banks share volume
and value respectively per year
was measured in terms of
quantity and value rate before
and after
Average cumulative mean and
variance of banks interest rate
month Jan- Dec per year in a
percentage form was measured
before and after
Average cumulative mean and
variance of shares value from
Jan-Dec per year in percentage
was measured before and after
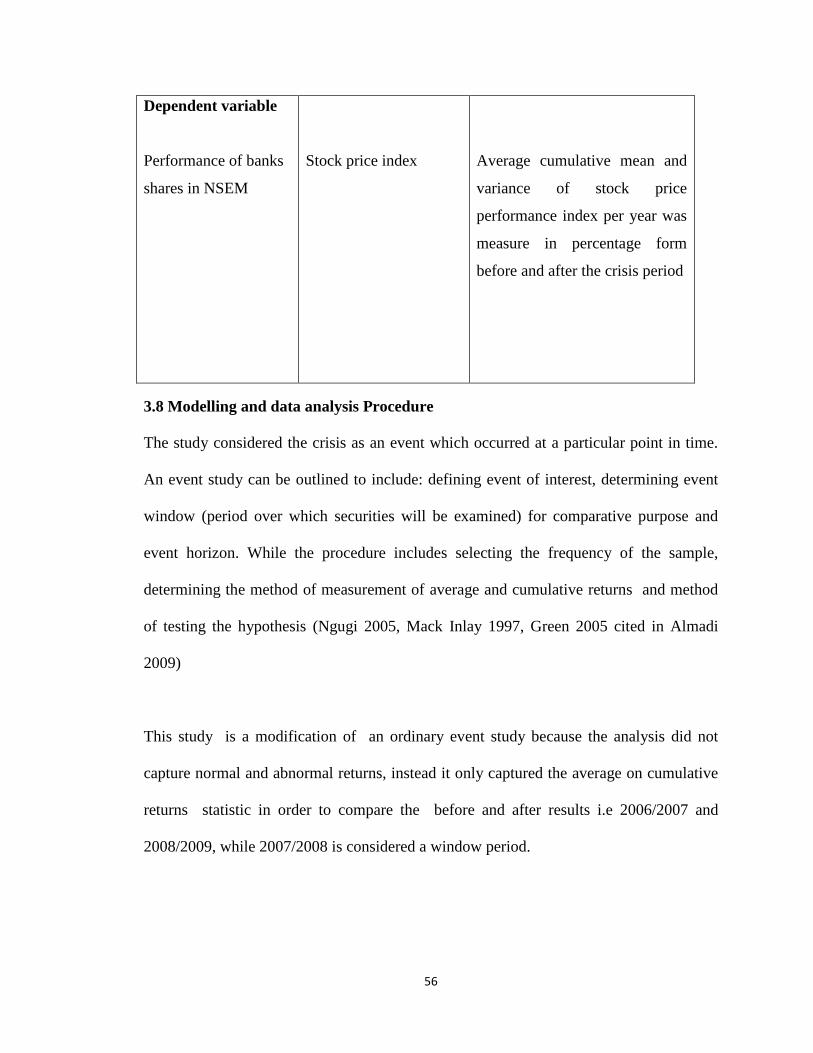
56
Dependent variable
Performance of banks
shares in NSEM
Stock price index
Average cumulative mean and
variance of stock price
performance index per year was
measure in percentage form
before and after the crisis period
3.8 Modelling and data analysis Procedure
The study considered the crisis as an event which occurred at a particular point in time.
An event study can be outlined to include: defining event of interest, determining event
window (period over which securities will be examined) for comparative purpose and
event horizon. While the procedure includes selecting the frequency of the sample,
determining the method of measurement of average and cumulative returns and method
of testing the hypothesis (Ngugi 2005, Mack Inlay 1997, Green 2005 cited in Almadi
2009)
This study is a modification of an ordinary event study because the analysis did not
capture normal and abnormal returns, instead it only captured the average on cumulative
returns statistic in order to compare the before and after results i.e 2006/2007 and
2008/2009, while 2007/2008 is considered a window period.
57
3.8.1 Average Returns
The stock price can only be considered normal if continued in one particular direction
(upward or downward) for a long period of time without fluctuations (Brown 1980 cited
in Chandra 2010) .The study captured the average return between two periods using
statistical model presented as:-
100)(1
xu
uuR
t
itit
………………………………………………………………3.1
Where μt = is the performance of firm ί at time t (Campbell et al, 1997)
µt = Is the average means and variance returns before the crisis
µi = is the average means and variance returns after the crisis
3.8.2 Sign Test
Sign test is used to test the existence of the two hypothetical statements already
established as null and alternative, which state that GFC has or does not have an effect on
each variable indicator. This also determines the performance of banks shares prices
traded in the Nigeria stock exchange market. The test can be presented statistically as:
1211 RRHo ..................................................................................................3.2
Where R11 is return for period before Global Financial Crisis
R12 is return for period after Global Financial Crisis
3.9 Data analysis Procedure and interpretation
This research adopted two procedures in analyzing the data. The first part which is 3.1
modernized the event study model to comparative event study model, so that the
application of two sample t test of means and variance, using descriptive statistics can be
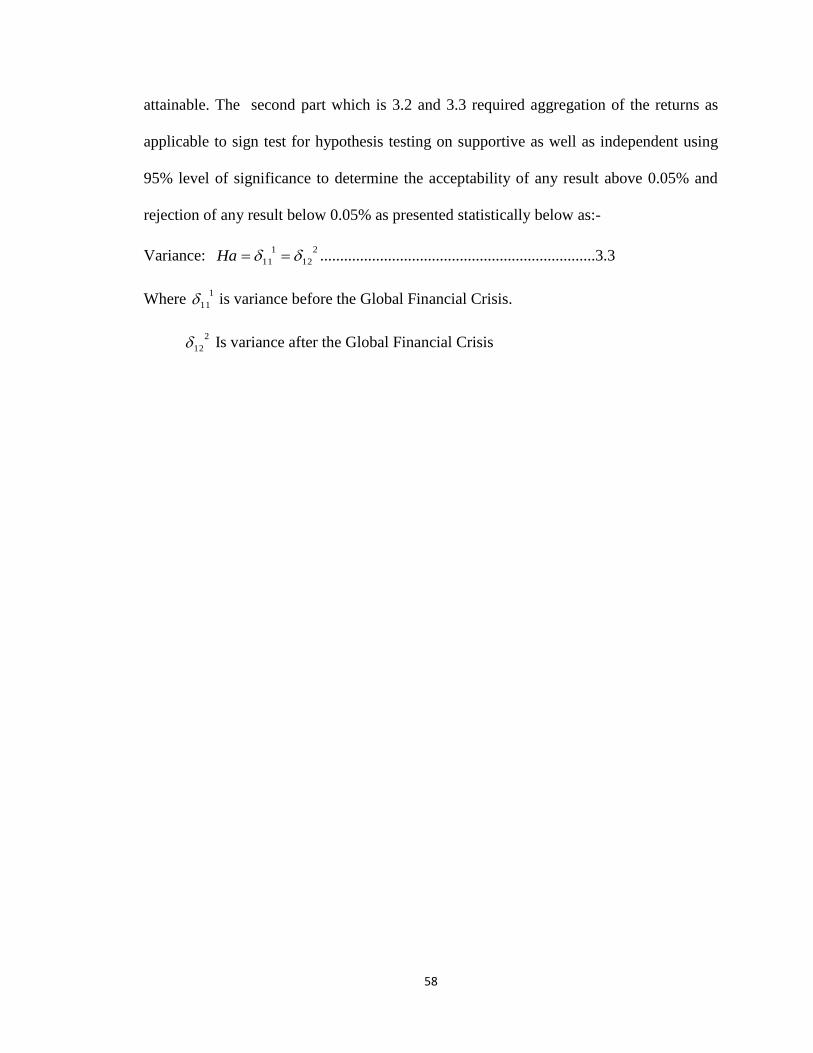
58
attainable. The second part which is 3.2 and 3.3 required aggregation of the returns as
applicable to sign test for hypothesis testing on supportive as well as independent using
95% level of significance to determine the acceptability of any result above 0.05% and
rejection of any result below 0.05% as presented statistically below as:-
Variance: 2
12
1
11 Ha .....................................................................3.3
Where 1
11 is variance before the Global Financial Crisis.
2
12 Is variance after the Global Financial Crisis
59
CHAPTER FOUR
RESEARCH FINDING AND DISCUSSION
4.1 Introduction
This chapter is presented in three parts. Part, one includes a brief introduction. Part two
covers a brief explanation about descriptive statistics and part three presents the data
analysis resulting from the specific objectives stated in chapter one of the study which
include the liquidity crisis, currency crisis, fluctuations of bank share price, fluctuation of
risk taken in business with the bank and the performance of banks share price traded in
NSEM before and after the 2008 GFC.
4.2 Descriptive Statistics
Descriptive statistics were used to describe the nature and the behaviour of the bank
performance variables as extracted using financial statement analysis from 2006 to 2010
which represent two years before and after the GFC that affects Nigeria‟s banks. This
statistical data format provided simple summary of the nature of the data as well as an
understanding of the behavioural character of the data for comparative measurement
using the statistical hypothetical expressions in relations to the two existing hypothetical
assumption of sigh test as Ho1 diff =0, Ho2 diff >0
The tables summarizes all the data covering 18 Money Deposits Banks (MDB) instead
of 24 that was mentioned earlier., The remaining six (6) were removed due to lack of
complete data covering the window horizon as a result of merger and acquisition by other
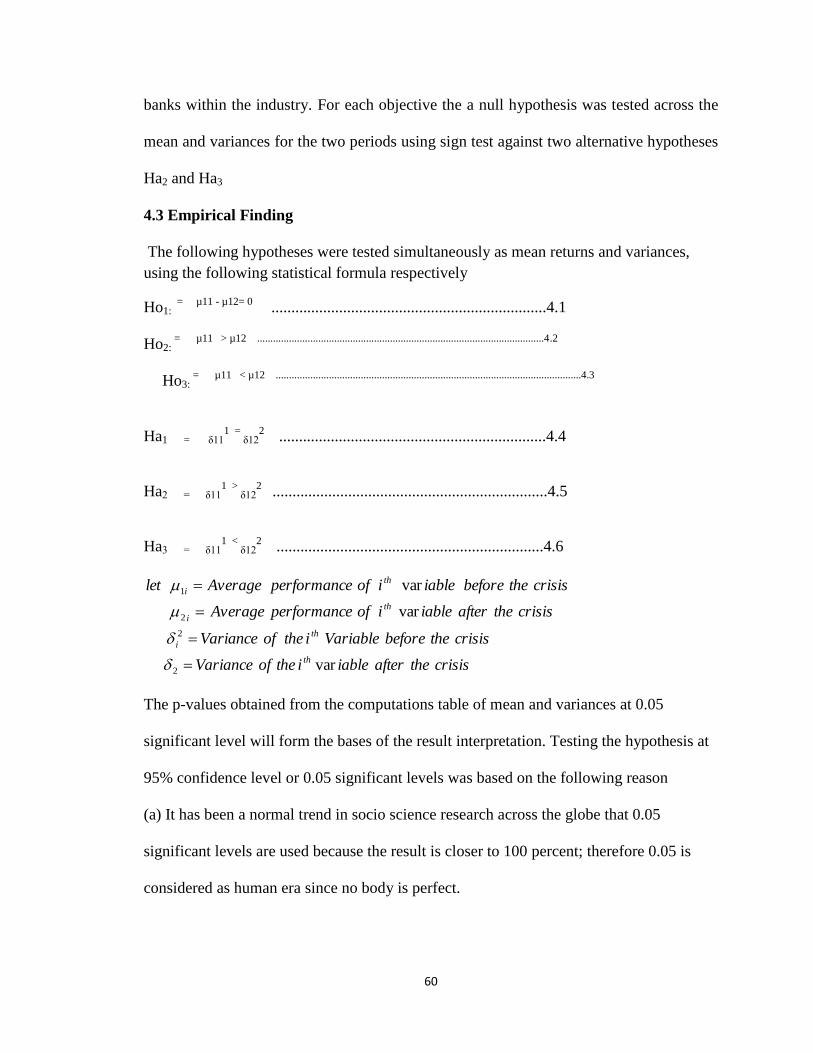
60
banks within the industry. For each objective the a null hypothesis was tested across the
mean and variances for the two periods using sign test against two alternative hypotheses
Ha2 and Ha3
4.3 Empirical Finding
The following hypotheses were tested simultaneously as mean returns and variances,
using the following statistical formula respectively
Ho1: = µ11 - µ12= 0
.....................................................................4.1
Ho2: = µ11 > µ12 ............................................................................................................4.2
Ho3:
= µ11 < µ12 ...................................................................................................................4.3
Ha1 = δ111 =
δ122 ...................................................................4.4
Ha2 = δ111 >
δ122 .....................................................................4.5
Ha3 = δ111 <
δ122 ...................................................................4.6
crisistheafteriableitheofVariance
crisisthebeforeVariableitheofVariance
crisistheafteriableiofeperformancAverage
crisisthebeforeiableiofeperformancAveragelet
th
th
i
th
i
th
i
var
var
var
2
2
2
1
The p-values obtained from the computations table of mean and variances at 0.05
significant level will form the bases of the result interpretation. Testing the hypothesis at
95% confidence level or 0.05 significant levels was based on the following reason
(a) It has been a normal trend in socio science research across the globe that 0.05
significant levels are used because the result is closer to 100 percent; therefore 0.05 is
considered as human era since no body is perfect.
61
(b) Looking at it from financial perspective and banking industry in particular were risk
management is considered as second to the first objective of any profit maximization firm
and banks are known to be risk managers; therefore 0.05 level of risk is quite reasonable
(c) Mathematically 95 percent confidence level is considered as generally accepted as
100 percent if principle of round figure is used
4.4 Liquidity Crisis
Liquidity problem as per this research is a function of saving deposit, bank cash
reserved deposit and cash repatriation. Each item is presented in a tabular format first
with brief explanation, followed by a detailed interpretation of the table analysis as
presented below;-
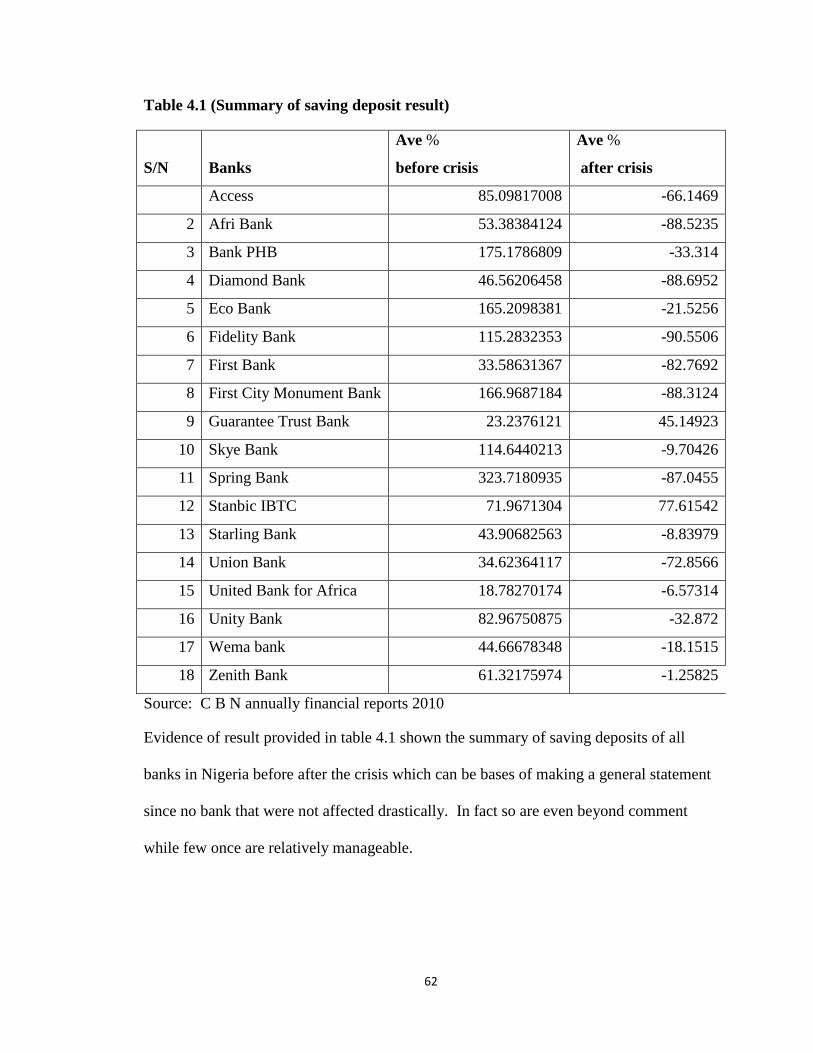
62
Table 4.1 (Summary of saving deposit result)
S/N Banks
Ave %
before crisis
Ave %
after crisis
Access 85.09817008 -66.1469
2 Afri Bank 53.38384124 -88.5235
3 Bank PHB 175.1786809 -33.314
4 Diamond Bank 46.56206458 -88.6952
5 Eco Bank 165.2098381 -21.5256
6 Fidelity Bank 115.2832353 -90.5506
7 First Bank 33.58631367 -82.7692
8 First City Monument Bank 166.9687184 -88.3124
9 Guarantee Trust Bank 23.2376121 45.14923
10 Skye Bank 114.6440213 -9.70426
11 Spring Bank 323.7180935 -87.0455
12 Stanbic IBTC 71.9671304 77.61542
13 Starling Bank 43.90682563 -8.83979
14 Union Bank 34.62364117 -72.8566
15 United Bank for Africa 18.78270174 -6.57314
16 Unity Bank 82.96750875 -32.872
17 Wema bank 44.66678348 -18.1515
18 Zenith Bank 61.32175974 -1.25825
Source: C B N annually financial reports 2010
Evidence of result provided in table 4.1 shown the summary of saving deposits of all
banks in Nigeria before after the crisis which can be bases of making a general statement
since no bank that were not affected drastically. In fact so are even beyond comment
while few once are relatively manageable.
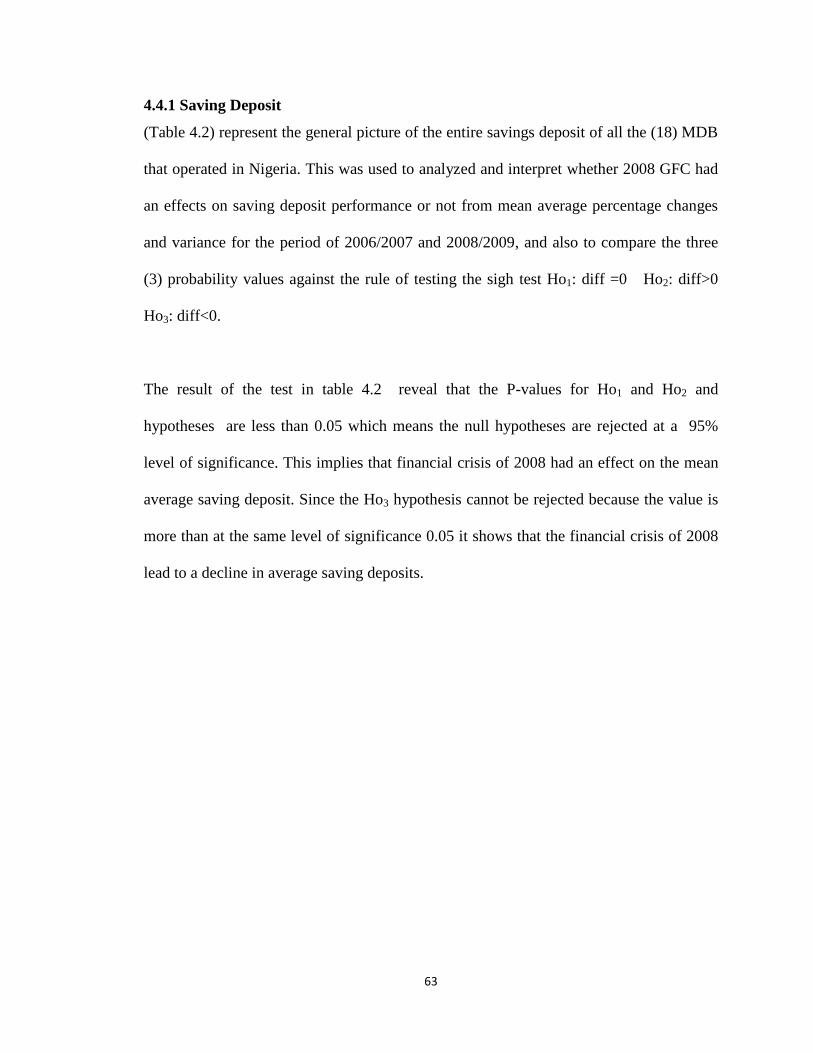
63
4.4.1 Saving Deposit
(Table 4.2) represent the general picture of the entire savings deposit of all the (18) MDB
that operated in Nigeria. This was used to analyzed and interpret whether 2008 GFC had
an effects on saving deposit performance or not from mean average percentage changes
and variance for the period of 2006/2007 and 2008/2009, and also to compare the three
(3) probability values against the rule of testing the sigh test Ho1: diff =0 Ho2: diff>0
Ho3: diff<0.
The result of the test in table 4.2 reveal that the P-values for Ho1 and Ho2 and
hypotheses are less than 0.05 which means the null hypotheses are rejected at a 95%
level of significance. This implies that financial crisis of 2008 had an effect on the mean
average saving deposit. Since the Ho3 hypothesis cannot be rejected because the value is
more than at the same level of significance 0.05 it shows that the financial crisis of 2008
lead to a decline in average saving deposits.
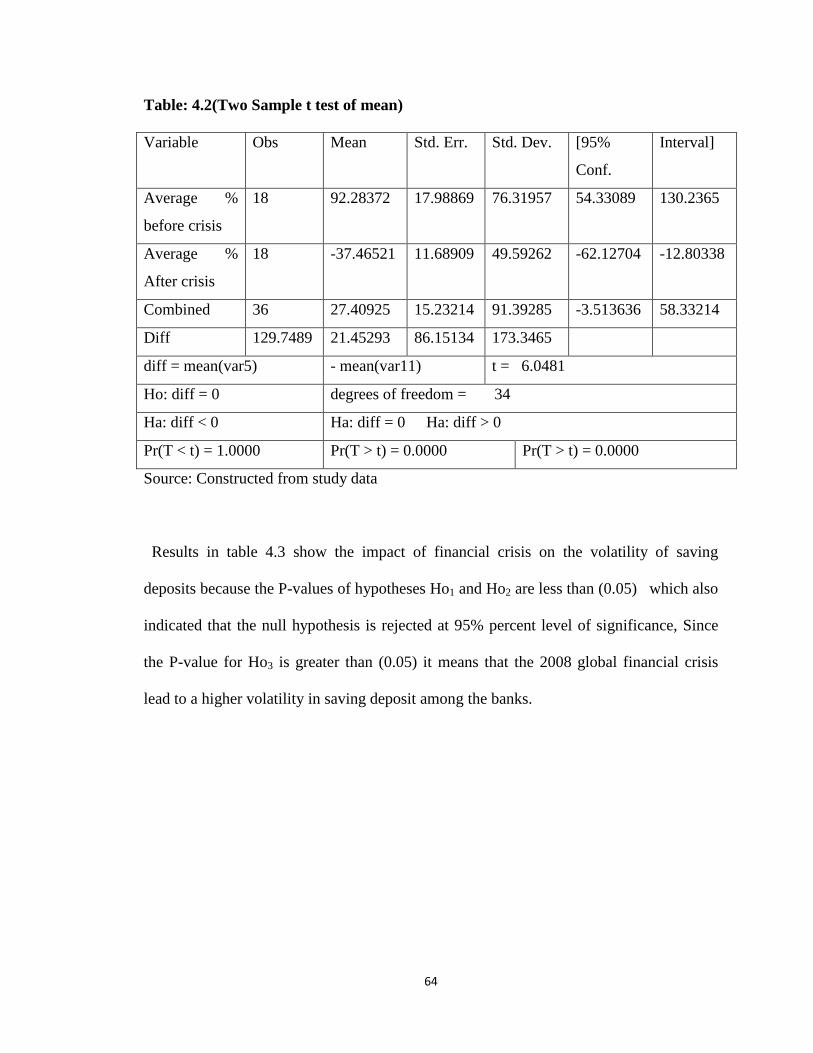
64
Table: 4.2(Two Sample t test of mean)
Variable Obs Mean Std. Err. Std. Dev. [95%
Conf.
Interval]
Average %
before crisis
18 92.28372 17.98869 76.31957 54.33089 130.2365
Average %
After crisis
18 -37.46521 11.68909 49.59262 -62.12704 -12.80338
Combined 36 27.40925 15.23214 91.39285 -3.513636 58.33214
Diff 129.7489 21.45293 86.15134 173.3465
diff = mean(var5) - mean(var11) t = 6.0481
Ho: diff = 0 degrees of freedom = 34
Ha: diff < 0 Ha: diff = 0 Ha: diff > 0
Pr(T < t) = 1.0000 Pr(T > t) = 0.0000 Pr(T > t) = 0.0000
Source: Constructed from study data
Results in table 4.3 show the impact of financial crisis on the volatility of saving
deposits because the P-values of hypotheses Ho1 and Ho2 are less than (0.05) which also
indicated that the null hypothesis is rejected at 95% percent level of significance, Since
the P-value for Ho3 is greater than (0.05) it means that the 2008 global financial crisis
lead to a higher volatility in saving deposit among the banks.
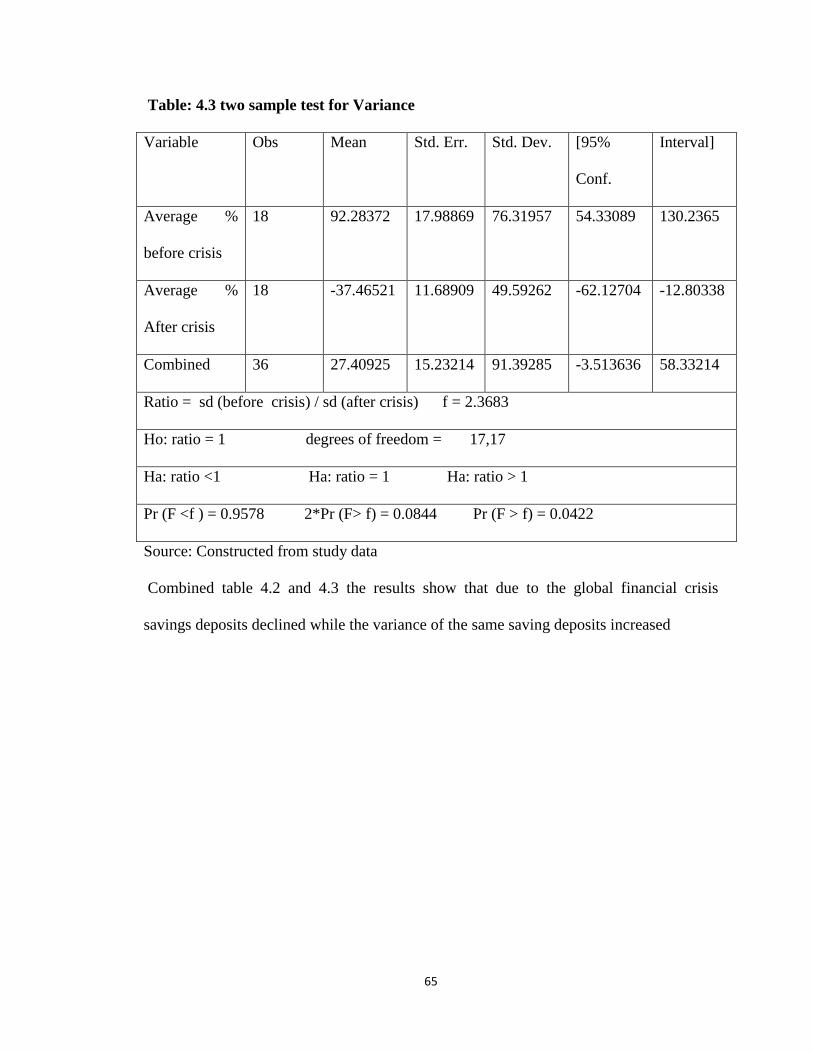
65
Table: 4.3 two sample test for Variance
Variable Obs Mean Std. Err. Std. Dev. [95%
Conf.
Interval]
Average %
before crisis
18 92.28372 17.98869 76.31957 54.33089 130.2365
Average %
After crisis
18 -37.46521 11.68909 49.59262 -62.12704 -12.80338
Combined 36 27.40925 15.23214 91.39285 -3.513636 58.33214
Ratio = sd (before crisis) / sd (after crisis) f = 2.3683
Ho: ratio = 1 degrees of freedom = 17,17
Ha: ratio <1 Ha: ratio = 1 Ha: ratio > 1
Pr (F <f ) = 0.9578 2*Pr (F> f) = 0.0844 Pr (F > f) = 0.0422
Source: Constructed from study data
Combined table 4.2 and 4.3 the results show that due to the global financial crisis
savings deposits declined while the variance of the same saving deposits increased
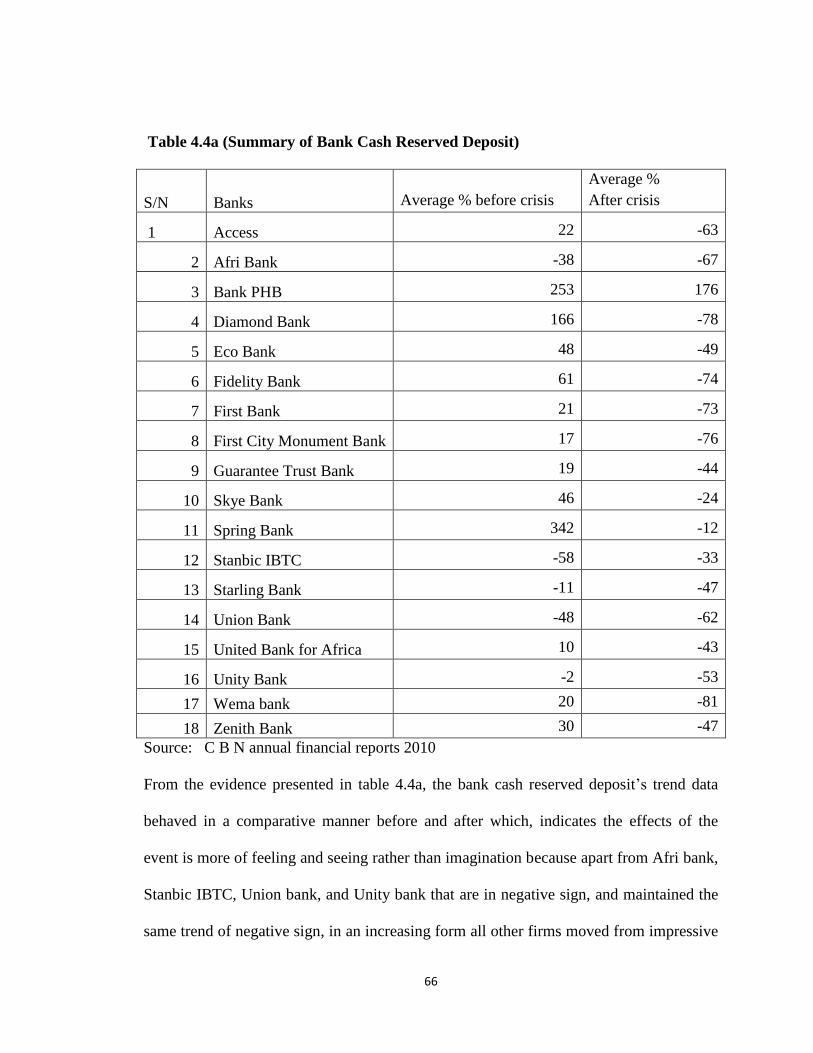
66
Table 4.4a (Summary of Bank Cash Reserved Deposit)
S/N Banks Average % before crisis
Average %
After crisis
1 Access 22 -63
2 Afri Bank -38 -67
3 Bank PHB 253 176
4 Diamond Bank 166 -78
5 Eco Bank 48 -49
6 Fidelity Bank 61 -74
7 First Bank 21 -73
8 First City Monument Bank 17 -76
9 Guarantee Trust Bank 19 -44
10 Skye Bank 46 -24
11 Spring Bank 342 -12
12 Stanbic IBTC -58 -33
13 Starling Bank -11 -47
14 Union Bank -48 -62
15 United Bank for Africa 10 -43
16 Unity Bank -2 -53
17 Wema bank 20 -81
18 Zenith Bank 30 -47
Source: C B N annual financial reports 2010
From the evidence presented in table 4.4a, the bank cash reserved deposit‟s trend data
behaved in a comparative manner before and after which, indicates the effects of the
event is more of feeling and seeing rather than imagination because apart from Afri bank,
Stanbic IBTC, Union bank, and Unity bank that are in negative sign, and maintained the
same trend of negative sign, in an increasing form all other firms moved from impressive
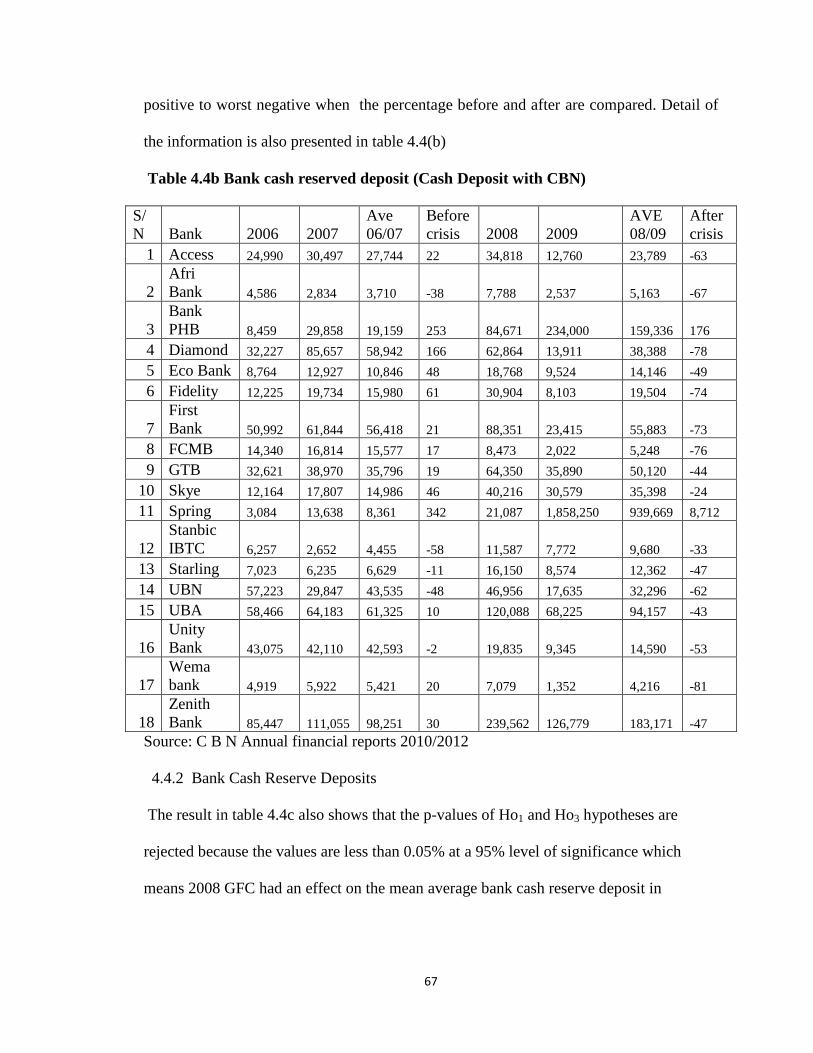
67
positive to worst negative when the percentage before and after are compared. Detail of
the information is also presented in table 4.4(b)
Table 4.4b Bank cash reserved deposit (Cash Deposit with CBN)
S/
N Bank 2006 2007
Ave
06/07
Before
crisis 2008 2009
AVE
08/09
After
crisis
1 Access 24,990 30,497 27,744 22 34,818 12,760 23,789 -63
2
Afri
Bank 4,586 2,834 3,710 -38 7,788 2,537 5,163 -67
3
Bank
PHB 8,459 29,858 19,159 253 84,671 234,000 159,336 176
4 Diamond 32,227 85,657 58,942 166 62,864 13,911 38,388 -78
5 Eco Bank 8,764 12,927 10,846 48 18,768 9,524 14,146 -49
6 Fidelity 12,225 19,734 15,980 61 30,904 8,103 19,504 -74
7
First
Bank 50,992 61,844 56,418 21 88,351 23,415 55,883 -73
8 FCMB 14,340 16,814 15,577 17 8,473 2,022 5,248 -76
9 GTB 32,621 38,970 35,796 19 64,350 35,890 50,120 -44
10 Skye 12,164 17,807 14,986 46 40,216 30,579 35,398 -24
11 Spring 3,084 13,638 8,361 342 21,087 1,858,250 939,669 8,712
12
Stanbic
IBTC 6,257 2,652 4,455 -58 11,587 7,772 9,680 -33
13 Starling 7,023 6,235 6,629 -11 16,150 8,574 12,362 -47
14 UBN 57,223 29,847 43,535 -48 46,956 17,635 32,296 -62
15 UBA 58,466 64,183 61,325 10 120,088 68,225 94,157 -43
16
Unity
Bank 43,075 42,110 42,593 -2 19,835 9,345 14,590 -53
17
Wema
bank 4,919 5,922 5,421 20 7,079 1,352 4,216 -81
18
Zenith
Bank 85,447 111,055 98,251 30 239,562 126,779 183,171 -47
Source: C B N Annual financial reports 2010/2012
4.4.2 Bank Cash Reserve Deposits
The result in table 4.4c also shows that the p-values of Ho1 and Ho3 hypotheses are
rejected because the values are less than 0.05% at a 95% level of significance which
means 2008 GFC had an effect on the mean average bank cash reserve deposit in
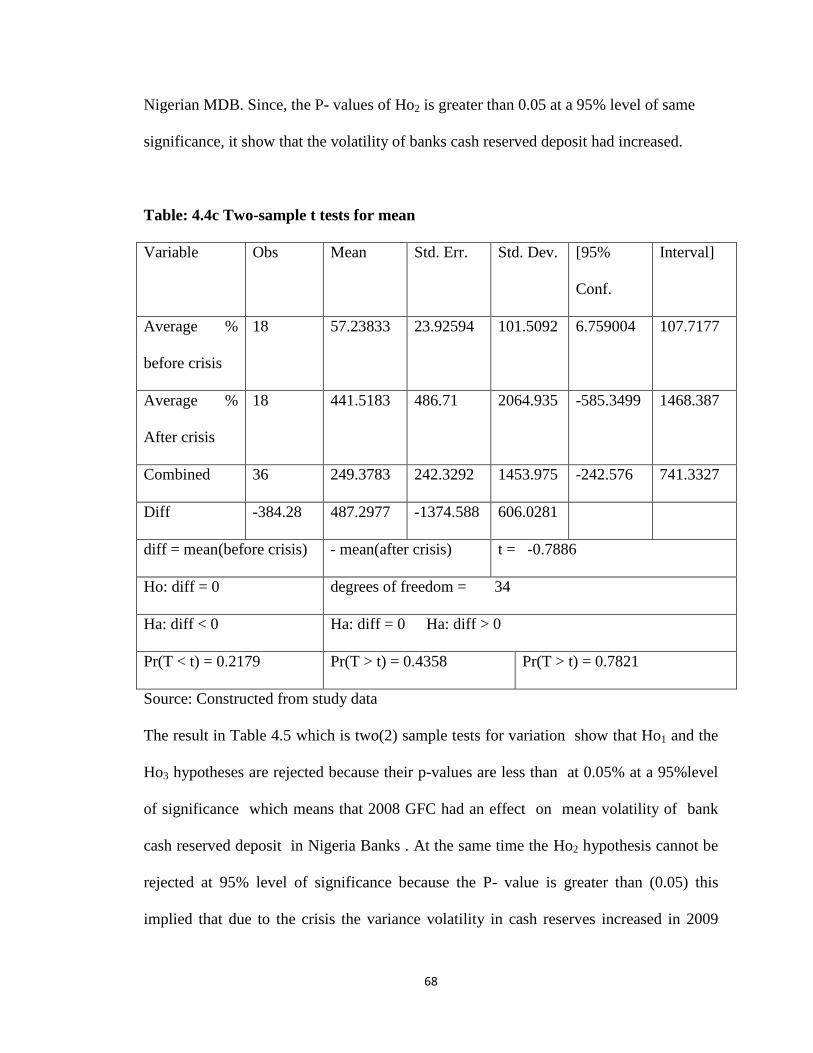
68
Nigerian MDB. Since, the P- values of Ho2 is greater than 0.05 at a 95% level of same
significance, it show that the volatility of banks cash reserved deposit had increased.
Table: 4.4c Two-sample t tests for mean
Variable Obs Mean Std. Err. Std. Dev. [95%
Conf.
Interval]
Average %
before crisis
18 57.23833 23.92594 101.5092 6.759004 107.7177
Average %
After crisis
18 441.5183 486.71 2064.935 -585.3499 1468.387
Combined 36 249.3783 242.3292 1453.975 -242.576 741.3327
Diff -384.28 487.2977 -1374.588 606.0281
diff = mean(before crisis) - mean(after crisis) t = -0.7886
Ho: diff = 0 degrees of freedom = 34
Ha: diff < 0 Ha: diff = 0 Ha: diff > 0
Pr(T < t) = 0.2179 Pr(T > t) = 0.4358 Pr(T > t) = 0.7821
Source: Constructed from study data
The result in Table 4.5 which is two(2) sample tests for variation show that Ho1 and the
Ho3 hypotheses are rejected because their p-values are less than at 0.05% at a 95%level
of significance which means that 2008 GFC had an effect on mean volatility of bank
cash reserved deposit in Nigeria Banks . At the same time the Ho2 hypothesis cannot be
rejected at 95% level of significance because the P- value is greater than (0.05) this
implied that due to the crisis the variance volatility in cash reserves increased in 2009
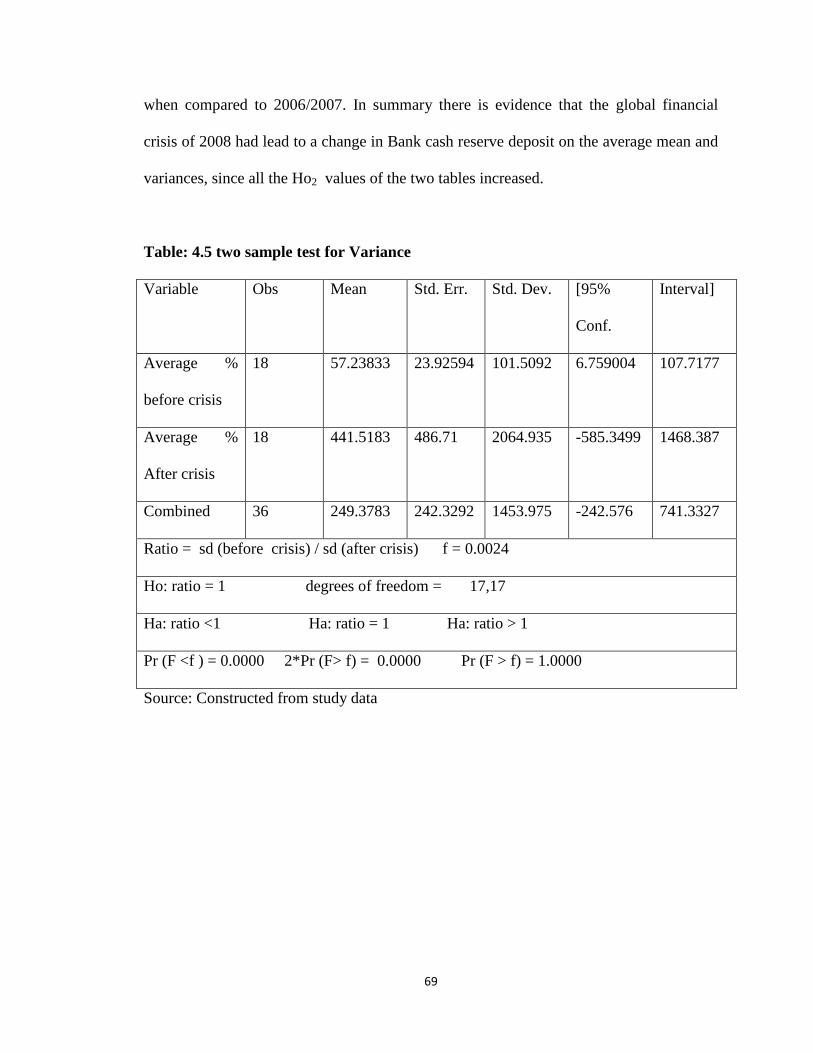
69
when compared to 2006/2007. In summary there is evidence that the global financial
crisis of 2008 had lead to a change in Bank cash reserve deposit on the average mean and
variances, since all the Ho2 values of the two tables increased.
Table: 4.5 two sample test for Variance
Variable Obs Mean Std. Err. Std. Dev. [95%
Conf.
Interval]
Average %
before crisis
18 57.23833 23.92594 101.5092 6.759004 107.7177
Average %
After crisis
18 441.5183 486.71 2064.935 -585.3499 1468.387
Combined 36 249.3783 242.3292 1453.975 -242.576 741.3327
Ratio = sd (before crisis) / sd (after crisis) f = 0.0024
Ho: ratio = 1 degrees of freedom = 17,17
Ha: ratio <1 Ha: ratio = 1 Ha: ratio > 1
Pr (F <f ) = 0.0000 2*Pr (F> f) = 0.0000 Pr (F > f) = 1.0000
Source: Constructed from study data
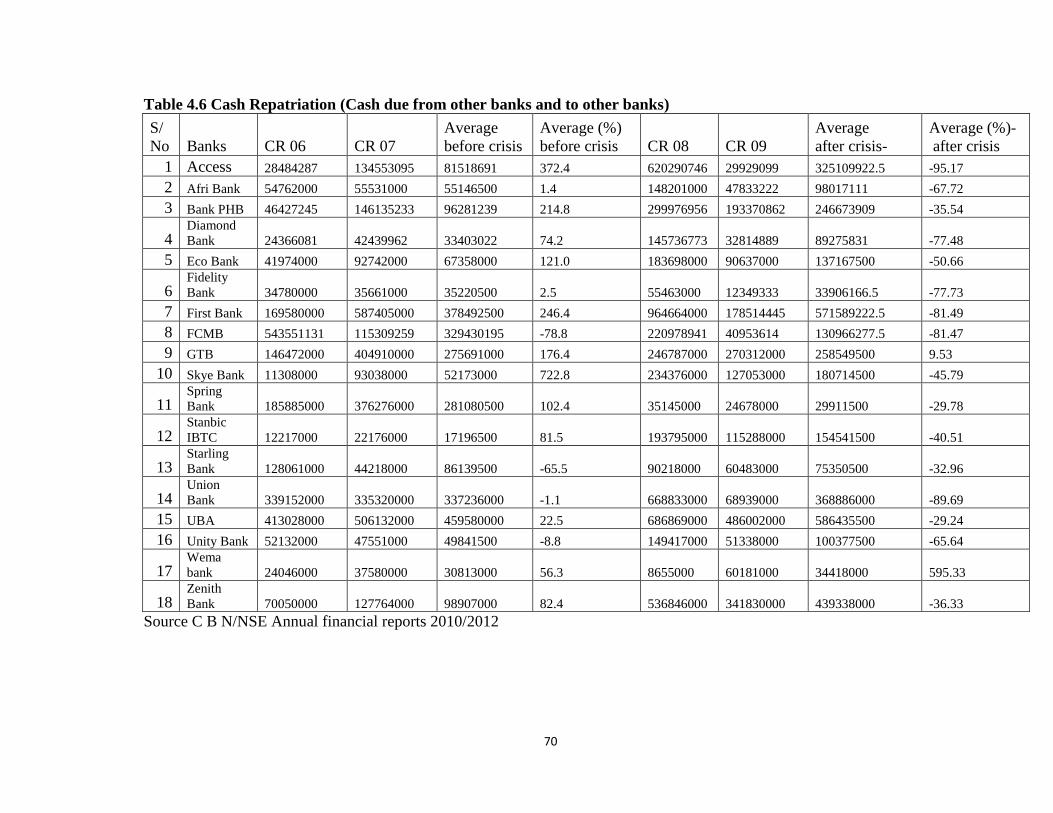
70
Table 4.6 Cash Repatriation (Cash due from other banks and to other banks)
S/
No Banks CR 06 CR 07
Average
before crisis
Average (%)
before crisis CR 08 CR 09
Average
after crisis-
Average (%)-
after crisis
1 Access 28484287 134553095 81518691 372.4 620290746 29929099 325109922.5 -95.17
2 Afri Bank 54762000 55531000 55146500 1.4 148201000 47833222 98017111 -67.72
3 Bank PHB 46427245 146135233 96281239 214.8 299976956 193370862 246673909 -35.54
4 Diamond
Bank 24366081 42439962 33403022 74.2 145736773 32814889 89275831 -77.48
5 Eco Bank 41974000 92742000 67358000 121.0 183698000 90637000 137167500 -50.66
6 Fidelity
Bank 34780000 35661000 35220500 2.5 55463000 12349333 33906166.5 -77.73
7 First Bank 169580000 587405000 378492500 246.4 964664000 178514445 571589222.5 -81.49
8 FCMB 543551131 115309259 329430195 -78.8 220978941 40953614 130966277.5 -81.47
9 GTB 146472000 404910000 275691000 176.4 246787000 270312000 258549500 9.53
10 Skye Bank 11308000 93038000 52173000 722.8 234376000 127053000 180714500 -45.79
11 Spring
Bank 185885000 376276000 281080500 102.4 35145000 24678000 29911500 -29.78
12 Stanbic
IBTC 12217000 22176000 17196500 81.5 193795000 115288000 154541500 -40.51
13 Starling
Bank 128061000 44218000 86139500 -65.5 90218000 60483000 75350500 -32.96
14 Union
Bank 339152000 335320000 337236000 -1.1 668833000 68939000 368886000 -89.69
15 UBA 413028000 506132000 459580000 22.5 686869000 486002000 586435500 -29.24
16 Unity Bank 52132000 47551000 49841500 -8.8 149417000 51338000 100377500 -65.64
17 Wema
bank 24046000 37580000 30813000 56.3 8655000 60181000 34418000 595.33
18 Zenith
Bank 70050000 127764000 98907000 82.4 536846000 341830000 439338000 -36.33
Source C B N/NSE Annual financial reports 2010/2012
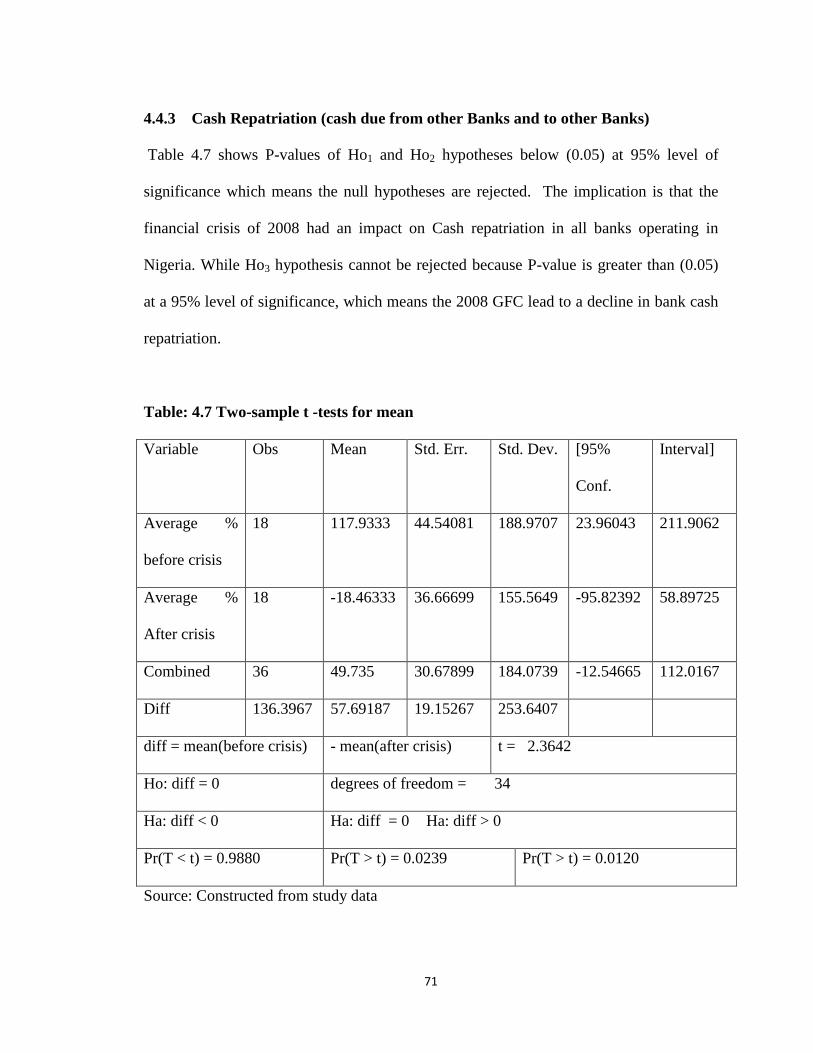
71
4.4.3 Cash Repatriation (cash due from other Banks and to other Banks)
Table 4.7 shows P-values of Ho1 and Ho2 hypotheses below (0.05) at 95% level of
significance which means the null hypotheses are rejected. The implication is that the
financial crisis of 2008 had an impact on Cash repatriation in all banks operating in
Nigeria. While Ho3 hypothesis cannot be rejected because P-value is greater than (0.05)
at a 95% level of significance, which means the 2008 GFC lead to a decline in bank cash
repatriation.
Table: 4.7 Two-sample t -tests for mean
Variable Obs Mean Std. Err. Std. Dev. [95%
Conf.
Interval]
Average %
before crisis
18 117.9333 44.54081 188.9707 23.96043 211.9062
Average %
After crisis
18 -18.46333 36.66699 155.5649 -95.82392 58.89725
Combined 36 49.735 30.67899 184.0739 -12.54665 112.0167
Diff 136.3967 57.69187 19.15267 253.6407
diff = mean(before crisis) - mean(after crisis) t = 2.3642
Ho: diff = 0 degrees of freedom = 34
Ha: diff < 0 Ha: diff = 0 Ha: diff > 0
Pr(T < t) = 0.9880 Pr(T > t) = 0.0239 Pr(T > t) = 0.0120
Source: Constructed from study data
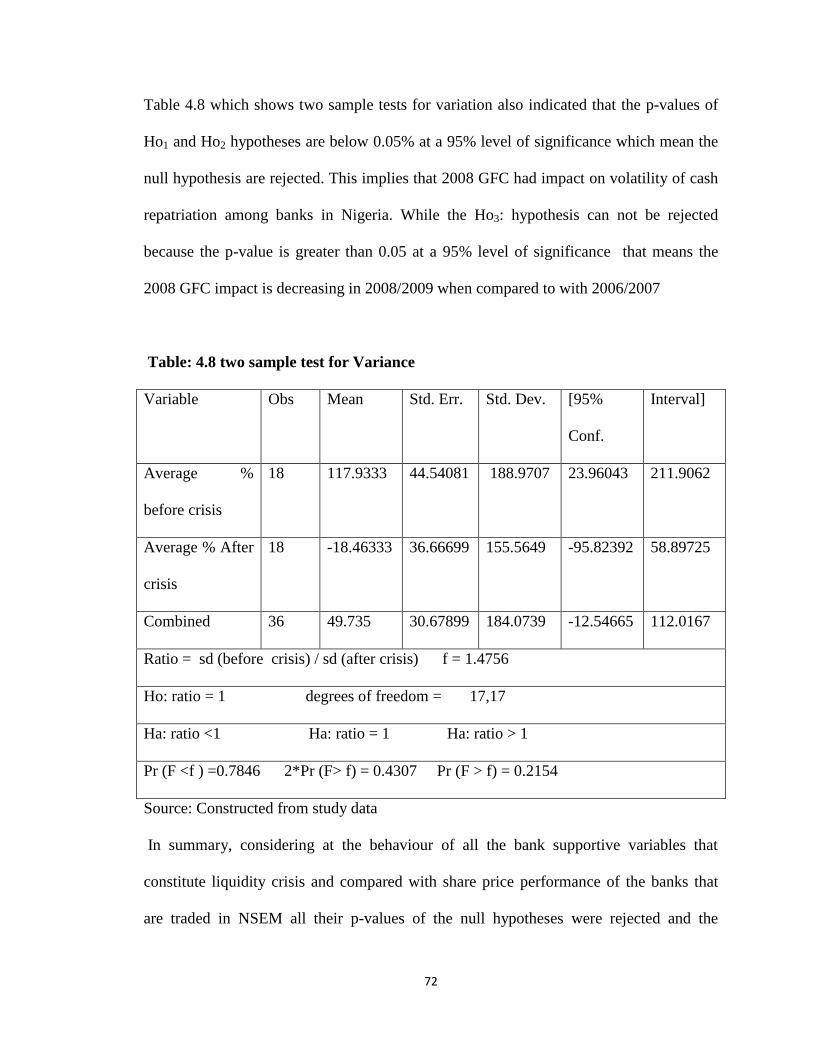
72
Table 4.8 which shows two sample tests for variation also indicated that the p-values of
Ho1 and Ho2 hypotheses are below 0.05% at a 95% level of significance which mean the
null hypothesis are rejected. This implies that 2008 GFC had impact on volatility of cash
repatriation among banks in Nigeria. While the Ho3: hypothesis can not be rejected
because the p-value is greater than 0.05 at a 95% level of significance that means the
2008 GFC impact is decreasing in 2008/2009 when compared to with 2006/2007
Table: 4.8 two sample test for Variance
Variable Obs Mean Std. Err. Std. Dev. [95%
Conf.
Interval]
Average %
before crisis
18 117.9333 44.54081 188.9707 23.96043 211.9062
Average % After
crisis
18 -18.46333 36.66699 155.5649 -95.82392 58.89725
Combined 36 49.735 30.67899 184.0739 -12.54665 112.0167
Ratio = sd (before crisis) / sd (after crisis) f = 1.4756
Ho: ratio = 1 degrees of freedom = 17,17
Ha: ratio <1 Ha: ratio = 1 Ha: ratio > 1
Pr (F <f ) =0.7846 2*Pr (F> f) = 0.4307 Pr (F > f) = 0.2154
Source: Constructed from study data
In summary, considering at the behaviour of all the bank supportive variables that
constitute liquidity crisis and compared with share price performance of the banks that
are traded in NSEM all their p-values of the null hypotheses were rejected and the
73
alternative are not rejected, that means that the GFC of 2008 had an effect on banks
shares price performance in NSEM.
4.5 Currency Crisis
The currency problem is captured by supportive variables like money in circulation,
exchange rate and level of bank funds transferred for either bank investment development
or by the banks customers at individual level within the period of the analysis 2006 to
2010.
Table 4.9 shows the general estimated value of money in circulation through banks
operation on a monthly basis in Billion Naira. However, these figures may not represent
the actual and correct figure of the money in circulation in the country because there are
other illegal ways through which money are circulated without government dictating it.
Therefore, this research assumed the figures is valuable and acceptable, since they were
official.
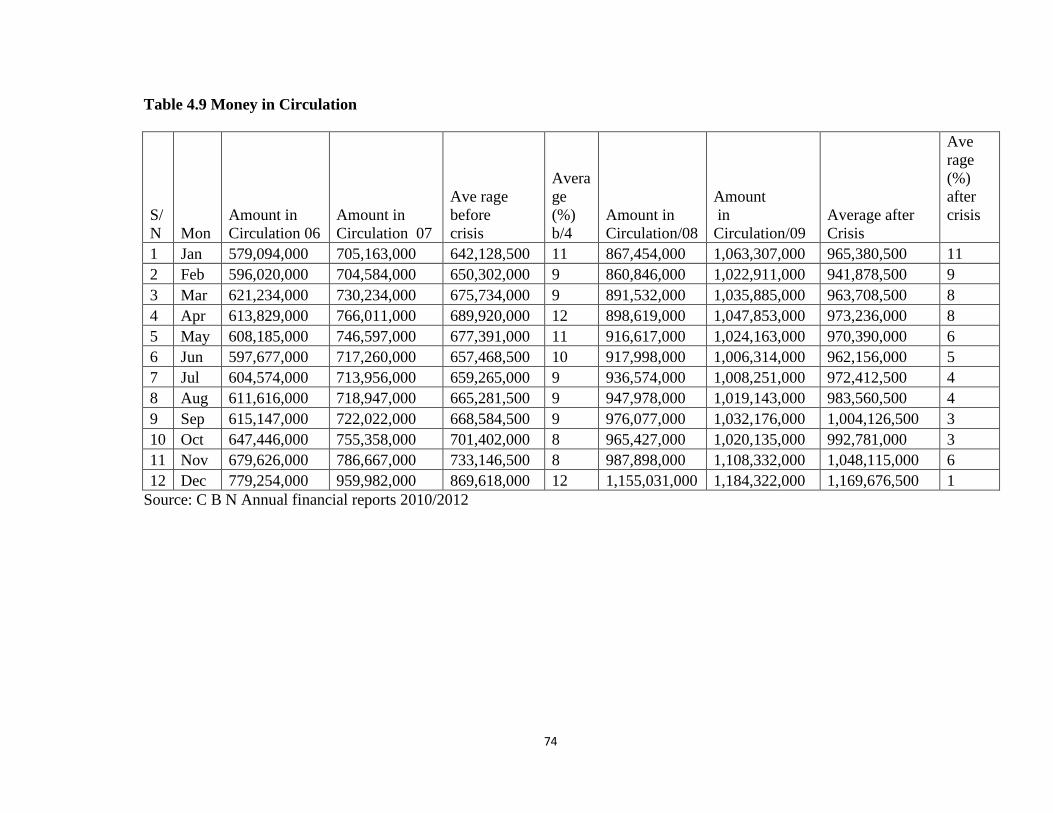
74
Table 4.9 Money in Circulation
S/
N Mon
Amount in
Circulation 06
Amount in
Circulation 07
Ave rage
before
crisis
Avera
ge
(%)
b/4
Amount in
Circulation/08
Amount
in
Circulation/09
Average after
Crisis
Ave
rage
(%)
after
crisis
1 Jan 579,094,000 705,163,000 642,128,500 11 867,454,000 1,063,307,000 965,380,500 11
2 Feb 596,020,000 704,584,000 650,302,000 9 860,846,000 1,022,911,000 941,878,500 9
3 Mar 621,234,000 730,234,000 675,734,000 9 891,532,000 1,035,885,000 963,708,500 8
4 Apr 613,829,000 766,011,000 689,920,000 12 898,619,000 1,047,853,000 973,236,000 8
5 May 608,185,000 746,597,000 677,391,000 11 916,617,000 1,024,163,000 970,390,000 6
6 Jun 597,677,000 717,260,000 657,468,500 10 917,998,000 1,006,314,000 962,156,000 5
7 Jul 604,574,000 713,956,000 659,265,000 9 936,574,000 1,008,251,000 972,412,500 4
8 Aug 611,616,000 718,947,000 665,281,500 9 947,978,000 1,019,143,000 983,560,500 4
9 Sep 615,147,000 722,022,000 668,584,500 9 976,077,000 1,032,176,000 1,004,126,500 3
10 Oct 647,446,000 755,358,000 701,402,000 8 965,427,000 1,020,135,000 992,781,000 3
11 Nov 679,626,000 786,667,000 733,146,500 8 987,898,000 1,108,332,000 1,048,115,000 6
12 Dec 779,254,000 959,982,000 869,618,000 12 1,155,031,000 1,184,322,000 1,169,676,500 1
Source: C B N Annual financial reports 2010/2012
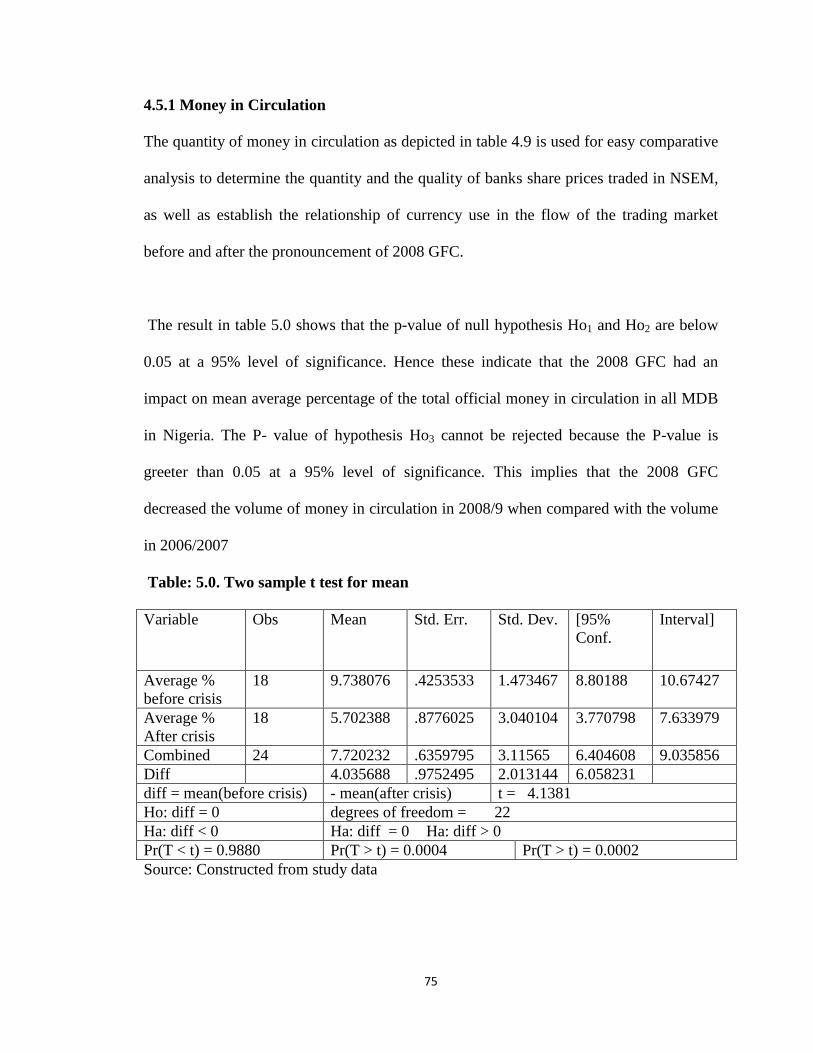
75
4.5.1 Money in Circulation
The quantity of money in circulation as depicted in table 4.9 is used for easy comparative
analysis to determine the quantity and the quality of banks share prices traded in NSEM,
as well as establish the relationship of currency use in the flow of the trading market
before and after the pronouncement of 2008 GFC.
The result in table 5.0 shows that the p-value of null hypothesis Ho1 and Ho2 are below
0.05 at a 95% level of significance. Hence these indicate that the 2008 GFC had an
impact on mean average percentage of the total official money in circulation in all MDB
in Nigeria. The P- value of hypothesis Ho3 cannot be rejected because the P-value is
greeter than 0.05 at a 95% level of significance. This implies that the 2008 GFC
decreased the volume of money in circulation in 2008/9 when compared with the volume
in 2006/2007
Table: 5.0. Two sample t test for mean
Variable Obs Mean Std. Err. Std. Dev. [95%
Conf.
Interval]
Average %
before crisis
18 9.738076 .4253533 1.473467 8.80188 10.67427
Average %
After crisis
18 5.702388 .8776025 3.040104 3.770798 7.633979
Combined 24 7.720232 .6359795 3.11565 6.404608 9.035856
Diff 4.035688 .9752495 2.013144 6.058231
diff = mean(before crisis) - mean(after crisis) t = 4.1381
Ho: diff = 0 degrees of freedom = 22
Ha: diff < 0 Ha: diff = 0 Ha: diff > 0
Pr(T < t) = 0.9880 Pr(T > t) = 0.0004 Pr(T > t) = 0.0002
Source: Constructed from study data
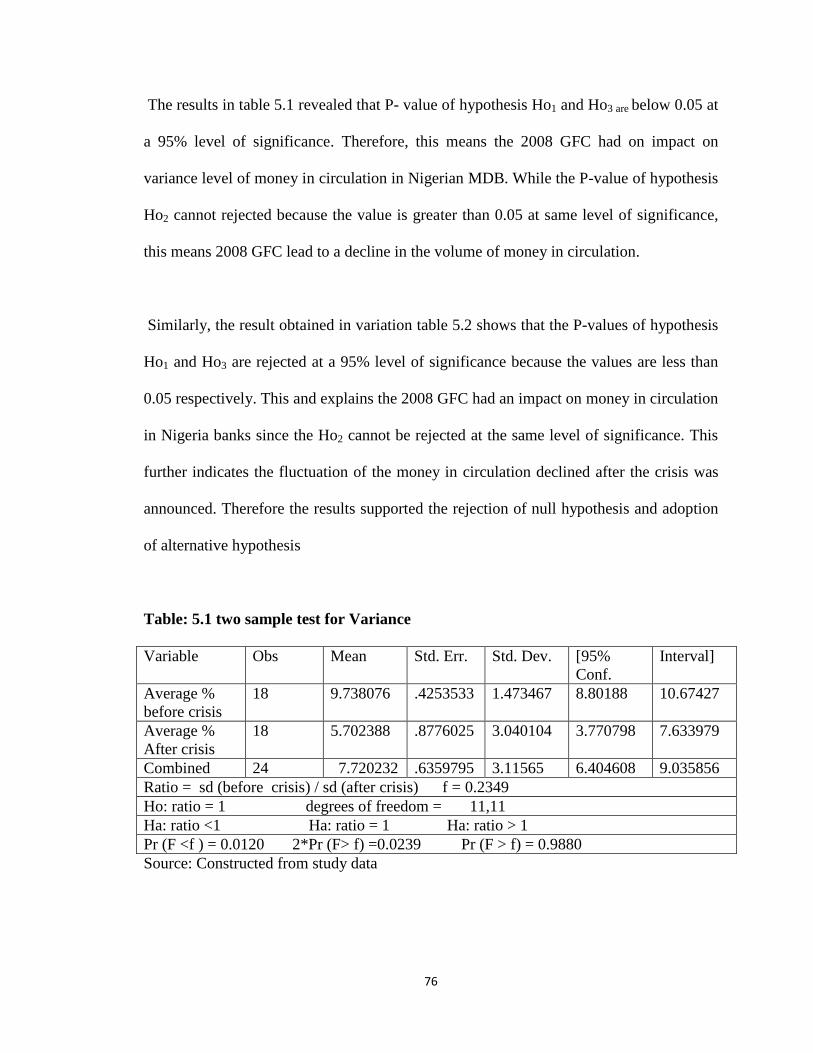
76
The results in table 5.1 revealed that P- value of hypothesis Ho1 and Ho3 are below 0.05 at
a 95% level of significance. Therefore, this means the 2008 GFC had on impact on
variance level of money in circulation in Nigerian MDB. While the P-value of hypothesis
Ho2 cannot rejected because the value is greater than 0.05 at same level of significance,
this means 2008 GFC lead to a decline in the volume of money in circulation.
Similarly, the result obtained in variation table 5.2 shows that the P-values of hypothesis
Ho1 and Ho3 are rejected at a 95% level of significance because the values are less than
0.05 respectively. This and explains the 2008 GFC had an impact on money in circulation
in Nigeria banks since the Ho2 cannot be rejected at the same level of significance. This
further indicates the fluctuation of the money in circulation declined after the crisis was
announced. Therefore the results supported the rejection of null hypothesis and adoption
of alternative hypothesis
Table: 5.1 two sample test for Variance
Variable Obs Mean Std. Err. Std. Dev. [95%
Conf.
Interval]
Average %
before crisis
18 9.738076 .4253533 1.473467 8.80188 10.67427
Average %
After crisis
18 5.702388 .8776025 3.040104 3.770798 7.633979
Combined 24 7.720232 .6359795 3.11565 6.404608 9.035856
Ratio = sd (before crisis) / sd (after crisis) f = 0.2349
Ho: ratio = 1 degrees of freedom = 11,11
Ha: ratio <1 Ha: ratio = 1 Ha: ratio > 1
Pr (F <f ) = 0.0120 2*Pr (F> f) =0.0239 Pr (F > f) = 0.9880
Source: Constructed from study data
77
Both the mean and the variable tables of the analysis indicated that the 2008 global
financial crisis directly affected cash in circulations in the Nigerian banking sector
specifically and the entire economy in general.
4.5.2 Exchange Rate
This is a monetary policy instrument which involves two or more different Countries
currency values for business exchange purpose. The policies differ from one country to
another as a result of micro and macroeconomic indices in operation. In this case Nigeria
Naira value is compared with US dollar as exchange rate because of the close inter-
relationship between the two countries in term of business and other economic policies.
Table 5.2 show the exchange rate movement per month, which was captured from 2006
to 2010 for the purpose of the analysis.
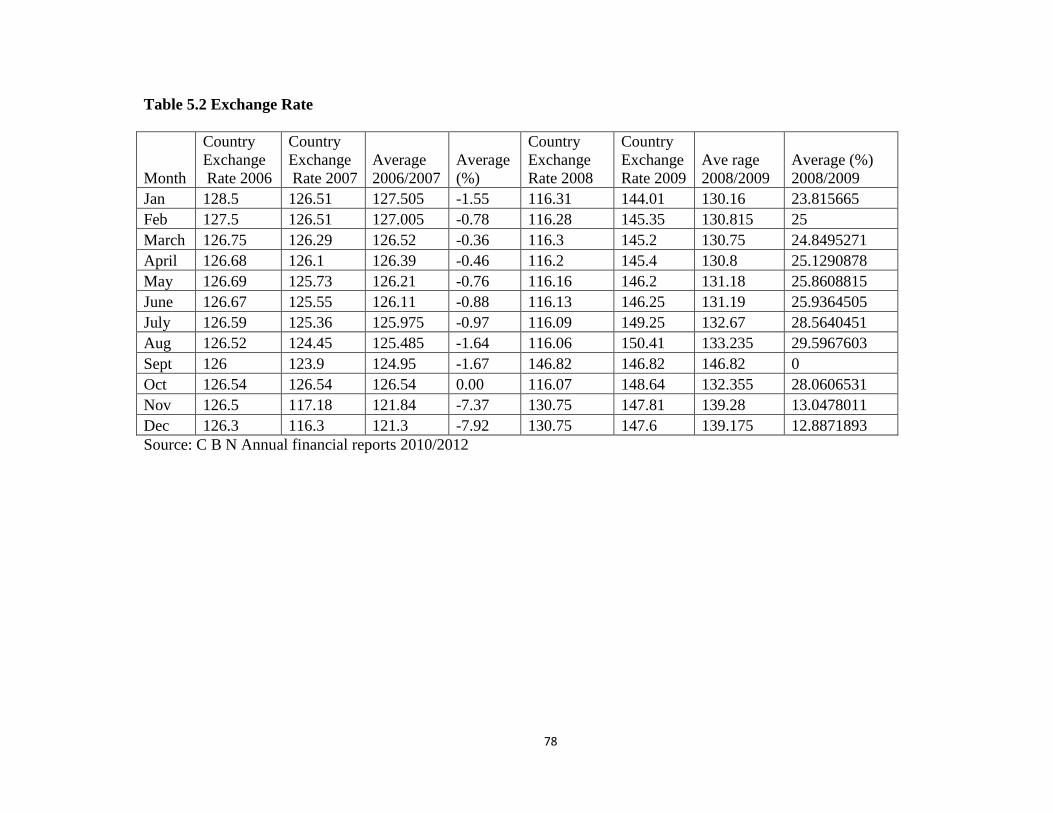
78
Table 5.2 Exchange Rate
Month
Country
Exchange
Rate 2006
Country
Exchange
Rate 2007
Average
2006/2007
Average
(%)
Country
Exchange
Rate 2008
Country
Exchange
Rate 2009
Ave rage
2008/2009
Average (%)
2008/2009
Jan 128.5 126.51 127.505 -1.55 116.31 144.01 130.16 23.815665
Feb 127.5 126.51 127.005 -0.78 116.28 145.35 130.815 25
March 126.75 126.29 126.52 -0.36 116.3 145.2 130.75 24.8495271
April 126.68 126.1 126.39 -0.46 116.2 145.4 130.8 25.1290878
May 126.69 125.73 126.21 -0.76 116.16 146.2 131.18 25.8608815
June 126.67 125.55 126.11 -0.88 116.13 146.25 131.19 25.9364505
July 126.59 125.36 125.975 -0.97 116.09 149.25 132.67 28.5640451
Aug 126.52 124.45 125.485 -1.64 116.06 150.41 133.235 29.5967603
Sept 126 123.9 124.95 -1.67 146.82 146.82 146.82 0
Oct 126.54 126.54 126.54 0.00 116.07 148.64 132.355 28.0606531
Nov 126.5 117.18 121.84 -7.37 130.75 147.81 139.28 13.0478011
Dec 126.3 116.3 121.3 -7.92 130.75 147.6 139.175 12.8871893
Source: C B N Annual financial reports 2010/2012
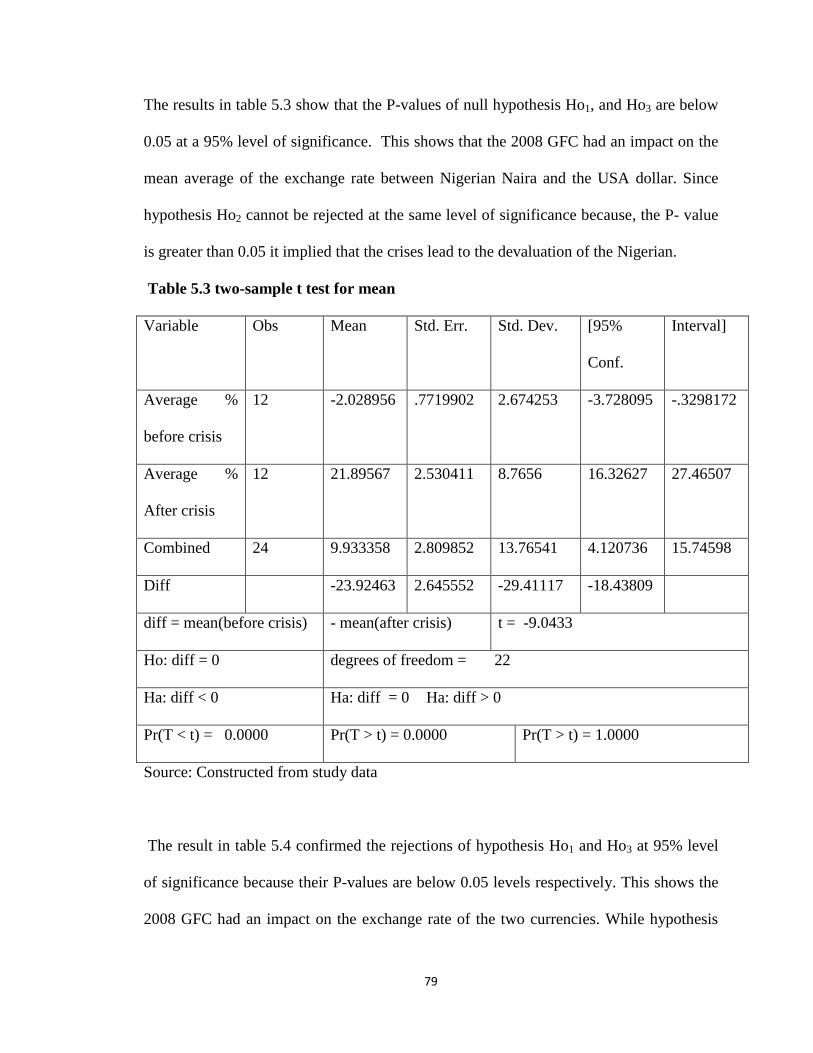
79
The results in table 5.3 show that the P-values of null hypothesis Ho1, and Ho3 are below
0.05 at a 95% level of significance. This shows that the 2008 GFC had an impact on the
mean average of the exchange rate between Nigerian Naira and the USA dollar. Since
hypothesis Ho2 cannot be rejected at the same level of significance because, the P- value
is greater than 0.05 it implied that the crises lead to the devaluation of the Nigerian.
Table 5.3 two-sample t test for mean
Variable Obs Mean Std. Err. Std. Dev. [95%
Conf.
Interval]
Average %
before crisis
12 -2.028956 .7719902 2.674253 -3.728095 -.3298172
Average %
After crisis
12 21.89567 2.530411 8.7656 16.32627 27.46507
Combined 24 9.933358 2.809852 13.76541 4.120736 15.74598
Diff -23.92463 2.645552 -29.41117 -18.43809
diff = mean(before crisis) - mean(after crisis) t = -9.0433
Ho: diff = 0 degrees of freedom = 22
Ha: diff < 0 Ha: diff = 0 Ha: diff > 0
Pr(T < t) = 0.0000 Pr(T > t) = 0.0000 Pr(T > t) = 1.0000
Source: Constructed from study data
The result in table 5.4 confirmed the rejections of hypothesis Ho1 and Ho3 at 95% level
of significance because their P-values are below 0.05 levels respectively. This shows the
2008 GFC had an impact on the exchange rate of the two currencies. While hypothesis
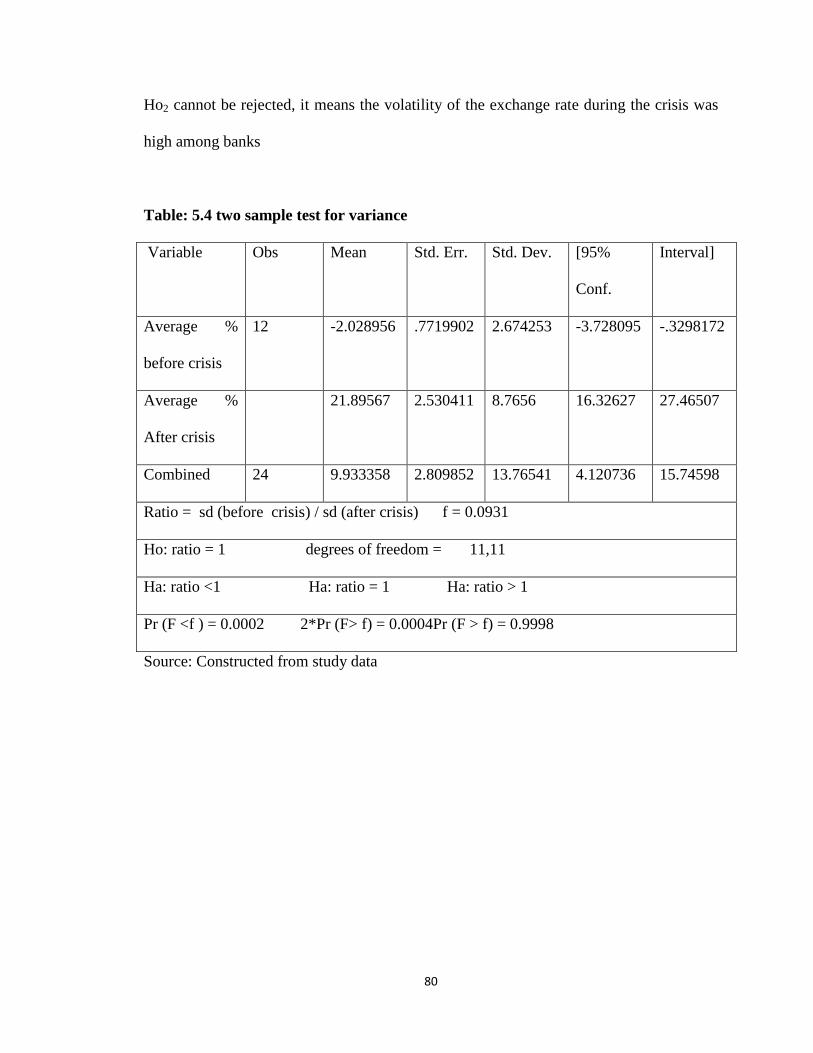
80
Ho2 cannot be rejected, it means the volatility of the exchange rate during the crisis was
high among banks
Table: 5.4 two sample test for variance
Variable Obs Mean Std. Err. Std. Dev. [95%
Conf.
Interval]
Average %
before crisis
12 -2.028956 .7719902 2.674253 -3.728095 -.3298172
Average %
After crisis
21.89567 2.530411 8.7656 16.32627 27.46507
Combined 24 9.933358 2.809852 13.76541 4.120736 15.74598
Ratio = sd (before crisis) / sd (after crisis) f = 0.0931
Ho: ratio = 1 degrees of freedom = 11,11
Ha: ratio <1 Ha: ratio = 1 Ha: ratio > 1
Pr (F <f ) = 0.0002 2*Pr (F> f) = 0.0004Pr (F > f) = 0.9998
Source: Constructed from study data
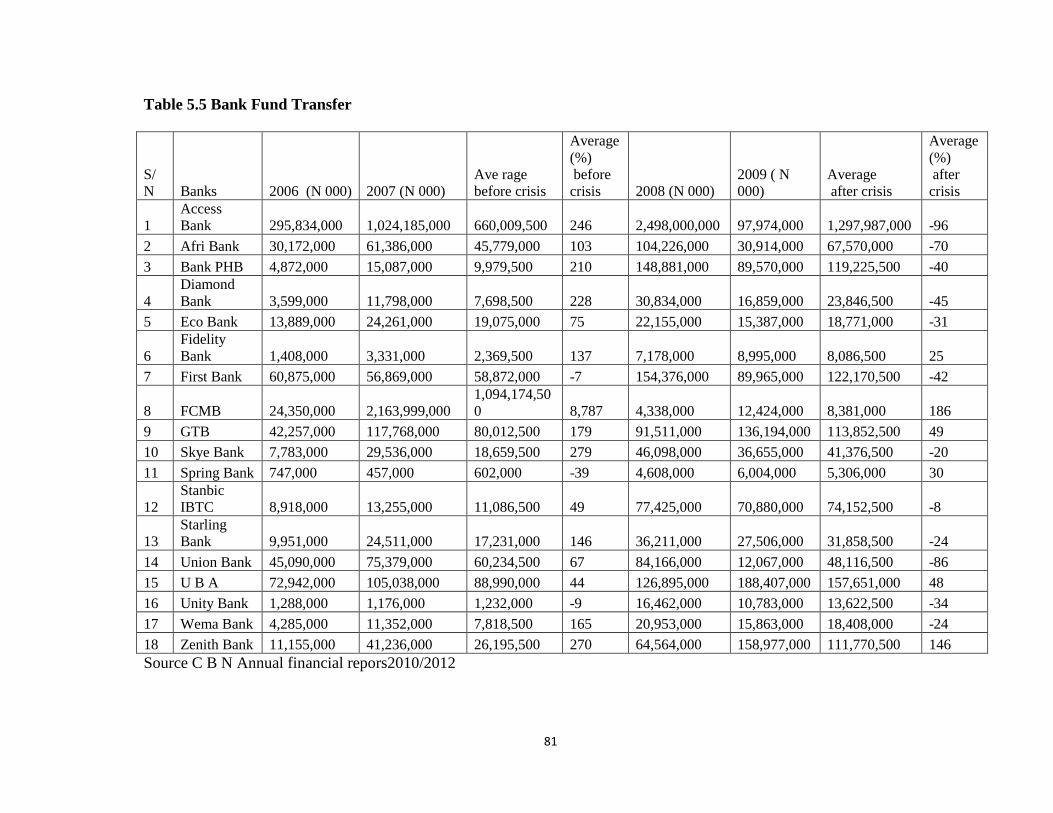
81
Table 5.5 Bank Fund Transfer
S/
N Banks 2006 (N 000) 2007 (N 000)
Ave rage
before crisis
Average
(%)
before
crisis 2008 (N 000)
2009 ( N
000)
Average
after crisis
Average
(%)
after
crisis
1
Access
Bank 295,834,000 1,024,185,000 660,009,500 246 2,498,000,000 97,974,000 1,297,987,000 -96
2 Afri Bank 30,172,000 61,386,000 45,779,000 103 104,226,000 30,914,000 67,570,000 -70
3 Bank PHB 4,872,000 15,087,000 9,979,500 210 148,881,000 89,570,000 119,225,500 -40
4
Diamond
Bank 3,599,000 11,798,000 7,698,500 228 30,834,000 16,859,000 23,846,500 -45
5 Eco Bank 13,889,000 24,261,000 19,075,000 75 22,155,000 15,387,000 18,771,000 -31
6
Fidelity
Bank 1,408,000 3,331,000 2,369,500 137 7,178,000 8,995,000 8,086,500 25
7 First Bank 60,875,000 56,869,000 58,872,000 -7 154,376,000 89,965,000 122,170,500 -42
8 FCMB 24,350,000 2,163,999,000
1,094,174,50
0 8,787 4,338,000 12,424,000 8,381,000 186
9 GTB 42,257,000 117,768,000 80,012,500 179 91,511,000 136,194,000 113,852,500 49
10 Skye Bank 7,783,000 29,536,000 18,659,500 279 46,098,000 36,655,000 41,376,500 -20
11 Spring Bank 747,000 457,000 602,000 -39 4,608,000 6,004,000 5,306,000 30
12
Stanbic
IBTC 8,918,000 13,255,000 11,086,500 49 77,425,000 70,880,000 74,152,500 -8
13
Starling
Bank 9,951,000 24,511,000 17,231,000 146 36,211,000 27,506,000 31,858,500 -24
14 Union Bank 45,090,000 75,379,000 60,234,500 67 84,166,000 12,067,000 48,116,500 -86
15 U B A 72,942,000 105,038,000 88,990,000 44 126,895,000 188,407,000 157,651,000 48
16 Unity Bank 1,288,000 1,176,000 1,232,000 -9 16,462,000 10,783,000 13,622,500 -34
17 Wema Bank 4,285,000 11,352,000 7,818,500 165 20,953,000 15,863,000 18,408,000 -24
18 Zenith Bank 11,155,000 41,236,000 26,195,500 270 64,564,000 158,977,000 111,770,500 146
Source C B N Annual financial repors2010/2012
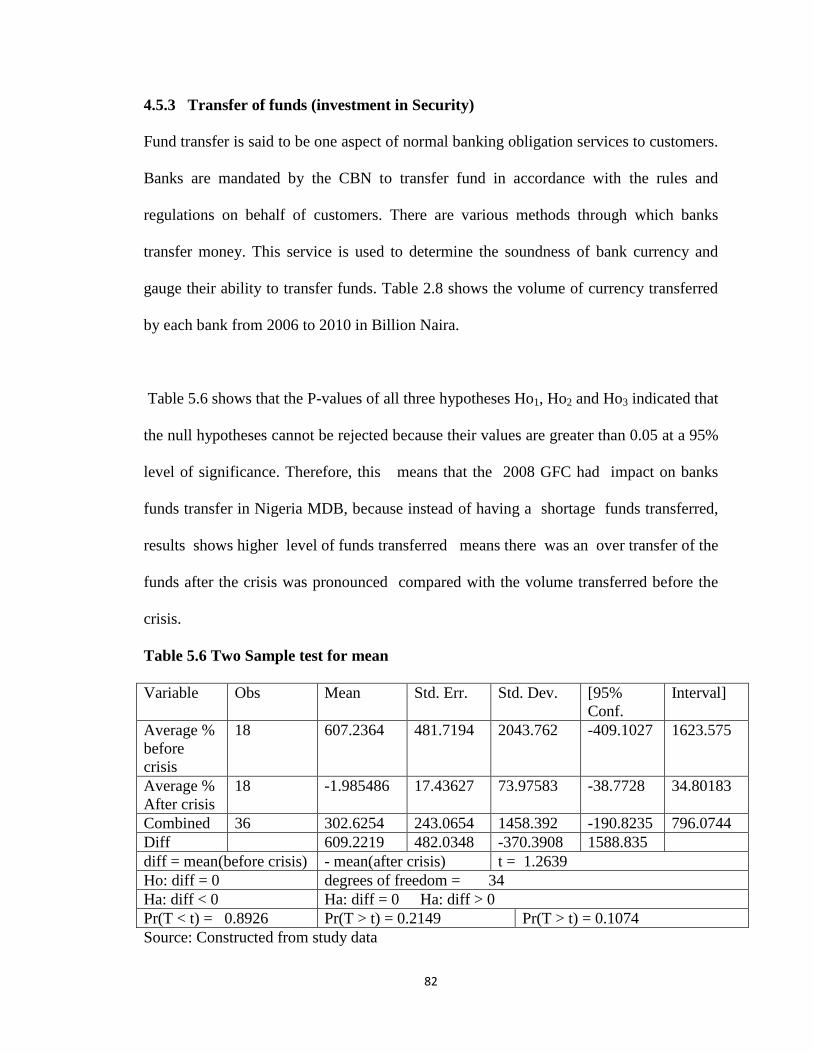
82
4.5.3 Transfer of funds (investment in Security)
Fund transfer is said to be one aspect of normal banking obligation services to customers.
Banks are mandated by the CBN to transfer fund in accordance with the rules and
regulations on behalf of customers. There are various methods through which banks
transfer money. This service is used to determine the soundness of bank currency and
gauge their ability to transfer funds. Table 2.8 shows the volume of currency transferred
by each bank from 2006 to 2010 in Billion Naira.
Table 5.6 shows that the P-values of all three hypotheses Ho1, Ho2 and Ho3 indicated that
the null hypotheses cannot be rejected because their values are greater than 0.05 at a 95%
level of significance. Therefore, this means that the 2008 GFC had impact on banks
funds transfer in Nigeria MDB, because instead of having a shortage funds transferred,
results shows higher level of funds transferred means there was an over transfer of the
funds after the crisis was pronounced compared with the volume transferred before the
crisis.
Table 5.6 Two Sample test for mean
Variable Obs Mean Std. Err. Std. Dev. [95%
Conf.
Interval]
Average %
before
crisis
18 607.2364 481.7194 2043.762 -409.1027 1623.575
Average %
After crisis
18 -1.985486 17.43627 73.97583 -38.7728 34.80183
Combined 36 302.6254 243.0654 1458.392 -190.8235 796.0744
Diff 609.2219 482.0348 -370.3908 1588.835
diff = mean(before crisis) - mean(after crisis) t = 1.2639
Ho: diff = 0 degrees of freedom = 34
Ha: diff < 0 Ha: diff = 0 Ha: diff > 0
Pr(T < t) = 0.8926 Pr(T > t) = 0.2149 Pr(T > t) = 0.1074
Source: Constructed from study data
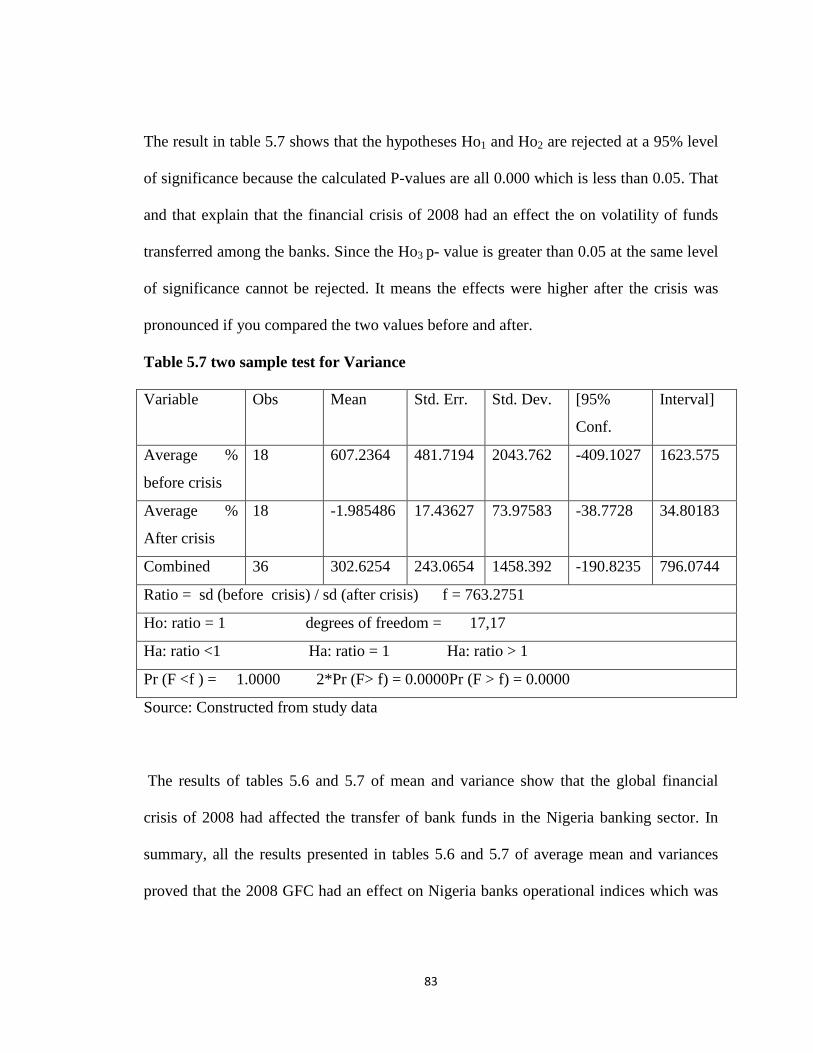
83
The result in table 5.7 shows that the hypotheses Ho1 and Ho2 are rejected at a 95% level
of significance because the calculated P-values are all 0.000 which is less than 0.05. That
and that explain that the financial crisis of 2008 had an effect the on volatility of funds
transferred among the banks. Since the Ho3 p- value is greater than 0.05 at the same level
of significance cannot be rejected. It means the effects were higher after the crisis was
pronounced if you compared the two values before and after.
Table 5.7 two sample test for Variance
Variable Obs Mean Std. Err. Std. Dev. [95%
Conf.
Interval]
Average %
before crisis
18 607.2364 481.7194 2043.762 -409.1027 1623.575
Average %
After crisis
18 -1.985486 17.43627 73.97583 -38.7728 34.80183
Combined 36 302.6254 243.0654 1458.392 -190.8235 796.0744
Ratio = sd (before crisis) / sd (after crisis) f = 763.2751
Ho: ratio = 1 degrees of freedom = 17,17
Ha: ratio <1 Ha: ratio = 1 Ha: ratio > 1
Pr (F <f ) = 1.0000 2*Pr (F> f) = 0.0000Pr (F > f) = 0.0000
Source: Constructed from study data
The results of tables 5.6 and 5.7 of mean and variance show that the global financial
crisis of 2008 had affected the transfer of bank funds in the Nigeria banking sector. In
summary, all the results presented in tables 5.6 and 5.7 of average mean and variances
proved that the 2008 GFC had an effect on Nigeria banks operational indices which was
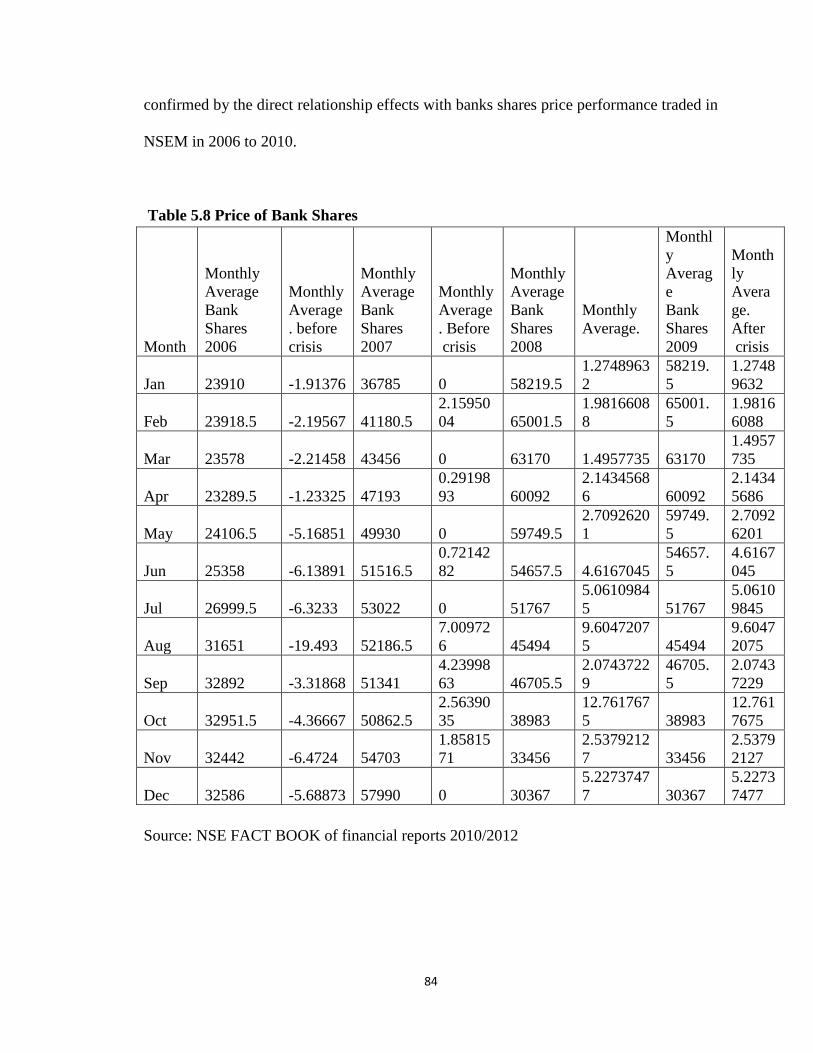
84
confirmed by the direct relationship effects with banks shares price performance traded in
NSEM in 2006 to 2010.
Table 5.8 Price of Bank Shares
Month
Monthly
Average
Bank
Shares
2006
Monthly
Average
. before
crisis
Monthly
Average
Bank
Shares
2007
Monthly
Average
. Before
crisis
Monthly
Average
Bank
Shares
2008
Monthly
Average.
Monthl
y
Averag
e
Bank
Shares
2009
Month
ly
Avera
ge.
After
crisis
Jan 23910 -1.91376 36785 0 58219.5
1.2748963
2
58219.
5
1.2748
9632
Feb 23918.5 -2.19567 41180.5
2.15950
04 65001.5
1.9816608
8
65001.
5
1.9816
6088
Mar 23578 -2.21458 43456 0 63170 1.4957735 63170
1.4957
735
Apr 23289.5 -1.23325 47193
0.29198
93 60092
2.1434568
6 60092
2.1434
5686
May 24106.5 -5.16851 49930 0 59749.5
2.7092620
1
59749.
5
2.7092
6201
Jun 25358 -6.13891 51516.5
0.72142
82 54657.5 4.6167045
54657.
5
4.6167
045
Jul 26999.5 -6.3233 53022 0 51767
5.0610984
5 51767
5.0610
9845
Aug 31651 -19.493 52186.5
7.00972
6 45494
9.6047207
5 45494
9.6047
2075
Sep 32892 -3.31868 51341
4.23998
63 46705.5
2.0743722
9
46705.
5
2.0743
7229
Oct 32951.5 -4.36667 50862.5
2.56390
35 38983
12.761767
5 38983
12.761
7675
Nov 32442 -6.4724 54703
1.85815
71 33456
2.5379212
7 33456
2.5379
2127
Dec 32586 -5.68873 57990 0 30367
5.2273747
7 30367
5.2273
7477
Source: NSE FACT BOOK of financial reports 2010/2012
85
4.6 Fluctuation of Share Price
Share price fluctuation is captured by price index, volatility of the shares from volume
and value point within the period under review. Table 5.8 captured the movement of bank
shares on monthly basis out of the total shares traded in the stock market, with an
indicator, indicating average mean and average percentage of variables before and after
the crisis covering 2006 to 2010 financial years.
4.6.1 Price Index
Price index is an independent variable that gives a highlight on how the price of the
bank shares changes in particular period of time with special consideration to 2006/
2007 as a period before the crisis pronouncement and 2008 / 2009 as period after the
crisis.
The result in table 5.9 show that the P-values hypotheses Ho1 and Ho3 are rejected at
95% level of significance because their P-values are less than 0.05. That explained that
the financial crisis of 2008 had an effect on the price of bank shares traded in NSEM.
Since hypothesis Ho2 cannot be rejected because the P- value is greater than 0.05 at a
95% level of significance it means that, the financial crisis of 2008 lead to an increase in
the mean percentage of banks shares price. This can be further explaining in line with as
the principles of devaluation theory, of Neo classical economist.
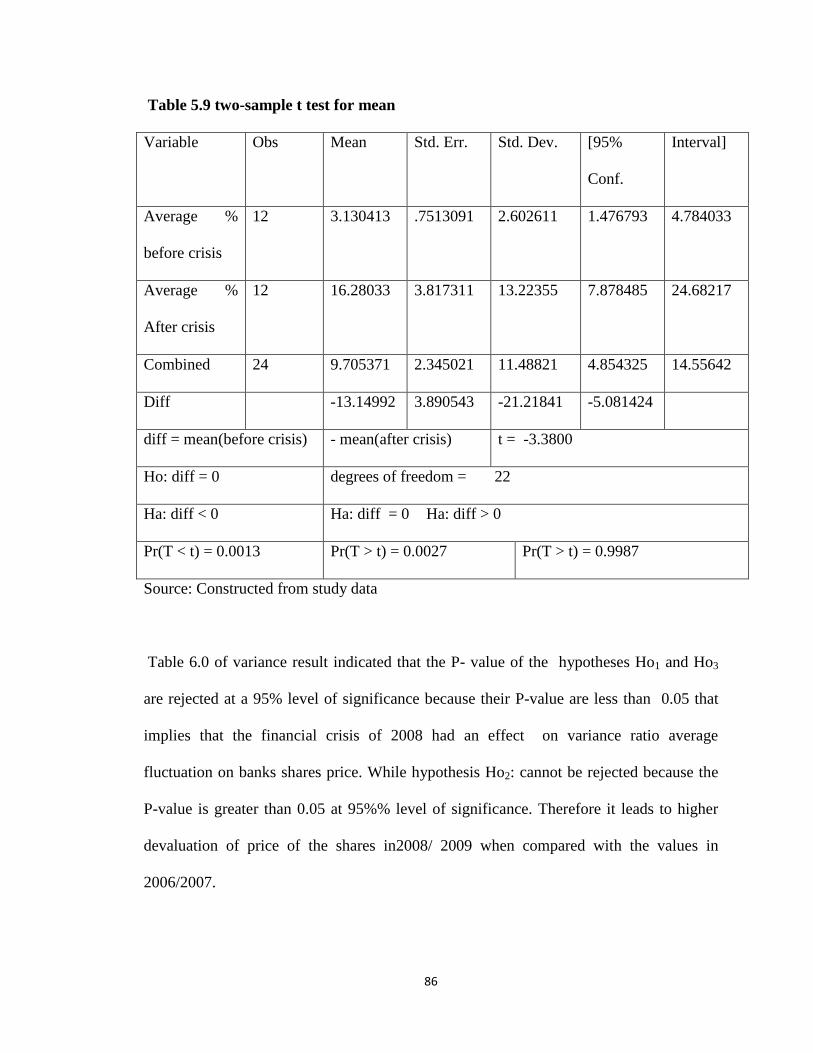
86
Table 5.9 two-sample t test for mean
Variable Obs Mean Std. Err. Std. Dev. [95%
Conf.
Interval]
Average %
before crisis
12 3.130413 .7513091 2.602611 1.476793 4.784033
Average %
After crisis
12 16.28033 3.817311 13.22355 7.878485 24.68217
Combined 24 9.705371 2.345021 11.48821 4.854325 14.55642
Diff -13.14992 3.890543 -21.21841 -5.081424
diff = mean(before crisis) - mean(after crisis) t = -3.3800
Ho: diff = 0 degrees of freedom = 22
Ha: diff < 0 Ha: diff = 0 Ha: diff > 0
Pr(T < t) = 0.0013 Pr(T > t) = 0.0027 Pr(T > t) = 0.9987
Source: Constructed from study data
Table 6.0 of variance result indicated that the P- value of the hypotheses Ho1 and Ho3
are rejected at a 95% level of significance because their P-value are less than 0.05 that
implies that the financial crisis of 2008 had an effect on variance ratio average
fluctuation on banks shares price. While hypothesis Ho2: cannot be rejected because the
P-value is greater than 0.05 at 95%% level of significance. Therefore it leads to higher
devaluation of price of the shares in2008/ 2009 when compared with the values in
2006/2007.
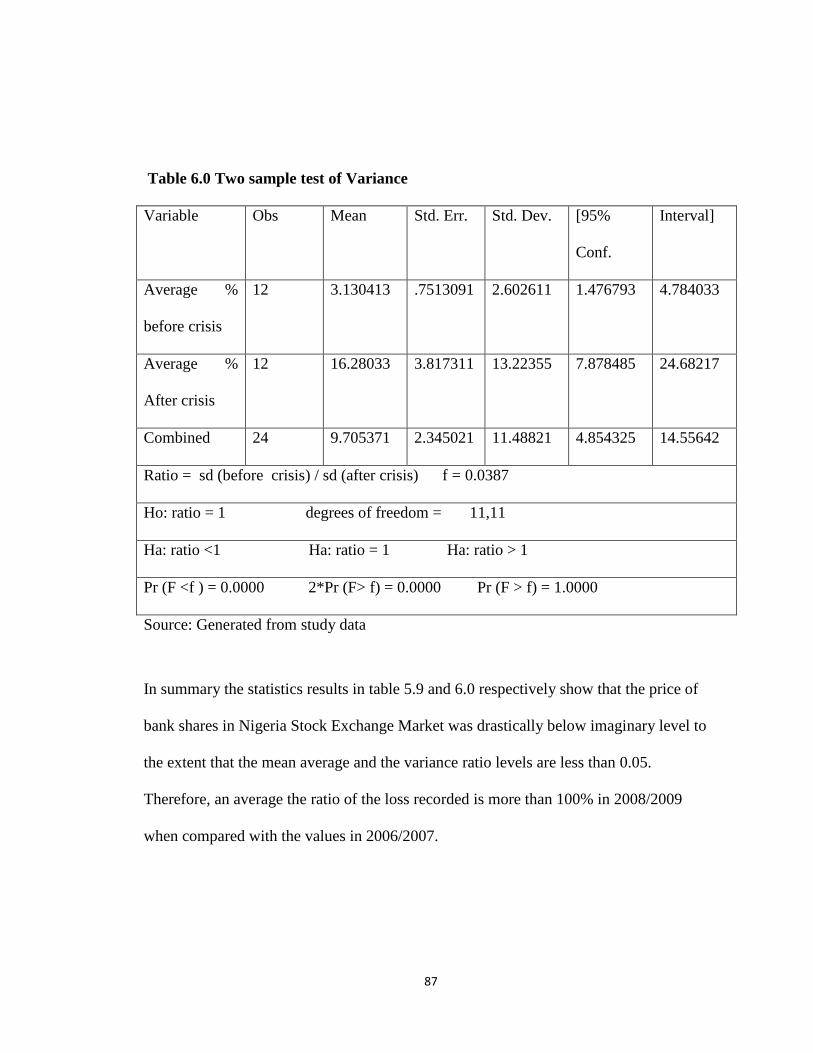
87
Table 6.0 Two sample test of Variance
Variable Obs Mean Std. Err. Std. Dev. [95%
Conf.
Interval]
Average %
before crisis
12 3.130413 .7513091 2.602611 1.476793 4.784033
Average %
After crisis
12 16.28033 3.817311 13.22355 7.878485 24.68217
Combined 24 9.705371 2.345021 11.48821 4.854325 14.55642
Ratio = sd (before crisis) / sd (after crisis) f = 0.0387
Ho: ratio = 1 degrees of freedom = 11,11
Ha: ratio <1 Ha: ratio = 1 Ha: ratio > 1
Pr (F <f ) = 0.0000 2*Pr (F> f) = 0.0000 Pr (F > f) = 1.0000
Source: Generated from study data
In summary the statistics results in table 5.9 and 6.0 respectively show that the price of
bank shares in Nigeria Stock Exchange Market was drastically below imaginary level to
the extent that the mean average and the variance ratio levels are less than 0.05.
Therefore, an average the ratio of the loss recorded is more than 100% in 2008/2009
when compared with the values in 2006/2007.
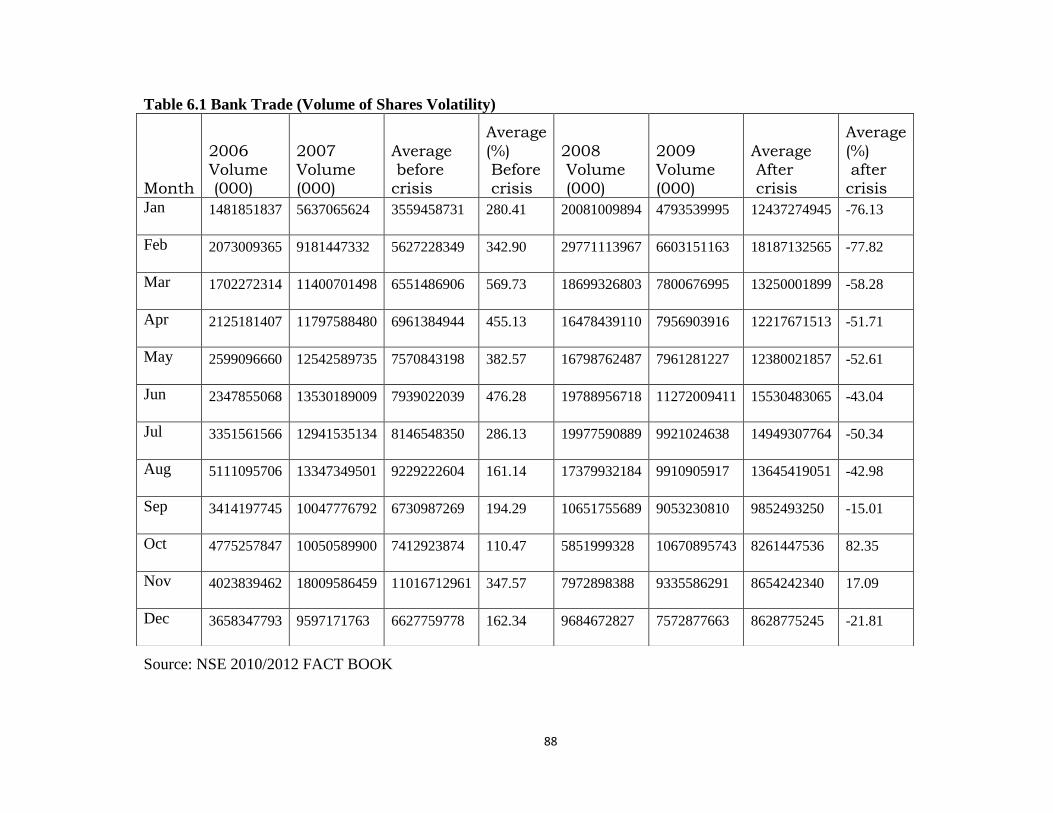
88
Table 6.1 Bank Trade (Volume of Shares Volatility)
Source: NSE 2010/2012 FACT BOOK
Month
2006 Volume (000)
2007 Volume (000)
Average before crisis
Average
(%) Before crisis
2008 Volume (000)
2009 Volume (000)
Average After crisis
Average
(%) after crisis
Jan 1481851837 5637065624 3559458731 280.41 20081009894 4793539995 12437274945 -76.13
Feb 2073009365 9181447332 5627228349 342.90 29771113967 6603151163 18187132565 -77.82
Mar 1702272314 11400701498 6551486906 569.73 18699326803 7800676995 13250001899 -58.28
Apr 2125181407 11797588480 6961384944 455.13 16478439110 7956903916 12217671513 -51.71
May 2599096660 12542589735 7570843198 382.57 16798762487 7961281227 12380021857 -52.61
Jun 2347855068 13530189009 7939022039 476.28 19788956718 11272009411 15530483065 -43.04
Jul 3351561566 12941535134 8146548350 286.13 19977590889 9921024638 14949307764 -50.34
Aug 5111095706 13347349501 9229222604 161.14 17379932184 9910905917 13645419051 -42.98
Sep 3414197745 10047776792 6730987269 194.29 10651755689 9053230810 9852493250 -15.01
Oct 4775257847 10050589900 7412923874 110.47 5851999328 10670895743 8261447536 82.35
Nov 4023839462 18009586459 11016712961 347.57 7972898388 9335586291 8654242340 17.09
Dec 3658347793 9597171763 6627759778 162.34 9684672827 7572877663 8628775245 -21.81
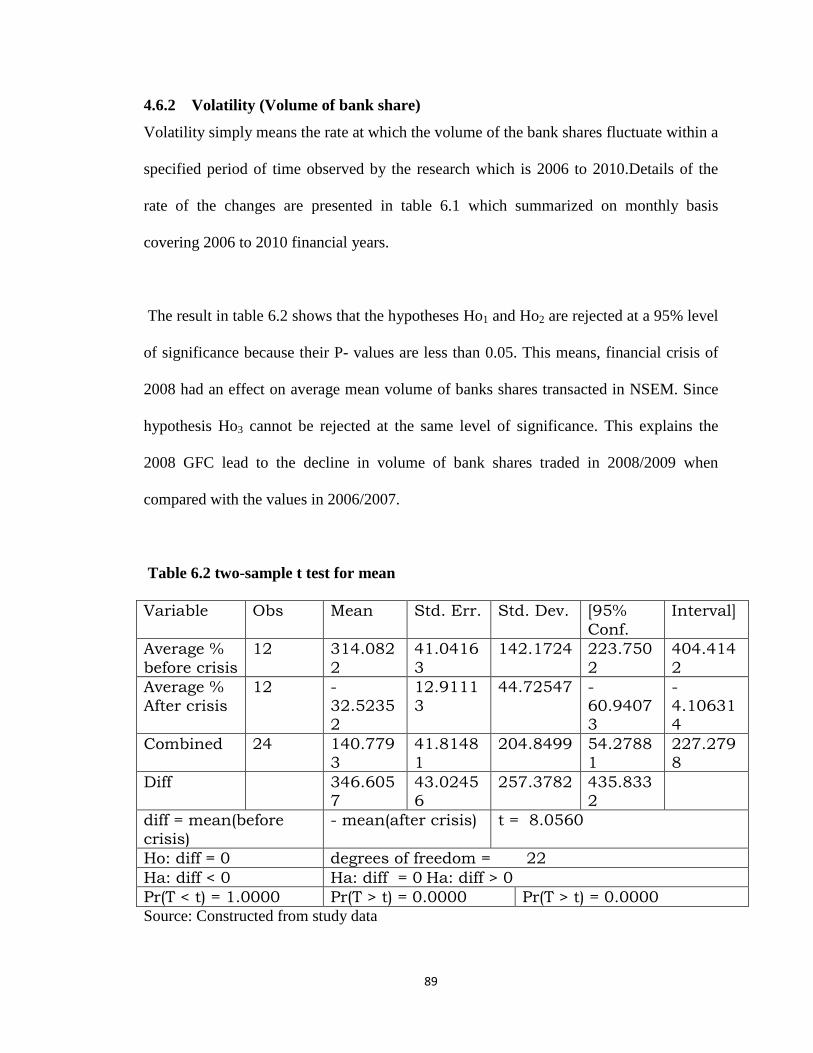
89
4.6.2 Volatility (Volume of bank share)
Volatility simply means the rate at which the volume of the bank shares fluctuate within a
specified period of time observed by the research which is 2006 to 2010.Details of the
rate of the changes are presented in table 6.1 which summarized on monthly basis
covering 2006 to 2010 financial years.
The result in table 6.2 shows that the hypotheses Ho1 and Ho2 are rejected at a 95% level
of significance because their P- values are less than 0.05. This means, financial crisis of
2008 had an effect on average mean volume of banks shares transacted in NSEM. Since
hypothesis Ho3 cannot be rejected at the same level of significance. This explains the
2008 GFC lead to the decline in volume of bank shares traded in 2008/2009 when
compared with the values in 2006/2007.
Table 6.2 two-sample t test for mean
Variable Obs Mean Std. Err. Std. Dev. [95%
Conf.
Interval]
Average %
before crisis
12 314.082
2
41.0416
3
142.1724 223.750
2
404.414
2
Average %
After crisis
12 -
32.52352
12.9111
3
44.72547 -
60.94073
-
4.106314
Combined 24 140.7793
41.81481
204.8499 54.27881
227.2798
Diff 346.6057
43.02456
257.3782 435.8332
diff = mean(before
crisis)
- mean(after crisis) t = 8.0560
Ho: diff = 0 degrees of freedom = 22
Ha: diff < 0 Ha: diff = 0 Ha: diff > 0
Pr(T < t) = 1.0000 Pr(T > t) = 0.0000 Pr(T > t) = 0.0000
Source: Constructed from study data
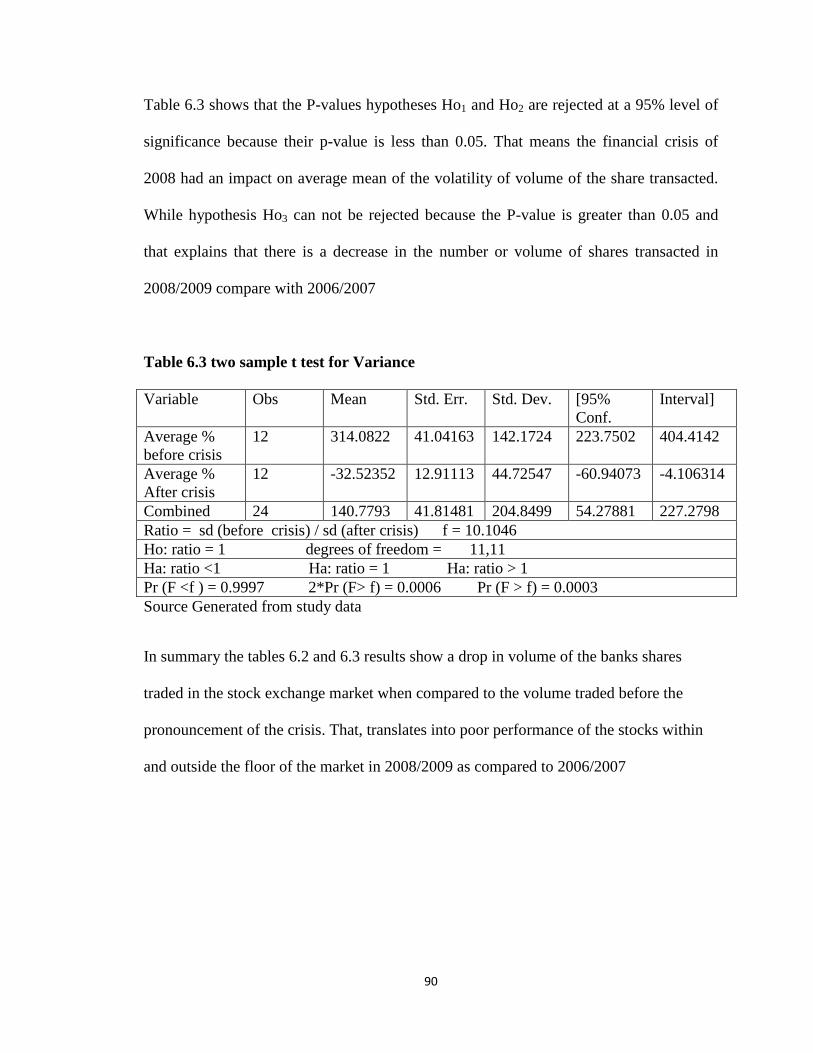
90
Table 6.3 shows that the P-values hypotheses Ho1 and Ho2 are rejected at a 95% level of
significance because their p-value is less than 0.05. That means the financial crisis of
2008 had an impact on average mean of the volatility of volume of the share transacted.
While hypothesis Ho3 can not be rejected because the P-value is greater than 0.05 and
that explains that there is a decrease in the number or volume of shares transacted in
2008/2009 compare with 2006/2007
Table 6.3 two sample t test for Variance
Variable Obs Mean Std. Err. Std. Dev. [95%
Conf.
Interval]
Average %
before crisis
12 314.0822 41.04163 142.1724 223.7502 404.4142
Average %
After crisis
12 -32.52352 12.91113 44.72547 -60.94073 -4.106314
Combined 24 140.7793 41.81481 204.8499 54.27881 227.2798
Ratio = sd (before crisis) / sd (after crisis) f = 10.1046
Ho: ratio = 1 degrees of freedom = 11,11
Ha: ratio <1 Ha: ratio = 1 Ha: ratio > 1
Pr (F <f ) = 0.9997 2*Pr (F> f) = 0.0006 Pr (F > f) = 0.0003
Source Generated from study data
In summary the tables 6.2 and 6.3 results show a drop in volume of the banks shares
traded in the stock exchange market when compared to the volume traded before the
pronouncement of the crisis. That, translates into poor performance of the stocks within
and outside the floor of the market in 2008/2009 as compared to 2006/2007
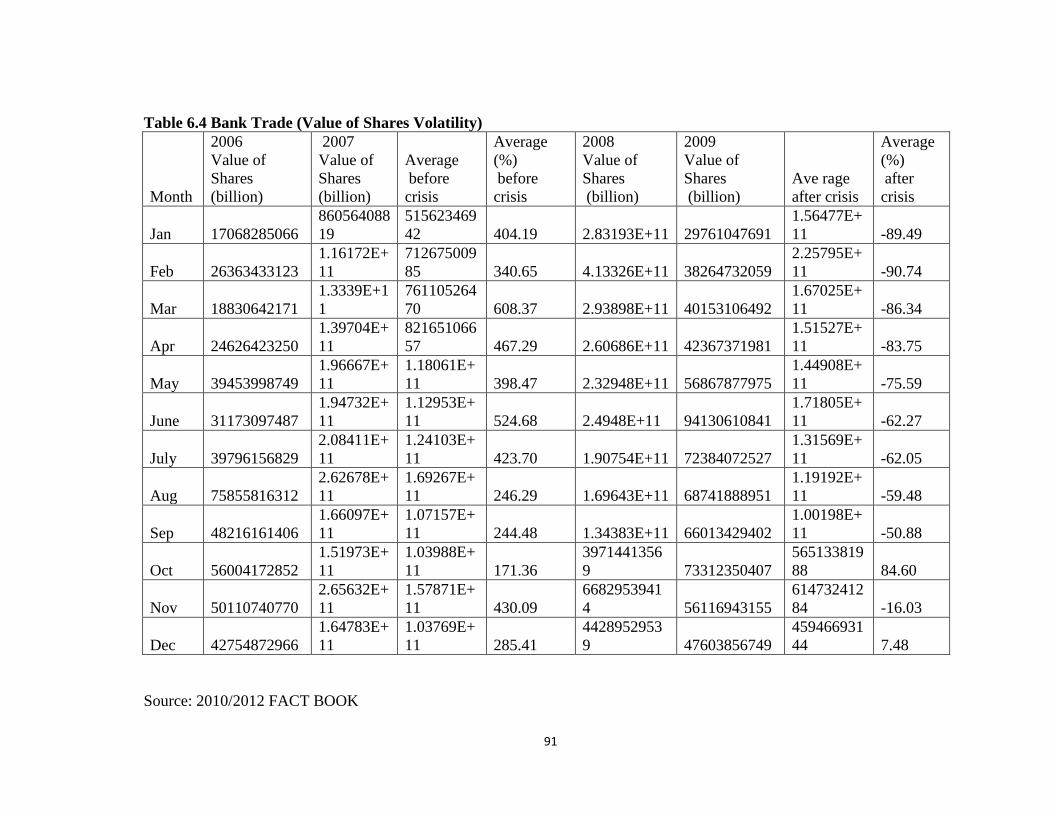
91
Table 6.4 Bank Trade (Value of Shares Volatility)
Source: 2010/2012 FACT BOOK
Month
2006
Value of
Shares
(billion)
2007
Value of
Shares
(billion)
Average
before
crisis
Average
(%)
before
crisis
2008
Value of
Shares
(billion)
2009
Value of
Shares
(billion)
Ave rage
after crisis
Average
(%)
after
crisis
Jan 17068285066
860564088
19
515623469
42 404.19 2.83193E+11 29761047691
1.56477E+
11 -89.49
Feb 26363433123
1.16172E+
11
712675009
85 340.65 4.13326E+11 38264732059
2.25795E+
11 -90.74
Mar 18830642171
1.3339E+1
1
761105264
70 608.37 2.93898E+11 40153106492
1.67025E+
11 -86.34
Apr 24626423250
1.39704E+
11
821651066
57 467.29 2.60686E+11 42367371981
1.51527E+
11 -83.75
May 39453998749
1.96667E+
11
1.18061E+
11 398.47 2.32948E+11 56867877975
1.44908E+
11 -75.59
June 31173097487
1.94732E+
11
1.12953E+
11 524.68 2.4948E+11 94130610841
1.71805E+
11 -62.27
July 39796156829
2.08411E+
11
1.24103E+
11 423.70 1.90754E+11 72384072527
1.31569E+
11 -62.05
Aug 75855816312
2.62678E+
11
1.69267E+
11 246.29 1.69643E+11 68741888951
1.19192E+
11 -59.48
Sep 48216161406
1.66097E+
11
1.07157E+
11 244.48 1.34383E+11 66013429402
1.00198E+
11 -50.88
Oct 56004172852
1.51973E+
11
1.03988E+
11 171.36
3971441356
9 73312350407
565133819
88 84.60
Nov 50110740770
2.65632E+
11
1.57871E+
11 430.09
6682953941
4 56116943155
614732412
84 -16.03
Dec 42754872966
1.64783E+
11
1.03769E+
11 285.41
4428952953
9 47603856749
459466931
44 7.48
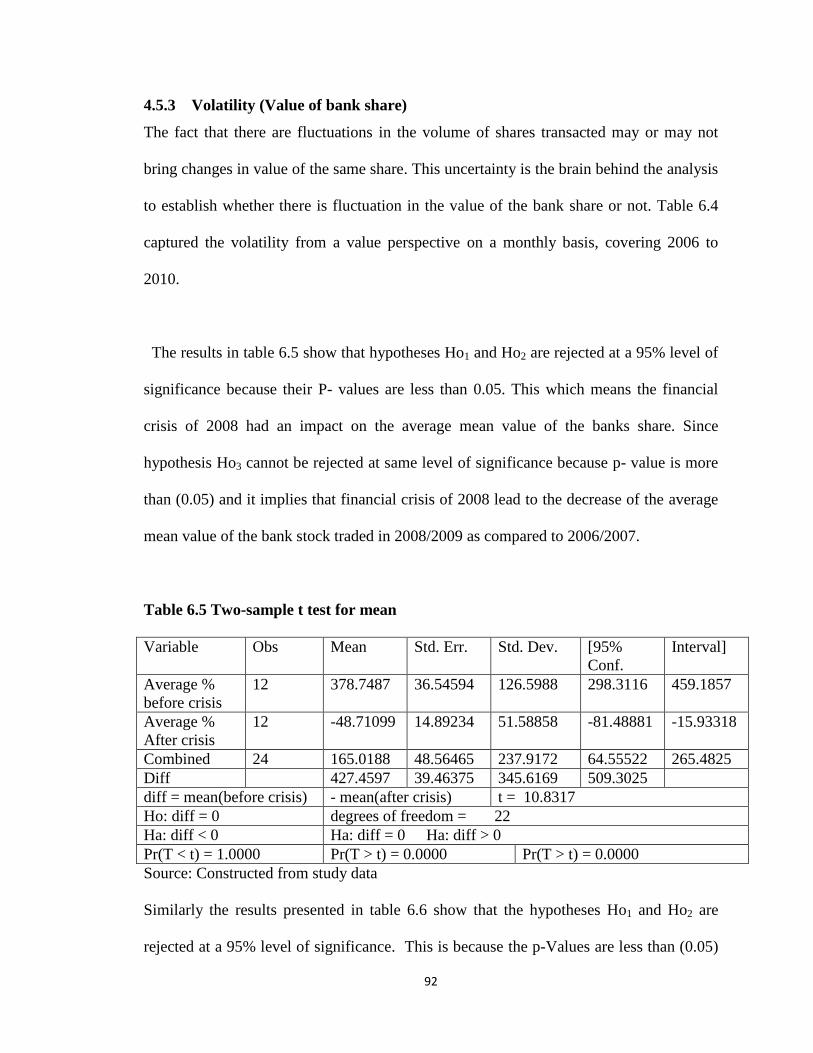
92
4.5.3 Volatility (Value of bank share)
The fact that there are fluctuations in the volume of shares transacted may or may not
bring changes in value of the same share. This uncertainty is the brain behind the analysis
to establish whether there is fluctuation in the value of the bank share or not. Table 6.4
captured the volatility from a value perspective on a monthly basis, covering 2006 to
2010.
The results in table 6.5 show that hypotheses Ho1 and Ho2 are rejected at a 95% level of
significance because their P- values are less than 0.05. This which means the financial
crisis of 2008 had an impact on the average mean value of the banks share. Since
hypothesis Ho3 cannot be rejected at same level of significance because p- value is more
than (0.05) and it implies that financial crisis of 2008 lead to the decrease of the average
mean value of the bank stock traded in 2008/2009 as compared to 2006/2007.
Table 6.5 Two-sample t test for mean
Variable Obs Mean Std. Err. Std. Dev. [95%
Conf.
Interval]
Average %
before crisis
12 378.7487 36.54594 126.5988 298.3116 459.1857
Average %
After crisis
12 -48.71099 14.89234 51.58858 -81.48881 -15.93318
Combined 24 165.0188 48.56465 237.9172 64.55522 265.4825
Diff 427.4597 39.46375 345.6169 509.3025
diff = mean(before crisis) - mean(after crisis) t = 10.8317
Ho: diff = 0 degrees of freedom = 22
Ha: diff < 0 Ha: diff = 0 Ha: diff > 0
Pr(T < t) = 1.0000 Pr(T > t) = 0.0000 Pr(T > t) = 0.0000
Source: Constructed from study data
Similarly the results presented in table 6.6 show that the hypotheses Ho1 and Ho2 are
rejected at a 95% level of significance. This is because the p-Values are less than (0.05)
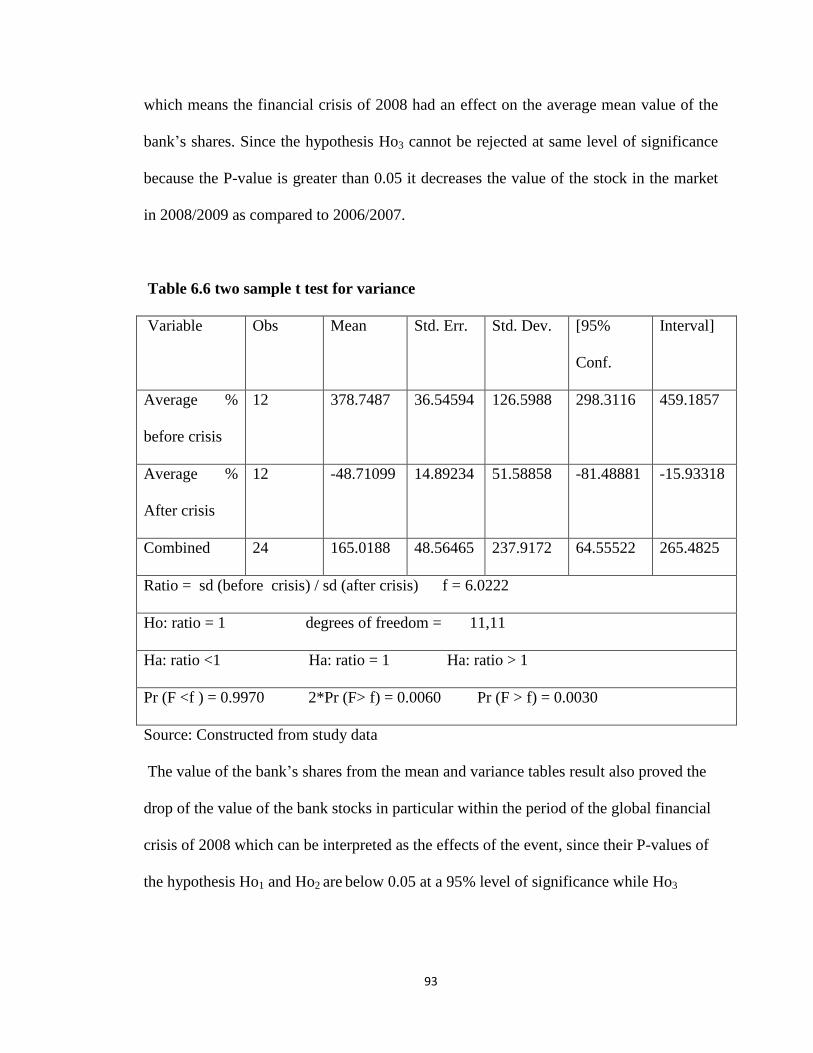
93
which means the financial crisis of 2008 had an effect on the average mean value of the
bank‟s shares. Since the hypothesis Ho3 cannot be rejected at same level of significance
because the P-value is greater than 0.05 it decreases the value of the stock in the market
in 2008/2009 as compared to 2006/2007.
Table 6.6 two sample t test for variance
Variable Obs Mean Std. Err. Std. Dev. [95%
Conf.
Interval]
Average %
before crisis
12 378.7487 36.54594 126.5988 298.3116 459.1857
Average %
After crisis
12 -48.71099 14.89234 51.58858 -81.48881 -15.93318
Combined 24 165.0188 48.56465 237.9172 64.55522 265.4825
Ratio = sd (before crisis) / sd (after crisis) f = 6.0222
Ho: ratio = 1 degrees of freedom = 11,11
Ha: ratio <1 Ha: ratio = 1 Ha: ratio > 1
Pr (F <f ) = 0.9970 2*Pr (F> f) = 0.0060 Pr (F > f) = 0.0030
Source: Constructed from study data
The value of the bank‟s shares from the mean and variance tables result also proved the
drop of the value of the bank stocks in particular within the period of the global financial
crisis of 2008 which can be interpreted as the effects of the event, since their P-values of
the hypothesis Ho1 and Ho2 are below 0.05 at a 95% level of significance while Ho3
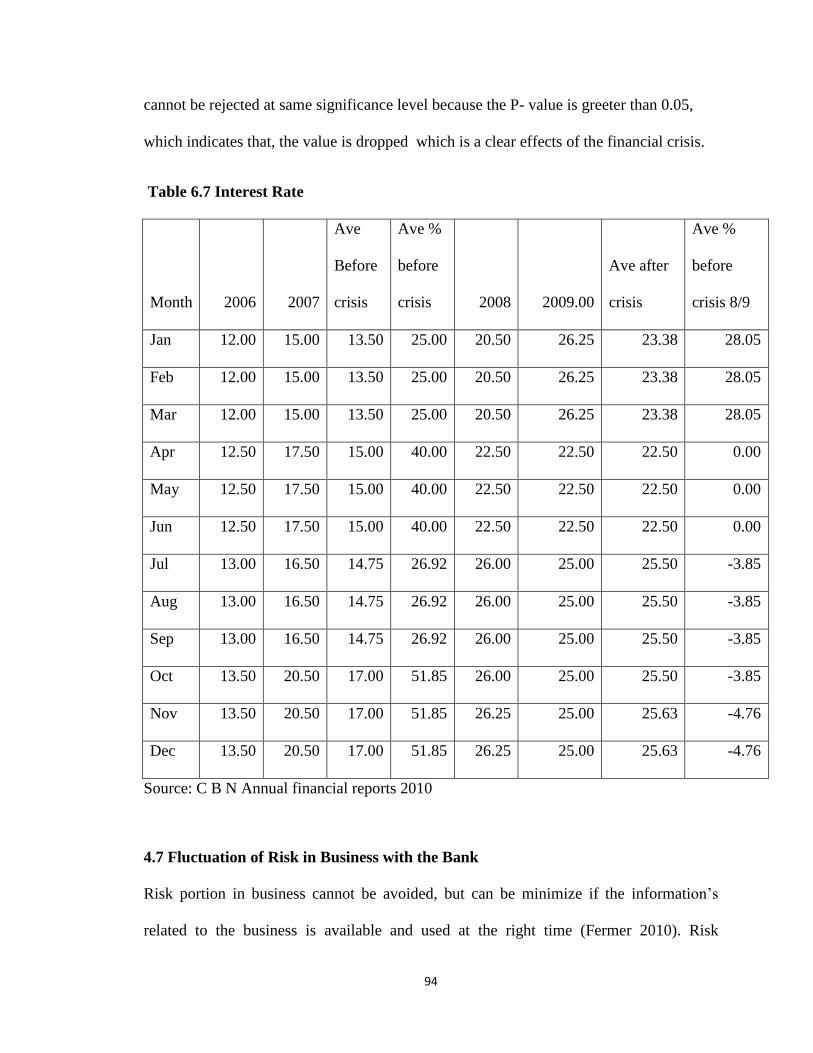
94
cannot be rejected at same significance level because the P- value is greeter than 0.05,
which indicates that, the value is dropped which is a clear effects of the financial crisis.
Table 6.7 Interest Rate
Month 2006 2007
Ave
Before
crisis
Ave %
before
crisis 2008 2009.00
Ave after
crisis
Ave %
before
crisis 8/9
Jan 12.00 15.00 13.50 25.00 20.50 26.25 23.38 28.05
Feb 12.00 15.00 13.50 25.00 20.50 26.25 23.38 28.05
Mar 12.00 15.00 13.50 25.00 20.50 26.25 23.38 28.05
Apr 12.50 17.50 15.00 40.00 22.50 22.50 22.50 0.00
May 12.50 17.50 15.00 40.00 22.50 22.50 22.50 0.00
Jun 12.50 17.50 15.00 40.00 22.50 22.50 22.50 0.00
Jul 13.00 16.50 14.75 26.92 26.00 25.00 25.50 -3.85
Aug 13.00 16.50 14.75 26.92 26.00 25.00 25.50 -3.85
Sep 13.00 16.50 14.75 26.92 26.00 25.00 25.50 -3.85
Oct 13.50 20.50 17.00 51.85 26.00 25.00 25.50 -3.85
Nov 13.50 20.50 17.00 51.85 26.25 25.00 25.63 -4.76
Dec 13.50 20.50 17.00 51.85 26.25 25.00 25.63 -4.76
Source: C B N Annual financial reports 2010
4.7 Fluctuation of Risk in Business with the Bank
Risk portion in business cannot be avoided, but can be minimize if the information‟s
related to the business is available and used at the right time (Fermer 2010). Risk
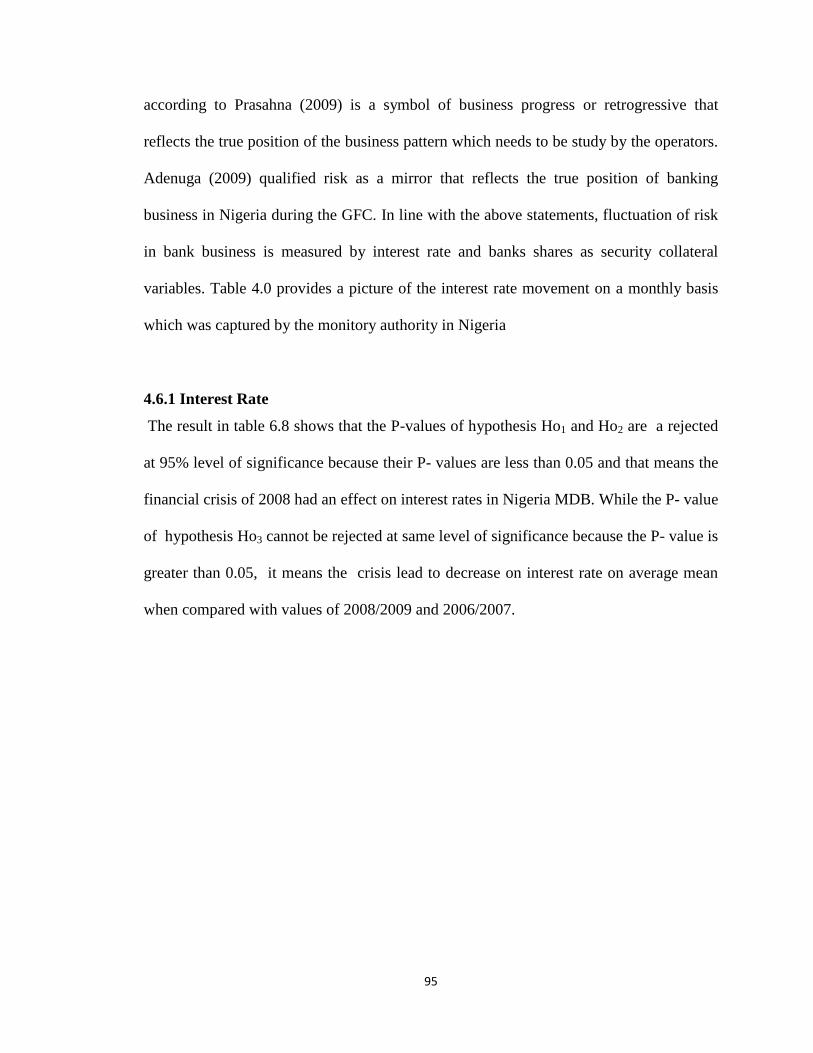
95
according to Prasahna (2009) is a symbol of business progress or retrogressive that
reflects the true position of the business pattern which needs to be study by the operators.
Adenuga (2009) qualified risk as a mirror that reflects the true position of banking
business in Nigeria during the GFC. In line with the above statements, fluctuation of risk
in bank business is measured by interest rate and banks shares as security collateral
variables. Table 4.0 provides a picture of the interest rate movement on a monthly basis
which was captured by the monitory authority in Nigeria
4.6.1 Interest Rate
The result in table 6.8 shows that the P-values of hypothesis Ho1 and Ho2 are a rejected
at 95% level of significance because their P- values are less than 0.05 and that means the
financial crisis of 2008 had an effect on interest rates in Nigeria MDB. While the P- value
of hypothesis Ho3 cannot be rejected at same level of significance because the P- value is
greater than 0.05, it means the crisis lead to decrease on interest rate on average mean
when compared with values of 2008/2009 and 2006/2007.
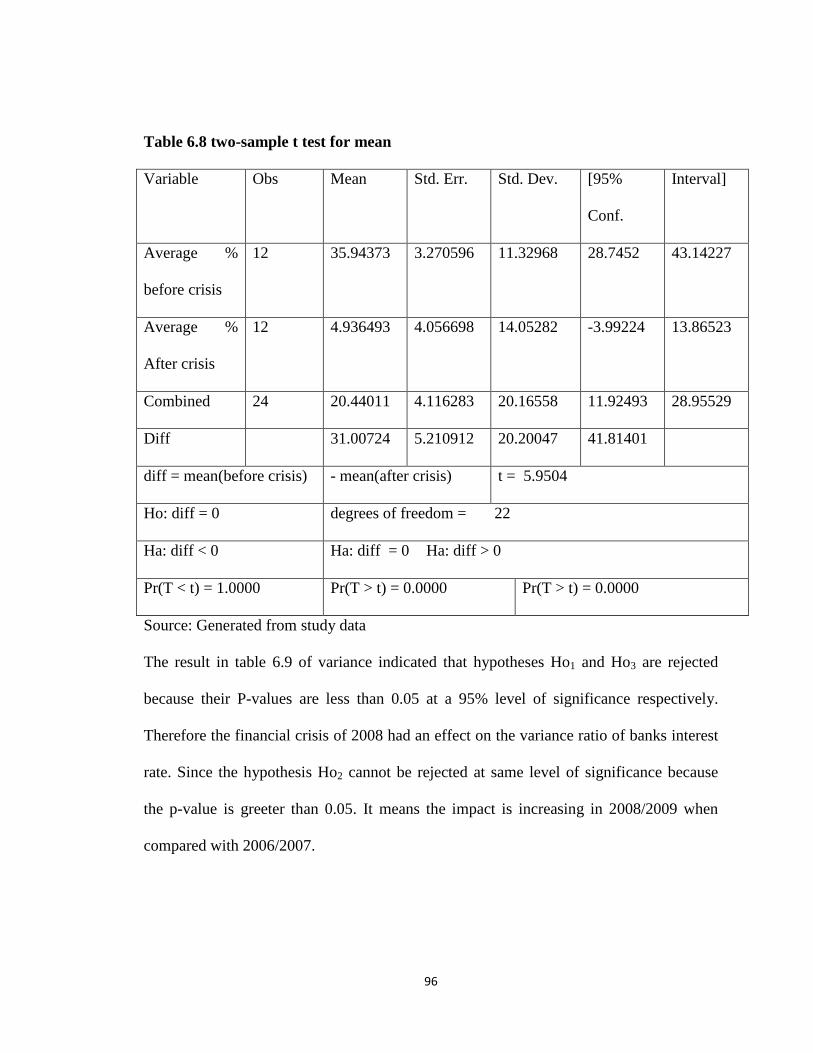
96
Table 6.8 two-sample t test for mean
Variable Obs Mean Std. Err. Std. Dev. [95%
Conf.
Interval]
Average %
before crisis
12 35.94373 3.270596 11.32968 28.7452 43.14227
Average %
After crisis
12 4.936493 4.056698 14.05282 -3.99224 13.86523
Combined 24 20.44011 4.116283 20.16558 11.92493 28.95529
Diff 31.00724 5.210912 20.20047 41.81401
diff = mean(before crisis) - mean(after crisis) t = 5.9504
Ho: diff = 0 degrees of freedom = 22
Ha: diff < 0 Ha: diff = 0 Ha: diff > 0
Pr(T < t) = 1.0000 Pr(T > t) = 0.0000 Pr(T > t) = 0.0000
Source: Generated from study data
The result in table 6.9 of variance indicated that hypotheses Ho1 and Ho3 are rejected
because their P-values are less than 0.05 at a 95% level of significance respectively.
Therefore the financial crisis of 2008 had an effect on the variance ratio of banks interest
rate. Since the hypothesis Ho2 cannot be rejected at same level of significance because
the p-value is greeter than 0.05. It means the impact is increasing in 2008/2009 when
compared with 2006/2007.
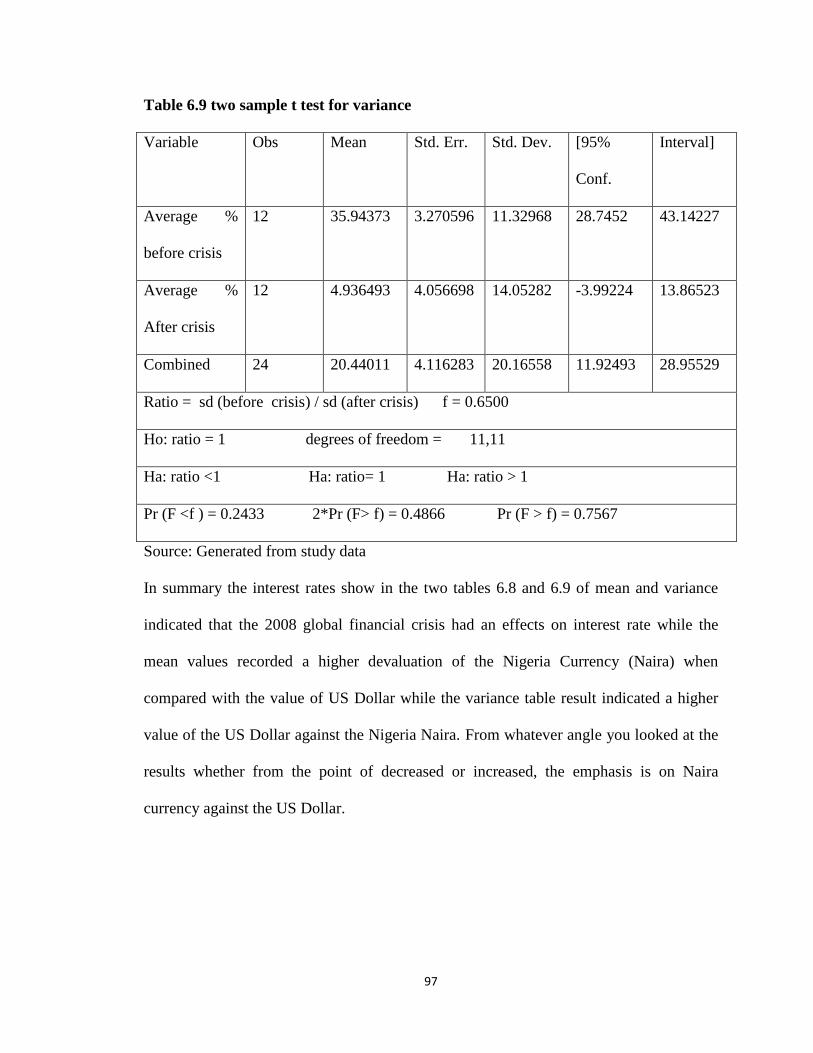
97
Table 6.9 two sample t test for variance
Variable Obs Mean Std. Err. Std. Dev. [95%
Conf.
Interval]
Average %
before crisis
12 35.94373 3.270596 11.32968 28.7452 43.14227
Average %
After crisis
12 4.936493 4.056698 14.05282 -3.99224 13.86523
Combined 24 20.44011 4.116283 20.16558 11.92493 28.95529
Ratio = sd (before crisis) / sd (after crisis) f = 0.6500
Ho: ratio = 1 degrees of freedom = 11,11
Ha: ratio <1 Ha: ratio= 1 Ha: ratio > 1
Pr (F <f ) = 0.2433 2*Pr (F> f) = 0.4866 Pr (F > f) = 0.7567
Source: Generated from study data
In summary the interest rates show in the two tables 6.8 and 6.9 of mean and variance
indicated that the 2008 global financial crisis had an effects on interest rate while the
mean values recorded a higher devaluation of the Nigeria Currency (Naira) when
compared with the value of US Dollar while the variance table result indicated a higher
value of the US Dollar against the Nigeria Naira. From whatever angle you looked at the
results whether from the point of decreased or increased, the emphasis is on Naira
currency against the US Dollar.
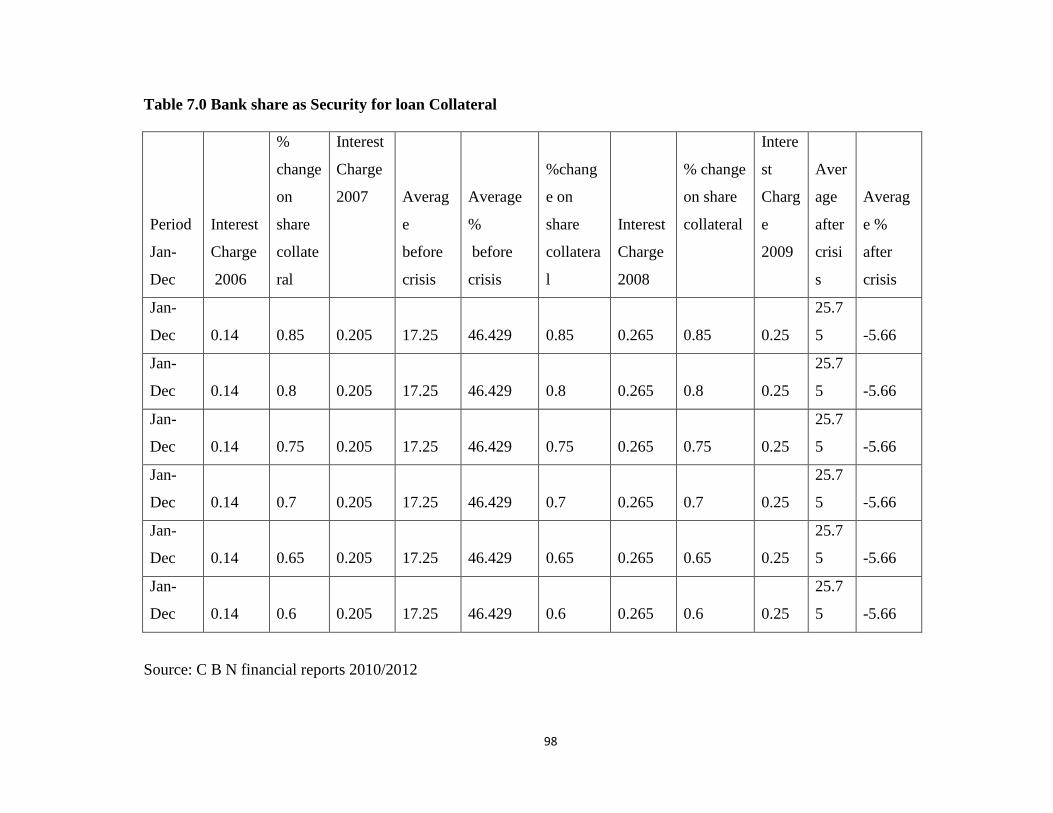
98
Table 7.0 Bank share as Security for loan Collateral
Period
Jan-
Dec
Interest
Charge
2006
%
change
on
share
collate
ral
Interest
Charge
2007 Averag
e
before
crisis
Average
%
before
crisis
%chang
e on
share
collatera
l
Interest
Charge
2008
% change
on share
collateral
Intere
st
Charg
e
2009
Aver
age
after
crisi
s
Averag
e %
after
crisis
Jan-
Dec 0.14
0.85
0.205 17.25 46.429 0.85 0.265 0.85 0.25
25.7
5 -5.66
Jan-
Dec 0.14
0.8
0.205 17.25 46.429 0.8 0.265 0.8 0.25
25.7
5 -5.66
Jan-
Dec 0.14
0.75
0.205 17.25 46.429 0.75 0.265 0.75 0.25
25.7
5 -5.66
Jan-
Dec 0.14
0.7
0.205 17.25 46.429 0.7 0.265 0.7 0.25
25.7
5 -5.66
Jan-
Dec 0.14
0.65
0.205 17.25 46.429 0.65 0.265 0.65 0.25
25.7
5 -5.66
Jan-
Dec 0.14
0.6
0.205 17.25 46.429 0.6 0.265 0.6 0.25
25.7
5 -5.66
Source: C B N financial reports 2010/2012
99
4.6.2 Banks Shares as Security Collateral for Loan
According to (Doguwa 2010) Security/Securities from financial point of view are said to
be a locus of the banking business primal intern operation. While Okereke, (2011) said
failure to obtain a higher value of security as collateral which has more than half the
value of the loan secured in commercial banking, is equal to liquidating the banks
financial strength. Sanusi (2010) lamented that progress or failure of MDB in 2000
global financial era depended solely on three factors with security considered ranking
first in the pyramid structure of sound risk control management of long surviving
financial firm. Therefore, bank‟s shares value as security for loans collateral is a function
of the share price performance in the stock exchange market. Table 7.0 represent the
summary of the annual value attached to average bank shares.
The result in table 7.1 and 7.2 shows that all the P- values of the three hypotheses tested
Ho1, Ho2 and Ho3 are below 0.05 at a 95% level of significance. In fact, the probability
values of all the mean variance ratio averages indicated a zero values. Therefore the 2008
GFC had a 100% effects on both the mean and variance values on banks shares certificate
used as collateral for loan.
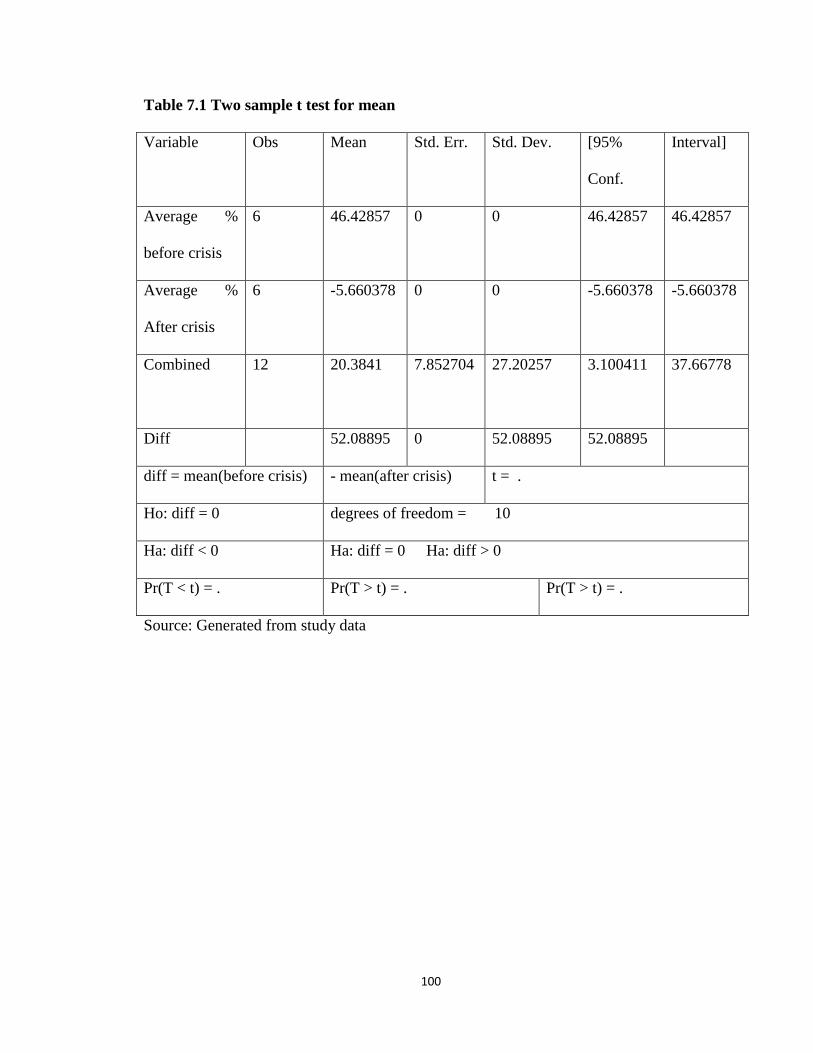
100
Table 7.1 Two sample t test for mean
Variable Obs Mean Std. Err. Std. Dev. [95%
Conf.
Interval]
Average %
before crisis
6 46.42857 0 0 46.42857 46.42857
Average %
After crisis
6 -5.660378 0 0 -5.660378 -5.660378
Combined 12 20.3841 7.852704
27.20257
3.100411 37.66778
Diff 52.08895 0 52.08895 52.08895
diff = mean(before crisis) - mean(after crisis) t = .
Ho: diff = 0 degrees of freedom = 10
Ha: diff < 0 Ha: diff = 0 Ha: diff > 0
Pr(T < t) = . Pr(T > t) = . Pr(T > t) = .
Source: Generated from study data
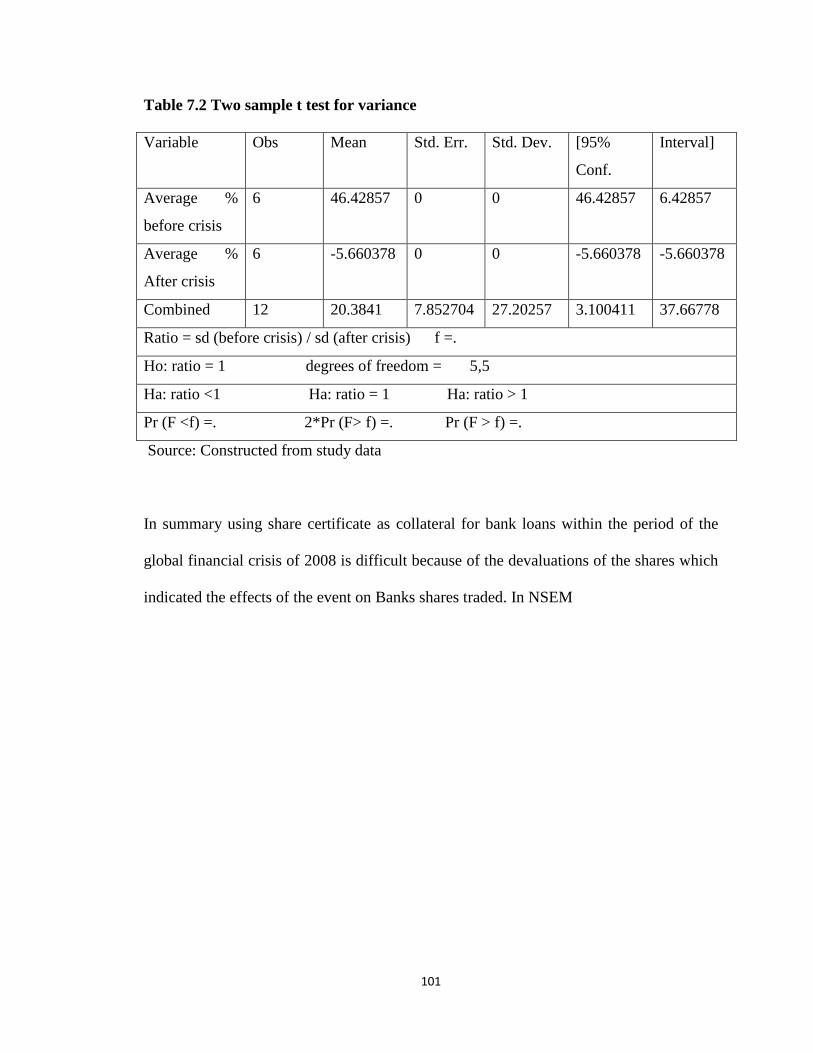
101
Table 7.2 Two sample t test for variance
Variable Obs Mean Std. Err. Std. Dev. [95%
Conf.
Interval]
Average %
before crisis
6 46.42857 0 0 46.42857 6.42857
Average %
After crisis
6 -5.660378 0 0 -5.660378 -5.660378
Combined 12 20.3841 7.852704 27.20257 3.100411 37.66778
Ratio = sd (before crisis) / sd (after crisis) f =.
Ho: ratio = 1 degrees of freedom = 5,5
Ha: ratio <1 Ha: ratio = 1 Ha: ratio > 1
Pr (F <f) =. 2*Pr (F> f) =. Pr (F > f) =.
Source: Constructed from study data
In summary using share certificate as collateral for bank loans within the period of the
global financial crisis of 2008 is difficult because of the devaluations of the shares which
indicated the effects of the event on Banks shares traded. In NSEM
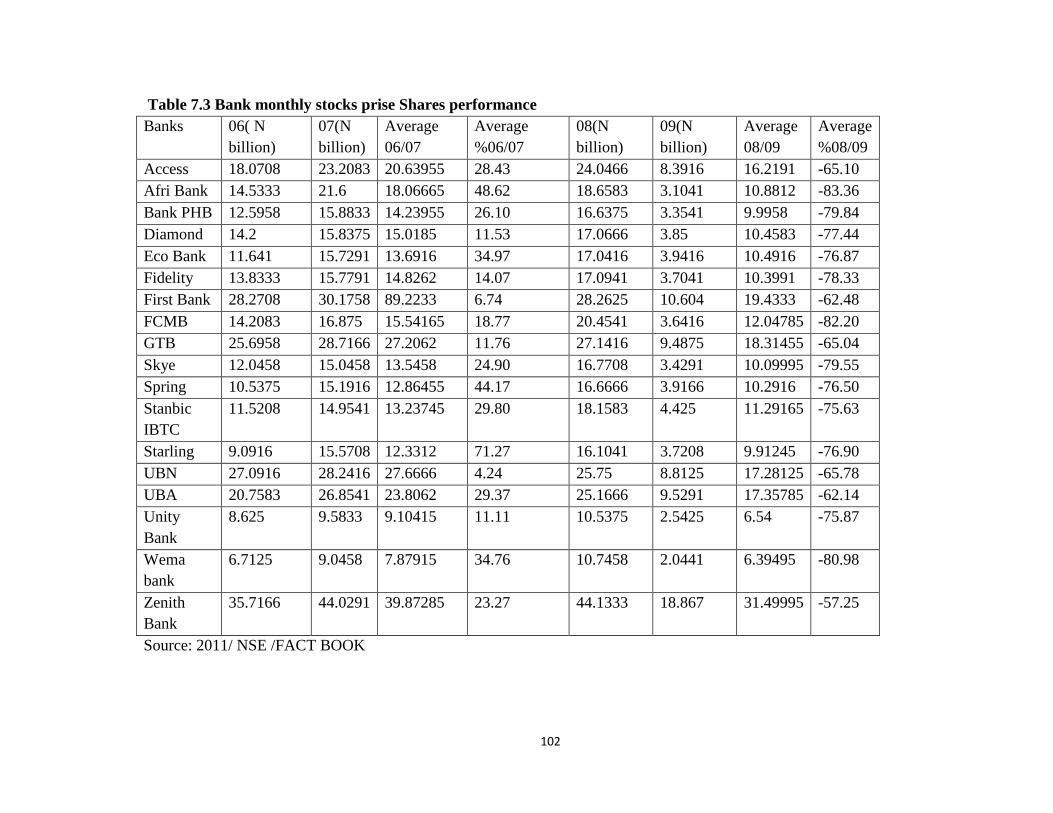
102
Table 7.3 Bank monthly stocks prise Shares performance
Banks 06( N
billion)
07(N
billion)
Average
06/07
Average
%06/07
08(N
billion)
09(N
billion)
Average
08/09
Average
%08/09
Access 18.0708 23.2083 20.63955 28.43 24.0466 8.3916 16.2191 -65.10
Afri Bank 14.5333 21.6 18.06665 48.62 18.6583 3.1041 10.8812 -83.36
Bank PHB 12.5958 15.8833 14.23955 26.10 16.6375 3.3541 9.9958 -79.84
Diamond 14.2 15.8375 15.0185 11.53 17.0666 3.85 10.4583 -77.44
Eco Bank 11.641 15.7291 13.6916 34.97 17.0416 3.9416 10.4916 -76.87
Fidelity 13.8333 15.7791 14.8262 14.07 17.0941 3.7041 10.3991 -78.33
First Bank 28.2708 30.1758 89.2233 6.74 28.2625 10.604 19.4333 -62.48
FCMB 14.2083 16.875 15.54165 18.77 20.4541 3.6416 12.04785 -82.20
GTB 25.6958 28.7166 27.2062 11.76 27.1416 9.4875 18.31455 -65.04
Skye 12.0458 15.0458 13.5458 24.90 16.7708 3.4291 10.09995 -79.55
Spring 10.5375 15.1916 12.86455 44.17 16.6666 3.9166 10.2916 -76.50
Stanbic
IBTC
11.5208 14.9541 13.23745 29.80 18.1583 4.425 11.29165 -75.63
Starling 9.0916 15.5708 12.3312 71.27 16.1041 3.7208 9.91245 -76.90
UBN 27.0916 28.2416 27.6666 4.24 25.75 8.8125 17.28125 -65.78
UBA 20.7583 26.8541 23.8062 29.37 25.1666 9.5291 17.35785 -62.14
Unity
Bank
8.625 9.5833 9.10415 11.11 10.5375 2.5425 6.54 -75.87
Wema
bank
6.7125 9.0458 7.87915 34.76 10.7458 2.0441 6.39495 -80.98
Zenith
Bank
35.7166 44.0291 39.87285 23.27 44.1333 18.867 31.49995 -57.25
Source: 2011/ NSE /FACT BOOK
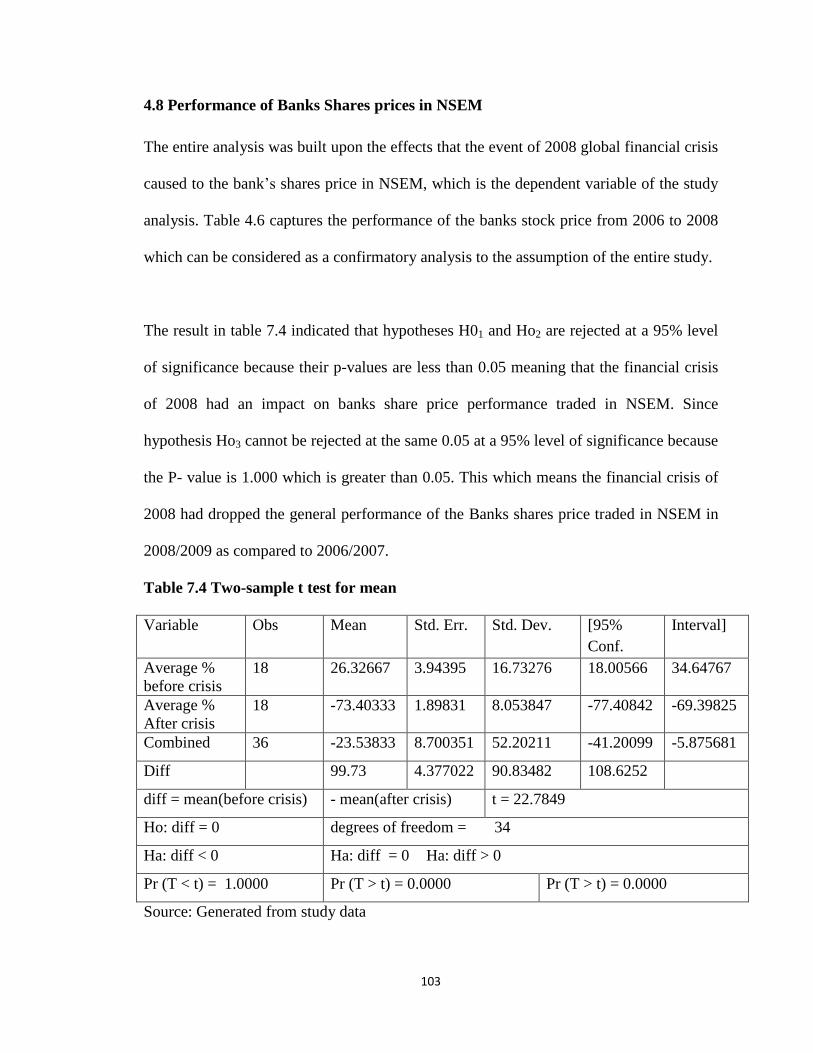
103
4.8 Performance of Banks Shares prices in NSEM
The entire analysis was built upon the effects that the event of 2008 global financial crisis
caused to the bank‟s shares price in NSEM, which is the dependent variable of the study
analysis. Table 4.6 captures the performance of the banks stock price from 2006 to 2008
which can be considered as a confirmatory analysis to the assumption of the entire study.
The result in table 7.4 indicated that hypotheses H01 and Ho2 are rejected at a 95% level
of significance because their p-values are less than 0.05 meaning that the financial crisis
of 2008 had an impact on banks share price performance traded in NSEM. Since
hypothesis Ho3 cannot be rejected at the same 0.05 at a 95% level of significance because
the P- value is 1.000 which is greater than 0.05. This which means the financial crisis of
2008 had dropped the general performance of the Banks shares price traded in NSEM in
2008/2009 as compared to 2006/2007.
Table 7.4 Two-sample t test for mean
Variable Obs Mean Std. Err. Std. Dev. [95%
Conf.
Interval]
Average %
before crisis
18 26.32667 3.94395 16.73276 18.00566 34.64767
Average %
After crisis
18 -73.40333 1.89831 8.053847 -77.40842 -69.39825
Combined 36 -23.53833 8.700351 52.20211 -41.20099 -5.875681
Diff 99.73 4.377022 90.83482 108.6252
diff = mean(before crisis) - mean(after crisis) t = 22.7849
Ho: diff = 0 degrees of freedom = 34
Ha: diff < 0 Ha: diff = 0 Ha: diff > 0
Pr (T < t) = 1.0000 Pr (T > t) = 0.0000 Pr (T > t) = 0.0000
Source: Generated from study data
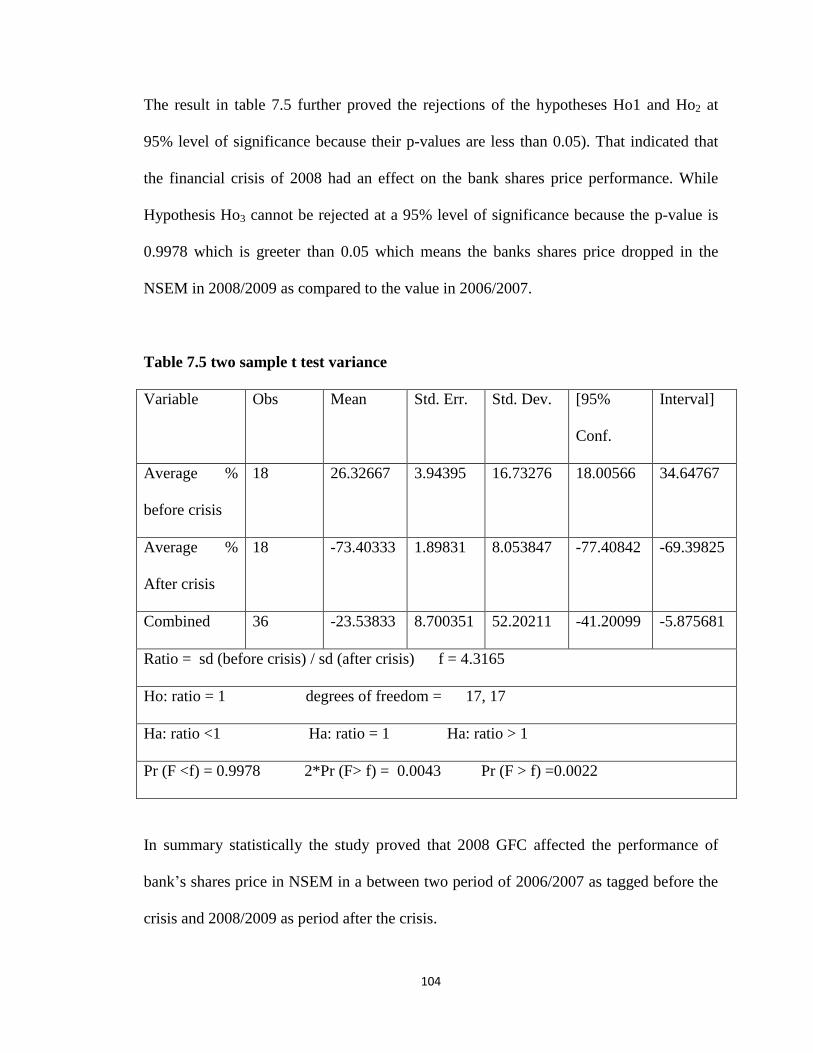
104
The result in table 7.5 further proved the rejections of the hypotheses Ho1 and Ho2 at
95% level of significance because their p-values are less than 0.05). That indicated that
the financial crisis of 2008 had an effect on the bank shares price performance. While
Hypothesis Ho3 cannot be rejected at a 95% level of significance because the p-value is
0.9978 which is greeter than 0.05 which means the banks shares price dropped in the
NSEM in 2008/2009 as compared to the value in 2006/2007.
Table 7.5 two sample t test variance
Variable Obs Mean Std. Err. Std. Dev. [95%
Conf.
Interval]
Average %
before crisis
18 26.32667 3.94395 16.73276 18.00566 34.64767
Average %
After crisis
18 -73.40333 1.89831 8.053847 -77.40842 -69.39825
Combined 36 -23.53833 8.700351 52.20211 -41.20099 -5.875681
Ratio = sd (before crisis) / sd (after crisis) f = 4.3165
Ho: ratio = 1 degrees of freedom = 17, 17
Ha: ratio <1 Ha: ratio = 1 Ha: ratio > 1
Pr (F <f) = 0.9978 2*Pr (F> f) = 0.0043 Pr (F > f) =0.0022
In summary statistically the study proved that 2008 GFC affected the performance of
bank‟s shares price in NSEM in a between two period of 2006/2007 as tagged before the
crisis and 2008/2009 as period after the crisis.
105
4.9 Discussion of Result
Discussion on this section was build upon the results established from the statistical
tables using three p- values of each mean and on variable that supported the independent
variables.
The first p-value which is in the centre of the statistical table indicated with Pr (T>t) = for
mean and 2* Pr (F>t) = respectively explained the position of the null hypothesis at 0.05
level weather to be accepted or rejected. If the values are less (<) 0.05 level, the null
hypotheses are rejected which means the 2008 global financial crisis had an effects on the
variables analyzed. While if the p-values are more (>) than 0.05 level we do not reject the
null hypothesis meaning that the 2008 global financial crisis did not have effects on the
variables discussed. In summary those P-values signify only the relationship between the
variable discussed and the event, which is Global Financial Crisis, but they could not
further explain the direction of the effects weather positively or negatively.
Other P – values in left and right hand side of the tables further indicated the direction of
the effects movement as follows:
If the P- value in the left hand side is greeter (>) than 0.05 level, it show the effect of the
event is increasing negatively, while if it is below (<) it decreasing negatively. Similarly
if the P- value is in right hand side is greeter (>) than 0.05 it indicated that the effect is
increasing positively or if it is below (<) 0.05 it decreasing positively.
On the bases of the above preamble which is the statistical evidence back up the
interpretations of the result, the results was said to be generalizes statement that 2008
Global Financial Crisis had an effects on all the in dependent variables measured and it
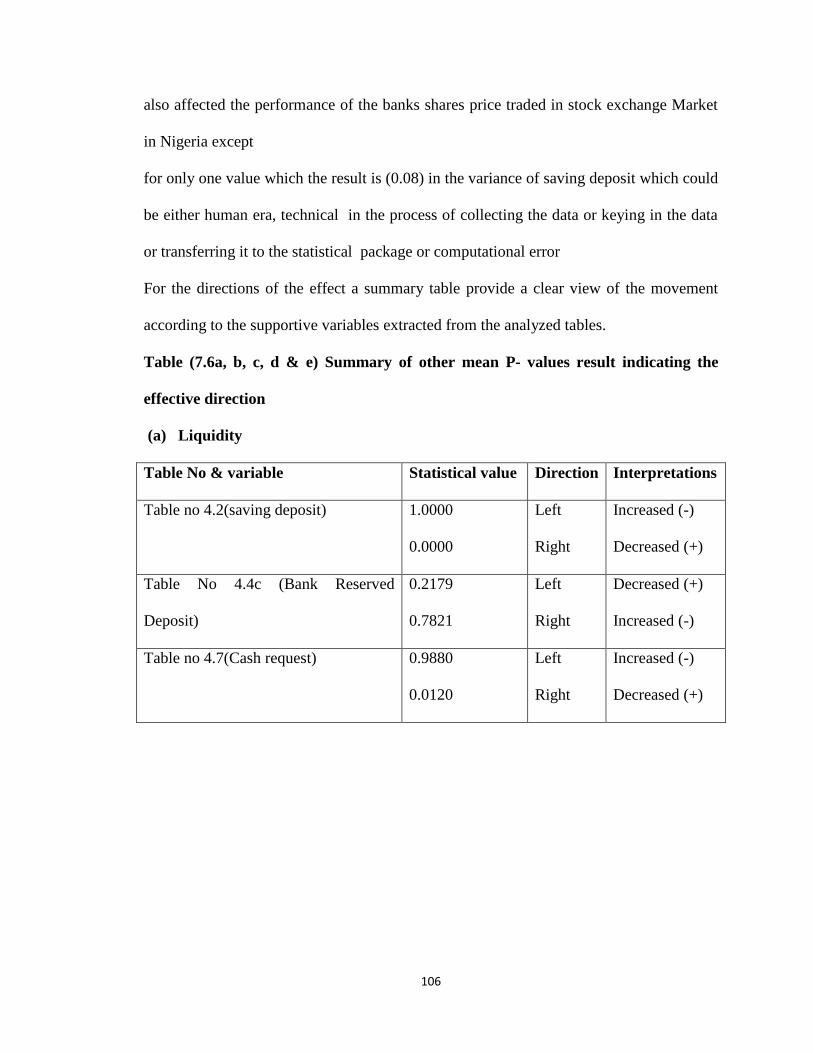
106
also affected the performance of the banks shares price traded in stock exchange Market
in Nigeria except
for only one value which the result is (0.08) in the variance of saving deposit which could
be either human era, technical in the process of collecting the data or keying in the data
or transferring it to the statistical package or computational error
For the directions of the effect a summary table provide a clear view of the movement
according to the supportive variables extracted from the analyzed tables.
Table (7.6a, b, c, d & e) Summary of other mean P- values result indicating the
effective direction
(a) Liquidity
Table No & variable Statistical value Direction Interpretations
Table no 4.2(saving deposit) 1.0000
0.0000
Left
Right
Increased (-)
Decreased (+)
Table No 4.4c (Bank Reserved
Deposit)
0.2179
0.7821
Left
Right
Decreased (+)
Increased (-)
Table no 4.7(Cash request) 0.9880
0.0120
Left
Right
Increased (-)
Decreased (+)
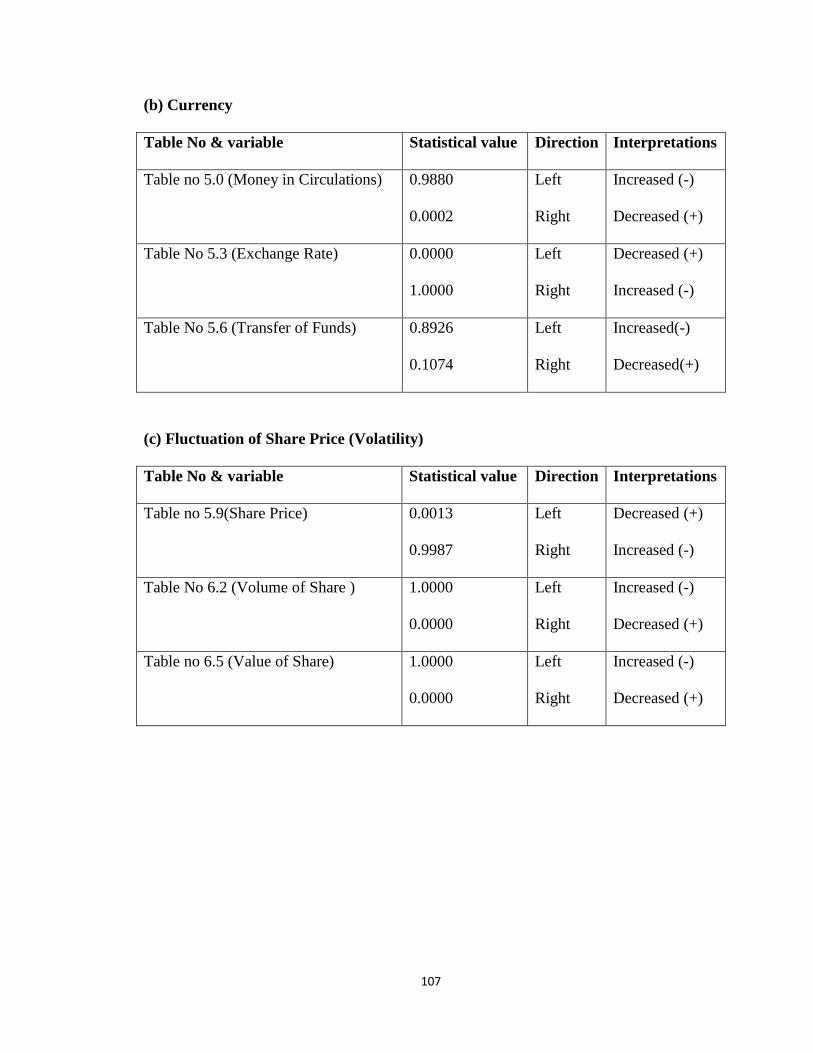
107
(b) Currency
Table No & variable Statistical value Direction Interpretations
Table no 5.0 (Money in Circulations) 0.9880
0.0002
Left
Right
Increased (-)
Decreased (+)
Table No 5.3 (Exchange Rate) 0.0000
1.0000
Left
Right
Decreased (+)
Increased (-)
Table No 5.6 (Transfer of Funds) 0.8926
0.1074
Left
Right
Increased(-)
Decreased(+)
(c) Fluctuation of Share Price (Volatility)
Table No & variable Statistical value Direction Interpretations
Table no 5.9(Share Price) 0.0013
0.9987
Left
Right
Decreased (+)
Increased (-)
Table No 6.2 (Volume of Share ) 1.0000
0.0000
Left
Right
Increased (-)
Decreased (+)
Table no 6.5 (Value of Share) 1.0000
0.0000
Left
Right
Increased (-)
Decreased (+)
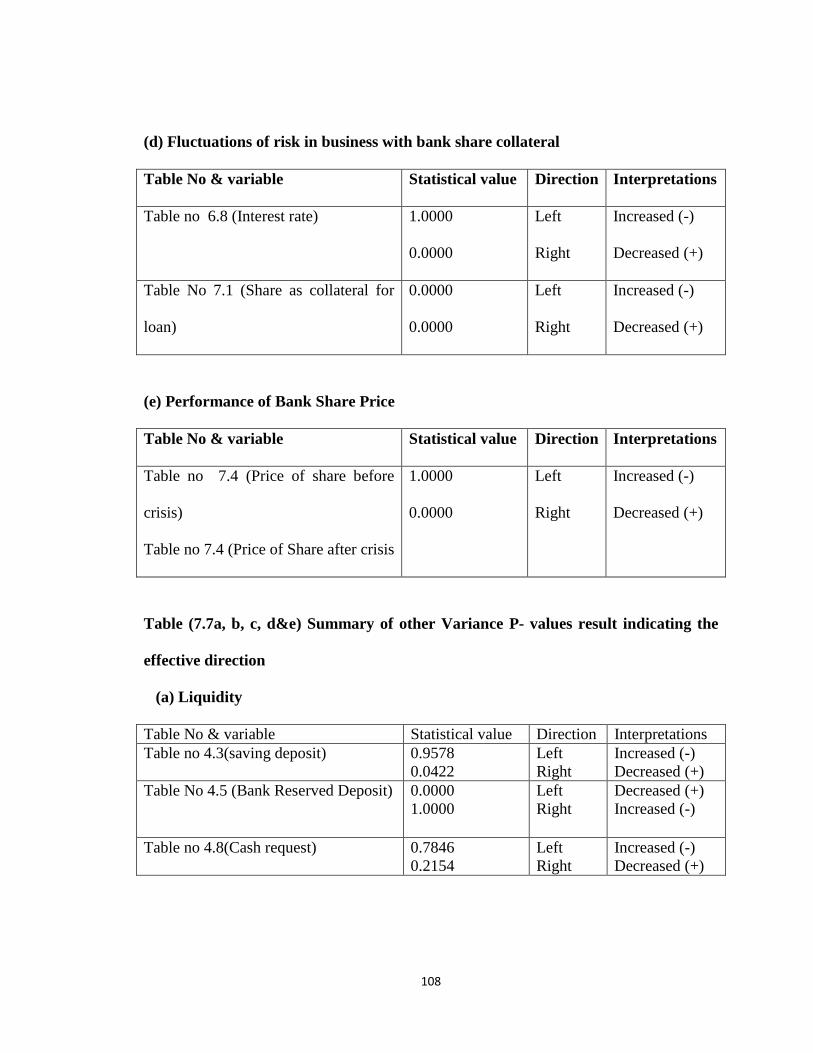
108
(d) Fluctuations of risk in business with bank share collateral
Table No & variable Statistical value Direction Interpretations
Table no 6.8 (Interest rate) 1.0000
0.0000
Left
Right
Increased (-)
Decreased (+)
Table No 7.1 (Share as collateral for
loan)
0.0000
0.0000
Left
Right
Increased (-)
Decreased (+)
(e) Performance of Bank Share Price
Table No & variable Statistical value Direction Interpretations
Table no 7.4 (Price of share before
crisis)
Table no 7.4 (Price of Share after crisis
1.0000
0.0000
Left
Right
Increased (-)
Decreased (+)
Table (7.7a, b, c, d&e) Summary of other Variance P- values result indicating the
effective direction
(a) Liquidity
Table No & variable Statistical value Direction Interpretations
Table no 4.3(saving deposit) 0.9578
0.0422
Left
Right
Increased (-)
Decreased (+)
Table No 4.5 (Bank Reserved Deposit) 0.0000
1.0000
Left
Right
Decreased (+)
Increased (-)
Table no 4.8(Cash request) 0.7846
0.2154
Left
Right
Increased (-)
Decreased (+)
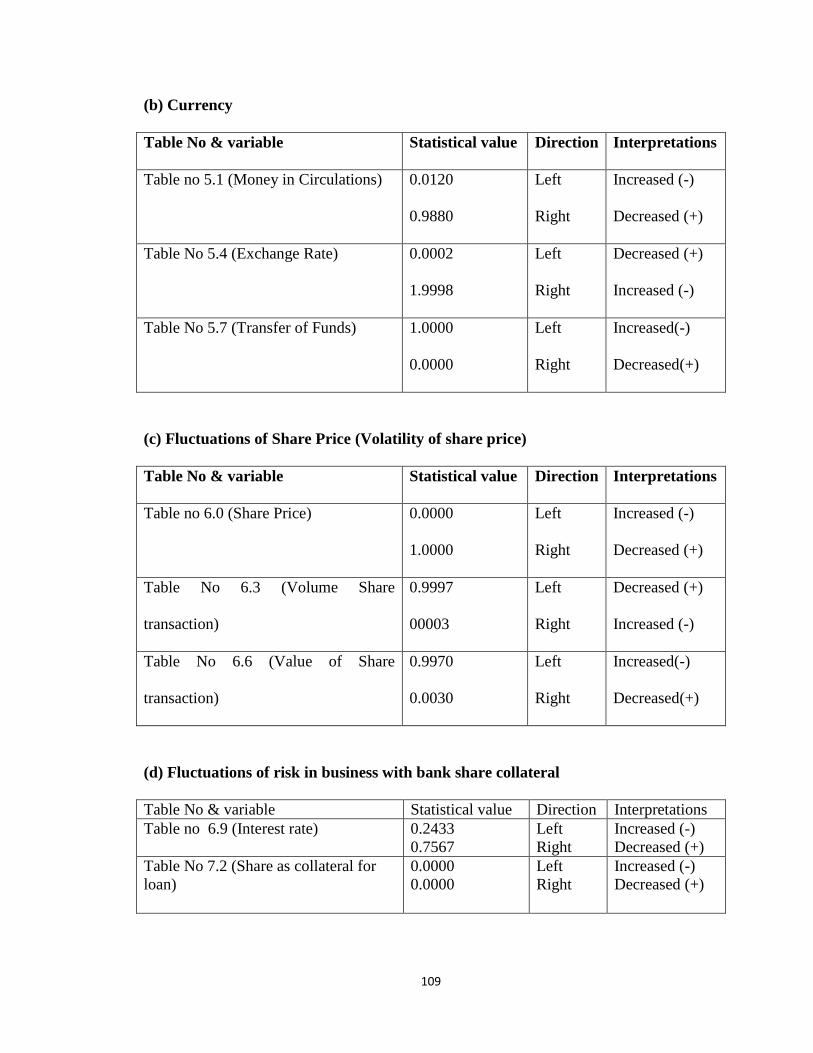
109
(b) Currency
Table No & variable Statistical value Direction Interpretations
Table no 5.1 (Money in Circulations) 0.0120
0.9880
Left
Right
Increased (-)
Decreased (+)
Table No 5.4 (Exchange Rate) 0.0002
1.9998
Left
Right
Decreased (+)
Increased (-)
Table No 5.7 (Transfer of Funds) 1.0000
0.0000
Left
Right
Increased(-)
Decreased(+)
(c) Fluctuations of Share Price (Volatility of share price)
Table No & variable Statistical value Direction Interpretations
Table no 6.0 (Share Price) 0.0000
1.0000
Left
Right
Increased (-)
Decreased (+)
Table No 6.3 (Volume Share
transaction)
0.9997
00003
Left
Right
Decreased (+)
Increased (-)
Table No 6.6 (Value of Share
transaction)
0.9970
0.0030
Left
Right
Increased(-)
Decreased(+)
(d) Fluctuations of risk in business with bank share collateral
Table No & variable Statistical value Direction Interpretations
Table no 6.9 (Interest rate) 0.2433
0.7567
Left
Right
Increased (-)
Decreased (+)
Table No 7.2 (Share as collateral for
loan)
0.0000
0.0000
Left
Right
Increased (-)
Decreased (+)
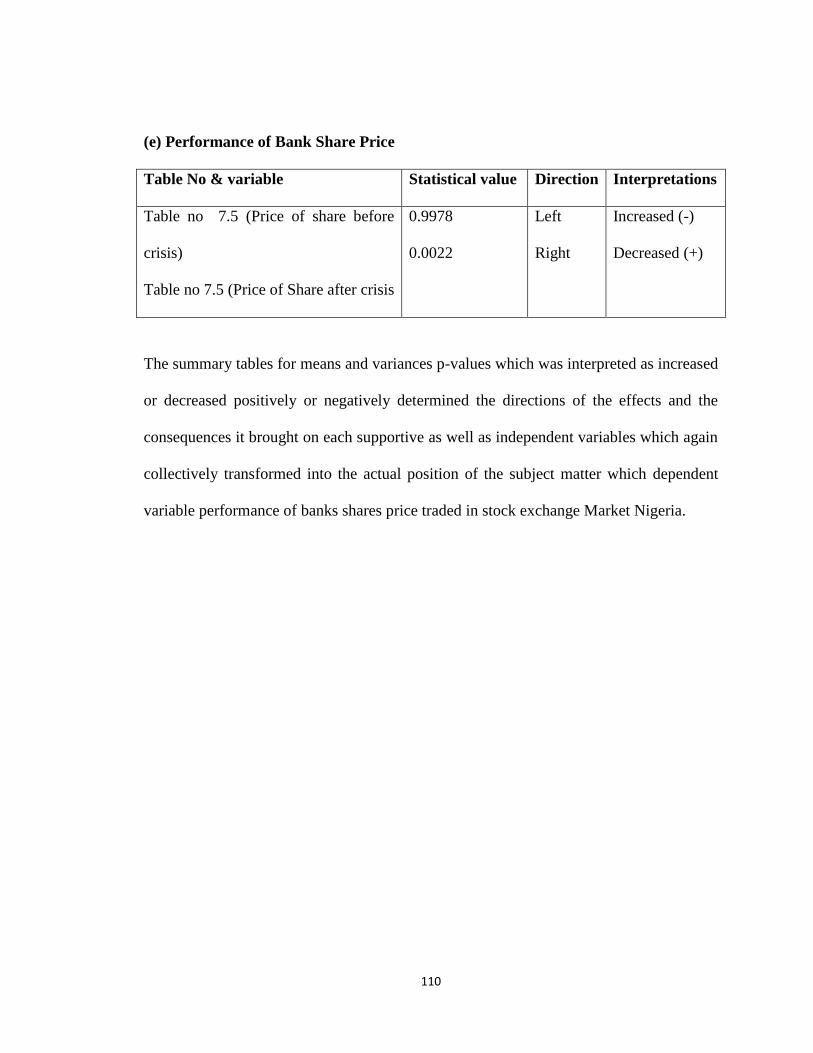
110
(e) Performance of Bank Share Price
Table No & variable Statistical value Direction Interpretations
Table no 7.5 (Price of share before
crisis)
Table no 7.5 (Price of Share after crisis
0.9978
0.0022
Left
Right
Increased (-)
Decreased (+)
The summary tables for means and variances p-values which was interpreted as increased
or decreased positively or negatively determined the directions of the effects and the
consequences it brought on each supportive as well as independent variables which again
collectively transformed into the actual position of the subject matter which dependent
variable performance of banks shares price traded in stock exchange Market Nigeria.
111
CHAPTER FIVE
SUMMARY, CONCLUSION AND RECOMMENDATION
5.0 Introduction
This chapter presents the summary of the study and draws conclusions based on the out
comes, of the result. Recommendations and suggestions for future research spur
researchers to exploit knowledge, since knowledge is not restricted or monopolized by
individual or group of people. All the recommendations were based on actual facts
established from the study, and the hope is that it will be use by the target audience, not
only in Nigeria but by the rest of the world. Finally suggestions for further areas where
researchers can exploit more knowledge within the scope but looking at it from different
direction are given.
5.1 Summary
There are various style of summarizing academic research of this nature, For example
Jagongo (2009) summarized his thesis, by considering each independent variable
separately under its own different heading and finally using one paragraph to further re-
summarized the entire summary. Wawire (2006) used a long easy paragraph style where
he combined all the independent variables and summarized them in a paragraphed under
one heading called summary, While Almadi (2009) treated each independent variable as
a chapter. He used the conclusion as a title to summarize the entire research..
This study adopted the Jagongo (2009) style where each independent variable and its
supportive variables are summarize under separate heading already mentioned in the
conceptual frame work, which further form the basis for the specific objectives of the
112
research.. Time series data was used for the five (5) years period from January 2006 to
December 2010, which gives flexibility of two (2) years before and after the event for
comparative analysis. Two sample of t test statistic were used to compare the mean and
the variance of each supportive independent variable while sign test was used to test the
hypothesis at a 95% level of significant and the conclusion was on the bases of
probability values of the calculated data where 0.05 was considered as a scale of decision
making. For any value below 0.05 the null hypothesis is rejected, while any value above
0.05 means the null hypothesis is not rejected. This means that, GFC of 2008 has an
impact on bank‟s share price performance traded in the stock exchange market in Nigeria.
While if the p value is above 0.05 the alternative hypothesis is not rejected meaning that
GFC of the 2008 has no impact on bank share price performance traded in the stock
exchange market of Nigeria.
Objective one focused on the effects of the global financial crisis on Nigeria banks
liquidity, where saving deposit, bank cash reserved deposit with Central Bank and Cash
repatriation data was analyzed using two (2) sample t tests of means and variance. The
results of the test rejected the P- values below 0.05 at a 95% level of significance, which
also the null hypothesis and do not reject a P-value above 0.05 at a 95% level of
significance as an alternative hypothesis. Another explanation of the result is the
determination of the direction of the variable either at decreasing or increasing level. The
effects of the 2008 global financial crisis are very real and starkly different from the
results before crisis was announced. Therefore it is true that the 2008 GFC had an effect
on bank‟s share price performance from the perspective of liquidity of the bank in
Nigeria stock exchange market.
113
Objective two focuses on determining the effects of the 2008 Global Financial Crisis on
bank currency in Nigeria. To establish the relationship, money in circulation, exchange
rate and bank funds transfer used to draw in to conclusions. Statistical tests reveal that,
the null hypotheses are rejected at a 95% level of significance because the P-values are
below 0.05 Therefore it means there negative effects regarding the event (GFC) and the
currency position of Nigeria bank‟s, which also affected the performance of the industry
stocks price traded in the Nigeria stock exchange market (NSEM) after the crisis was
pronounced, when compared with the price before the crisis.
Objective three is concerned with the inconsistency of the bank‟s share price. To analyze
the objective price index, volatility of price from volume and value perspectives
are measured. The statistical results proved the rejection of null hypotheses at a
95% level of significance. Therefore the alternative hypothesis was adopted. That
implies that the 2008 Global Financial Crisis played a significant role in bank‟s
shares price fluctuation, which also affected the quantity and the quality of the
share prices. The result further reveal that, the stocks volume was reduced from
314.05% before the event was pronounced to negative (32.52%) after the event
was pronounced. Similarly the value of the stocks stand event as 378.75% before
and moved down to negative (48.72) after the event.
Objective four focuses on the risk of taking loans for business in a bank for. The analysis
used the interest rate and bank share certificate as collateral. The statistical evidence
shows that the interest rate of the bank was higher, and the value of the bank share
certificate used for collateral for example the value of the bank share used for collateral
114
before the crisis stands as 46.43% out of 100% security collateral used in the banking
industry. The percentage dropped drastically to negative 5.66% after the crisis
pronouncement, which can be interpreted as more than 100% effect value per share
before the crisis. It value was 100% which of course was a serious concern for bank.
This is because it led to customers servicing the higher interest rate. At the same time
devaluation of the share price value as collateral also contribute to poor performance of
the stocks in the trading flow of the (NSEM) Nigeria Stock exchange. This placed their
business profile at a greater risk.
The entire study focused on effects of the 2008 Global Financial Crisis on bank shares
price performance where various indices were used to find out the relationship between
two (2) variables. To conclude and confirm the overrule assumption, the performance of,
the dependent variable which is the performance of the bank‟s shares price is also tested
using monthly price data. The statistical analysis indicated that the performance of banks
shares price in 2008/2009 drastically decline to zero level, when compared with that of
2006/2007. Therefore all the results confirmed the existence of a negative relationship
between the GFC and the performance of banks shares price. In summary this study
provides factual information, which clearly explains the effects of GFC of the 2008 on
bank‟s shares price performance traded in NSEM.
5.2 Conclusion
The study concluded by observing key findings on each objective as follows:
Objectives one Liquidity crisis which is a function of saving deposit, banks reserved
deposit with Central Bank of Nigeria and cash request were all affected negatively. For
115
example savings depositors were no longer depositing , there hold their cash at hand for
precautionary purpose: the existing savings deposit before the crisis were highly
demanded by the same depositors in a huge withdrawals volume which placed banks to
no option rather than to backup their liquid transaction from cash reserved deposit with
Central Bank. This situations placed money deposit banks in a higher liquidity problem
which reflected on their share price performance to the extend that some of the banks can
not withstand the pressure therefore the only option remain was to go in to distress or
accept the policy of merger or acquisition, which can be directly related to the effects of
2008 global financial crisis on bank shares price performance.
The situations remain the same from currency point of view were the rate of money in
circulations within the period under review became high. Exchange rate also became an
issue to the extent, that the value of Naira against Dollar or Pound or any other strong
currency is more than 100% devaluation. Transfer of funds from Naira to other stronger
curries became the order of the day. All these situations played an important role in
determining bank share prices which also used to determine the performance of the banks
shares price.
Fluctuations of share price which was measured by the price performance and volatility
of the shares from volume and values perspective was all affected drastically. The level
of the price changes which brought about absolute loss resulted to some investors to
commit suicide others full out from the business and those intend to invest in the same
directions change their mine, which placed banks share business in a critical condition all
as a result of the effects of global financial crisis.
116
Banks share certificates which was initial considered among the top security collateral for
loans and other financial advances loss credibility completely because the share had no
value and its may take longer time to regain it glory, therefore accepting it as security
collateral became highly risk. Finally the study stand to accept the fact that the two period
of the comparison i.e. before and after the crisis , the price of banks shares performance is
said to be decline with more than 100% after the crisis when compared with the prices
before the crisis. Therefore without any aorta of dough 2008 global financial crisis had an
effects on performance of banks shares price traded in stock exchange marker in Nigeria
5.3 Policy recommendations
On the bases of problems already identified, this research fills a gap in knowledge
according to the literature review for this research also form the bases of the specific
objectives of the study
The following recommendations were made to serve as a short and long term solution to
the problem of the banking industry in the event of such global financial crisis not only as
applies to the Nigerian banking sector, but also to other countries banking sectors across
the globe.
(1)With reference to the liquidity problem, the researcher is appealing to the federal
government of Nigeria through it financial regulatory agencies to collaborate and develop
a strategy inform of regulations that will force all the money deposit banks to keep a
minimum of quarter of all their customers deposit in a separate account with CBN
different from cash reserve deposit and strictly applicable to saving accounts depositors
which can be redeemable bi- annually. This will attract a reasonable and interest at the
117
same time raise cash reserved deposit by 25% from its present status. This will go along
way in reducing the high level of risk from both depositors and the bank, and restore
confidence by depositors as well attract more customers to improve the level of their
bank deposit. This takes care of the liquidity problem.
(2) Central Bank of Nigeria should improve the services of the bank inspectorate
division, especially on currency operation where money in circulation, transfer of funds,
exchange rate, and other indices should be properly inspected monthly at branch level
and a certificate of clearance and compliance should be given to the branch as evidence
of inspection. At the same time stiffer punishment imposed on branches found to be
violating the rules. This will go a long way in exposing bank as branch weaknesses in
terms of cash management and reduce the general currency problem in banks and banks
and the general economy.
(3)The issue of exchange rates is becoming a very serious problem because since the
pronouncement of the global financial crisis, Nigerian Naira is lowering in value when
exchanged with US Dollar. The situations persist because Nigeria become is importing
more than export. Therefore, government must bad the importations of any goods that
are capable of producing it at commercial quantity for at list a period of fifteen (15) and
above years or levy higher taxes at list 50% of the imported goods book value. This
measure will force the exchange rate to come down and make the Naira currency
appreciate.
(4) With regard to share volatility, it is suggested that the security and exchange
commission of Nigeria should monitor the activities of the stock exchange market share
118
price fluctuation, and play an advisory role to banks that are likely to face. This way, it
act as an evaluator, with a special unit with tools to perform this role, and if the said
advice is in existence there is need to over hold it completely.
(5) To overcome the issues of higher risk taken in business with banks by investors in
line with the stock market business, the CBN and SEC should carry out routine. This will
ensure proper control over the interest rate and valuation of bank‟s share certificate as
collateral possible, independent valuation reports outside the banking and stock exchange
market should be adopted by financial analyst, to ensure that there is a fair valuation of
the bank or firm stocks. This will add more value in using bank stocks as security
collateral.
(6)Nigerians and other stakeholders in government and private organizations that are
directly or indirectly responsible for stock exchange market activities should be
sensitized on the causes and effects of the global financial crisis. They should also daily,
weekly; monthly and annual examine their actions to ensure they are ethical and
professional values. National or nationwide public awareness campaigns must support
this initiative.
5.4 Recommendations for further research
The fact that this study concentrated on banking firms in Nigeria, it does not mean the
effects of the global financial crisis within the financial industry are well and adequately
covered. Even within the banking firms, there are other areas of study that still, need to
be addressed. For examples marketing and human resources were seriously affected by
119
the crisis affected which brought about the present aggressive approach in marketing and
the downsizing of staff within the industry. In addition, Insurance, discount houses,
mortgage institutions, brokers firms and a host of financial industry institutions were
affected but the research is quite silent about them. Therefore this research leads the way
for incoming researchers to explore more knowledge on those areas
5.5 Study Contribution to Knowledge
The study contributions to knowledge is unique in the sense that many studies done on
global financial crisis across the globe are directed towards individual financial firm or
on one of the economic indices of a particular country, and the results obtained did not
capture the entire economy neither sufficient to make a general statement that reflect or
covered the entire industry which the firm study was used as a scope. Unlike this study a
particular industry I.e. (Banking industry) was study and the results obtained provided a
room for generalization statement which many parties can make used of it to correct their
mistakes. Example economists, accountants, financial experts, potential investors,
administrators, marketers, academicians and other within the society
The study also added value to the existing literatures on finance, economics and other
related field of business courses across the world. It also justifies the application of same
statistic approach on each objective variables rather than applying different statistics
method on each objective variable. However the study provided the flexibility of
modification of existing financial/economic model (Event study model) to comparative
event study model which seems not to be very rear in most of academics research.
120
Again the study allowed the introduction of variance in the hypothesis test became
reality. While from Nigerian perspectives as a country, the study will contribute towards
achieving the nation vision 2020 and Millennium Development Gold (MDG) from
financial perspective.
121
REFERENCES
Ali, A (2011) Relationship between Finance and Politics in Nigerian political era: Lesson
from Third
Republic election. Paper presented at National Institute of policy and
strategic (NIPS)
Kuru Jos dated February, 2011
Adeyi, J.A (2008) Profiting with Stocks: Top secrets of making millions from shares
Go-go International Limited, Rwang Pam Jos, Nigeria
AL-Faki, O. (2008)” Nigeria Economic Review”, 3rd
quarterly publication
Federal office of statistic, Abuja Nigeria
African Development Bank. (2009) “The impact of global financial crisis on Africa”
A conference paper presented in Abidjan, on 7/10/2009 Unpublished
Amedu, S (2010) Global Financial Market Meal down and the Nigerian Stock
Market crash of 2008: Any lesson for Market Players and Regulations?
Journal of Securities and Finance NSE publication vol.15 No 1
Amusa, O.I. (1994) “Banking Law and Regulation: Special cases and Solution”2rd
2rd edition, University of Ibadan Press, Nigeria
Anthony. (2006) Testing Stock Market Efficiency Hypothesis in Tanzania
Unpublished M.A (Economics) Thesis, University of Dares Salam.
Anup, S. (2008) “Global Financial Crisis 2008 global issues”(http://www/Global
Issues.org/Article/789/Global Financial –Crisis Retrieved on 11/09/2008
Baja, J.V. (2008) “Global Financial Crisis of 2008”Wikkipedia the free Encyclopaedia
Ws of Roller Coaster Hiplash End File://c;/ Document 094 I.E.C.F
Bernard, V. and Thomas, J. (1990) Evidence that Stock Price do not fully reflect
122
The implications of Current Earnings for Future Earning, journal of
Accounting and Economics
Brendan, V. (2008) Trade Talk, Business Day Exporter, December.”The social
And Economic Consequence of the GFC on Developing Countries and
Emerging Economies Focus on Africa” Paper presented at “In went Die
Dialogue on effect of GFC December 2008, United Kingdom
Bush, P andVanders, G. (2008) “An Overview of 1930 Economic Depression and its
Consequences in Larger Economic Market” A public lecture in world
and Economic Controversy Wikipedia file://c: Document 0771 AFC. Retrieved on
24/12/2012
Chandra, P. (2010) Investment Analysis and Portfolio Management 3 edt Tata McGraw
Hill Education Private Limited, New Delhi India.
Campbell, J.Y,Lo, A. W, and Mack inlay, A.C. (1997) The Economy of Financial
Markets, Princeton University Press, Princeton, New Jersey
Cooper, D and Schindler, P (2006) Business Research Method, McGraw Hill
Publication .Nine edition U.K
Danjuma, I (2009) “A way foreword to Nigeria Banking Sector in a period
Of Global Financial Crisis” Seminar paper presented in B.U.K dated
Nov, 2009.( Unpublished)
Doguwa, S (2010) Factors Responsible for poor Credit management in Money
Deposit Banks in Nigeria: CBN Bullion publication vol 1 No2
2010. Central Bank Research unit publication
123
Erdad,E (2002) Price determination as a factor affecting larger firms production in
Nigeria. Msc Thesis University of Jos, Nigeria Unpublished
Essang, O and Olayide, O. (2011) “Banking Practice From Legal Framework” A paper
Presented at Nigeria Institute of Bankers Annual Conference Lagos, Nigeria
Evans-Pritchard, A. (2007) “Dollar Tumbles as Huge Credit Crunch Looms”(http://
Www. Telegraph.co.u.k media group limited Retrieved on 15/3/201 Unpublished
Economist (2008) Structural Crucks: “Trouble ahead for Global House Prices”
Conference paper of Economist and Finance (http://www.economist.com/
Financial/ display Retrieved on 15/01/2013
Fantami, I.S (2009) “The status of the Muslim Investment in the present world”
A lecture presented in North-East Muslim professional forum ATBU
Bauchi. Unpublished
Francis, I. (2008) “The social and Economic Consequences of the Global Financial
Crisis on Developing Countries and Emerging Economy A focus on Africa”
A paper presented at “IN went Die Dialogue on effect of GFC and merging
Market Dec, 2008. United Kingdom
Frankler, M, (2008) “Tumble without Borders” A special Article on world
Business The New York Times (http://www.nytimes.com/2013/01/24/
Business/world business/24won) Retrieved on 24/01/2013
Garba, A. (2010) Challenges and prospect on banks shares in Nigeria economy. Journal
Publication of Economic and Business matters Vol2 No 34, ABU Zaria,
Nigeria
124
India National Bureau of Statistical Data (2009) Global Financial Crisis: Courses
Effects and Solution on Indian economic policies INBSD publication
(http://www.icb.res.com/2009/2010
Jagongo, A.O (2009) Constraints to Saving Mobilization for Growth of Selected
Women-owned MSEs in Kisumu and Kakamega Districts in Kenya
PhD thesis unpublished
Kaldor, M. (2008) “Crisis as a prelude to a new age “Open Democracy an article
Of finance Volume 2 New York City
Keymakei, O. (2012) “Global Financial Crisis and Nigeria Economic Development”
A paper presented at ICINE published on Financial Stand and Magazine Vol 9
No 332.
Kothari, C.R (2010) Research Methodology: Method and Techniques New Age
International Limited, New Delhi
Kwanashie, M. (2008) “The Status of Western Firms within the period of Financial
Problem Focus on African Economy” Paper presented at National
Conference of economic and Financial Institutions Published in JEMS
A.B.U Zaria, Nigeria
Kyawa, S (2008) Macro-economic Policies approach to economic sector in a period of
Financial difficulties in under developing Countries: Case of Nigeria
Journal paper No13 vol.2 Jossms Bayero University Kano, Nigeria.
Landler, M. (2008) “West is in Talk on Credit to Aid Poorer Nations” (http://www
.nytimes.com/2012/12/24/Business/ World business/24/the New York Time
125
McClure, D. L (2008) “Software Designers in Stock Trading Market” Chicago Stock
Trading Journal, vol 4 No 2 (2008)
Mac, Jonas, Washington, Douglass and Maria Philip (2009) Review on Australian
economic Policies and it relationship with USA “Focus on financial
intermediations in a Period of economic controversy” Journal of American
financial matters and Other related field vol 3 No 16 November, 2009
Morton, P (2008) Using Critical Communication in Weekly Stock Assessment. A
journal of Weekly trading vol 1 No 12 of (2008)
Musleh, D. (2009) Global Financial Crisis:”Implication for Macroeconomic and
Development Policies in Pakistan” A paper presented at a regional high Level
Workshop on strengthening the response to the GFC in Asia-
Pacific, Dhaka Bangladesh (unpublished)
Naboaho, L. (2009)” The impact of the GFC on Employment and Labour
Market in African Countries, a preliminary survey” Paper presented at
African Association for Public administrations and Management (AAPAM)
31st Annual round table Conference Kenya Institute of Administration (KIA)
Nairobi (unpublished)
Nikolas, K. And Alexander, G.K. (2012) “Problem of African Economy and African
Banks in focus” World Bankers Day (http://www.worldbank.com/2012
(Unpublished)
Norris, F. (2008) “United Panic “(http://Noris.blogs.nytimes.com/2008/10/24/
Economic and financial time journal, The New York Times
126
Nirupam, B. (2011) (Global Financial Crisis its impact on India and the Policy
Response) No 5 paper presented at Columbia Global Centre /South Asia
Columbia University New York City
Obere, J.A.(2009) “Essays on an emerging stock market :The case of Nairobi Stock
Exchange” (statistical Distribution of Returns, Market Seasonality and
Reactions to Dividend Announcement) PhD thesis (unpublished)
Okereke,B (2009) Review of Nigerian Stock Market and it impact on performing Stocks
In the economy Journal of Security and finance NSE publication
Vol 15 No 1
Olusegun, O. (2009) “The Global Financial Crisis and Implication for Nigeria Financial
System” An article published in Financial Standard dated 12 January,
2009
Oso,W.Y. and Onen, D(2011) A general Guide to Writing Research Proposal and Report
Jomo Kenyatta Foundation publishers, Nairobi, Kenya .
Osoala, S.O (1990) An Introduction to Research Methodology “Principles and Practice
2rd ed U.I Publishers Ibadan Nigeria.
Paulson, M.H. (2007) “Treasury and Federal Housing Finance Agency Action to
Protect Financial Markets and Tax payers “U.S Department of Treasury.
(http://www.gov/press/releases/hp1129.htm 7/09/2012 Wikipedia
Reserved Bank of Australia (2009) “Feature Article on Global Financial Crisis and
It’s Impact on Australia Economy
“(http://www.rba.a.gov.au/publicatios/rba/ Index.htm
127
Rose, W. N (2003) what define Liquidity of the Stock Market? The case of the NSM
KIPPRA. A paper presented at Economic and Financial Forum
Dated 29 December, 2003
Sanusi, L.S. (2009) “GFC Impact in Nigeria Financial Reforms and the role of
Multilateral Development Banks and IMF “paper presented to House
Of Finance service committee of US congress.( unpublished
Sao, P. (2008) “Global Financial Crisis and Implication for Developing Countries
G-20 Finance Ministers Meeting “World Bank publication dated Nov,
2008. Retrieved on 10/11/2012
Saunders,M ,Lewis ,P, Thornhill, A (2009) Research Methods For business Students
Pearson Education Limited, Edinburgh Gate, England. Fifth edition
Soludo, C.C. (2005) “Nigeria Banking Reforms, a step towards Re-enforcement of
Banking Sector “CBN quarterly publication 2005”
Tella, S.A (2009) The Global Economic Crises and Nigerian stock Market
Issues on Contagion Journal on securities and Finance publication
of NSE vol 14 No 1
Torbat, A and Akbar, J (2011) Socio- economic Implication of Global Economic
Meltdown in European Financial Derivatives Market, Journal of
London Stocks Market (4 qts) publication of 2008
Udeme, O (2009) An update reports on Stock Market activities after Financial Meltdown
of 2008. Annual publication of NSE bulleting first quarter report
Ujunwa, N (2011) Market reaction and consequences on Global Financial Crisis Journal
Of NSEM title” what is the way forward”? Vol 18 No 4
128
Whipple, L .C (2007)” Return to investment in USA”A journal of E-business advisor
on bull Trading vol 4 No 18 of (2007)
Wawire, N.H.W. (2006) the Determinants of Tax Revenue in Kenya ( PhD thesis
Unpublished)
Westland, J. (2006) the Project Management Life Cycle: A Complete Step-by- Step
Methodology for Initiating, Planning, Executing and Closing a Project
Successfully, United Kingdom: Konan Page Limited
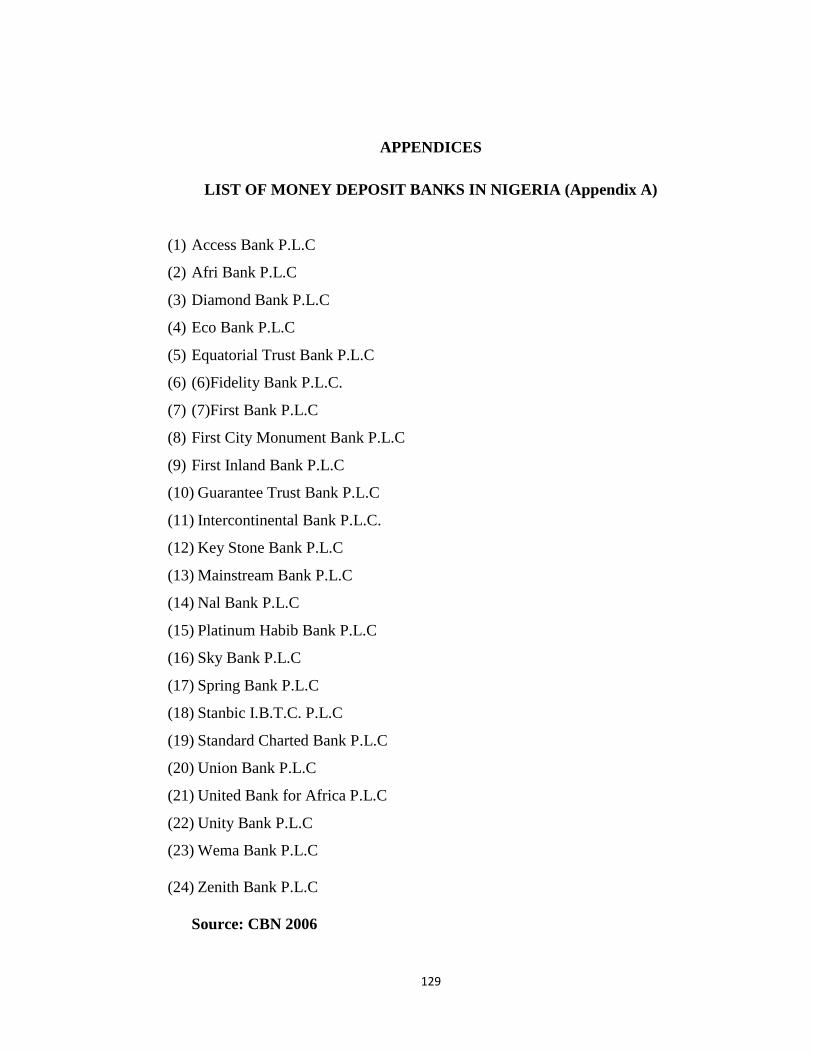
129
APPENDICES
LIST OF MONEY DEPOSIT BANKS IN NIGERIA (Appendix A)
(1) Access Bank P.L.C
(2) Afri Bank P.L.C
(3) Diamond Bank P.L.C
(4) Eco Bank P.L.C
(5) Equatorial Trust Bank P.L.C
(6) (6)Fidelity Bank P.L.C.
(7) (7)First Bank P.L.C
(8) First City Monument Bank P.L.C
(9) First Inland Bank P.L.C
(10) Guarantee Trust Bank P.L.C
(11) Intercontinental Bank P.L.C.
(12) Key Stone Bank P.L.C
(13) Mainstream Bank P.L.C
(14) Nal Bank P.L.C
(15) Platinum Habib Bank P.L.C
(16) Sky Bank P.L.C
(17) Spring Bank P.L.C
(18) Stanbic I.B.T.C. P.L.C
(19) Standard Charted Bank P.L.C
(20) Union Bank P.L.C
(21) United Bank for Africa P.L.C
(22) Unity Bank P.L.C
(23) Wema Bank P.L.C
(24) Zenith Bank P.L.C
Source: CBN 2006
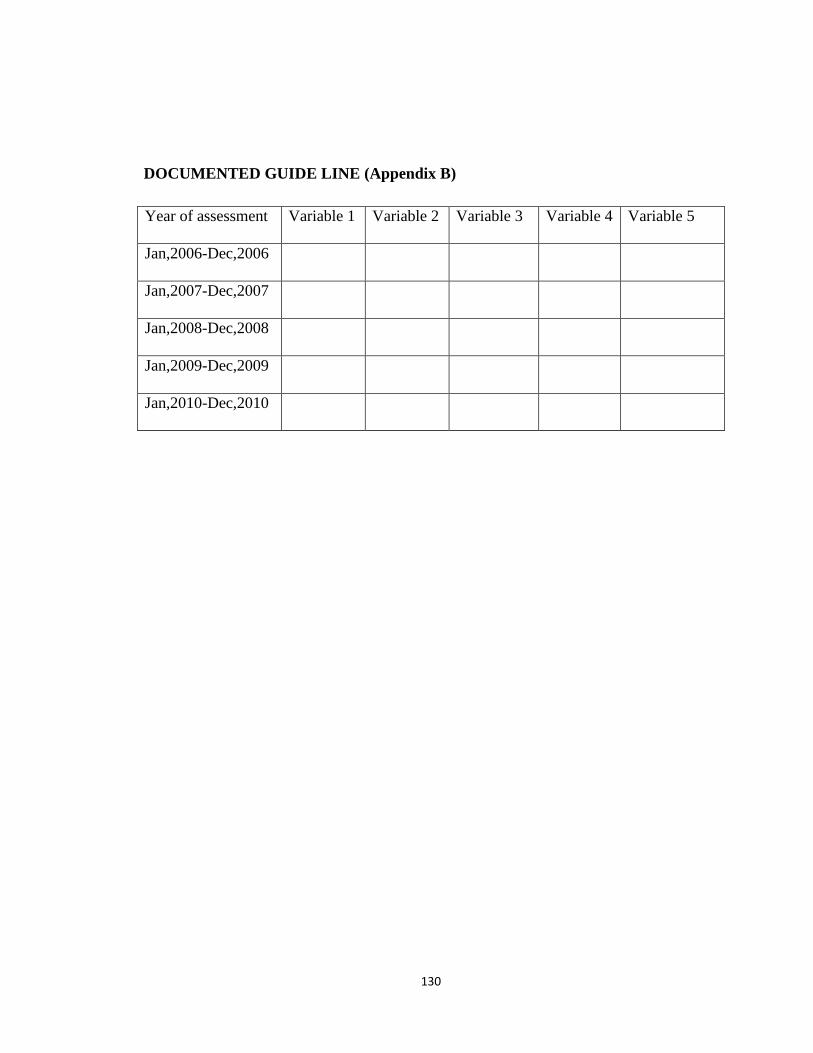
130
DOCUMENTED GUIDE LINE (Appendix B)
Year of assessment Variable 1 Variable 2 Variable 3 Variable 4 Variable 5
Jan,2006-Dec,2006
Jan,2007-Dec,2007
Jan,2008-Dec,2008
Jan,2009-Dec,2009
Jan,2010-Dec,2010