Effectiveness Study for the Development of a Home ... Study for the Development of a Home...
133
Effectiveness Study for the Development of a Home Fortification Programme for Young Children in Zambia – Endline Report June 2015
-
Upload
duongxuyen -
Category
Documents
-
view
213 -
download
0
Transcript of Effectiveness Study for the Development of a Home ... Study for the Development of a Home...

Effectiveness Study for the Development of a Home Fortification Programme for Young Children in Zambia – Endline Report
June 2015

2
Executive Summary
While earlier studies have demonstrated MNP to be efficacious and effective in specific settings, it is
recognized that the findings from one country are not transferable to another due to differences in
acceptability in accordance with cultural practices, economics, food availability and particularly infant and
child feeding practices. The MNP Home Fortification project was designed to fill the need for a country
specific programme in Zambia with relevant training materials for health workers, local packaging,
messaging and communication materials for caregivers and their families, as well as a distribution system.
The ‘Home Fortification Programme with MNP for Young Children in Zambia’ was designed as a multiphase
project with the first phase consisting of two components, a feasibility study and a 30-day trial of MNP. The
feasibility study included key informant interviews and focus group discussions, which assessed current
feeding practices, perception of MNP, potential barriers to MNP introduction, knowledge of anaemia, and
tested local package designs. This component was completed in May 2012. The second component, a 30-
day trial of MNP, was completed in July 2012, and assessed the acceptability and utilisation of MNP among
60 households using two different delivery strategies. The findings of the feasibility study and the 30-day
trial compiled in two separate reports1 were integrated into the design of the pilot phase, with the
ultimate goal of this phase being to inform how best to operationalize and scale up the MNP intervention
in Zambia. In addition, the findings from the formative research were used to develop the training
manuals, training guidelines, instructions of use, FAQ, and BCC and information, educational, and
communication (IEC) materials for MNP, for the pilot phase as well as the Zambian package design.
This report presents the endline findings from an effectiveness study nested within a larger home
fortification programme targeting children 6-23 months of age in Mbala District, Northern Province
Zambia. In the study, micronutrient powders (MNP), locally branded as Chipolopolo, were provided to
caregivers in an intervention group free of charge alongside training on infant and young child feeding
practices (IYCF), and insecticide treated nets (ITN). Another group, the control group, received the same
treatment with the exception of the Chipolopolo micronutrient powder. Endline data was collected 12
months after distribution of Chipolopolo commenced, and data was also gathered at baseline, before the
programme started. Data included anthropometrics, various biochemical indicators including haemoglobin
(Hb) concentrations and measures of iron status, as well as household information collected via a
questionnaire that was answered by caregivers of the children enrolled in the study.
Both the intervention and control groups saw improvements in their average Hb concentrations and a
decrease in the prevalence of anaemia over the course of the study, down to 22% overall from 57% at
baseline; however, the differences between the two groups did not prove to be statistically significant.
There was also inconclusive evidence of a dose response relationship between reported number of
Chipolopolo boxes received and endline Hb concentrations. One potential explanation for the lack of a
clear effect from Chipolopolo was the delay, five months, between the beginning of distribution and
baseline data collection, as well as other issues, including instances of spoilage of the product causing
some areas to suspend distribution and a higher than expected rate of loss to follow up which reduced the
sample size. It is also difficult to make definitive comparisons between the two treatment groups given the
lack of randomization at baseline, which increased the possibility of confounders masking any effect.
1 MoH/UNICEF/UBC. Formative Research for the Development of a Home Fortification Programme for Young Children in Zambia – MNP Feasibility Study Report, July 2012 AND MoH/UNICEF/UBC. Formative Research for the Development of a Home Fortification Programme for Young Children in Zambia – MNP 30-Day Trial Report, October 2012

3
Despite this, there was a highly statistically significant difference in the prevalence of iron deficiency
between the two groups, with a rate of 49% in the intervention group and 66% in the control group when
determined using serum transferrin receptor (STfR), the most appropriate indicator of iron status in this
setting
Importantly, acceptability of Chipolopolo in the intervention group was high, with the vast majority of
caregivers that were interviewed at endline continuing to use the product and stating that they would
recommend Chipolopolo to other mothers. Caregivers also reported that they attributed a number of
positive effects to the product such as increased energy and appetites. The high level of acceptability was
also in spite of the fact that approximately half of the caregivers reported hearing negative rumours and/or
being discouraged from using Chipolopolo by family or community members. This finding points to the
importance of proper community mobilization and ongoing education. There was also evidence that
caregivers were not always using Chipolopolo properly, particularly when mixing it with food, suggesting
the need for further outreach and education on use.
A number of other positive results were found. Of note nearly all households reported that their child was
now sleeping under a mosquito net (97%).
Another area of improvement was the hand washing practices of caregivers, alongside an increase the
percentage of households treating water to make it safe to drink. This is possible explained by the IYCF
counselling sessions that mothers are now attending at greater rates. In line with this, there were
improvements in the IYCF knowledge of caregivers, although this was only in relative terms when
compared to knowledge at baseline. Despite these improvements, there were still a number of areas
where knowledge was low, specifically caregiver knowledge about anaemia and iron rich foods. The rate of
continued breastfeeding was also low, highlighting the importance of ensuring that actual IYCF practices
are in line with IYCF knowledge.
There was an overall decrease in morbidity. This was determined by the lower prevalence of fever, cough
and diarrhoea, alongside biochemical assessment of inflammation status; however, the prevalence of
stunting worsened. While unfortunate, this is not entirely unanticipated as rates of stunting are generally
higher among children of the age measured at endline.
Overall, the rate of malaria parasitism in the sample was 12%; the prevalence was 15% in the control and
10% in the intervention group, although this difference was not statistically significant. Likewise, there was
not a statistically significant difference in rates of malaria parasitism between boys and girls. While, the
prevalence of malaria parasitism at endline was slightly higher than at baseline, given that endline
occurred during a different time of year, it is difficult to make a direct comparison as seasonality impacts
malaria transmission in Zambia. Among the cases of malaria in the sample, 90% were of Plasmodium
falciparum, 8% were of Plasmodium malaria, and for 2% species was not identified. Children with malaria
parasitism had statistically significantly lower haemoglobin concentrations and higher concentrations of
STfR. Finally, the catchment areas involved in the study had varying prevalances of malaria: with a
prevalence of malaria parasitism of 27% in Kaka, 21% in Nondo, 19% in Tulemane, 11% in Senga, 9% in
Mpande, 8% in Kawimbe, 7% in Mambwe Mission, 6% in Mbala Urban, and 2% in Kamuzwazi.
It is important to note that while there were concerns over the safety of iron supplementation in malaria
endemic zones in the past, several meta-analyses of MNP and malaria have since been conducted to
4
examine the safety of MNP in malaria zones. These meta-analyses found that the use of MNP does not
increase morbidity or mortality from malaria, as long as treatment and surveillance programmes are in
place. In light of this information, the current position of the WHO is that the use of MNP in malaria zones
is acceptable as long as malaria control programmes are in place, as is the case in Zambia and Mbala
generally, and this study specifically, as evidence by the high usage of ITN.
An external monitoring exercise conducted at midline in May 2014 identified poor coverage rates
attributed to inadequate community sensitization affecting acceptance of MNP in intervention areas and
to a lesser extent difficulties in the recording and reporting of programme information. In response to
these unanticipated challenges a review of the social and cultural barriers to uptake and identification of
local solutions was undertaken as well as a review of the monitoring system with the aim of creating more
user-friendly tools for the system’s users, in particular community health volunteers with varying levels of
literacy. To strengthen recording and reporting of Chipolopolo programme data, the exercise and further
experiences revealed that for any information to be recorded accurately and completely, only the number
of beneficiaries who receive Chipolopolo during a distribution event should be documented.
Suspicions and poor acceptance largely stemmed from activities relating to the effectiveness study
component of the pilot despite the initial community mobilization done prior to the start of baseline data
collection. These included the fear of Satanism resulting from the blood draws, the use of length boards for
anthropometric measurements and the association made with coffins, and the exclusion of severely
acutely malnourish children or the ‘targeting’ of only ‘healthy children’ for MNP when it was understood by
caregivers that sick children would benefit most from these based on the communicated benefits. Other
issues identified, not associated with the research, highlighted the need for carefully constructed messages
and uniform responses to frequently asked questions for programme implementers that minimize
potential rumours. A revised communications strategy based on lessons learned was drafted and will be
instrumental in avoiding similar issues as the programme is scaled up nationally.
In conclusion, any future scale-up of the programme to target anaemia and other forms of malnutrition in
infants in Zambia would need to be comprehensive in both approach and delivery. MNP have proven
effective in a number of settings, as have mosquito nets, and water treatment, particularly when
integrated as a complete package. However, the delivery and implementation of the package is of equal
importance to the contents itself, and results from this study provide valuable information to build an
effective system of physical delivery of MNP, community sensitization, and the required education of
caregivers and other members of the community.

5
Contents
Executive Summary ................................................................................................................................ 2
Contents ................................................................................................................................................. 5
List of Tables .......................................................................................................................................... 7
Acronyms and Abbreviations ................................................................................................................ 12
1. Background ................................................................................................................................... 13 1.1. Home Fortification with Micronutrient Powders ................................................................................... 14 1.2. Formative Research in Zambia .............................................................................................................. 15 1.3. The MNP Pilot Programme ................................................................................................................... 15
1.3.1. Objectives of the MNP Pilot Programme .................................................................................................. 16
2. Methods ........................................................................................................................................ 16 2.1. Sampling ............................................................................................................................................. 16
2.1.1. Inclusion criteria ....................................................................................................................................... 16 2.1.2. Exclusion criteria ....................................................................................................................................... 17 2.1.3. Sample size ............................................................................................................................................... 17
2.2. Evaluation Tools .................................................................................................................................. 18 2.2.1 Household Information.............................................................................................................................. 18 2.2.2 Anthropometric Data (Weight, Length, Age, Mid-Upper Arm Circumference) ........................................ 18 2.2.3 Biochemical Data ....................................................................................................................................... 18
2.3. Community Mobilisation & Sensitisation .............................................................................................. 20 2.4. Data Collection .................................................................................................................................... 20 2.5. Data Entry & Management ................................................................................................................... 21 2.6. Data Analysis ....................................................................................................................................... 21 2.7. Ethical Consideration ........................................................................................................................... 21 2.8. Institutional Arrangement .................................................................................................................... 22
3. Results ........................................................................................................................................... 22 3.1. Module 2: Chipolopolo Use .................................................................................................................. 22
3.1.1. Utilization and Adherence ........................................................................................................................ 22 3.1.2. Perceived Changes .................................................................................................................................... 28 3.1.3. Acceptability ............................................................................................................................................. 32 3.1.4. Delivery of Chipolopolo ............................................................................................................................ 35 3.1.5. Delivery of Chipolopolo Messages ............................................................................................................ 37 3.1.6. Knowledge of Chipolopolo ........................................................................................................................ 38
3.2. Module 3: Mother’s Knowledge on IYCF and Anaemia .......................................................................... 40 3.2.1. IYCF Counselling ........................................................................................................................................ 40 3.2.2. IYCF Knowledge ......................................................................................................................................... 41 3.2.3. Knowledge of Anaemia ............................................................................................................................. 44
3.3. Module 4: Infant and Young Child Practices and Food Consumption ...................................................... 47 3.3.1. Breastfeeding and Feeding Practices ........................................................................................................ 47 3.3.2. Food Consumption .................................................................................................................................... 48
3.4. Module 5: Child Health and Health Seeking Behaviour .......................................................................... 51 3.5. Module 6: Early Childhood Development .............................................................................................. 53 3.6. Module 7: Drinking Water, Hygiene, and Sanitation .............................................................................. 54 3.7. Module 8: Household Information ........................................................................................................ 56 3.8. Module 9: Anthropometry and biochemical assessment ....................................................................... 57
3.8.1. Anthropometry ............................................................................................................................................. 57 3.8.2. Biochemical assessment ............................................................................................................................... 60
4. Discussion ......................................................................................................................................... 71

6
4.1. Chipolopolo .......................................................................................................................................................... 72 4.1.1. Utilization and Adherence ........................................................................................................................ 72 4.1.2. Perceived Changes .................................................................................................................................... 73 4.1.3. Acceptability ............................................................................................................................................. 74 4.1.4. Delivery of Chipolopolo ............................................................................................................................ 75 4.1.5. Delivery of Chipolopolo Messages ............................................................................................................ 76 4.1.6. Knowledge of Chipolopolo ........................................................................................................................ 76 4.1.7. Chipolopolo and Child Health ................................................................................................................... 76
4.2. Drinking Water, Sanitation, and Hygiene .............................................................................................. 79 4.3. Early Childhood Development .............................................................................................................. 79 4.4. Child Health and Health Seeking Behaviour .......................................................................................... 80 4.5. Caregivers’ Knowledge on IYCF and Anaemia ........................................................................................ 81 4.6. Infant and Young Child Feeding Practices and Food Consumption ......................................................... 82
5. Conclusions ...................................................................................................................................... 82
6. Appendices ....................................................................................................................................... 85 Appendix 1. Contents of MNP ........................................................................................................................ 85 Appendix 2. Mbala District Map (with Intervention and Control Sites Marked) ................................................ 86 Appendix 3. Selected Zones in Study Catchment Areas (Control and Intervention) ........................................... 87 Appendix 4. Data Collection Schedule ............................................................................................................. 91 Appendix 5. TDRC Approval Letter .................................................................................................................. 96 Appendix 6. CREB Approval Letter .................................................................................................................. 97 Appendix 7. Endline Intervention Questionnaire ............................................................................................. 99 Appendix 8. Endline Control Questionnaire .................................................................................................. 122

7
List of Tables
Table 1 | Iron Deficiency Classifications Using Serum Ferritin ...................................................................................... 20
Table 2 | Annual and Weekly Exposure to Chipolopolo .................................................................................................. 22
Table 3| Comparison of Baseline Household and Child Characteristics between Individuals Who Were
and Were Not Consuming Chipolopolo at Endline ........................................................................................................... 23
Table 4| Comparison of Baseline Haemoglobin (Hb) Concentrations and Anthropometrics between
Those in the Intervention Group who were and were no Longer Receiving Chipolopolo .............................. 23
Table 5 | Discontinuation of Chipolopolo Use ..................................................................................................................... 24
Table 6 | Temporary Discontinuation of Chipolopolo Use ............................................................................................. 25
Table 7 | Chipolopolo Sachet Use per Child in Study (Self Report) ........................................................................... 25
Table 8 | Pressure to Share Chipolopolo ................................................................................................................................ 25
Table 9 | Experience with Chipolopolo .................................................................................................................................... 26
Table 10| Comparison of Caregiver Experiences of Using Chipolopolo between Individuals Who Were
and Were Not Consuming Chipolopolo at Endline ........................................................................................................... 26
Table 11 | Common Food Vehicles for Chipolopolo ......................................................................................................... 27
Table 12 | Finishing Chipolopolo in One Sitting and Handling of Leftovers ......................................................... 27
Table 13 | Caregiver Motivation(s) for using Chipolopolo .............................................................................................. 28
Table 14| Comparison of Caregiver Motivation(s) to use Chipolopolo between Individuals Who Were
and Were Not Consuming Chipolopolo at Endline ........................................................................................................... 28
Table 15 | Perceived Changes due to Chipolopolo ............................................................................................................ 29
Table 16 | Effects of Perceived Changes in Food following addition of Chipolopolo on Child’s Appetite
.................................................................................................................................................................................................................... 29
Table 17 | Side Effects or Changes in Child’s Health or Behaviour after Consuming Chipolopolo ............. 31
Table 18| Comparison of Caregiver Reported Effects of Chipolopolo usage Comparing Individuals Who
Were and Were Not Consuming Chipolopolo at Endline ............................................................................................... 32
8
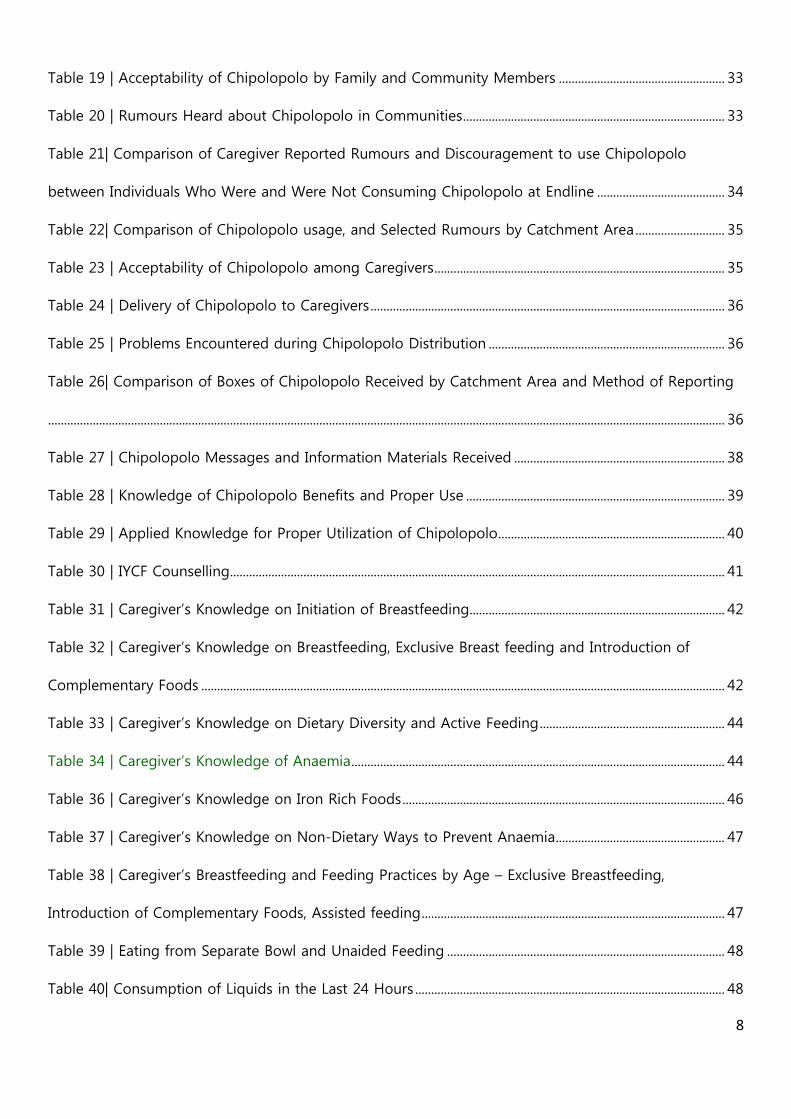
Table 19 | Acceptability of Chipolopolo by Family and Community Members .................................................... 33
Table 20 | Rumours Heard about Chipolopolo in Communities .................................................................................. 33
Table 21| Comparison of Caregiver Reported Rumours and Discouragement to use Chipolopolo
between Individuals Who Were and Were Not Consuming Chipolopolo at Endline ........................................ 34
Table 22| Comparison of Chipolopolo usage, and Selected Rumours by Catchment Area ............................ 35
Table 23 | Acceptability of Chipolopolo among Caregivers ........................................................................................... 35
Table 24 | Delivery of Chipolopolo to Caregivers ............................................................................................................... 36
Table 25 | Problems Encountered during Chipolopolo Distribution .......................................................................... 36
Table 26| Comparison of Boxes of Chipolopolo Received by Catchment Area and Method of Reporting
.................................................................................................................................................................................................................... 36
Table 27 | Chipolopolo Messages and Information Materials Received .................................................................. 38
Table 28 | Knowledge of Chipolopolo Benefits and Proper Use ................................................................................. 39
Table 29 | Applied Knowledge for Proper Utilization of Chipolopolo ....................................................................... 40
Table 30 | IYCF Counselling ........................................................................................................................................................... 41
Table 31 | Caregiver’s Knowledge on Initiation of Breastfeeding ................................................................................ 42
Table 32 | Caregiver’s Knowledge on Breastfeeding, Exclusive Breast feeding and Introduction of
Complementary Foods .................................................................................................................................................................... 42
Table 33 | Caregiver’s Knowledge on Dietary Diversity and Active Feeding .......................................................... 44
Table 34 | Caregiver’s Knowledge of Anaemia ..................................................................................................................... 44
Table 36 | Caregiver’s Knowledge on Iron Rich Foods ..................................................................................................... 46
Table 37 | Caregiver’s Knowledge on Non-Dietary Ways to Prevent Anaemia ..................................................... 47
Table 38 | Caregiver’s Breastfeeding and Feeding Practices by Age – Exclusive Breastfeeding,
Introduction of Complementary Foods, Assisted feeding ............................................................................................... 47
Table 39 | Eating from Separate Bowl and Unaided Feeding ....................................................................................... 48
Table 40| Consumption of Liquids in the Last 24 Hours ................................................................................................. 48
9
Table 41| Food Consumption in the Last 24 Hours ........................................................................................................... 49
Table 43 | Child Morbidity 2 weeks prior to Endline Data Collection ....................................................................... 52
Table 44 | Health Seeking Behaviour of Caregivers ........................................................................................................... 53
Table 45 | Caregiver’s Knowledge on Child Stimulation .................................................................................................. 53
Table 46 | Child Stimulation Practices in Previous Three Days ..................................................................................... 54
Table 47 | Person that Stimulates Child (N=431) ................................................................................................................ 54
Table 48 | Water Treatment Practices ...................................................................................................................................... 55
Table 49 | Hand Washing Practices for Caregivers and Children ................................................................................ 56
Table 50 | Household information ............................................................................................................................................. 56
Table 51 | Caregiver’s Relationship to Child .......................................................................................................................... 57
Table 52 | Stunting, Wasting, and Underweight by Treatment .................................................................................... 57
Table 53 | Stunting, Wasting and Underweight by Sex ................................................................................................... 58
Table 54 | MUAC Classification and Bilateral Oedema by Treatment ....................................................................... 58
Table 55 | MUAC Classification and Bilateral Oedema by Sex ...................................................................................... 59
Table 56 | Change in Anthropometrics by Intervention Group .................................................................................... 59
Table 57| Comparison of Endline Anthropometrics between Those in the Intervention Group who were
and were no Longer Receiving Chipolopolo ......................................................................................................................... 60
Table 58 | Haemoglobin (Hb) Concentrations and Anaemia by Intervention Group ......................................... 60
Table 59 | Haemoglobin (Hb) Concentrations and Anaemia by Sex.......................................................................... 61
Table 60 | Endline Haemoglobin (Hb) Concentrations and Changes in Hb Concentrations of Children in
the Intervention Group by Number of Boxes of Chipolopolo Received (Caregiver Reported) ..................... 61
Table 61| Endline Haemoglobin (Hb) Concentrations and Changes in Hb Concentrations of Children in
the Intervention Group by Number of Boxes of Chipolopolo Received (As Recorded On Distribution
Card Reported) .................................................................................................................................................................................... 62

10
Table 62| Haemoglobin (Hb) Concentrations and Caregiver Reported Use of Chipolopolo in Intervention
Group....................................................................................................................................................................................................... 62
Table 64| The Inflammation Markers C-Reactive Protein (CRP) and Alpha-1-acid glycoprotein (AGP) by
Treatment Group ................................................................................................................................................................................ 63
Table 65| Iron Deficiency by Sex Using Different Definitions ........................................................................................ 64
Table 66| Iron Deficiency by Treatment Group Using Different Definitions ........................................................... 65
Table | Iron Deficiency Anaemia (IDA) by Sex Using Different Definitions ............................................................. 66
Table 68| Iron Deficiency Anaemia (IDA) by Treatment Group Using Different Definitions ........................... 66
Table 69| Pearson’s Correlations between Selected Biochemical Indicators .......................................................... 67
Table 70| Linear regression of Endline Haemoglobin (Hb) Concentrations (g/dL), using Serum Ferritin
Concentrations (µg/L), and Inflammation Status from C-Reactive Protein (CRP) and Alpha-1-acic
glycoprotein (AGP) ............................................................................................................................................................................ 68
Table 71| Linear regression of Endline Haemoglobin (Hb) Concentrations (g/dL), using Inflammation
Adjusted Serum Ferritin Concentrations (µg/L), and Inflammation Status from C-Reactive Protein (CRP)
and Alpha-1-acic glycoprotein (AGP) ....................................................................................................................................... 68
Table 72| Linear regression of Endline Haemoglobin (Hb) Concentrations (g/dL), using Baseline Hb
Concentrations (g/dL), Vitamin A Capsule Status, IYCF Counselling Status, Water Treatment Status,
Mosquito Net Use and Treatment Group .............................................................................................................................. 69
Table 73| Malaria Parasitism and Selected Indicators at Endline ................................................................................. 70

11
Acknowledgments
This report is authored by Zachary Daly MSc, Martina Northrup-Lyons MPH, RJ Reid, Myra Cheung BSc and
Daria Hutchinson BSc from the University of British Columbia (UBC).
We are grateful to Irish Aid for funding the research for the development of a Home Fortification
programme for young children in Zambia.
We would like to thank Agnes Aongola, Chief Nutrition Liaison Officer from the Ministry of Health, for her
continuous support and effort. We would also like to thank Dominique Brunet and Ruth Siyandi from
UNICEF Zambia for their extensive technical and logistical support. We would like to thank Ulembe
Chinyemba, Chipolopolo Project Coordinator, Edwin Mumba, Mbala District Nutritionist and Daniel
Chiluba, Nutritionist from the Provincial Medical Office, for their invaluable work throughout the study and
tireless efforts in the implementation the Chipolopolo pilot programme. We thank the team from the
National Food and Nutrition Commission (NFNC) for all their efforts and excellent community mobilisation
and sensitisation. We also thank the TDRC team under the supervision of Justin Chileshe for their support
and management of the blood samples. We gratefully acknowledge the Zambian research and survey
team, many of who have been part of the data collection effort since the start of the formative research,
for their time and superior effort. Without all of them this work would not have been possible.
Last by not least, we would like to acknowledge all the caregiver-child pairs who voluntarily participated
and therefore, have make a huge contribution towards the development of a national Home Fortification
programme in Zambia for current and future generations to come.
12
Acronyms and Abbreviations
AGP Alpha-1 acid glycoprotein BCC Behaviour Change Communications CA Catchment Area CHW Community Health Worker CREB Clinical Research Ethics Board CRP C-reactive protein DMO District Medical Office ECD Early Childhood Development ELISA Enzyme Linked Immunosorbent Assay Hb Haemoglobin HCP Health Care Provider HF-TAG Home Fortification Technical Advisory Group IDA Iron deficiency anaemia IYCF Infant and Young Child Feeding ITN Insecticide Treated Net MCDMCH Ministry of Community Development, Mother and Child Health MNP Micronutrient Powders MoH Ministry of Health MUAC Mid Upper Arm Circumference NFNC National Food and Nutrition Commission NIST National Institute of Standards and Technology OP Outreach Post PMO Provincial Medical Office RBP Retinol-binding protein TBA Traditional Birth Attendant TfR Transferrin Receptor TDRC Tropical Disease Research Centre UBC University of British Columbia UNICEF United Nations’ Children Fund WHO World Health Organisation

13
1. Background
The current burden of under-nutrition among young children in Zambia is reflected in the high prevalence
of anaemia and stunting. It is well recognised that the consequences of inadequate nutrition, often
coupled with frequent infections during the first ‘1000 days’ of life, from conception until about two years
of age, can permanently impact a child’s physical and cognitive potential.
Inadequate access to nutritious food and sub-optimal infant and young child feeding (IYCF) practices are
major contributors of nutrition deficiencies in Zambian children, hence the need for integrated solutions to
improve the quality of diets in young children.
While Zambia has made progress towards reducing under-nutrition among children, as measured by
underweight, other indicators of nutritional status, particularly stunting and anaemia have remained
unchanged over the past decades. In 2001, the UN General Assembly at the Special Session on Children
recommended that the prevalence of iron deficiency and anaemia be reduced by one-third between 2000
and 2010.
Numerous national surveys show that the global goal for the reduction of iron deficiency and anaemia has
not been met in Zambia and that anaemia remains of public health significance among Zambian children.
According to World Health Organisation (WHO) classification, a prevalence of anaemia above 40% is
categorized as a severe public health problem. There has been no significant reduction in anaemia among
children 6-59 months over the past two decades with an estimated prevalence of 60% in 19982, 53% in
20033 49% in 20094 and 55% in 20125. Further, younger infants were found to be more affected than older
children with an estimated prevalence of 81% in children 6-18 months in 1992, 61% in children 6-23
months in 2009 and 67% in children 6-23 months in 2012.
Iron deficiency, iron deficiency anaemia and anaemia are often incorrectly used as synonyms. Iron
deficiency anaemia is defined as occurring when individuals are both anaemic, based on low haemoglobin
(Hb) concentrations, and iron deficient, based on an indicator of iron status. In developing countries
approximately 50% of all anaemia is attributed to iron deficiency. It is further estimated that the frequency
of iron deficiency is about 2.5 times that of anaemia, and when anaemia prevalence exceeds 40%, it is
assumed that the entire population is suffering from some degree of iron deficiency6. It is therefore
assumed that this is the case with young children in Zambia.
It is well established that iron deficiency has adverse health consequences even before anaemia develops.
These include cognitive impairment, decreased physical capacity and reduced immunity. In general, the
negative effects of iron deficiency on health, physical capacity, cognitive performance and behaviour can
be corrected by providing adequate iron, except in young children, as severe iron deficiency at a young age
can lead to irreversible brain damage and impaired cognitive development7.
2 National Survey on Anemia in Zambia, NFNC, 1998. 3 NFNC, Report of the National Survey to Evaluate Impact of Vitamin A Interventions in Zambia in July/November 2003. 4 Zambia National Malaria National Survey, 2009. 5 Zambia National Malaria Indicator Survey, 2012 6 WHO/UNICEF/UNU. Iron Deficiency Anemia Assessment, Prevention, and Control. Geneva. 2001. 7 Lozoff, B., Jimenez, E. & Wolf, A. 1991. Long-term developmental outcome of infants with iron deficiency. N. Engl. J. Med., 325: 687-694.

14
Fortification of staple foods for the general population with key micronutrients such as iron and zinc is not
a suitable solution to combat the problem of micronutrient deficiencies in young children who eat too little
of these fortified foods to obtain an adequate amount of each essential nutrient. In addition, these foods
are not affordable for a large percentage of the population.
1.1. Home Fortification with Micronutrient Powders
The most promising strategy for young children is ‘home fortification’ of staple complementary foods
(foods that are consumed in addition to breast milk after 6 months of age) with small packets of
Micronutrient Powders (MNP). MNP are single use sachets of highly bioavailable vitamins and minerals
that can be easily mixed with a child’s home-prepared food just before consumption.
MNP have been used in over 80 interventions across the globe and have been found to be highly
efficacious in reducing anaemia.8 More recent trials in Nepal, Kenya and South Africa9 have also showed
improvements in child anthropometry, although this was not the case in a Bangladeshi trial.10 A recent
meta-analysis of Home Fortification trials found that MNP were as effective as iron drops in reducing
anaemia, but had higher acceptability and lower levels of adverse side effects. Furthermore, it was found
that MNP usage was associated with an approximately 50% reduction in the risk of anaemia. 11
‘Stunting’, low height-for-age is a problem of public health significance in Zambia with 40% of children
under five being stunted12. While MNP are primarily designed to control micronutrient deficiencies,
particularly iron deficiency, and not the problem of stunting, the integration of MNP with an IYCF protocol
provides an opportunity for promoting key practices that have the potential to contribute to improved
child growth and development; therefore, MNP are not a ‘stand-alone’ intervention. This programme will
specifically address practices that will help to improve nutritional intake and reduce infection in order to
promote growth during the early years of life. Improved feeding practices have been demonstrated in
large-scale studies in multiple countries including Ghana, Bangladesh, South Africa, Cambodia and
Mongolia. In 2011, studies in both Nepal and Kenya reported a significant decrease in the prevalence of
stunting following the inclusion of MNP in IYCF programmes for children 6-59 months of age.13
There has been concern in the medical community concerning the use of iron supplementation in malaria
endemic zones, based upon a trial in Zanzibar, which found an increase in mortality and morbidity in
children receiving iron supplements.14 While the mechanism by which this occurred is not fully understood,
it is thought that high levels of unabsorbed iron in the bloodstream provide nutrition for any pathogens in
the body, and as such the WHO called for restrictions on iron supplementation in areas with high levels of
8 Rah JH, Kraemer K, Steiger G, Bloem MW, Spiegel P, Wilkinson C, et al. Program Experience with Micronutrient Powders and Current
Evidence. The Journal of Nutrition. 2012;142:191S–196S. 9 Troesch B, Stujivenberg M van. A micronutrient powder with low doses of highly absorbable iron and zinc reduces iron and zinc deficiency and improves weight-for-age Z-scores in South African. The Journal of Nutrition. 2011;(141):237–42. 10 Rah JH et al. 11 Dewey KG, Yang Z, Boy E. Systematic review and meta-analysis of home fortification of complementary foods. Maternal & Child Nutrition. 2009 Oct;5(4):283–321. 12 CSO. Zambia Demographic and Health Survey 2013-2014 Preliminary Report. Lusaka, Zambia; 2014. 13 Rah JH et al. 14 Sazawal S, Black RE, Ramsan M, Chwaya HM, Stoltzfus RJ, Dutta A, et al. Effects of routine prophylactic supplementation with iron and folic acid on admission to hospital and mortality in preschool children in a high malaria transmission setting: community-based, randomised, placebo-controlled trial. Lancet. 2006 Jan 14;367(905):133–43.
15
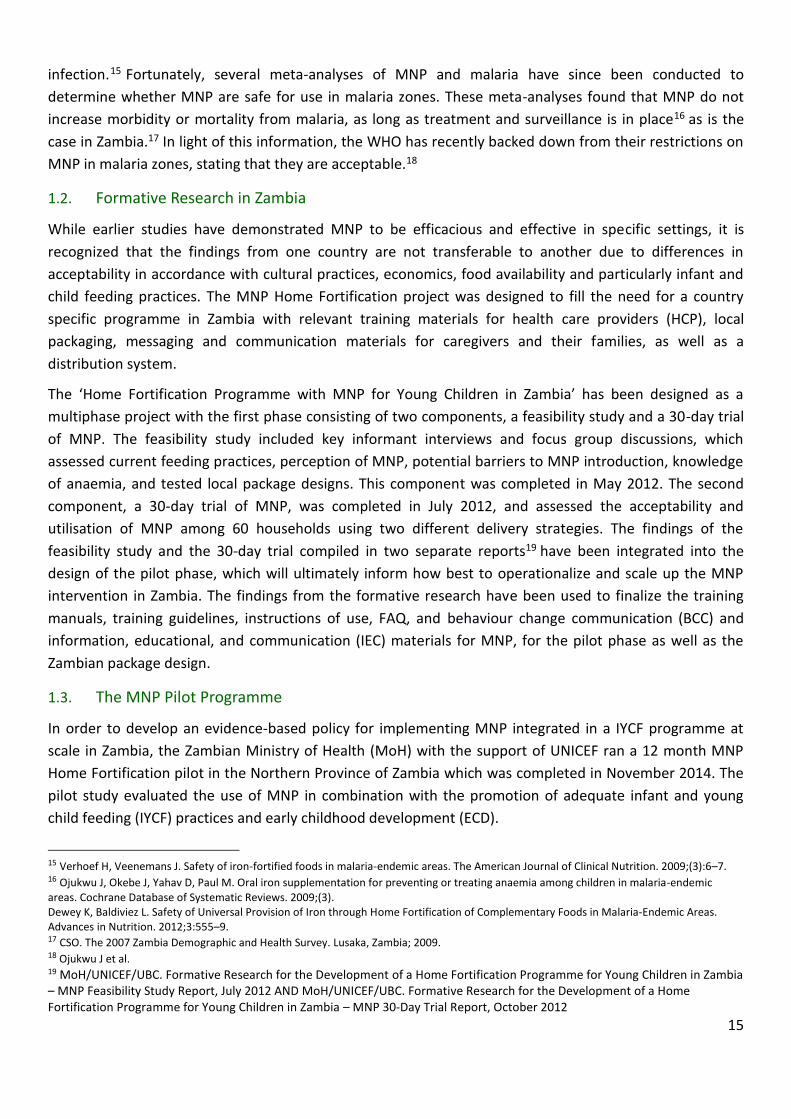
infection.15 Fortunately, several meta-analyses of MNP and malaria have since been conducted to
determine whether MNP are safe for use in malaria zones. These meta-analyses found that MNP do not
increase morbidity or mortality from malaria, as long as treatment and surveillance is in place16 as is the
case in Zambia.17 In light of this information, the WHO has recently backed down from their restrictions on
MNP in malaria zones, stating that they are acceptable.18
1.2. Formative Research in Zambia
While earlier studies have demonstrated MNP to be efficacious and effective in specific settings, it is
recognized that the findings from one country are not transferable to another due to differences in
acceptability in accordance with cultural practices, economics, food availability and particularly infant and
child feeding practices. The MNP Home Fortification project was designed to fill the need for a country
specific programme in Zambia with relevant training materials for health care providers (HCP), local
packaging, messaging and communication materials for caregivers and their families, as well as a
distribution system.
The ‘Home Fortification Programme with MNP for Young Children in Zambia’ has been designed as a
multiphase project with the first phase consisting of two components, a feasibility study and a 30-day trial
of MNP. The feasibility study included key informant interviews and focus group discussions, which
assessed current feeding practices, perception of MNP, potential barriers to MNP introduction, knowledge
of anaemia, and tested local package designs. This component was completed in May 2012. The second
component, a 30-day trial of MNP, was completed in July 2012, and assessed the acceptability and
utilisation of MNP among 60 households using two different delivery strategies. The findings of the
feasibility study and the 30-day trial compiled in two separate reports19 have been integrated into the
design of the pilot phase, which will ultimately inform how best to operationalize and scale up the MNP
intervention in Zambia. The findings from the formative research have been used to finalize the training
manuals, training guidelines, instructions of use, FAQ, and behaviour change communication (BCC) and
information, educational, and communication (IEC) materials for MNP, for the pilot phase as well as the
Zambian package design.
1.3. The MNP Pilot Programme
In order to develop an evidence-based policy for implementing MNP integrated in a IYCF programme at
scale in Zambia, the Zambian Ministry of Health (MoH) with the support of UNICEF ran a 12 month MNP
Home Fortification pilot in the Northern Province of Zambia which was completed in November 2014. The
pilot study evaluated the use of MNP in combination with the promotion of adequate infant and young
child feeding (IYCF) practices and early childhood development (ECD).
15 Verhoef H, Veenemans J. Safety of iron-fortified foods in malaria-endemic areas. The American Journal of Clinical Nutrition. 2009;(3):6–7. 16 Ojukwu J, Okebe J, Yahav D, Paul M. Oral iron supplementation for preventing or treating anaemia among children in malaria-endemic areas. Cochrane Database of Systematic Reviews. 2009;(3). Dewey K, Baldiviez L. Safety of Universal Provision of Iron through Home Fortification of Complementary Foods in Malaria-Endemic Areas. Advances in Nutrition. 2012;3:555–9. 17 CSO. The 2007 Zambia Demographic and Health Survey. Lusaka, Zambia; 2009. 18 Ojukwu J et al. 19 MoH/UNICEF/UBC. Formative Research for the Development of a Home Fortification Programme for Young Children in Zambia – MNP Feasibility Study Report, July 2012 AND MoH/UNICEF/UBC. Formative Research for the Development of a Home Fortification Programme for Young Children in Zambia – MNP 30-Day Trial Report, October 2012
16
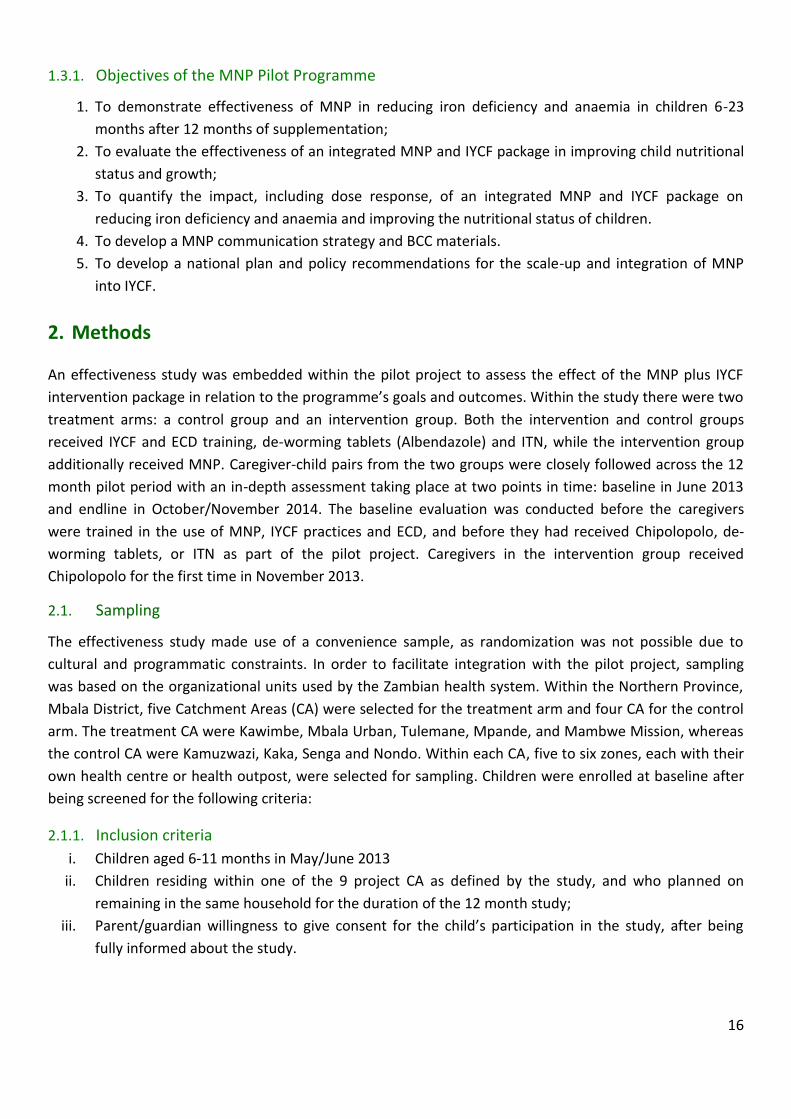
1.3.1. Objectives of the MNP Pilot Programme
1. To demonstrate effectiveness of MNP in reducing iron deficiency and anaemia in children 6-23
months after 12 months of supplementation;
2. To evaluate the effectiveness of an integrated MNP and IYCF package in improving child nutritional
status and growth;
3. To quantify the impact, including dose response, of an integrated MNP and IYCF package on
reducing iron deficiency and anaemia and improving the nutritional status of children.
4. To develop a MNP communication strategy and BCC materials.
5. To develop a national plan and policy recommendations for the scale-up and integration of MNP
into IYCF.
2. Methods
An effectiveness study was embedded within the pilot project to assess the effect of the MNP plus IYCF
intervention package in relation to the programme’s goals and outcomes. Within the study there were two
treatment arms: a control group and an intervention group. Both the intervention and control groups
received IYCF and ECD training, de-worming tablets (Albendazole) and ITN, while the intervention group
additionally received MNP. Caregiver-child pairs from the two groups were closely followed across the 12
month pilot period with an in-depth assessment taking place at two points in time: baseline in June 2013
and endline in October/November 2014. The baseline evaluation was conducted before the caregivers
were trained in the use of MNP, IYCF practices and ECD, and before they had received Chipolopolo, de-
worming tablets, or ITN as part of the pilot project. Caregivers in the intervention group received
Chipolopolo for the first time in November 2013.
2.1. Sampling
The effectiveness study made use of a convenience sample, as randomization was not possible due to
cultural and programmatic constraints. In order to facilitate integration with the pilot project, sampling
was based on the organizational units used by the Zambian health system. Within the Northern Province,
Mbala District, five Catchment Areas (CA) were selected for the treatment arm and four CA for the control
arm. The treatment CA were Kawimbe, Mbala Urban, Tulemane, Mpande, and Mambwe Mission, whereas
the control CA were Kamuzwazi, Kaka, Senga and Nondo. Within each CA, five to six zones, each with their
own health centre or health outpost, were selected for sampling. Children were enrolled at baseline after
being screened for the following criteria:
2.1.1. Inclusion criteria
i. Children aged 6-11 months in May/June 2013
ii. Children residing within one of the 9 project CA as defined by the study, and who planned on
remaining in the same household for the duration of the 12 month study;
iii. Parent/guardian willingness to give consent for the child’s participation in the study, after being
fully informed about the study.

17
2.1.2. Exclusion criteria
i. Severely malnourished children (i.e. weight-for-height Z-score < 3 SD, MUAC < 11.5 cm, or the
presence of bilateral oedema);
ii. Children with severe anaemia (Hb < 7.0 g/dl);
iii. HIV positive children, as identified by their Zambian ‘under 5 child card’ or the baseline
questionnaire.
2.1.3. Sample size
The primary outcome variable used for the determination of the sample size in the effectiveness study was
the change in prevalence of anaemia (defined as Hb < 11.0 g/dL) among participating children over the
course of the 12-month intervention.
According to the WHO Global Database on Anaemia, approximately 50% of children 12-59 months of age
are anaemic.20 As it is to be expected that rates would be high for children 6-11 months, we used an
estimate of 60% for the children who would participate in the effectiveness component of the project in
two different groups. In order to detect a significant difference of 15 percentage points in the prevalence
of anaemia over the course of the intervention, assuming an alpha of 0.05, a beta of 0.8, and a design
effect of 2; 268 children per group were required. A 15% attrition rate (loss to follow-up) was estimated
prior to baseline, making the target number of children per treatment group 308.
A total of 435 out of a possible 631 children were followed up with during the endline data collection for
this study in which a greater number of caregiver-child pairs were lost-to-follow-up in the control group
compared to the intervention group (32% vs. 27%). Tables for Modules 3-7 only present information for
432 of the children followed up with. Someone other than the primary caregiver brought three children to
data collection and attempts to locate the primary caregiver for an interview were unsuccessful. Therefore,
anthropometric measurements and blood work were collected, however, no interview was conducted. The
two most common reasons that families were not available at endline were that the family of an enrolled
child had relocated (38%) and that the caregiver was “not available” at the time of data collection (26%).
There were also eight reported instances of enrolled children who passed away, one in the intervention
group and seven in the control group, although the causes were not recorded, and given that there were
instances of individuals who were not available for unknown reasons, it is difficult to draw definitive
conclusions from this seeming disparity.
At the conclusion of baseline data collection the following number of caregivers had been reached:
Intervention group: 329 caregiver-child pairs
Control group: 302 caregiver-child pairs
Of those caregiver-child pairs the following number were reached at endline data collection.
Intervention group: 239 caregiver-child pairs
Control group: 193 caregiver-child pairs
20 WHO. Worldwide prevalence of anaemia 1993-2005. Geneva, Switzerland; 2008.

18
2.2. Evaluation Tools
Three types of data were collected during the baseline and endline surveys including information on
household characteristics, anthropometry for children and biomarkers for the children.
2.2.1 Household Information
A baseline questionnaire was administered prior to training on Chipolopolo usage, and as such did not
include items related to Chipolopolo use. The baseline questionnaires for the intervention and control
group were therefore identical. It contained seven modules with the following categories: ‘Anthropometry,
Oedema & Biochemical Assessment’, ‘Household Information’, ‘Drinking Water, Hygiene & Sanitation’,
‘Early Childhood Development’, ‘Child Health & Health Seeking Behaviour’, ’Caregivers’ IYCF Knowledge &
Anaemia’, and ‘Infant and Young Child Feeding Practices & Food Consumption’.
Separate questionnaires were administered for the control and intervention groups during endline data
collection. The questionnaire for the control group contained the same seven modules found in the
baseline survey; the questionnaire for the intervention group contained an additional module on
Chipolopolo and was sub-divided into the following categories: ‘Utilization and Adherence’, ‘Perceived
Changes’, ‘Acceptability’, ‘Delivery of Chipolopolo’, ‘Delivery of Chipolopolo Messages’, and ‘Knowledge of
Chipolopolo’.
2.2.2 Anthropometric Data (Weight, Length, Age, Mid-Upper Arm Circumference)
An electronic scale was used to weigh children and children’s length was measured using a standard
recumbent length board. The weight and length of each child was recorded to the nearest 100g and 1mm
respectively. The length and weight values were to be used to calculate the z-scores for weight-for-age
(underweight), height-for-age (stunting) and weight-for-height (wasting) and compared to the WHO
growth curve standards. Children’s Mid Upper Arm Circumference (MUAC) was measured using a MUAC
measuring tape. Age was determined from the child’s date of birth as listed on their Under-5 Card or other
documentation, and the use of an Age Calculator.
2.2.3 Biochemical Data
Iron status was determined by measuring serum ferritin and serum transferrin receptor (STfR). Serum
ferritin is considered a reliable indirect measure of iron body stores when there is no concurrent infection.
However, when infection is present the concentration of ferritin may increase even if iron stores are low.
Measuring concentration of STfR has been proposed as an alternative method to assess iron status in
populations with a high burden of infections. However malaria, even in asymptomatic individuals, is
associated with increased STfR concentrations. High serum ferritin concentrations resulting from infections
were corrected using biomarkers for infections. Hb concentrations were also measured although not all
anaemia is caused by iron deficiency. Hb concentration was measured on the spot using a portable
photometer, the Hemocue.
Vitamin A was measured via serum retinol-binding protein (RBP). RBP has been shown to correlate well
with serum retinol in many contexts although it may be affected by protein status and infection. However
it is considered to be more heat and light stable than serum retinol, which makes RBP ideal for field
studies.
19
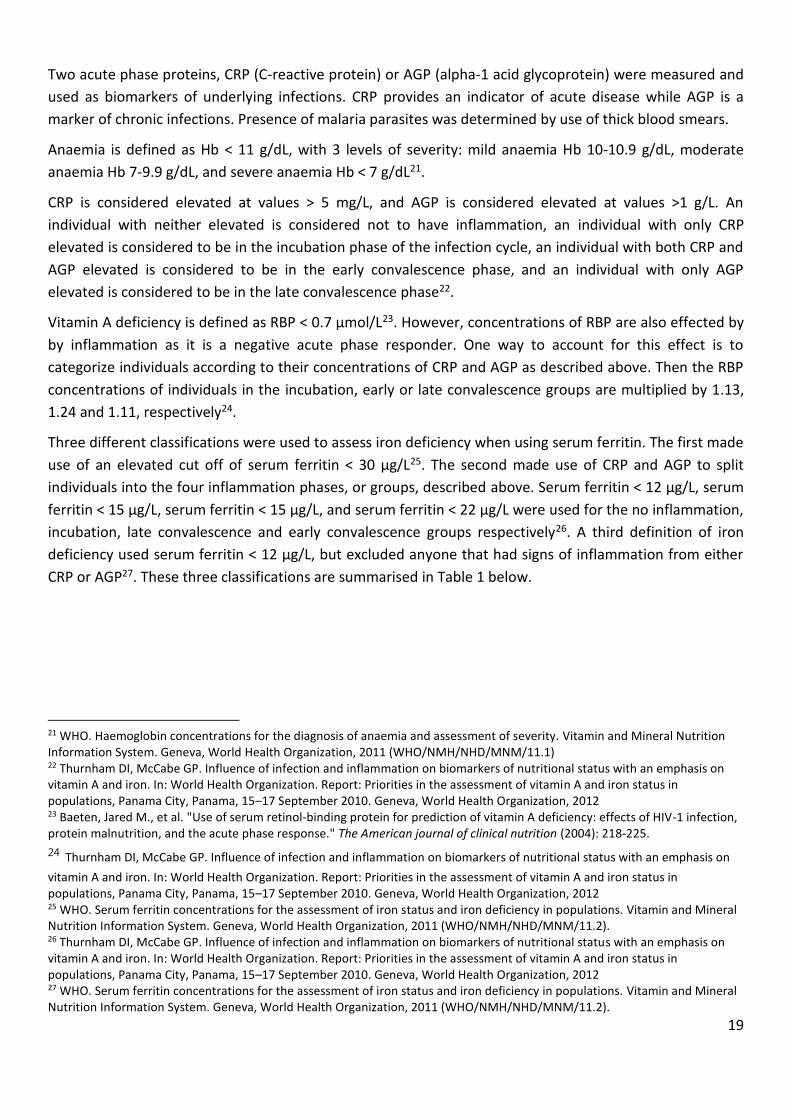
Two acute phase proteins, CRP (C-reactive protein) or AGP (alpha-1 acid glycoprotein) were measured and
used as biomarkers of underlying infections. CRP provides an indicator of acute disease while AGP is a
marker of chronic infections. Presence of malaria parasites was determined by use of thick blood smears.
Anaemia is defined as Hb < 11 g/dL, with 3 levels of severity: mild anaemia Hb 10-10.9 g/dL, moderate
anaemia Hb 7-9.9 g/dL, and severe anaemia Hb < 7 g/dL21.
CRP is considered elevated at values > 5 mg/L, and AGP is considered elevated at values >1 g/L. An
individual with neither elevated is considered not to have inflammation, an individual with only CRP
elevated is considered to be in the incubation phase of the infection cycle, an individual with both CRP and
AGP elevated is considered to be in the early convalescence phase, and an individual with only AGP
elevated is considered to be in the late convalescence phase22.
Vitamin A deficiency is defined as RBP < 0.7 µmol/L23. However, concentrations of RBP are also effected by
by inflammation as it is a negative acute phase responder. One way to account for this effect is to
categorize individuals according to their concentrations of CRP and AGP as described above. Then the RBP
concentrations of individuals in the incubation, early or late convalescence groups are multiplied by 1.13,
1.24 and 1.11, respectively24.
Three different classifications were used to assess iron deficiency when using serum ferritin. The first made
use of an elevated cut off of serum ferritin < 30 µg/L25. The second made use of CRP and AGP to split
individuals into the four inflammation phases, or groups, described above. Serum ferritin < 12 µg/L, serum
ferritin < 15 µg/L, serum ferritin < 15 µg/L, and serum ferritin < 22 µg/L were used for the no inflammation,
incubation, late convalescence and early convalescence groups respectively26. A third definition of iron
deficiency used serum ferritin < 12 µg/L, but excluded anyone that had signs of inflammation from either
CRP or AGP27. These three classifications are summarised in Table 1 below.
21 WHO. Haemoglobin concentrations for the diagnosis of anaemia and assessment of severity. Vitamin and Mineral Nutrition Information System. Geneva, World Health Organization, 2011 (WHO/NMH/NHD/MNM/11.1) 22 Thurnham DI, McCabe GP. Influence of infection and inflammation on biomarkers of nutritional status with an emphasis on vitamin A and iron. In: World Health Organization. Report: Priorities in the assessment of vitamin A and iron status in populations, Panama City, Panama, 15–17 September 2010. Geneva, World Health Organization, 2012 23 Baeten, Jared M., et al. "Use of serum retinol-binding protein for prediction of vitamin A deficiency: effects of HIV-1 infection, protein malnutrition, and the acute phase response." The American journal of clinical nutrition (2004): 218-225.
24 Thurnham DI, McCabe GP. Influence of infection and inflammation on biomarkers of nutritional status with an emphasis on
vitamin A and iron. In: World Health Organization. Report: Priorities in the assessment of vitamin A and iron status in populations, Panama City, Panama, 15–17 September 2010. Geneva, World Health Organization, 2012 25 WHO. Serum ferritin concentrations for the assessment of iron status and iron deficiency in populations. Vitamin and Mineral Nutrition Information System. Geneva, World Health Organization, 2011 (WHO/NMH/NHD/MNM/11.2). 26 Thurnham DI, McCabe GP. Influence of infection and inflammation on biomarkers of nutritional status with an emphasis on vitamin A and iron. In: World Health Organization. Report: Priorities in the assessment of vitamin A and iron status in populations, Panama City, Panama, 15–17 September 2010. Geneva, World Health Organization, 2012 27 WHO. Serum ferritin concentrations for the assessment of iron status and iron deficiency in populations. Vitamin and Mineral Nutrition Information System. Geneva, World Health Organization, 2011 (WHO/NMH/NHD/MNM/11.2).

20
Table 1 | Iron Deficiency Classifications Using Serum Ferritin
Serum Ferritin Cut Off Used for Each Inflammation Phase
(As determined from CRP and AGP)
Serum Ferritin
Classification
No
Inflammation
Incubation
Phase
Early
Convalescence
Phase
Late
Convalescence
Phase
WHO elevated
serum ferritin
cut off
classification
< 30 µg/L < 30 µg/L < 30 µg/L < 30 µg/L
Inflammation
adjusted ferritin
cut offs
classification
< 12 µg/L < 15 µg/L < 22 µg/L < 15 µg/L
Standard serum
ferritin cut off,
excluding
inflammation
classification
< 12 µg/L Excluded
from analysis
Excluded from
analysis
Excluded from
analysis
Iron deficiency when using serum Transferrin Receptors was defined by STfR > 8.3 mg/L28.
Iron deficiency anaemia was defined as concurrent iron deficiency and anaemia, using the above
definitions.
Serum ferritin, Serum Transferrin Receptor, Retinol Binding Protein, Alpha-1-acid glycoprotein and C-
reactive protein were measured by using Enzyme Linked Immunosorbent Assay (ELISA) methods.
2.3. Community Mobilisation & Sensitisation
Due to the sensitive nature of blood collection, the National Food and Nutrition Commission (NFNC), the
Chipolopolo Programme Coordinator and District Nutritionist were responsible for conducting community
mobilisation and sensitisation. A local drama group was employed to help with the sensitization and
dissemination of messages. Their main objective was to inform the communities within the CA that were to
be part of the effectiveness study about the role of data collection in the project, in particular, explaining
why blood samples must be collected, while also addressing any additional concerns or fears that may be
brought up by community leadership and/or members. The NFNC team was also responsible for informing
communities on how to prepare for the data collection.
2.4. Data Collection
The provincial and district health offices were instrumental in ensuring the success of the data collection.
Prior to the start of the endline survey, Zambian researchers selected based on high levels of competency
and professionalism were released from their work responsibilities by the province/district to participate in
28 Engle-Stone, Reina, et al. "Plasma ferritin and soluble transferrin receptor concentrations and body iron stores identify similar risk factors for iron deficiency but result in different estimates of the national prevalence of iron deficiency and iron-deficiency anemia among women and children in Cameroon." The Journal of nutrition 143.3 (2013): 369-377
21
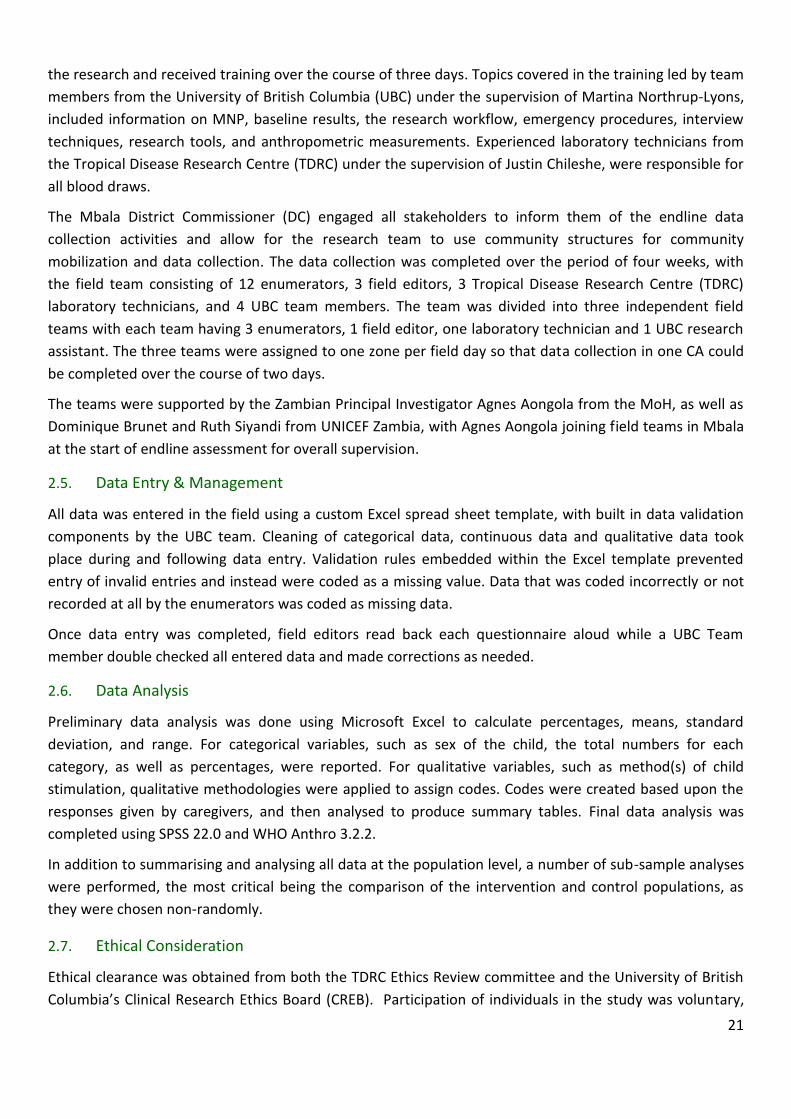
the research and received training over the course of three days. Topics covered in the training led by team
members from the University of British Columbia (UBC) under the supervision of Martina Northrup-Lyons,
included information on MNP, baseline results, the research workflow, emergency procedures, interview
techniques, research tools, and anthropometric measurements. Experienced laboratory technicians from
the Tropical Disease Research Centre (TDRC) under the supervision of Justin Chileshe, were responsible for
all blood draws.
The Mbala District Commissioner (DC) engaged all stakeholders to inform them of the endline data
collection activities and allow for the research team to use community structures for community
mobilization and data collection. The data collection was completed over the period of four weeks, with
the field team consisting of 12 enumerators, 3 field editors, 3 Tropical Disease Research Centre (TDRC)
laboratory technicians, and 4 UBC team members. The team was divided into three independent field
teams with each team having 3 enumerators, 1 field editor, one laboratory technician and 1 UBC research
assistant. The three teams were assigned to one zone per field day so that data collection in one CA could
be completed over the course of two days.
The teams were supported by the Zambian Principal Investigator Agnes Aongola from the MoH, as well as
Dominique Brunet and Ruth Siyandi from UNICEF Zambia, with Agnes Aongola joining field teams in Mbala
at the start of endline assessment for overall supervision.
2.5. Data Entry & Management
All data was entered in the field using a custom Excel spread sheet template, with built in data validation
components by the UBC team. Cleaning of categorical data, continuous data and qualitative data took
place during and following data entry. Validation rules embedded within the Excel template prevented
entry of invalid entries and instead were coded as a missing value. Data that was coded incorrectly or not
recorded at all by the enumerators was coded as missing data.
Once data entry was completed, field editors read back each questionnaire aloud while a UBC Team
member double checked all entered data and made corrections as needed.
2.6. Data Analysis
Preliminary data analysis was done using Microsoft Excel to calculate percentages, means, standard
deviation, and range. For categorical variables, such as sex of the child, the total numbers for each
category, as well as percentages, were reported. For qualitative variables, such as method(s) of child
stimulation, qualitative methodologies were applied to assign codes. Codes were created based upon the
responses given by caregivers, and then analysed to produce summary tables. Final data analysis was
completed using SPSS 22.0 and WHO Anthro 3.2.2.
In addition to summarising and analysing all data at the population level, a number of sub-sample analyses
were performed, the most critical being the comparison of the intervention and control populations, as
they were chosen non-randomly.
2.7. Ethical Consideration
Ethical clearance was obtained from both the TDRC Ethics Review committee and the University of British
Columbia’s Clinical Research Ethics Board (CREB). Participation of individuals in the study was voluntary,
22
participation could be withdrawn at any time without consequences, and informed consent was obtained
from caregivers of children.
2.8. Institutional Arrangement
The pilot study was implemented by the MoH and MCDMCH in partnership with UNICEF-Zambia with funds
from Irish Aid, specifically by MoH Nutrition Unit at central level, Provincial Medical Office (PMO) of
Northern Province, and the District Medical Office (DMO) of Mbala district. The University of British
Columbia, a member of the Home Fortification Technical Advisory Group (HF-TAG) at the global level,
provided technical assistance due to their considerable experience with MNP interventions in Asia and
Africa.
3. Results
3.1. Module 2: Chipolopolo Use
3.1.1. Utilization and Adherence
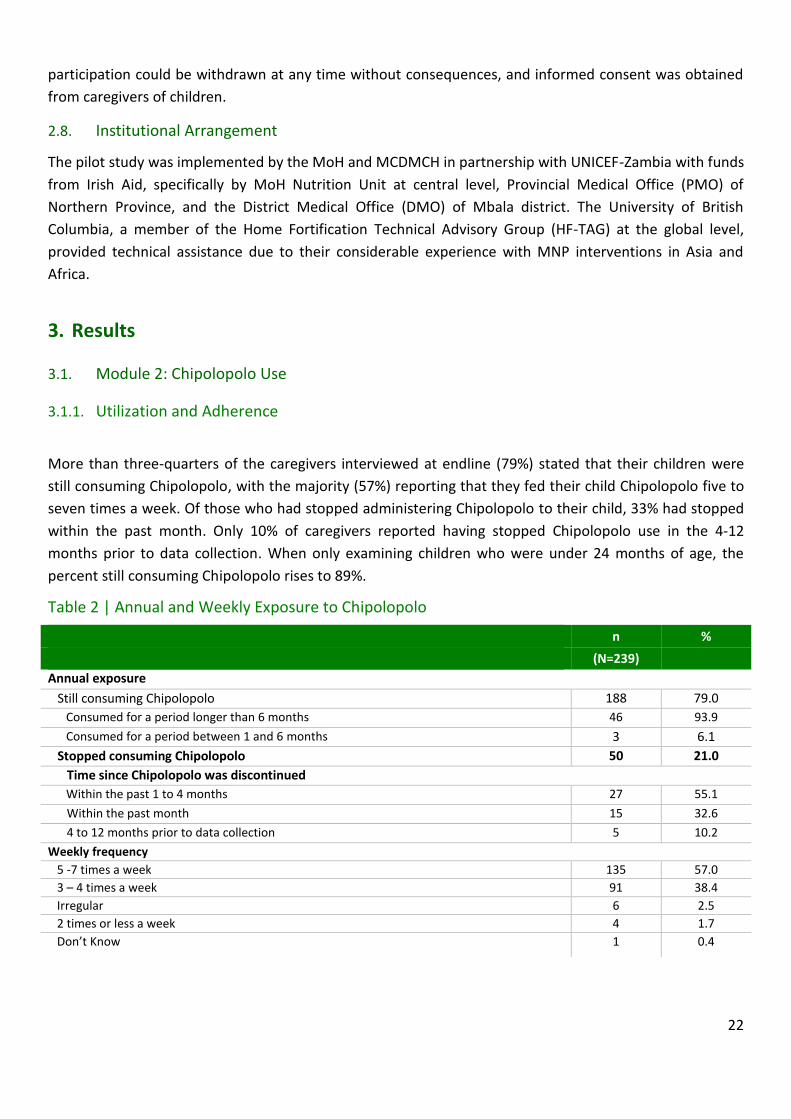
More than three-quarters of the caregivers interviewed at endline (79%) stated that their children were
still consuming Chipolopolo, with the majority (57%) reporting that they fed their child Chipolopolo five to
seven times a week. Of those who had stopped administering Chipolopolo to their child, 33% had stopped
within the past month. Only 10% of caregivers reported having stopped Chipolopolo use in the 4-12
months prior to data collection. When only examining children who were under 24 months of age, the
percent still consuming Chipolopolo rises to 89%.
Table 2 | Annual and Weekly Exposure to Chipolopolo
n %
(N=239)
Annual exposure
Still consuming Chipolopolo 188 79.0
Consumed for a period longer than 6 months 46 93.9
Consumed for a period between 1 and 6 months 3 6.1
Stopped consuming Chipolopolo 50 21.0
Time since Chipolopolo was discontinued
Within the past 1 to 4 months 27 55.1
Within the past month 15 32.6
4 to 12 months prior to data collection 5 10.2
Weekly frequency
5 -7 times a week 135 57.0
3 – 4 times a week 91 38.4
Irregular 6 2.5
2 times or less a week 4 1.7
Don’t Know 1 0.4
23
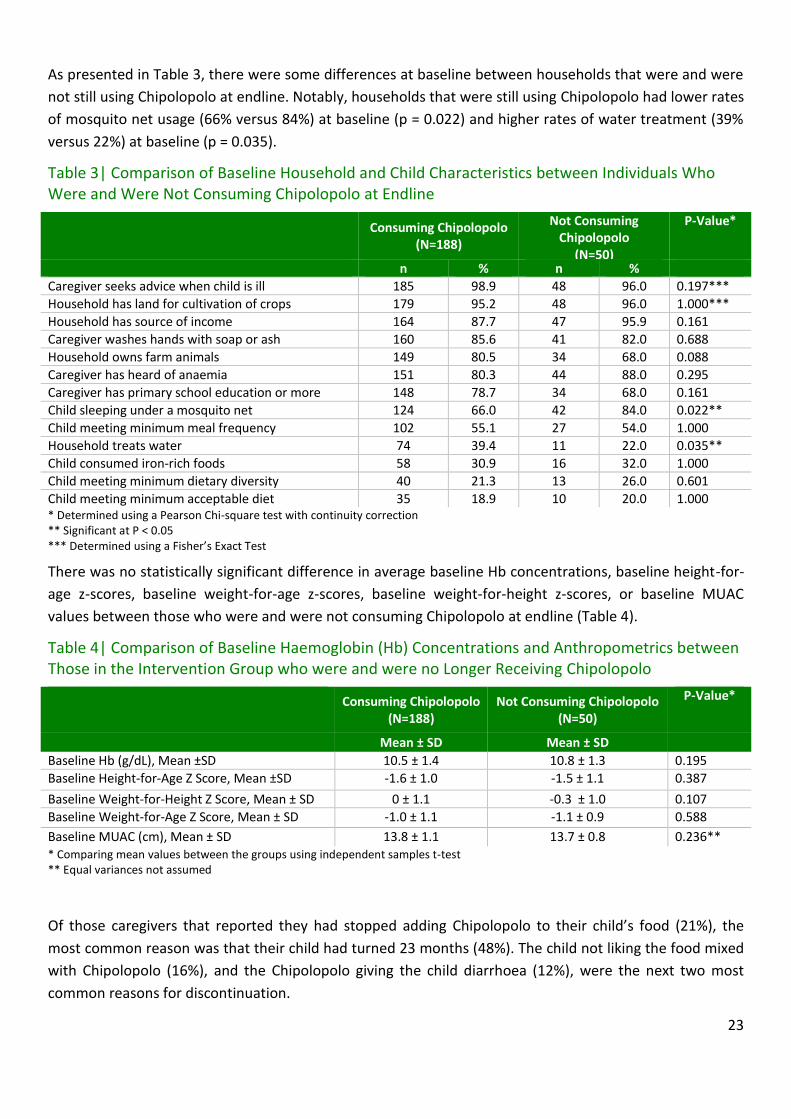
As presented in Table 3, there were some differences at baseline between households that were and were
not still using Chipolopolo at endline. Notably, households that were still using Chipolopolo had lower rates
of mosquito net usage (66% versus 84%) at baseline (p = 0.022) and higher rates of water treatment (39%
versus 22%) at baseline (p = 0.035).
Table 3| Comparison of Baseline Household and Child Characteristics between Individuals Who Were and Were Not Consuming Chipolopolo at Endline
Consuming Chipolopolo (N=188)
Not Consuming Chipolopolo
(N=50)
P-Value*
n % n %
Caregiver seeks advice when child is ill 185 98.9 48 96.0 0.197***
Household has land for cultivation of crops 179 95.2 48 96.0 1.000***
Household has source of income 164 87.7 47 95.9 0.161
Caregiver washes hands with soap or ash 160 85.6 41 82.0 0.688
Household owns farm animals 149 80.5 34 68.0 0.088
Caregiver has heard of anaemia 151 80.3 44 88.0 0.295
Caregiver has primary school education or more 148 78.7 34 68.0 0.161
Child sleeping under a mosquito net 124 66.0 42 84.0 0.022**
Child meeting minimum meal frequency 102 55.1 27 54.0 1.000
Household treats water 74 39.4 11 22.0 0.035**
Child consumed iron-rich foods 58 30.9 16 32.0 1.000
Child meeting minimum dietary diversity 40 21.3 13 26.0 0.601
Child meeting minimum acceptable diet 35 18.9 10 20.0 1.000 * Determined using a Pearson Chi-square test with continuity correction ** Significant at P < 0.05 *** Determined using a Fisher’s Exact Test
There was no statistically significant difference in average baseline Hb concentrations, baseline height-for-
age z-scores, baseline weight-for-age z-scores, baseline weight-for-height z-scores, or baseline MUAC
values between those who were and were not consuming Chipolopolo at endline (Table 4).
Table 4| Comparison of Baseline Haemoglobin (Hb) Concentrations and Anthropometrics between Those in the Intervention Group who were and were no Longer Receiving Chipolopolo
Consuming Chipolopolo (N=188)
Not Consuming Chipolopolo (N=50)
P-Value*
Mean ± SD Mean ± SD
Baseline Hb (g/dL), Mean ±SD 10.5 ± 1.4 10.8 ± 1.3 0.195
Baseline Height-for-Age Z Score, Mean ±SD -1.6 ± 1.0 -1.5 ± 1.1 0.387
Baseline Weight-for-Height Z Score, Mean ± SD 0 ± 1.1 -0.3 ± 1.0 0.107
Baseline Weight-for-Age Z Score, Mean ± SD -1.0 ± 1.1 -1.1 ± 0.9 0.588
Baseline MUAC (cm), Mean ± SD 13.8 ± 1.1 13.7 ± 0.8 0.236** * Comparing mean values between the groups using independent samples t-test ** Equal variances not assumed
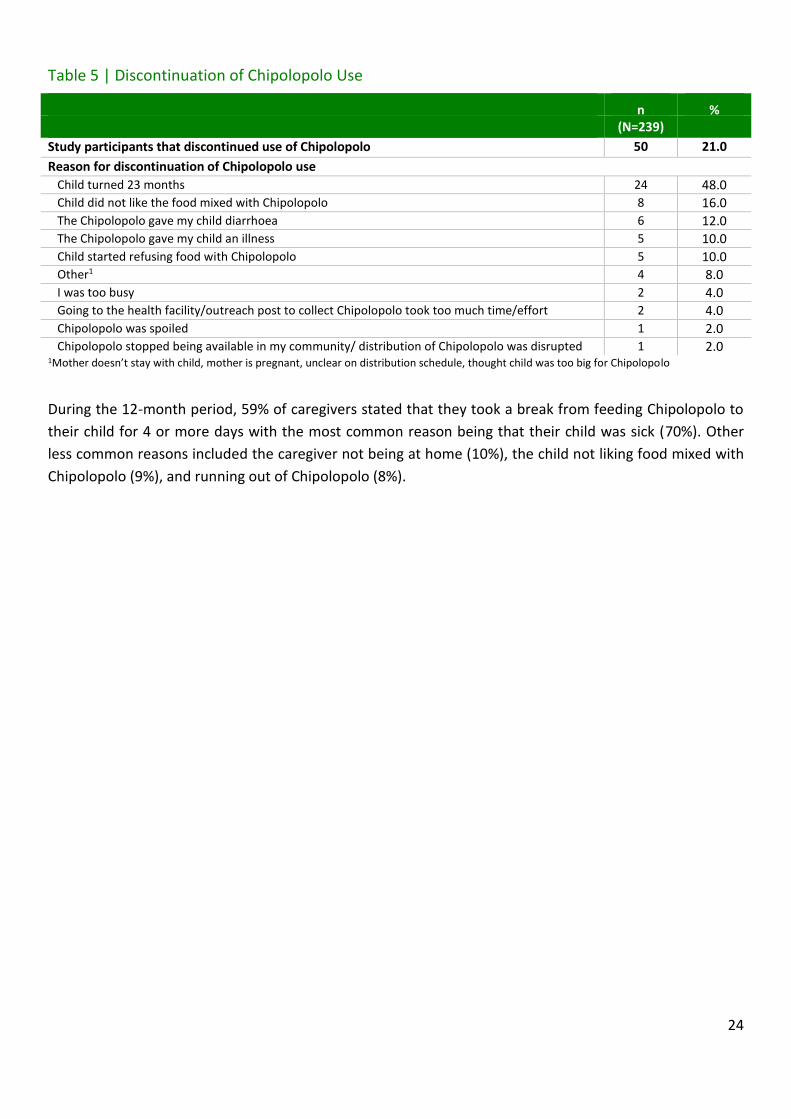
Of those caregivers that reported they had stopped adding Chipolopolo to their child’s food (21%), the
most common reason was that their child had turned 23 months (48%). The child not liking the food mixed
with Chipolopolo (16%), and the Chipolopolo giving the child diarrhoea (12%), were the next two most
common reasons for discontinuation.
24
Table 5 | Discontinuation of Chipolopolo Use
n % (N=239)
Study participants that discontinued use of Chipolopolo 50 21.0
Reason for discontinuation of Chipolopolo use Child turned 23 months 24 48.0
Child did not like the food mixed with Chipolopolo 8 16.0
The Chipolopolo gave my child diarrhoea 6 12.0
The Chipolopolo gave my child an illness 5 10.0
Child started refusing food with Chipolopolo 5 10.0
Other1 4 8.0
I was too busy 2 4.0
Going to the health facility/outreach post to collect Chipolopolo took too much time/effort 2 4.0
Chipolopolo was spoiled 1 2.0
Chipolopolo stopped being available in my community/ distribution of Chipolopolo was disrupted 1 2.0 1Mother doesn’t stay with child, mother is pregnant, unclear on distribution schedule, thought child was too big for Chipolopolo
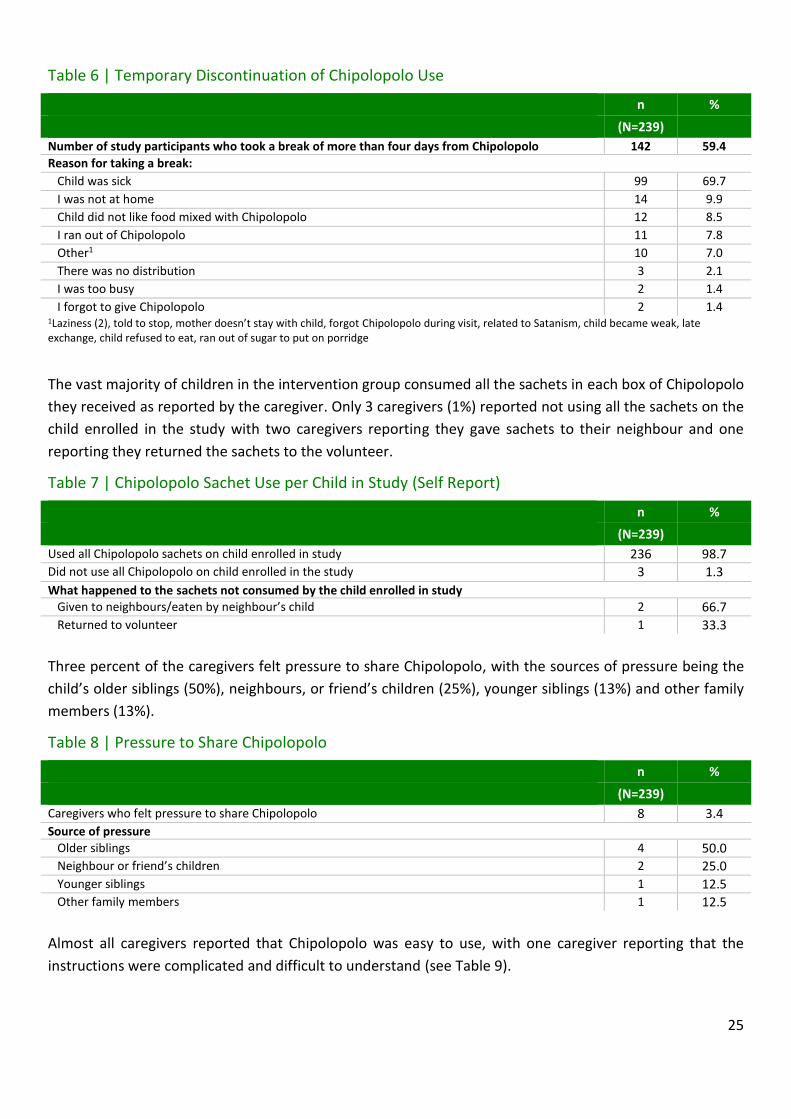
During the 12-month period, 59% of caregivers stated that they took a break from feeding Chipolopolo to
their child for 4 or more days with the most common reason being that their child was sick (70%). Other
less common reasons included the caregiver not being at home (10%), the child not liking food mixed with
Chipolopolo (9%), and running out of Chipolopolo (8%).
25
Table 6 | Temporary Discontinuation of Chipolopolo Use
n %
(N=239)
Number of study participants who took a break of more than four days from Chipolopolo 142 59.4
Reason for taking a break:
Child was sick 99 69.7
I was not at home 14 9.9
Child did not like food mixed with Chipolopolo 12 8.5
I ran out of Chipolopolo 11 7.8
Other1 10 7.0
There was no distribution 3 2.1
I was too busy 2 1.4
I forgot to give Chipolopolo 2 1.4 1Laziness (2), told to stop, mother doesn’t stay with child, forgot Chipolopolo during visit, related to Satanism, child became weak, late exchange, child refused to eat, ran out of sugar to put on porridge
The vast majority of children in the intervention group consumed all the sachets in each box of Chipolopolo
they received as reported by the caregiver. Only 3 caregivers (1%) reported not using all the sachets on the
child enrolled in the study with two caregivers reporting they gave sachets to their neighbour and one
reporting they returned the sachets to the volunteer.
Table 7 | Chipolopolo Sachet Use per Child in Study (Self Report)
n %
(N=239)
Used all Chipolopolo sachets on child enrolled in study
236 98.7 Did not use all Chipolopolo on child enrolled in the study 3 1.3
What happened to the sachets not consumed by the child enrolled in study Given to neighbours/eaten by neighbour’s child 2 66.7
Returned to volunteer 1 33.3
Three percent of the caregivers felt pressure to share Chipolopolo, with the sources of pressure being the
child’s older siblings (50%), neighbours, or friend’s children (25%), younger siblings (13%) and other family
members (13%).
Table 8 | Pressure to Share Chipolopolo
n %
(N=239)
Caregivers who felt pressure to share Chipolopolo
8 3.4 Source of pressure
Older siblings 4 50.0
Neighbour or friend’s children 2 25.0
Younger siblings 1 12.5
Other family members 1 12.5
Almost all caregivers reported that Chipolopolo was easy to use, with one caregiver reporting that the
instructions were complicated and difficult to understand (see Table 9).

26
Table 9 | Experience with Chipolopolo
n %
(N=239)
Chipolopolo was easy to mix
238 99.6
Chipolopolo was not easy to mix 1 0.4 Reason(s) for difficulty
Instructions were complicated/ difficult to understand 1 100
Contents of the sachet did not mix well in the food 1 100
Table 10 presents analysis of the different experiences of using Chipolopolo between those in the
intervention group who still were providing Chipolopolo and endline, and those who were not. None of the
parameters examined were significant, although the closest to significance (p = 0.114) was whether or not
a caregiver had ever taken a break of 4 or more days: of those who were still using Chipolopolo 56% had
taken a break and of those who were not using Chipolopolo 70% had taken a break.
Table 10| Comparison of Caregiver Experiences of Using Chipolopolo between Individuals Who Were and Were Not Consuming Chipolopolo at Endline
Consuming Chipolopolo
(N=188)
Not Consuming Chipolopolo
(N=50)
P-Value*
n % n % Caregiver took a break giving Chipolopolo of more than 4 days
106 56.4 35 70.0 0.114
Caregiver found Chipolopolo easy to mix with food 188 100.0 49 98.0 0.210**
Caregiver noticed changes to food after mixing with Chipolopolo
156 83.0 43 86.0 0.766
Caregiver reported that the colour of the food changed after adding Chipolopolo
152 97.4 43 100.0 0.579**
Caregiver reported receiving messages about Chipolopolo
170 90.4 44 88.0 0.809
* Determined using a Pearson Chi-square test with continuity correction ** Determined using a Fisher’s Exact Test
The most common foods caregivers reported having added Chipolopolo to were staple foods, including
porridge (94%), nshima (61%), rice (59%), beans (48%) and mashed potatoes (45%). Of those who mixed
Chipolopolo with porridge, 90% reported that the consistency of the porridge was thick.
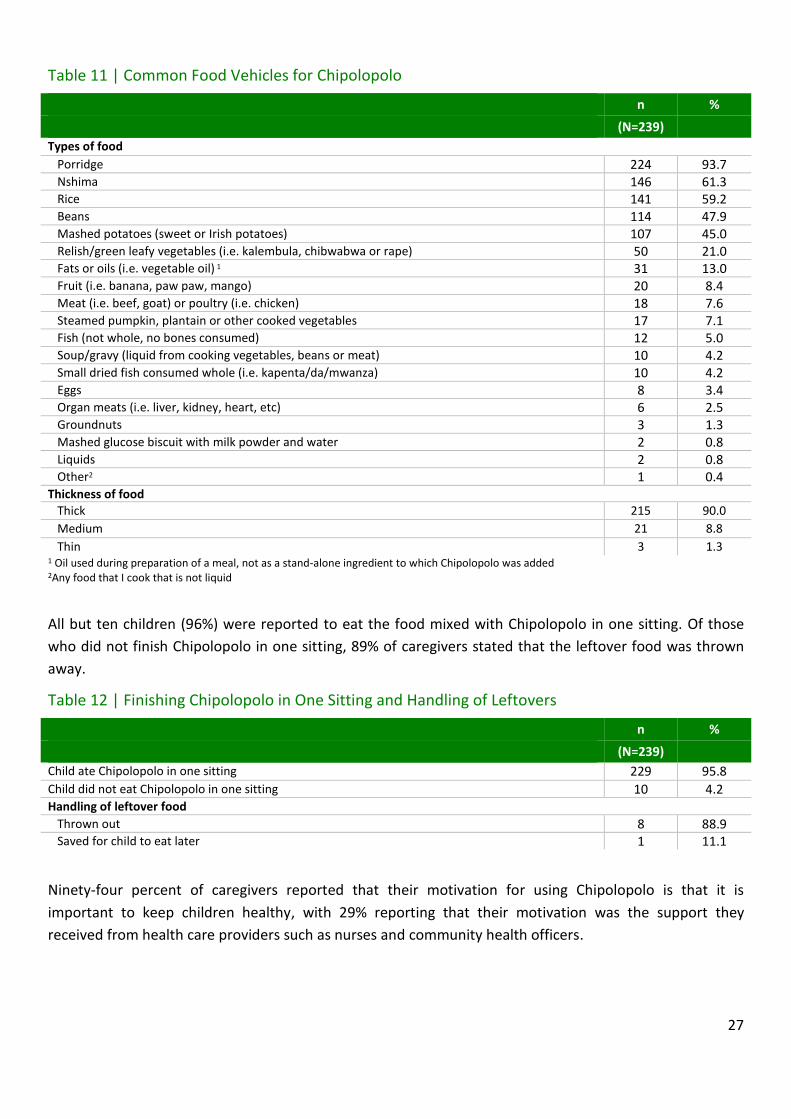
27
Table 11 | Common Food Vehicles for Chipolopolo
n %
(N=239)
Types of food
Porridge 224 93.7 Nshima 146 61.3 Rice 141 59.2 Beans 114 47.9 Mashed potatoes (sweet or Irish potatoes) 107 45.0 Relish/green leafy vegetables (i.e. kalembula, chibwabwa or rape) 50 21.0 Fats or oils (i.e. vegetable oil) 1 31 13.0 Fruit (i.e. banana, paw paw, mango) 20 8.4 Meat (i.e. beef, goat) or poultry (i.e. chicken) 18 7.6 Steamed pumpkin, plantain or other cooked vegetables 17 7.1 Fish (not whole, no bones consumed) 12 5.0 Soup/gravy (liquid from cooking vegetables, beans or meat) 10 4.2 Small dried fish consumed whole (i.e. kapenta/da/mwanza) 10 4.2 Eggs 8 3.4 Organ meats (i.e. liver, kidney, heart, etc) 6 2.5 Groundnuts 3 1.3 Mashed glucose biscuit with milk powder and water 2 0.8 Liquids 2 0.8 Other2 1 0.4
Thickness of food
Thick 215 90.0
Medium 21 8.8
Thin 3 1.3 1 Oil used during preparation of a meal, not as a stand-alone ingredient to which Chipolopolo was added
2Any food that I cook that is not liquid
All but ten children (96%) were reported to eat the food mixed with Chipolopolo in one sitting. Of those
who did not finish Chipolopolo in one sitting, 89% of caregivers stated that the leftover food was thrown
away.
Table 12 | Finishing Chipolopolo in One Sitting and Handling of Leftovers
n %
(N=239)
Child ate Chipolopolo in one sitting
229 95.8
Child did not eat Chipolopolo in one sitting 10 4.2 Handling of leftover food
Thrown out
8 88.9 Saved for child to eat later 1 11.1
Ninety-four percent of caregivers reported that their motivation for using Chipolopolo is that it is
important to keep children healthy, with 29% reporting that their motivation was the support they
received from health care providers such as nurses and community health officers.
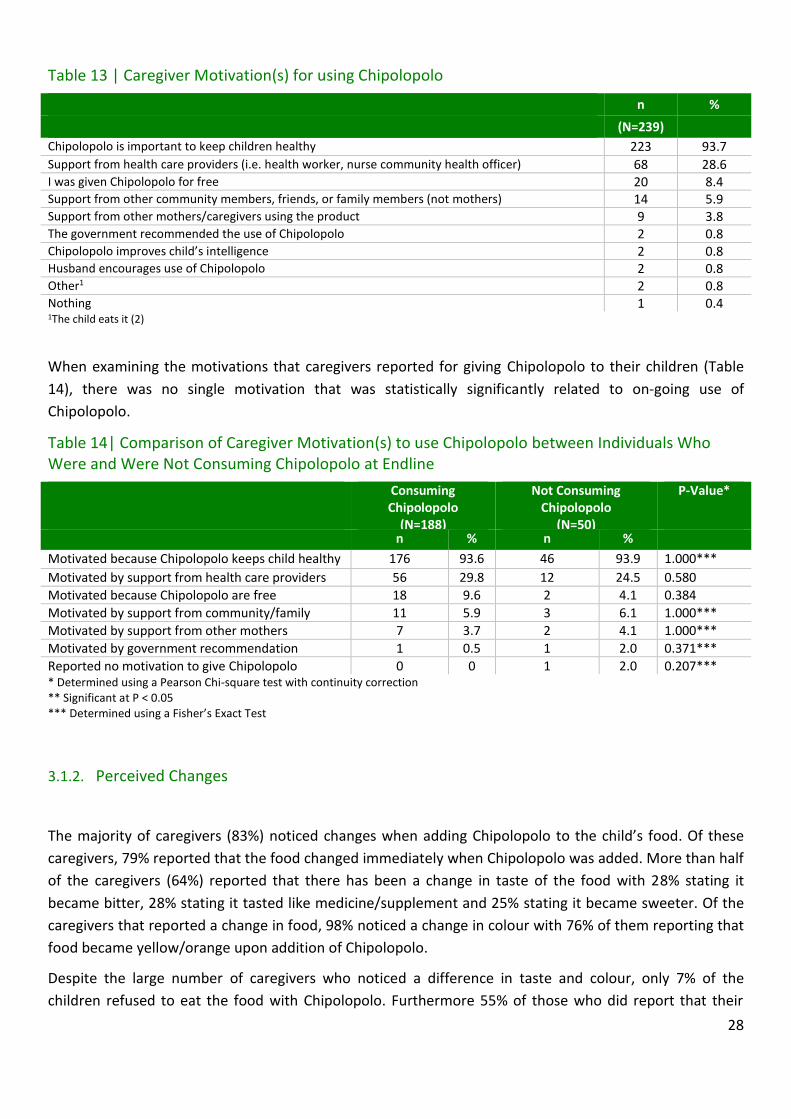
28
Table 13 | Caregiver Motivation(s) for using Chipolopolo
n %
(N=239)
Chipolopolo is important to keep children healthy 223 93.7
Support from health care providers (i.e. health worker, nurse community health officer) 68 28.6 I was given Chipolopolo for free 20 8.4 Support from other community members, friends, or family members (not mothers) 14 5.9 Support from other mothers/caregivers using the product 9 3.8 The government recommended the use of Chipolopolo 2 0.8 Chipolopolo improves child’s intelligence 2 0.8 Husband encourages use of Chipolopolo 2 0.8 Other1 2 0.8 Nothing
1 0.4 1The child eats it (2)
When examining the motivations that caregivers reported for giving Chipolopolo to their children (Table
14), there was no single motivation that was statistically significantly related to on-going use of
Chipolopolo.
Table 14| Comparison of Caregiver Motivation(s) to use Chipolopolo between Individuals Who Were and Were Not Consuming Chipolopolo at Endline
Consuming Chipolopolo
(N=188)
Not Consuming Chipolopolo
(N=50)
P-Value*
n % n %
Motivated because Chipolopolo keeps child healthy 176 93.6 46 93.9 1.000***
Motivated by support from health care providers 56 29.8 12 24.5 0.580
Motivated because Chipolopolo are free 18 9.6 2 4.1 0.384
Motivated by support from community/family 11 5.9 3 6.1 1.000***
Motivated by support from other mothers 7 3.7 2 4.1 1.000***
Motivated by government recommendation 1 0.5 1 2.0 0.371***
Reported no motivation to give Chipolopolo 0 0 1 2.0 0.207*** * Determined using a Pearson Chi-square test with continuity correction ** Significant at P < 0.05 *** Determined using a Fisher’s Exact Test
3.1.2. Perceived Changes
The majority of caregivers (83%) noticed changes when adding Chipolopolo to the child’s food. Of these
caregivers, 79% reported that the food changed immediately when Chipolopolo was added. More than half
of the caregivers (64%) reported that there has been a change in taste of the food with 28% stating it
became bitter, 28% stating it tasted like medicine/supplement and 25% stating it became sweeter. Of the
caregivers that reported a change in food, 98% noticed a change in colour with 76% of them reporting that
food became yellow/orange upon addition of Chipolopolo.
Despite the large number of caregivers who noticed a difference in taste and colour, only 7% of the
children refused to eat the food with Chipolopolo. Furthermore 55% of those who did report that their

29
child refused food with Chipolopolo stated that it was only refused before spoiled Chipolopolo sachets
were replaced.
Table 15 | Perceived Changes due to Chipolopolo
n %
(N=239)
Noted changes to the food
199 83.3
Duration of time for change to occur Right away 156 78.8 After 15 minutes 16 8.1 Within 15 minutes 14 7 After 30 minutes or longer
10 5.1 Other1 2 0.8
Changes in taste 127 63.8 Became bitter 35 27.6 Tasted like medicine/supplement 35 27.6 Became sweeter 32 25.2 Tastes good 9 7.1 Other2 5 3.9 Tasted bad 3 2.4 Tastes sour 3 2.4 Tastes like beef 3 2.4 Tastes like milk 2 1.6
Changes in colour 195 98.0 Yellow/ Orange 148 75.9 Brown 27 13.9 Green 6 3.1 Black 10 5.1 Darker 2 1.0 Other3 2 1.0
1Can’t specify time, when food gets colder 2Can’t explain (2), forgotten (2), tastes rusty 3Grey, red
Table 16 | Effects of Perceived Changes in Food following addition of Chipolopolo on Child’s Appetite
n %
(N=199)
Child refused to eat food as a result of these changes
No 168 84.4 Sometimes
18 9.1 Yes 13 6.5
When did the child refuse? Only before replacement of spoiled Chipolopolo 16 55.2 Only after replacement of spoiled Chipolopolo 7 24.1 Before and after replacement of spoiled Chipolopolo 6 20.7
Many caregivers reported having noticed improvements in their child’s health and behaviour after
introducing Chipolopolo to their child’s diet. When asked if they had noticed a change in their child’s health
or behaviour, 86% of caregivers reported that their child became more active, 73% that their child had an
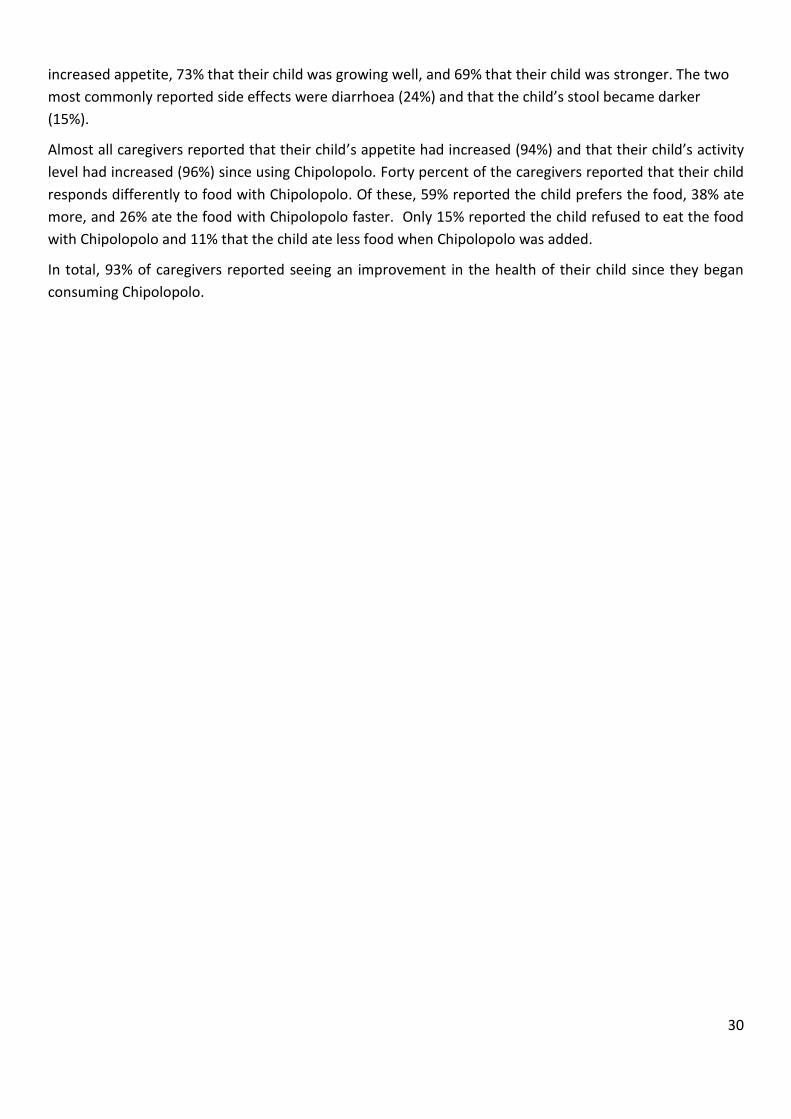
30
increased appetite, 73% that their child was growing well, and 69% that their child was stronger. The two
most commonly reported side effects were diarrhoea (24%) and that the child’s stool became darker
(15%).
Almost all caregivers reported that their child’s appetite had increased (94%) and that their child’s activity
level had increased (96%) since using Chipolopolo. Forty percent of the caregivers reported that their child
responds differently to food with Chipolopolo. Of these, 59% reported the child prefers the food, 38% ate
more, and 26% ate the food with Chipolopolo faster. Only 15% reported the child refused to eat the food
with Chipolopolo and 11% that the child ate less food when Chipolopolo was added.
In total, 93% of caregivers reported seeing an improvement in the health of their child since they began
consuming Chipolopolo.
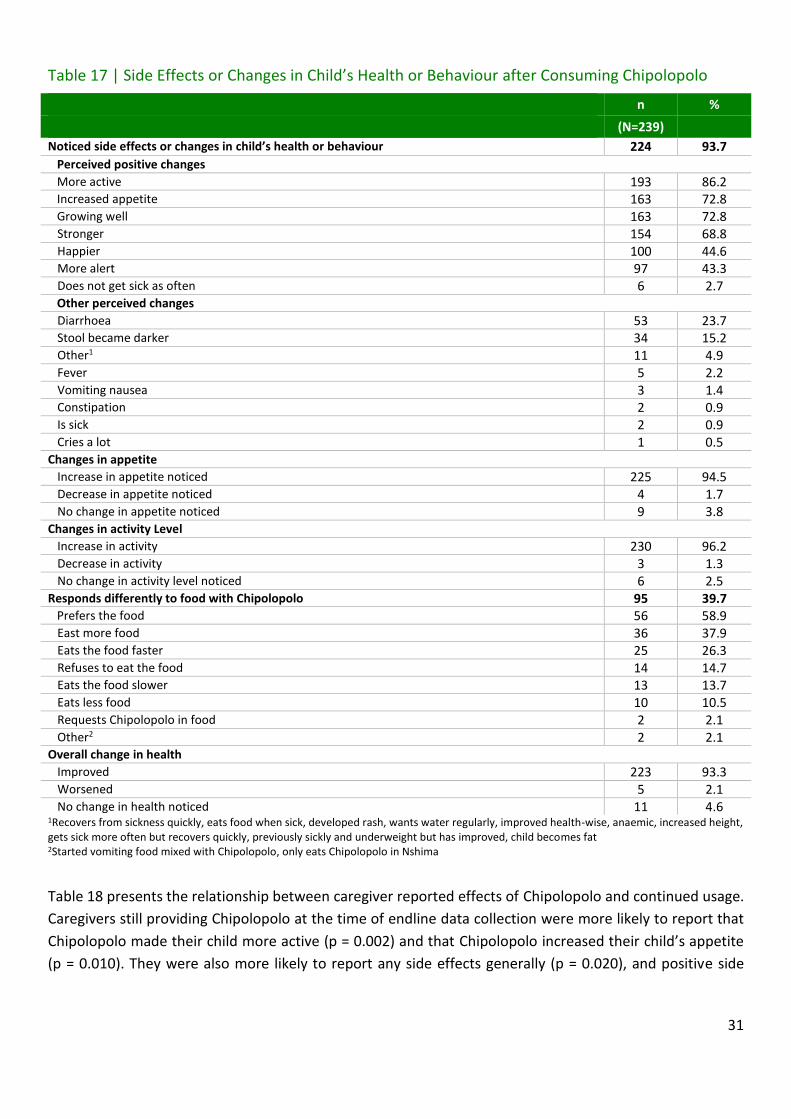
31
Table 17 | Side Effects or Changes in Child’s Health or Behaviour after Consuming Chipolopolo
n %
(N=239)
Noticed side effects or changes in child’s health or behaviour
224 93.7
Perceived positive changes More active 193 86.2 Increased appetite 163 72.8 Growing well 163 72.8
Stronger 154 68.8 Happier 100 44.6 More alert 97 43.3 Does not get sick as often 6 2.7
Other perceived changes Diarrhoea 53 23.7 Stool became darker 34 15.2 Other1 11 4.9 Fever 5 2.2 Vomiting nausea 3 1.4 Constipation 2 0.9 Is sick 2 0.9
224
Stool becomes
darker
Cries a lot 1 0.5 Changes in appetite
Increase in appetite noticed 225 94.5 Decrease in appetite noticed 4 1.7 No change in appetite noticed 9 3.8
Changes in activity Level Increase in activity 230 96.2 Decrease in activity 3 1.3 No change in activity level noticed 6 2.5
Responds differently to food with Chipolopolo 95 39.7 Prefers the food 56 58.9
East more food 36 37.9 Eats the food faster 25 26.3 Refuses to eat the food 14 14.7 Eats the food slower 13 13.7 Eats less food 10 10.5
Other
Requests Chipolopolo in food 2 2.1 Other2 2 2.1
Overall change in health
228 95.4
Improved 223 93.3 Worsened 5 2.1 No change in health noticed 11 4.6
1Recovers from sickness quickly, eats food when sick, developed rash, wants water regularly, improved health-wise, anaemic, increased height, gets sick more often but recovers quickly, previously sickly and underweight but has improved, child becomes fat 2Started vomiting food mixed with Chipolopolo, only eats Chipolopolo in Nshima
Table 18 presents the relationship between caregiver reported effects of Chipolopolo and continued usage.
Caregivers still providing Chipolopolo at the time of endline data collection were more likely to report that
Chipolopolo made their child more active (p = 0.002) and that Chipolopolo increased their child’s appetite
(p = 0.010). They were also more likely to report any side effects generally (p = 0.020), and positive side

32
effects specifically (p = 0.000), and were less likely to report only negative effects (p = 0.001), although no
single negative effect was statistically significantly related to on-going usage.
Table 18| Comparison of Caregiver Reported Effects of Chipolopolo usage Comparing Individuals Who Were and Were Not Consuming Chipolopolo at Endline
Consuming Chipolopolo
(N=188)
Not Consuming Chipolopolo
(N=50)
P-Value*
n % n % Caregiver reports that there are effects/side effects 180 95.7 43 86.0 0.020**/***
Caregiver reported any positive effects 179 95.2 39 78.0 0.000**/***
Caregiver reported only positive effects 118 62.8 28 56.0 0.478
Chipolopolo make child active 160 85.1 32 64.0 0.002**
Chipolopolo improve child appetite 136 72.3 26 52.0 0.010**
Chipolopolo make the child grow well 133 70.7 29 58.0 0.122
Chipolopolo make child strong 126 67.0 28 56.0 0.200
Chipolopolo make child happy 82 43.6 18 36.0 0.419
Chipolopolo make the child more alert 77 41.0 20 40.0 1.000
Caregiver reported any negative effects 62 33.0 15 30.0 0.818
Caregiver reported only negative effects 1 0.5 4 8.0 0.001**/***
Chipolopolo cause diarrhoea 41 21.8 12 24.0 0.889
Chipolopolo cause dark stools 31 16.5 3 6.0 0.098
Chipolopolo cause fever 4 2.1 1 2.0 1.000***
Chipolopolo make the child sick 2 1.1 0 0 1.000***
Chipolopolo make the child cry 1 0.5 0 0 1.000***
Chipolopolo cause constipation 1 0.5 1 2.0 0.377***
Chipolopolo make the child vomit/be nauseous 1 0.5 2 4.0 0.113*** * Determined using a Pearson Chi-square test with continuity correction ** Significant at P < 0.05 *** Determined using a Fisher’s Exact Test
3.1.3. Acceptability
Almost half of the caregivers (47%) reported that family and/or community members had discouraged
them from using Chipolopolo, with 76% reporting friends or neighbours as the source. The two most
common reasons for discouragement included the belief that Chipolopolo is harmful to the child (62%),
and the suspicion of new or unfamiliar products (47%).

33
Table 19 | Acceptability of Chipolopolo by Family and Community Members
n %
(N=239)
Discouragement from family and/or community members
113 47.3
Friend or neighbour 87 76.3 Uncle or aunt 17 14.9 Grandparent 11 9.6 Father of child 10 8.8 Other1 6 5.3 Cousin 1 0.9 Mother support group member 1 0.9
Reason for discouragement Believe that Chipolopolo is harmful to child 83 61.5 Are suspicious of new or unfamiliar products 63 46.7 Chipolopolo is associated with Satanism 20 14.8 Do not understand the importance of Chipolopolo 20 14.8 Are suspicious of people outside of community 13 9.6 Believe that diet is good enough 10 7.4 Are suspicious of packaged foods and associated illnesses 9 6.7 Other2 6 4.4 Foreign/imported product 4 3.0 Because it is a government project 2 1.5 Reason for discouragement unknown 1 0.7 Do not know how to use Chipolopolo 1 0.7
1Community members, elderly people, mother from community, mothers not getting Chipolopolo, sister, cousin 2no reason just discouraged, Chipolopolo changed colour after first distribution, Chipolopolo meant for villagers who do not have enough food, they don’t give us anything for giving blood, Chipolopolo is made of caterpillars and I am Seventh Day Adventist
Over half of all caregivers (57%) reported having heard rumours about Chipolopolo. Seventy-one percent
of rumours involved Chipolopolo being associated with Satanism and witchcraft, and 34% were that
Chipolopolo makes children ill. Only 6% of the caregivers however, reported that the rumours and
discouragement received from their family and/or communities had affected their decision to give
Chipolopolo to their child.
Table 20 | Rumours Heard about Chipolopolo in Communities
n %
(N=239)
Heard rumours about Chipolopolo
169 56.9 Associated with Satanism/witchcraft 120 71.0
Will make children ill 58 34.3 Will give children diarrhoea 41 24.3 Chipolopolo are harmful/ poisonous/ kill 40 23.7 Will make children sterile 24 14.2 Other 24 14.2 Causes the gastrointestinal tract to rot 2 1.2 Will give children skin rashes 2 1.2
Rumours and discouragements has affected my decision to give Chipolopolo to my child 11 6.0
Table 21 presents analysis of different rumours and whether or not reporting being aware of them was
related to continued use of Chipolopolo at endline. While no single rumour was statistically significantly
related to use, rumours that Chipolopolo caused diarrhoea were the closest to being significant (p = 0.101)
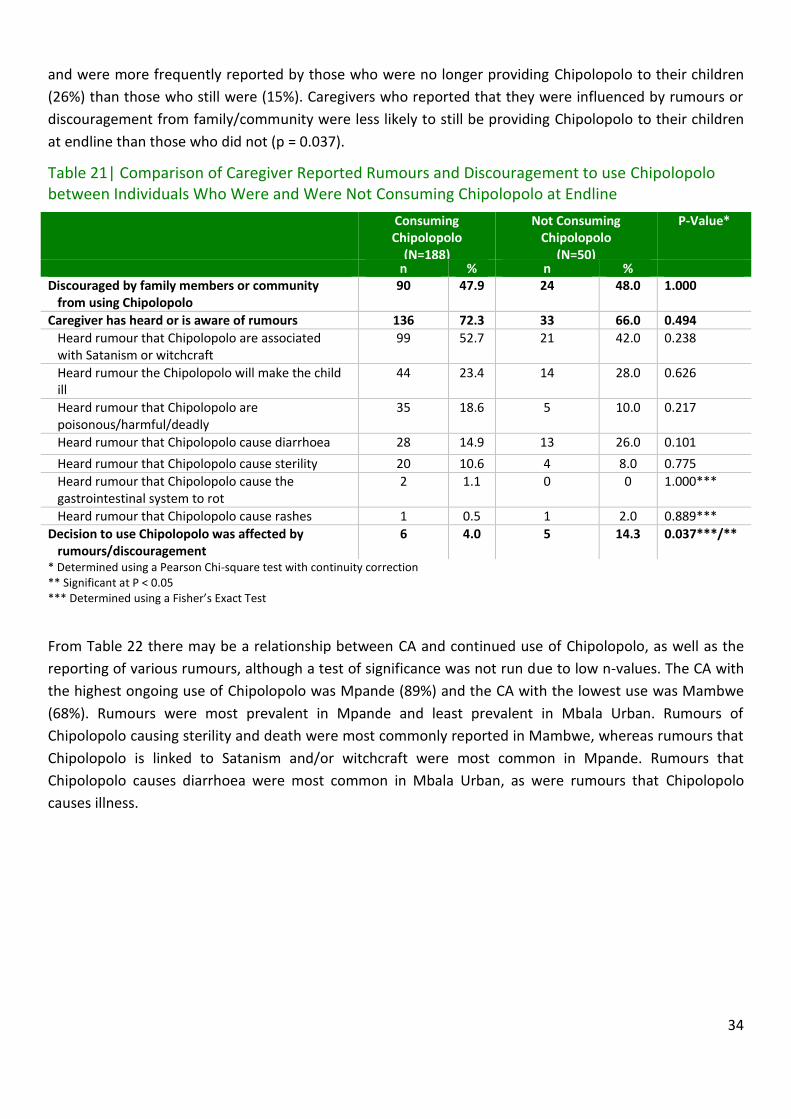
34
and were more frequently reported by those who were no longer providing Chipolopolo to their children
(26%) than those who still were (15%). Caregivers who reported that they were influenced by rumours or
discouragement from family/community were less likely to still be providing Chipolopolo to their children
at endline than those who did not (p = 0.037).
Table 21| Comparison of Caregiver Reported Rumours and Discouragement to use Chipolopolo between Individuals Who Were and Were Not Consuming Chipolopolo at Endline
Consuming Chipolopolo
(N=188)
Not Consuming Chipolopolo
(N=50)
P-Value*
n % n % Discouraged by family members or community from using Chipolopolo
90 47.9 24 48.0 1.000
Caregiver has heard or is aware of rumours 136 72.3 33 66.0 0.494
Heard rumour that Chipolopolo are associated with Satanism or witchcraft
99 52.7 21 42.0 0.238
Heard rumour the Chipolopolo will make the child ill
44 23.4 14 28.0 0.626
Heard rumour that Chipolopolo are poisonous/harmful/deadly
35 18.6 5 10.0 0.217
Heard rumour that Chipolopolo cause diarrhoea 28 14.9 13 26.0 0.101
Heard rumour that Chipolopolo cause sterility 20 10.6 4 8.0 0.775
Heard rumour that Chipolopolo cause the gastrointestinal system to rot
2 1.1 0 0 1.000***
Heard rumour that Chipolopolo cause rashes 1 0.5 1 2.0 0.889***
Decision to use Chipolopolo was affected by rumours/discouragement
6 4.0 5 14.3 0.037***/**
* Determined using a Pearson Chi-square test with continuity correction ** Significant at P < 0.05 *** Determined using a Fisher’s Exact Test
From Table 22 there may be a relationship between CA and continued use of Chipolopolo, as well as the
reporting of various rumours, although a test of significance was not run due to low n-values. The CA with
the highest ongoing use of Chipolopolo was Mpande (89%) and the CA with the lowest use was Mambwe
(68%). Rumours were most prevalent in Mpande and least prevalent in Mbala Urban. Rumours of
Chipolopolo causing sterility and death were most commonly reported in Mambwe, whereas rumours that
Chipolopolo is linked to Satanism and/or witchcraft were most common in Mpande. Rumours that
Chipolopolo causes diarrhoea were most common in Mbala Urban, as were rumours that Chipolopolo
causes illness.

35
Table 22| Comparison of Chipolopolo usage, and Selected Rumours by Catchment Area
Consuming Chipolopolo
Heard Rumours
Cause Sterility
Satanism/ Witchcraft
Cause Diarrhoea
Are Deadly
Cause Illness
Catchment Area n (%) n (%) n (%) n (%) n (%) n (%) n (%)
Kawimbe (N = 39) 31 (79.5) 30 (76.9) 1 (2.6) 19 (48.7) 7 (17.9) 8 (20.5) 12 (30.8)
Mambwe (N = 50) 34 (68.0) 36 (72.0) 9 (18.0) 26 (52.0) 10 (20) 12 (24.0) 10 (20.0)
Mbala Urban (N = 52) 44 (84.6) 33 (63.5) 3 (5.8) 22 (42.3) 12 (23.1) 5 (9.6) 15 (28.8)
Mpande (N = 55) 49 (89.1) 44 (80.0) 9 (16.4) 36 (65.5) 5 (9.1) 8 (14.5) 14 (25.5)
Tulemane (N = 43) 30 (71.4) 26 (60.5) 2 (4.7) 17 (39.5) 7 (16.3) 7 (16.3) 7 (16.3)
Overall, Chipolopolo was well accepted as 98% of the caregivers responded that they would recommend
Chipolopolo to other caregivers in the community. The median price caregivers were willing to pay for one
box of Chipolopolo is 5 Kwacha, with the value ranging from zero to 150 Kwacha.
Table 23 | Acceptability of Chipolopolo among Caregivers
n %
(N=239)
I would recommend that other mothers use Chipolopolo
233 97.5 I would not recommend that other mothers use Chipolopolo 6 2.5
3.1.4. Delivery of Chipolopolo
Caregivers reported having received an average of 4 boxes over the course of the study, with 70% receiving
4 boxes or more; however, this value is different when examining Chipolopolo distribution cards, which
101 caregivers were in possession of (Table 24). Based on these cards, caregivers received on average 3
boxes of Chipolopolo, with 48% receiving 4 boxes or more. The majority of caregivers (93%) reported
having received boxes from a community health worker (CHW) either at the health outreach post (35%) or
during a home visit (34%). When looking at the frequency of distribution, the plurality of caregivers
reported that they received a box of Chipolopolo every two months (44%), while 43% reported that they
received one every month.

36
Table 24 | Delivery of Chipolopolo to Caregivers
n %
(N=239)
Person from which boxes of Chipolopolo are received
Community Health Worker 222 92.9 Health Worker 17 7.1
Location of Chipolopolo distribution Outreach post/mobile clinic 83 34.7 Home visit 80 33.5 Home of community health worker/ volunteer 34 14.2 Health Clinic 29 12.1 Hospital 10 4.2 Other community member’s home 2 0.8
Other School 1 0.4 Frequency of distribution
Every two months 105 44.1 Every month 102 42.9 Every two weeks 10 4.2 Don’t know 9 3.8 Longer than 2 months 8 3.4 Collects distribution when out of Chipolopolo 3 1.3 Every week 1 0.4
Five of the caregivers interviewed at endline (2%) reported that they had experienced a problem at a
Chipolopolo distribution. The reported problems were long wait times (50%), the person responsible was
not present to give out Chipolopolo (25%), and Chipolopolo being out of stock (25%).
Table 25 | Problems Encountered during Chipolopolo Distribution
n %
(N=239)
Experienced a problem at a Chipolopolo distribution
5 2.1
Problems encountered Had to wait a long time to receive Chipolopolo 2 50.0 Person responsible was not there to give out Chipolopolo on the proper day 1 25.0 Out of stock 1 25.0
Using a Kruskal-Wallis Test, it was found that there was a statistically significant difference between CA in
the number of boxes of Chipolopolo, using both the distribution cards (p < 0.001), and the caregiver
reports (p < 0.001). The CA with the highest average distribution of Chipolopolo boxes, as assessed via
distribution cards was Kawimbe, at 4.8 boxes, and the CA with the lowest distribution was Mambwe, at an
average of 2.1 boxes (Table 26). When assessing distribution using caregiver reports the results differed:
for all CA but Kawimbe the average number of boxes received was higher and the CA with the highest
distribution was Mbala Urban, which also had the largest disagreement when comparing distribution levels
from the distribution cards and caregiver report.
Table 26| Comparison of Boxes of Chipolopolo Received by Catchment Area and Method of Reporting

37
Number of Boxes Received (Distribution Card)
Number of Boxes Received (Caregiver Reported)
Catchment Area Mean ± SD (Range) Mean ± SD (Range)
Kawimbe 4.82 ± 0.215 (1-6) 4.76 ± 0.218 (1-6)
Mambwe 2.10 ± 0.379 (1-4) 4.40 ± 0.267 (3-5)
Mbala Urban 2.57 ± 0.388 (1-6) 5.10 ± 0.266 (2-7)
Mpande 2.30 ± 0.371 (1-5) 4.00 ± 0.262 (1-5)
Tulemane 3.06 ± 0.466 (0-6) 4.00 ± 0.284 (2-6)
* Determined using a Pearson Chi-square test with continuity correction ** Significant at P < 0.05 *** Determined using a Fisher’s Exact Test
3.1.5. Delivery of Chipolopolo Messages
Ninety percent of caregivers reported having received messages about Chipolopolo at community
gatherings. Immunization/vitamin A supplementation activities (67%) and meetings held by community
leaders (26%), were the most commonly listed community gathering locations at which messages were
received. Additionally, 93% reported that they had received Chipolopolo information materials and
brochures. Of those that were provided informational materials, 97% stated they had found these to be
useful. In total, 99.6% of caregivers reported they had received Chipolopolo-related training and all but one
of these caregivers reported that their training session included a cooking demonstration. The one
caregiver whose training did not include a cooking demonstration was the only one to state that the
training was not useful.
38
Table 27 | Chipolopolo Messages and Information Materials Received
n %
(N=239)
Messages received regarding Chipolopolo at community gatherings 215 90.0
Where messages were heard Immunization/ Vitamin A supplementation (under-five child clinic) 144 67.0 Meeting or other community leaders meeting 56 26.0
Mother support group 23 10.7 Meeting at school (Community or PTA) 16 7.4
Church announcements 7 3.3 Home visit 6 2.8 Health clinic 5 2.3 Other1 4 1.9 Markets 2 0.9
Received informational material(s) regarding Chipolopolo 221 92.5 Materials and/or brochures were useful 215 97.3 Materials and/ or brochures were not useful 5 2.3 Illiterate 5 100
Received training on how to use Chipolopolo 238 99.6 Received cooking demonstration 237 99.6 Training was useful 237 99.6 Training was not useful 1 0.4
Too complicated 1 100 Too long 1 100
1Cooking demonstration (2), forgotten, co-operative meeting
3.1.6. Knowledge of Chipolopolo
Overall caregiver knowledge of Chipolopolo was strong. Almost all caregivers in the study believe that they
know why Chipolopolo should be added to food (99%), with 89% of caregivers reporting that Chipolopolo
will make children strong, and 67% of caregivers reporting that Chipolopolo increases resistance to disease.
Caregiver knowledge for proper utilization of Chipolopolo each of the steps varied. The most commonly
recalled instructions were: add Chipolopolo to a small portion of food (90%), mix Chipolopolo with semi-
solid, soft or mashed foods (72%) and wash hands and utensils with soap and clean water (70%). The least
recalled step for using Chipolopolo consists of the proper storage in a cool, dry location at home (21%).

39
Table 28 | Knowledge of Chipolopolo Benefits and Proper Use
n %
(N=238)
Believes they know why Chipolopolo should be added to food 236 99.2
Will make children strong 209 88.6 Increased resistance to disease 159 67.4 Increased appetite 148 62.7
Treat or prevent anaemia 104 44.1 Increased ability to learn 95 40.3 Increased ability to develop 82 34.7 Nutritious /contains vitamins 8 3.4 Other1 5 2.1
How to use Chipolopolo Add Chipolopolo to a small portion of food 213 89.5 Mix Chipolopolo with semi-solid, soft or mashed foods 171 71.8 Wash hands and utensils with soap and clean water 167 70.2 Do not add to hot food 153 64.3 Add entire contents of one sachet to child’s food 151 63.4 Do not add to liquids or liquids to foods
124 52.1 Shake sachet before opening check for clumping 109 45.8 Feed entire contents to child within 30 minutes 107 45.0 Storage – keep sachets in a cool dry place in the home 51 21.4 Can’t remember 7 2.9 Other2 7 2.9
1Prevents blindness, prevents oedema, to reduce stunting and malnutrition, heard a lot of good things about Chipolopolo, all the problem children faced are now gone thanks to Chipolopolo 2Throw out damaged sachets, don’t put entire sachet on food, treat water first, give Chipolopolo to one child only, clean cooking area, add to nutritious food, use active feeding
The majority of the caregivers in the study were able to correctly identify the time at which Chipolopolo
should be added into food during preparation (97%), that Chipolopolo should not be added to liquids
(94%), and the maximum number of sachets a child should receive in one day (93%). Four percent
incorrectly stated that Chipolopolo should be introduced into a child’s diet before 6 months of age.

40
Table 29 | Applied Knowledge for Proper Utilization of Chipolopolo
n %
(N=239)
Age child should start using Chipolopolo
At 6 months 196 82.4 Older than 6 months 26 10.9 Before 6 months 9 3.8 Do not know 7 2.9
Maximum number of sachets a child should consume a day One a day 222 93.3 More than one sachet a day 15 6.3 Less than one a day 1 0.4
When should Chipolopolo be added to a meal? After the food has cooled enough for the child to eat 231 97.1 Immediately after cooking 5 2.1 During cooking
1 0.4 Other1 1 0.4
One sachet is meant for how many children? Only one 236 99.2 More than one 2 0.8
Can Chipolopolo be added to liquids or liquid foods? Chipolopolo cannot be added to liquid or liquid foods 224 94.1 Chipolopolo can be added to liquids or liquid foods 14 5.9
1After ten minutes
3.2. Module 3: Mother’s Knowledge on IYCF and Anaemia
3.2.1. IYCF Counselling
Health care providers (HCP) had discussed breastfeeding or how to feed a child with 93% of caregivers
interviewed. Sixty-eight percent of caregivers had attended a counselling session in the past two months
with 1.3 sessions being the average number attended.
How to feed a child was the most commonly cited topic of the counselling sessions (85%), followed by
breastfeeding (49%) and proper hygiene and sanitation (35%). Caregivers’ responses to topics discussed
were similar between the control and intervention group, however there was a notable difference in who
conducted the session. Within the control group a CHW was the more commonly listed option (60%) with
only 34% stating their session had been conducted by a trained HCP. In contrast, a trained HCP was the
more commonly listed option (49%) within the intervention group, followed by a CHW at (47%).
The majority of counselling sessions took place at some form of community meeting place, including a
health centre, outreach post, school, or church. The provision of written materials was more common
within the intervention group, even when accounting for the presence of the Chipolopolo brochure.
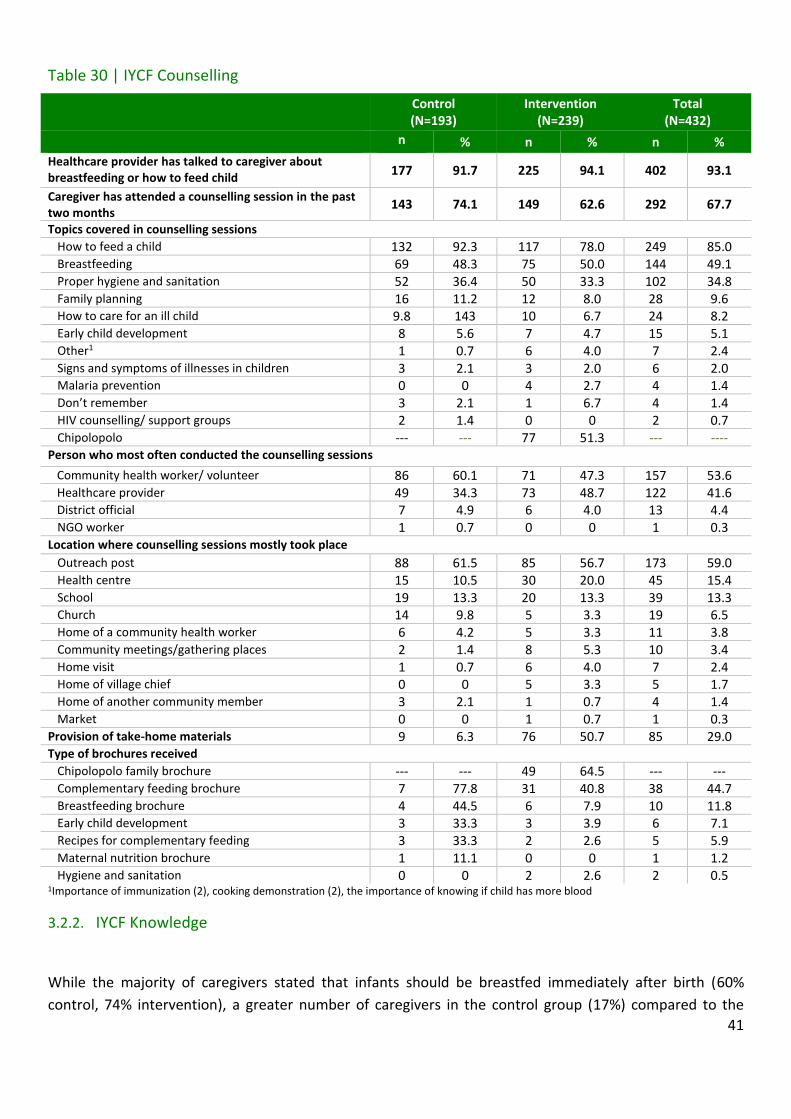
41
Table 30 | IYCF Counselling
Control (N=193)
Intervention (N=239)
Total (N=432)
n
%
% n % n %
Healthcare provider has talked to caregiver about breastfeeding or how to feed child
177 91.7 225 94.1 402 93.1
Caregiver has attended a counselling session in the past two months
143 74.1 149 62.6 292 67.7
Topics covered in counselling sessions How to feed a child 132 92.3 117 78.0 249 85.0 Breastfeeding 69 48.3 75 50.0 144 49.1 Proper hygiene and sanitation 52 36.4 50 33.3 102 34.8 Family planning 16 11.2 12 8.0 28 9.6 How to care for an ill child 9.8 143 10 6.7 24 8.2 Early child development 8 5.6 7 4.7 15 5.1 Other1 1 0.7 6 4.0 7 2.4 Signs and symptoms of illnesses in children 3 2.1 3 2.0 6 2.0 Malaria prevention 0 0 4 2.7 4 1.4 Don’t remember 3 2.1 1 6.7 4 1.4 HIV counselling/ support groups 2 1.4 0 0 2 0.7 Chipolopolo --- --- 77 51.3 --- ----
Person who most often conducted the counselling sessions
Community health worker/ volunteer 86 60.1 71 47.3 157 53.6 Healthcare provider 49 34.3 73 48.7 122 41.6 District official 7 4.9 6 4.0 13 4.4
NGO worker 1 0.7 0 0 1 0.3 Location where counselling sessions mostly took place
Outreach post 88 61.5 85 56.7 173 59.0 Health centre 15 10.5 30 20.0 45 15.4 School 19 13.3 20 13.3 39 13.3 Church 14 9.8 5 3.3 19 6.5 Home of a community health worker 6 4.2 5 3.3 11 3.8 Community meetings/gathering places 2 1.4 8 5.3 10 3.4 Home visit 1 0.7 6 4.0 7 2.4 Home of village chief 0 0 5 3.3 5 1.7 Home of another community member 3 2.1 1 0.7 4 1.4 Market 0 0 1 0.7 1 0.3
Provision of take-home materials 9 6.3 76 50.7 85 29.0 Type of brochures received
Chipolopolo family brochure --- --- 49 64.5 --- --- Complementary feeding brochure 7 77.8 31 40.8 38 44.7 Breastfeeding brochure 4 44.5 6 7.9 10 11.8 Early child development 3 33.3 3 3.9 6 7.1 Recipes for complementary feeding 3 33.3 2 2.6 5 5.9 Maternal nutrition brochure 1 11.1 0 0 1 1.2 Hygiene and sanitation 0 0 2 2.6 2 0.5
1Importance of immunization (2), cooking demonstration (2), the importance of knowing if child has more blood
3.2.2. IYCF Knowledge
While the majority of caregivers stated that infants should be breastfed immediately after birth (60%
control, 74% intervention), a greater number of caregivers in the control group (17%) compared to the
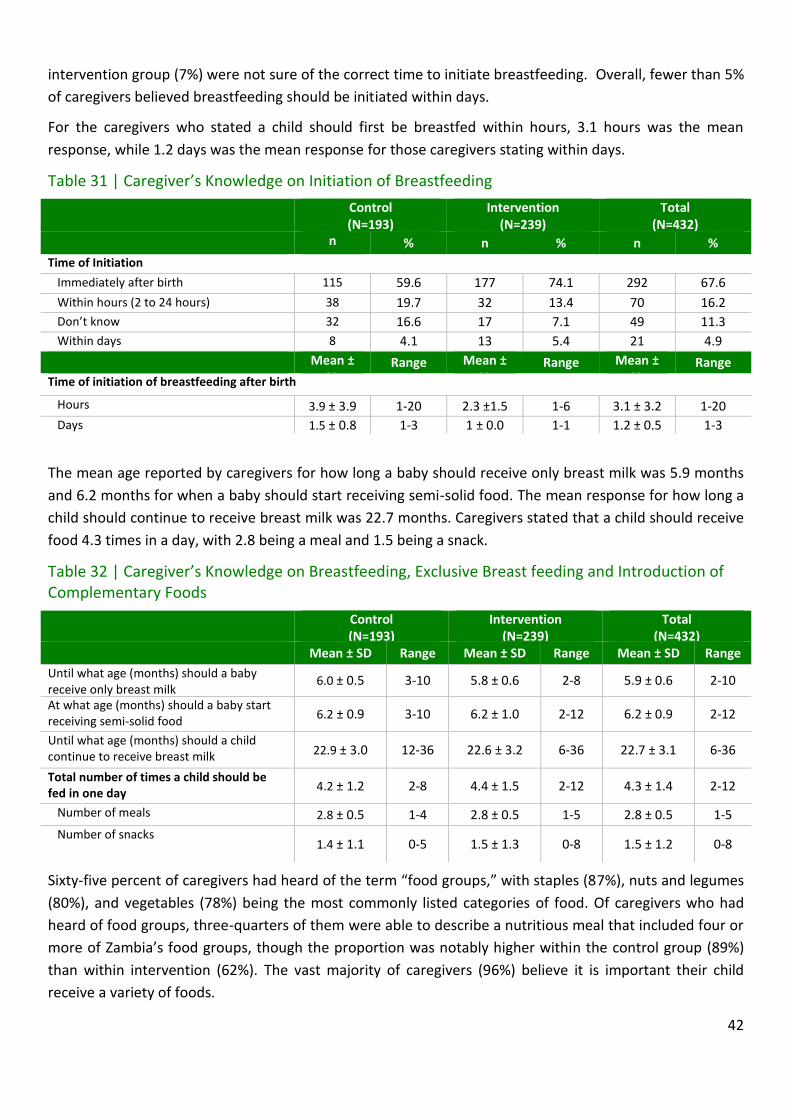
42
intervention group (7%) were not sure of the correct time to initiate breastfeeding. Overall, fewer than 5%
of caregivers believed breastfeeding should be initiated within days.
For the caregivers who stated a child should first be breastfed within hours, 3.1 hours was the mean
response, while 1.2 days was the mean response for those caregivers stating within days.
Table 31 | Caregiver’s Knowledge on Initiation of Breastfeeding
Control (N=193)
Intervention (N=239)
Total (N=432)
n % n % n %
Time of Initiation
Immediately after birth 115 59.6 177 74.1 292 67.6
Within hours (2 to 24 hours) 38 19.7 32 13.4 70 16.2
Don’t know 32 16.6 17 7.1 49 11.3
Within days 8 4.1 13 5.4 21 4.9
Mean ± SD
Range Mean ± SD
Range Mean ± SD
Range
Time of initiation of breastfeeding after birth
Hours 3.9 ± 3.9 1-20 2.3 ±1.5 1-6 3.1 ± 3.2 1-20
Days 1.5 ± 0.8 1-3 1 ± 0.0 1-1 1.2 ± 0.5 1-3
The mean age reported by caregivers for how long a baby should receive only breast milk was 5.9 months
and 6.2 months for when a baby should start receiving semi-solid food. The mean response for how long a
child should continue to receive breast milk was 22.7 months. Caregivers stated that a child should receive
food 4.3 times in a day, with 2.8 being a meal and 1.5 being a snack.
Table 32 | Caregiver’s Knowledge on Breastfeeding, Exclusive Breast feeding and Introduction of Complementary Foods
Control (N=193)
Intervention (N=239)
Total (N=432)
Mean ± SD Range Mean ± SD Range Mean ± SD Range
Until what age (months) should a baby receive only breast milk
6.0 ± 0.5 3-10 5.8 ± 0.6 2-8 5.9 ± 0.6 2-10
At what age (months) should a baby start receiving semi-solid food
6.2 ± 0.9 3-10 6.2 ± 1.0 2-12 6.2 ± 0.9 2-12
Until what age (months) should a child continue to receive breast milk 22.9 ± 3.0 12-36 22.6 ± 3.2 6-36 22.7 ± 3.1 6-36
Total number of times a child should be fed in one day
4.2 ± 1.2 2-8 4.4 ± 1.5 2-12 4.3 ± 1.4 2-12
Number of meals 2.8 ± 0.5 1-4 2.8 ± 0.5 1-5 2.8 ± 0.5 1-5
Number of snacks 1.4 ± 1.1 0-5 1.5 ± 1.3 0-8 1.5 ± 1.2 0-8
Sixty-five percent of caregivers had heard of the term “food groups,” with staples (87%), nuts and legumes
(80%), and vegetables (78%) being the most commonly listed categories of food. Of caregivers who had
heard of food groups, three-quarters of them were able to describe a nutritious meal that included four or
more of Zambia’s food groups, though the proportion was notably higher within the control group (89%)
than within intervention (62%). The vast majority of caregivers (96%) believe it is important their child
receive a variety of foods.

43
In total, 88% of caregivers have heard of the term active feeding, with 79% of those stating it consists of
encouraging the baby to eat. Approximately half of all caregivers stated that active feeding involves
supervising the child while eating, and being patient while feeding the child (51% and 49% respectively).

44
Table 33 | Caregiver’s Knowledge on Dietary Diversity and Active Feeding
Control (N=193)
Intervention (N=239)
Total (N=432)
n
%
% n % n %
Heard of the term “food groups” 135 69.9 148 61.9 283 65.5
Types of food/ingredients listed for a nutritious meal
Staples 116 85.9 129 87.2 148 148 148 148 148 148 148 148 148 239 239
245 86.6 Nuts and legumes 105 77.8 120 81.1 225 79.5 Vegetables 102 75.6 118 79.7 220 77.7 Animal source 91 67.4 93 62.8 184 65.0 Fruits 51 37.8 90 60.8 141 49.8
Fats 52 38.5 67 45.3 119 42.0 Dairy products 17 12.6 19 12.8 36 12.7 Don’t know 2 1.5 1 0.7 3 1.1 Other1 6 4.4 3 2.0 9 3.2
Number of food groups listed by caregiver in nutritious meal One 2 1.5 1 0.7 3 1.1 Two 1 0.7 1 0.7 2 0.7 Three 9 6.7 15 10.1 24 8.5 Four 42 3.1 25 16.8 67 23.6 Five 33 24.4 36 24.2 69 24.3 Six 34 25.2 27 18.1 61 21.5 Seven 11 8.1 4 26.8 15 0.4 Four or more 120 88.8 92 61.7 212 74.6
Think feeding a variety of foods is important 178 92.7 236 98.7 414 95.8
Have heard of the term “active feeding” 171 88.6 207 87.0 378 87.5 What consists of active feeding
Caregiver encourages baby to eat 130 76.0 171 171 171 171
169 81.6 299 79.1
Caregiver feeds the child or supervises the child when he/she is eating
94 55.0 97 46.9 191 50.5
Caregiver is patient in feeding the child (not force feeding)
81 47.4 103 49.8 184 48.7
Other2 7 4.1 7 3.4 14 3.7
Don’t know 0 0 2 1.0 2 0.5 1Liquids (8), I just give what I can afford 2Eating with the child (2), giving him what he likes most (2), forcing to eat (2), not forcing to eat, playing with child, feeding food the child likes, I leave the child with someone else to feed, giving the child nice food like fritters, I can just change the food if he refuses again then I leave him, giving the child a variety of food, try different types of food if child refuses
3.2.3. Knowledge of Anaemia
Awareness of anaemia was high among caregivers in both the intervention and control groups with 97%
and 92%, respectively, having heard of anaemia or “lack of blood.” Almost all of the caregivers (98%) were
able to identify white/pale skin eyes, nails, and hands as a sign of anaemia, though only 27% were able to
identify apathy/fatigue and 16% feeling faint or dizzy. A variety of incorrect signs were also identified by
caregivers with the most common being oedema (17%).
Table 34 | Caregiver’s Knowledge of Anaemia
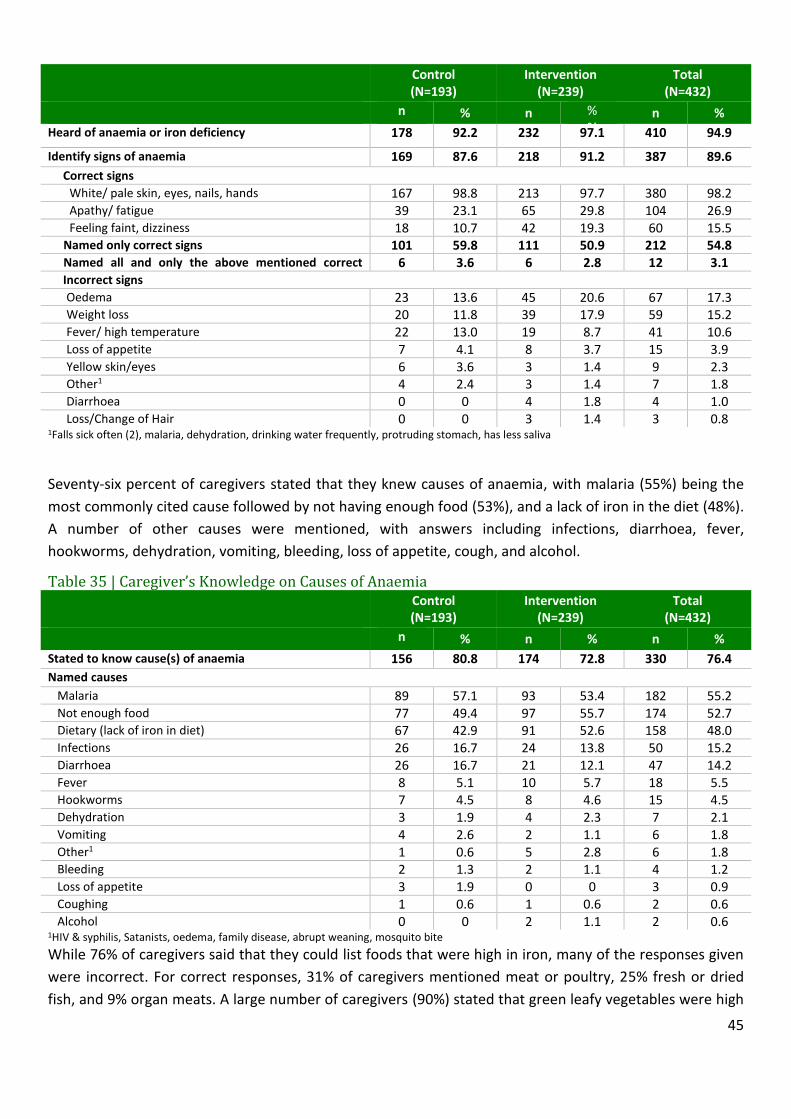
45
Control (N=193)
Intervention (N=239)
Total (N=432)
n
%
% n % %
n %
Heard of anaemia or iron deficiency
178 92.2 232 97.1 410 94.9
Identify signs of anaemia 169 87.6 218 91.2 387 89.6
Correct signs White/ pale skin, eyes, nails, hands 167 98.8 213 97.7 380 98.2 Apathy/ fatigue 39 23.1 65 29.8 104 26.9 Feeling faint, dizziness 18 10.7 42 19.3 60 15.5 Named only correct signs 101 59.8 111 50.9 212 54.8 Named all and only the above mentioned correct signs
6 3.6 6 2.8 12 3.1 Incorrect signs
Oedema 23 13.6 45 20.6 67 17.3 Weight loss 20 11.8 39 17.9 59 15.2 Fever/ high temperature 22 13.0 19 8.7 41 10.6 Loss of appetite 7 4.1 8 3.7 15 3.9 Yellow skin/eyes 6 3.6 3 1.4 9 2.3 Other1 4 2.4 3 1.4 7 1.8 Diarrhoea 0 0 4 1.8 4 1.0 Loss/Change of Hair 0 0 3 1.4 3 0.8
1Falls sick often (2), malaria, dehydration, drinking water frequently, protruding stomach, has less saliva
Seventy-six percent of caregivers stated that they knew causes of anaemia, with malaria (55%) being the
most commonly cited cause followed by not having enough food (53%), and a lack of iron in the diet (48%).
A number of other causes were mentioned, with answers including infections, diarrhoea, fever,
hookworms, dehydration, vomiting, bleeding, loss of appetite, cough, and alcohol.
Table 35 | Caregiver’s Knowledge on Causes of Anaemia
Control (N=193)
Intervention (N=239)
Total (N=432)
n
%
% n % n %
Stated to know cause(s) of anaemia
156 80.8 174 72.8 330 76.4
Named causes
Malaria 89 57.1 93 53.4 182 55.2 Not enough food 77 49.4 97 55.7 174 52.7 Dietary (lack of iron in diet) 67 42.9 91 52.6 158 48.0 Infections 26 16.7 24 13.8 50 15.2 Diarrhoea 26 16.7 21 12.1 47 14.2 Fever 8 5.1 10 5.7 18 5.5 Hookworms 7 4.5 8 4.6 15 4.5 Dehydration 3 1.9 4 2.3 7 2.1 Vomiting 4 2.6 2 1.1 6 1.8 Other1 1 0.6 5 2.8 6 1.8 Bleeding 2 1.3 2 1.1 4 1.2 Loss of appetite 3 1.9 0 0 3 0.9 Coughing 1 0.6 1 0.6 2 0.6 Alcohol 0 0 2 1.1 2 0.6
1HIV & syphilis, Satanists, oedema, family disease, abrupt weaning, mosquito bite
While 76% of caregivers said that they could list foods that were high in iron, many of the responses given
were incorrect. For correct responses, 31% of caregivers mentioned meat or poultry, 25% fresh or dried
fish, and 9% organ meats. A large number of caregivers (90%) stated that green leafy vegetables were high
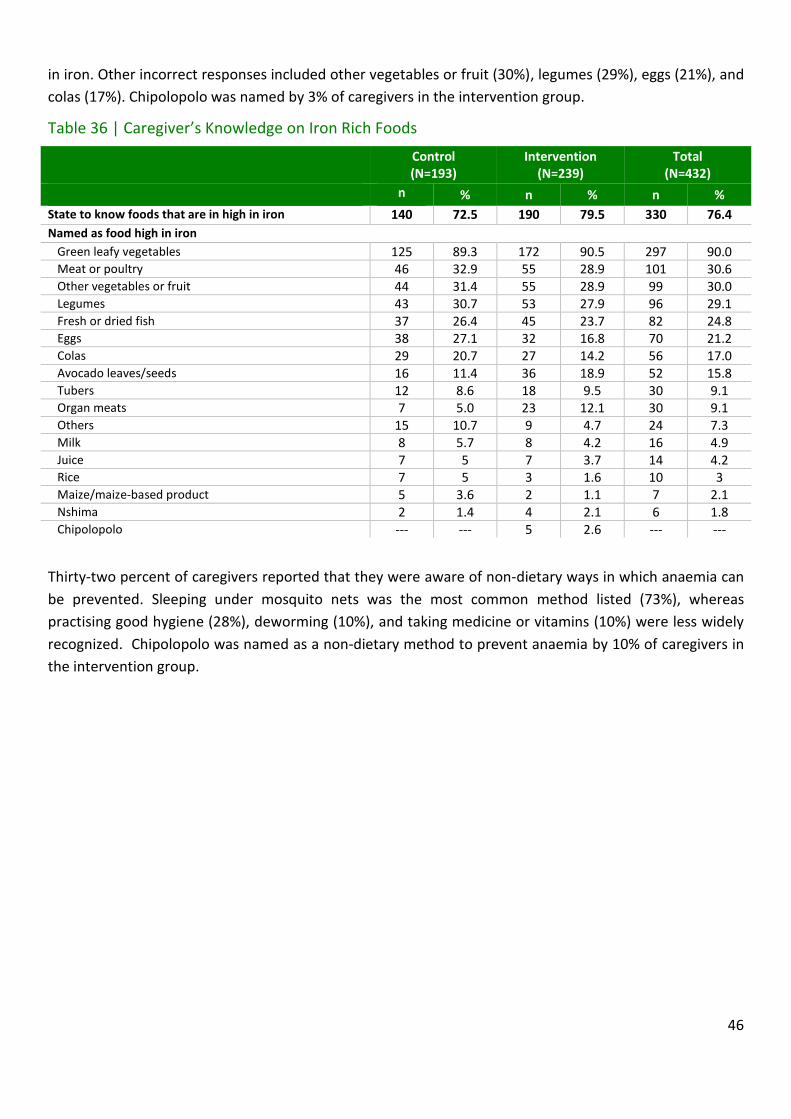
46
in iron. Other incorrect responses included other vegetables or fruit (30%), legumes (29%), eggs (21%), and
colas (17%). Chipolopolo was named by 3% of caregivers in the intervention group.
Table 36 | Caregiver’s Knowledge on Iron Rich Foods
Control (N=193)
Intervention (N=239)
Total (N=432)
n
%
% n % n %
State to know foods that are in high in iron
140 72.5 190 79.5 330 76.4
Named as food high in iron
Green leafy vegetables 125 89.3 172 90.5 297 90.0 Meat or poultry 46 32.9 55 28.9 101 30.6 Other vegetables or fruit 44 31.4 55 28.9 99 30.0 Legumes 43 30.7 53 27.9 96 29.1 Fresh or dried fish 37 26.4 45 23.7 82 24.8 Eggs 38 27.1 32 16.8 70 21.2 Colas 29 20.7 27 14.2 56 17.0 Avocado leaves/seeds 16 11.4 36 18.9 52 15.8 Tubers 12 8.6 18 9.5 30 9.1 Organ meats 7 5.0 23 12.1 30 9.1 Others 15 10.7 9 4.7 24 7.3 Milk 8 5.7 8 4.2 16 4.9 Juice 7 5 7 3.7 14 4.2 Rice 7 5 3 1.6 10 3 Maize/maize-based product 5 3.6 2 1.1 7 2.1 Nshima 2 1.4 4 2.1 6 1.8 Chipolopolo --- --- 5 2.6 --- ---
Thirty-two percent of caregivers reported that they were aware of non-dietary ways in which anaemia can
be prevented. Sleeping under mosquito nets was the most common method listed (73%), whereas
practising good hygiene (28%), deworming (10%), and taking medicine or vitamins (10%) were less widely
recognized. Chipolopolo was named as a non-dietary method to prevent anaemia by 10% of caregivers in
the intervention group.

47
Table 37 | Caregiver’s Knowledge on Non-Dietary Ways to Prevent Anaemia
Control (N=193)
Intervention (N=239)
Total (N=432)
n
%
% n % n %
Non-dietary ways to prevent Anaemia
63 32.6 77 32.2 140 32.2
Sleeping under mosquito nets 52 82.5 50 64.9 102 72.9 Practicing good hygiene 20 31.7 19 24.7 39 27.9 Deworming 7 11.1 7 9.1 14 10.0 Taking medicine or vitamins 8 12.7 6 7.8 14 10.0 Other1 4 6.3 6 7.8 10 7.1 Chipolopolo --- --- 8 10.4 --- ---
1 Go to the health centre/hospital (3), traditional medicine (2), prevent bleeding and avoid child playing in sun, giving child water to drink, herbs, resting, cleaning surroundings to prevent mosquitos
3.3. Module 4: Infant and Young Child Practices and Food Consumption
3.3.1. Breastfeeding and Feeding Practices
Breastfeeding practices among caregivers in the control and intervention groups were similar with 15% and
14% of children still being breastfed at the time of the interview respectively; however, if one only
examines caregivers of children under 24 months of age, this number climbs to 41%. Furthermore, in the
control, 46% of children under 24 months of age are still breastfed, compared to 38% in the intervention,
although this difference is not statistically significant (p = 0.574). Seventy percent of children were
receiving foods from the family pot (foods not specifically prepared for the child), and almost all of the
children (97%) consumed their meals from a separate bowl. The majority of children were feeding
themselves (85%), though this number was slightly larger in the control group than in the intervention
group (89% versus 82%). Of the children who were not yet feeding themselves, 87% were assisted by their
mother.
Table 38 | Caregiver’s Breastfeeding and Feeding Practices by Age – Exclusive Breastfeeding, Introduction of Complementary Foods, Assisted feeding
Control (N=193)
Intervention (N=239)
Total (N=432)
n
%
n
%
n %
Still being breastfed
28
14.5 34 14.2 62 14.4
Receiving foods from family pot 133 68.9 171 71.5 304 70.4
Eating from a separate bowl 185 95.9 235 98.3 420 97.2
Child feeds themselves 172 89.1 197 82.4 369 85.4 Assisted feeding 21 10.9 42 17.6 63 14.6
By mother 17 85.0 37 88.1 54 87.1 By grandparent 2 10.0 3 7.1 5 8.1 By father/ husband 1 5.0 0 0 1 1.6 By older sibling 0 0 1 2.4 1 1.6 By aunt 0 0 1 2.4 1 1.6
Encourage child to eat 19 95.0 41 100 60 98.4
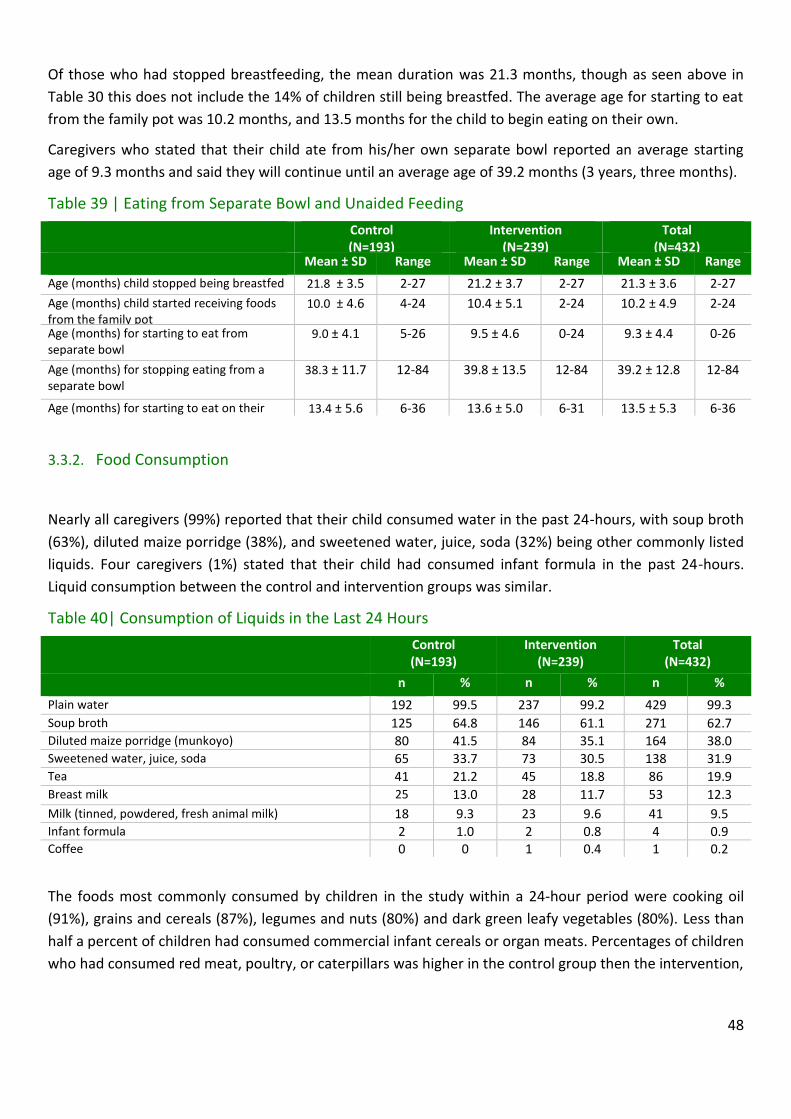
48
Of those who had stopped breastfeeding, the mean duration was 21.3 months, though as seen above in
Table 30 this does not include the 14% of children still being breastfed. The average age for starting to eat
from the family pot was 10.2 months, and 13.5 months for the child to begin eating on their own.
Caregivers who stated that their child ate from his/her own separate bowl reported an average starting
age of 9.3 months and said they will continue until an average age of 39.2 months (3 years, three months).
Table 39 | Eating from Separate Bowl and Unaided Feeding
Control (N=193)
Intervention (N=239)
Total (N=432)
Mean ± SD Range Mean ± SD Range Mean ± SD Range
Age (months) child stopped being breastfed 21.8 ± 3.5 2-27 21.2 ± 3.7 2-27 21.3 ± 3.6 2-27
Age (months) child started receiving foods from the family pot
10.0 ± 4.6 4-24 10.4 ± 5.1 2-24 10.2 ± 4.9 2-24
Age (months) for starting to eat from separate bowl
9.0 ± 4.1 5-26 9.5 ± 4.6 0-24 9.3 ± 4.4 0-26
Age (months) for stopping eating from a separate bowl
38.3 ± 11.7 12-84 39.8 ± 13.5 12-84 39.2 ± 12.8 12-84
Age (months) for starting to eat on their own
13.4 ± 5.6 6-36 13.6 ± 5.0 6-31 13.5 ± 5.3 6-36
3.3.2. Food Consumption
Nearly all caregivers (99%) reported that their child consumed water in the past 24-hours, with soup broth
(63%), diluted maize porridge (38%), and sweetened water, juice, soda (32%) being other commonly listed
liquids. Four caregivers (1%) stated that their child had consumed infant formula in the past 24-hours.
Liquid consumption between the control and intervention groups was similar.
Table 40| Consumption of Liquids in the Last 24 Hours
Control (N=193)
Intervention (N=239)
Total (N=432)
n
%
% n % n %
Plain water 192 99.5 237 99.2 429 99.3
Soup broth 125 64.8 146 61.1 271 62.7 Diluted maize porridge (munkoyo) 80 41.5 84 35.1 164 38.0 Sweetened water, juice, soda 65 33.7 73 30.5 138 31.9 Tea 41 21.2 45 18.8 86 19.9
Breast milk
25 13.0 28 11.7 53 12.3
Milk (tinned, powdered, fresh animal milk) 18 9.3 23 9.6 41 9.5 Infant formula 2 1.0 2 0.8 4 0.9 Coffee 0 0 1 0.4 1 0.2
The foods most commonly consumed by children in the study within a 24-hour period were cooking oil
(91%), grains and cereals (87%), legumes and nuts (80%) and dark green leafy vegetables (80%). Less than
half a percent of children had consumed commercial infant cereals or organ meats. Percentages of children
who had consumed red meat, poultry, or caterpillars was higher in the control group then the intervention,
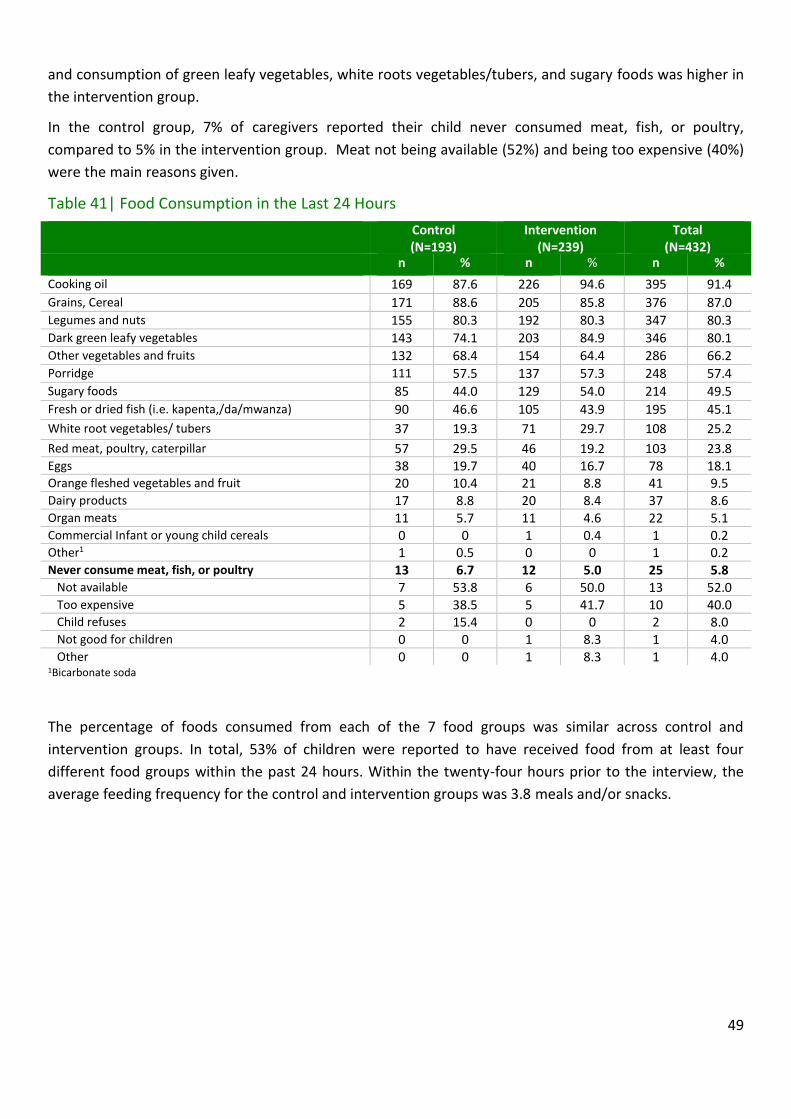
49
and consumption of green leafy vegetables, white roots vegetables/tubers, and sugary foods was higher in
the intervention group.
In the control group, 7% of caregivers reported their child never consumed meat, fish, or poultry,
compared to 5% in the intervention group. Meat not being available (52%) and being too expensive (40%)
were the main reasons given.
Table 41| Food Consumption in the Last 24 Hours
Control (N=193)
Intervention (N=239)
Total (N=432)
n % n
% n %
Cooking oil 169 87.6 226 94.6 395 91.4
Grains, Cereal 171 88.6 205 85.8 376 87.0 Legumes and nuts 155 80.3 192 80.3 347 80.3 Dark green leafy vegetables 143 74.1 203 84.9 346 80.1 Other vegetables and fruits 132 68.4 154 64.4 286 66.2 Porridge
111 57.5 137 57.3 248 57.4 Sugary foods 85 44.0 129 54.0 214 49.5
Fresh or dried fish (i.e. kapenta,/da/mwanza) 90 46.6 105 43.9 195 45.1
White root vegetables/ tubers 37 19.3 71 29.7 108 25.2
Red meat, poultry, caterpillar 57 29.5 46 19.2 103 23.8 Eggs 38 19.7 40 16.7 78 18.1 Orange fleshed vegetables and fruit 20 10.4 21 8.8 41 9.5 Dairy products 17 8.8 20 8.4 37 8.6 Organ meats 11 5.7 11 4.6 22 5.1 Commercial Infant or young child cereals 0 0 1 0.4 1 0.2 Other1 1 0.5 0 0 1 0.2 Never consume meat, fish, or poultry 13 6.7 12 5.0 25 5.8 Not available 7 53.8 6 50.0 13 52.0 Too expensive 5 38.5 5 41.7 10 40.0 Child refuses 2 15.4 0 0 2 8.0 Not good for children
0 0 1 8.3 1 4.0 Other 0 0 1 8.3 1 4.0 1Bicarbonate soda
The percentage of foods consumed from each of the 7 food groups was similar across control and
intervention groups. In total, 53% of children were reported to have received food from at least four
different food groups within the past 24 hours. Within the twenty-four hours prior to the interview, the
average feeding frequency for the control and intervention groups was 3.8 meals and/or snacks.

50
Table 42 | Dietary Diversity – 7 Food Groups Control
(N=193)
Intervention
(N=239)
Total
(N=432)
n % n % n %
Grains, roots and tubers 188 97.4 232 97.1 420 97.2
Other fruit and vegetables 170 88.1 226 94.6 396 91.7
Legumes and nuts 155 80.3 192 80.3 347 80.3
Flesh foods 124 64.2 141 59.0 265 61.3
Eggs 38 19.7 40 16.7 78 18.1
Vitamin A rich fruits & vegetables 20 10.5 21 8.8 41 9.5
Dairy products 17 8.8 20 8.4 37 8.6
Number of Food Groups Consumed by Child
Zero 0 0 1 0.4 1 0.2
One 4 2.1 2 0.8 6 1.4
Two 14 7.3 14 5.9 28 6.5
Three 69 35.8 100 41.8 169 39.1
Four 69 35.8 77 32.2 146 33.8
Five 27 14.0 37 15.5 64 14.8
Six 8 4.1 7 2.9 15 34.7
Seven 2 1.0 1 0.4 3 0.7
Four or more of the above 106 54.9 122 51.0 228 52.8

51
3.4. Module 5: Child Health and Health Seeking Behaviour
In the two weeks prior to the interview, 38% of caregivers reported their child having had a cough, 36%
having had a fever and 24% having had diarrhoea. The differences in the prevalence of these morbidities
were not statistically significant between the control and intervention groups, as determined from a chi-
square test.
Of those children suffering from diarrhoea, 24% were reported as having had blood in their stool (28%
control and 21% intervention), although as before, this difference was not statistically significant (p =
0.546). Of those who reported their child having a cough, nearly half of those in the in control group (49%)
said their child experienced short rapid breaths or difficulty breathing compared to only 27% of those in
the intervention group.
At the time of interview, 16% of children had been treated for malaria in the past two weeks (20% control,
13% intervention). Ninety-seven percent of caregivers reported that their child slept under a mosquito net,
90% had received a deworming tablet in the past six months, and 93% had received a vitamin A capsule in
the past six months. Differences in the frequency of vitamin A capsules (p = 1.000), bed nets (p = 0.359), or
deworming tablets (p = 0.179) between the control and intervention groups were not statistically
significant, as determined via a chi-square test or Fisher’s Exact Test.
14%
63%
12%
19%
30%
49%
23%
39%
22%
56%
18%
29%
0%
10%
20%
30%
40%
50%
60%
70%
80%
90%
100%
minimum dietarydiversity
minimum mealfrequency
minimumacceptable diet
consumption ofiron-rich foods
6-8 months 9-11 months Total

52
Table 43 | Child Morbidity 2 weeks prior to Endline Data Collection
Control (N=193)
Intervention (N=239)
Total (N=432)
n
%
% n
% n %
Malnutrition in the past 6 months
6 3.1 6 2.5 12 2.8
Referral to a hospital, health centre or other treatment programs
5 83.3 3 50 8 66.7
Currently being treated for malnutrition 4 66.7 2 33.3 6 50.0
Diarrhoea in the past 2 weeks 47 24.4 58 24.3 105 24.3 Blood present in the stools 13 27.7 12 20.7 25 23.8 More fluid given before diarrhoea 29 61.7 37 63.8 66 62.9 Less fluid given before diarrhoea 5 10.6
6 10.3 11 10.5
More food given before diarrhoea 8 17.0 16 27.6 24 22.9 Less food given before diarrhoea 27 57.4 30 51.7 57 54.3
Sought Treatment for diarrhoea 37 78.7 45 77.6 82 78.1
Fever in the past two weeks 78 40.4 78 32.6 156 36.1 Sought treatment for fever 58 74.4
54 69.2 112 71.8
Children with fever who were tested for malaria 51 65.4 47 60.3 98 62.9 Treated for malaria in the past two weeks 39 20.2 32 13.4 71 16.4 Cough in the past two weeks 81 42.0 83 34.7 164 38.0
Children with short, rapid breaths and/ or difficulty breathing
40 49.4 22 26.5 62 37.8
Sought treatment for cough 49 60.5 60 69.8 109 66.5
More than one of the symptoms above 57 29.5 58 24.3 115 26.6 None of the symptoms above 61 31.6 90 37.7 151 35.0 Vitamin A capsule within past 6 months 180 93.3 221 92.5 401 92.8 Deworming tablet within the past 6 months 178 92.2 209 87.4 387 89.6 Suffered from TB in the past 6 months 0 0 2 0.8 2 0.5 Sleeping under a mosquito net in the past 6 months 190 98.4 228 96.6 418 97.4
All but one caregiver reported that they seek medical advice or treatment from someone (within the
health sector, community, or family) when their child is sick with the most common source of advice being
health clinics (90%) followed by hospitals (18%). Twenty-five percent of caregivers in the intervention
group stated they seek advice from a hospital, whereas only 10% mentioned this option in the control
group.
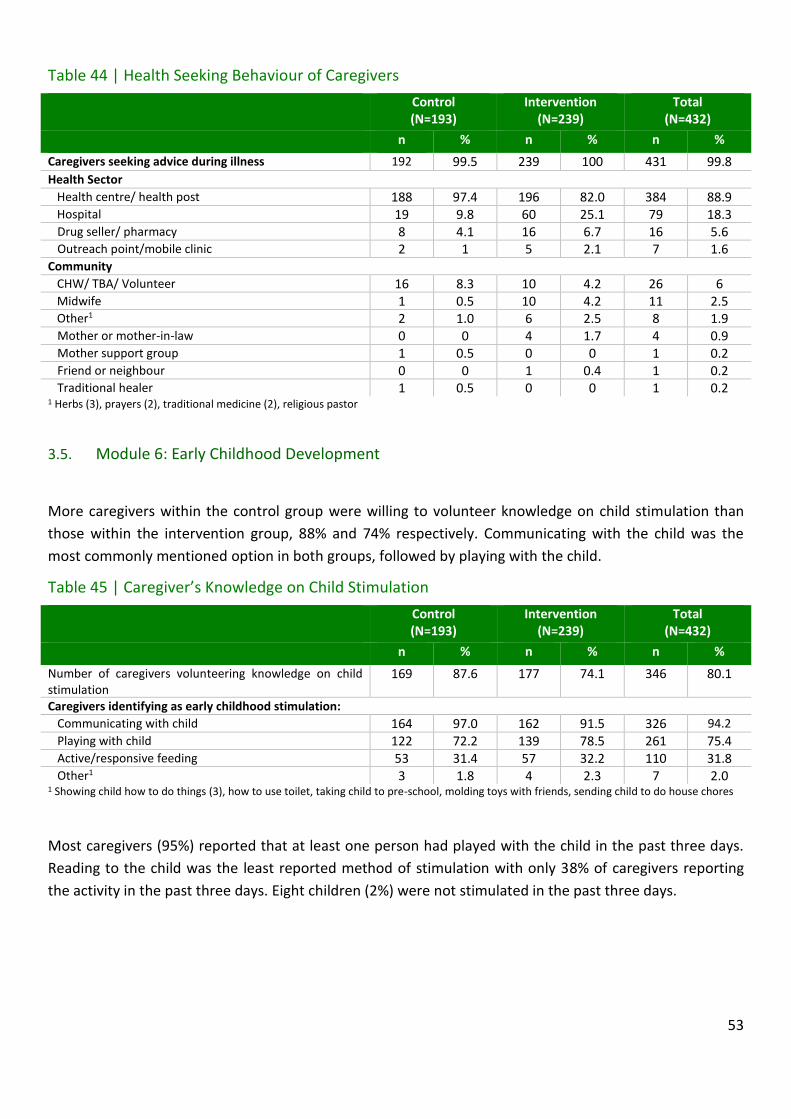
53
Table 44 | Health Seeking Behaviour of Caregivers
Control (N=193)
Intervention (N=239)
Total (N=432)
n
%
% n % n %
Caregivers seeking advice during illness
192 99.5 239 100 431 99.8
Health Sector Health centre/ health post 188 97.4 196 82.0 384 88.9 Hospital 19 9.8 60 25.1 79 18.3
Drug seller/ pharmacy 8 4.1 16 6.7 16 5.6 Outreach point/mobile clinic 2 1 5 2.1 7 1.6
Community CHW/ TBA/ Volunteer 16 8.3 10 4.2 26 6 Midwife 1 0.5 10 4.2 11 2.5 Other1 2 1.0 6 2.5 8 1.9
Mother or mother-in-law 0 0 4 1.7 4 0.9 Mother support group 1 0.5 0 0 1 0.2 Friend or neighbour 0 0 1 0.4 1 0.2 Traditional healer 1 0.5 0 0 1 0.2
1 Herbs (3), prayers (2), traditional medicine (2), religious pastor
3.5. Module 6: Early Childhood Development
More caregivers within the control group were willing to volunteer knowledge on child stimulation than
those within the intervention group, 88% and 74% respectively. Communicating with the child was the
most commonly mentioned option in both groups, followed by playing with the child.
Table 45 | Caregiver’s Knowledge on Child Stimulation
Control (N=193)
Intervention (N=239)
Total (N=432)
n
%
% n
% n %
Number of caregivers volunteering knowledge on child stimulation
169 87.6 177 74.1 346 80.1
Caregivers identifying as early childhood stimulation: Communicating with child 164 97.0 162 91.5 326 94.2 Playing with child 122 72.2 139 78.5 261 75.4 Active/responsive feeding 53 31.4 57 32.2 110 31.8 Other1 3 1.8 4 2.3 7 2.0
1 Showing child how to do things (3), how to use toilet, taking child to pre-school, molding toys with friends, sending child to do house chores
Most caregivers (95%) reported that at least one person had played with the child in the past three days.
Reading to the child was the least reported method of stimulation with only 38% of caregivers reporting
the activity in the past three days. Eight children (2%) were not stimulated in the past three days.
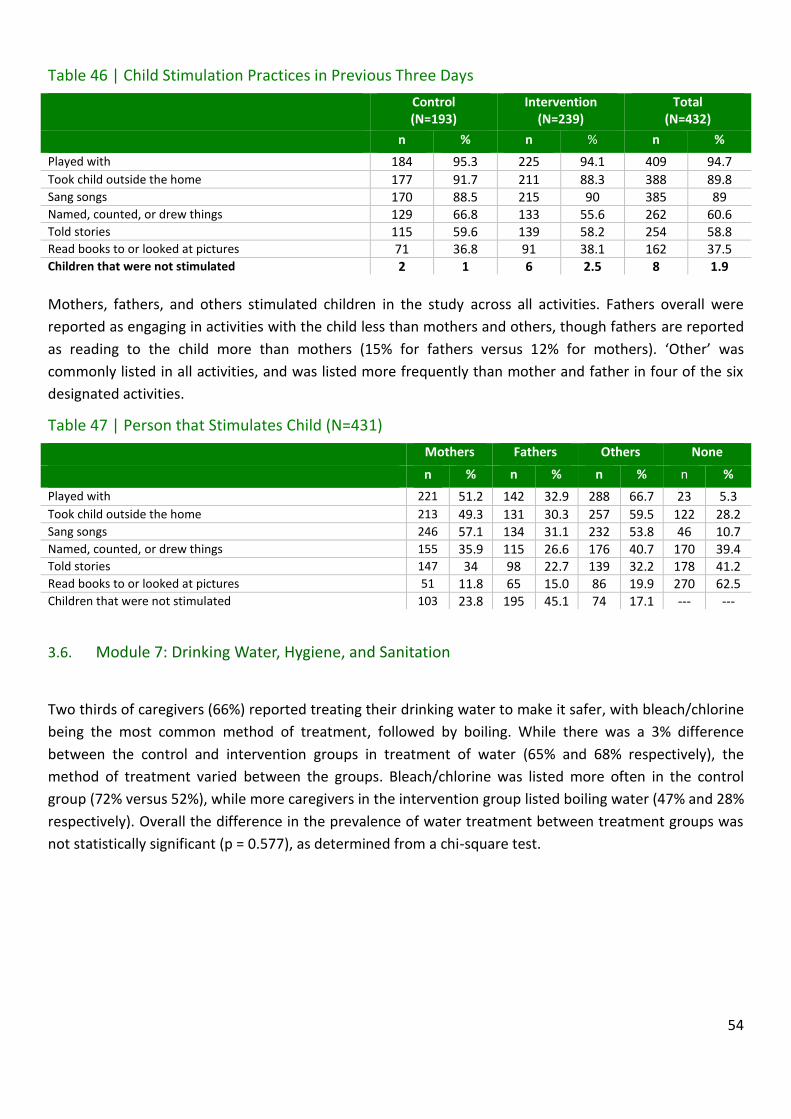
54
Table 46 | Child Stimulation Practices in Previous Three Days
Control (N=193)
Intervention (N=239)
Total (N=432)
n
%
%
n
% n %
Played with 184 95.3 225 94.1 409 94.7
Took child outside the home 177 91.7 211 88.3 388 89.8 Sang songs 170 88.5 215 90 385 89 Named, counted, or drew things 129 66.8 133 55.6 262 60.6 Told stories 115 59.6 139 58.2 254 58.8 Read books to or looked at pictures 71 36.8 91 38.1 162 37.5 Children that were not stimulated 2 1 6 2.5 8 1.9
Mothers, fathers, and others stimulated children in the study across all activities. Fathers overall were
reported as engaging in activities with the child less than mothers and others, though fathers are reported
as reading to the child more than mothers (15% for fathers versus 12% for mothers). ‘Other’ was
commonly listed in all activities, and was listed more frequently than mother and father in four of the six
designated activities.
Table 47 | Person that Stimulates Child (N=431)
Mothers Fathers Others None
n % n % n % n %
Played with 221 51.2 142 32.9 288 66.7 23 5.3 Took child outside the home 213 49.3 131 30.3 257 59.5 122 28.2 Sang songs 246 57.1 134 31.1 232 53.8 46 10.7 Named, counted, or drew things 155 35.9 115 26.6 176 40.7 170 39.4 Told stories 147 34 98 22.7 139 32.2 178 41.2 Read books to or looked at pictures 51 11.8 65 15.0 86 19.9 270 62.5 Children that were not stimulated 103 23.8 195 45.1 74 17.1 --- ---
3.6. Module 7: Drinking Water, Hygiene, and Sanitation
Two thirds of caregivers (66%) reported treating their drinking water to make it safer, with bleach/chlorine
being the most common method of treatment, followed by boiling. While there was a 3% difference
between the control and intervention groups in treatment of water (65% and 68% respectively), the
method of treatment varied between the groups. Bleach/chlorine was listed more often in the control
group (72% versus 52%), while more caregivers in the intervention group listed boiling water (47% and 28%
respectively). Overall the difference in the prevalence of water treatment between treatment groups was
not statistically significant (p = 0.577), as determined from a chi-square test.

55
Table 48 | Water Treatment Practices
Control (N=193)
Intervention (N=239)
Total (N=432)
n
%
% n
% n %
Treat water to make it safer 125 64.8 162 67.8 287 66.4
Add bleach/chlorine 90 72.0 84 51.9 174 60.3 Boil 35 28.0 76 46.9 111 38.7 Strain in through a cloth 0 0 1 0.6 1 0.3 Solar disinfection 0 0 1 0.6 1 0.3
Nearly all of the caregivers (98%) in both control and intervention group reported washing their hands with
soup or ash. Common reasons for hand washing include after defecating/using the toilet (88%), after field
work/cleaning (54%), and before preparing/handling food (51%). Caregivers in the control and intervention
groups differed in terms of when they wash their hands. The proportion of caregivers who wash their
hands before preparing/handling food is higher within the intervention group (64% versus 37% in control)
as well before feeding children (33% versus 17% in control).
Most caregivers (96%) also reported washing their children’s hands, with ‘after defecating’ being the most
commonly stated option (69%). It was more common for caregivers within the intervention group to wash
their children’s hands before eating (74%) than it was within in the control group (56%).

56
Table 49 | Hand Washing Practices for Caregivers and Children
Control (N=193)
Intervention (N=239)
Total (N=432)
n
%
% n
% n %
Washing hands with soap or ash 192 99.5 232 97.1 424 98.1
After defecating/using toilet facility 171 89.1 207 89.2 378 87.5 After field work/cleaning 108 56.3 121 52.2 229 54.0 Before preparing/handling food 70 36.5 148 63.8 218 51.4 While washing the rest of the body 114 59.4 93 40.1 207 48.8 Before eating 56 29.2 99 42.3 155 36.6 Before feeding children 33 17.2 76 32.8 109 25.7 After changing babies/cleaning child who has defecated 45 23.4 51 22.0 96 22.6 After eating 27 14.1 61 26.3 88 20.8 After preparing food 28 14.6 60 25.9 88 20.8 In the morning /upon waking up 22 11.5 10 4.3 32 7.5
After touching dirty things 5 2.6 7 3.0 12 2.8 Other1 5 2.6 4 1.7 9 2.1
Washing child’s hands with soap or ash 185 95.9 231 96.7 416 96.3 After they defecate/use toilet facility 133 71.9 153 66.2 286 68.8 Before they eat 104 56.2 170 73.6 274 65.9 While washing the rest of the body 126 68.1 123 53.2 249 59.9 After they eat 53 28.6 93 40.3 146 35.1 After playing 15 8.1 39 16.9 54 13.0 In the morning / Upon waking up 10 5.4 10 4.3 20 4.8 Whenever dirty 11 5.9 7 3.0 18 4.3 After being in dirt 6 3.2 9 3.9 15 3.6 Other2 2 1.1 4 1.7 6 1.4
1Before breastfeeding (2), before washing clothes (2), after some time passes (2), after sexual intercourse, upon returning home, before going to church 2Two to three times a day (2), when going to bed, upon returning home, upon returning from field, anytime
3.7. Module 8: Household Information
As designated by the parameters of the study, the children were in the age range of 22-29 to months
during endline data collection; the mean age was approximately 25 months for children in both the control
and intervention groups. The mean household size was 6.1 for control and 5.8 for intervention. In total,
92% of caregivers interviewed identified themselves as the mother of the child.
Table 50 | Household information
Control (N=193)
Intervention (N=239)
Mean ± SD Range Mean ± SD Range
Age of child (months) 25.1 ± 1.8 22-29 25.0 ± 1.7 27-29
Household size 6.1 ± 2.1 2-12 5.8 ± 2.2 1-11 No. of under 5 children/household 1.6 ± 0.7 1-4 1.6 ± 0.7 1-4
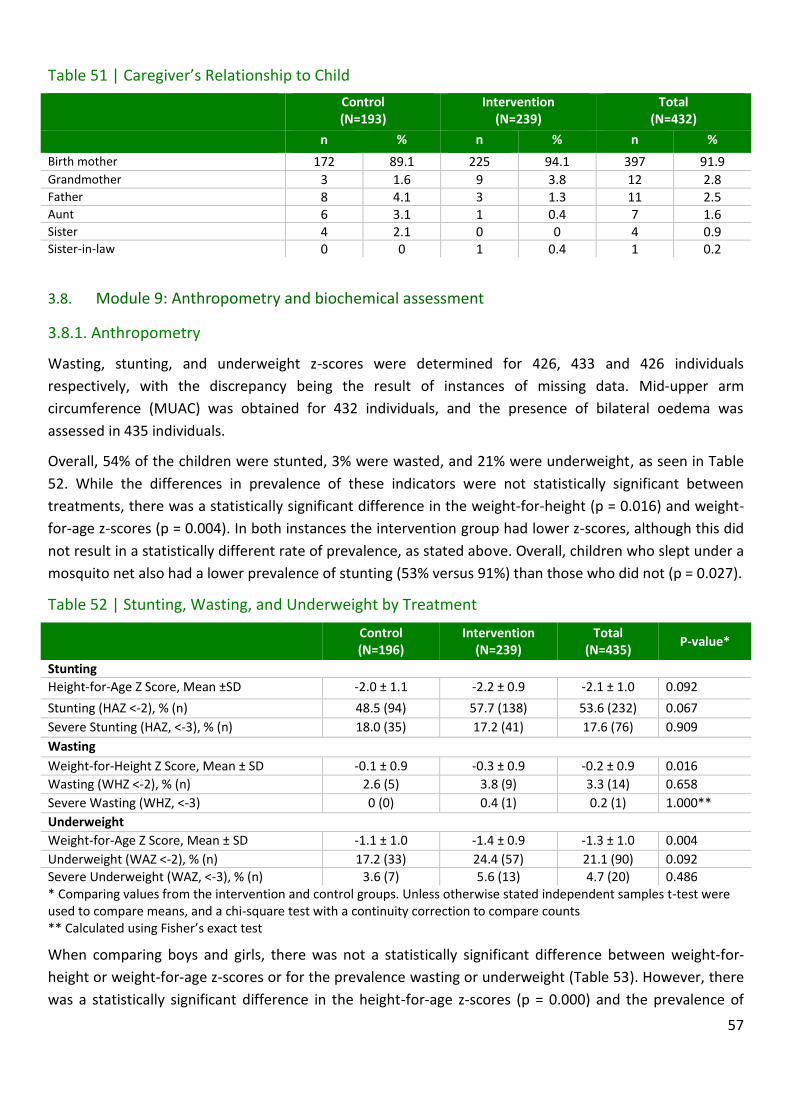
57
Table 51 | Caregiver’s Relationship to Child
Control (N=193)
Intervention (N=239)
Total (N=432)
n
%
% n
% n %
Birth mother 172 89.1 225 94.1 397 91.9
Grandmother 3 1.6 9 3.8 12 2.8 Father 8 4.1 3 1.3 11 2.5 Aunt 6 3.1 1 0.4 7 1.6 Sister 4 2.1 0 0 4 0.9 Sister-in-law 0 0 1 0.4 1 0.2
3.8. Module 9: Anthropometry and biochemical assessment
3.8.1. Anthropometry
Wasting, stunting, and underweight z-scores were determined for 426, 433 and 426 individuals
respectively, with the discrepancy being the result of instances of missing data. Mid-upper arm
circumference (MUAC) was obtained for 432 individuals, and the presence of bilateral oedema was
assessed in 435 individuals.
Overall, 54% of the children were stunted, 3% were wasted, and 21% were underweight, as seen in Table
52. While the differences in prevalence of these indicators were not statistically significant between
treatments, there was a statistically significant difference in the weight-for-height (p = 0.016) and weight-
for-age z-scores (p = 0.004). In both instances the intervention group had lower z-scores, although this did
not result in a statistically different rate of prevalence, as stated above. Overall, children who slept under a
mosquito net also had a lower prevalence of stunting (53% versus 91%) than those who did not (p = 0.027).
Table 52 | Stunting, Wasting, and Underweight by Treatment
Control (N=196)
Intervention (N=239)
Total (N=435)
P-value*
Stunting
Height-for-Age Z Score, Mean ±SD -2.0 ± 1.1 -2.2 ± 0.9 -2.1 ± 1.0 0.092
Stunting (HAZ <-2), % (n) 48.5 (94) 57.7 (138) 53.6 (232) 0.067
Severe Stunting (HAZ, <-3), % (n)
18.0 (35) 17.2 (41) 17.6 (76) 0.909
Wasting
Weight-for-Height Z Score, Mean ± SD -0.1 ± 0.9 -0.3 ± 0.9 -0.2 ± 0.9 0.016
Wasting (WHZ <-2), % (n) 2.6 (5) 3.8 (9) 3.3 (14) 0.658
Severe Wasting (WHZ, <-3) 0 (0) 0.4 (1) 0.2 (1) 1.000**
Underweight
Weight-for-Age Z Score, Mean ± SD -1.1 ± 1.0 -1.4 ± 0.9 -1.3 ± 1.0 0.004
Underweight (WAZ <-2), % (n) 17.2 (33) 24.4 (57) 21.1 (90) 0.092 Severe Underweight (WAZ, <-3), % (n) 3.6 (7) 5.6 (13) 4.7 (20) 0.486 * Comparing values from the intervention and control groups. Unless otherwise stated independent samples t-test were used to compare means, and a chi-square test with a continuity correction to compare counts ** Calculated using Fisher’s exact test
When comparing boys and girls, there was not a statistically significant difference between weight-for-
height or weight-for-age z-scores or for the prevalence wasting or underweight (Table 53). However, there
was a statistically significant difference in the height-for-age z-scores (p = 0.000) and the prevalence of
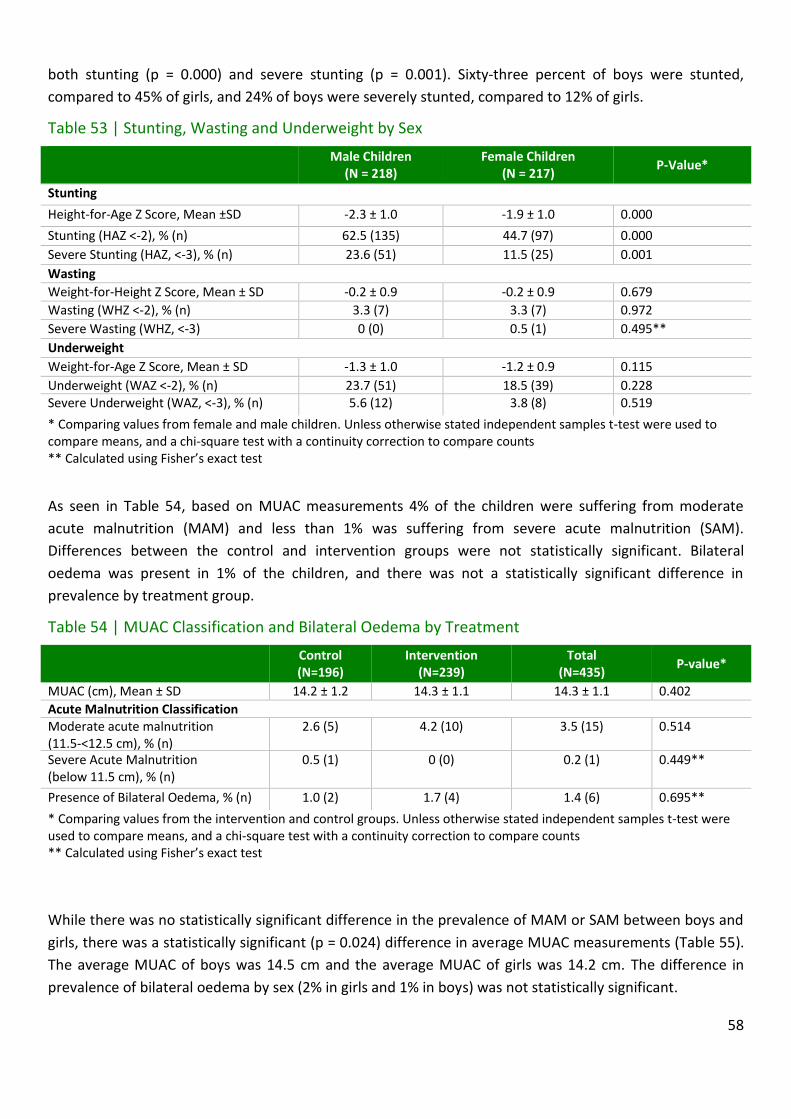
58
both stunting (p = 0.000) and severe stunting (p = 0.001). Sixty-three percent of boys were stunted,
compared to 45% of girls, and 24% of boys were severely stunted, compared to 12% of girls.
Table 53 | Stunting, Wasting and Underweight by Sex
Male Children (N = 218)
Female Children (N = 217)
P-Value*
Stunting
Height-for-Age Z Score, Mean ±SD -2.3 ± 1.0 -1.9 ± 1.0 0.000
Stunting (HAZ <-2), % (n) 62.5 (135) 44.7 (97) 0.000
Severe Stunting (HAZ, <-3), % (n)
23.6 (51) 11.5 (25) 0.001
Wasting
Weight-for-Height Z Score, Mean ± SD -0.2 ± 0.9 -0.2 ± 0.9 0.679
Wasting (WHZ <-2), % (n) 3.3 (7) 3.3 (7) 0.972
Severe Wasting (WHZ, <-3) 0 (0) 0.5 (1) 0.495**
Underweight
Weight-for-Age Z Score, Mean ± SD -1.3 ± 1.0 -1.2 ± 0.9 0.115
Underweight (WAZ <-2), % (n) 23.7 (51) 18.5 (39) 0.228 Severe Underweight (WAZ, <-3), % (n) 5.6 (12) 3.8 (8) 0.519
* Comparing values from female and male children. Unless otherwise stated independent samples t-test were used to compare means, and a chi-square test with a continuity correction to compare counts ** Calculated using Fisher’s exact test
As seen in Table 54, based on MUAC measurements 4% of the children were suffering from moderate
acute malnutrition (MAM) and less than 1% was suffering from severe acute malnutrition (SAM).
Differences between the control and intervention groups were not statistically significant. Bilateral
oedema was present in 1% of the children, and there was not a statistically significant difference in
prevalence by treatment group.
Table 54 | MUAC Classification and Bilateral Oedema by Treatment
Control (N=196)
Intervention (N=239)
Total (N=435)
P-value*
MUAC (cm), Mean ± SD 14.2 ± 1.2 14.3 ± 1.1 14.3 ± 1.1 0.402
Acute Malnutrition Classification Moderate acute malnutrition (11.5-<12.5 cm), % (n)
2.6 (5) 4.2 (10) 3.5 (15) 0.514
Severe Acute Malnutrition (below 11.5 cm), % (n)
0.5 (1) 0 (0) 0.2 (1) 0.449**
Presence of Bilateral Oedema, % (n) 1.0 (2) 1.7 (4) 1.4 (6) 0.695**
* Comparing values from the intervention and control groups. Unless otherwise stated independent samples t-test were used to compare means, and a chi-square test with a continuity correction to compare counts ** Calculated using Fisher’s exact test
While there was no statistically significant difference in the prevalence of MAM or SAM between boys and
girls, there was a statistically significant (p = 0.024) difference in average MUAC measurements (Table 55).
The average MUAC of boys was 14.5 cm and the average MUAC of girls was 14.2 cm. The difference in
prevalence of bilateral oedema by sex (2% in girls and 1% in boys) was not statistically significant.

59
Table 55 | MUAC Classification and Bilateral Oedema by Sex
Male Children (N = 218)
Female Children (N = 217)
P-Value*
MUAC (cm), Mean ± SD 14.5 ± 1.1 14.2 ± 1.1 0.024
Acute Malnutrition Classification
Moderate acute malnutrition (11.5-<12.5 cm), % (n)
3.2 (7) 3.7 (8) 1.000
Severe Acute Malnutrition (below 11.5 cm), % (n)
0 (0) 0.5 (1) 1.000**
Presence of Bilateral Oedema, % (n) 0.5 (1) 2.3 (5) 0.122**
* Comparing values from female and male children. Unless otherwise stated independent samples t-test were used to compare means, and a chi-square test with a continuity correction to compare counts ** Calculated using Fisher’s exact test
Table 56 presents the average changes in anthropometric z-scores, and MUAC measurements over the
course of the pilot, determined by subtracting the baseline value from the endline value. The average
change in Hb concentrations was +1.1 g/dL overall, +1.3 g/dL in the control group and +1.1 g/dL in the
intervention group, although this difference was not statistically significant (p = 0.131). Average height-for-
age z-scores, weight-for-height z-scores and weight-for-age z-scores changed by -0.6, -0.2, and -0.3,
respectively. Differences by treatment group were not statistically significant for these variables.
Table 56 | Change in Anthropometrics by Intervention Group
Control (N=196)
Intervention (N=233)
Total (N=435)
P-Value*
Hb (g/dL), Mean ±SD +1.3 ± 1.9 +1.0 ± 1.8 +1.1 ± 1.9 0.131
Height-for-Age Z Score, Mean ±SD
-0.6 ± 0.7
-0.6 ±0.8
-0.6 ± 0.7
0.194
Weight-for-Height Z Score, Mean ± SD
-0.1 ± 0.8 -0.2 ± 1.0 -0.2 ± 0.9
0.386**
Weight-for-Age Z Score, Mean ± SD -0.3 ± 0.6 -0.4 ± 0.8 -0.3 ± 0.7 0.176**
MUAC (cm), Mean ± SD +0.7 ± 0.9 +0.5 ± 1.1 +0.6 ± 1.0 0.052
* Comparing values from the intervention and control groups. Unless otherwise stated independent samples t-test were used to compare means ** Equality of variance not assumed when performing t-test
Furthermore, there was no statistically significant difference in average endline height-for-age z-scores,
endline weight-for-age z-scores, endline weight-for-height z-scores, or endline MUAC values between
those who were and were not consuming Chipolopolo at endline (Table 57).

60
Table 57| Comparison of Endline Anthropometrics between Those in the Intervention Group who were and were no Longer Receiving Chipolopolo
Consuming Chipolopolo
(N=188)
Not Consuming Chipolopolo
(N=50)
P-Value*
Endline Height-for-Age Z Score, Mean ±SD -2.2 ± 1.0 -2.2 ± 0.9 0.978
Endline Weight-for-Height Z Score, Mean ± SD -0.3 ± 0.9 -0.3 ± 0.8 0.903
Endline Weight-for-Age Z Score, Mean ± SD -1.4 ± 0.9 -1.4 ± 0.9 0.952
Endline MUAC (cm), Mean ± SD 14.8 ± 1.2 14.3 ± 1.0 0.918
* Comparing mean values between the groups using independent samples t-test
3.8.2. Biochemical assessment
Blood was obtained for the determination of Hb concentrations from 426 individuals, 233 in the
intervention group and 193 in the control group.
As seen in Table 58, the average concentration of Hb in children in the intervention group was 11.6 g/dL
compared to 11.7 g/dL in the control group, although this difference was not statistically significant (p =
0.306). The overall prevalence of anaemia is 22%; it was 21% in the control group, as opposed to 22% in
the intervention group (p = 0.816). Furthermore, the overall prevalence of mild, moderate and severe
anaemia was 13%, 7% and 1% respectively, with no significant difference in prevalence by treatment group.
Table 58 | Haemoglobin (Hb) Concentrations and Anaemia by Intervention Group
Control (N=193)
Intervention (N=233)
Total (N=426)
P-Value*
Hb (g/dL), Mean ±SD 11.7 ± 1.3 11.6 ± 1.4 11.6 ± 1.3 0.306
Change in concentration of Hb (g/dL) from baseline to endline, Mean ±SD
+1.3 ± 1.9 +1.0 ± 1.8 +1.1 ± 1.9 0.131
Anaemia Classification
Anaemic (Hb< 11 g/dl), % (n)
20.9 (41) 22.3 (52) 21.7 (93) 0.816
Mild Anaemia (Hb 10-10.9 g/dl), % (n)
13.8 (27) 12.4 (29) 13.1 (56) 0.792
Moderate Anaemia (Hb 7-9.9 g/dl), % (n)
5.6 (11) 8.6 (20) 7.2 (31) 0.319
Severe Anaemia (Hb< 7 g/dl), % (n)
1.5 (3) 1.3 (3) 1.4 (6) 1.000**
* Comparing values from the intervention and control groups. Unless otherwise stated independent samples t-test were used to compare means, and a chi-square test with a continuity correction to compare counts ** Calculated using Fisher’s exact test
As seen in Table 59, the average concentration of Hb in boys was 11.6 g/dL compared to 11.7 g/dL in girls,
although this difference was not statistically significant (p = 0.735). There was not a statistically significant
relationship between sex and the prevalence of anaemia (p = 0.795).

61
Table 59 | Haemoglobin (Hb) Concentrations and Anaemia by Sex
Male Children (N = 213)
Female Children (N = 213)
P-Value*
Hb (g/dL), Mean ± SD 11.6 ± 1.3 11.7 ± 1.3 0.735
Anaemia Classification
Anaemic (Hb < 11 g/dl), % (n) 20.9 (45) 22.4 (48) 0.795
Mild Anaemia (Hb 10-10.9 g/dl), % (n)
11.2 (24) 15.0 (32) 0.307
Moderate Anaemia (Hb 7-9.9 g/dl), % (n)
8.8 (19) 5.6 (12) 0.269
Severe Anaemia (Hb< 7 g/dl), % (n)
0.9 (2) 1.9 (4) 0.449**
* Comparing values from female and male children. Unless otherwise stated independent samples t-test were used to compare means, and a chi-square test with a continuity correction to compare counts ** Calculated using Fisher’s exact test
Table 60 presents the average endline Hb concentrations, and mean changes in Hb concentrations for the
different amounts of boxes of Chipolopolo received, as reported by caregivers. While the endline Hb
concentrations and mean changes in concentration seem to increase with an increasing number of boxes,
up to 5, the differences are not actually significant as tested by Kruskal-Wallis H Test.
Table 60 | Endline Haemoglobin (Hb) Concentrations and Changes in Hb Concentrations of Children in the Intervention Group by Number of Boxes of Chipolopolo Received (Caregiver Reported)
Number of Boxes N Mean Hb Concentration (g/d\L) ± SD Mean Change in Hb Concentration from
Baseline to Endline (g/dL) ± SD
1 4 9.2 ± 2.1 -0.7 ± 2.1
2 20 11.3 ± 1.8 0.5 ± 2.4
3 44 11.6 ± 1.3 1.0 ± 1.9
4 60 11.7 ± 1.4 1.1 ± 1.8
5 67 11.7 ± 1.2 1.2 ± 1.7
6 33 11.6 ± 1.5 0.8 ± 1.3
7 2 11.2 ± 1.5 -0.1 ± 1.1
Table 61 presents the average endline Hb concentrations, and mean changes in Hb concentrations for the
different amounts of boxes of Chipolopolo received, although not necessarily consumed, as reported on
caregivers’ distribution cards. While the child of the individual who reportedly only received one box had a
lower endline Hb concentration, none of these differences, or the differences in the mean changes in
concentrations, were statistically significant when tested with the Kruskal-Wallis H Test.
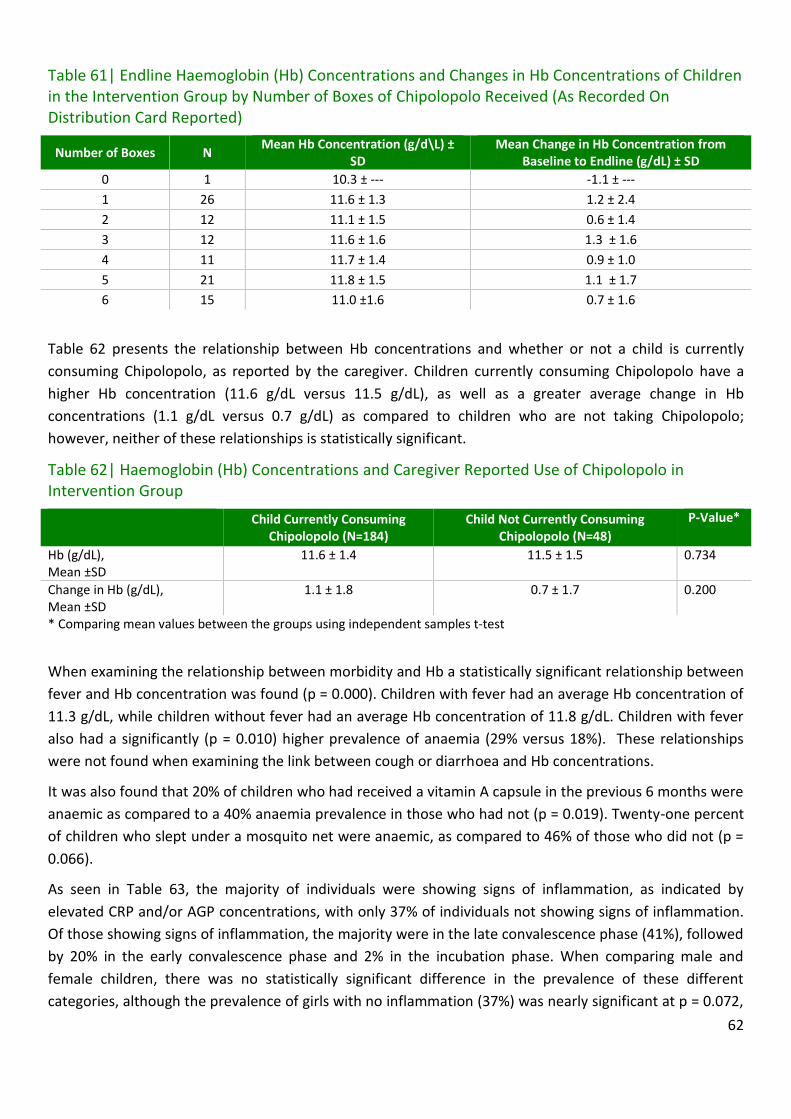
62
Table 61| Endline Haemoglobin (Hb) Concentrations and Changes in Hb Concentrations of Children in the Intervention Group by Number of Boxes of Chipolopolo Received (As Recorded On Distribution Card Reported)
Number of Boxes N Mean Hb Concentration (g/d\L) ±
SD Mean Change in Hb Concentration from
Baseline to Endline (g/dL) ± SD
0 1 10.3 ± --- -1.1 ± ---
1 26 11.6 ± 1.3 1.2 ± 2.4
2 12 11.1 ± 1.5 0.6 ± 1.4
3 12 11.6 ± 1.6 1.3 ± 1.6
4 11 11.7 ± 1.4 0.9 ± 1.0
5 21 11.8 ± 1.5 1.1 ± 1.7
6 15 11.0 ±1.6 0.7 ± 1.6
Table 62 presents the relationship between Hb concentrations and whether or not a child is currently
consuming Chipolopolo, as reported by the caregiver. Children currently consuming Chipolopolo have a
higher Hb concentration (11.6 g/dL versus 11.5 g/dL), as well as a greater average change in Hb
concentrations (1.1 g/dL versus 0.7 g/dL) as compared to children who are not taking Chipolopolo;
however, neither of these relationships is statistically significant.
Table 62| Haemoglobin (Hb) Concentrations and Caregiver Reported Use of Chipolopolo in Intervention Group
Child Currently Consuming Chipolopolo (N=184)
Child Not Currently Consuming Chipolopolo (N=48)
P-Value*
Hb (g/dL), Mean ±SD
11.6 ± 1.4 11.5 ± 1.5 0.734
Change in Hb (g/dL), Mean ±SD
1.1 ± 1.8 0.7 ± 1.7 0.200
* Comparing mean values between the groups using independent samples t-test
When examining the relationship between morbidity and Hb a statistically significant relationship between
fever and Hb concentration was found (p = 0.000). Children with fever had an average Hb concentration of
11.3 g/dL, while children without fever had an average Hb concentration of 11.8 g/dL. Children with fever
also had a significantly (p = 0.010) higher prevalence of anaemia (29% versus 18%). These relationships
were not found when examining the link between cough or diarrhoea and Hb concentrations.
It was also found that 20% of children who had received a vitamin A capsule in the previous 6 months were
anaemic as compared to a 40% anaemia prevalence in those who had not (p = 0.019). Twenty-one percent
of children who slept under a mosquito net were anaemic, as compared to 46% of those who did not (p =
0.066).
As seen in Table 63, the majority of individuals were showing signs of inflammation, as indicated by
elevated CRP and/or AGP concentrations, with only 37% of individuals not showing signs of inflammation.
Of those showing signs of inflammation, the majority were in the late convalescence phase (41%), followed
by 20% in the early convalescence phase and 2% in the incubation phase. When comparing male and
female children, there was no statistically significant difference in the prevalence of these different
categories, although the prevalence of girls with no inflammation (37%) was nearly significant at p = 0.072,

63
as compared to a prevalence of 32% among boys. This represented a drop in overall inflammation as
compared to baseline, when 74% of children showed signs of inflammation.
Table 63| The Inflammation Markers C-Reactive Protein (CRP) and Alpha-1-acid glycoprotein (AGP) by Sex
Male
Children
(N=194)
Female
Children
(N=199)
Total
(N=393)
P-value*
n % n % n % No inflammation
(CRP < 5 mg/L and AGP < 1 g/L)
62 32.0 82 41.2 144 36.6 0.072
Elevated CRP only (Incubation phase) (CRP > 5 mg/L and AGP < 1 g/L)
4 2.1 5 2.5 9 2.3 1.000**
Both CRP and AGP elevated (Early convalescence phase) ( CRP > 5 mg/L and AGP > 1 g/L)
42 21.6 37 18.6 79 20.1 0.529
Elevated AGP only (Late convalescence phase) (CRP < 5 mg/L and AGP > 1 g/L)
86 44.3 75 37.7 161 41.0 0.216
* Comparing male and female children using a Pearson Chi-square test with continuity correction ** Determined using a Fisher’s Exact Test
As seen in Table 64, there was no statistically significant difference in the prevalence of different
inflammation categories, as determined by CRP and AGP concentrations, when comparing individuals in
the intervention and control groups.
Table 64| The Inflammation Markers C-Reactive Protein (CRP) and Alpha-1-acid glycoprotein (AGP) by Treatment Group
Control
(N=179)
Intervention
(N=214)
Total
(N=393)
P-value*
n % n % n % No inflammation
(CRP < 5 mg/L and AGP < 1 g/L)
59 33.0 85 39.7 144 36.6 0.201
Elevated CRP only (Incubation phase) (CRP > 5 mg/L and AGP < 1 g/L)
6 3.4 3 1.4 9 2.3 0.311**
Both CRP and AGP elevated (Early convalescence phase) ( CRP > 5 mg/L and AGP > 1 g/L)
40 22.3 39 18.2 79 20.1 0.374
Elevated AGP only (Late convalescence phase) (CRP < 5 mg/L and AGP > 1 g/L)
74 41.3 87 40.7 161 41.0 0.972
* Comparing treatment groups using a Pearson Chi-square Test with continuity correction ** Determined using a Fisher’s Exact Test
The prevalence of iron deficiency was highly dependent on the biochemical indicator and cut-offs used to
assess it, ranging from 4% when using serum ferritin and excluding those who were experiencing
inflammation, to 57% when using serum transferrin receptor (Table 65). When using a serum ferritin cut-
off of 30 µg/L the prevalence was 24% and when using inflammation adjusted serum ferritin cut-offs the
prevalence of iron deficiency was 5%. There was no statistically significant difference in the prevalence of
iron deficiency among boys and girls, regardless of the definition used.
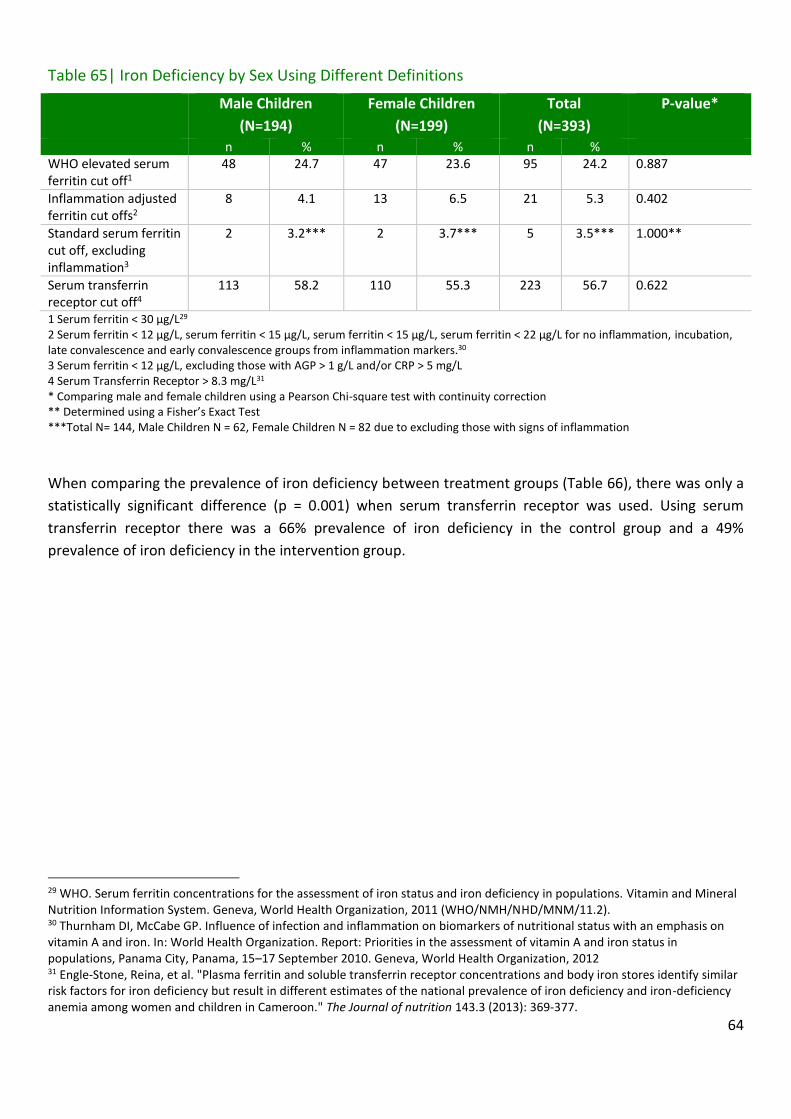
64
Table 65| Iron Deficiency by Sex Using Different Definitions
Male Children
(N=194)
Female Children
(N=199)
Total
(N=393)
P-value*
n % n % n % WHO elevated serum ferritin cut off1
48 24.7 47 23.6 95 24.2 0.887
Inflammation adjusted ferritin cut offs2
8 4.1 13 6.5 21 5.3 0.402
Standard serum ferritin cut off, excluding inflammation3
2 3.2*** 2 3.7*** 5 3.5*** 1.000**
Serum transferrin receptor cut off4
113 58.2 110 55.3 223 56.7 0.622
1 Serum ferritin < 30 µg/L29 2 Serum ferritin < 12 µg/L, serum ferritin < 15 µg/L, serum ferritin < 15 µg/L, serum ferritin < 22 µg/L for no inflammation, incubation, late convalescence and early convalescence groups from inflammation markers.30 3 Serum ferritin < 12 µg/L, excluding those with AGP > 1 g/L and/or CRP > 5 mg/L 4 Serum Transferrin Receptor > 8.3 mg/L31 * Comparing male and female children using a Pearson Chi-square test with continuity correction ** Determined using a Fisher’s Exact Test ***Total N= 144, Male Children N = 62, Female Children N = 82 due to excluding those with signs of inflammation
When comparing the prevalence of iron deficiency between treatment groups (Table 66), there was only a
statistically significant difference (p = 0.001) when serum transferrin receptor was used. Using serum
transferrin receptor there was a 66% prevalence of iron deficiency in the control group and a 49%
prevalence of iron deficiency in the intervention group.
29 WHO. Serum ferritin concentrations for the assessment of iron status and iron deficiency in populations. Vitamin and Mineral Nutrition Information System. Geneva, World Health Organization, 2011 (WHO/NMH/NHD/MNM/11.2). 30 Thurnham DI, McCabe GP. Influence of infection and inflammation on biomarkers of nutritional status with an emphasis on vitamin A and iron. In: World Health Organization. Report: Priorities in the assessment of vitamin A and iron status in populations, Panama City, Panama, 15–17 September 2010. Geneva, World Health Organization, 2012 31 Engle-Stone, Reina, et al. "Plasma ferritin and soluble transferrin receptor concentrations and body iron stores identify similar risk factors for iron deficiency but result in different estimates of the national prevalence of iron deficiency and iron-deficiency anemia among women and children in Cameroon." The Journal of nutrition 143.3 (2013): 369-377.

65
Table 66| Iron Deficiency by Treatment Group Using Different Definitions
Control
(N=179)
Intervention
(N=214)
Total
(N=393)
P-value*
n % n % n % WHO elevated serum ferritin cut off1
42 23.5 53 24.8 95 24.2 0.856
Inflammation adjusted ferritin cut offs2
11 6.1 10 4.7 21 5.3 0.674
Standard serum ferritin cut off, excluding inflammation3
3 5.1*** 2 2.4*** 5 3.5*** 0.400**
Serum transferrin receptor cut off4
118 65.9 105 49.1 223 56.7 0.001****
1 Serum ferritin < 30 µg/L32 2 Serum ferritin < 12 µg/L, serum ferritin < 15 µg/L, serum ferritin < 15 µg/L, serum ferritin < 22 µg/L for no inflammation, incubation, late convalescence and early convalescence groups from inflammation markers.33 3 Serum ferritin < 12 µg/L, excluding those with AGP > 1 g/L and/or CRP > 5 mg/L 4 Serum Transferrin Receptor > 8.3 mg/L34 * Comparing treatments using a Pearson Chi-square test with continuity correction ** Determined using a Fisher’s Exact Test ***Total N= 144, Control N = 59, Intervention N = 85 due to excluding those with signs of inflammation **** Significant at p < 0.05
As with iron deficiency, the prevalence of iron deficiency anaemia was dependent on what biochemical
indicator and cut-off was used (Table 67). The highest prevalence of IDA, 15%, was found when using
serum transferrin receptor to define iron deficiency and the lowest prevalence of IDA, 1%, when found
when using inflammation adjust serum ferritin cut-offs. There was no statistically significant difference in
the prevalence of IDA, regardless of the underlying definition of iron deficiency, when comparing boys and
girls.
32 WHO. Serum ferritin concentrations for the assessment of iron status and iron deficiency in populations. Vitamin and Mineral Nutrition Information System. Geneva, World Health Organization, 2011 (WHO/NMH/NHD/MNM/11.2). 33 Thurnham DI, McCabe GP. Influence of infection and inflammation on biomarkers of nutritional status with an emphasis on vitamin A and iron. In: World Health Organization. Report: Priorities in the assessment of vitamin A and iron status in populations, Panama City, Panama, 15–17 September 2010. Geneva, World Health Organization, 2012 34 Engle-Stone, Reina, et al. "Plasma ferritin and soluble transferrin receptor concentrations and body iron stores identify similar risk factors for iron deficiency but result in different estimates of the national prevalence of iron deficiency and iron-deficiency anemia among women and children in Cameroon." The Journal of nutrition 143.3 (2013): 369-377.
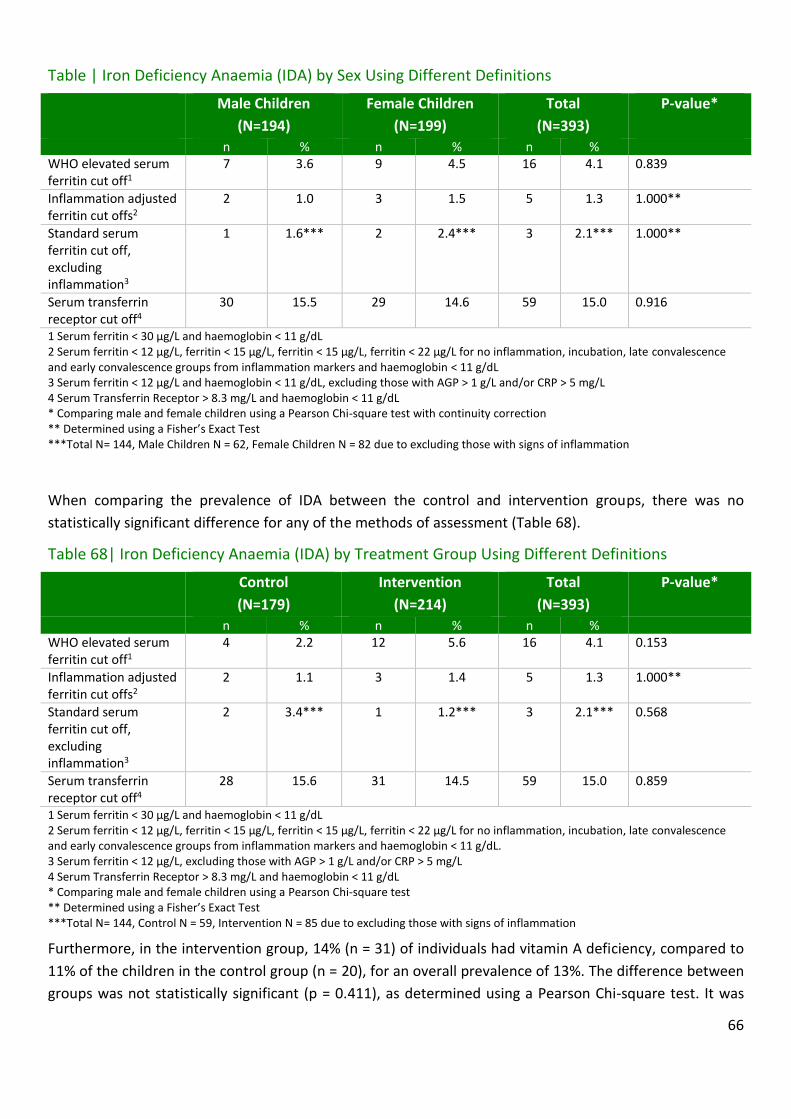
66
Table | Iron Deficiency Anaemia (IDA) by Sex Using Different Definitions
Male Children
(N=194)
Female Children
(N=199)
Total
(N=393)
P-value*
n % n % n % WHO elevated serum ferritin cut off1
7 3.6 9 4.5 16 4.1 0.839
Inflammation adjusted ferritin cut offs2
2 1.0 3 1.5 5 1.3 1.000**
Standard serum ferritin cut off, excluding inflammation3
1 1.6*** 2 2.4*** 3 2.1*** 1.000**
Serum transferrin receptor cut off4
30 15.5 29 14.6 59 15.0 0.916
1 Serum ferritin < 30 µg/L and haemoglobin < 11 g/dL 2 Serum ferritin < 12 µg/L, ferritin < 15 µg/L, ferritin < 15 µg/L, ferritin < 22 µg/L for no inflammation, incubation, late convalescence and early convalescence groups from inflammation markers and haemoglobin < 11 g/dL 3 Serum ferritin < 12 µg/L and haemoglobin < 11 g/dL, excluding those with AGP > 1 g/L and/or CRP > 5 mg/L 4 Serum Transferrin Receptor > 8.3 mg/L and haemoglobin < 11 g/dL * Comparing male and female children using a Pearson Chi-square test with continuity correction ** Determined using a Fisher’s Exact Test ***Total N= 144, Male Children N = 62, Female Children N = 82 due to excluding those with signs of inflammation
When comparing the prevalence of IDA between the control and intervention groups, there was no
statistically significant difference for any of the methods of assessment (Table 68).
Table 68| Iron Deficiency Anaemia (IDA) by Treatment Group Using Different Definitions
Control
(N=179)
Intervention
(N=214)
Total
(N=393)
P-value*
n % n % n % WHO elevated serum ferritin cut off1
4 2.2 12 5.6 16 4.1 0.153
Inflammation adjusted ferritin cut offs2
2 1.1 3 1.4 5 1.3 1.000**
Standard serum ferritin cut off, excluding inflammation3
2 3.4*** 1 1.2*** 3 2.1*** 0.568
Serum transferrin receptor cut off4
28 15.6 31 14.5 59 15.0 0.859
1 Serum ferritin < 30 µg/L and haemoglobin < 11 g/dL 2 Serum ferritin < 12 µg/L, ferritin < 15 µg/L, ferritin < 15 µg/L, ferritin < 22 µg/L for no inflammation, incubation, late convalescence and early convalescence groups from inflammation markers and haemoglobin < 11 g/dL. 3 Serum ferritin < 12 µg/L, excluding those with AGP > 1 g/L and/or CRP > 5 mg/L 4 Serum Transferrin Receptor > 8.3 mg/L and haemoglobin < 11 g/dL * Comparing male and female children using a Pearson Chi-square test ** Determined using a Fisher’s Exact Test ***Total N= 144, Control N = 59, Intervention N = 85 due to excluding those with signs of inflammation
Furthermore, in the intervention group, 14% (n = 31) of individuals had vitamin A deficiency, compared to
11% of the children in the control group (n = 20), for an overall prevalence of 13%. The difference between
groups was not statistically significant (p = 0.411), as determined using a Pearson Chi-square test. It was

67
also found that 22% of individuals who did not take a vitamin A capsule in the previous 6 months had
vitamin A deficiency, compared to 12% of those who did, although the difference was not statistically
significant (p = 0.138). However, as concentrations of RBP are effected by inflammation status the
prevalence of VAD was also calculated using correction factors, as described in the methods section. When
this was done the prevalence of VAD dropped to 8% overall, 10% in the control and 6% in the intervention,
although the difference was not statistically significant (p = 0.249).
Table 69 present correlations between selected biochemical indicators. There was a statistically significant
(p < 0.01) negative relationship between endline Hb concentrations and concentrations of serum ferritin,
concentrations of inflammation adjusted serum ferritin, concentrations of serum transferrin receptor, and
concentrations of CRP. In other words, at higher concentrations of Hb, there were lower concentrations of
these chemicals. Serum ferritin was positively correlated with CRP, and serum transferrin receptor. After
adjusting for inflammation the concentration of serum ferritin was still negatively correlated with the
endline Hb, and positively correlated with concentrations of CRP. Serum transferrin receptor was not
correlated with concentrations of CRP.
Table 69| Pearson’s Correlations between Selected Biochemical Indicators
Indicator Endline Hb
Baseline Hb
Serum Ferritin
Adjusted serum ferritin1
Serum transferrin receptor
C-reactive Protein
Endline Hb 1 0.169* -0.270* -0.163* -0.320* -0.317*
Baseline Hb 0.169* 1 0.046 0.082 -0.209* -0.036
Serum ferritin 0.270* 0.046 1 0.928* 0.162* 0.630*
Adjusted serum ferritin
-0.163* 0.082 0.928* 1 0.073 0.423*
Serum transferrin receptor
-0.320* -0.209* 0.162* 0.073 1 0.071
C-reactive protein 0.317* -0.036 0.630* 0.423* 0.071 1
1 Using the correction factors from: Thurnham DI, McCabe GP. Influence of infection and inflammation on biomarkers of nutritional status with an emphasis on vitamin A and iron. In: World Health Organization. Report: Priorities in the assessment of vitamin A and iron status in populations, Panama City, Panama, 15–17 September 2010. Geneva, World Health Organization, 2012 *Significant at p < 0.01 (two-sided)
The linear model presented in Table 70, R2 = 0.10, F(3, 389) = 15.092, p < .001, indicates that after
controlling for the effect of elevated concentrations of CRP and AGP, there is a statistically significant (p =
0.001), negative (ẞ = -0.005) relationship between endline concentrations of serum ferritin and Hb.

68
Table 70| Linear regression of Endline Haemoglobin (Hb) Concentrations (g/dL), using Serum Ferritin Concentrations (µg/L), and Inflammation Status from C-Reactive Protein (CRP) and Alpha-1-acic glycoprotein (AGP)
Unstandardized β Standardized β t Significance Tolerance
(Constant) 12.170 --- 104.825 0.000 ---
Serum ferritin -0.005 -0.184 -3.351 0.001 0.809
Elevated AGP1 -0.124 -0.046 -0.905 0.366 0.878
Elevated CRP2 -0.554 -0.178 -3.275 0.001 0.783
1 Defined as AGP > 1 g/L 2 Defined as CRP > 5 mg/L
The linear model presented in Table 71, R2 = 0.09, F(3, 389) = 13.076, p < .001, indicates that after
controlling for the effect of elevated concentrations of CRP and AGP, there remains a statistically
significant (p = 0.012), negative (ẞ = -0.006) relationship between inflammation adjusted concentrations of
serum ferritin and Hb concentrations.
Table 71| Linear regression of Endline Haemoglobin (Hb) Concentrations (g/dL), using Inflammation Adjusted Serum Ferritin Concentrations (µg/L), and Inflammation Status from C-Reactive Protein (CRP) and Alpha-1-acic glycoprotein (AGP)
Unstandardized β Standardized β T Significance Tolerance
(Constant) 12.203 --- 88.648 0.000 ---
Adjusted Serum ferritin1
-0.006 -0.123 -2.515 0.012 0.972
Elevated AGP2 -0.205 -0.077 -1.507 0.133 0.900
Elevated CRP3 -0.697 -0.223 -4.326 0.000 0.875
1 Using the correction factors from: Thurnham DI, McCabe GP. Influence of infection and inflammation on biomarkers of nutritional status with an emphasis on vitamin A and iron. In: World Health Organization. Report: Priorities in the assessment of vitamin A and iron status in populations, Panama City, Panama, 15–17 September 2010. Geneva, World Health Organization, 2012 2 Defined as AGP > 1 g/L 3 Defined as CRP > 5 mg/L
The linear model presented in Table 7, R2 = 0.06, F(6, 413) = 4.578, p < .001, shows the relationship
between treatment group and endline Hb concentrations, while controlling for several other factors that
could affect Hb, as well as the baseline Hb concentrations. There is a statistically significant (p = 0.001),
positive (ẞ = 0.134) relationship between baseline and endline Hb concentrations, as well as a statistically
significant (p = 0.025), positive (ẞ = 0.575) relationship having received a vitamin A capsule and endline Hb
concentrations. While the coefficient on the treatment group is negative (ẞ = -0.137), it is not statistically
significant (p = 0.286).

69
Table 72| Linear regression of Endline Haemoglobin (Hb) Concentrations (g/dL), using Baseline Hb Concentrations (g/dL), Vitamin A Capsule Status, IYCF Counselling Status, Water Treatment Status, Mosquito Net Use and Treatment Group
Unstandardized β Standardized β t Significance Tolerance
(Constant) 8.996 --- 14.625 0.000 ---
Baseline Hb concentration 0.134 0.156 3.250 0.001 0.982
Received Vitamin A capsule in previous 6 months
0.575 0.111 2.257 0.025 0.938
Caregiver has been counselled on IYCF
0.305 0.059 1.207 0.228 0.954
Household treats water -0.200 -0.071 -1.482 0.139 0.994
Child slept under mosquito net 0.640 0.077 1.572 0.117 0.956
Household is in Intervention group
-0.137 -0.051 -1.069 0.286 0.990
Overall, the rate of malaria parasitism in the population was 12%, representing 51 cases of the 420
individuals for which tests were available. The prevalence was 15% in the control and 10% in the
intervention group, although this was not statistically significant (p = 0.111). Likewise, the relationship
between sex and malaria was not significant (p = 0.126), with 15% of males, and 10% of girls testing
positive for parasites. Furthermore, whether or not a child was using a bed-net was not related to malaria
parasitism (p = 0.633). Of the 51 cases of malaria, 46 (90%) were of Plasmodium falciparum, 4 (8%) were
of Plasmodium malaria, and 1 (2%) were of an unspecified species. Due to the low numbers of cases,
further analysis was not performed for specific species.
Finally, there was evidence that different CA were experiencing different levels of malaria parasitism: with
prevalences of 27% in Kaka, 21% in Nondo, 19% in Tulemane, 11% in Senga, 9% in Mpande, 8% in
Kawimbe, 7% in Mambwe Mission, 6% in Mbala Urban, and 2% in Kamuzwazi.
Table 73 presents the relationship between malaria parasitism and several indicators. Those with malaria
had lower Hb concentrations and stunting z-scores, but higher serum ferritin, serum transferrin receptor,
and C-reactive protein concentrations, all significant at p < 0.05 or lower.

70
Table 73| Malaria Parasitism and Selected Indicators at Endline
Indicator Haemoglobin (g/dL)
Serum Ferritin (µg/L)
Serum Transferrin Receptor (mg/L)
C-reactive Protein (mg/L)
Stunting z-score
Positive for malaria parasites
10.3 68.7 11.8 15.5 -2.5
Negative for malaria parasites
11.8 41.9 10.0 4.5 -2.0
P –value* 0.000** 0.000** 0.010 0.001** 0.004
* Determined using an independent samples t-test ** Equal variances not assumed

71
4. Discussion
Overall, the results of the endline data collection and analysis suggest several areas for improvement,
which would benefit a future scale-up. These areas focus on improved community sensitisation, improved
training on how to properly use Chipolopolo and improved monitoring. Both the control and intervention
groups saw significant improvement in their Hb concentrations and iron status as determined by
concentrations of serum transferrin receptor, and while there was an overall high level of acceptability
towards Chipolopolo, there was not a statistically significant difference between those who were in either
group when examining either endline Hb concentrations, or their change over time. Furthermore, both
groups saw an increase in the rates of stunting, although this is not surprising given the high rates found at
baseline. Notably, when assessed using serum transferrin receptor (STfR), there was a lower prevalence of
iron deficiency in the intervention group as compared to the control group.
A number of positive trends were observed: there were marked reductions in a number of indicators of
morbidity, such as fever, cough, and diarrhoea and there was an increase in the percentage of children
receiving vitamin A capsules and sleeping under mosquito nets. Potentially related to the drop in morbidity
there was also a notable increase in the percentage of households that were treating their water, and
there was an overall improvement in hand washing practices among the caregivers. The improvements in
morbidity are also seen in the results of biochemical assessment, with fewer children showing signs of
inflammation as compared to baseline. Likewise, for all four methods of assessment looked at, there was a
decrease in iron deficiency over the course of the programme, although there was an increase in vitamin A
deficiency.
There was also an improvement in IYCF knowledge with more caregivers able to correctly identify causes
and symptoms of anaemia, examples of iron-rich food, and proper feeding practices than at baseline. This
is likely a result of the increase in IYCF counselling reported by the caregivers, which is also reflected in
actual feeding practices recorded at endline. While it is difficult to make comparisons, given that the age
groups at baseline and endline are different, there is evidence that the diet has improved, particularly in
regards to iron-rich foods.
One of the issues encountered in the field was the number of subjects in the study who were lost at
endline data collection. Only 435 caregiver-child pairs were part of the endline collection, representing a
loss of 196 caregiver-child pairs, or 31% of the original sample. This is notably higher than the assumed
15%, and while the remaining sample size is still fairly large, the loss of data does reduce the statistical
power of all tests to a certain extent. Another issue that must be kept in mind is the length of time – 5
months – between baseline data collection, and the beginning of Chipolopolo distribution and the large
shift in age of the children during the study
The remainder of this discussion will begin by focusing on knowledge pertaining to Chipolopolo: its
utilization, acceptability, and delivery, as well as knowledge of the product amongst caregivers. The
discussion will then examine more general results concerning both the control and intervention groups
including: sanitation, early childhood development, child health, and IYCF knowledge and practices, before
concluding with a focus on lessons learned.

72
4.1. Chipolopolo
Chipolopolo was distributed to individuals living in the 5 CA designated part of the intervention group:
Kawimbe, Mbala Urban, Tulemane, Mpande, and Mambwe Mission, beginning in November 2013.
Interviews at endline data collection with the caregivers enrolled in the study within these five CA revealed
general trends about the use and perception of Chipolopolo.
4.1.1. Utilization and Adherence
At the time of the endline data collection nearly four-fifths of the caregivers interviewed reported that
they were still giving Chipolopolo to their child and nearly all of these children had been consuming
Chipolopolo for over six months, although there were differences between various CA, from a high of 89%
in Mpande to a low of 68% in Mambwe Mission.
The majority of the caregivers with children still consuming Chipolopolo also reported that they were
giving the product to their child five to seven times per week. Given that the supply of Chipolopolo within
the study only accounted for use by caregivers three to four times a week if a more ‘flexible’ schedule was
followed, the explanation for the high level of usage is not immediately apparent. One explanation is that
caregivers were only recalling and reporting on the most recent week, rather than reporting the average
number of sachets mixed with their child’s food in a week over the course of the whole of the study as they
were asked.
Among caregivers who reported that they had stopped using the product, 21% of the sample interviewed
at endline, the most common reason – accounting for nearly half of responses – was that their child had
turned 23 months, and as such was no longer eligible to receive Chipolopolo. Originally, children between
the ages of 6-11 months were included at baseline so that they would still be consuming Chipolopolo in
twelve months at the time of endline data collection. Due to the delay in distribution of Chipolopolo, it
meant that some children were over two years of age by the time of the endline data collection. While
caregivers of children enrolled in the effectiveness study were instructed to continue use of Chipolopolo
until endline data collection was complete, programmatic messaging instructing caregivers to discontinue
use at 23 months may have led to some confusion. Encouragingly, this demonstrates that the original
directions on how to use Chipolopolo were effectively communicated and remembered by caregivers. Of
relevance, when only examining the 25% of children who were still under 24 months at endline, the
percent still consuming Chipolopolo climbs to 89%. Slightly under one quarter of the caregivers who
stopped using the product gave a reason related to the child not liking the food, and just over one fifth
reported that they felt that Chipolopolo made their child sick in some way, such as by causing diarrhoea.
The prevalence of diarrhoea in the control and intervention groups however, was statistically the same,
along with the prevalence of fever and cough, suggesting that caregivers are attributing their child’s
diarrhoea to Chipolopolo when in fact it is the result of other causes.
Over half of the caregivers reported that they took at least one break of over four days from Chipolopolo,
with the most common reason being that the child was sick, which suggests proper use. However, as 10%
of the breaks were associated with the caregiver being away from home, there is evidence of the need to
make sure that all family members, including fathers, are supportive of the product and have the
73
knowledge of how to use it when the primary caregiver is away. Furthermore, another 10% of caregivers
who had taken a break said it was a result of either running out of the product or of a lack of distribution.
Nearly all caregivers reported that they only used the Chipolopolo sachets on the child enrolled in the
study, and very few stated that they felt pressure to share them with others. More critically, only one
caregiver stated that they did not find Chipolopolo easy to mix with food. Broadly speaking, when
comparing the experiences of using Chipolopolo between the 79% of caregivers who were and the 21% of
caregivers were no longer using the product, caregivers reported similar experiences, suggesting that
factors other than ease of use, perceived changes to the food, or having received Chipolopolo messaging
were affecting usage.
As expected the most common food vehicle for Chipolopolo was porridge, followed by nshima, rice, beans,
and mashed potatoes. All of these foods are ideal, assuming they are not too hot or of a thin, liquid-like
consistency. Promisingly, 90% of caregivers stated that the food they added Chipolopolo to was of a thick
consistency. Only a very small number, 1%, of caregivers did however report that they added the
Chipolopolo to liquid, suggesting that overall the messaging on food vehicles was followed by the vast
majority of caregivers.
When asked what their motivation for using Chipolopolo was, 94% of caregivers stated that they felt the
product was important to keep a child healthy, suggesting caregivers understand Chipolopolo is related to
the health of their child.
4.1.2. Perceived Changes
Caregivers reported a wide variety of perceived changes both in the food that Chipolopolo was added to,
and in the health of the children consuming it. A majority of caregivers (83%) stated that Chipolopolo
caused a change in the food it was added to, with over three quarters of these individuals stating that the
change occurred as soon as the product was added to the food.
Among those stating that there was a change to the food, 64% said that the taste changed, and 98% said
that the colour changed, most commonly to a yellow or orange colour. Taken together this could suggest
that caregivers are adding Chipolopolo to food that is too hot, which is causing the lipid coating to dissolve.
This is in line with the “medicinal” flavour reported by some caregivers, and may mean that the messaging
around the acceptable food temperature to which Chipolopolo can be added to and consistency of the
food vehicle needs to be strengthened. However, there may be another possible explanation as even
during cooking demonstrations by trained CHW, changes in colour were observed even when the food was
an adequate temperature. This suggests the need for further follow-up as to what the causal mechanism
may be.
Nearly all, 94%, of the caregivers reported a perceived change in their child’s health or behaviour. Of note,
95% felt that their child’s appetite had improved, 96% felt that there was an increase in their child’s
activity level, and 93% felt that overall their child’s health had improved, although this may not necessarily
be due to the Chipolopolo.
Nearly 40% of the caregivers stated that their child responded differently to food mixed with Chipolopolo,
with the majority stating that they felt their child preferred food mixed with Chipolopolo, This perceived
preference for food mixed with Chipolopolo is difficult to explain, as when it is mixed properly there should

74
be minimal change in taste or colour, and may reflect instead an overall increase in appetite. Furthermore,
while changes to taste and colour were commonly noted, it would not be assumed that this would lead the
child to enjoy the food more; the food tasting bitter or like supplements being the most commonly chosen
option. Again this supports the idea that the child’s appetite was increasing in general, causing all foods to
be more appealing. Unfortunately, there were also some perceived negative changes, with the most
common being diarrhoea (24%), although as previously mentioned, it should be noted that there was no
difference in the prevalence of diarrhoea across treatment groups and it may have only represented a few
days of intermittent diarrhoea at the start of usage. Other negative changes that caregivers associated with
Chipolopolo were rashes (<1%), fever (2%), and vomiting (1%), and while these were reported for a
minority of cases, it is important to follow-up with caregivers, to maintain adherence. Thirty-four
caregivers reported that their child’s stool darkened, and this is known to occur as a result of the child
responding to the increase in iron in the diet.
The perceived changes may partly explain patterns in discontinuation; it was found that caregivers that
reported one or more positive changes were more likely to still be providing Chipolopolo and caregivers
who reported only negative effects were less likely. Likewise, caregivers who were still providing
Chipolopolo were more likely to say that it made their child more active and that it improved their child’s
appetite, as compared to caregivers who were not providing Chipolopolo anymore.
4.1.3. Acceptability
There were high levels of discouragement towards the use of Chipolopolo, with nearly half of the
caregivers stating that they had been discouraged by family and/or community members from adding
Chipolopolo to their child’s food. The most common source of discouragement was friends and
neighbours, rather than family, and suggests the need to sensitize all members of the community, not just
those receiving the sachets. The most common reason for being discouraged was that people felt the
Chipolopolo was harmful to children, followed by suspicion towards Chipolopolo as a new and unfamiliar
product. Some caregivers even reported that they were discouraged from using the product because of
associations between Satanism and Chipolopolo. While this was the case for less than 10% of all caregivers,
it is still evidence of the need to increase community mobilisation and sensitization.
This finding is further supported by information that was gathered about the rumours that caregivers
heard about Chipolopolo. Over half of the caregivers reported hearing rumours, with the most common
rumour being that Chipolopolo is associated with Satanism and witchcraft. Other rumours were that
Chipolopolo is harmful, that it can kill children, and that it can cause them to become sterile. While only 11
caregivers stated that they were influenced by these rumours, and no one rumour had a statistically
significant effect on adherence, it is still critical to respond to rumours with proper outreach and
sensitization before they become entrenched and deeply rooted in the community, by which point they
will be difficult to correct. This is supported by evidence that certain rumours may have been more
common in some areas compared to others, suggesting that if caught in time it may be possible to
adequately respond to them before they become widespread. During a potential scale-up it will be
important to monitor and respond to rumours as soon as they arise in a community.
Despite this, nearly all of the caregivers who were interviewed at endline reported that they would
recommend that other caregivers use Chipolopolo, and that they would be willing to pay for it. This

75
suggests that while there may be many negative rumours about Chipolopolo in the community, overall
caregivers felt that the product was actually beneficial, which given the high reports of improved health, is
not surprising. Of course, caution must be used when interpreting this, as there was a high rate of loss to
follow up and it is not possible to estimate what the level of acceptability was among caregivers who were
not interviewed.
4.1.4. Delivery of Chipolopolo
There are two main sources of information on the delivery of Chipolopolo to caregivers: the distribution
cards which were provided to the caregivers, as well as the memory of the caregivers themselves.
Unfortunately, there was a discrepancy between these two sources of information. The average number of
boxes of Chipolopolo received according to the caregiver self-report was four, but the average number
based on distribution cards was only three. One possible reason for this disagreement was that not all
boxes were marked down on the cards. In fact, only 101 caregivers had their card on the day of the
interview, suggesting that they were not always filled in by CHW, were lost by caregivers, or were not
themselves properly distributed. Findings from the external monitoring exercise in May 2014 by UBC
support the theory that the recording of distribution activities simply are not happening as they should,
either on enrolled children’s’ distribution cards or in community Chipolopolo registers. Thus, the data
based on caregiver report is likely more accurate and reliable than the data from the cards.
However, regardless of the source of information, it is clear that there were issues with distribution, with
only 70% of caregivers reporting that they had received four or more boxes; this percentage drops below
half when using the distribution cards. Determining the exact reason for low distribution is difficult, but a
number of factors can be suggested. The prevalence of spoilt packages early on in the pilot could have led
to lower collection rates and resulted in temporary cessation of distribution in some areas; the frequency
of pick-up times and availability of CHW could also have been factors, as well as poor integration with
other services that are part of the Under 5 Clinics, and delays resulting from inefficient recording of
distribution data. Harder still to determine is the motivation level of the caregiver in picking-up
Chipolopolo and whether this led to a lower number of boxes received. Future scale-up should plan on
making Chipolopolo as accessible as possible to help overcome such obstacles, as well as making sure that
distribution cards and registers are properly used.
The vast majority of the boxes were distributed by CHW as expected, with one third of caregivers receiving
their boxes at outreach posts or mobile clinics, and one third reporting they were obtained during home
visits. While 44% of caregivers reported that they had received a box once every two months, 43% stated
that they were receiving a box every month, which suggests that there was increase in distribution towards
the end of the project. One possible explanation for this is the previously mentioned issues of spoiled
product. In August 2014, the DHO ‘recalled’ all Chipolopolo that had been distributed to enrolled children
and carried out a campaign to replace it with new product supplied by the manufacturer. Therefore, this
43% may have been recalling their most recent experience(s) with distribution rather than their experience
over the course of the whole study, as these caregivers were found in all CA and not concentrated in
particular CA.
76
Most interestingly, only five caregivers stated that they experienced a problem during Chipolopolo
distribution. Given the previously mentioned issues with the delivery of Chipolopolo, this suggests that
caregivers were perhaps not made aware of the amount of boxes that they were supposed to receive. The
main takeaway remains: delivery systems need to be improved.
Finally there may have been geographic differences in distribution, as there were statistically significant
differences in the number of boxes delivered to caregivers, both as assessed by caregiver report, and when
using distribution cards. The area with the highest distribution as determined by the distribution cards was
Kawimbe, at 4.8 boxes, but the area with the highest distribution when based on caregiver report was
Mbala Urban, at 5.1 boxes per caregiver. Notably, the differences in distribution were less pronounced
when going by caregiver reports, suggesting that there may also be differences in proper utilization of the
distribution cards across CA.
4.1.5. Delivery of Chipolopolo Messages
Proper use of micronutrient powders such as Chipolopolo depends on their proper use by the caregivers
who add them to a child’s food. As such, it is critical that caregiver’s receive training in their use. Nine in
ten caregivers reported that they received information at community gatherings, typically alongside
immunization and vitamin A supplementation, and slightly over this proportion reported that they received
information materials on Chipolopolo. The fact that most public messages about Chipolopolo were
presented at child health clinics helps explain the higher level of discouragement from friends and
neighbours, as they were likely less informed about the product. More messages targeted to the general
community could help sensitize the community during future scale-up.
Promisingly, 97% of the caregivers found the information material helpful, although some caregivers (2%)
found them unhelpful as a result of a lack of adequate literacy. This suggests that it may be important to
develop a wider range of information materials, to make sure that they are accessible to all caregivers. All
but one caregiver stated that they had received training on how to use Chipolopolo, with nearly universal
statements that this training involved a cooking demonstration, and that it was helpful. These results
indicate that the systems to deliver information to caregivers are functioning well overall, although it is still
important to examine specific knowledge to identify gaps.
4.1.6. Knowledge of Chipolopolo
Knowledge on proper Chipolopolo usage was relatively high, although there is evidence that caregivers
may not have fully understood why it was important to add Chipolopolo to food. While only 44% of
caregivers linked Chipolopolo with anaemia, 87% stated that it would make a child strong. Four in five
caregivers were able to state the correct age for when Chipolopolo should be introduced into a child’s diet,
and nine in ten correctly stated that a child should receive a maximum of one sachet per day. Nearly all
caregivers stated that Chipolopolo should only be added after food has cooled, and 95% stated that
Chipolopolo should not be added to liquid foods.
4.1.7. Chipolopolo and Child Health
Much of the results comparing the health of children who were in the control and intervention groups are
inconclusive, which may be related to some of the issues which have already been discussed: a higher than
anticipated number of caregiver-child pairs left the study and were not interviewed at endline, reducing

77
the statistical power of tests, as well as the issues with distribution, including a delay in the beginning of
Chipolopolo distribution and temporary suspension of distribution due to spoiled sachets which varied by
CA. These latter issues would potentially reduce the magnitude of any changes in Hb concentrations.
Another issue is that given the lack of randomization in the original selection of CA and study participants,
it is difficult to draw firm conclusions, as any differences between the intervention and control groups may
be due to unknown confounding variables.
There was an overall decrease in the prevalence of anaemia for all children in the study, from 57% at
baseline to 22% at endline. To a certain extent this is to be expected given the increased age of the
children from an average of 9 months at baseline to 25 months at endline; independent of other factors
one would expect Hb concentrations amongst children who are 22-29 months old to be higher than in
children 6-11 months old. However, when comparing the endline Hb concentrations between the control
and intervention groups there was not a statistically significant difference, nor was there a statistically
significant difference in the average change in Hb concentrations.
The lack of a statistically significant effect on Hb concentrations is repeated when comparing the mean Hb
concentrations of children in the intervention group who were still receiving Chipolopolo and those who
were not. While children currently consuming Chipolopolo had a slightly higher mean Hb concentration
and saw a greater increase in Hb concentrations over the course of the intervention, these differences did
not prove to be statistically significant. Furthermore, when linear regression was used to control for the
effects of other aspects of the programme, such as mosquito net usage, or IYCF counselling, as well as
baseline Hb concentrations there was still no statistically significant effect of being enrolled in the
intervention group on Hb concentrations.
However, different households received different numbers of boxes of Chipolopolo during the
intervention. This allowed for the investigation of whether there might be a dose response between the
number of boxes received and mean Hb concentrations. This is of course a proxy for Chipolopolo usage, as
there is no way to know for certain how many sachets of Chipolopolo a child actually consumed from each
box received.
When examining the relationship between boxes received and Hb concentrations, there does not appear
to be a clear relationship when relying on boxes received as determined from distribution cards. However,
there does seem to be a pattern when one uses the number of boxes received as reported by the
caregivers directly. The mean Hb concentrations, and the average change in Hb concentrations increases
up to 5 boxes received, before levelling off and then decreasing slightly. Specifically the endline Hb
concentration of those living in a household which received 5 boxes averaged 11.7 g/dL, whereas the
endline concentration of those who received only one box averaged 9.2 g/dL. While this is suggestive it is
not conclusive, as the differences between the groups did not prove to be statistically significant.
As was the case at baseline, the prevalence of iron deficiency, and thus iron deficiency anaemia was highly
dependent on the method of assessment. The lowest prevalence, 4%, was found when using the standard
WHO serum ferritin cut off, but excluding children with signs of inflammation35. This rose to 5% when using
35 WHO. Serum ferritin concentrations for the assessment of iron status and iron deficiency in populations. Vitamin and Mineral Nutrition Information System. Geneva, World Health Organization, 2011 (WHO/NMH/NHD/MNM/11.2).

78
inflammation adjusted serum ferritin cut offs36, and 24% when using the WHO recommended elevated
serum ferritin cut off, for areas with a high burden of infection37. When using the currently recommended
cut off for serum transferrin receptor (STfR)38, the prevalence of iron deficiency rose to 57%.
It is not surprising that there is a discrepancy between the various indicators, given the high rate of
inflammation, as seen by the elevated AGP and CRP concentrations in the population. This is because
serum ferritin is a positive acute phase protein, and as such its concentrations rises during infection,
possibly masking iron deficiency. For this reason “in areas where inflammation is prevalent, assessing a
population’s iron status based on serum transferrin receptor levels is most appropriate,” according to the
WHO39. Furthermore, linear regression models and correlation coefficients presented in this report provide
evidence that serum ferritin is highly confounded by infection in this population, further supporting the use
of STfR as the indicator of choice when assessing the prevalence of iron deficiency.
Based on the relative concentrations of STfR and serum ferritin, it can be stated that both iron deficiency
and inflammation are prevalent in the population40. It is thus of particular note was the that there was a
significant (p = 0.001) difference in the prevalence of iron deficiency in the control (66%) and intervention
(49%) groups, as assessed by STfR concentrations, as STfR is likely the most reliable indicator of iron
deficiency in this specific population. Given the negative consequences of iron deficiency early in life, this is
one of the key findings of the present report.
Finally, the prevalence of IDA varied depending on the method of assessing iron deficiency, from a low 1%
when using inflammation adjusted serum ferritin cut offs, to a high of 15% when using STfR. However,
there was no statistically significant difference in prevalence for any of the methods when comparing
children in the intervention and control groups.
There was also no statistically significant relationship between treatment group and the prevalence of
diarrhoea, bloody diarrhoea, fever, cough, wasting, stunting, underweight, bilateral oedema or MUAC
status. While children in the intervention group did have lower endline weight-for-age z-scores, this finding
disappeared when taking differences at baseline into account. Likewise, the seemingly higher prevalence of
stunting in the intervention group, at 58%, as compared to 49% in the control group, while worrying, was
not statistically significant and may be due to other differences between the Catchment Areas in the
control and intervention groups. Overall, 54% of the children were stunted, of which 18% were severely
stunted, 3% were wasted, with less than 1% severely wasted, and 21% were underweight, with 5% severely
underweight. These rates are higher than at baseline, although it is difficult to compare wasting values at
36 Thurnham, David I., et al. "Adjusting plasma ferritin concentrations to remove the effects of subclinical inflammation in the assessment of iron deficiency: a meta-analysis." The American journal of clinical nutrition 92.3 (2010): 546-555. 37 WHO. Serum ferritin concentrations for the assessment of iron status and iron deficiency in populations. Vitamin and Mineral Nutrition Information System. Geneva, World Health Organization, 2011 (WHO/NMH/NHD/MNM/11.2). 38 Engle-Stone, Reina, et al. "Plasma ferritin and soluble transferrin receptor concentrations and body iron stores identify similar risk factors
for iron deficiency but result in different estimates of the national prevalence of iron deficiency and iron-deficiency anemia among women and children in Cameroon." The Journal of nutrition 143.3 (2013): 369-377. 39 Serum transferrin receptor levels for the assessment of iron status and iron deficiency in populations. Vitamin and Mineral Nutrition
Information System. Geneva: World Health Organization; 2014 (WHO/NMH/NHD/MNM/14.6 40 Serum transferrin receptor levels for the assessment of iron status and iron deficiency in populations. Vitamin and Mineral Nutrition
Information System. Geneva: World Health Organization; 2014 (WHO/NMH/NHD/MNM/14.6

79
endline and baseline because severe wasting was excluded at baseline, and more importantly it is likely a
result of the shift in the age of the cohort in between baseline and endline.
4.2. Drinking Water, Sanitation, and Hygiene
Safe drinking water and proper sanitation and hygiene practices are essential to promote the optimal
health and growth of children. While there was less data gathered on topics related to WASH during the
endline data collection, some important areas of improvement, as well as areas for further effort were
apparent. There was no difference between the percentage of households treating their water between
the control and intervention groups, but there was an overall increase in water treatment as compared to
baseline. While only 36% of households were treating their water at baseline, this had increased to 66% at
endline. This increase was a result of an increase in both the boiling of water and the use of
chlorine/bleach. While water treatment was not explicitly a part of the current project, this is still a
positive finding, and it may be related to the reduction in some forms of morbidity over the course of the
intervention. It was found that one third of caregivers who had attended a counselling session over the
previous two months heard about proper hygiene and sanitation, which may explain some of the change in
water treatment as well as the changes in hand washing discussed below.
There was an improvement in hand washing practices, with 98% of caregivers now washing their hands
with soap or ash, and 96% using soap or ash to wash their child’s hands. Most markedly, 88% of caregivers
now wash their hands after using the lavatory or defecating, compared to approximately two thirds at
baseline. Furthermore, while only a quarter of caregivers washed their hands before preparing or handling
food at baseline, this had increased to 51% at endline. However, while these values are an improvement
over baseline, they are still less than ideal. Troublingly, the percentage of caregivers who wash their hands
after changing or cleaning a child dropped to 23% from 42%. Thus, while there have been improvements,
there is still further work to be done to improve hygiene practices. One possible avenue would be through
further coupling WASH messages with the other messages caregivers hear at counselling sessions.
4.3. Early Childhood Development
Optimal child development, particularly during the first three years of life, requires psycho-social
stimulation to promote optimal growth of the brain. As part of this, there are three core categories of
stimulation: playing, communicating, and interactive feeding. Given its importance, child stimulation
messages were incorporated into the IYCF trainings, which caregivers received. There did not seem to be
an appreciable change in the percentage of children who were played with (95%), taken outside the home
(90%), or sang too (89%) between baseline and endline, all of which were high. However, there did seem to
be an increase in levels of knowledge on the topic, with 94% of caregivers identifying communication, 75%
identifying playing, and 32% identifying active feeding as forms of stimulation, which were increases from
23%, 18% and 7% at baseline respectively. One area for improvement, also found at baseline, was the low
participation of fathers as compared to mothers in behaviours promoting child stimulation. At endline 33%
of fathers had played with the child, compared to 51% of mothers and only 31% of fathers had sang to the
child, as compared to 57% of mothers.
80
4.4. Child Health and Health Seeking Behaviour
There was a high burden of disease in the population as compared to the latest results from the Zambia
Demographic and Health Survey 2013-201441. Nationally among children under 5 years, 21% have had a
fever, 16% have had diarrhoea, and 4% have had a cough paired with short rapid breathing in the previous
two weeks. However, in the current sample, 36% had had a fever, 24% had had diarrhoea, and 14% had
had a cough paired with short rapid breathing in the previous two weeks. When looking at all types of
cough, this final prevalence increases to 38%. Only 35% of the children were fever, cough and diarrhoea
free over the previous two weeks.
While it is difficult to say why there is such a discrepancy, it may have to do with regional differences, as
Mbala District is underserved relative to other parts of the province and country. Diarrhoea in particular is
nutritionally relevant, as it lowers the absorption of vitamins and minerals that may already be lacking in
the diet and contributes to the loss of iron via the loss of intestinal cells42. Fever is also of concern, as it
may be indicative of diseases such as malaria; in line with this, children who had had a fever had lowered
Hb concentrations. On a positive note, the percentage of children in the sample for whom treatment for
fever and diarrhoea was sought, at 72% and 78% was higher
Furthermore, the prevalence of fever, diarrhoea and cough was lower than the rates found at baseline:
55%, 56% and 72% respectively. It is not clear why there was such a drop in the prevalence of these
morbidities.
There were also improvements in the percentage of children sleeping under a mosquito net. At baseline
these were 69% and 74%, but by endline these values had increased to 97% and 93%. In contrast, the most
recent national data on the percentage of children under 5 sleeping under a mosquito net is only 43%43.
Children who had received a vitamin A capsule had half the prevalence of anaemia than those who had not,
a relationship which was statistically significant. A similar finding was also found for mosquito nets,
although the relationship was not significant statistically. However, children not sleeping under a mosquito
net were more likely to be stunted. While it is not possible to state causation in these cases, this
information supports the importance of maintaining high levels of coverage for both of these aspects of
the current intervention.
Unfortunately, there was an increase in the prevalence of vitamin A deficiency, from 5% at baseline to 13%
at endline. While children with vitamin A deficiency were less likely to have received a vitamin A tablet in
the previous 6 months, this relationship was not statistically significant. As concentrations of RBP are
depressed during inflammation, the apparent prevalence of VAD can be incorrectly increased. When using
41 CSO. Zambia Demographic and Health Survey 2013-2014. Lusaka, Zambia; 2015.
42 Oski FA. Iron deficiency in infancy and childhood. N Engl J Med. 1993
43 CSO. Zambia Demographic and Health Survey 2013-2014. Lusaka, Zambia; 2015.

81
a correction method44, the baseline prevalence of VAD at baseline drops to 3% and the prevalence of VAD
at endline drops to 8%.
The prevalence of malaria parasitism was 12%, which is nearly unchanged from the 10% seen at baseline,
although since baseline and endline were conducted at different times of the year, and malaria prevalence
is seasonal in nature, higher during the rainy seasons and lower during the dry season45, it is difficult to
make direct comparisons. However, in some CA the prevalence of malaria parasitism was notably higher,
rising to 27% in Kaka and 21% in Nondo. According to the most recent Malaria Indicator Survey, there was
24% prevalence of malaria parasitism among children under five in the Northern Province46.
4.5. Caregivers’ Knowledge on IYCF and Anaemia
One major component of the project was the provision of IYCF counselling for caregivers, in both the
control and intervention groups. The effects of this are clearly seen in the data collected at endline. While
only 41% of caregivers at baseline had been to a counselling session in the previous 2 months, this number
had risen to 68% by endline. Reflecting this, while only 70% of caregivers at baseline reported that they
had ever received messages on breastfeeding and/or complementary feeding, by endline 93% of caregivers
had received such messaging at one point or another. There was also an increase in the amount of take-
home materials being distributed: while 29% of caregivers who had recently attended a counselling session
at endline had received such materials, mainly among the intervention group, this was only the case for 5%
of the caregivers at baseline. From this, it is clear that there was an increase in the level of counselling
which caregivers were receiving and hence trained community volunteers were active in their communities.
This is apparent in the increased knowledge demonstrated by caregivers at endline. Just over two-thirds of
caregivers reported that breastfeeding should start immediately after birth, compared to 54% at baseline.
The average age stated for the beginning of complementary feeding was 6.2 months, which is close to the
current recommendation, and nearly unchanged different from the average of 6.1 months reported at
baseline. However, there were outliers ranging from 2-12 months, suggesting room for improvement,
although this was smaller than the range reported at baseline of 1-18 months. Furthermore, these outliers
represented only a minority of cases: 79% of caregivers reported that the age to commence
complementary feeding was 6 months. Almost three quarters of caregivers were able to name four or
more different food groups, and nearly all caregivers stated that it was important to feed a variety of foods
to their child.
There was also an improvement in knowledge relating to anaemia. One manifestation of this was improved
awareness of pale skin, eyes nails or hands as a sign of anaemia (up to 98% form 77%); however, there was
also a slight increase in the percentages of caregivers naming certain incorrect signs, such as oedema (up
to 17% from 12% at baseline). More strikingly, there was an increase in the percentage of caregivers who
knew that malaria and/or a lack of iron in the diet could cause anaemia (up to 48%, from 21% at baseline).
While roughly the same percentage of caregivers stated that they knew of foods rich in iron at both 44 Thurnham DI, McCabe GP. Influence of infection and inflammation on biomarkers of nutritional status with an emphasis on
vitamin A and iron. In: World Health Organization. Report: Priorities in the assessment of vitamin A and iron status in populations, Panama City, Panama, 15–17 September 2010. Geneva, World Health Organization, 2012 45 Ministry of Health. Zambia National Malaria Indicator Survey 2012. Lusaka, Zambia; 2013. 46 Ministry of Health. Zambia National Malaria Indicator Survey 2012. Lusaka, Zambia; 2013

82
baseline (76%) and endline (75%), the responses were more accurate at endline. In particular, there was an
increased knowledge of organ meats, meat, poultry and fish as being high in iron. Despite this increase,
knowledge was still poor in absolute terms, with only 31% of caregivers who stated that they knew of
foods rich in iron naming meat or poultry. The most common response was green leafy vegetable (90%).
While there is iron in this type of food, its bioavailability is low. There is also still a large amount of
misinformation, with an increase in the percentage of caregivers stating that colas are high in iron (up to 1%
from 6% \). This stems from a local belief that liquids which are red and or dark are good sources of iron.
Thus, while there has been an increase in caregiver knowledge on IYCF and anaemia in relative terms,
there is still poor knowledge overall and need to reinforce messages with provision of Chipolopolo as an
entry point and cooking demonstration to promote nutritious recipes with locally available ingredients to
build on the improvements seen over the course of the project.
4.6. Infant and Young Child Feeding Practices and Food Consumption
Adequate age-specific feeding practices are essential to ensure that children grow properly during the first
“1000 days.” Overall, there is evidence that the diet is poor in quality, a fact which is certainly contributing
to the high rates of malnutrition in the population. One example of this is the low rate of continued
breastfeeding. Only 41% of the children under 24 months of age were still being breastfed, contrary to
current recommendations. This is also lower than the national figure children aged 18-23 months of 51%,
and could have negative health implications for the children who stop breastfeeding early, particularly as
some caregivers reported that they stopped breastfeeding as soon as two months after birth.
Based on the 24-hour food recall the diet is largely plant based, and is low in diversity, as was found at
baseline. In particular there was a low consumption of iron rich foods such as fish (45%) meat, poultry, or
caterpillars (24%) and organ meat (5%), although there was an increase in the consumption or organ meat
and fish as compared to baseline (1%). While there was a higher percentage of children consuming meat,
poultry or caterpillar in the control group (30%) than in the intervention group (19%), this was likely a
result of the seasonal nature of the caterpillar harvest, which coincided with the timing of data collection
in the control sites, but not in the intervention sites.
It is not possible to calculate traditional IYCF indicators such as minimum dietary diversity, as many of the
children were over 23 months of age at the time of endline, but there is evidence that the diet is more
diverse than at baseline, given that 53% of the children were consuming four or more of the food
categories used in the calculation of minimum dietary diversity. For reference, only 22% of children were
meeting minimum dietary diversity at baseline, but caution must be used when comparing these figures.
5. Conclusions
In summary, the endline results, were inconclusive in terms of the effect of Chipolopolo on changes in Hb
concentration and anaemia status. It is important to emphasize that given that this was operational
research the lack of clear results is not entirely unexpected, given the challenges faces with distribution
discussed above. Numerous studies, including a recent systematic review by the Cochrane Collaboration
83
concluded that home fortification with MNP was “an effective intervention to reduce anaemia and iron
deficiency in children six months to 23 months of age”47.
In addition, the results point to point to several positive developments as well as areas for improvement. In
particular, there were improvements in the IYCF knowledge among caregivers. However, this improvement
is only in relative terms, while knowledge has improved over the low levels found at baseline, it is still fairly
low in absolute terms, particularly around knowledge related to anaemia and iron rich foods. There was
also an improvement in hand washing practices, which was matched with an increase in the percentage of
households that were treating their water, which is particularly important for reducing the risk of diarrheal
episodes, which put a child at increased risk of malnutrition and other forms of morbidity. There was an
overall decrease in morbidity, as determined by the prevalence of fever, cough and diarrhoea, as well as
biochemical assessment of inflammation status, although endline and baseline took place at different
points in the year, and given the seasonal nature of infection in Zambia, this makes direct comparisons
difficult. However, the prevalence of stunting worsened. While unfortunate, this is not entirely
unanticipated as rates of stunting are generally higher in the current age group (22-29 months) than in the
younger group (6-11 months) which was measured at baseline.
Furthermore, across various definitions there was a decrease in iron deficiency, and when using STfR, there
was a statistically significant effect, with children in the intervention group having lower rates of iron
deficiency than those in the control group. This is a key finding and is particularly relevant given the
evidence presented that serum ferritin was highly confounded by infection, something which is not
believed to effect concentrations of STfR, making STfR the preferred indicator in this particular setting.
While there was an overall decline in the rate of anaemia, from 57% at baseline to 22% at endline, there
was not a statistically significant difference in the rates of anaemia when comparing the group receiving
Chipolopolo and the group that was not at endline. There was some inconclusive evidence that the
children of caregivers who reported receiving a greater number of boxes of Chipolopolo may have had
higher concentrations of Hb. One possibility for the lack of a clear effect is the delay, five months, in the
beginning of distribution, as well as other issues, such as spoilage of product resulting in interruptions in
distribution. It is also difficult to make definitive comparisons between the two treatment groups given the
lack of randomization at baseline because this introduces the possibility that differences between the two
groups at endline may be the result of differences besides receiving Chipolopolo.
Despite this, the acceptability among caregivers seemed high, with the vast majority stating that they
would recommend Chipolopolo to other caregivers. Caregivers also attributed a number of positive effects
of the product such as increased appetite and energy levels, although it is not possible to know for certain
whether these changes are in fact connected to Chipolopolo. However, approximately half of the
caregivers reported hearing rumours and/or being discouraged from using Chipolopolo by family or
community members, so increased outreach to the wider community is clearly warranted. There is also
some evidence that caregivers may not always be mixing Chipolopolo with food properly and this
illustrates the importance of proper outreach and education.
47 De-Regil LM, Suchdev PS, Vist GE, Walleser S, Peña-Rosas JP. Home fortification of foods with multiple micronutrient
powders for health and nutrition in children under two years of age. Cochrane Database of Systematic Reviews 2011, Issue 9.
Art. No.: CD008959. DOI: 10.1002/14651858.CD008959.pub2.
84
As can be seen from the results of this study, future scale-up targeting anaemia and malnutrition in infants
in Zambia would need to be comprehensive in both approach and delivery. Solutions such as Chipolopolo,
insecticide-treated mosquito nets, and water treatment have shown potential in this and other
interventions to provide concrete improvements in child health, and are best integrated as a complete
package. The delivery of the package however is of equal importance to the contents itself, and future
scale-up should use this study’s system as a base from which to build an effective system of physical
delivery, community sensitization, and education of caregivers and volunteers.

85
6. Appendices
Appendix 1. Contents of MNP
Micronutrient Amount
Vitamin A 400.0 μg
Vitamin D 5.0 μg
Vitamin E 5.0 mg
Vitamin C 30.0 mg
Vitamin B1 0.5 mg
Vitamin B2 0.5 mg
Niacin 6.0 mg
Vitamin B6 0.5 mg
Vitamin B12 0.9 μg
Folic Acid 150.0 μg
Iron 10.0 mg
Zinc 4.1 mg
Copper 0.56 mg
Selenium 17.0 μg
Iodine 90.0 μg

86
Appendix 2. Mbala District Map (with Intervention and Control Sites Marked)

87
Appendix 3. Selected Zones in Study Catchment Areas (Control and Intervention)
LEGEND Indicates a CA in a Control Group (n=4)
Indicates a CA in an Intervention Group (n=5)
FIXED DATA Eligible Children Required per CA 78
Eligible Children Required per CA 62
KAMUZWAZI (5 ZONES)
No. Name of outreach zone
Language spoken
Distance from HC (km)
Eligible Children in zone (6-11mo)
No. of villages in zone
Furthest village from OP
Furthest village (km)
1 Chisitu Mambwe 7 26 3 6
2 Kachenyente Mambwe 6 29 4 Mponde 5
3 Kakonde Mambwe 5 34 2 Malamba 4
4 Mutipe Mambwe 6 37 3 Mbalazi 2
5 Kawala Mambwe 9 69 5
Total Number of Eligble Children
195
Penetration Rate 40.00%
KAKA
No. Name of outreach zone
Language spoken
Distance from HC (km)
Eligible Children in zone (6-11mo)
No. of villages in zone
Furthest village from OP
Furthest village (km)
1 Mwabala Mambwe 13 34 4
2 Jeremia Lutundu
Mambwe 2 35 5
3 Chisenga Mixed (more Mambwe)
10 78 3
4 Pumpa Mixed 8 88 2
5 Chisafwa Mambwe 15 104 3
6 Maloni Mambwe 9 135 7
Total Number of Eligble Children
474
Penetration Rate 16.46%
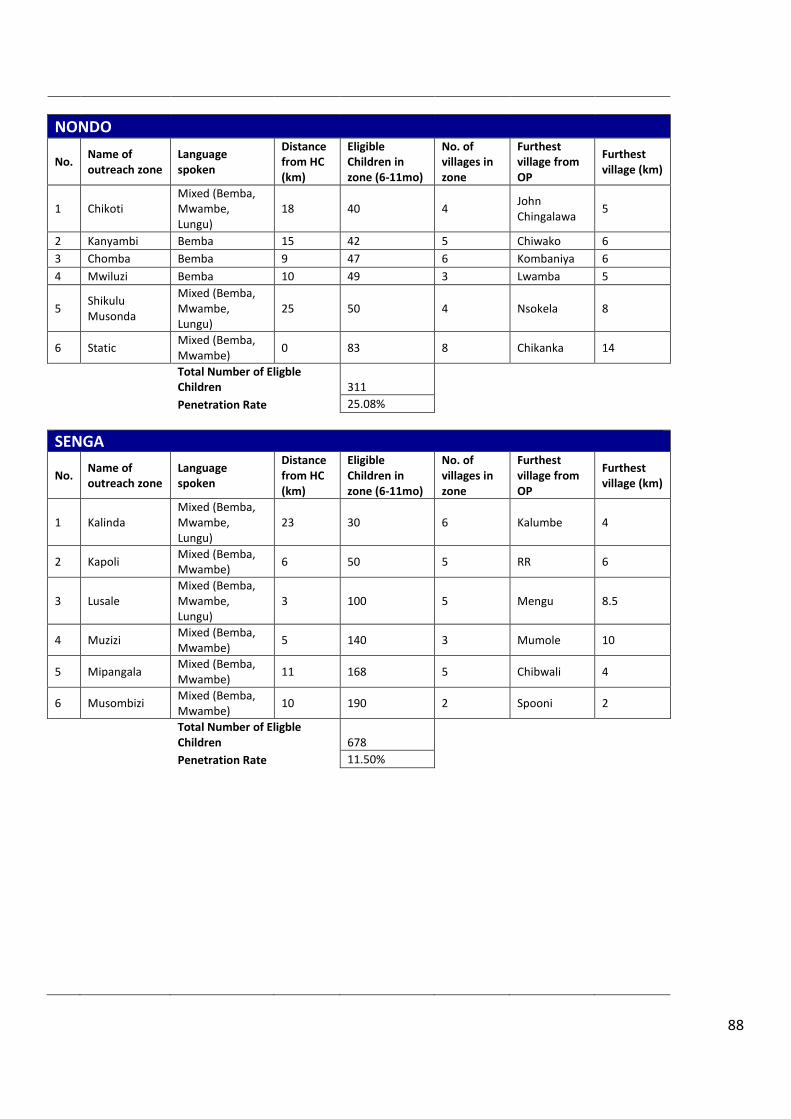
88
NONDO
No. Name of outreach zone
Language spoken
Distance from HC (km)
Eligible Children in zone (6-11mo)
No. of villages in zone
Furthest village from OP
Furthest village (km)
1 Chikoti Mixed (Bemba, Mwambe, Lungu)
18 40 4 John Chingalawa
5
2 Kanyambi Bemba 15 42 5 Chiwako 6
3 Chomba Bemba 9 47 6 Kombaniya 6
4 Mwiluzi Bemba 10 49 3 Lwamba 5
5 Shikulu Musonda
Mixed (Bemba, Mwambe, Lungu)
25 50 4 Nsokela 8
6 Static Mixed (Bemba, Mwambe)
0 83 8 Chikanka 14
Total Number of Eligble Children 311
Penetration Rate 25.08%
SENGA
No. Name of outreach zone
Language spoken
Distance from HC (km)
Eligible Children in zone (6-11mo)
No. of villages in zone
Furthest village from OP
Furthest village (km)
1 Kalinda Mixed (Bemba, Mwambe, Lungu)
23 30 6 Kalumbe 4
2 Kapoli Mixed (Bemba, Mwambe)
6 50 5 RR 6
3 Lusale Mixed (Bemba, Mwambe, Lungu)
3 100 5 Mengu 8.5
4 Muzizi Mixed (Bemba, Mwambe)
5 140 3 Mumole 10
5 Mipangala Mixed (Bemba, Mwambe)
11 168 5 Chibwali 4
6 Musombizi Mixed (Bemba, Mwambe)
10 190 2 Spooni 2
Total Number of Eligble Children 678
Penetration Rate 11.50%
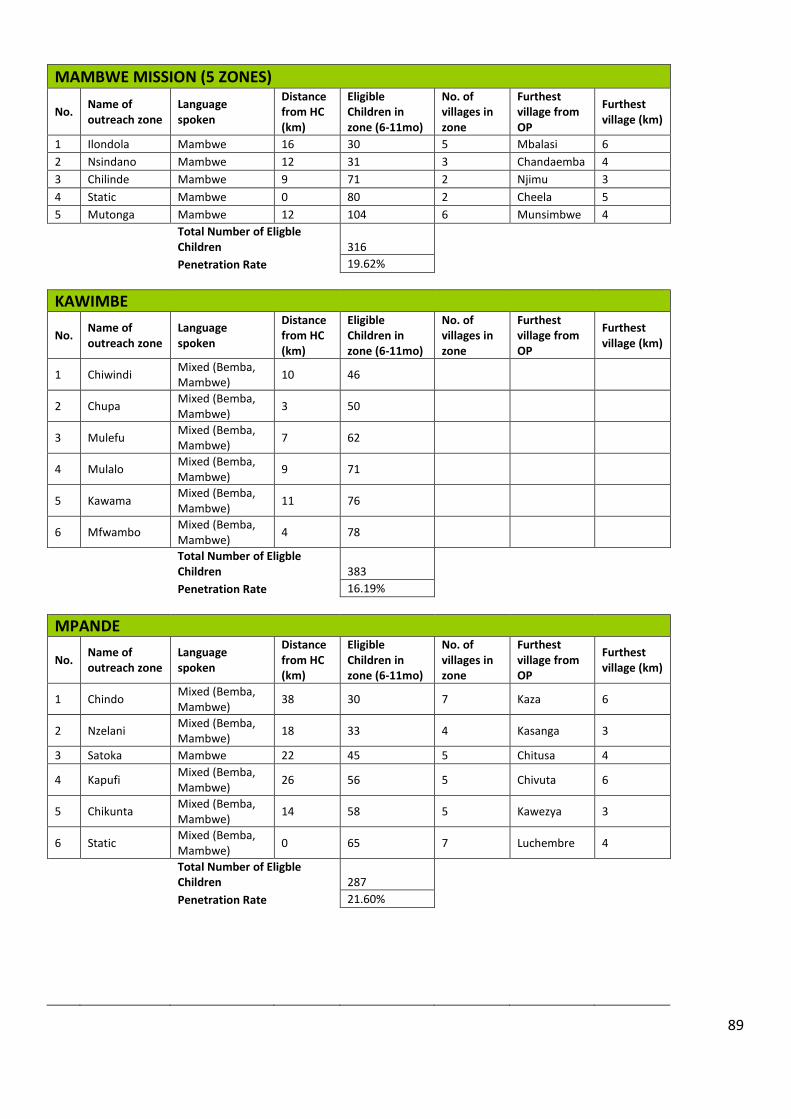
89
MAMBWE MISSION (5 ZONES)
No. Name of outreach zone
Language spoken
Distance from HC (km)
Eligible Children in zone (6-11mo)
No. of villages in zone
Furthest village from OP
Furthest village (km)
1 Ilondola Mambwe 16 30 5 Mbalasi 6
2 Nsindano Mambwe 12 31 3 Chandaemba 4
3 Chilinde Mambwe 9 71 2 Njimu 3
4 Static Mambwe 0 80 2 Cheela 5
5 Mutonga Mambwe 12 104 6 Munsimbwe 4
Total Number of Eligble Children 316
Penetration Rate 19.62%
KAWIMBE
No. Name of outreach zone
Language spoken
Distance from HC (km)
Eligible Children in zone (6-11mo)
No. of villages in zone
Furthest village from OP
Furthest village (km)
1 Chiwindi Mixed (Bemba, Mambwe)
10 46
2 Chupa Mixed (Bemba, Mambwe)
3 50
3 Mulefu Mixed (Bemba, Mambwe)
7 62
4 Mulalo Mixed (Bemba, Mambwe)
9 71
5 Kawama Mixed (Bemba, Mambwe)
11 76
6 Mfwambo Mixed (Bemba, Mambwe)
4 78
Total Number of Eligble Children 383
Penetration Rate 16.19%
MPANDE
No. Name of outreach zone
Language spoken
Distance from HC (km)
Eligible Children in zone (6-11mo)
No. of villages in zone
Furthest village from OP
Furthest village (km)
1 Chindo Mixed (Bemba, Mambwe)
38 30 7 Kaza 6
2 Nzelani Mixed (Bemba, Mambwe)
18 33 4 Kasanga 3
3 Satoka Mambwe 22 45 5 Chitusa 4
4 Kapufi Mixed (Bemba, Mambwe)
26 56 5 Chivuta 6
5 Chikunta Mixed (Bemba, Mambwe)
14 58 5 Kawezya 3
6 Static Mixed (Bemba, Mambwe)
0 65 7 Luchembre 4
Total Number of Eligble Children 287
Penetration Rate 21.60%
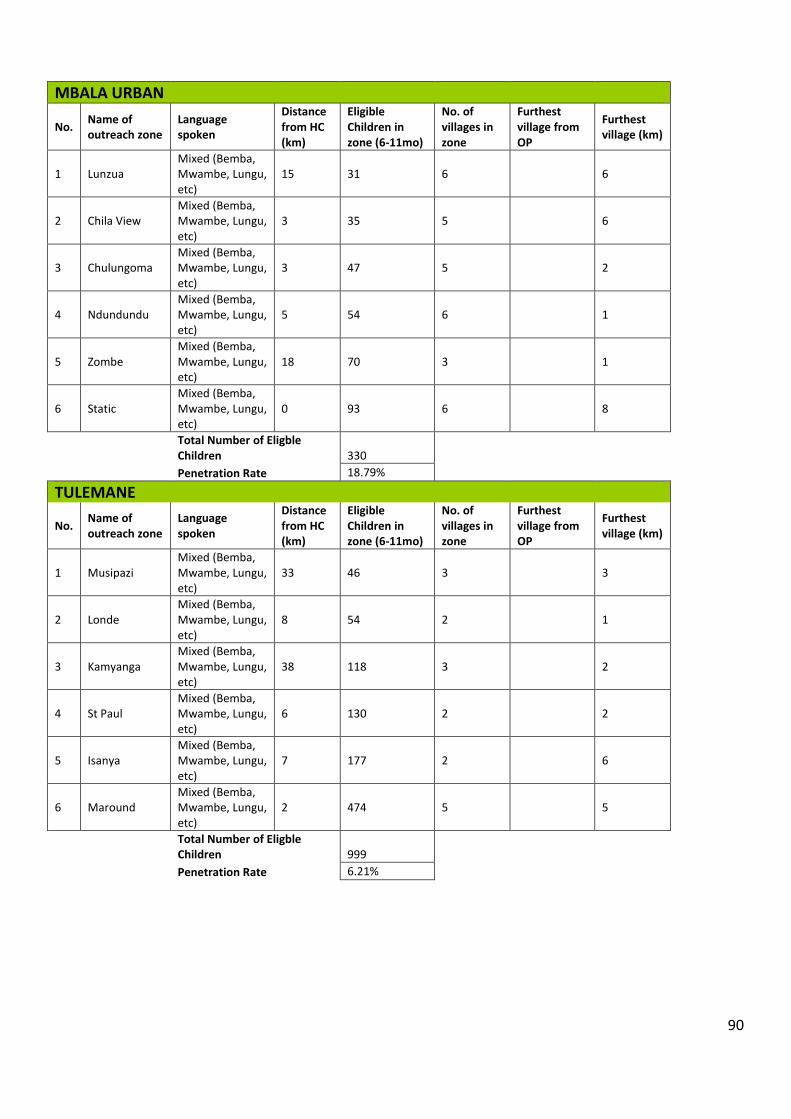
90
MBALA URBAN
No. Name of outreach zone
Language spoken
Distance from HC (km)
Eligible Children in zone (6-11mo)
No. of villages in zone
Furthest village from OP
Furthest village (km)
1 Lunzua Mixed (Bemba, Mwambe, Lungu, etc)
15 31 6 6
2 Chila View Mixed (Bemba, Mwambe, Lungu, etc)
3 35 5 6
3 Chulungoma Mixed (Bemba, Mwambe, Lungu, etc)
3 47 5 2
4 Ndundundu Mixed (Bemba, Mwambe, Lungu, etc)
5 54 6 1
5 Zombe Mixed (Bemba, Mwambe, Lungu, etc)
18 70 3 1
6 Static Mixed (Bemba, Mwambe, Lungu, etc)
0 93 6 8
Total Number of Eligble Children 330
Penetration Rate 18.79%
TULEMANE
No. Name of outreach zone
Language spoken
Distance from HC (km)
Eligible Children in zone (6-11mo)
No. of villages in zone
Furthest village from OP
Furthest village (km)
1 Musipazi Mixed (Bemba, Mwambe, Lungu, etc)
33 46 3 3
2 Londe Mixed (Bemba, Mwambe, Lungu, etc)
8 54 2 1
3 Kamyanga Mixed (Bemba, Mwambe, Lungu, etc)
38 118 3 2
4 St Paul Mixed (Bemba, Mwambe, Lungu, etc)
6 130 2 2
5 Isanya Mixed (Bemba, Mwambe, Lungu, etc)
7 177 2 6
6 Maround Mixed (Bemba, Mwambe, Lungu, etc)
2 474 5 5
Total Number of Eligble Children 999
Penetration Rate 6.21%

91
Appendix 4. Data Collection Schedule
Data Collection Schedule for October-November 2014, Mbala District
Monday October 20th (Research Day 1)
Morning Briefing Catchment Area Team Destination
(Zone)
Distance
(km) Travel Time
#
Participants
Arrival Time at
Outreach Post
06:00 Kawimbe
(Intervention)
A Mulefu 34 45 mins 8 08:30
B Kalekwa 34 1 hr 30 mins 3 08:30
C Mfwambo 31 35 mins 13 08:40
Tuesday October 21st
Buffer Day1
Wednesday October 22nd (Research Day 2)
Morning Briefing Catchment Area Team Destination Distance
(km) Travel Time
#
Participants
Arrival Time at
Outreach Post
07:00 Kawimbe
(Intervention)
A Mulalo 36 35 mins 11 08:30
B Chiwindi 37 25 mins 9 08:30
C Kawama 38 25 mins 16 08:30
Thursday October 23rd (Research Day 3)
Morning Briefing Catchment Area Team Destination Distance
(km) Travel Time
#
Participants
Arrival Time at
Outreach Post
08:15 Mbala Urban
(Intervention)
A Chulungoma 5 15 mins 10 09:00
B Chila View 5 15 mins 11 09:00
C Static 2 5 mins 13 08:50
Friday October 24th
INDEPENDENCE DAY

92
Saturday October 25th (Resarch Day 4)
Morning Briefing Catchment Area Team Destination Distance
(km) Travel Time
#
Participants
Arrival Time at
Outreach Post
08:00 Mbala Urban
(Intervention)
A Ndundundu 7 20 mins 12 08:50
B Lunzuwa 17 35 mins 9 09:00
C Zombe 20 1 hr 16 09:10
Sunday Oct 26th
Sunday
Monday October 27th (Research Day 5)
Morning Briefing Catchment Area Team Destination Distance
(km) Travel Time
#
Participants
Arrival Time at
Outreach Post
07:00 Tulemane
(Intervention)
A Musipazi 36 1 hr 9 08:00
B Kalambo 41 3 hrs 9 09:00
C Namukale 45 2 hrs 30 mins 4 08:55
Tuesday October 28th (Research Day 6)
Morning Briefing Catchment Area Team Destination Distance
(km) Travel Time
#
Participants
Arrival Time at
Outreach Post
08:30 Tulemane
(Intervention)
A Isanya 10 15 mins 13 09:00
B St Paul 9 10 mins 9 08:55
C Maround 5 7 mins 19 08:50
Wednesday Oct 29th
Buffer Day 2
Teams should be using this day to prepare leave in the evening to Mambwe Mission and spend 3 nights there to return to Mbala late Saturday
evening Please note that there will not be access to electricity
Thursday October 30th (Research Day 7)

93
Morning Briefing Catchment Area Team Destination Distance
(km) Travel Time
#
Participants
Arrival Time at
Outreach Post
07:00 Mpande
(Intervention)
A Chikunta 123 45 mins 6 08:00
B Nzelani 127 2 hrs 11 09:15
C Static 109 1 hr 30 mins 19 08:45
Friday October 31st (Research Day 8)
Morning Briefing Catchment Area Team Destination Distance
(km) Travel Time
#
Participants
Arrival Time at
Outreach Post
Departure: 05:30 Mpande
(Intervention)
A Chindo 147 3 hrs 20 mins 8 08:50
07:00 B Satoka 131 2 hrs 15 09:15
C Kapufi 135 1 hr 15 mins 11 08:30
Saturday November 1st (Research Day 9)
Morning Briefing Catchment Area Team Destination Distance
(km) Travel Time
#
Participants
Arrival Time at
Outreach Post
08:00 Mambwe Mission
(Intervention)
A + C Nsindano 147 45 mins 16 09:00
B Mutonga 131 20 mins 7 08:35
Sunday November 2nd
Sunday
Monday November 3rd (Research Day 10)
Morning Briefing Catchment Area Team Destination Distance
(km) Travel Time
#
Participants
Arrival Time at
Outreach Post
06:00 Mambwe Mission
(Intervention)
A Ilondola 84 3 hrs 12 09:15
B + C Static 68 2 hrs 55 mins 30 08:55
Tuesday November 4th (Research Day 11)
Morning Briefing Catchment Area Team Destination Distance
(km) Travel Time
#
Participants
Arrival Time at
Outreach Post
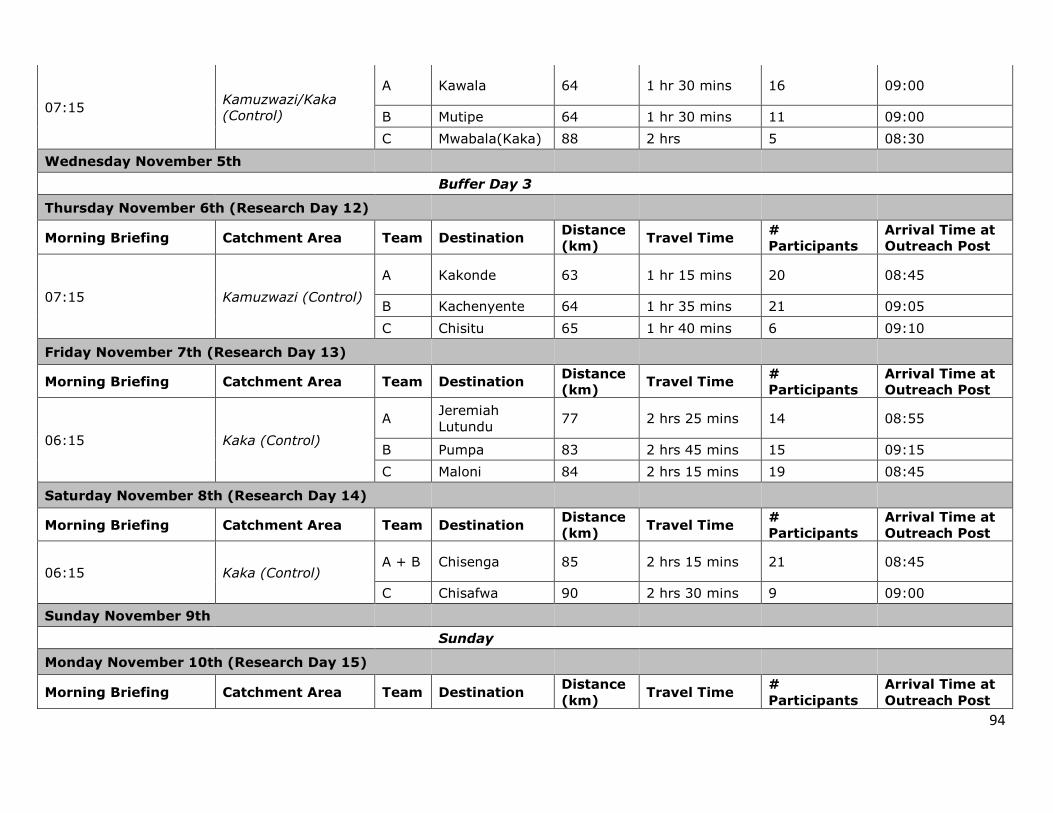
94
07:15 Kamuzwazi/Kaka
(Control)
A Kawala 64 1 hr 30 mins 16 09:00
B Mutipe 64 1 hr 30 mins 11 09:00
C Mwabala(Kaka) 88 2 hrs 5 08:30
Wednesday November 5th
Buffer Day 3
Thursday November 6th (Research Day 12)
Morning Briefing Catchment Area Team Destination Distance
(km) Travel Time
#
Participants
Arrival Time at
Outreach Post
07:15 Kamuzwazi (Control)
A Kakonde 63 1 hr 15 mins 20 08:45
B Kachenyente 64 1 hr 35 mins 21 09:05
C Chisitu 65 1 hr 40 mins 6 09:10
Friday November 7th (Research Day 13)
Morning Briefing Catchment Area Team Destination Distance
(km) Travel Time
#
Participants
Arrival Time at
Outreach Post
06:15 Kaka (Control)
A Jeremiah
Lutundu 77 2 hrs 25 mins 14 08:55
B Pumpa 83 2 hrs 45 mins 15 09:15
C Maloni 84 2 hrs 15 mins 19 08:45
Saturday November 8th (Research Day 14)
Morning Briefing Catchment Area Team Destination Distance
(km) Travel Time
#
Participants
Arrival Time at
Outreach Post
06:15 Kaka (Control) A + B Chisenga 85 2 hrs 15 mins 21 08:45
C Chisafwa 90 2 hrs 30 mins 9 09:00
Sunday November 9th
Sunday
Monday November 10th (Research Day 15)
Morning Briefing Catchment Area Team Destination Distance
(km) Travel Time
#
Participants
Arrival Time at
Outreach Post

95
06:30 Senga (Control)
A Lusale 71 1 hr 45 mins 14 08:30
B Mipangala 79 2 hrs 30 mins 3 09:00
C Muzizi 73 2 hrs 18 08:45
12:30 Senga (Control)
B Kapoli 74 2 hrs 45 mins 9 09:30
B Kalinda 91 2 hrs 15 mins 11 08:45
C Musombizi 78 1 hr 45 mins 10 08:15
Wednesday November 12th (Research Day 16)
Morning Briefing Catchment Area Team Destination Distance
(km) Travel Time
#
Participants
Arrival Time at
Outreach Post
07:45 Nondo (Control)
A Chomba 102 1 hr 10 09:00
B Kanyambi 108 1 hr 10 mins 9 09:10
C Mwiluzi 103 40 mins 15 08:40
Thursday November 13th (Reseach Day 17)
Morning Briefing Catchment Area Team Destination Distance
(km) Travel Time
#
Participants
Arrival Time at
Outreach Post
Departure: 06:15
Nondo (Control)
A Shikulu
Musonda 118 2 hrs 40 mins 12 08:55
7:15 B Chikoti 111 1 hr 30 mins 12 09:00
C Static 93 1 hr 22 08:30
Friday November 14th
Final Data Entry and
Validation
Saturday November 15th
Travel to Lusaka

96
Appendix 5. TDRC Approval Letter

97
Appendix 6. CREB Approval Letter

98
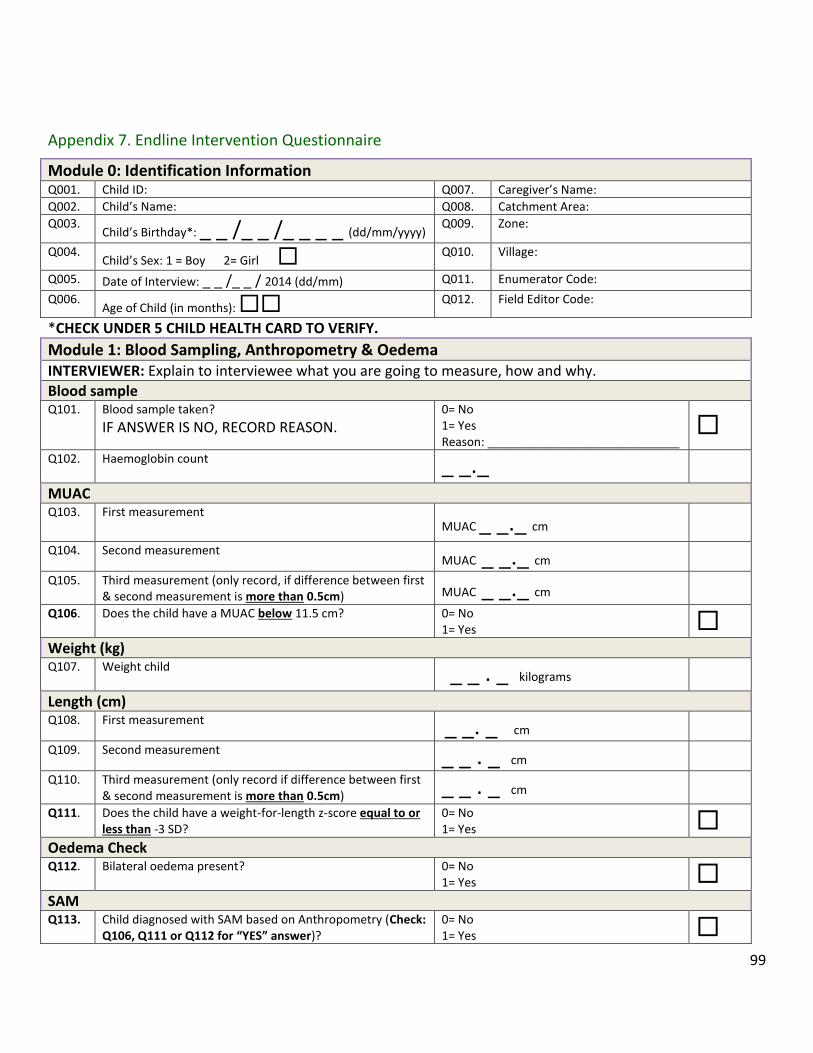
99
Appendix 7. Endline Intervention Questionnaire
Module 0: Identification Information Q001. Child ID: Q007. Caregiver’s Name:
Q002. Child’s Name: Q008. Catchment Area:
Q003. Child’s Birthday*: _ _ /_ _ /_ _ _ _ (dd/mm/yyyy) Q009. Zone:
Q004. Child’s Sex: 1 = Boy 2= Girl
Q010. Village:
Q005. Date of Interview: _ _ /_ _ / 2014 (dd/mm) Q011. Enumerator Code:
Q006. Age of Child (in months):
Q012. Field Editor Code:
*CHECK UNDER 5 CHILD HEALTH CARD TO VERIFY.
Module 1: Blood Sampling, Anthropometry & Oedema INTERVIEWER: Explain to interviewee what you are going to measure, how and why.
Blood sample Q101. Blood sample taken?
IF ANSWER IS NO, RECORD REASON. 0= No 1= Yes Reason: _____________________________
Q102. Haemoglobin count _ _._ MUAC Q103. First measurement
MUAC _ _._ cm Q104. Second measurement
MUAC _ _._ cm Q105. Third measurement (only record, if difference between first
& second measurement is more than 0.5cm) MUAC _ _._ cm Q106. Does the child have a MUAC below 11.5 cm? 0= No
1= Yes Weight (kg) Q107. Weight child
_ _ . _ kilograms Length (cm) Q108. First measurement
_ _. _ cm Q109. Second measurement _ _ . _ cm Q110. Third measurement (only record if difference between first
& second measurement is more than 0.5cm) _ _ . _ cm Q111. Does the child have a weight-for-length z-score equal to or
less than -3 SD? 0= No 1= Yes
Oedema Check Q112. Bilateral oedema present? 0= No
1= Yes SAM Q113. Child diagnosed with SAM based on Anthropometry (Check:
Q106, Q111 or Q112 for “YES” answer)? 0= No 1= Yes

100
INTERVIEWER: Thank you for meeting with us today and participating in this study. There are no right or wrong answers to the questions. We are here to learn about your experiences using Chipolopolo. If you cannot or do not want to answer any of the questions just let us know and we will go on to the next question. We really appreciate your time and your participation. May we start the interview now?
Module 2: Chipolopolo Use Part I: Utilization & Adherence Q201. Has (CHILD’S NAME) ever consumed
Chipolopolo? 0= No See Field Editor or UBC team member 1 = Yes
Q202. Is (NAME OF CHILD) currently consuming Chipolopolo?
0 = No, child consumed Chipolopolo for a time when it was first introduced but has since stopped and caregiver is not planning on resuming use. 1 = Yes, (NAME OF CHILD) is still consuming Chipolopolo skip to Q205.
Q203. If no, When was the last time you added Chipolopolo to (NAME OF CHILD’S) food? Response: ___________________________ ____________________________________ ____________________________________
1= Less than a week (not planning on resuming use)
2= Less than a month Q203a. Record weeks
3= Over one month Q203b. Record months
Q204. Why did you stop mixing Chipolopolo to (NAME OF CHILD’S) food?
DO NOT READ OPTIONS ALOUD.
PROBE TO GET AS MUCH DETAIL AS POSSIBLE. RECORD ALL GIVEN ANSWERS BY RECORDING NUMBERS IN THE
CORRESPONDING BOXES.
1 = The colour of the Chipolopolo was brown/black (spoiled) 2 = Going to the health facility/outreach post to collect Chipolopolo took too much time/effort 3 = It took too much extra time/effort to prepare food using Chipolopolo 4 = I was too busy 5 = Community and/or family members were unsupportive/discouraged me from using Chipolopolo 6 = Child did not like the food mixed with Chipolopolo 7 = Chipolopolo stopped being available in our community/distribution of Chipolopolo was disrupted 8 = I kept forgetting to give Chipolopolo so I stopped giving 9 = Believe that Chipolopolo is harmful to the child 10 = Child’s stool turned black/darker 11 = The Chipolopolo gave my child diarrhoea 12 = The Chipolopolo gave my child a skin rash 13 = The Chipolopolo gave my child an illness/made child sick 14 = Child turned 23 months so is now too old for Chipolopolo 99 = Other—Specify: _______________________________
Q205. How often do you/did you mix Chipolopolo with (NAME OF CHILD’s) food on average over the course of one week?
DO NOT READ OPTIONS ALOUD.
1= Every day 2= 3-4 times every week (every other day) 3= Once a week 4= Irregular (differs from week to week) 77= I don’t know 99= Other – specify: _______________________________

101
Q206.
Have you ever taken a break from giving Chipolopolo to (NAME OF CHILD) for more than 4 days?
0 = No skip to Q208. 1 = Yes
Q207. If yes: Can you tell me the reason(s) why you took a break from giving Chipolopolo for more than 4 days?
DO NOT READ OPTIONS ALOUD. PROMPT FOR MORE.
RECORD ALL GIVEN ANSWERS BY RECORDING NUMBERS IN THE CORRESPONDING BOXES.
1 = Child was sick 2 = I was not at home 3 = Child did not like the food mixed with Chipolopolo 4 = I forgot to give Chipolopolo to child 5 = I lost the Chipolopolo /it was stolen 6 = I did not want my child using Chipolopolo 7 = I ran out of Chipolopolo 8 = Community and/or family members were unsupportive/discouraged me from using Chipolopolo 9 = I was too busy 10= There was no distribution 99 = Other – Specify: _____________________________
Q208. Were ALL of the Chipolopolo sachets that you received consumed only by (NAME OF CHILD)?
0 = No 1 = Yes (all 30 sachets in every box received were consumed by only the child in the study) skip to Q211.
Q209. If no: how many, on average, of the 30
sachets contained in each box, were consumed only by (NAME OF CHILD)?
Avg. number of sachets consumed by child in each box
Q210. If no: What happened to the sachets that
were not consumed by (NAME OF CHILD)?
DO NOT READ OPTIONS ALOUD. PROMPT FOR MORE.
RECORD ALL GIVEN ANSWERS BY RECORDING NUMBERS IN THE CORRESPONDING BOXES.
1 = Eaten by older siblings 2 = Eaten by younger siblings 3 = Eaten by other family members (e.g. father, aunt, grandmother) 4 = Given to neighbour 5 = Eaten by neighbour’s child 6 = Thrown away 7 = Lost 8 = Stolen 9 = Spoiled 99 = Others—Specify: _____________________________
Q211. Did you feel pressure to share Chipolopolo, or food mixed with Chipolopolo, with other family members or community members?
0 = No skip to Q213. 1 = Yes

102
Q212. If yes: who made you feel this way?
DO NOT READ OPTIONS ALOUD. PROMPT FOR MORE.
RECORD ALL GIVEN ANSWERS BY RECORDING NUMBERS IN THE CORRESPONDING BOXES.
1 = Older siblings 2 = Younger siblings 3 = Father of child 4 = Grandparents 5 = Neighbour or friends’s children 6 = Other family members (e.g. aunt, uncle) 7 = Other community members 8 = Mother of child 99 = Other – Specify: ______________________________
Q213. Did you find Chipolopolo easy to mix with (NAME OF CHILD)’s food?
0 = No 1 = Yes skip to Q215.
Q214. If no: What problems have you had mixing Chipolopolo with your child’s food?
DO NOT READ OPTIONS ALOUD. PROMPT FOR MORE.
RECORD ALL GIVEN ANSWERS BY RECORDING NUMBERS IN THE CORRESPONDING BOXES.
1 = Instructions were complicated/difficult to understand 2 = Sachet was hard to open 3 = Contents of the sachet did not mix well in the food 4 = Contents of sachet were clumped together 5 = Food consistency made it difficult to mix 6 = Changed colour or taste 99 = Other—Specify: _____________________________ _______________________________________________
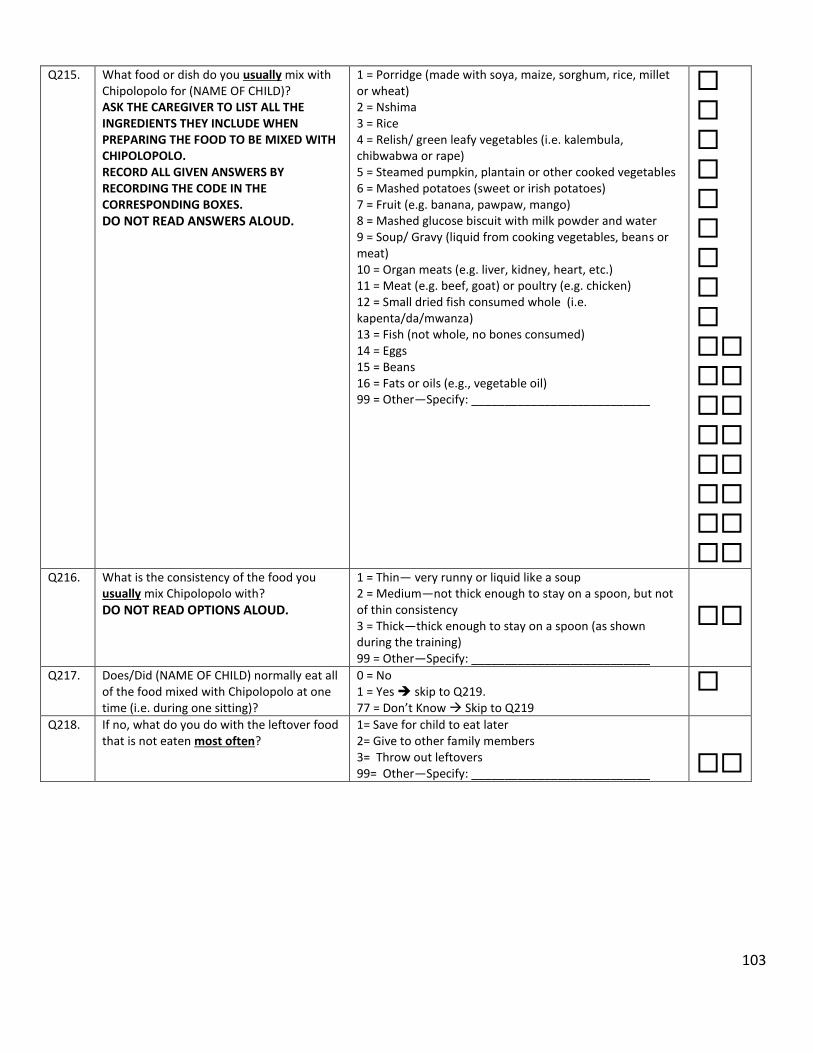
103
Q215. What food or dish do you usually mix with Chipolopolo for (NAME OF CHILD)? ASK THE CAREGIVER TO LIST ALL THE INGREDIENTS THEY INCLUDE WHEN PREPARING THE FOOD TO BE MIXED WITH CHIPOLOPOLO. RECORD ALL GIVEN ANSWERS BY RECORDING THE CODE IN THE CORRESPONDING BOXES.
DO NOT READ ANSWERS ALOUD.
1 = Porridge (made with soya, maize, sorghum, rice, millet or wheat) 2 = Nshima 3 = Rice 4 = Relish/ green leafy vegetables (i.e. kalembula, chibwabwa or rape) 5 = Steamed pumpkin, plantain or other cooked vegetables 6 = Mashed potatoes (sweet or irish potatoes) 7 = Fruit (e.g. banana, pawpaw, mango) 8 = Mashed glucose biscuit with milk powder and water 9 = Soup/ Gravy (liquid from cooking vegetables, beans or meat) 10 = Organ meats (e.g. liver, kidney, heart, etc.) 11 = Meat (e.g. beef, goat) or poultry (e.g. chicken) 12 = Small dried fish consumed whole (i.e. kapenta/da/mwanza) 13 = Fish (not whole, no bones consumed) 14 = Eggs 15 = Beans 16 = Fats or oils (e.g., vegetable oil) 99 = Other—Specify: ___________________________
Q216. What is the consistency of the food you usually mix Chipolopolo with?
DO NOT READ OPTIONS ALOUD.
1 = Thin— very runny or liquid like a soup 2 = Medium—not thick enough to stay on a spoon, but not of thin consistency 3 = Thick—thick enough to stay on a spoon (as shown during the training) 99 = Other—Specify: ___________________________
Q217. Does/Did (NAME OF CHILD) normally eat all of the food mixed with Chipolopolo at one time (i.e. during one sitting)?
0 = No 1 = Yes skip to Q219. 77 = Don’t Know Skip to Q219
Q218. If no, what do you do with the leftover food that is not eaten most often?
1= Save for child to eat later 2= Give to other family members 3= Throw out leftovers 99= Other—Specify: ___________________________

104
Q219. What motivates (or motivated) you to give Chipolopolo to (NAME OF CHILD)?
DO NOT READ OPTIONS ALOUD. PROMPT FOR MORE.
RECORD ALL GIVEN ANSWERS BY RECORDING NUMBERS IN THE CORRESPONDING BOXES.
1 = Nothing 2 = Chipolopolo is important to keep children healthy 3 = I was given the Chipolopolo for free 4 = Support from other mothers/caregivers using the product 5 = Support from other community members, friends, or family members (not mothers) 6 = Support from health care providers (e.g. nurse, MSG members, community health officer) 7 = The government recommended the use of Chipolopolo 99 = Other – Specify: ____________________________
Part II: Perceived Changes Q220. Have you noticed any changes to the food
after mixing it with Chipolopolo? 0 = No skip to Q227. 1 = Yes 77 = Don’t Know skip to Q227.
Q221. If yes: Approximately how long after you
mixed Chipolopolo into the food did you notice a change in the food?
DO NOT READ OPTIONS ALOUD.
1 = Right away 2 = After 15 minutes 3 = After 30 minutes or longer 99 = Other—Specify: ___________________________
Q222. Was there a change in the taste of food after mixing in Chipolopolo?
0 = No skip to Q224. 1 = Yes 77 = Don’t know skip to Q224.
Q223. If yes: How did the taste of the food change
after Chipolopolo was mixed in?
DO NOT READ OPTIONS ALOUD.
1 = Food became bitter 2 = Food became sweeter 3 = Food tastes bad 4 = Food tastes like medicine 99 = Other – Specify: _______________________________
Q224. Have you noticed any change in the colour of (NAME OF CHILD)’s food after the Chipolopolo is added?
0 = No skip to Q226. 1 = Yes
Q225. How did the colour of (NAME OF CHILD)’s food change after Chipolopolo was added?
DO NOT READ OPTIONS ALOUD.
1 = Food turned yellow/orange 2 = Food turned brown 3 = Food turned green 4 = Food turned black 5 = Food turned darker 99 = Other — Specify: ______________________________
Q226. ONLY ASK QUESTION IF CHANGE IN TASTE AND/OR COLOUR WAS NOTICED Did (NAME OF CHILD) ever refuse to eat his/her food as a result of the change in colour and/or taste?
0 = No skip to Q227. 1 = Yes, all the time 2 = Some of the time/not always
Q226a. If yes: When did the child refuse food mixed with Chipolopolo due to the changes mentioned?
READ OPTIONS ALOUD.
1= Child refused food mixed with Chipolopolo only BEFORE it was replaced 2= Child refused food mixed with Chipolopolo only AFTER it was replaced 3= Child refused food mixed with Chipolopolo BEFORE and AFTER it was replaced

105
Q227. ASK ALL CAREGIVERS: Have you noticed any side effects or changes in (NAME OF CHILD)’s health or behaviour since he/she started eating food mixed with Chipolopolo?
0 = No skip to Q229. 1 = Yes
Q228. If yes: What kinds of side effects or changes in health or behaviour have you noticed in (NAME OF CHILD)?
DO NOT READ OPTIONS ALOUD. PROMPT FOR MORE.
RECORD ALL GIVEN ANSWERS BY RECORDING NUMBERS IN THE CORRESPONDING BOXES.
Changes in health or behaviour 1 = Child is happier 2 = Child is stronger 3 = Child is more active 4 = Child has an increased/improved appetite 5 = Child is more alert 6 = Child is growing well 7 = Child is apathetic or not interested (i.e. child doesn’t play, has less energy) 8 = Child cries a lot 9 = Child is sick
Side effects 10 = Child’s stool became darker 11 = Diarrhoea 12 = Constipation 13 = Vomiting/nausea 14 = Fever 99 = Other – Specify: _______________________________
Q229. Have you noticed a change in (NAME OF
CHILD)’s appetite since you began adding Chipolopolo to his/her food?
0 = No skip to Q231. 1 = Yes
Q230. If yes: What change in appetite have you noticed since you began adding Chipolopolo to (NAME OF CHILD)’s food?
DO NOT READ OPTIONS ALOUD.
1 = Appetite increased 2 = Appetite decreased 99 = Other (e.g. wanted different foods) – Specify: _________________________________________________
Q231. Have you noticed a change in (NAME OF CHILD)’s activity level since you began adding Chipolopolo to his/her food?
0 = No skip to Q233. 1 = Yes
Q232. If yes: What change in activity have you noticed since you began adding Chipolopolo to (NAME OF CHILD)’s food?
DO NOT READ OPTIONS ALOUD
1 = More active 2 = Less active 99 = Other – Specify: _______________________________
Q233. Does (NAME OF CHILD) respond differently to food mixed with Chipolopolo than to the same food without Chipolopolo?
0 = No skip to Q235. 1 = Yes
Q234. If yes: How or in what way does (NAME OF CHILD) respond differently to the food
1 = Child refuses to eat food 2 = Child seems to like the food more (prefers the food)

106
mixed with Chipolopolo than to the same food without Chipolopolo during feeding?
DO NOT READ OPTIONS ALOUD. PROMPT FOR MORE.
RECORD ALL GIVEN ANSWERS BY RECORDING NUMBERS IN THE CORRESPONDING BOXES.
3 = Child eats the food faster 4 = Child eats the food slower 5 = Eats more food 6 = Eats less food 99 = Other – Specify: _______________________________
Q235. Overall, do you think (NAME OF CHILD)’s health has changed since you started adding Chipolopolo to his/her food?
0 = No skip to Q237. 1 = Yes
Q236. If yes, how do you think your child’s health has changed?
1= Improved 2= Worsened 99= Other – describe: ______________________________
Part III: Acceptability Q237. Have any family members or community
members discouraged you from adding Chipolopolo to (NAME OF CHILD)’s food?
0 = No skip to Q239. 1 = Yes
Q238. If yes: Which of your family or community members (a) discouraged you from adding Chipolopolo to your child’s food and why (b)?
DO NOT READ OPTIONS ALOUD. PROMPT FOR MORE.
RECORD ALL GIVEN ANSWERS BY RECORDING NUMBERS IN THE CORRESPONDING BOXES. RECORD ‘WHO‘ IN BOXES 1a or 2a RECORD ‘WHY’ IN BOXES 1b or 2b
1a. Family/community member not supportive: RECORD FAMILY MEMBER BY WRITING NUMBER IN CORRESPONDING BOX 1a. 1 = Mother of child 2 = Father of child 3 = Grandparent 4 = Aunt or uncle 5 = Sibling of child 6 = Cousin of child 7 = Community leader/chief 8 = District offical 9 = Mother Support Group member 10 = Religious leader 11 = Health worker (e.g. nurse, health assistant, midwife) 12 = Friend or neighbour 99 = Other—Specify:_______________________________ 1b. Reason for not supporting: DO NOT READ ANSWERS ALOUD. RECORD ALL GIVEN ANSWERS BY RECORDING THE NUMBER(S) IN THE CORRESPONDING BOXES FOR 1b 1 = Believe that Chipolopolo is harmful to the child 2 = Are suspicious of new or unfamiliar products 3 = Do not understand the importance of Chipolopolo 4 = Believe traditional medicine is better 5 = Believe diet is good enough 6 = Are suspicious of people from outside the community 7 = Are suspicious of packaged foods and associated illnesses 8 = Because it is a government project 9 = Foreign/imported product 10 = Do not know how to use the Chipolopolo
1a:
1b:

107
IF THERE ARE MORE THAN 2 INDIVIDUALS WHO DO NOT SUPPORT THE USE OF CHIPOLOPOLO, RECORD THE EXTRAS UNDER ‘RESEARCHER OBSERVATIONS’ ON THE LAST PAGE OF THIS SURVEY
77 = Don’t know 99 = Other—Specify: _______________________________ 2a. Family/community member not supportive: RECORD FAMILY MEMBER BY WRITING NUMBER IN CORRESPONDING BOX 2a. 0 = Only one person discouraged me 1 = Mother of child 2 = Father of child 3 = Grandparent 4 = Aunt or uncle 5 = Sibling of child 6 = Cousin of child 7 = Community leader/chief 8 = District offical 9 = Mother Support Group member 10 = Religious leader 11 = Health worker (e.g. nurse, health assistant, midwife) 12 = Friend or neighbour 99 = Other—Specify:_______________________________ 2b. Reason for not supporting: DO NOT READ ANSWERS ALOUD. RECORD ALL GIVEN ANSWERS BY RECORDING THE NUMBER(S) IN THE CORRESPONDING BOXES FOR 2b 1 = Believe that Chipolopolo is harmful to the child 2 = Are suspicious of new or unfamiliar products 3 = Do not understand the importance of Chipolopolo 4 = Believe traditional medicine is better 5 = Believe diet is good enough 6 = Are suspicious of people from outside the community 7 = Are suspicious of packaged foods and associated illnesses 8 = Because it is a government project 9 = Foreign/imported product 10 = Do not know how to use the Chipolopolo 77 = Don’t know 99 = Other—Specify: ______________________________ ________________________________________________
2a:
2b:
Q239. Have you ever heard any rumours (negative things) about Chipolopolo?
0 = No skip to Q241. 1 = Yes
Q240. If yes: Can you tell me what rumours you have heard?
DO NOT READ ANSWERS ALOUD. RECORD ALL GIVEN ANSWERS BY WRITING THE NUMBERS IN THE CORRESPONDING BOXES
1 = Chipolopolo will make children sterile 2 = Chipolopolo are associated with witchcraft/satanism 3 = Chipolopolo will give children diarrhoea 4 = Chipolopolo will make children ill 5 = Chipolopolo are harmful/poisonous/kill 6 = Chipolopolo will give children skin rash 7 = Chipolopolo will cause children’s hair to fall out 8 = Chipolopolo causes the gastrointestinal tract to rot
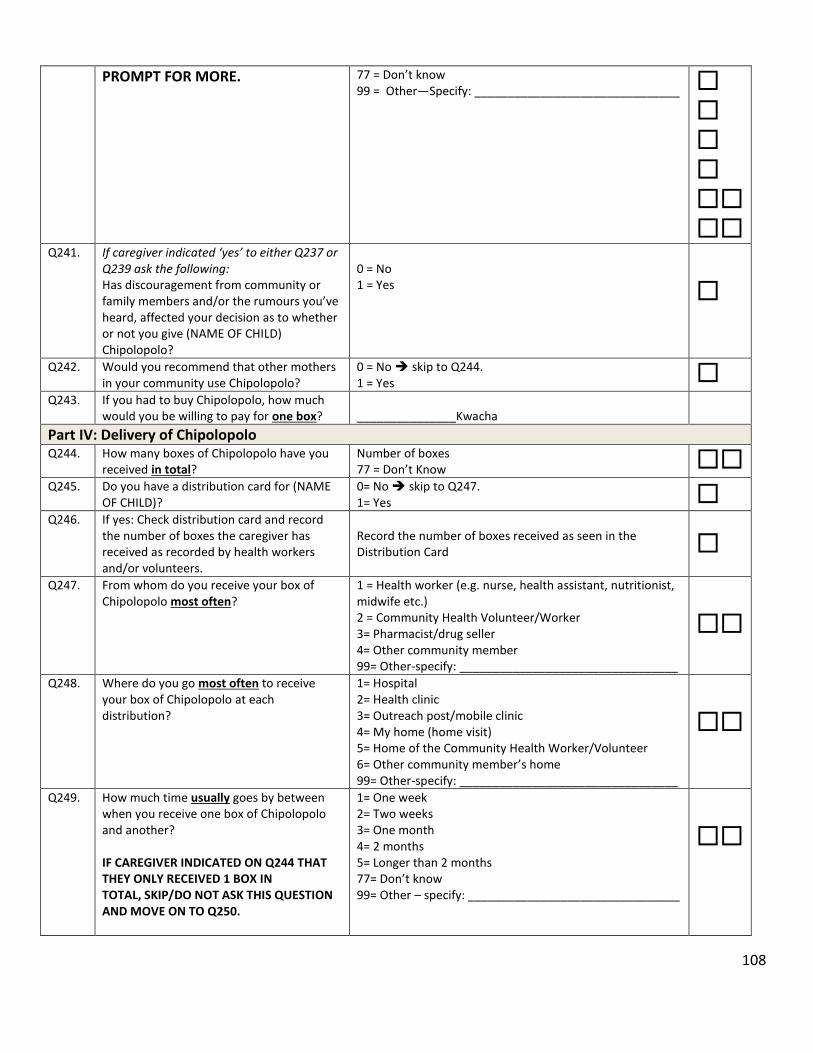
108
PROMPT FOR MORE.
77 = Don’t know 99 = Other—Specify: _______________________________
Q241. If caregiver indicated ‘yes’ to either Q237 or Q239 ask the following: Has discouragement from community or family members and/or the rumours you’ve heard, affected your decision as to whether or not you give (NAME OF CHILD) Chipolopolo?
0 = No 1 = Yes
Q242. Would you recommend that other mothers in your community use Chipolopolo?
0 = No skip to Q244. 1 = Yes
Q243. If you had to buy Chipolopolo, how much would you be willing to pay for one box?
_______________Kwacha
Part IV: Delivery of Chipolopolo Q244. How many boxes of Chipolopolo have you
received in total? Number of boxes 77 = Don’t Know
Q245. Do you have a distribution card for (NAME OF CHILD)?
0= No skip to Q247. 1= Yes
Q246. If yes: Check distribution card and record the number of boxes the caregiver has received as recorded by health workers and/or volunteers.
Record the number of boxes received as seen in the Distribution Card
Q247. From whom do you receive your box of Chipolopolo most often?
1 = Health worker (e.g. nurse, health assistant, nutritionist, midwife etc.) 2 = Community Health Volunteer/Worker 3= Pharmacist/drug seller 4= Other community member 99= Other-specify: _________________________________
Q248. Where do you go most often to receive your box of Chipolopolo at each distribution?
1= Hospital 2= Health clinic 3= Outreach post/mobile clinic 4= My home (home visit) 5= Home of the Community Health Worker/Volunteer 6= Other community member’s home 99= Other-specify: _________________________________
Q249. How much time usually goes by between when you receive one box of Chipolopolo and another? IF CAREGIVER INDICATED ON Q244 THAT THEY ONLY RECEIVED 1 BOX IN TOTAL, SKIP/DO NOT ASK THIS QUESTION AND MOVE ON TO Q250.
1= One week 2= Two weeks 3= One month 4= 2 months 5= Longer than 2 months 77= Don’t know 99= Other – specify: ________________________________

109
PROBE FOR AS MUCH DETAIL AS POSSIBLE AND RECORD ANSWER IN THE SPACE PROVIDED.
Q250. Did you ever experience any problems at or following a Chipolopolo distribution?
0= No skip to Q252. 1= Yes
Q251. If yes, what problems did you experience at or following the Chipolopolo distribution?
RECORD ALL GIVEN ANSWERS BY RECORDING NUMBERS IN THE
CORRESPONDING BOXES.
1= Person responsible (i.e. health worker, volunteer, etc.) was not there to give out Chipolopolo on the proper day 2 = We were told the wrong date to pick up Chipolopolo 3= We were not told when we could pick up Chipolopolo 4= We had to wait a long time to receive Chipolopolo 5= I discovered that the Chipolopolo was spoilt (powder had turned black) 6= Stock out 99= Other-specify: _________________________________
Part V: Delivery of Chipolopolo Messages including Training and Communication Materials Q252. Have you ever received messages regarding
Chipolopolo at community gatherings? 0 = No skip to Q254. 1 = Yes
Q253. If yes: Where were you when you received information regarding Chipolopolo?
DO NOT READ OPTIONS ALOUD. PROMPT FOR AS MANY REASONS AS THE CAREGIVER CAN REMEMBER. RECORD ALL GIVEN ANSWERS BY RECORDING NUMBERS IN THE CORRESPONDING BOXES
1 = Immunizations/Vitamin A supplementation 2 = Church annoucements 3 = Meeting or other community leaders meeting 4 = Mother Support Group meetings 5 = Sporting event 6 = Youth meetings 7 = Market 99 = Other—Specify: _______________________________
Q254. Have you received any Chipolopolo-related materials or brochures? (e.g. family brochure)
0 = No skip to Q257. 1 = Yes
Q255. If yes: Were these information materials (e.g. pamphlets) useful?
0 = No 1 = Yes skip to Q257.
Q256. If no: Why have you not found these materials useful?
DO NOT READ OPTIONS ALOUD.
PROBE TO GET AS MUCH DETAIL AS POSSIBLE. RECORD ALL GIVEN ANSWERS BY RECORDING NUMBERS IN THE
CORRESPONDING BOXES.
1 = They are too complicated (hard to understand) 2 = I am illiterate 3 = Not enough information or text 4 = Too much text 5 = Not enough pictures 6 = Pictures are unclear 99 = Other—Specify: _______________________________

110
Q257. Have you received training (either as an individual or as part of a group) on how to use Chipolopolo?
0 = No skip to Module 3 1 = Yes
Q258. Did your training include a cooking demonstration using Chipolopolo?
0 = No 1 = Yes
Q259. Was the training you received useful? 0 = No 1 = Yes skip to Q261.
Q260. If no, why did you not find the training to be useful?
RECORD ALL GIVEN ANSWERS BY RECORDING NUMBERS IN THE
CORRESPONDING BOXES
1= It was too complicated 2= It was too long 3= Not enough information 4= It did not answer all my questions 99= Other-specify: _________________________________
Part VI: Knowledge of Chipolopolo Q261. Are you able to tell me some of the reasons
why you should add Chipolopolo to (NAME OF CHILD)’s food?
0 = No skip to Q263. 1 = Yes
Q262. If yes: What are some of the reasons why you should add Chipolopolo to (NAME OF CHILD)’S food?
DO NOT READ OPTIONS ALOUD. PROMPT FOR AS MANY REASONS AS THE CAREGIVER CAN REMEMBER. RECORD ALL GIVEN ANSWERS BY RECORDING NUMBERS IN THE CORRESPONDING BOXES
1 = Will help make my child strong, active and healthy (child plays more) 2 = Increased resistance to disease (get sick less often) 3 = Increased ability to learn 4 = Increased appetite 5 = Treat or prevent anaemia/increase blood 6 = Increased ability to develop 99 = Other – Specify: ______________________________
Q263. Can you describe how to use Chipolopolo, step by step, and mention any other instructions you can remember?
DO NOT READ OPTIONS ALOUD. PROMPT FOR AS MANY INSTRUCTIONS AS THE CAREGIVER CAN REMEMBER. (e.g. is there anything else you remember, any other instructions that you have not mentioned yet?) RECORD ALL GIVEN ANSWERS BY RECORDING NUMBERS IN THE CORRESPONDING BOXES.
1 = No, I can’t remember 2 = Wash hands (caregiver and child) and utensils with soap and clean water 3 = Shake sachet before opening, check for clumping
4 = DO NOT add to hot food 5 = DO NOT add to liquids or liquid foods 6 = Add entire contents of one sachet to child’s food 7 = Mix Chipolopolo with semi-solid, soft, or mashed foods 8 = Add Chipolopolo to a small portion of food—an amount a child can finish in one sitting 9 = Feed enitre contents to child within 30 minutes 10 = Storage—keep sachets in a cool, dry, clean place in the home 99 = Other – Specify: _______________________________

111
Q264. At what age should you start giving a child Chipolopolo?
DO NOT READ OPTIONS ALOUD.
1 = Before 6 months of age 2 = At 6 months of age 3 = Older than 6 months of age 99 = Other – Specify: ______________________________
Q265. What is the maximum number of Chipolopolo sachets (show example sachet) a child should consume in one day?
DO NOT READ OPTIONS ALOUD.
1 = One sachet a day 2 = More than one sachet a day 77 = Don’t know 99 = Other – Specify: ______________________________
Q266. When preparing a meal for your child, when should you add in Chipolopolo?
DO NOT READ OPTIONS ALOUD.
1 = During cooking 2 = Immediately after cooking 3 = After the food has cooled enough for the child to eat 77 = Don’t know 99 = Other—Specify: ______________________________
Q267. One sachet (show example sachet) of Chipolopolo mixed with food is meant for how many children?
DO NOT READ OPTIONS ALOUD.
1 = Only one child 2 = More than one child 77 = Don’t know 99 = Other – Specify: _____________________________
Q268. Can you add Chipolopolo to liquids or liquid foods like soup?
0 = No 1 = Yes 77 = I don’t know 99 = Other – Specify: _____________________________
Module 3: Mother’s Knowledge on IYCF & Anaemia Part I: IYCF Counselling Q301. Have healthcare providers ever talked to
you about breastfeeding or how to feed (NAME)?
0= No skip to Q308. 1= Yes
Q302. In the last two months, how many IYCF counselling sessions at an outreach point or health centre have you attended?
Record number of times If caregivers answers ‘0’ skip to Q308
Q303. Can you tell me what the topics of those
counselling sessions were?
PROBE AND RECORD AS MUCH DETAIL AS YOU CAN.
DO NOT READ ALOUD.
RECORD ALL GIVEN ANSWERS BY RECORDING NUMBERS IN THE
CORRESPONDING BOXES.
1 = Signs and symptoms of illnesses in children 2 = Breast feeding 3 = How to feed a child 4 = How to care for an ill child 5 = HIV counseling/support groups 6 = ANC or PNC counseling 7 = Family Planning 8 = Chipolopolo (MNP) 9 = Early child development 10= Proper hygiene and sanitation 99 = Other – Specify: ___________________________ ____________________________________________
Q304. Who most often conducted the counselling sessions you attended?
1 = Health worker (e.g. nurse, health assistant, nutritionist, midwife etc.)

112
DO NOT READ ALOUD.
2 = Community Health Worker/Volunteer 3 = Village Chief 4 = NGO worker (e.g. UNICEF, World Vision) 5 = District official 99 = Other – Specify: ________________________________ _________________________________________________
Q305. Where did the counselling sessions take place?
DO NOT READ ALOUD. RECORD ALL GIVEN ANSWERS BY RECORDING NUMBERS IN THE
CORRESPONDING BOXES.
1 = Health Centre 2 = Outreach Post 3 = Community Meetings / gathering place 4 = Home of Village Chief 5 = Home of a Community Health Volunteer 6 = School 7 = Market 8 = Church 9 = Home of another community member 99 = Other – Specify: _______________________________
Q306. Were you provided with brochures or materials to take home with you?
0= No skip to Q308. 1= Yes
Q307. If yes, what types of brochures did you receive?
RECORD ALL GIVEN ANSWERS BY RECORDING THE NUMBER IN THE CORRESPONDING BOX. DO NOT READ ALOUD. PROMPT FOR MORE.
1= Breastfeeding brochure 2= Complementary feeding brochure 3= Maternal nutrition brochure (ANC/PNC) 4= Recipes for complementary feeding 5 = Early Child Development 6= Chipolopolo family brochure 99= Other – Specify? ____________________________
Part II: IYCF Knowledge Q308 Can you tell me how long after birth a child
should start receiving breast milk/be put to the breast?
PLEASE RECORD CODE IN BOXES TO FAR RIGHT. DEPENDING ON ANSWER ALSO RECORD NUMBER OF HOURS OR DAYS.
1= Immediately (within one hour)
2= Hours Record number of hours Q308a. 3= Days Record number of days Q308b. 77= Don’t know
Q309. Can you tell me until what age a baby should receive only breast milk, that is, no other food, water or other fluids?
Record months 77= Don’t know
Q310. At what age (in months) should a child start receiving food in addition to breast milk?
Record months 77= Don’t know

113
Q311. Until what age (in months), or for how long should a child continue to receive breast milk?
Record age in months 77 = Don’t know
Q312. How many times should (NAME OF CHILD) be fed in one day?
Number of times (meals and snack in total) 77= Don’t know skip to Q314.
Q313. a) How many of these feedings should be a meal? b) How many of these feedings should be a snack?
Number of meals Number of snacks 77= Don’t know
Q314. Have you heard of the term “food groups” before?
0 = No skip to Q316. 1 = Yes
Q315. If yes: what different foods/ingredients would you use to make a nutritious meal for (NAME OF CHILD)? ASK THE CAREGIVER TO LIST THE INGREDIENTS OF THE MOST NURTITIOUS/DIETARY DIVERSE MEAL SHE MIGHT PREPARE FOR THE CHILD. CLASSIFY THESE IN THE APPROPRIATE FOOD GROUPS. List ingredients: ______________________ ____________________________________ ____________________________________ ____________________________________ ____________________________________
1 = Staple (grains, cassava, potatoes) 2 = Legumes (beans, chickpeas) 3 = Vegetables 4 = Fruits (i.e. pawpaws, mangoes, banana) 5 = Animal Source – (fish, chicken, beef, eggs) 6 = Dairy Products (milk, cheese) 7 = Fats (oils, butter) 77=Don’t Know 99 = Other – Specify?
Q316. Do you think it is important for (NAME OF CHILD) to consume different kinds of foods (foods from the different food groups)?
0 = No 1 = Yes 77 = Don’t know
Q317. Do you know what it means if a mother “actively feeds” her child?
0 = No skip to Q319. 1 = Yes
Q318. If yes: what does a mother do if she is actively feeding?
1 = Caregiver encourages the baby to eat (i.e. singing, talking to baby, playing with baby) 2 = Caregiver feeds the (NAME OF CHILD) or supervises (NAME OF CHILD) when he/she is eating 3 = Caregiver is patient in feeding the child (not force feeding) 77 = Don’t know 99 = Other – Specify? _______________________________
Part III: Knowledge of Anaemia Q319. Have you ever heard of a condition called
anaemia or ‘lack of blood’? 0= No skip to Module 4. 1= Yes
Q320. Can you identify some signs that a child has anaemia or ‘lack of blood’?
0= No skip to Q322. 1= Yes
Q321. If yes, please tell me some of the signs that a child has anaemia or a ‘lack of blood’?
RECORD ALL GIVEN ANSWERS BY RECORDING THE NUMBER IN THE CORRESPONDING BOX.
1= White/pale skin, eyes, nails, hands 2= Feeling faint, dizziness 3= Apathy/fatigue (child doesn’t play) 4= Oedema 5= Weight loss 6= Fever/high temperature

114
DO NOT READ ANSWERS ALOUD. PROMPT FOR MORE.
99= Other – Specify: _______________________________
Q322. Do you know what causes anaemia or ‘lack of blood’?
0= No skip to Q324. 1= Yes
Q323. If yes, what causes anaemia or ‘lack of blood’?
RECORD ALL GIVEN ANSWERS BY RECORDING THE NUMBER IN THE CORRESPONDING BOX. PROMPT FOR MORE. DO NOT READ ANSWERS ALOUD.
1= Malaria 2= Hookworms 3= Infection 4= Bleeding 5= Dietary (lack of iron in diet) 6= Diarrhoea 7= Dehydration 8= Vomiting 9= Not enough food 99= Other – Specify: _______________________________
Q324. Do you know of any foods that can prevent anaemia or ‘lack of blood’?
0= No skip to Q326. 1= Yes
Q325. If yes, please tell me what foods can prevent anaemia or ‘lack of blood’?
RECORD ALL GIVEN ANSWERS BY RECORDING THE NUMBER IN THE CORRESPONDING BOX. PROMPT FOR MORE. DO NOT READ ANSWERS ALOUD.
1= Organ meats (e.g. liver, kidney, heart) 2= Meat (e.g. beef, pork) or poultry (e.g. chicken) 3= Fresh or dried fish (e.g. kapenta, da/mwanza) 4= Green leafy vegetables (e.g. rape, chibwabwa, katapa) 5= Other vegetables or fruit (e.g. oranges, tomatoes) 6= Legumes (e.g. beans, lentils) 7= Tubers (e.g. potatoes) 8= Eggs 9= Colas 10= Avocado leaves/seeds 99= Others – Specify: ______________________________
Q326. Do you know of any non-dietary ways to prevent anaemia or ‘lack of blood’?
0 = No skip to Module 4. 1 = Yes
Q327. If yes: What are some non-dietary ways to prevent anaemia or ‘lack of blood’. IF RESPONDENT REPLIES WITH AN ANSWER
1 = Sleeping under bed nets (mosquito nets) 2 = Deworming 3 = Practicing good hygiene
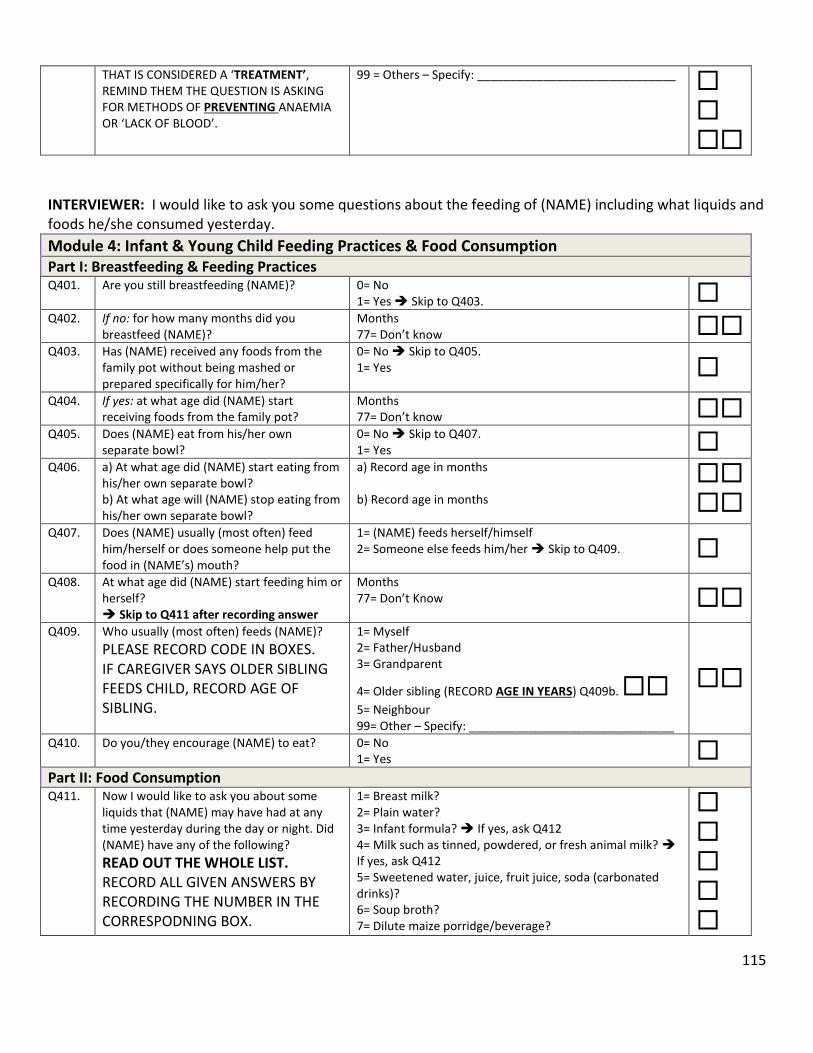
115
THAT IS CONSIDERED A ‘TREATMENT’, REMIND THEM THE QUESTION IS ASKING FOR METHODS OF PREVENTING ANAEMIA OR ‘LACK OF BLOOD’.
99 = Others – Specify: ______________________________
INTERVIEWER: I would like to ask you some questions about the feeding of (NAME) including what liquids and foods he/she consumed yesterday.
Module 4: Infant & Young Child Feeding Practices & Food Consumption Part I: Breastfeeding & Feeding Practices Q401. Are you still breastfeeding (NAME)? 0= No
1= Yes Skip to Q403. Q402. If no: for how many months did you
breastfeed (NAME)? Months 77= Don’t know
Q403. Has (NAME) received any foods from the family pot without being mashed or prepared specifically for him/her?
0= No Skip to Q405. 1= Yes
Q404. If yes: at what age did (NAME) start receiving foods from the family pot?
Months 77= Don’t know
Q405. Does (NAME) eat from his/her own separate bowl?
0= No Skip to Q407. 1= Yes
Q406. a) At what age did (NAME) start eating from his/her own separate bowl? b) At what age will (NAME) stop eating from his/her own separate bowl?
a) Record age in months b) Record age in months
Q407. Does (NAME) usually (most often) feed him/herself or does someone help put the food in (NAME’s) mouth?
1= (NAME) feeds herself/himself 2= Someone else feeds him/her Skip to Q409.
Q408. At what age did (NAME) start feeding him or herself? Skip to Q411 after recording answer
Months 77= Don’t Know
Q409. Who usually (most often) feeds (NAME)?
PLEASE RECORD CODE IN BOXES. IF CAREGIVER SAYS OLDER SIBLING FEEDS CHILD, RECORD AGE OF SIBLING.
1= Myself 2= Father/Husband 3= Grandparent
4= Older sibling (RECORD AGE IN YEARS) Q409b.
5= Neighbour 99= Other – Specify: _______________________________
Q410. Do you/they encourage (NAME) to eat? 0= No 1= Yes
Part II: Food Consumption Q411. Now I would like to ask you about some
liquids that (NAME) may have had at any time yesterday during the day or night. Did (NAME) have any of the following?
READ OUT THE WHOLE LIST. RECORD ALL GIVEN ANSWERS BY RECORDING THE NUMBER IN THE CORRESPODNING BOX.
1= Breast milk? 2= Plain water? 3= Infant formula? If yes, ask Q412 4= Milk such as tinned, powdered, or fresh animal milk? If yes, ask Q412 5= Sweetened water, juice, fruit juice, soda (carbonated drinks)? 6= Soup broth? 7= Dilute maize porridge/beverage?
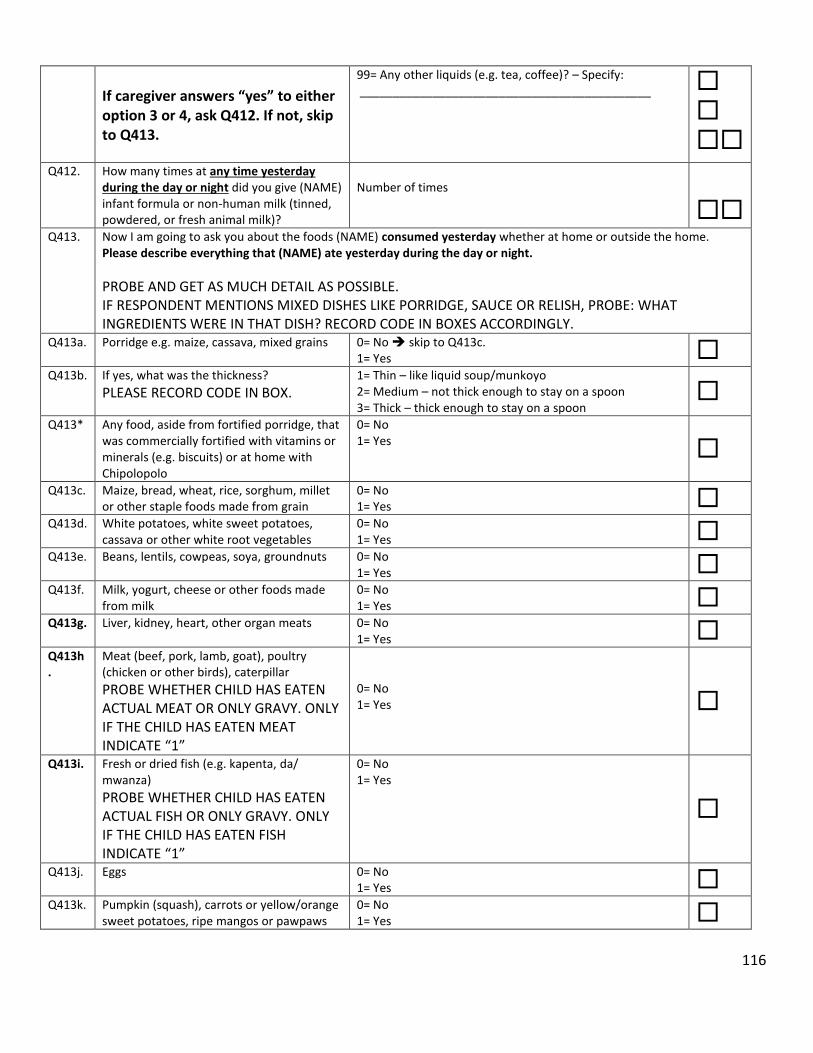
116
If caregiver answers “yes” to either option 3 or 4, ask Q412. If not, skip to Q413.
99= Any other liquids (e.g. tea, coffee)? – Specify: ____________________________________________
Q412. How many times at any time yesterday during the day or night did you give (NAME) infant formula or non-human milk (tinned, powdered, or fresh animal milk)?
Number of times
Q413. Now I am going to ask you about the foods (NAME) consumed yesterday whether at home or outside the home. Please describe everything that (NAME) ate yesterday during the day or night.
PROBE AND GET AS MUCH DETAIL AS POSSIBLE. IF RESPONDENT MENTIONS MIXED DISHES LIKE PORRIDGE, SAUCE OR RELISH, PROBE: WHAT INGREDIENTS WERE IN THAT DISH? RECORD CODE IN BOXES ACCORDINGLY.
Q413a. Porridge e.g. maize, cassava, mixed grains 0= No skip to Q413c. 1= Yes
Q413b. If yes, what was the thickness?
PLEASE RECORD CODE IN BOX. 1= Thin – like liquid soup/munkoyo 2= Medium – not thick enough to stay on a spoon 3= Thick – thick enough to stay on a spoon
Q413* Any food, aside from fortified porridge, that
was commercially fortified with vitamins or minerals (e.g. biscuits) or at home with Chipolopolo
0= No 1= Yes
Q413c. Maize, bread, wheat, rice, sorghum, millet or other staple foods made from grain
0= No 1= Yes
Q413d. White potatoes, white sweet potatoes, cassava or other white root vegetables
0= No 1= Yes
Q413e. Beans, lentils, cowpeas, soya, groundnuts 0= No 1= Yes
Q413f. Milk, yogurt, cheese or other foods made from milk
0= No 1= Yes
Q413g. Liver, kidney, heart, other organ meats 0= No 1= Yes
Q413h.
Meat (beef, pork, lamb, goat), poultry (chicken or other birds), caterpillar
PROBE WHETHER CHILD HAS EATEN ACTUAL MEAT OR ONLY GRAVY. ONLY IF THE CHILD HAS EATEN MEAT INDICATE “1”
0= No 1= Yes
Q413i. Fresh or dried fish (e.g. kapenta, da/ mwanza)
PROBE WHETHER CHILD HAS EATEN ACTUAL FISH OR ONLY GRAVY. ONLY IF THE CHILD HAS EATEN FISH INDICATE “1”
0= No 1= Yes
Q413j. Eggs 0= No 1= Yes
Q413k. Pumpkin (squash), carrots or yellow/orange sweet potatoes, ripe mangos or pawpaws
0= No 1= Yes

117
Q413l. Dark green leafy vegetables such as rape, kalembula, bondwe, chibwabwa or katapa
0= No 1= Yes
Q413m Other vegetables or fruits e.g. cabbage, tomatoes, oranges, bananas, pineapple, avocados, wild fruit
0= No 1= Yes
Q413n. Cooking oil (e.g. salad), fat or foods made with oil (e.g. fried foods)
0= No 1= Yes
Q413o. Any sugary foods such as sweets, candies, pastries, cakes, biscuits or chocolates.
0= No 1= Yes
Q413p. Commercial infant or young child cereals (from a box, tin or jar)
0= No skip to Q413r. 1= Yes
Q413q. If yes, what was the thickness?
PLEASE RECORD CODE IN BOX. 1= Thin – like liquid soup/munkoyo 2= Medium – not thick enough to stay on a spoon 3= Thick – thick enough to stay on a spoon
Q413r. Any other food? 0= No skip to Q414.
1= Yes Q413s. If yes, what other foods?
Q414. Does (NAME OF CHIILD) ever eat organ
meat, meat, and/or fish? 0= No 1= Yes Skip to Q416.
Q415. If no, what is the reason(s) that (NAME)
does not eat organ meat, meat or fish?
RECORD ALL GIVEN ANSWERS BY RECORDING NUMBERS IN THE
CORRESPONDING BOXES.
1= Too expensive 2= Not available 3= Not good for children 4= My child refuses to eat organ meat/meat/fish 99= Other – specify: ________________________________
Q416. How many times yesterday, during the day or night, did (NAME) eat any solid or semi-solid foods (excluding breastfeeding)?
ALSO PROMPT FOR SNACKS.
Number of meals and snacks 77= Don’t Know
INTERVIEWER: I would now like to ask you some questions about the health of (NAME OF CHILD).
Module 5: Child Health & Health Seeking Behaviour Q501. In the past 6 months, has (NAME) been
measured and diagnosed with malnutrition (i.e. were you told he/she was underweight/small, not growing well or had too small a mid-upper arm?)
0= No Skip to Q505. 1= Yes 77= Don't Know Skip to Q505.
Q502. If yes, was your child referred to a hospital, health center or other treatment program?
0= No Skip to Q504. 1= Yes 77= Don't Know
Q503. Did your child receive any of the following
treatments for malnutrition? RECORD ALL GIVEN ANSWERS BY RECORDING THE NUMBER IN THE CORRESPONDING BOX DO NOT READ ANSWERS ALOUD.
1= Was treated in hospital (eg. F75 or F100) 2= Was given a take-home food product (e.g. Plumpy nut, CSB++) 3= Was given ORS (Oralyte) 4= Was given an intravenous solution (IV) 5= Was referred to a mother support group 77= Don’t Know 99= Other – Specify: ____________________

118
Q504. Is your child still being treated for
malnutrition? 0= No 1= Yes
Q505. Has (NAME) had diarrhoea, (this means 3 or more times a day of loose stools) in the past 2 weeks?
0= No Skip to Q510. 1= Yes
Q506. Was there any blood in the stools? 0 = No 1 = Yes 77 = Don't Know
Q507. Was (NAME) given the same amount of
fluids to drink as before the diarrhoea, or more, or less? IF THE CAREGIVER INDICATE “NO,” ASK WHETHER THEY RECEIVED MORE FLUIDS OR LESS
1 = Same 2= More 3= Less 77= Don’t know
Q508. Was (NAME) given the same amount of food to eat as before the diarrhoea, or more or less food? IF THE CAREGIVER INDICATES “NO,” ASK WHETHER THEY RECEIVED MORE FOOD OR LESS
1 = Same 2= More 3= Less 77= Don’t know
Q509. Did you seek advice or treatment for the diarrhoea?
0= No 1= Yes
Q510. Has (NAME) been ill with a fever at any time in the past 2 weeks?
0 = No Skip to Q514. 1 = Yes
Q511. Did you seek advice or treatment for the fever from any source?
0 = No Skip to Q514. 1 = Yes
Q512. Did (NAME OF CHILD) receive a test (finger or heel prick) for the fever?
0 = No Skip to Q514. 1 = Yes
Q513. Was (NAME OF CHILD) treated for malaria?
0 = No 1 = Yes 77 = Don’t Know
Q514. Has (NAME) been ill with a cough at any
time in the past 2 weeks? 0 = No Skip to Q518. 1 = Yes
Q515. When (NAME) had a cough, did he/she breathe faster than usual with short, rapid breaths or have difficulty breathing?
0 = No Skip to Q517. 1 = Yes 77 = Don’t Know Skip to Q517.
Q516. Was the fast or difficult breathing due to a
problem in the chest OR blocked or runny nose?
1 = Problem in chest only 2 = Blocked or runny nose only 3 = Both 77 = Don’t Know 99 = Other—Specify: ___________________________
Q517. Did you seek advice or treatment for the cough from any source?
0 = No 1 = Yes

119
Q518. From whom do you generally seek advice/treatment?
RECORD ALL GIVEN ANSWERS BY RECORDING THE NUMBER IN THE CORRESPODNING BOX. DO NOT READ ALOUD. PROMPT FOR MORE.
Health Sector 1= Hospital 2= Health centre/health post 3= Outreach point/mobile clinic 4= Drug sellers/Pharmacy 99a= Other – Specify: ____________________________ Community 5= Midwife 6= CHW/TBA/volunteer 7= Traditional healer 8= Mother support group 9= Friend or neighbor 10= Mother or mother-in-law 11= Other relative 99b= Other – Specify: ______________________________
Q519. Has (NAME) received a Vitamin A capsule within the past 6 months?
0= No 1= Yes 77= Don't Know
Q520. Has (NAME) received a de-worming tablet
within the past 6 months? 0= No 1= Yes 77= Don't Know
Q521. Has (NAME) suffered from tuberculosis in
the past 6 months? 0= No 1= Yes 77= Don't Know
Q522. Does (NAME) sleep under a mosquito net? 0= No
1= Yes
Module 6: Early Childhood Development Q601. Do you know how a child could be
stimulated to help him/her learn new things?
0= No Skip to Q603. 1= Yes
Q602. If yes, can you tell me how a child can be
stimulated?
PROBE TO LEARN SPECIFICALLY HOW THE INTERVIEWEE WOULD STIMULATE A CHILD.
1= Playing with child 2= Communicating with child 3= Active/responsive feeding 99= Other – specify: ______________________________ _______________________________________________
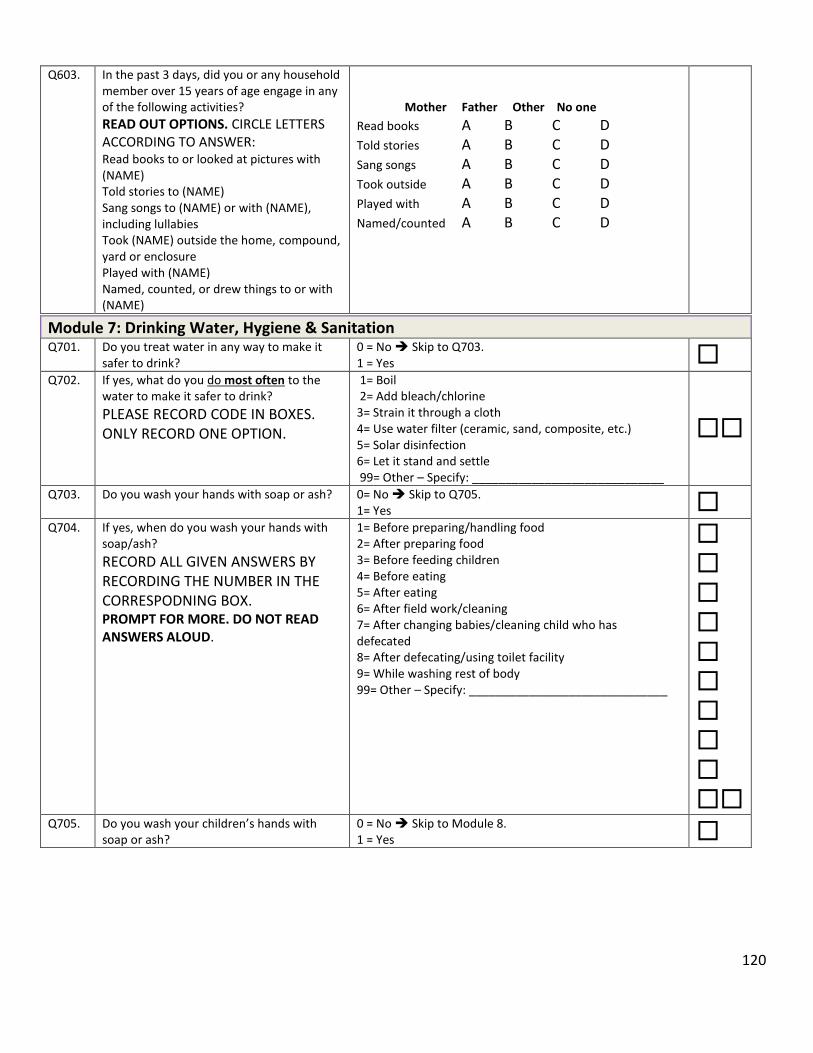
120
Q603. In the past 3 days, did you or any household member over 15 years of age engage in any of the following activities? READ OUT OPTIONS. CIRCLE LETTERS ACCORDING TO ANSWER: Read books to or looked at pictures with (NAME) Told stories to (NAME) Sang songs to (NAME) or with (NAME), including lullabies Took (NAME) outside the home, compound, yard or enclosure Played with (NAME) Named, counted, or drew things to or with (NAME)
Mother Father Other No one
Read books A B C D Told stories A B C D
Sang songs A B C D
Took outside A B C D
Played with A B C D
Named/counted A B C D
Module 7: Drinking Water, Hygiene & Sanitation Q701. Do you treat water in any way to make it
safer to drink? 0 = No Skip to Q703. 1 = Yes
Q702. If yes, what do you do most often to the water to make it safer to drink?
PLEASE RECORD CODE IN BOXES. ONLY RECORD ONE OPTION.
1= Boil 2= Add bleach/chlorine 3= Strain it through a cloth 4= Use water filter (ceramic, sand, composite, etc.) 5= Solar disinfection 6= Let it stand and settle 99= Other – Specify: _____________________________
Q703. Do you wash your hands with soap or ash? 0= No Skip to Q705. 1= Yes
Q704. If yes, when do you wash your hands with soap/ash?
RECORD ALL GIVEN ANSWERS BY RECORDING THE NUMBER IN THE CORRESPODNING BOX. PROMPT FOR MORE. DO NOT READ ANSWERS ALOUD.
1= Before preparing/handling food 2= After preparing food 3= Before feeding children 4= Before eating 5= After eating 6= After field work/cleaning 7= After changing babies/cleaning child who has defecated 8= After defecating/using toilet facility 9= While washing rest of body 99= Other – Specify: ______________________________
Q705. Do you wash your children’s hands with soap or ash?
0 = No Skip to Module 8. 1 = Yes

121
Q706. If yes, when do you wash your children’s hands with soap or ash?
RECORD ALL GIVEN ANSWERS BY RECORDING THE NUMBER IN THE CORRESPODNING BOX. PROMPT FOR MORE. DO NOT READ ANSWERS ALOUD.
1= Before they eat 2= After they eat 3= After they defecate/use toilet facility 4= While washing rest of the body 99= Other – Specify: ______________________________ _______________________________________________
Module 8: Household Information Q801. How many people in total currently live in
your household?
DEFINITION: ALL PEOPLE WHO HAVE LIVED IN THE HOUSE FOR THE PAST 6 MONTHS AND INTEND TO STAY IN THE HOUSEHOLD.
Number of people living in the household
Q802. How many children are in your primary care?
Number of children Q803. Including yourself, and your child in this
survey, how many people in the following age groups currently live in your house? WHEN ADDED TOGETHER, THE NUMBERS INDICATED IN THE BOXES PROVIDED SHOULD EQUAL THAT IN Q801.
0 - <6 months 6 months – <8 months 9 months – <11 months 12 months – <17 months 18 months – <23 months 2 years - <5 years 5 years - <18 years 18 years and above
Q804. What is your relationship to the child who is enrolled in this study?
1= Birth mother 2= Aunt 3= Grandmother 99= Other – Specify: ________________________________
Module 9: Additional Comments and Questions Q901. Do you have any further questions or
comments? 0 = No END OF INTERVIEW 1 = Yes
Q902. If yes: What questions or comments do you have?
PROMPT FOR MORE. BE SURE TO ANSWER QUESTIONS AS BEST AS YOU CAN AND ASK THE SUPERVISOR FOR ASSISTANCE IF NEEDED.
__________________________________________________________ __________________________________________________________ __________________________________________________________ __________________________________________________________ __________________________________________________________
This is the end of the interview. Thank you very much for your participation and time!
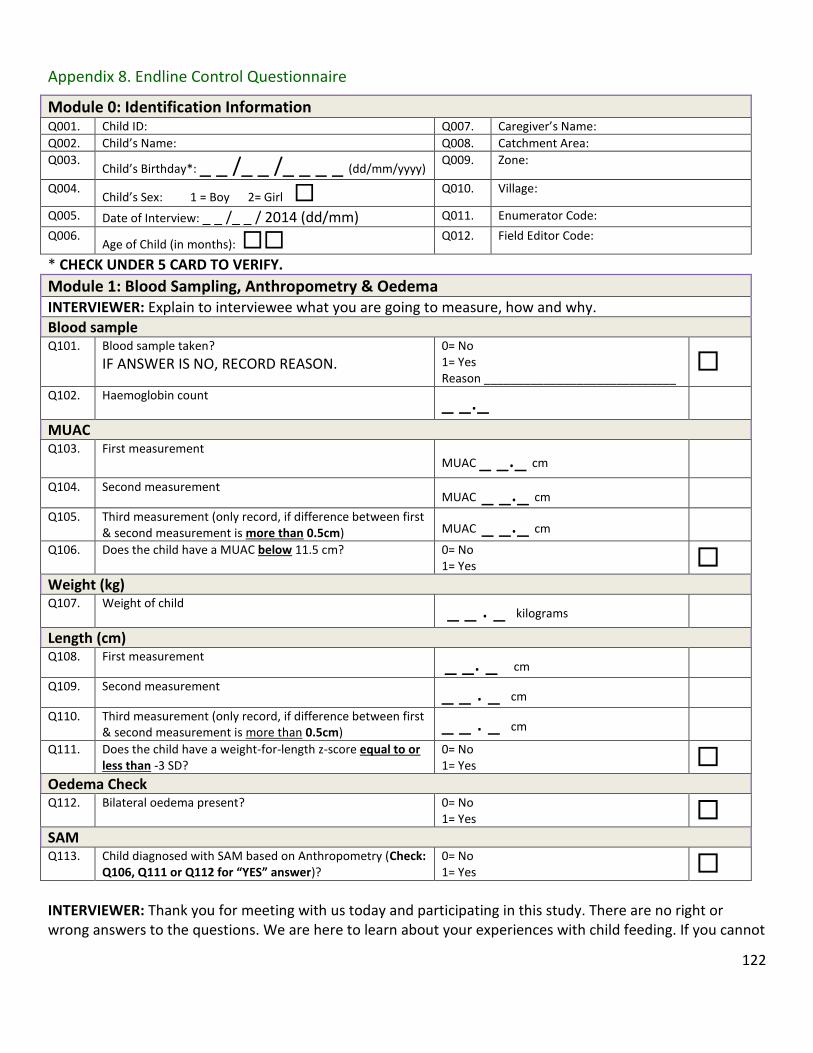
122
Appendix 8. Endline Control Questionnaire
Module 0: Identification Information Q001. Child ID: Q007. Caregiver’s Name:
Q002. Child’s Name: Q008. Catchment Area:
Q003. Child’s Birthday*: _ _ /_ _ /_ _ _ _ (dd/mm/yyyy) Q009. Zone:
Q004. Child’s Sex: 1 = Boy 2= Girl
Q010. Village:
Q005. Date of Interview: _ _ /_ _ / 2014 (dd/mm) Q011. Enumerator Code:
Q006. Age of Child (in months):
Q012. Field Editor Code:
* CHECK UNDER 5 CARD TO VERIFY.
Module 1: Blood Sampling, Anthropometry & Oedema INTERVIEWER: Explain to interviewee what you are going to measure, how and why.
Blood sample Q101. Blood sample taken?
IF ANSWER IS NO, RECORD REASON. 0= No 1= Yes Reason _____________________________
Q102. Haemoglobin count _ _._ MUAC Q103. First measurement
MUAC _ _._ cm Q104. Second measurement
MUAC _ _._ cm Q105. Third measurement (only record, if difference between first
& second measurement is more than 0.5cm) MUAC _ _._ cm Q106. Does the child have a MUAC below 11.5 cm? 0= No
1= Yes Weight (kg) Q107. Weight of child
_ _ . _ kilograms Length (cm)
Q108. First measurement _ _. _ cm
Q109. Second measurement _ _ . _ cm Q110. Third measurement (only record, if difference between first
& second measurement is more than 0.5cm) _ _ . _ cm Q111. Does the child have a weight-for-length z-score equal to or
less than -3 SD? 0= No 1= Yes
Oedema Check
Q112. Bilateral oedema present? 0= No 1= Yes
SAM Q113. Child diagnosed with SAM based on Anthropometry (Check:
Q106, Q111 or Q112 for “YES” answer)? 0= No 1= Yes
INTERVIEWER: Thank you for meeting with us today and participating in this study. There are no right or wrong answers to the questions. We are here to learn about your experiences with child feeding. If you cannot

123
or do not want to answer any of the questions just let us know and we will go on to the next question. We really appreciate your time and your participation. May we start the interview now?
Module 2: Household Information Q201. How many people in total currently live in
your household?
DEFINITION: ALL PEOPLE WHO HAVE LIVED IN THE HOUSE FOR THE PAST 6 MONTHS AND INTEND TO STAY IN THE HOUSEHOLD.
Number of people living in the household
Q202. How many children are in your primary care?
Number of children Q203. Including yourself, and your child in this
survey, how many people in the following age groups currently live in your house? WHEN ADDED TOGETHER, THE NUMBERS INDICATED IN THE BOXES PROVIDED SHOULD EQUAL THAT IN Q201. INDICATE THE NUMBER OF PEOPLE NOT NUMBER THAT CORRESPONDS TO THEIR ANSWER.
0 - <6 months 6 months – <8 months 9 months – <11 months 12 months – <17 months 18 months – <23 months 2 years - <5 years 75 years - <18 years 18 years and above
Q204. What is your relationship to the child who is enrolled in this study?
1= Birth mother 2= Aunt 3= Grandmother 99= Other – Specify: ________________________________
Module 3: Drinking Water, Hygiene & Sanitation Q301. Do you treat water in any way to make it
safer to drink? 0 = No Skip to Q303. 1 = Yes
Q302. If yes, what do you do most often to the water to make it safer to drink?
PLEASE RECORD CODE IN BOXES. ONLY RECORD ONE OPTION.
1= Boil 2= Add bleach/chlorine 3= Strain it through a cloth 4= Use water filter (ceramic, sand, composite, etc.) 5= Solar disinfection 6= Let it stand and settle 99= Other – Specify: _____________________________
Q303. Do you wash your hands with soap or ash? 0= No Skip to Q305. 1= Yes

124
Q304. If yes, when do you wash your hands with soap/ash?
RECORD ALL GIVEN ANSWERS BY RECORDING THE NUMBER IN THE CORRESPODNING BOX. PROMPT FOR MORE. DO NOT READ ANSWERS ALOUD.
1= Before preparing/handling food 2= After preparing food 3= Before feeding children 4= Before eating 5= After eating 6= After field work/cleaning 7= After changing babies/cleaning child who has defecated 8= After defecating/using toilet facility 9= While washing rest of body 99= Other – Specify: ______________________________
Q305. Do you wash your children’s hands with soap or ash?
0 = No Skip to Module 4. 1 = Yes
Q306. If yes, when do you wash your children’s hands with soap or ash?
RECORD ALL GIVEN ANSWERS BY RECORDING THE NUMBER IN THE CORRESPODNING BOX. PROMPT FOR MORE. DO NOT READ ANSWERS ALOUD.
1= Before they eat 2= After they eat 3= After they defecate/use toilet facility 4= While washing rest of the body 99= Other – Specify: ______________________________
Module 4: Early Childhood Development Q401. Do you know how a child could be
stimulated to help him/her learn new things?
0= No Skip to Q403. 1= Yes
Q402. If yes, can you tell me how a child can be
stimulated?
PROBE TO LEARN SPECIFICALLY HOW THE INTERVIEWEE WOULD STIMULATE A CHILD.
1= Playing with child 2= Communicating with child 3= Active/responsive feeding 99= Other – specify: ______________________________ _______________________________________________

125
Q403. In the past 3 days, did you or any household member over 15 years of age engage in any of the following activities?
READ OUT OPTIONS. CIRCLE ALL LETTERS ACCORDING TO ANSWER: Read books to or looked at pictures with (NAME) Told stories to (NAME) Sang songs to (NAME) or with (NAME), including lullabies Took (NAME) outside the home, compound, yard or enclosure Played with (NAME) Named, counted, or drew things to or with (NAME)
Mother Father Other No one
Read books A B C D Told stories A B C D
Sang songs A B C D
Took outside A B C D
Played with A B C D
Named/counted A B C D
INTERVIEWER: I would now like to ask you some questions about the health of (NAME OF CHILD).
Module 5: Child Health & Health Seeking Behaviour Q501. In the past 6 months, has (NAME) been
measured and diagnosed with malnutrition? PROBE: were you told he/she was underweight/small, not growing well or had too small a mid-upper arm?
0= No Skip to Q505. 1= Yes 77= Don't Know Skip to Q505.
Q502. If yes, was your child referred to a hospital, health center or other treatment program?
0= No Skip to Q504. 1= Yes 77= Don't Know
Q503. Did your child receive any of the following
treatment(s) for malnutrition? RECORD ALL GIVEN ANSWERS BY RECORDING THE NUMBER IN THE CORRESPONDING BOX DO NOT READ ANSWERS ALOUD.
1= Was treated in hospital (eg. F75 or F100) 2= Was given a take-home food product (e.g. Plumpy nut, CSB++) 3= Was given ORS (Oralyte) 4= Was given an intravenous solution (IV) 5= Was referred to a mother support group 77= Don’t Know 99= Other – Specify: ____________________
Q504. Is your child still being treated for
malnutrition? 0= No 1= Yes
Q505. Has (NAME) had diarrhoea, (this means 3 or more times a day of loose stools) in the past 2 weeks?
0= No Skip to Q510. 1= Yes
Q506. Was there any blood in the stools? 0 = No 1 = Yes 77 = Don't Know
Q507. Was (NAME) given the same amount of
fluids to drink as before the diarrhoea, or more, or less? IF THE CAREGIVER INDICATE “NO,” ASK WHETHER THEY RECEIVED MORE FLUIDS OR LESS
1= Same 2= More 3= Less 77= Don’t know

126
Q508. Was (NAME) given the same amount of food to eat as before the diarrhoea, or more or less food? IF THE CAREGIVER INDICATE “NO,” ASK WHETHER THEY RECEIVED MORE FOOD OR LESS
1= Same 2= More 3= Less 77= Don’t know
Q509. Did you seek advice or treatment for the diarrhoea from any source?
0= No 1= Yes
Q510. Has (NAME) been ill with a fever at any time in the past 2 weeks?
0 = No Skip to Q514. 1 = Yes
Q511. Did you seek advice or treatment for the fever from any source?
0 = No Skip to Q514. 1 = Yes
Q512. Did (NAME OF CHILD) receive a test (finger or heel prick) for the fever?
0 = No Skip to Q514. 1 = Yes
Q513. Was (NAME OF CHILD) treated for malaria?
0 = No 1 = Yes 77 = Don’t Know
Q514. Has (NAME) been ill with a cough at any
time in the past 2 weeks? 0 = No Skip to Q518. 1 = Yes
Q515. When (NAME) had a cough, did he/she breathe faster than usual with short, rapid breaths or have difficulty breathing?
0 = No Skip to Q517. 1 = Yes 77 = Don’t Know Skip to Q517.
Q516. Was the fast or difficult breathing due to a
problem in the chest OR blocked or runny nose?
1 = Problem in chest only 2 = Blocked or runny nose only 3 = Both 77 = Don’t Know 99 = Other—Specify: ___________________________
Q517. Did you seek advice or treatment for the cough from any source?
0 = No 1 = Yes
Q518. When (NAME OF CHILD) is sick, from whom do you generally seek advice/treatment?
RECORD ALL GIVEN ANSWERS BY RECORDING THE LETTER IN THE CORRESPODNING BOX. DO NOT READ ALOUD. PROMPT FOR MORE.
Health Sector 1= Hospital 2= Health centre/health post 3= Outreach point/mobile clinic 4= Drug sellers/Pharmacy 99a= Other – Specify: ____________________________ Community 5= Midwife 6= CHW/TBA/volunteer 7= Traditional healer 8= Mother support group 9= Friend or neighbor 10= Mother or mother-in-law 11= Other relative 99b= Other – Specify: ______________________________
Q519. Has (NAME) received a Vitamin A capsule within the past 6 months?
0= No 1= Yes 77= Don't Know

127
Q520. Has (NAME) received a de-worming tablet within the past 6 months?
0= No 1= Yes 77= Don't Know
Q521. Has (NAME) suffered from tuberculosis in
the past 6 months? 0= No 1= Yes 77= Don't Know
Q522. Does (NAME) sleep under a mosquito net? 0= No
1= Yes
Module 6: Mother’s Knowledge on IYCF & Anaemia Part I: IYCF Counselling Q601. Have healthcare providers ever talked to
you about breastfeeding or how to feed (NAME)?
0= No skip to Q608. 1= Yes
Q602. In the last two months, how many IYCF counselling sessions (as an individual or in a group) have you attended at an outreach point or health centre?
Record number of times If caregivers answers ‘0’ skip to Q608
Q603. Can you tell me what the topics of those counselling sessions were?
PROBE AND RECORD AS MUCH DETAIL AS YOU CAN.
DO NOT READ ALOUD. RECORD ALL GIVEN ANSWERS BY RECORDING NUMBERS IN THE
CORRESPONDING BOXES.
1 = Signs and symptoms of illnesses in children 2 = Breast feeding 3 = How to feed a child 4 = How to care for an ill child 5 = HIV counseling/support groups 6 = ANC or PNC counseling 7 = Family Planning 8 = Early Child Development 9= Proper hygiene and sanitation 99 = Other – Specify: ___________________________ ____________________________________________
Q604. Who most often conducted the counselling sessions you attended?
DO NOT READ ALOUD.
1 = Health worker (e.g. nurse, health assistant, nutritionist, midwife etc.) 2 = Community Health Worker/Volunteer 3 = Village Chief 4 = NGO worker (e.g. UNICEF, World Vision) 5 = District official 99 = Other – Specify: ________________________________ _________________________________________________

128
Q605. Where did the counselling sessions take place?
DO NOT READ ALOUD.
1 = Health Centre 2 = Outreach Post 3 = Community Meetings / gathering place 4 = Home of Village Chief 5 = Home of a Community Health Volunteer 6 = School 7 = Market 8 = Church 9 = Home of another community member 99 = Other – Specify: _______________________________
Q606. Were you provided with brochures or materials to take home with you?
0= No skip to Q608. 1= Yes
Q607. If yes, what types of brochures did you receive?
RECORD ALL GIVEN ANSWERS BY RECORDING THE LETTER IN THE CORRESPONDING BOX. DO NOT READ ALOUD. PROMPT FOR MORE.
1= Breastfeeding brochure 2= Complementary feeding brochure 3= Maternal nutrition brochure (ANC/PNC) 4= Recipes for complementary feeding 5= Early child development 99= Other – Specify? ____________________________
Part II: IYCF Knowledge Q608 Can you tell me how long after birth a child
should start receiving breast milk/be put to the breast?
PLEASE RECORD CODE IN BOXES TO FAR RIGHT. DEPENDING ON ANSWER ALSO RECORD NUMBER OF HOURS OR DAYS.
1= Immediately (within one hour)
2= Hours Record number of hours Q608a. 3= Days Record number of days Q608b. 77= Don’t know
Q609. Can you tell me until what age a baby should receive only breast milk, that is, no other food, water or other fluids?
Record months 77= Don’t know
Q610. At what age (in months) should a child start receiving food in addition to breast milk?
Record months 77= Don’t know
Q611. Until what age (in months), or for how long should a child continue to receive breast milk?
Record age in months 77 = Don’t know
Q612. How many times should (NAME OF CHILD) be fed in one day?
Number of times (meals and snack in total) 77= Don’t know skip to Q614.
Q613. If yes: a) How many of these feedings should be a meal?
Number of meals Number of snacks 77= Don’t know

129
b) How many of these feedings should be a snack?
Q614. Have you heard of the term “food groups” before?
0 = No skip to Q616. 1 = Yes
Q615. If yes: what different foods/ingredients would you use to make a nutritious meal for (NAME OF CHILD)? ASK THE CAREGIVER TO LIST THE INGREDIENTS OF THE MOST NURTITIOUS/DIETARY DIVERSE MEAL SHE MIGHT PREPARE FOR THE CHILD. CLASSIFY THESE IN THE APPROPRIATE FOOD GROUPS. List ingredients: ______________________ ____________________________________ ____________________________________ ____________________________________ ____________________________________
1 = Staple (grains, cassava, potatoes) 2 = Legumes (beans, chickpeas) 3 = Vegetables 4 = Fruits (i.e. pawpaws, mangoes, banana) 5 = Animal Source – (fish, chicken, beef, eggs) 6 = Dairy Products (milk, cheese) 7 = Fats (oils, butter) 77=Don’t Know 99 = Other – Specify?
Q616. Do you think it is important for (NAME OF CHILD) to consume different kinds of foods (foods from the different food groups)?
0 = No 1 = Yes 77 = Don’t know
Q617. Do you know what it means if a mother “actively feeds” her child?
0 = No skip to Q619. 1 = Yes
Q618. If yes: what does a mother do if she is actively feeding?
1 = Caregiver encourages the baby to eat (i.e. singing, talking to baby, playing with baby) 2 = Caregiver feeds the (NAME OF CHILD) or supervises (NAME OF CHILD) when he/she is eating 3 = Caregiver is patient in feeding the child (not force feeding) 77 = Don’t know 99 = Other – Specify? _______________________________
Part IIl: Knowledge of Anaemia Q619. Have you ever heard of a condition called
anaemia or ‘lack of blood’? 0= No skip to Module 7. 1= Yes
Q620. Can you identify some signs that a child has anaemia or ‘lack of blood’?
0= No skip to Q622. 1= Yes
Q621. If yes: please tell me some of the signs that a child has anaemia or a ‘lack of blood’?
RECORD ALL GIVEN ANSWERS BY RECORDING THE LETTER IN THE CORRESPONDING BOX. DO NOT READ ANSWERS ALOUD. PROMPT FOR MORE.
1= White/pale skin, eyes, nails, hands 2= Feeling faint, dizziness 3= Apathy/fatigue (child doesn’t play) 4= Oedema 5= Weight loss 6= Fever/high temperature 99= Other – Specify: _______________________________
Q622. Do you know what causes anaemia or ‘lack 0= No skip to Q624.

130
of blood’? 1= Yes
Q623. If yes: what causes anaemia or ‘lack of blood’?
RECORD ALL GIVEN ANSWERS BY RECORDING THE LETTER IN THE CORRESPONDING BOX. PROMPT FOR MORE. DO NOT READ ANSWERS ALOUD.
1= Malaria 2= Hookworms 3= Infection 4= Bleeding 5= Dietary (lack of iron in diet) 6= Diarrhoea 7= Dehydration 8= Vomiting 9= Not enough food 99= Other – Specify: _______________________________
Q624. Do you know of any foods that can prevent anaemia or ‘lack of blood’?
0= No skip to Q626. 1= Yes
Q625. If yes: please tell me what foods can prevent anaemia or ‘lack of blood’?
RECORD ALL GIVEN ANSWERS BY RECORDING THE LETTER IN THE CORRESPONDING BOX. PROMPT FOR MORE. DO NOT READ ANSWERS ALOUD.
1= Organ meats (e.g. liver, kidney, heart) 2= Meat (e.g. beef, pork) or poultry (e.g. chicken) 3= Fresh or dried fish (e.g. kapenta, da/mwanza) 4= Green leafy vegetables (e.g. rape, chibwabwa, katapa) 5= Other vegetables or fruit (e.g. oranges, tomatoes) 6= Legumes (e.g. beans, lentils) 7= Tubers (e.g. potatoes) 8= Eggs 9= Colas 10= Avocado leaves/seeds 99= Others – Specify: ______________________________
Q626. Do you know of any non-dietary ways to prevent anaemia or ‘lack of blood’?
0 = No skip to Module 7. 1 = Yes
Q627. If yes: What are some non-dietary ways to prevent anaemia or ‘lack of blood’. IF RESPONDENT REPLIES WITH AN ANSWER THAT IS CONSIDERED A ‘TREATMENT’, REMIND THEM THE QUESTION IS ASKING FOR METHODS OF PREVENTING ANAEMIA OR ‘LACK OF BLOOD’.
1 = Sleeping under bed nets (mosquito nets) 2 = Deworming 3 = Practicing good hygiene 99 = Others – Specify: ______________________________
INTERVIEWER: I would like to ask you some questions about the feeding of (NAME) including what liquids and foods he/she consumed yesterday.

131
Module 7: Infant & Young Child Feeding Practices & Food Consumption Part I: Breastfeeding & Feeding Practices Q701. Are you still breastfeeding (NAME)? 0= No
1= Yes Skip to Q703. Q702. If no: for how many months did you
breastfeed (NAME)? Months 77= Don’t know
Q703. Has (NAME) received any foods from the family pot without being mashed or prepared specifically for him/her?
0= No Skip to Q705. 1= Yes
Q704. If yes: at what age did (NAME) start receiving foods from the family pot?
Months 77= Don’t know
Q705. Does (NAME) eat from his/her own separate bowl?
0= No Skip to Q707. 1= Yes
Q706. a) At what age did (NAME) start eating from his/her own separate bowl? b) At what age will (NAME) stop eating from his/her own separate bowl?
a) Record age in months b) Record age in months
Q707. Does (NAME) usually (most often) feed him/herself or does someone help put the food in (NAME’s) mouth?
1= (NAME) feeds herself/himself 2= Someone else feeds him/her Skip to Q709.
Q708. At what age did (NAME) start feeding him or herself? Skip to Q711 after recording answer
Months 77= Don’t Know
Q709. Who usually (most often) feeds (NAME)?
PLEASE RECORD CODE IN BOXES. IF CAREGIVER SAYS OLDER SIBLING FEEDS CHILD, RECORD AGE OF SIBLING.
1= Myself 2= Father/Husband 3= Grandparent
4= Older sibling (RECORD AGE IN YEARS) Q709b.
5= Neighbour 99= Other – Specify: _______________________________
Q710. Do you/they encourage (NAME) to eat? 0= No 1= Yes
Part II: Food Consumption Q711. Now I would like to ask you about some
liquids that (NAME) may have had at any time yesterday during the day or night. Did (NAME) have any of the following?
READ OUT THE WHOLE LIST. RECORD ALL GIVEN ANSWERS BY RECORDING THE LETTER IN THE CORRESPODNING BOX. If caregiver answers “yes” to either option 3 or 4, ask Q712. If not, skip to Q713.
1= Breast milk? 2= Plain water? 3= Infant formula? If yes, ask Q712 4= Milk such as tinned, powdered, or fresh animal milk? If yes, ask Q712 5= Sweetened water, juice, fruit juice, soda (carbonated drinks)? 6= Soup broth? 7= Dilute maize porridge/beverage? 99= Any other liquids (e.g. tea, coffee)? – Specify: ____________________________________________
Q712. How many times at any time yesterday during the day or night did you give (NAME) infant formula or non-human milk (tinned, powdered, or fresh animal milk)?
Number of times
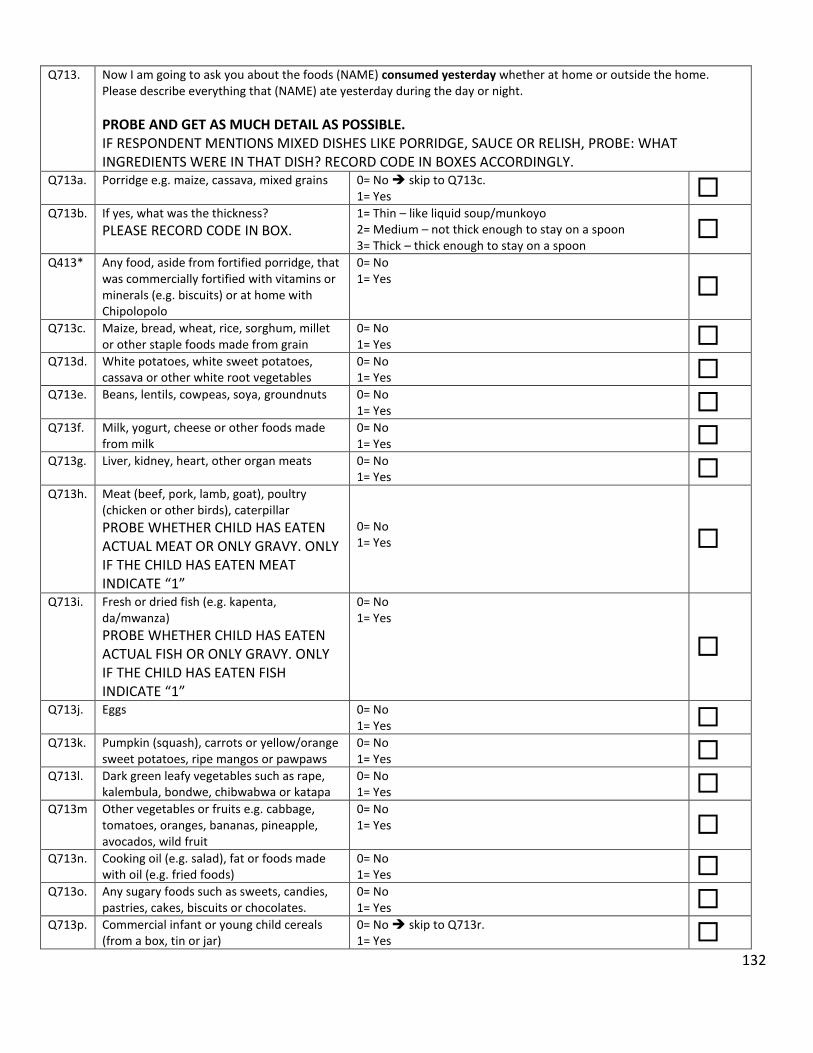
132
Q713. Now I am going to ask you about the foods (NAME) consumed yesterday whether at home or outside the home. Please describe everything that (NAME) ate yesterday during the day or night.
PROBE AND GET AS MUCH DETAIL AS POSSIBLE. IF RESPONDENT MENTIONS MIXED DISHES LIKE PORRIDGE, SAUCE OR RELISH, PROBE: WHAT INGREDIENTS WERE IN THAT DISH? RECORD CODE IN BOXES ACCORDINGLY.
Q713a. Porridge e.g. maize, cassava, mixed grains 0= No skip to Q713c. 1= Yes
Q713b. If yes, what was the thickness?
PLEASE RECORD CODE IN BOX. 1= Thin – like liquid soup/munkoyo 2= Medium – not thick enough to stay on a spoon 3= Thick – thick enough to stay on a spoon
Q413* Any food, aside from fortified porridge, that
was commercially fortified with vitamins or minerals (e.g. biscuits) or at home with Chipolopolo
0= No 1= Yes
Q713c. Maize, bread, wheat, rice, sorghum, millet or other staple foods made from grain
0= No 1= Yes
Q713d. White potatoes, white sweet potatoes, cassava or other white root vegetables
0= No 1= Yes
Q713e. Beans, lentils, cowpeas, soya, groundnuts 0= No 1= Yes
Q713f. Milk, yogurt, cheese or other foods made from milk
0= No 1= Yes
Q713g. Liver, kidney, heart, other organ meats 0= No 1= Yes
Q713h. Meat (beef, pork, lamb, goat), poultry (chicken or other birds), caterpillar
PROBE WHETHER CHILD HAS EATEN ACTUAL MEAT OR ONLY GRAVY. ONLY IF THE CHILD HAS EATEN MEAT INDICATE “1”
0= No 1= Yes
Q713i. Fresh or dried fish (e.g. kapenta, da/mwanza)
PROBE WHETHER CHILD HAS EATEN ACTUAL FISH OR ONLY GRAVY. ONLY IF THE CHILD HAS EATEN FISH INDICATE “1”
0= No 1= Yes
Q713j. Eggs 0= No 1= Yes
Q713k. Pumpkin (squash), carrots or yellow/orange sweet potatoes, ripe mangos or pawpaws
0= No 1= Yes
Q713l. Dark green leafy vegetables such as rape, kalembula, bondwe, chibwabwa or katapa
0= No 1= Yes
Q713m Other vegetables or fruits e.g. cabbage, tomatoes, oranges, bananas, pineapple, avocados, wild fruit
0= No 1= Yes
Q713n. Cooking oil (e.g. salad), fat or foods made with oil (e.g. fried foods)
0= No 1= Yes
Q713o. Any sugary foods such as sweets, candies, pastries, cakes, biscuits or chocolates.
0= No 1= Yes
Q713p. Commercial infant or young child cereals (from a box, tin or jar)
0= No skip to Q713r. 1= Yes

133
Q713q. If yes, what was the thickness?
PLEASE RECORD CODE IN BOX. 1= Thin – like liquid soup/munkoyo 2= Medium – not thick enough to stay on a spoon 3= Thick – thick enough to stay on a spoon
Q713r. Any other food? 0= No skip to Q714.
1= Yes Q713s. If yes, what other foods?
Q714. Does (NAME OF CHIILD) ever eat organ meat, meat, and/or fish?
0= No 1= Yes Skip to Q716.
Q715. If no, what is the reason that (NAME) does not eat organ meat, meat or fish?
RECORD ALL GIVEN ANSWERS BY RECORDING NUMBERS IN THE
CORRESPONDING BOXES.
1= Too expensive 2= Not available 3= Not good for children 4= My child refuses to eat organ meat/meat/fish 99= Other – specify: ________________________________
Q716. How many times yesterday, during the day or night, did (NAME) eat any solid or semi-solid foods (excluding breastfeeding)?
ALSO PROMPT FOR SNACKS.
Number of meals and snacks 77= Don’t Know
Module 8: Additional Comments and Questions Q901. Do you have any further questions or
comments? 0 = No skip to the END 1 = Yes
Q902. If yes: What questions or comments do you have?
PROMPT FOR MORE. BE SURE TO ANSWER QUESTIONS AS BEST AS YOU CAN AND ASK THE SUPERVISOR FOR ASSISTANCE IF NEEDED.
__________________________________________________________ __________________________________________________________ _________________________________________________________ _________________________________________________________ __________________________________________________________
This is the end of the interview. Thank you very much for your participation and time!