
Effectiveness of Targeting Mechanisms Utilized in Social Protection Programs in Bolivia
36
September 2015 Effectiveness of Targeting Mechanisms Utilized in Social Protection Programs in Bolivia Ignacio Apella and Gastón Blanco DISCUSSION PAPER NO. 1506
-
Upload
the-world-bank-social-protection-labor -
Category
Documents
-
view
216 -
download
2
description
As part of the 2006-2011 National Development Plan, the Plurinational State of Bolivia launched two cash transfer programs and one youth labor training program aimed at promoting the accumulation of households’ human capital: the Juancito Pinto Educational Grant, the Juana Azurduy Mother-Child Grant, and My First Decent Job. The objective of this paper is to analyze the effectiveness of the targeting mechanisms utilized in these programs. Based on the information provided by the Ongoing Household Survey, we estimate the mechanisms’ potential inclusion and exclusion errors. The results permit us to suggest that the categorical selection mechanisms used in the three programs are effective in reaching the poorest population, although they present distinct levels of inclusion and exclusion errors associated with both the design and implementation problems of the particular mechanism utilized.
Transcript of Effectiveness of Targeting Mechanisms Utilized in Social Protection Programs in Bolivia

S e p t e m b e r 2 0 1 5
Abstract
As part of the 2006–2011 National Development Plan, the Plurinational State of Bolivia launched two cash transfer programs and one youth labor training program aimed at promoting the accumulation of households’ human capital: the Juancito Pinto Educational Grant, the Juana Azurduy Mother-Child Grant, and My First Decent Job. The objective of this paper is to analyze the effectiveness of the targeting mechanisms utilized in these programs. Based on the information provided by the Ongoing Household Survey, we estimate the mechanisms’ potential inclusion and exclusion errors. The results permit us to suggest that the categorical selection mechanisms used in the three programs are effective in reaching the poorest population, although they present distinct levels of inclusion and exclusion errors associated with both the design and implementation problems of the particular mechanism utilized.
Effectiveness of Targeting Mechanisms Utilized in Social
Protection Programs in Bolivia
Ignacio Apella and Gastón Blanco
D I S C U S S I O N P A P E R NO. 1506
© 2015 International Bank for Reconstruction and Development / The World Bank
About this series...
Social Protection & Labor Discussion Papers are published to communicate the results of The World Bank’s work to the development community with the least possible delay. This paper therefore has not been prepared in accordance with the procedures appropriate for formally edited texts.
The findings, interpretations, and conclusions expressed herein are those of the author(s), and do not necessarily reflect the views of the International Bank for Reconstruction and Development/The World Bank and its affiliated organizations, or those of the Executive Directors of The World Bank or the governments they represent. The World Bank does not guarantee the accuracy of the data included in this work. The boundaries, colors, denominations, and other information shown on any map in this work do not imply any judgement on the part of The World Bank concerning the legal status of any territory or the endorsement or acceptance of such boundaries.
For more information, please contact the Social Protection Advisory Service, The World Bank, 1818 H Street, N.W., Room G7-803, Washington, DC 20433 USA. Telephone: (202) 458-5267, Fax: (202) 614-0471, E-mail:[email protected] or visit us on-line at www.worldbank.org/spl.

Effectiveness of targeting mechanisms utilized
in social protection programs in Bolivia
Ignacio Apella and Gastón Blanco1
September 2015
Abstract of main findings:
As part of the 2006-2011 National Development Plan, the Plurinational State of Bolivia launched two cash transfer programs and one youth labor training program aimed at promoting the accumulation of households’ human capital: the Juancito Pinto Educational Grant, the Juana Azurduy Mother-Child Grant, and My First Decent Job. The objective of this paper is to analyze the effectiveness of the targeting mechanisms utilized in these programs. Based on the information provided by the Ongoing Household Survey, we estimate the mechanisms’ potential inclusion and exclusion errors. The results permit us to suggest that the categorical selection mechanisms used in the three programs are effective in reaching the poorest population, although they present distinct levels of inclusion and exclusion errors associated with both the design and implementation problems of the particular mechanism utilized.
JEL Classification: H20; H53; J08 Keywords: social protection, targeting mechanism, poverty
1 World Bank Global Social Protection and Labor Practice. Both the errors and/or omissions, as well as the opinions expressed in this document are the authors’ responsibility and in no way reflect the views of the Institutions they represent. The authors would like to thank Margaret Grosh, Rafael Rofman, Jamele Rigolini, Roland Pardo, Cecilia Vidal, and Sdenka Claros for their valuable comments. Please correspondence to [email protected]; [email protected].
- 1 -

Table of Contents
I. Introduction 3
II. Analytical Framework 5
III. Transfer programs in Bolivia 10
IV. Analysis of the effectiveness of the programs’ targeting
mechanisms
15
V. Estimation of inclusion and exclusion errors in the new
Single Registry of Beneficiaries
25
VI. Conclusions and future challenges 29
VII. Bibliography 31
- 2 -

I. Introduction
Social protection policies in the Plurinational State of Bolivia have undergone significant
transformations during the last 10 years. These changes parallel what has occurred in the
majority of Latin American countries, where diverse household cash transfer and youth labor
training programs have been implemented with the goal of alleviating poverty, contributing
to the development of human capital, stemming the intergenerational transmission of
poverty, and improving employability.
The 2006-2011 National Development Plan articulated four strategies central to the
development of the country: Respectable, Democratic, Productive, and Sovereign Bolivia. The
first of these2 refers to asset-creating sectors and inter-sectorial social protection programs.
The focus is not centered just on the provision of basic services, but also on the promotion of
households’ economic capacities. Its objectives include: a) create an equitable pattern of the
distribution of wealth and opportunities; b) promote the full exercise of dignity and
individuals’ and social groups’ rights; and c) implement development programs designed to
drastically reduce risk situations and their consequences.
As part of this strategy, the country launched a set of cash transfer and youth labor training
programs directed at promoting the accumulation of human capital within households. In
2006, the Juancito Pinto Educational Grant was created with the objective of increasing
school enrollment and reducing desertion rates among children and adolescents. Three years
later, the Juana Azurduy Mother-Child Grant was launched with the goal of decreasing the
levels of maternal and infant mortality and chronic malnutrition among children below age 2
through an incentive to use healthcare services. Finally, also in 2009, the “My First Decent
Job” Program was started with the goal of confronting the shortcomings in terms of
2 The second strategy, Democratic Bolivia, refers to the formation of a Social-Community State where “the people exercise social power and are co-responsible for decisions related to their own development”. The third strategy, Productive Bolivia is aimed at transforming the productive matrix to achieve the development of Comprehensive Productive Complexes and giving the State the power to generate income and employment surpluses based on the economy’s strategic sectors. Finally, the fourth strategy, Sovereign Bolivia, refers to a change in the country’s foreign policy with greater representation of “the people” abroad and the defense of natural resources and biodiversity.
- 3 -

employability for young adults between the ages of 18 and 24 by offering training and
internships.
Since their launches, the three programs have faced the challenge of using effective
mechanisms to identify and register the target population. Regular evaluations of the
effectiveness of the application of the targeting instruments allow for the analysis of potential
modifications to the instruments, as well as identifying needs for strengthening their
application.
In this context, the goal of this paper is to analyze the effectiveness of the existing targeting
mechanisms for each of the programs, while at the same time analyzing the results of the
recently launched single mechanism for beneficiary identification from the Ministry of
Development Planning. The application of a single mechanism should improve efficiency (by
reducing the cost of identifying potential beneficiaries) as well as effectiveness (by reducing
inclusion and exclusion errors).
This document presents six sections in addition to this Introduction. In the second section,
we present the analytical framework that guides the discussion of the targeting mechanisms
utilized by the three programs in the analyses described in the third section. In the third
section, we present the three programs’ general characteristics. Subsequently, in the fourth
section, we estimate the inclusion and exclusion errors associated with the beneficiary
identification tools for the three programs, under certain assumptions and design
characteristics, based on the information provided by the 2012 Ongoing Household Survey
(ECH), developed by the National Statistics Institute of Bolivia. In the fifth section, we
estimate the potential inclusion and exclusion errors for the recently launched Single Registry
of Beneficiaries for social programs. Finally, we offer some final reflections and provide a
bibliography of the works consulted.
- 4 -

II. Analytical Framework
The design and implementation of social protection policies rely on correctly diagnosing the
problem or risk to be addressed. Examples include: vulnerability of a specific population
group in the face of a situation of poverty or an elevated school desertion rate – a lack of
accumulation of human capital – among children and youth, with a special emphasis on those
that belong to households living in poverty, to mention a few. An accurate diagnosis permits
one to define the target population that the initiative aims to reach with greater precision.
This leads to the necessity of choosing a mechanism that allows for the identification of
potentially eligible individuals. In general terms, there are two alternatives for reaching these
individuals: either a universal program or a targeted one.
The arguments in favor of universalization as a strategy to eradicate poverty have an ethical,
political, and practical basis. The principal point of reference is the European experience,
where poverty has been successfully fought via a framework of policies centered on
guaranteeing services with universal coverage.
Supporters of universal policies posit that the State should effectively guarantee basic rights,
distributing the available resources among all citizens, regardless of whether or not they will
be recovered, through direct general revenue schemes. Funds should originate from
individuals with higher incomes. Nonetheless, available resources are generally limited. This
requires policymakers to maximize their impact when they are put to use—in other words,
to utilize the funds efficiently such that the greatest expected impact is achieved.
Therefore, the arguments in favor of creating targeted policies are based on the need to focus
the benefits on the target population, thus increasing efficiency in the use of cash transfers
aimed at combating the problem or risk factor as previously identified through an assessment
of the situation. Targeting criteria commonly used in social protection programs are age,
gender, employment status, level of poverty, and/or geographic location. The utilization of
targeting criteria as a condition for potential beneficiaries facing poverty requires
policymakers to develop more complex, specific tools.
- 5 -
In any case, following the situational assessment, the way in which the potentially eligible
population is defined and the argument behind this definition are key factors in terms of the
policy’s effectiveness. In contrast, incorrectly defining the target population could result in
design errors in the selection of beneficiaries. Based on the previous examples, the target
population could be households living in poverty and school-age children and youth living in
poverty. Once the problem and/or risk factor is assessed and the potentially eligible
population is defined, one must design a tool that allows said population to be identified and
reached.
In all cases, applying targeting criteria in social programs entails an administrative cost
associated with the work of creating, implementing, updating, and supervising the selection
tools (socioeconomic records, household surveys, poverty maps, etc.). One relevant aspect
when targeting mechanisms are designed is to evaluate whether the additional costs
associated with targeting are greater than the costs of universalization, represented as the
amount of transfers that reach the non-poor population for example (Atkinson, 1995).
The goal of targeting is for a social program’s resources to only reach the population whose
socioeconomic status is situated below the established threshold, as well as attempting to
ensure as much as possible that all members of the target group benefit from the program.
However, in addition to the increased administrative costs, there is a risk of committing two
types of targeting errors: inclusion and exclusion (Cornia and Steward, 1992). While
universalization schemes do not face exclusion errors (the exclusion from the program of
individuals and households that belong to the target group), in the case of targeted policies,
and depending on the effectiveness of the mechanisms utilized, these schemes can face both
inclusion and exclusion errors.
A standard exercise when one wants to evaluate the effectiveness of targeting mechanisms
is to analyze the tradeoff that exists between both types of errors. As a program attempts to
minimize inclusion errors—in other words, the more a program tries to avoid that the
ineligible population (the non-poor, for example) is included—the probability of committing
an exclusion error increases, meaning that poorer people are left out of the program. In other
- 6 -

words, the more eligibility requirements there are and the stricter they are, the smaller the
group of potentially eligible beneficiaries.
The risk of committing these kinds of errors can originate during two stages of the policy:
design and implementation. Regarding the former, inclusion and exclusion errors can emerge
as a consequence of incorrectly identifying the target population. For example, they could
result from design flaws in the mechanism: selecting personal and household characteristics
that are not correlated with the real problem or risk factor. In addition, the implementation
process, in other words identifying and approaching the program’s target population, can find
itself dependent on or limited by the program’s ability to reach the target population: it is not
clear who they are, where they are located, or how to approach them.
Targeting Mechanisms. The objective of targeting mechanisms is to correctly and efficiently
identify which households meet the eligibility requirements and which do not. The methods
for reaching a beneficiary group are divided into three categories: individual/family
evaluation; categorical and geographic selection; and self-targeting.
The individual/family evaluation determines for each household or individual if the applicant
meets the eligibility requirements established by the program. This type of tool requires the
highest level of effort from the program.
Within this category, the verified proxy means test stands out. It compiles (nearly) complete
information on household income level and/or assets and verifies this information with
independent sources, such as spending, tax, and other records. This requires that verifiable
records for the beneficiary population must exist and be updated regularly, as well as the
need for the administrative capacity to process this information.
In the absence of the capacity to carry out a verified means test, other individual evaluation
mechanisms are generally used. The three most common are simple proxy means testing,
substituted proxy means testing, and community-based selection.
In simple means testing, the conditions stated by the beneficiaries are not verified. A
household visit from one of the program’s social workers could help to qualitatively
- 7 -

corroborate that the apparent living conditions reasonably coincide with the stated data. On
the other hand, evaluations performed by social workers could be completely qualitative and
account for many factors related to the household’s needs and means, without the
requirement to quantify them.
Proxy means testing is a system that scores each of the household or individual applicants
based on easily observable characteristics, such as the location and quality of the residence,
ownership of durable goods, household demographic structure, educational level, and
employment status. The indicators or formulas used to calculate these scores and their
weighting are derived from a statistical analysis of data from detailed household surveys.
Generally, the information provided by the applicant is partially verified by gathering
information from a household visit performed by a representative of the program.
Community-based selection uses a group of community members or one of their leaders
whose principal function is not related to the transfer program to decide which members of
the community should benefit from the program. An example of this is using special
committees comprised of community members or a combination of community members
and local officials to establish eligibility for a program. The idea behind this method is that
local knowledge of families’ living conditions could be more accurate than data gathered via
means testing performed by a program representative.
The risk of committing inclusion and/or exclusion errors resulting from the setting up and
utilizing this type of mechanism is related to the level of correlation that exists between the
individual or household characteristics that are evaluated and those which truly determine
whether one is eligible or not, poverty for example. The more correlated actual poverty is
with the means that are measured (educational level, household property, mobile phone
ownership, etc.), the fewer inclusion and exclusion errors there will be.
The implementation of a targeting mechanism can result in these kinds of errors as well. For
example, the capabilities of the workers responsible for gathering data from each
individual/household determines the degree of error minimization.
- 8 -

Categorical selection refers to a method by which all of the individuals in a specific category
meet the requirements to receive the benefit. This method is also known as statistical
selection, classification, or group targeting and determines eligibility in terms of easily
observable individual or family characteristics that are difficult to distort and are correlated
with the relevant characteristic (for example, poverty). Examples include: age, gender,
ethnicity, land ownership, demographic makeup, geographical location, the type of
educational institution attended, and the type of formal healthcare coverage possessed. Age
is a category that is frequently utilized in family cash transfer programs which are principally
used in transitioning countries, in supplemental nutrition programs for children below age
five which are common in poor countries, and in non-contributory pensions for the elderly.
Characteristics like unemployment and disabilities are more difficult to verify, but it is also
possible to use categorical selection for cash transfers to these groups.
Here again, correctly defining category in terms of its correlation to the real risk factor
determines the degree of inclusion and/or exclusion error that may result.
Geographic targeting means determining the eligible population based on where they live
(state, municipality, neighborhood, etc.). This type of mechanism is frequently used and is
generally combined with other methods.
Finally, via self-targeting a program is open to the entire population, but its design includes
features meant to incentivize just the participation of those households or groups that belong
to a specific group (for example, poor households), thereby disincentivizing the participation
of those that do not belong to this group. This is achieved by recognizing the differences in
the private costs of participation faced by poor and non-poor households. Examples of self-
targeting include:
• employment programs with low salaries, so that only unemployed workers with low or no
opportunity costs will participate;
• delivering the transfer via a mechanism that includes lining up and is limited to certain
hours;
- 9 -

• transferring in-kind benefits with characteristics of “inferior goods” (for example, flour,
low-quality rice, etc.); and
• situating service delivery points (supply warehouses, clinics or hospitals, and participating
schools, etc.) such that the non-poor population would incur greater costs (private and
social).
III. Transfer programs in Bolivia
3.1 Juancito Pinto Grant (BJP)
In 2006, the national government of Bolivia decided to incentivize school enrollment and
reduce desertion in the formal education system as one of its principal goals. Supreme Decree
28,899 created the conditional cash transfer program known as the Juancito Pinto Grant
(BJP). The BJP provides an annual transfer of Bs. 200 as an incentive to reduce school absence
and desertion and to increase children’s enrollment and continuity in the country’s
educational institutions.
The target population consists of children and youth that attend the formal education system
at public institutions. The program increased its target population over time, including more
educational levels over the years, as shown in Table 1.
Table 3.1. The evolution of BJP regulations Year Decree Educational levels reached
2006 No. 28,899 1st through 5th years of primary school.
2007 No. 29,321 1st through 6th years of primary school.
2008 No. 29,652 1st through 8th years of primary school.
2011 No. 1,016 1st through 6th years of primary school and 1st and 2nd years of secondary school.
2012 No. 1,372 1st through 6th years of primary school and 1st, 2nd and 3rd years of secondary school.
Source: Authors’ elaboration based on official Decrees and Orichuela and Daga (2012)
- 10 -

For each year, the mechanism to identify potential beneficiaries uses categorical selection
given that their eligibility is defined in terms of their individual characteristics.
After multiple modifications to the regulations, Supreme Decree 1,372 of 2012 established
that the program’s target population consisted of all primary school students (first through
sixth years) and students from the first, second, and third years of secondary school, including
Special Education and Alternative Youth Education students from all public sector educational
institutions and private institutions with agreements with the government. Additionally, the
BJP sets an age limit of 18 years old in order to receive the grant for the formal education and
alternative youth education systems. Based on this categorization, those children and
adolescents that attend private educational institutions are excluded from the program’s
benefits. Students must achieve a regular attendance rate of at least 80% during the school
year in order to receive the transfer. Figure 3.1 shows the evolution of the number of
beneficiaries and the total expenditure directed toward financing the BJP from 2006 to 2012.
Figure 3.1. Beneficiaries and total expenditure for the Juancito Pinto Grant. 2006-2012.
Source: Orichuela and Daga (2012)
0
50
100
150
200
250
300
350
400
450
0
200
400
600
800
1000
1200
1400
1600
1800
2000
2006 2007 2008 2009 2010 2011 2012
Beneficiaries (thousands). Right axis Expenditure (millions of bs). Left axis
- 11 -

3.2 . Juana Azurduy Mother-Child Grant (BJA)
The Juana Azurduy Mother-Child Grant (BJA) was created in 2009 with the objective of
“decreasing the levels of maternal and infant mortality and chronic malnutrition among
children younger than two years old”. The target population comprises all pregnant women
and children younger than two years old that do not have formal healthcare coverage. The
stipend is a cash incentive of Bs. 320 that is given to the pregnant woman for attending four
prenatal checkups, Bs. 50 for each one, a delivery attended by healthcare personnel, and one
postnatal checkup (Bs. 120). For children younger than age 2, the program delivers a transfer
of Bs. 125 for each of the child’s two-month development checkups. In total, the mother
receives an incentive of Bs. 1,820.
The program comprises a “demand” incentive for healthcare services and covers all of the
municipalities in the country.
Figure 3.2 shows the evolution of the number of beneficiaries and the program’s expenditure
on transfers between 2009 and 2013. Given the high degree of turnover of pregnant women
and children due to their short participation in the program, reduced annual affiliation efforts
have resulted in a reduction in the number of beneficiaries.
- 12 -

Figure 3.2. Beneficiaries of the Juana Azurduy Mother-Child Grant. 2009-2013.
Source: Ministry of Health – Juana Azurduy Coordination Unit
3.3 . My First Decent Job
The “My First Decent Job” Program’s (MPED) principal objective is to increase labor force
insertion and improve employability among youth. It is directed at men and women between
the ages of 18 and 24 that have completed primary school in the public system and/or schools
with an Agreement with the public system, have limited resources, are from urban and
suburban areas, and are unemployed.
In order for a young person to be considered eligible for the program, he or she must have a
per capita family income below the poverty line 3 and meet one of the following
requirements:
• Electricity consumption per family. The government has determined that households
with consumption equal to or less than 70 kWh per month are charged a “Dignity”
rate because they are considered to be low-income families. Consequently, youth that
3 The poverty line values are updated once they are published by the National Statistics Institute (INE) and take effect for eligibility evaluations performed for potential beneficiaries following the data’s publication by the INE.
0
50
100
150
200
250
0
20000
40000
60000
80000
100000
120000
140000
160000
2009 2010 2011 2012 2013
Pregnancies. Left axis Children <2 years. Left axis Expenditure (millions of Bs.). Right axis
- 13 -

come from households that consume up to 70 kWh of electricity are also considered
low-income.
• Type of educational institution. The Bolivian Government has established that the
Juancito Pinto Grant will be directed to children that study in state educational
institutions or those that have agreements with the state, with the assumption that
these institutions provide services to low-income families. This government-defined
criterion is one of those adopted by the Program. Consequently, youth from state
secondary schools or those with an agreement with the state meet the eligibility
criteria established by the Program.
Implementation of the program began as a pilot in five cities (El Alto, La Paz, Santa Cruz de la
Sierra, Cochabamba, and Montero) in 2009 and was extended to mid-2010, reaching a total
of 2,562 beneficiaries. Following an evaluation process with an eye toward beginning the
expansion phase, the program’s design was modified, coverage was expanded to the cities of
Tarija and Sucre and the management of the program in Santa Cruz de la Sierra and Montero
was combined.
The expansion phase was finally launched at the beginning of 2012 and was expected to be
completed in the first semester of 2015, with a total of 1,400 young people trained. Beginning
in July 2015, the Ministry of Labor, Employment, and Social Security (MTEPS) will launch a
third phase of the program, increasing coverage to the nine departmental capital cities and
Ciudad del Alto, in addition to 5 medium-sized cities with more than 50,000 inhabitants.
During the next 5 years, the program is expected to provide 1,200 beneficiaries per year with
basic and intermediate technical degrees.
In budget terms, even though the program received budget increases throughout the period,
with the most significant in 2014, its implementations capabilities were weak. On average it
has not surpassed an annual execution of more than 50% of its resources.
- 14 -

Figure 3.3. Budget vs. spending for the MPED. 2010-2014. (in millions de BS$)
Source: National Coordination Unit of the MPED – MTEPS.
IV. Analysis of the effectiveness of the programs’ targeting mechanisms
4.1 Juancito Pinto Grant (BJP)
In the case of the BJP, two analyses of the targeting mechanism were performed utilizing the
2012 Household Survey. First, the program’s exclusion errors were analyzed, and secondly
we evaluated whether or not the categorical selection criterion showed a relationship with
the beneficiary household’s socioeconomic status.
Analysis of targeting errors in the BJP. The program’s target population is students under
age 18 that are enrolled in the first 8 years of formal education in public educational
institutions and private institutions with agreements with the state. Table 4.1 shows the
distribution of beneficiaries by the type of educational institution they attend.
42.7% 38.9% 45.7% 48.4% 42.5% -
5.00
10.00
15.00
20.00
25.00
2010 2011 2012 2013 2014
Budget Spending
- 15 -

Table 4.1. Distribution of the beneficiaries of the Juancito Pinto Grant by educational institution and area of residence.
2012
Type of educational institution
Total Urban Rural
Public or State 91.1% 85.7% 98.7% Private with agreement 8.9% 14.2% 1.3% Private 0.0% 0.0% 0.0% Source: Authors’ elaboration based on the ECH (2012)
According to the information provided by the 2012 ECH, the majority of the program’s
beneficiaries attend public institutions, while less than 10% attend private schools with
agreements.
With the goal of determining if the program is making exclusion errors, Table 4.2 presents
the distribution of students under age 18 that have studied up to the eighth year of formal
education, according to whether or not they receive the BJP transfer.
Table 4.2. Distribution of students up to the 8th year in public schools by their beneficiary status.
2012
Institution Non-beneficiaries Beneficiaries Total
Public or State 18.69 81.31 100
Private with agreement 24.35 75.65 100
Source: Authors’ elaboration based on the ECH (2012)
The results presented in Table 3 suggest the existence of some 18.7% of students up to the
eighth grade in state institutions and 24.4% of those that attend private schools with state
agreements that do not receive the BJP’s cash transfer.
Analysis of the incidence of poverty in the BJP. Even though it is not explicitly explained in
the law that created the program, it is possible that the categorical selection related to the
presence of state funding in the schools that are the target of the program is related to the
- 16 -

objective of incentivizing the accumulation of human capital among the population that
attends those schools. Additionally, it is assumed that the population that attends public
schools or private ones with state agreements is poor and requires this type of incentive for
the formation of human capital. Table 4 shows the incidence of poverty among students
under age 18 by the type of educational institution that they attend.
Table 4.3. Incidence of poverty among children up to 8th grade,
by educational institution. 2012
Institution/Area Total Urban Rural Public – State 58.76 50.82 68.6 Private with agreement 40.63 39.05 62.88 Private 18.47 18.42 19.76
Source: Authors’ elaboration based on the ECH (2012)
Although the incidence of poverty among students at public institutions and private
institutions with state agreements is greater than that among private institutions, there is a
high percentage of non-poor students in those institutions. In effect, some 41.2% of the
students at state schools and 59.4% of those that attend schools that have agreements with
the state are not poor. Figure 4.1 shows that the presence of BJP beneficiaries among the
above 60 percent of the income distribution in private institutions with agreements is much
important than in public institutions. Finally, the use of public funding at schools as a proxy
of poverty, leads to inclusion errors based on the mechanism’s design, especially for private
schools with agreements, and to exclusion errors as almost 20% of students in private
institutions is poor.
- 17 -

Figure 4.1. Distribution of Juancito Pinto beneficiaries by quintile of household income and educational institution
2012
Source: Authors’ elaboration based on the ECH (2012)
In conclusion, if one assumes that the objective of the BJP is to support poor children so that
they complete their secondary education, then the targeting mechanism, based on its design,
creates inclusion errors (non-poor children that attend public schools or those with state
agreements) as well as exclusion errors (poor children that attend private schools).
4.2 . Juana Azurduy Mother-Child Grant (BJA)
Just as we performed with the Juancito Pinto Grant, in this section we undertake an
evaluation of the application of the program’s targeting mechanisms and an analysis of the
incidence of poverty.
Analysis of targeting errors in the BJA. Table 4.4 shows the distribution of women by their
status as beneficiaries of the Juana Azurduy Grant and whether they care for children under
age 2.
0
5
10
15
20
25
30
35
I II III IV V
Public - state Private with agreement
- 18 -

Table 4.4. Beneficiaries of the BJA by presence of children under age 2. 2012
Beneficiary Without children under age 2 11.6%
With children under age 2 88.4%
Total 100% Source: Authors’ elaboration based on the ECH (2012)
Of the total number of women enrolled in the Juana Azurduy Grant, 88.4% have children
under age two, while the remaining 11.6% do not have children. Of the total number of
women in the latter group, 26.4% of them are pregnant and thus eligible for the grant.
With the goal of obtaining a better understanding of the profile of the program’s
beneficiaries, Table 4.5 presents the distribution of beneficiary women in the Juana Azurduy
Grant program by the type of healthcare coverage they have.
Table 4.5. Beneficiaries of the Juana Azurduy Stipend
by type of healthcare coverage. 2012
Beneficiaries No coverage 81.89 National Healthcare Fund 8.83 Departmental Government Health Insurance 7.79 Private 1.49 Total 100
Source: Authors’ elaboration based on the ECH (2012)
Of the total number of beneficiaries, 81.9% do not have short-term coverage, while 8.8% are
covered by social security in health. In addition, 7.8% of the women beneficiaries have health
insurance from the departmental governments. Finally, 1.5% of beneficiaries state that they
have private healthcare coverage. These latter three categories of coverage signal clear
inclusion errors. Although this inclusion error is small, concerns emerge related to the failings
of the operational mechanisms of the categorical selection tool, inasmuch as it is not possible
to clearly identify the type of coverage that some beneficiaries enjoy.
- 19 -

Keeping the eligibility criteria around the coverage of social security in health is a good proxy
to the households’ level of poverty. Table 4.6 shows the distribution of women according to
their level of poverty and the type of health coverage they have and it ratifies a strong
correlation between the lack of health coverage and poverty. In effect, of the individuals that
belong to poor households, one observes that 83% do not have health coverage.
Table 4.6. Incidence of poverty and type of health insurance. 2012
Non-poor Poor No coverage 61.85 83.09 National Healthcare Fund 26.45 7.76 Universal Maternal-Infant Insurance 2.13 3.52 Departmental Government Health Insurance 5.99 4.46 Private 3.38 0.84 Other 0.2 0.33 Total 100 100
Source: Authors’ elaboration based on the ECH (2012)
However, the table also shows a strong correlation between the lack of coverage and not
being poor, with almost 62% of the non-poor also not having healthcare coverage. These
results suggest that the use of the category of no healthcare coverage could also create an
inclusion error based on the mechanism’s design.
Analysis of the incidence of poverty in the BJA. A poverty incidence analysis was undertaken,
for which status as a beneficiary of the program was compared to level of poverty (Table 4.7)
among the BJA’s target population.
- 20 -

Table 4.7. Status as BJA beneficiary and level of poverty. 2012
Beneficiary Non-beneficiary Total Poor 14.2% 33.5% 47.6% Non-poor 10.7% 41.6% 52.4% Total 24.9% 75.1% 100%
Source: Authors’ elaboration based on the ECH (2012)
Based on these values, if one adds a household’s level of poverty to the categorical eligibility
criteria, then the exclusion error is 33.5% and the inclusion error is 10.7%. In terms of the first
error, it is associated with the program’s operational problems, insomuch as it does not
manage to reach the entire population of potentially eligible individuals. Figure 4.2 shows
that almost 23% of beneficiaries of the BJA of the third quintile of income distribution, a
population group that is vulnerable and eventually only exceeds the poverty line after
receiving a transfer from the program. Finally, the existence of 25% of beneficiaries in the
two highest quintiles of income distribution could be explained by the inclusion errors
created by the lack of objective mechanism of verifying the coverage of social security in
health (the program uses self declaration instead of cross data base checking).
Figure 4.2. Distribution of Juana Azurduy beneficiaries by quintile of household income
2012
Source: Authors’ elaboration based on the ECH (2012)
24.4627.25
22.91
13.33 12.05
0
5
10
15
20
25
30
I II III IV V
%
Quintile of income
- 21 -

Figure 4.3 shows the Pen’s Parade of the beneficiaries according to the household’s gross per capita
income net of the transfers received from the Juana Azurduy Grant along with the value of the official
poverty line. The objective is to obtain a better understanding of the importance of the value of the
transfer on the level of household income. The results uncovered suggest a null impact from the
stipend on individual income levels.
Figure 4.3. Pen’s parade for the beneficiaries according to gross income and net of the transfer from the Juana Azurduy Grant.
2012
Source: Authors’ elaboration based on the ECH (2012)
4.3 . My First Decent Job (MPED)
The “My First Decent Job” Program’s principal objective is to increase labor insertion and
improve employability of young people. It is aimed at men and women between the ages of
18 and 24 that have completed primary school in public schools or those with agreements
with the state, have low income, are from urban and suburban areas, and are unemployed.
As was mentioned previously, an individual targeting mechanism based on simple means
testing is applied which combines a self-declared household income with the presentation of
an energy bill or demonstration of attendance at a public educational institution. The
0
1000
2000
3000
4000
5000
6000
7000Per capita householdincome
Per capita householdincome net of thestipendPoverty line
- 22 -

program’s eligibility limits are a per capita income below the poverty line and household
energy consumption below 70 kWh.
Due to the impossibility of identifying the beneficiaries via the ongoing household survey, the
following paragraphs present an approximation of the target population based on estimating
electricity expenditure, the type of educational institution that young persons attended, and
their level of poverty.
Household expenditure on electricity associated with consumption less than 70 kWh per
month is calculated based on the information presented in Table 4.8:
Table 4.8. Rate table for electricity consumption4
Charges Consumption band Unit Value
Fixed Charge Bs/month 22.420 Variable Charges 1st Block 0 to 50 Bs/kWh 0.065 2nd Block 51 to 140 Bs/kWh 0.414 3rd Block 141 to 300 Bs/kWh 0.380 4th Block 301 to 500 Bs/kWh 0.408 5th Block Above 500 Bs/kWh 0.439 Source: Supervision and Social Control Authority for Electricity
Based on this information, consumption of 70 kWh is equivalent to:
𝐺𝐺𝑖𝑖,𝑐𝑐≤70 = ($22.420 + 50𝑥𝑥$0.065 + 20𝑥𝑥$0.414)𝑥𝑥1.15 = 𝐵𝐵𝐵𝐵40
A household that spends up to Bs40 per month would be consuming less than 70 kWh during
said period. Based on this calculation, and with information from the ECH (2012), it is possible
to identify those households that consume less than 70 kWh per month.
Analysis of the incidence of poverty in the MPED. Figure 4.4 presents the distribution of the
population under age 24 that has completed primary school, according to their level of
4 An additional cost should be added to the total amount calculated here, representing the cost of Public Lighting which on average is equal to 15% of the total amount.
- 23 -
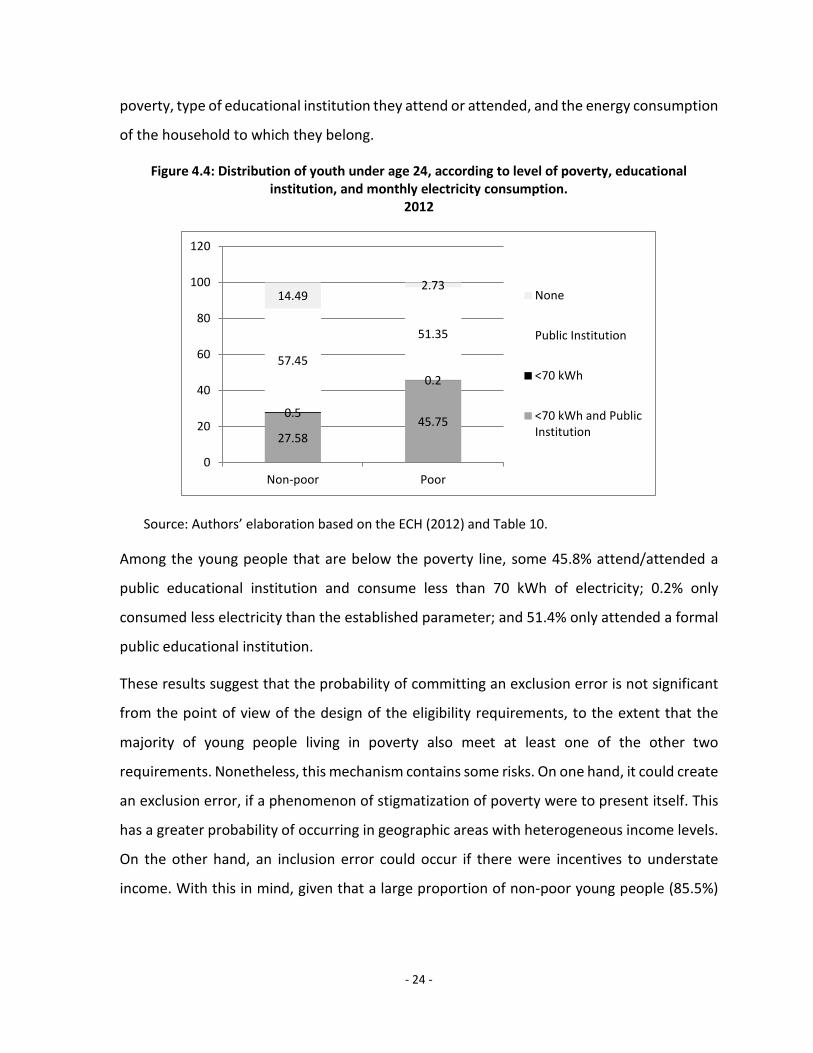
poverty, type of educational institution they attend or attended, and the energy consumption
of the household to which they belong.
Figure 4.4: Distribution of youth under age 24, according to level of poverty, educational institution, and monthly electricity consumption.
2012
Source: Authors’ elaboration based on the ECH (2012) and Table 10.
Among the young people that are below the poverty line, some 45.8% attend/attended a
public educational institution and consume less than 70 kWh of electricity; 0.2% only
consumed less electricity than the established parameter; and 51.4% only attended a formal
public educational institution.
These results suggest that the probability of committing an exclusion error is not significant
from the point of view of the design of the eligibility requirements, to the extent that the
majority of young people living in poverty also meet at least one of the other two
requirements. Nonetheless, this mechanism contains some risks. On one hand, it could create
an exclusion error, if a phenomenon of stigmatization of poverty were to present itself. This
has a greater probability of occurring in geographic areas with heterogeneous income levels.
On the other hand, an inclusion error could occur if there were incentives to understate
income. With this in mind, given that a large proportion of non-poor young people (85.5%)
27.5845.75
0.5
0.257.45
51.35
14.492.73
0
20
40
60
80
100
120
Non-poor Poor
None
Public Institution
<70 kWh
<70 kWh and PublicInstitution
- 24 -

meet at least one of the other requirements, there could be incentives to understate
household per capita income.
In this context, and considering institutional capabilities, one alternative in order to avoid
these risks is to utilize records for means testing. Having recognized this possibility, in the
future the Ministry of Labor, Employment, and Social Security has decided to use the results
of the Single Registry of Beneficiaries targeting mechanism implemented by the Ministry of
Development Planning for the Program. The next section analyzes the general characteristics
of the Registry and its potential to be used in Bolivia’s social protection programs.
V. Estimation of inclusion and exclusion errors in the new Single Registry of Beneficiaries
With the goal of improving the quality and coverage of the current and future registries of
beneficiaries of social programs in Bolivia, the Ministry of Development Planning, through the
Unit for Analysis of Social and Economic Policies (UDAPE), developed a targeting mechanism
known as the Single Registry of Beneficiaries (RUB) that utilizes the means testing method.
The Ministry of Development Planning aims to reach agreements with the social programs
operated by the various Ministries that utilize beneficiary selection mechanisms based on
vulnerability and/or poverty. Following the example of other countries, such as Peru’s
Household Selection System (SISFOH) and Colombia’s Social Program Potential Beneficiary
Identification System (SISBEN), a single, poverty-based targeting mechanism allows for
selection criteria to be standardized, reducing identification costs and improving the final
results of the targeting process.
The development of the RUB represents a planning and monitoring tool that would allow
policymakers to create a database of households and their members based on their
demographic and socioeconomic characteristics in order to categorize households according
to their level of poverty. The demographic and socioeconomic characteristics are collected
through a survey carried out in a census of households located in specific areas of the country.
The RUB uses a probit model in order to estimate the probability that an individual/household
will be below the poverty line as a function of the data collected by the RUB survey. The
- 25 -

objective is not just to determine the significance of the collected variables, but also to
establish an estimate of the potential exclusion and inclusion errors that could occur.
The regressors to be considered are divided into 3 groups of variables:
i. Personal characteristics: age, gender with a value of one if the individual is male,
educational level, and employment status.
ii. Characteristics of the residence: urban/rural, residential property, principal material
used in the walls.
iii. Household characteristics: mobile and fixed telephone ownership, household
members per room.
In order to evaluate the significance of the variables and the potential inclusion and exclusion
errors, we utilized data from the Ongoing Household Survey (ECH) from 2012. The survey’s
objective is to generate and follow indicators on the incidence of poverty, wellbeing, and the
population’s living conditions. The survey is performed at a national level, covering both
urban and rural areas. Therefore, the study population included the sum of all private
residences and their occupants in urban and rural areas of the country.
Taking into consideration the demographic and socioeconomic variables from the RUB, we
performed a multivariate analysis designed to estimate the probability of belonging to a poor
household as a function of this set of characteristics.
The estimates undertaken show a good regression adjustment, with a success ratio
equivalent to 69%. As was expected, the educational level is negatively associated with the
probability of being poor. Similarly, the number of household members per room positively
affects the likelihood of poverty. On the other hand, those households that reside in urban
areas and have fixed line and/or mobile telephone service are the households with the least
probability of falling below the poverty line.
People’s economic status significantly affects the probability that they are poor in terms of
income. In effect, being employed or unemployed has a lesser or greater impact on poverty,
respectively, in relation to inactivity.
- 26 -

Finally, the effects of home ownership are not so clear. The estimator of the dummy variable
that takes a value of one if the household residence is owned turns out to be statistically
significant and positive in terms of explaining the probability of being poor. Although this
result is counterintuitive, it is associated with the low variability of this characteristic among
the study population.
Table 5.1. Econometric results. Probability of being poor
Variables Coefficient Standard deviation z P>|z|
Male 0.0141255 0.037 0.380 0.701 Age 0.0043429 0.006 0.770 0.443 Age2 -0.0000503 0.000 -0.880 0.378 Identification Document 0.2563267** 0.113 2.270 0.023 Member of indigenous group 0.2210223*** 0.033 6.680 0.000 Healthcare coverage -0.4337224*** 0.036 -12.150 0.000 Primary education -0.3145823*** 0.060 -5.250 0.000 Secondary education -0.3815922*** 0.067 -5.650 0.000 Higher education -0.6860626*** 0.073 -9.350 0.000 Employed -0.2802988*** 0.053 -5.260 0.000 Unemployed 0.5471131*** 0.148 3.710 0.000 Homeowner 0.1365598*** 0.043 3.190 0.001 Renter -0.0259516 0.050 -0.510 0.607 Urban -0.0097166 0.047 -0.210 0.835 Walls with plaster -0.0061046 0.043 -0.140 0.886 Overcrowding (members/room) 0.2075785*** 0.015 13.780 0.000 Has a cell phone -0.1899203*** 0.040 -4.730 0.000 Has a fixed line telephone -0.1358767*** 0.045 -3.050 0.002 Water service via the public network -0.0431474 0.044 -0.980 0.325 Sewer service via the public network -0.2751582*** 0.045 -6.080 0.000 Electricity -0.3124525*** 0.059 -5.330 0.000 Constant 0.2488785 0.193 1.290 0.198 Number of observations 8415.0 Wald chi2(21) 1546.3 Prob > chi2 0.0 Pseudo R2 0.2 Log pseudolikelihood -4697.9 Success ratio 69.0%
- 27 -

Inclusion error 19.1% Exclusion error 11.9%
Source: Authors’ elaboration based on the ECH (2012)
Based on this theoretical exercise, we estimate that the design of the RUB generates an
inclusion error of 19.1% and an exclusion error of 11.9%. The exposure to these kinds of errors
is always present. Policymakers’ efforts focus on minimizing their presence, and this is
dependent on the number and type of characteristics that are gathered in order to
approximate the state of income poverty.
The definition of the target population based on its level of income poverty, requires some
mechanisms other than self-declaration in order to eliminate the risk of understatement. In
general, means testing mechanisms gather a set of characteristics related to the household,
the residence, and the members that make it up, and this is actually one of the causes of the
existence of these kinds of errors. In that regard, the characteristics of the residence, the
building materials for example, are aspects that are more linked to the concept of structural
poverty or to unmet basic needs (NBI) than to a lack of resources. In general, the correlation
between the direct and indirect concepts of poverty is not one-to-one, due to the fact that a
lack of resources does not necessarily mean there are unmet needs, given that goods and
services can come from public, family, accumulated capital sources.
Nonetheless, this exercise is a theoretical approximation of the potentially achievable results
with this mechanism based on a probit model. The final calibration of the mechanism should
be performed when it is put to use with a significant group of beneficiaries.
VI. Conclusions and future challenges
The Plurinational State of Bolivia launched the BJP, BJA, and MPED programs in 2006. They
are designed to promote the accumulation of human capital among households and improve
employability. The three programs are directed toward well-defined population groups and
present specific eligibility requirements. With the exception of the MPED, the programs’ goals
do not explicitly include covering the poor population. However, given that the challenges
- 28 -

that the BJP and BJA aim to cover are strongly correlated with a household’s poverty level
(secondary school desertion, infant malnutrition, and a lack of access to healthcare services),
in this paper we sought to evaluate the effectiveness of the targeting mechanisms for
covering the poor population. In order to do this, we evaluated the inclusion and exclusion
errors resulting from applying the mechanisms to the general population and to the
programs’ beneficiaries.
The inclusion and exclusion errors from the BJP and BJA are moderate when the effectiveness
of the design of the identification mechanism is evaluated. If one assumes that the objective
of the BJP is to support poor children to complete their secondary education, then the
targeting mechanism, based on its design, generates inclusion errors (non-poor children that
attend public schools or private schools with state agreements at a rate between 40% and
60% approximately) and exclusion errors (poor children that attend private schools at a rate
near 15%). In turn, the BJA, which considers not just the type of health insurance that the
beneficiary has, but also her level of poverty, generates a potential inclusion error of 10% and
an exclusion error of 33%.
Meanwhile, in the case of the MPED the probability of committing an exclusion error is not
significant in terms of the design of the eligibility requirements insomuch as the majority of
young people living in poverty also meet at least one of the other two targeting requirements
(formal education in the public system or a private school with a state agreement and
household electricity consumption at the social rate level). In any case, the mechanism
contains some risk of generating inclusion errors associated with the household income level
requirement because incentives to understate income could exist, especially within the group
of non-poor young people that meets the selection criteria (some 85% of non-poor youth
meet at least one of these requirements).
Keeping in mind the limitations of identifying the poor population as demonstrated by the
mechanisms evaluated in the three programs, one notes a future opportunity to begin to use
the results of the means testing selection mechanism developed under the auspices of the
Single Registry of Beneficiaries (RUB), as implemented by the Ministry of Development
- 29 -

Planning (MPD). This tool attempts to obtain an estimate of individuals’ level of income
poverty, according to a set of characteristics related to their residences, households, and
household members. The results of an initial evaluation of the tool’s effectiveness have
shown low inclusion and exclusion errors—fewer than those generated by the current
mechanisms.
The MPD is in the process of collecting household data and is beginning to reach agreements
with the various social programs so they can use this targeting mechanism. Accordingly, the
MPED decided to utilize the results of the RUB once it has covered the program’s target cities.
Subsequent agreements with other social programs will improve their effectiveness in terms
of targeting, while at the same time increasing their efficiency by decreasing the cost of
beneficiary selection.
Clearly, this entails a very significant qualitative change, insofar as the use of the RUB involves
explicitly stating the poverty level as an eligibility criterion for social protection transfer
programs.
- 30 -

VII. Bibliography
Atkinson, A., 1995. On Targeting Social Security: Theory and Western Experiences with Family Benefits. 1995. In Van de Walle, D. y K. Nead, Public Spending and the Poor: Theory and Practice. John Hopkins University Press, pp. 25-68. Cecchini, S. and Madariaga, A., 2012. Programas de Transferencias Condicionadas. Balance de la Experiencia Reciente en América Latina y el Caribe. Economic Commission for Latin America and the Caribbean, Santiago de Chile, Chile. Cornia, G. and Stewart, F., 1992. Two errors of targeting. Washington, DC.
Orichuela, R. and Daga, S., 2012. Transferencias Monetarias Condicionadas en Bolivia: el Bono Juancito Pinto. In Desarrollo Económico y Pobreza en América Latina. El rol de los Planes Sociales. Asociación de Iberoamericanos por la Libertad, Madrid, España.
Vidal Fuertes, Cecilia; Martínez, Sebastián; Celhay, Pablo; and Claros Gómez, Sdenka, 2015. Evaluación de Impacto Bono Juana Azurduy. Unidad de Análisis de Políticas Sociales y Económicas (UDAPE), La Paz, Bolivia.
- 31 -

Social Protection & Labor Discussion Paper Series Titles 2013-2015
No. Title 1507 Integrating Disaster Response and Climate Resilience in Social Protection Programs in the Pacific
Island Countries by Cecilia Costella and Oleksiy Ivaschenko, September 2015 1506 Effectiveness of Targeting Mechanisms Utilized in Social Protection Programs in Bolivia by Ignacio Apella and Gastón Blanco, September 2015 1505 Kyrgyz Republic: Social Sectors at a Glance by João Pedro Azevedo, Paula Calvo, Minh Nguyen and Josefina Posadas, August 2015 1504 Entering the City: Emerging Evidence and Practices with Safety Nets in Urban Areas by Ugo Gentilini, July 2015 1503 Pension Patterns in Sub-Saharan Africa by Mark Dorfman, July 2015 1502 Social Protection in Fragile and Conflict-Affected Countries: Trends and Challenges by Mirey Ovadiya, Adea Kryeziu, Syeda Masood and Eric Zapatero, April 2015 1501 Defining, Measuring, and Benchmarking Administrative Expenditures of Mandatory Social Security
Programs by Oleksiy Sluchynsky, February 2015
1425 Old-Age Financial Protection in Malaysia: Challenges and Options by Robert Holzmann, November 2014 1424 Profiling the Unemployed: A Review of OECD Experiences and Implications for Emerging Economies by Artan Loxha and Matteo Morgandi, August 2014 1423 Any Guarantees? An Analysis of China’s Rural Minimum Living Standard Guarantee Program by Jennifer Golan, Terry Sicular and Nithin Umapathi, August 2014 1422 World Bank Support for Social Safety Nets 2007-2013: A Review of Financing, Knowledge Services
and Results by Colin Andrews, Adea Kryeziu and Dahye Seo, June 2014 1421 STEP Skills Measurement Surveys: Innovative Tools for Assessing Skills
by Gaëlle Pierre, Maria Laura Sanchez Puerta, Alexandria Valerio and Tania Rajadel, July 2014
1420 Our Daily Bread: What is the Evidence on Comparing Cash versus Food Transfers? by Ugo Gentilini, July 2014

1419 Rwanda: Social Safety Net Assessment by Alex Kamurase, Emily Wylde, Stephen Hitimana and Anka Kitunzi, July 2012 1418 Niger: Food Security and Safety Nets by Jenny C. Aker, Carlo del Ninno, Paul A. Dorosh, Menno Mulder-Sibanda and Setareh Razmara,
February 2009 1417 Benin: Les Filets Sociaux au Bénin Outil de Réduction de la Pauvreté
par Andrea Borgarello et Damien Mededji, Mai 2011 1416 Madagascar Three Years into the Crisis: An Assessment of Vulnerability and Social Policies and
Prospects for the Future by Philippe Auffret, May 2012 1415 Sudan Social Safety Net Assessment
by Annika Kjellgren, Christina Jones-Pauly, Hadyiat El-Tayeb Alyn, Endashaw Tadesse and Andrea Vermehren, May 2014
1414 Tanzania Poverty, Growth, and Public Transfers: Options for a National Productive Safety Net
Program by W. James Smith, September 2011
1413 Zambia: Using Social Safety Nets to Accelerate Poverty Reduction and Share Prosperity by Cornelia Tesliuc, W. James Smith and Musonda Rosemary Sunkutu, March 2013
1412 Mali Social Safety Nets
by Cécile Cherrier, Carlo del Ninno and Setareh Razmara, January 2011 1411 Swaziland: Using Public Transfers to Reduce Extreme Poverty
by Lorraine Blank, Emma Mistiaen and Jeanine Braithwaite, November 2012 1410 Togo: Towards a National Social Protection Policy and Strategy
by Julie van Domelen, June 2012 1409 Lesotho: A Safety Net to End Extreme Poverty
by W. James Smith, Emma Mistiaen, Melis Guven and Morabo Morojele, June 2013 1408 Mozambique Social Protection Assessment: Review of Social Assistance Programs and Social
Protection Expenditures by Jose Silveiro Marques, October 2012
1407 Liberia: A Diagnostic of Social Protection
by Andrea Borgarello, Laura Figazzolo and Emily Weedon, December 2011 1406 Sierra Leone Social Protection Assessment
by José Silvério Marques, John Van Dyck, Suleiman Namara, Rita Costa and Sybil Bailor, June 2013

1405 Botswana Social Protection by Cornelia Tesliuc, José Silvério Marques, Lillian Mookodi, Jeanine Braithwaite, Siddarth Sharma and Dolly Ntseane, December 2013
1404 Cameroon Social Safety Nets
by Carlo del Ninno and Kaleb Tamiru, June 2012 1403 Burkina Faso Social Safety Nets
by Cécile Cherrier, Carlo del Ninno and Setareh Razmara, January 2011 1402 Social Insurance Reform in Jordan: Awareness and Perceptions of Employment Opportunities for
Women by Stefanie Brodmann, Irene Jillson and Nahla Hassan, June 2014 1401 Social Assistance and Labor Market Programs in Latin America: Methodology and Key Findings from
the Social Protection Database by Paula Cerutti, Anna Fruttero, Margaret Grosh, Silvana Kostenbaum, Maria Laura Oliveri, Claudia
Rodriguez-Alas, Victoria Strokova, June 2014 1308 Youth Employment: A Human Development Agenda for the Next Decade by David Robalino, David Margolis, Friederike Rother, David Newhouse and Mattias Lundberg, June
2013 1307 Eligibility Thresholds for Minimum Living Guarantee Programs: International Practices and
Implications for China by Nithin Umapathi, Dewen Wang and Philip O’Keefe, November 2013
1306 Tailoring Social Protection to Small Island Developing States: Lessons Learned from the Caribbean by Asha Williams, Timothy Cheston, Aline Coudouela and Ludovic Subran, August 2013 1305 Improving Payment Mechanisms in Cash-Based Safety Net Programs by Carlo del Ninno, Kalanidhi Subbarao, Annika Kjellgren and Rodrigo Quintana, August 2013 1304 The Nuts and Bolts of Designing and Implementing Training Programs in Developing Countries
by Maddalena Honorati and Thomas P. McArdle, June 2013 1303 Designing and Implementing Unemployment Benefit Systems in Middle and Low Income Countries:
Key Choices between Insurance and Savings Accounts by David A. Robalino and Michael Weber, May 2013 1302 Entrepreneurship Programs in Developing Countries: A Meta Regression Analysis by Yoonyoung Cho and Maddalena Honorati, April 2013 1301 Skilled Labor Flows: Lessons from the European Union by Martin Kahanec, February 2013 To view Social Protection & Labor Discussion papers published prior to 2013, please visit www.worldbank.org/spl.
S e p t e m b e r 2 0 1 5
Abstract
As part of the 2006–2011 National Development Plan, the Plurinational State of Bolivia launched two cash transfer programs and one youth labor training program aimed at promoting the accumulation of households’ human capital: the Juancito Pinto Educational Grant, the Juana Azurduy Mother-Child Grant, and My First Decent Job. The objective of this paper is to analyze the effectiveness of the targeting mechanisms utilized in these programs. Based on the information provided by the Ongoing Household Survey, we estimate the mechanisms’ potential inclusion and exclusion errors. The results permit us to suggest that the categorical selection mechanisms used in the three programs are effective in reaching the poorest population, although they present distinct levels of inclusion and exclusion errors associated with both the design and implementation problems of the particular mechanism utilized.
Effectiveness of Targeting Mechanisms Utilized in Social
Protection Programs in Bolivia
Ignacio Apella and Gastón Blanco
D I S C U S S I O N P A P E R NO. 1506
© 2015 International Bank for Reconstruction and Development / The World Bank
About this series...
Social Protection & Labor Discussion Papers are published to communicate the results of The World Bank’s work to the development community with the least possible delay. This paper therefore has not been prepared in accordance with the procedures appropriate for formally edited texts.
The findings, interpretations, and conclusions expressed herein are those of the author(s), and do not necessarily reflect the views of the International Bank for Reconstruction and Development/The World Bank and its affiliated organizations, or those of the Executive Directors of The World Bank or the governments they represent. The World Bank does not guarantee the accuracy of the data included in this work. The boundaries, colors, denominations, and other information shown on any map in this work do not imply any judgement on the part of The World Bank concerning the legal status of any territory or the endorsement or acceptance of such boundaries.
For more information, please contact the Social Protection Advisory Service, The World Bank, 1818 H Street, N.W., Room G7-803, Washington, DC 20433 USA. Telephone: (202) 458-5267, Fax: (202) 614-0471, E-mail:[email protected] or visit us on-line at www.worldbank.org/spl.


