Effectiveness of Small Onshore Seawall in Reducing Forces Induced by Tsunami Bore
9
Oshnack, M. E. et al. Paper: Effectiveness of Small Onshore Seawall in Reducing Forces Induced by Tsunami Bore: Large Scale Experimental Study Mary Elizabeth Oshnack ∗ , Francisco Agu´ ı˜ niga ∗∗ , Daniel Cox ∗ , Rakesh Gupta ∗ , and John van de Lindt ∗∗∗ ∗ Oregon State University, Corvallis, Oregon 97331-3212, USA E-mail: [email protected], [email protected] ∗∗ Texas A&M University-Kingsville, Kingsville, Texas 78363-8203, USA ∗∗∗ Colorado State University, Fort Collins, CO 80523-1372, USA [Received August 15, 2009; accepted October 29, 2009] Tsunami force and pressure distributions on a rigid wall fronted by a small seawall were determined ex- perimentally in a large-scale wave flume. Six different seawall heights were examined, two of which were ex- posed to a range of solitary wave heights. The same experiment was done without a seawall for compar- ison. The measured wave profile contained incident offshore, incident broken, reflected broken, and trans- mitted wave heights measured using wire resistance and ultrasonic wave gauges. Small individual seawalls increased reflection of the incoming broken bore front and reduced force on the rigid landward wall. These findings agree well with published field reconnaissance on small seawalls in Thailand that showed a correla- tion between seawalls and reduced damage on land- ward structures. Keywords: tsunami hazard mitigation, tsunami inun- dation, tsunami risk reduction, tsunami defense strategy, wave forces 1. Introduction and Background 1.1. Significance of This Study The December 2004 Indian Ocean Tsunami visited tremendous loss of life and severe damage on coastal communities and infrastructure, reminding the world of the vulnerability of such communities and infrastructure in tsunami occurrence. Prior to this disaster, few research groups specifically studied tsunami force and subsequent structural failure modes, and many findings were based on field reconnaissance or small-scale experimentation rather than large-scale testing. While several experiments have been conducted on wave force on vertical walls, most have, again, been small-scale or considered regular or random waves rather than the unique solitary wave form and bore like loading conditions present during tsunamis. The experiments in this study provide large-scale data for tsunami-induced force and pressure on a stiff aluminum wall. As several field studies have found qualitative cor- relation between the presence of small seawalls and re- Fig. 1. Small seawall at Patong Beach, Phuket, Thailand (Photo courtesy of Robert Dalrymple). duced wave energy, this study provides quantitative data for tsunami loading on a rigid wall fronted by a small sea- wall. This analysis of the effectiveness of small seawalls in reducing wave force is expected to be valuable in help- ing protect coastal communities vulnerable to tsunamis. 1.2. Literature Review Numerous studies have covered generation and propa- gation of tsunamis through the open ocean; however, re- search on inundation and tsunami impacts on structures is less common. Wave force on vertical walls has long been studied, but most experiments have been small-scale. Theoretical pressure profiles from water-wave impact on walls have been studied in great detail by Peregrine (2003). Several hydraulic model studies have focused on tsunami loading on structures (Ramsden 1996; Thusyan- than and Madabhushi 2008; Arikawa, 2008). Ramsden (1996) focused on the impact of translatory waves (bores and dry-bed surges) rather than breaking waves on a ver- tical wall at a small scale, but his instrumentation did not resolve short-duration shock loads, and the measured force and moment should only be used for design re- lated to sliding and overturning failure, and are not ap- plicable to punching failure. Thusyanthan and Madab- 382 Journal of Disaster Research Vol.4 No.6, 2009
Transcript of Effectiveness of Small Onshore Seawall in Reducing Forces Induced by Tsunami Bore
Oshnack, M. E. et al.
Paper:
Effectiveness of Small Onshore Seawall in Reducing ForcesInduced by Tsunami Bore: Large Scale Experimental Study
Mary Elizabeth Oshnack∗, Francisco Aguıniga∗∗, Daniel Cox∗,Rakesh Gupta∗, and John van de Lindt∗∗∗
∗Oregon State University, Corvallis, Oregon 97331-3212, USAE-mail: [email protected], [email protected]
∗∗Texas A&M University-Kingsville, Kingsville, Texas 78363-8203, USA∗∗∗Colorado State University, Fort Collins, CO 80523-1372, USA
[Received August 15, 2009; accepted October 29, 2009]
Tsunami force and pressure distributions on a rigidwall fronted by a small seawall were determined ex-perimentally in a large-scale wave flume. Six differentseawall heights were examined, two of which were ex-posed to a range of solitary wave heights. The sameexperiment was done without a seawall for compar-ison. The measured wave profile contained incidentoffshore, incident broken, reflected broken, and trans-mitted wave heights measured using wire resistanceand ultrasonic wave gauges. Small individual seawallsincreased reflection of the incoming broken bore frontand reduced force on the rigid landward wall. Thesefindings agree well with published field reconnaissanceon small seawalls in Thailand that showed a correla-tion between seawalls and reduced damage on land-ward structures.
Keywords: tsunami hazard mitigation, tsunami inun-dation, tsunami risk reduction, tsunami defense strategy,wave forces
1. Introduction and Background
1.1. Significance of This StudyThe December 2004 Indian Ocean Tsunami visited
tremendous loss of life and severe damage on coastalcommunities and infrastructure, reminding the world ofthe vulnerability of such communities and infrastructurein tsunami occurrence. Prior to this disaster, few researchgroups specifically studied tsunami force and subsequentstructural failure modes, and many findings were based onfield reconnaissance or small-scale experimentation ratherthan large-scale testing. While several experiments havebeen conducted on wave force on vertical walls, mosthave, again, been small-scale or considered regular orrandom waves rather than the unique solitary wave formand bore like loading conditions present during tsunamis.The experiments in this study provide large-scale data fortsunami-induced force and pressure on a stiff aluminumwall. As several field studies have found qualitative cor-relation between the presence of small seawalls and re-
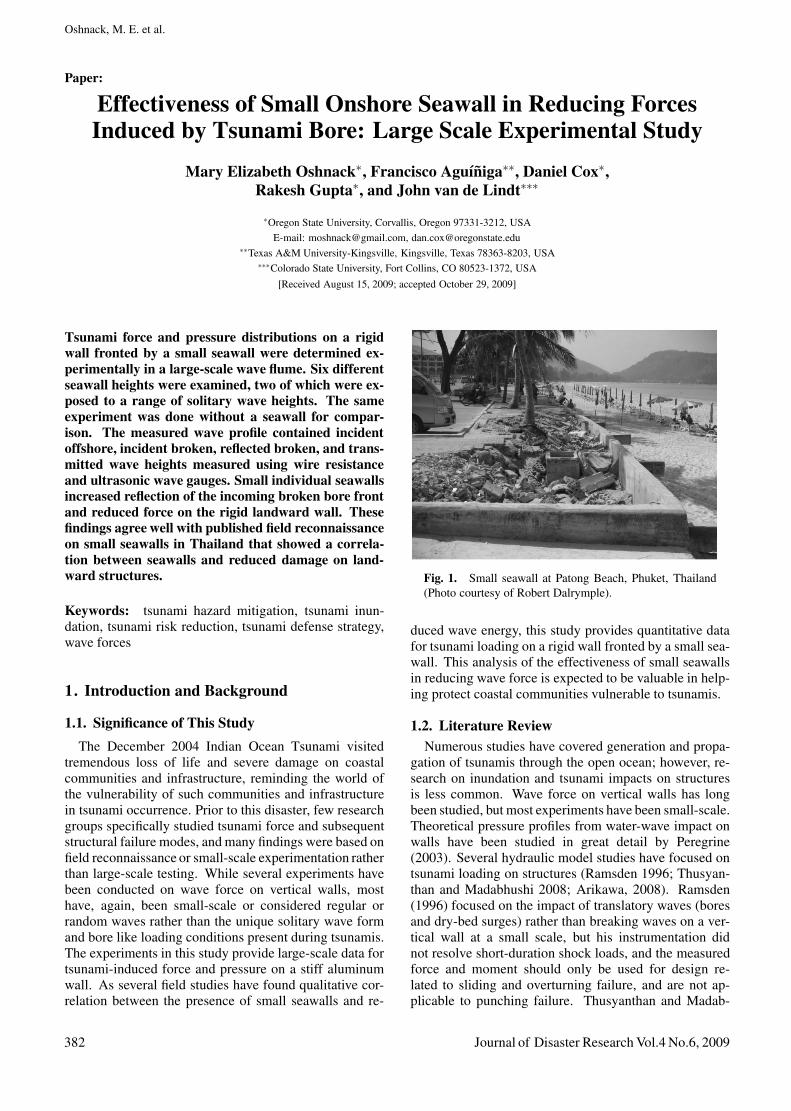
Fig. 1. Small seawall at Patong Beach, Phuket, Thailand(Photo courtesy of Robert Dalrymple).
duced wave energy, this study provides quantitative datafor tsunami loading on a rigid wall fronted by a small sea-wall. This analysis of the effectiveness of small seawallsin reducing wave force is expected to be valuable in help-ing protect coastal communities vulnerable to tsunamis.
1.2. Literature ReviewNumerous studies have covered generation and propa-
gation of tsunamis through the open ocean; however, re-search on inundation and tsunami impacts on structuresis less common. Wave force on vertical walls has longbeen studied, but most experiments have been small-scale.Theoretical pressure profiles from water-wave impact onwalls have been studied in great detail by Peregrine(2003). Several hydraulic model studies have focused ontsunami loading on structures (Ramsden 1996; Thusyan-than and Madabhushi 2008; Arikawa, 2008). Ramsden(1996) focused on the impact of translatory waves (boresand dry-bed surges) rather than breaking waves on a ver-tical wall at a small scale, but his instrumentation didnot resolve short-duration shock loads, and the measuredforce and moment should only be used for design re-lated to sliding and overturning failure, and are not ap-plicable to punching failure. Thusyanthan and Madab-
382 Journal of Disaster Research Vol.4 No.6, 2009
Effectiveness of Small Onshore Seawall in Reducing ForcesInduced by Tsunami Bore: Large Scale Experimental Study
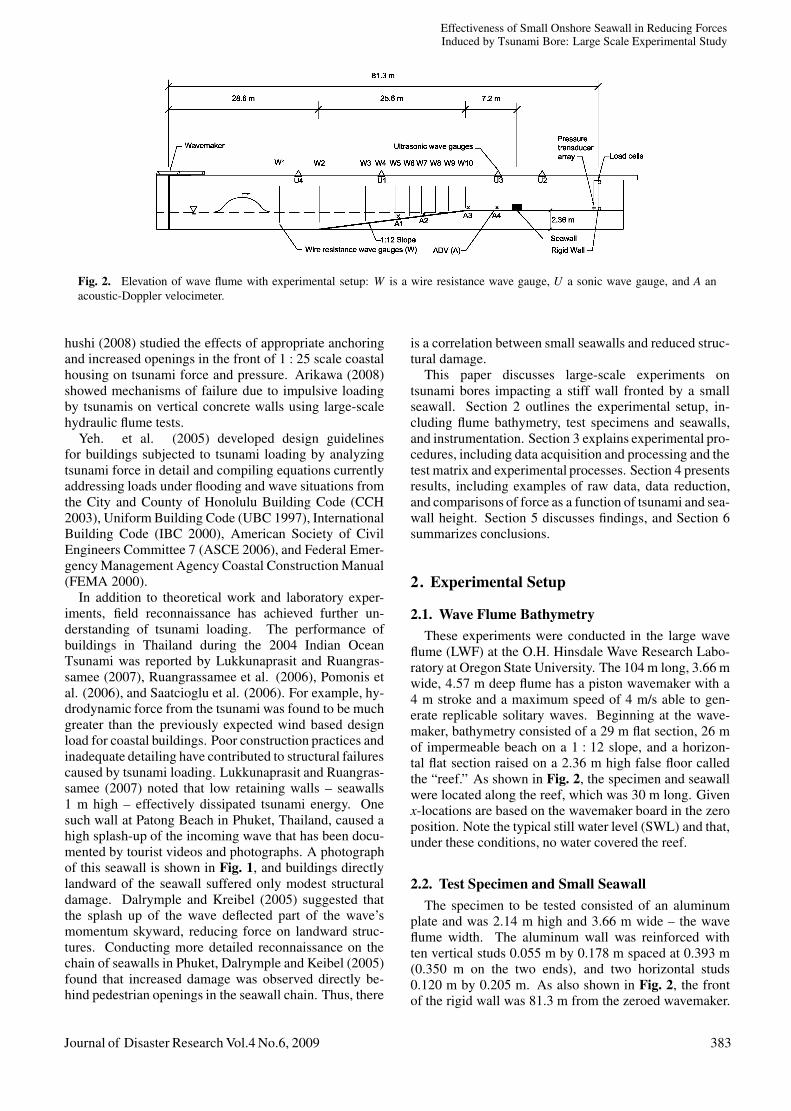
Fig. 2. Elevation of wave flume with experimental setup: W is a wire resistance wave gauge, U a sonic wave gauge, and A anacoustic-Doppler velocimeter.
hushi (2008) studied the effects of appropriate anchoringand increased openings in the front of 1 : 25 scale coastalhousing on tsunami force and pressure. Arikawa (2008)showed mechanisms of failure due to impulsive loadingby tsunamis on vertical concrete walls using large-scalehydraulic flume tests.
Yeh. et al. (2005) developed design guidelinesfor buildings subjected to tsunami loading by analyzingtsunami force in detail and compiling equations currentlyaddressing loads under flooding and wave situations fromthe City and County of Honolulu Building Code (CCH2003), Uniform Building Code (UBC 1997), InternationalBuilding Code (IBC 2000), American Society of CivilEngineers Committee 7 (ASCE 2006), and Federal Emer-gency Management Agency Coastal Construction Manual(FEMA 2000).
In addition to theoretical work and laboratory exper-iments, field reconnaissance has achieved further un-derstanding of tsunami loading. The performance ofbuildings in Thailand during the 2004 Indian OceanTsunami was reported by Lukkunaprasit and Ruangras-samee (2007), Ruangrassamee et al. (2006), Pomonis etal. (2006), and Saatcioglu et al. (2006). For example, hy-drodynamic force from the tsunami was found to be muchgreater than the previously expected wind based designload for coastal buildings. Poor construction practices andinadequate detailing have contributed to structural failurescaused by tsunami loading. Lukkunaprasit and Ruangras-samee (2007) noted that low retaining walls – seawalls1 m high – effectively dissipated tsunami energy. Onesuch wall at Patong Beach in Phuket, Thailand, caused ahigh splash-up of the incoming wave that has been docu-mented by tourist videos and photographs. A photographof this seawall is shown in Fig. 1, and buildings directlylandward of the seawall suffered only modest structuraldamage. Dalrymple and Kreibel (2005) suggested thatthe splash up of the wave deflected part of the wave’smomentum skyward, reducing force on landward struc-tures. Conducting more detailed reconnaissance on thechain of seawalls in Phuket, Dalrymple and Keibel (2005)found that increased damage was observed directly be-hind pedestrian openings in the seawall chain. Thus, there
is a correlation between small seawalls and reduced struc-tural damage.
This paper discusses large-scale experiments ontsunami bores impacting a stiff wall fronted by a smallseawall. Section 2 outlines the experimental setup, in-cluding flume bathymetry, test specimens and seawalls,and instrumentation. Section 3 explains experimental pro-cedures, including data acquisition and processing and thetest matrix and experimental processes. Section 4 presentsresults, including examples of raw data, data reduction,and comparisons of force as a function of tsunami and sea-wall height. Section 5 discusses findings, and Section 6summarizes conclusions.
2. Experimental Setup
2.1. Wave Flume BathymetryThese experiments were conducted in the large wave
flume (LWF) at the O.H. Hinsdale Wave Research Labo-ratory at Oregon State University. The 104 m long, 3.66 mwide, 4.57 m deep flume has a piston wavemaker with a4 m stroke and a maximum speed of 4 m/s able to gen-erate replicable solitary waves. Beginning at the wave-maker, bathymetry consisted of a 29 m flat section, 26 mof impermeable beach on a 1 : 12 slope, and a horizon-tal flat section raised on a 2.36 m high false floor calledthe “reef.” As shown in Fig. 2, the specimen and seawallwere located along the reef, which was 30 m long. Givenx-locations are based on the wavemaker board in the zeroposition. Note the typical still water level (SWL) and that,under these conditions, no water covered the reef.
2.2. Test Specimen and Small SeawallThe specimen to be tested consisted of an aluminum
plate and was 2.14 m high and 3.66 m wide – the waveflume width. The aluminum wall was reinforced withten vertical studs 0.055 m by 0.178 m spaced at 0.393 m(0.350 m on the two ends), and two horizontal studs0.120 m by 0.205 m. As also shown in Fig. 2, the frontof the rigid wall was 81.3 m from the zeroed wavemaker.
Journal of Disaster Research Vol.4 No.6, 2009 383
Oshnack, M. E. et al.
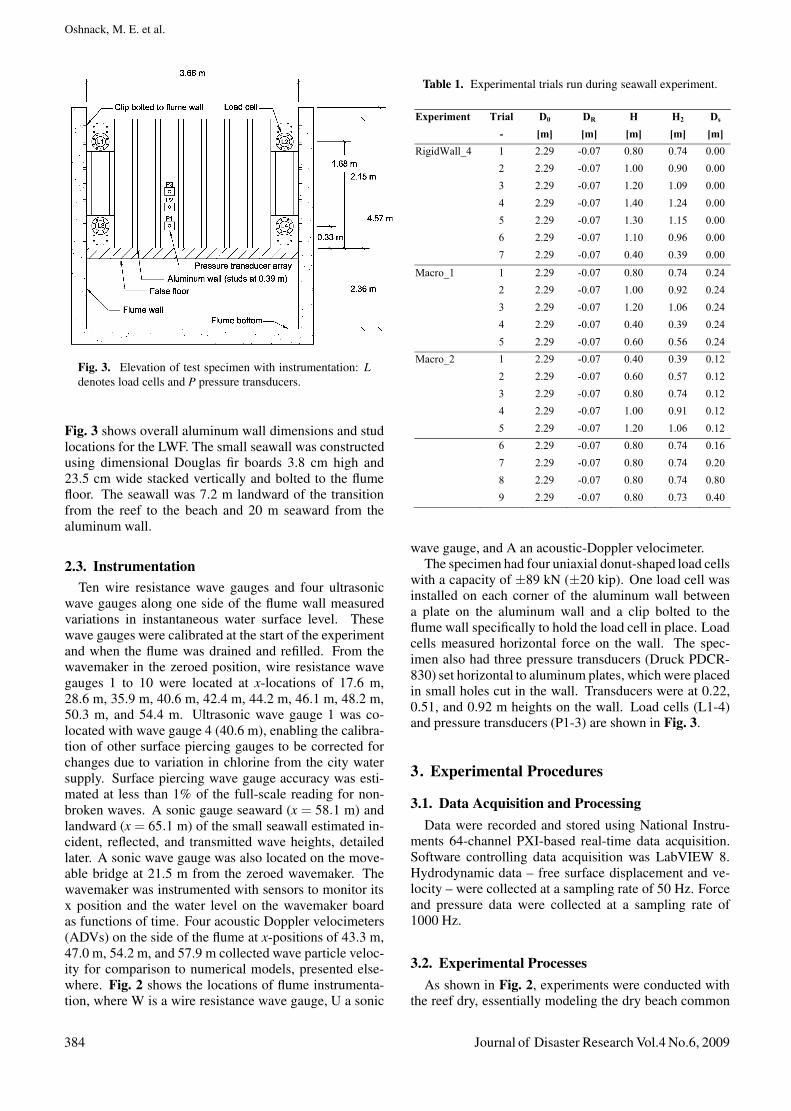
Fig. 3. Elevation of test specimen with instrumentation: Ldenotes load cells and P pressure transducers.
Fig. 3 shows overall aluminum wall dimensions and studlocations for the LWF. The small seawall was constructedusing dimensional Douglas fir boards 3.8 cm high and23.5 cm wide stacked vertically and bolted to the flumefloor. The seawall was 7.2 m landward of the transitionfrom the reef to the beach and 20 m seaward from thealuminum wall.
2.3. InstrumentationTen wire resistance wave gauges and four ultrasonic
wave gauges along one side of the flume wall measuredvariations in instantaneous water surface level. Thesewave gauges were calibrated at the start of the experimentand when the flume was drained and refilled. From thewavemaker in the zeroed position, wire resistance wavegauges 1 to 10 were located at x-locations of 17.6 m,28.6 m, 35.9 m, 40.6 m, 42.4 m, 44.2 m, 46.1 m, 48.2 m,50.3 m, and 54.4 m. Ultrasonic wave gauge 1 was co-located with wave gauge 4 (40.6 m), enabling the calibra-tion of other surface piercing gauges to be corrected forchanges due to variation in chlorine from the city watersupply. Surface piercing wave gauge accuracy was esti-mated at less than 1% of the full-scale reading for non-broken waves. A sonic gauge seaward (x = 58.1 m) andlandward (x = 65.1 m) of the small seawall estimated in-cident, reflected, and transmitted wave heights, detailedlater. A sonic wave gauge was also located on the move-able bridge at 21.5 m from the zeroed wavemaker. Thewavemaker was instrumented with sensors to monitor itsx position and the water level on the wavemaker boardas functions of time. Four acoustic Doppler velocimeters(ADVs) on the side of the flume at x-positions of 43.3 m,47.0 m, 54.2 m, and 57.9 m collected wave particle veloc-ity for comparison to numerical models, presented else-where. Fig. 2 shows the locations of flume instrumenta-tion, where W is a wire resistance wave gauge, U a sonic
Table 1. Experimental trials run during seawall experiment.
Experiment Trial D0 DR H H2 Ds
- [m] [m] [m] [m] [m]RigidWall_4 1 2.29 -0.07 0.80 0.74 0.00 2 2.29 -0.07 1.00 0.90 0.00 3 2.29 -0.07 1.20 1.09 0.00 4 2.29 -0.07 1.40 1.24 0.00 5 2.29 -0.07 1.30 1.15 0.00 6 2.29 -0.07 1.10 0.96 0.00 7 2.29 -0.07 0.40 0.39 0.00Macro_1 1 2.29 -0.07 0.80 0.74 0.24 2 2.29 -0.07 1.00 0.92 0.24 3 2.29 -0.07 1.20 1.06 0.24 4 2.29 -0.07 0.40 0.39 0.24 5 2.29 -0.07 0.60 0.56 0.24Macro_2 1 2.29 -0.07 0.40 0.39 0.12 2 2.29 -0.07 0.60 0.57 0.12 3 2.29 -0.07 0.80 0.74 0.12 4 2.29 -0.07 1.00 0.91 0.12 5 2.29 -0.07 1.20 1.06 0.12 6 2.29 -0.07 0.80 0.74 0.16 7 2.29 -0.07 0.80 0.74 0.20 8 2.29 -0.07 0.80 0.74 0.80 9 2.29 -0.07 0.80 0.73 0.40
wave gauge, and A an acoustic-Doppler velocimeter.The specimen had four uniaxial donut-shaped load cells
with a capacity of ±89 kN (±20 kip). One load cell wasinstalled on each corner of the aluminum wall betweena plate on the aluminum wall and a clip bolted to theflume wall specifically to hold the load cell in place. Loadcells measured horizontal force on the wall. The spec-imen also had three pressure transducers (Druck PDCR-830) set horizontal to aluminum plates, which were placedin small holes cut in the wall. Transducers were at 0.22,0.51, and 0.92 m heights on the wall. Load cells (L1-4)and pressure transducers (P1-3) are shown in Fig. 3.
3. Experimental Procedures
3.1. Data Acquisition and ProcessingData were recorded and stored using National Instru-
ments 64-channel PXI-based real-time data acquisition.Software controlling data acquisition was LabVIEW 8.Hydrodynamic data – free surface displacement and ve-locity – were collected at a sampling rate of 50 Hz. Forceand pressure data were collected at a sampling rate of1000 Hz.
3.2. Experimental ProcessesAs shown in Fig. 2, experiments were conducted with
the reef dry, essentially modeling the dry beach common
384 Journal of Disaster Research Vol.4 No.6, 2009
Effectiveness of Small Onshore Seawall in Reducing ForcesInduced by Tsunami Bore: Large Scale Experimental Study
Fig. 4. Example time series of data collected during atypical run corresponding to H2 = 0.74 m (H = 0.80 m),Ds = 0.12 m: (a) wavemaker displacement and free-surfacedisplacement on the wavemaker; (b) free surface profile:wire resistance wave gauges 1-5; (c) free surface profile: ul-trasonic wave gauges; (d) velocity measured by ADV 1, 2;(e) force; and (f) pressure measurements.
at urban waterfronts. While the wavemaker was zeroed,the water level was set at 2.38 m from the flume bot-tom, at which depth the water level was aligned with thepoint at which the bathymetry changed from beach toreef. The wavemaker was then fully retracted, decreas-ing the water level due to the finite flume volume. Thestill water depth (D0) with the wavemaker retracted was2.29 m, corresponding to −0.07 m below the reef (DR).The tsunami was modeled as an idealized solitary waveusing forward paddle movement typical in these studies.Because of the flume’s finite volume, this produced a stillwater level +0.03 m above the reef at the end of tests from40 < t < 55 s, as can be seen in Fig. 4(b).
Table 1 summarizes the trials. Experiment names andtrial numbers correspond to those in the experimentalnotebook supported under the Network for EarthquakeEngineering Simulation (NEES) program of the UnitedStates National Science Foundation. The RigidWall 1 ex-periment is the control group of trials in which force wasmeasured on the aluminum wall with no seawall for pro-tection, Macro 1 is testing of a 0.24 m seawall under a
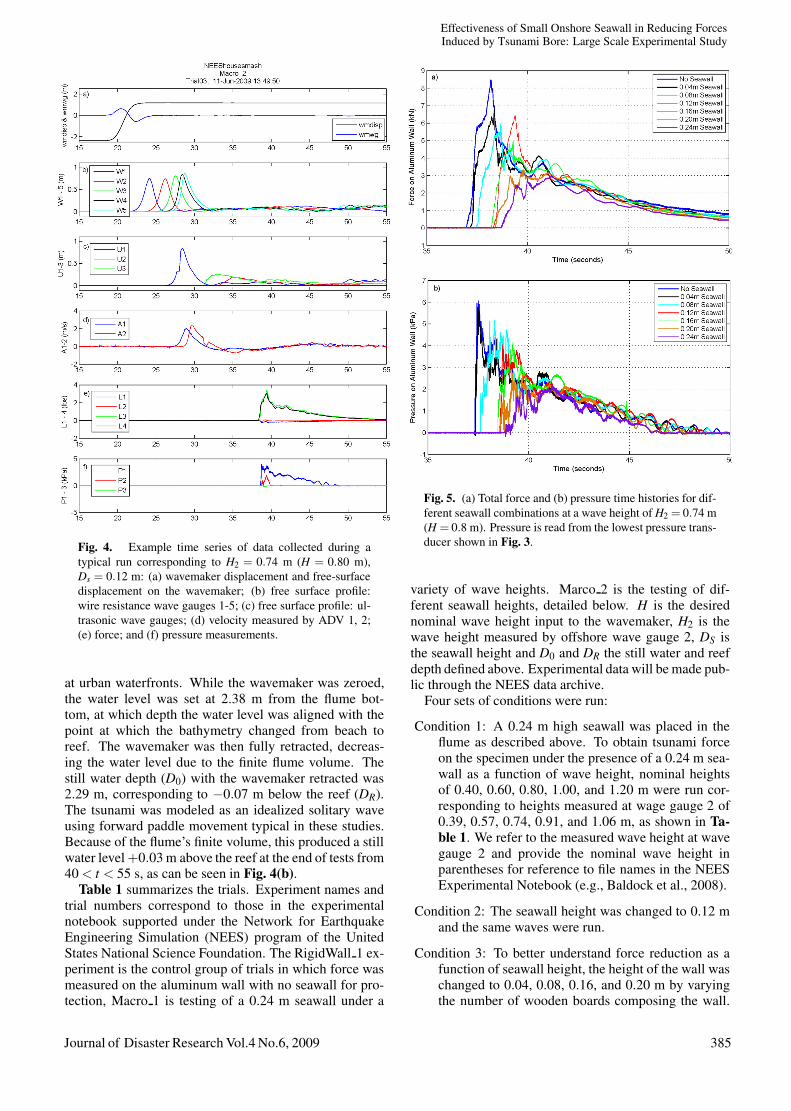
Fig. 5. (a) Total force and (b) pressure time histories for dif-ferent seawall combinations at a wave height of H2 = 0.74 m(H = 0.8 m). Pressure is read from the lowest pressure trans-ducer shown in Fig. 3.
variety of wave heights. Marco 2 is the testing of dif-ferent seawall heights, detailed below. H is the desirednominal wave height input to the wavemaker, H2 is thewave height measured by offshore wave gauge 2, DS isthe seawall height and D0 and DR the still water and reefdepth defined above. Experimental data will be made pub-lic through the NEES data archive.
Four sets of conditions were run:
Condition 1: A 0.24 m high seawall was placed in theflume as described above. To obtain tsunami forceon the specimen under the presence of a 0.24 m sea-wall as a function of wave height, nominal heightsof 0.40, 0.60, 0.80, 1.00, and 1.20 m were run cor-responding to heights measured at wage gauge 2 of0.39, 0.57, 0.74, 0.91, and 1.06 m, as shown in Ta-ble 1. We refer to the measured wave height at wavegauge 2 and provide the nominal wave height inparentheses for reference to file names in the NEESExperimental Notebook (e.g., Baldock et al., 2008).
Condition 2: The seawall height was changed to 0.12 mand the same waves were run.
Condition 3: To better understand force reduction as afunction of seawall height, the height of the wall waschanged to 0.04, 0.08, 0.16, and 0.20 m by varyingthe number of wooden boards composing the wall.
Journal of Disaster Research Vol.4 No.6, 2009 385
Oshnack, M. E. et al.
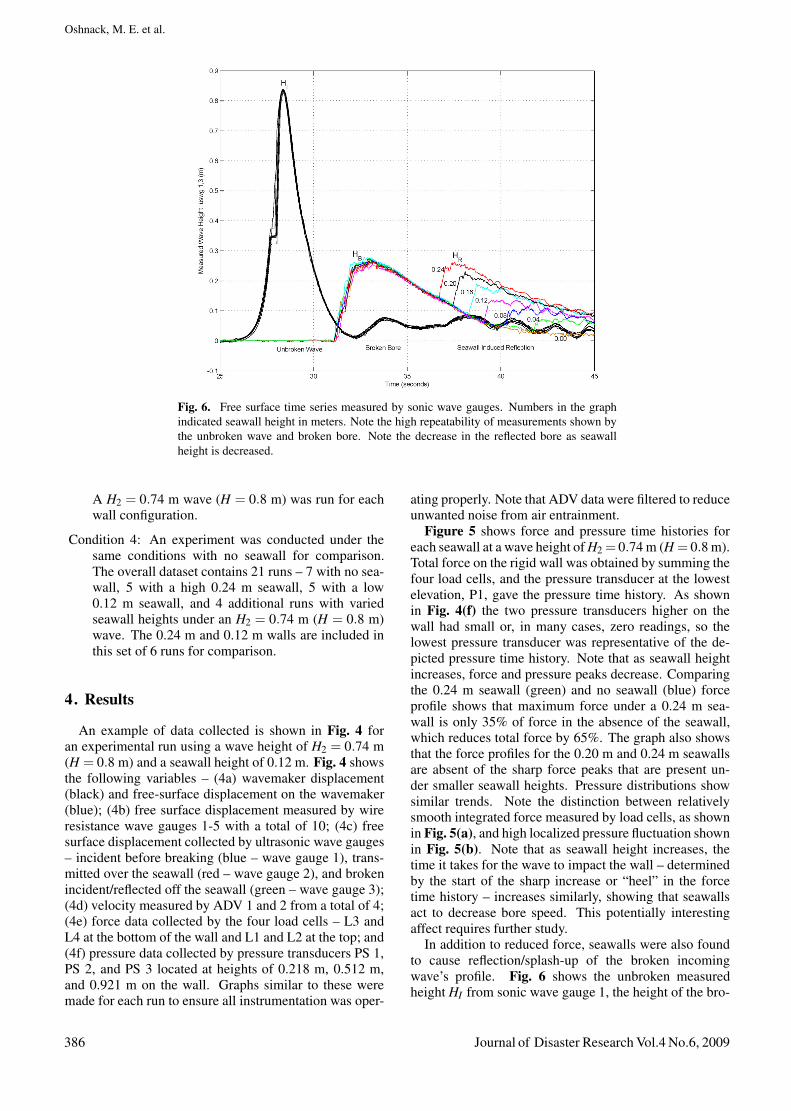
Fig. 6. Free surface time series measured by sonic wave gauges. Numbers in the graphindicated seawall height in meters. Note the high repeatability of measurements shown bythe unbroken wave and broken bore. Note the decrease in the reflected bore as seawallheight is decreased.
A H2 = 0.74 m wave (H = 0.8 m) was run for eachwall configuration.
Condition 4: An experiment was conducted under thesame conditions with no seawall for comparison.The overall dataset contains 21 runs – 7 with no sea-wall, 5 with a high 0.24 m seawall, 5 with a low0.12 m seawall, and 4 additional runs with variedseawall heights under an H2 = 0.74 m (H = 0.8 m)wave. The 0.24 m and 0.12 m walls are included inthis set of 6 runs for comparison.
4. Results
An example of data collected is shown in Fig. 4 foran experimental run using a wave height of H2 = 0.74 m(H = 0.8 m) and a seawall height of 0.12 m. Fig. 4 showsthe following variables – (4a) wavemaker displacement(black) and free-surface displacement on the wavemaker(blue); (4b) free surface displacement measured by wireresistance wave gauges 1-5 with a total of 10; (4c) freesurface displacement collected by ultrasonic wave gauges– incident before breaking (blue – wave gauge 1), trans-mitted over the seawall (red – wave gauge 2), and brokenincident/reflected off the seawall (green – wave gauge 3);(4d) velocity measured by ADV 1 and 2 from a total of 4;(4e) force data collected by the four load cells – L3 andL4 at the bottom of the wall and L1 and L2 at the top; and(4f) pressure data collected by pressure transducers PS 1,PS 2, and PS 3 located at heights of 0.218 m, 0.512 m,and 0.921 m on the wall. Graphs similar to these weremade for each run to ensure all instrumentation was oper-
ating properly. Note that ADV data were filtered to reduceunwanted noise from air entrainment.
Figure 5 shows force and pressure time histories foreach seawall at a wave height of H2 = 0.74 m (H = 0.8 m).Total force on the rigid wall was obtained by summing thefour load cells, and the pressure transducer at the lowestelevation, P1, gave the pressure time history. As shownin Fig. 4(f) the two pressure transducers higher on thewall had small or, in many cases, zero readings, so thelowest pressure transducer was representative of the de-picted pressure time history. Note that as seawall heightincreases, force and pressure peaks decrease. Comparingthe 0.24 m seawall (green) and no seawall (blue) forceprofile shows that maximum force under a 0.24 m sea-wall is only 35% of force in the absence of the seawall,which reduces total force by 65%. The graph also showsthat the force profiles for the 0.20 m and 0.24 m seawallsare absent of the sharp force peaks that are present un-der smaller seawall heights. Pressure distributions showsimilar trends. Note the distinction between relativelysmooth integrated force measured by load cells, as shownin Fig. 5(a), and high localized pressure fluctuation shownin Fig. 5(b). Note that as seawall height increases, thetime it takes for the wave to impact the wall – determinedby the start of the sharp increase or “heel” in the forcetime history – increases similarly, showing that seawallsact to decrease bore speed. This potentially interestingaffect requires further study.
In addition to reduced force, seawalls were also foundto cause reflection/splash-up of the broken incomingwave’s profile. Fig. 6 shows the unbroken measuredheight HI from sonic wave gauge 1, the height of the bro-
386 Journal of Disaster Research Vol.4 No.6, 2009
Effectiveness of Small Onshore Seawall in Reducing ForcesInduced by Tsunami Bore: Large Scale Experimental Study
Fig. 7. Reflected bore height measured by ultrasonic wavegauge 3 (a-red, magenta), and transmitted bore heights byultrasonic wave gauge 2 (b-red, magenta) as functions ofoffshore wave height measured by resistance wave gauge 2.Both cases of broken incident waves were measured by ul-trasonic wave gauge 1 (a, b-blue, green).
ken bore HB, and the height of the broken bore reflectedoff of the seawall, HR (both HB and HR were measuredby sonic wave gauge 3). As expected, the highest seawallcaused the greatest reflection – an HR/HB ratio of nearly1 – and the height of the reflected wave decreases withseawall height over the range of conditions tested. Fig. 6also shows the high level of repeatability in wave heightmeasurement. Note the similarity between offshore waveprofiles (black lines) even after breaking and the brokenbore (colored lines) before hitting the seawall. This highlevel of repeatability for incident and broken waves lendscredibility to reflection measurement. Fig. 7 shows max-imum broken incident (HB), broken reflected (HR), andtransmitted (HT ) waves for 0.12 and 0.24 m seawalls fora range of wave heights. Broken incident wave condi-tions are very similar regardless of seawall height, this isalso shown in Fig. 6, and the height of the broken inci-dent wave increases linearly as offshore wave height H2,measured by wave gauge 2, increases. Note that for the0.24 m seawall when HB is less than the height of theseawall, DS, reflection exceeds the incident broken waveheight. When HB is nearly equal to DS, reflection is veryclose to the incident broken wave height, and when HB ex-ceeds DS, reflection is less than the broken incident waveheight. For the 0.12 m seawall, HB is greater than DS for
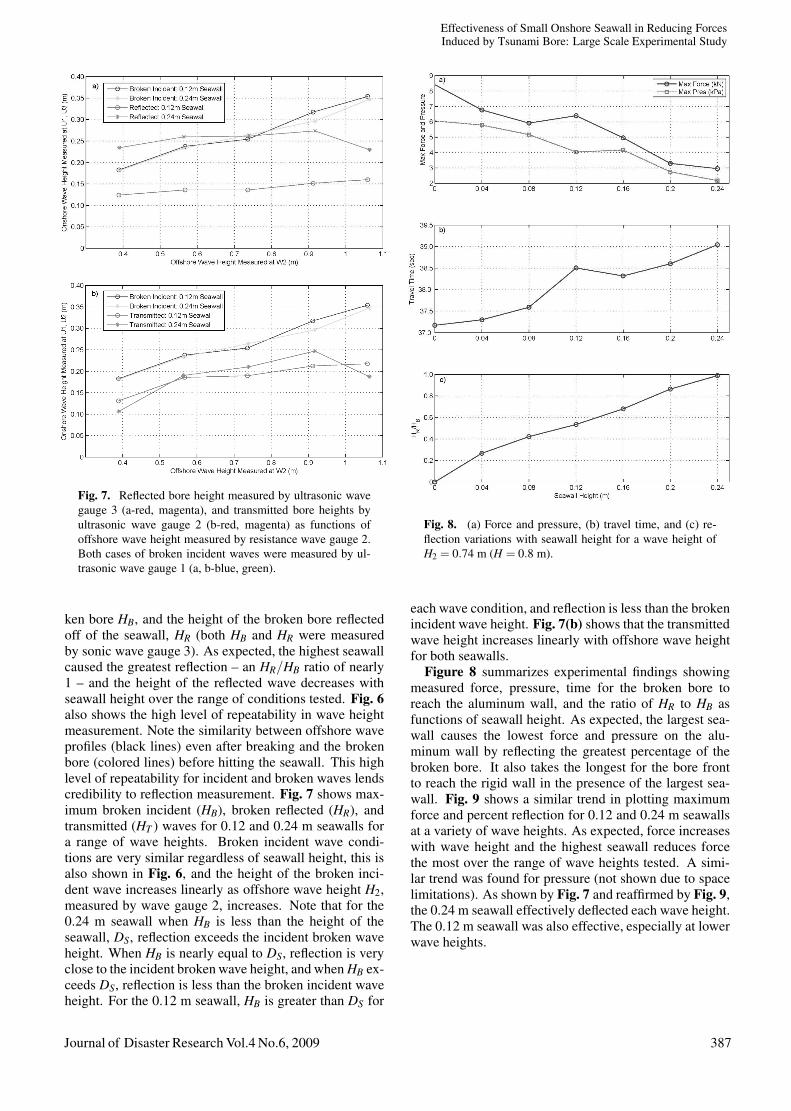
Fig. 8. (a) Force and pressure, (b) travel time, and (c) re-flection variations with seawall height for a wave height ofH2 = 0.74 m (H = 0.8 m).
each wave condition, and reflection is less than the brokenincident wave height. Fig. 7(b) shows that the transmittedwave height increases linearly with offshore wave heightfor both seawalls.
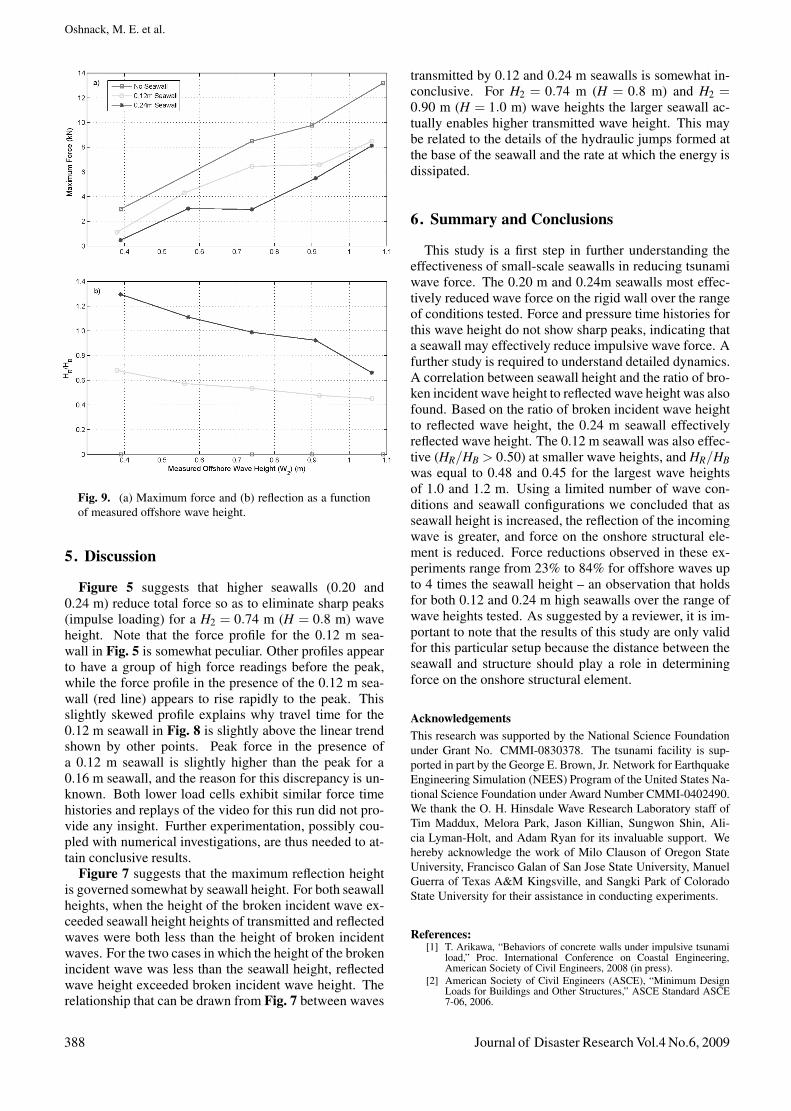
Figure 8 summarizes experimental findings showingmeasured force, pressure, time for the broken bore toreach the aluminum wall, and the ratio of HR to HB asfunctions of seawall height. As expected, the largest sea-wall causes the lowest force and pressure on the alu-minum wall by reflecting the greatest percentage of thebroken bore. It also takes the longest for the bore frontto reach the rigid wall in the presence of the largest sea-wall. Fig. 9 shows a similar trend in plotting maximumforce and percent reflection for 0.12 and 0.24 m seawallsat a variety of wave heights. As expected, force increaseswith wave height and the highest seawall reduces forcethe most over the range of wave heights tested. A simi-lar trend was found for pressure (not shown due to spacelimitations). As shown by Fig. 7 and reaffirmed by Fig. 9,the 0.24 m seawall effectively deflected each wave height.The 0.12 m seawall was also effective, especially at lowerwave heights.
Journal of Disaster Research Vol.4 No.6, 2009 387
Oshnack, M. E. et al.
Fig. 9. (a) Maximum force and (b) reflection as a functionof measured offshore wave height.
5. Discussion
Figure 5 suggests that higher seawalls (0.20 and0.24 m) reduce total force so as to eliminate sharp peaks(impulse loading) for a H2 = 0.74 m (H = 0.8 m) waveheight. Note that the force profile for the 0.12 m sea-wall in Fig. 5 is somewhat peculiar. Other profiles appearto have a group of high force readings before the peak,while the force profile in the presence of the 0.12 m sea-wall (red line) appears to rise rapidly to the peak. Thisslightly skewed profile explains why travel time for the0.12 m seawall in Fig. 8 is slightly above the linear trendshown by other points. Peak force in the presence ofa 0.12 m seawall is slightly higher than the peak for a0.16 m seawall, and the reason for this discrepancy is un-known. Both lower load cells exhibit similar force timehistories and replays of the video for this run did not pro-vide any insight. Further experimentation, possibly cou-pled with numerical investigations, are thus needed to at-tain conclusive results.
Figure 7 suggests that the maximum reflection heightis governed somewhat by seawall height. For both seawallheights, when the height of the broken incident wave ex-ceeded seawall height heights of transmitted and reflectedwaves were both less than the height of broken incidentwaves. For the two cases in which the height of the brokenincident wave was less than the seawall height, reflectedwave height exceeded broken incident wave height. Therelationship that can be drawn from Fig. 7 between waves
transmitted by 0.12 and 0.24 m seawalls is somewhat in-conclusive. For H2 = 0.74 m (H = 0.8 m) and H2 =0.90 m (H = 1.0 m) wave heights the larger seawall ac-tually enables higher transmitted wave height. This maybe related to the details of the hydraulic jumps formed atthe base of the seawall and the rate at which the energy isdissipated.
6. Summary and Conclusions
This study is a first step in further understanding theeffectiveness of small-scale seawalls in reducing tsunamiwave force. The 0.20 m and 0.24m seawalls most effec-tively reduced wave force on the rigid wall over the rangeof conditions tested. Force and pressure time histories forthis wave height do not show sharp peaks, indicating thata seawall may effectively reduce impulsive wave force. Afurther study is required to understand detailed dynamics.A correlation between seawall height and the ratio of bro-ken incident wave height to reflected wave height was alsofound. Based on the ratio of broken incident wave heightto reflected wave height, the 0.24 m seawall effectivelyreflected wave height. The 0.12 m seawall was also effec-tive (HR/HB > 0.50) at smaller wave heights, and HR/HBwas equal to 0.48 and 0.45 for the largest wave heightsof 1.0 and 1.2 m. Using a limited number of wave con-ditions and seawall configurations we concluded that asseawall height is increased, the reflection of the incomingwave is greater, and force on the onshore structural ele-ment is reduced. Force reductions observed in these ex-periments range from 23% to 84% for offshore waves upto 4 times the seawall height – an observation that holdsfor both 0.12 and 0.24 m high seawalls over the range ofwave heights tested. As suggested by a reviewer, it is im-portant to note that the results of this study are only validfor this particular setup because the distance between theseawall and structure should play a role in determiningforce on the onshore structural element.
AcknowledgementsThis research was supported by the National Science Foundationunder Grant No. CMMI-0830378. The tsunami facility is sup-ported in part by the George E. Brown, Jr. Network for EarthquakeEngineering Simulation (NEES) Program of the United States Na-tional Science Foundation under Award Number CMMI-0402490.We thank the O. H. Hinsdale Wave Research Laboratory staff ofTim Maddux, Melora Park, Jason Killian, Sungwon Shin, Ali-cia Lyman-Holt, and Adam Ryan for its invaluable support. Wehereby acknowledge the work of Milo Clauson of Oregon StateUniversity, Francisco Galan of San Jose State University, ManuelGuerra of Texas A&M Kingsville, and Sangki Park of ColoradoState University for their assistance in conducting experiments.
References:[1] T. Arikawa, “Behaviors of concrete walls under impulsive tsunami
load,” Proc. International Conference on Coastal Engineering,American Society of Civil Engineers, 2008 (in press).
[2] American Society of Civil Engineers (ASCE), “Minimum DesignLoads for Buildings and Other Structures,” ASCE Standard ASCE7-06, 2006.
388 Journal of Disaster Research Vol.4 No.6, 2009

Effectiveness of Small Onshore Seawall in Reducing ForcesInduced by Tsunami Bore: Large Scale Experimental Study
[3] T. E. Baldock, D. Cox, T. Maddux, J. Killian, and L. Fayler, L.“Kinematics of breaking tsunami wavefronts: A data set from largescale laboratory experiments,” Coastal Engineering, Vol.56, pp.506-516, 2008.
[4] CCH 2003 Department of Planning and Permitting of HonoluluHawaii, “City and County of Honolulu Building Code,” Chapter16 Article 11. July, 2003.
[5] R. A. Dalrymple and D. L. Kriebel, “Lessons in Engineering fromthe Tsunami in Thailand,” The Bridge, National Academy of Engi-neering, Vol.35, pp. 4-16, 2005.
[6] Federal Emergency Management Agency (FEMA), “Coastal Con-struction Manual,” (FEMA 55), Federal Emergency ManagementAgency, 2000.
[7] IBC 2003 International Code Council, INC. “International BuildingCode 2003,” Country Club Hills, IL, 2002.
[8] P. Lukkunaprasit and A. Ruangrassamee, “Building Damage inThailand in the 2004 Indian Ocean Tsunami and Clues for Tsunami-Resistant Design,” The IES Journal Part A: Civil and Structural En-gineering, Vol.1 No.1, pp. 17-30, 2008.
[9] D. H. Peregrine, “Water-Wave Impact on Walls.” Annual Review ofFluid Mechanics,” Vol.35, pp. 23-43, 2003.
[10] A. Pomonis, T. Rossetto, N. Peiris, S. Wilkinson, D. Del Re, R.Koo, R. Manlapig, and S. Gallocher, “The Indian Ocean Tsunami of26 December 2004: Mission Findings in Sri Lanka and Thailand,”United Kingdom: Institution of Structural Engineers, 2006.
[11] Ramsden, “Forces on a Vertical Wall Due to Long Waves, Bores,and Dry-Bed Surges,” Journal of Waterway, Port, Coastal, andOcean Engineering, ASCE, Vol.122, No.3, pp. 134-141, May-June1996.
[12] A. Ruangrassamee, H. Yanagisawa, P. Foytong, P. Lukkunaprasit,S. Koshimura, and F. Imamura, “Investigation of Tsunami-InducedDamage and Fragility of Buildings in Thailand after the December2004 Indian Ocean Tsunami,” Earthquake Spectra, Vol.22, S377-S401, 2006.
[13] M. Saatcioglu, A. Ghobarah, and I. Nistor, “Performance of Struc-tures in Thailand During the December 2004 Great Sumatra Earth-quake and Indian Ocean Tsunami,” Earthquake Spectra, Vol.22,S355-S375, 2006.
[14] N. I. Thusyanthan and S. P. Madabhushi, “Tsunami Wave Loadingon Coastal Houses: a Model Approach,” New Civil EngineeringInternational, September 2008, pp. 27-31, 2008.
[15] Uniform Building Code (UBC), “1997 Uniform Building Code,”California, 1997.
[16] H. Yeh, I. Robertson, and J. Pruess, “Development of DesignGuidelines for Structures that Serve as Tsunami Vertical Evacu-ation Sites,” Washington State Department of Natural Resources,Olympia, WA, 2005.
Name:Mary Elizabeth Oshnack
Affiliation:Graduate Research Assistant, Oregon State Uni-versity
Address:6300 SW Grand Oaks Dr, Apt C303, Corvallis, OR 97333, USABrief Career:2007- Conducted field reconnaissance in tsunami affected regions ofThailand through Notre Dame’s ISTIM program2008- Obtained B.S. in Civil Engineering with magna cum laude honorsfrom the University of Pittsburgh2009- Graduate Research Assistant, Hinsdale Wave Research Laboratoryat Oregon State UniversitySelected Publications:• “Sea Level Rise as a Designed-for Engineering Hazard,” with K. Harries,33rd IAHR 2009 Congress: Water Engineering for a SustainableEnvironment, August 9-14, 2009, Vancouver, BC.Academic Societies & Scientific Organizations:• Solar Decathlon Team, University of Pittsburgh/Carnegie MellonUniversity• Engineers Without Borders, University of Pittsburgh• American Society of Civil Engineers (ASCE)
Name:Francisco Aguıniga
Affiliation:Assistant Professor, Civil and Architectural En-gineering Program, Texas A&M University-Kingsville
Address:MSC 194; Kingsville, Texas 78363-8203, USABrief Career:1991- B.S. Civil Engineering, Universidad Michoacana (Michoacan,Mexico)1996- M.S. Civil Engineering, University of Illinois atUrbana-Champaign, Urbana, Illinois2003- Ph.D. Civil Engineering (Structures), Texas A&M University,College Station, TexasSelected Publications:• F. Aguiniga, K. Matakis, H. Estrada, J. Sai, P. Leelani, and J. Shelden,“Wave Forces on Bridge Decks: State of the Art and State of the PracticeReview,” Texas A&M University-Kingsville, Report No. FHWA/0-5516-1,95pp, October 2006.• F. Aguiniga, K. Matakis, H. Estrada, J. Sai, P. Leelani, and J. Shelden,“Synthesis of Wave Load Design Methods for Coastal Bridges,” TexasA&M University-Kingsville, Report No. FHWA/0-5516-2, 190pp,October 2006.Academic Societies & Scientific Organizations:• American Society of Engineering Education (ASEE)
Name:Daniel Cox
Affiliation:Professor, School of Civil and Construction En-gineering, Oregon State University
Address:220 Owen Hall, Corvallis, OR 97331, USABrief Career:1995-2002 Assistant Professor, Texas A&M University2002- Oregon State University.2002- Director, O.H. Hinsdale Wave Research LaboratorySelected Publications:• N. V. Scott, T. J. Hsu, and D. Cox, “Steep Wave, Turbulence, andSediment Concentration Statistics Beneath a Breaking Wave Field andTheir Implications for Sediment Transport,” Continental Shelf Research,2009 (accepted).• T. Baldock, D. Cox, T. Maddux, J. Killian, and L. Fayler, “Kinematics ofBreaking Tsunami Wavefronts: A Data Set from Large Scale LaboratoryExperiments,” Coastal Engineering, Vol.56, No.5, pp. 506-516, 2009.Academic Societies & Scientific Organizations:• American Society of Civil Engineers• Coastal Ocean Ports River Institute
Journal of Disaster Research Vol.4 No.6, 2009 389

Oshnack, M. E. et al.
Name:Rakesh Gupta
Affiliation:Professor, Department of Wood Science and En-gineering, Oregon State University
Address:114 Richardson Hall, Corvallis, OR 97331, USABrief Career:1991- Joined Oregon State University1999- Visiting Scientist, Division of Building, Construction andEngineering, CSIRO, Australia1998- Research Engineer, Alpine Engineered Products, Inc., Haines City,FloridaSelected Publications:• Wilson, J., Gupta, R., van de Lindt, J. Clauson, M. and Garcia, R.,“Behavior of a One-Sixth Scale Wood-Framed Residential Structure underWave Loading,” J. of Performance of Constructed Facilities, 23(5),pp. 336-345, 2009.• van de Lindt, J., Gupta, R., Garcia, R. and Wilson, J., “Tsunami BoreForces on a Compliant Residential Building Model,” EngineeringStructures, 31(2009), pp. 2534-2539, 2009.Academic Societies & Scientific Organizations:• American Society of Civil Engineers• Forest Products Society• Society of Wood Science and Technology
Name:John W. van de Lindt
Affiliation:Professor, Colorado State University
Address:Civil Engineering Department, Fort Collins, Colorado 80523-1372, USABrief Career:2000- Michigan Technological University2004- Colorado State UniversitySelected Publications:• J. W. van de Lindt and M. Taggart, “Fragility Analysis Framework forPerformance-Based Analysis of Wood Frame Buildings for Flood,” ASCENatural Hazards Review, 10(3), pp. 113-123, 2009.• J. W. van de Lindt, Y. Li, W. M. Bulleit, R. Gupta, and P. I. Morris, “TheNext Step for ASCE 16 : Performance-Based Design of Wood Structures,”ASCE Journal of Structural Engineering, 135(6), pp. 611-618, 2009.Academic Societies & Scientific Organizations:• Academic Societies & Scientific Organizations: American Society ofCivil Engineers (ASCE)• Associate Editor for Wood, Journal of Structural Engineering (EERI)• Earthquake Engineering Research Institute
390 Journal of Disaster Research Vol.4 No.6, 2009