
Effectiveness of protected areas in the Western Caucasus before ...
9
Effectiveness of protected areas in the Western Caucasus before and after the transition to post-socialism E.V. Bragina a,b,⇑ , V.C. Radeloff a , M. Baumann c , K. Wendland d , T. Kuemmerle c,e , A.M. Pidgeon a a SILVIS Lab, Department of Forest and Wildlife Ecology, University of Wisconsin-Madison, 1630 Linden Drive, Madison, WI 53706, USA b Faculty of Biology, Lomonosov Moscow State University, 1-12 Leninskie Gory, Moscow 119991, Russia c Geography Department, Humboldt-Universitat zu Berlin, Unter den Linden 6, 10099 Berlin, Germany d Department of Conservation Social Sciences, University of Idaho, ID, USA e Integrative Research Institute on Transformations of Human Environment Systems (IRI THESys), Humboldt-Universitat zu Berlin, Unter den Linden 6, 10099 Berlin, Germany article info Article history: Received 18 August 2014 Received in revised form 1 February 2015 Accepted 12 February 2015 Keywords: Forest disturbance Logging Socioeconomic shock Russia Abkhazia Random Forests Olympic Games abstract Economic and social transition periods can have strong negative effects for the environment and for wild- life. The collapse of the Soviet Union in 1991 provides a striking example of social turmoil and transition to a new society. It is unclear, however, how humans affected the environment in the course of the col- lapse, and if institutions designed to safeguard the environment continued to fulfill their intended role. Our goal was to assess the impact of the collapse of the Soviet Union on forest canopy removal rates in protected areas, and how these rates varied by protected area status and over time. We monitored forest canopy removal within and outside of protected areas using a 1985–2010 time series of Landsat satellite images from the Western Caucasus. On average, we found surprisingly low annual forest canopy removal rates of only 0.03%. The highest canopy removal inside of protected areas of all types occurred after 2000. Among the protected areas, we found the highest canopy removal rates within Sochi National Park, attri- butable to construction for the Olympic Games and in spite of the Park’s protected status. Overall, it is encouraging that forest canopy removal rates in protected areas in the Western Caucasus are far lower than in other Russian regions. Because many local endemic plant and animal species are found in the Caucasus region, clear cuts are prohibited, and this regulation appears to be effective. However, forest canopy removal within protected areas caused by major social and political events such as the Olympic Games is of concern. Ó 2015 Elsevier Ltd. All rights reserved. 1. Introduction Protected area effectiveness and human disturbance inside of nature reserves are important environmental issues affecting wild- life (Bruner et al., 2001; Hocking et al., 2000). Unfortunately, the establishment of a protected area per se is not enough to safeguard biodiversity. Without proper enforcement, protected areas can become ‘paper parks’ that do not contribute to nature conservation (Bruner et al., 2001). This is why it is important to measure protect- ed area effectiveness (Joppa and Pfaff, 2011; Knorn et al., 2012). The rate of removal of the forest canopy is commonly used as a proxy for protected area effectiveness (Andam et al., 2008; DeFries and Hansen, 2005; Joppa and Pfaff, 2011; Knorn et al., 2012; Mas, 2005; Naughton-Treves et al., 2011). Here, we estimat- ed forest canopy removal rate within and outside of protected areas to assess effectiveness of protected areas. Protected areas may be especially vulnerable when the economy declines; as people’s income plummets, they rely more on natural resources, such as bushmeat (Bragina et al., 2015; Brashares et al., 2004; Wilkie and Godoy, 2014). A striking example of a major eco- nomic downturn was the collapse of the Soviet Union in 1991 and the subsequent transition to post-socialism, which resulted in increased poverty (Dudwick et al., 2003), abandonment of agricul- ture (Ioffe and Nefedova, 2004), and the decline of livestock populations (Kolesnikov, 2003). As a result of economic issues, con- servation funding plummeted, and conservation institutions were weakened (Brandt, 1992; Wells and Williams, 1998). At least some regions experienced increased pressure on natural resources, for example due to illegal logging as a source of income (Vandergert and Newell, 2003; Lebedev, 2001). While official forest statistics show a decrease in forest logging after the collapse, considerable http://dx.doi.org/10.1016/j.biocon.2015.02.013 0006-3207/Ó 2015 Elsevier Ltd. All rights reserved. ⇑ Corresponding author at: SILVIS Lab, Department of Forest and Wildlife Ecology, University of Wisconsin-Madison, 1630 Linden Drive, Madison, WI 53706, USA. Tel.: +1 (608) 265 9219. E-mail address: [email protected] (E.V. Bragina). Biological Conservation 184 (2015) 456–464 Contents lists available at ScienceDirect Biological Conservation journal homepage: www.elsevier.com/locate/biocon
Transcript of Effectiveness of protected areas in the Western Caucasus before ...

Biological Conservation 184 (2015) 456–464
Contents lists available at ScienceDirect
Biological Conservation
journal homepage: www.elsevier .com/locate /b iocon
Effectiveness of protected areas in the Western Caucasus beforeand after the transition to post-socialism
http://dx.doi.org/10.1016/j.biocon.2015.02.0130006-3207/� 2015 Elsevier Ltd. All rights reserved.
⇑ Corresponding author at: SILVIS Lab, Department of Forest and Wildlife Ecology,University of Wisconsin-Madison, 1630 Linden Drive, Madison, WI 53706, USA. Tel.:+1 (608) 265 9219.
E-mail address: [email protected] (E.V. Bragina).
E.V. Bragina a,b,⇑, V.C. Radeloff a, M. Baumann c, K. Wendland d, T. Kuemmerle c,e, A.M. Pidgeon a
a SILVIS Lab, Department of Forest and Wildlife Ecology, University of Wisconsin-Madison, 1630 Linden Drive, Madison, WI 53706, USAb Faculty of Biology, Lomonosov Moscow State University, 1-12 Leninskie Gory, Moscow 119991, Russiac Geography Department, Humboldt-Universitat zu Berlin, Unter den Linden 6, 10099 Berlin, Germanyd Department of Conservation Social Sciences, University of Idaho, ID, USAe Integrative Research Institute on Transformations of Human Environment Systems (IRI THESys), Humboldt-Universitat zu Berlin, Unter den Linden 6, 10099 Berlin, Germany
a r t i c l e i n f o
Article history:Received 18 August 2014Received in revised form 1 February 2015Accepted 12 February 2015
Keywords:Forest disturbanceLoggingSocioeconomic shockRussiaAbkhaziaRandom ForestsOlympic Games
a b s t r a c t
Economic and social transition periods can have strong negative effects for the environment and for wild-life. The collapse of the Soviet Union in 1991 provides a striking example of social turmoil and transitionto a new society. It is unclear, however, how humans affected the environment in the course of the col-lapse, and if institutions designed to safeguard the environment continued to fulfill their intended role.Our goal was to assess the impact of the collapse of the Soviet Union on forest canopy removal rates inprotected areas, and how these rates varied by protected area status and over time. We monitored forestcanopy removal within and outside of protected areas using a 1985–2010 time series of Landsat satelliteimages from the Western Caucasus. On average, we found surprisingly low annual forest canopy removalrates of only 0.03%. The highest canopy removal inside of protected areas of all types occurred after 2000.Among the protected areas, we found the highest canopy removal rates within Sochi National Park, attri-butable to construction for the Olympic Games and in spite of the Park’s protected status. Overall, it isencouraging that forest canopy removal rates in protected areas in the Western Caucasus are far lowerthan in other Russian regions. Because many local endemic plant and animal species are found in theCaucasus region, clear cuts are prohibited, and this regulation appears to be effective. However, forestcanopy removal within protected areas caused by major social and political events such as theOlympic Games is of concern.
� 2015 Elsevier Ltd. All rights reserved.
1. Introduction
Protected area effectiveness and human disturbance inside ofnature reserves are important environmental issues affecting wild-life (Bruner et al., 2001; Hocking et al., 2000). Unfortunately, theestablishment of a protected area per se is not enough to safeguardbiodiversity. Without proper enforcement, protected areas canbecome ‘paper parks’ that do not contribute to nature conservation(Bruner et al., 2001). This is why it is important to measure protect-ed area effectiveness (Joppa and Pfaff, 2011; Knorn et al., 2012).The rate of removal of the forest canopy is commonly used as aproxy for protected area effectiveness (Andam et al., 2008;DeFries and Hansen, 2005; Joppa and Pfaff, 2011; Knorn et al.,
2012; Mas, 2005; Naughton-Treves et al., 2011). Here, we estimat-ed forest canopy removal rate within and outside of protectedareas to assess effectiveness of protected areas.
Protected areas may be especially vulnerable when the economydeclines; as people’s income plummets, they rely more on naturalresources, such as bushmeat (Bragina et al., 2015; Brashares et al.,2004; Wilkie and Godoy, 2014). A striking example of a major eco-nomic downturn was the collapse of the Soviet Union in 1991 andthe subsequent transition to post-socialism, which resulted inincreased poverty (Dudwick et al., 2003), abandonment of agricul-ture (Ioffe and Nefedova, 2004), and the decline of livestockpopulations (Kolesnikov, 2003). As a result of economic issues, con-servation funding plummeted, and conservation institutions wereweakened (Brandt, 1992; Wells and Williams, 1998). At least someregions experienced increased pressure on natural resources, forexample due to illegal logging as a source of income (Vandergertand Newell, 2003; Lebedev, 2001). While official forest statisticsshow a decrease in forest logging after the collapse, considerable
E.V. Bragina et al. / Biological Conservation 184 (2015) 456–464 457
forest canopy removal, much of which may be due to illegal logging,was found in Russia and other post-soviet countries (Wendlandet al., 2015; Baumann et al., 2012; Kuemmerle et al., 2009).
In Russia, protected area status likely affects the vulnerability toillegal natural resource extraction. As a rule, in a strict naturereserve (IUCN category I) only staff can enter the protected areawithout special permission. Unlike strict nature reserves, the man-agement policies of national parks allow visiting tourists thoughcommercial activity is prohibited, including logging, but rangerspatrol the territory as well as in strict nature reserves. The regula-tions of other protected areas (IUCN categories III–IV) restrict com-mercial logging as well, while allowing low-level extractive use, forexample cattle grazing (Federal Law of Russian Federation onNature Reserves, 2014). The collapse of the former Soviet Unionappears to have been associated with different levels of forestcanopy removal, depending on protected area status. For example,in European Russia, two long-established strict nature reservesremained effective and provided forest protection in spite of thechanging institutional and economic situation (Sieber et al.,2013). However establishment of some national parks after thebreakdown of the Soviet Union had little to no effect on loweringforest canopy removal within their borders (Wendland et al.,2015). These differences in effectiveness associated with protectedarea status, as well as regional differences in forest types, forestuse, and markets for timber, raise the question of how effectiveprotected areas in other parts of Russia were before and after thecollapse.
Due to its unique geological history, the Western Caucasus ishome to many endemic species (Akatov et al., 1990) and a largepart of it is protected, albeit with varying levels of protection(Dubinin et al., 2005). Our study area included several protectedareas of IUCN categories I–IV in Russia and three protected areasin IUCN category I in Abkhazia. While forest logging is prohibitedor restricted in all of these categories of protected areas (FederalLaw of Russian Federation on Nature Reserves, 2014), levels ofenforcement most likely varied in the past, and some illegal log-ging has been documented in protected areas of the WesternCaucasus (Plotnikov, 2010). We wondered if patterns of forestcanopy removal in the Western Caucasus followed patternsdocumented in other parts of Russia.
Our study spanned three periods: the last five years of socialism(1985–1990), the period of transition to post-socialism (1991–1999), and the decade after 2000, because we expected rates of for-est canopy removal to vary before and after the collapse. There aremany factors that might have affected forest canopy disturbancerates. Increased poverty, weakened regulation, and the war inAbkhazia in 1992–1993 might all have increased forest logging inthe region, as was the case in the Russian Far East and Siberia(Vandergert and Newell, 2003). Such logging may have alsooccurred within protected areas because the transition periodbrought huge turmoil to post-Soviet countries, including the ero-sion of the nature protection infrastructure and reduced lawenforcement (Henry and Douhovnikoff, 2008; Williams, 1996).On the other hand, the timber industry underwent a difficult peri-od during the transition, and forest harvesting declined inEuropean Russia (Potapov et al., 2011), suggesting that there wasless demand for timber.
Another potential cause of forest canopy removal in theWestern Caucasus was the preparation for the 2014 OlympicGames in Sochi. The construction of infrastructure for theOlympics substantially modified the landscape through clearingland for construction of buildings, roads, and trails (WWF Russia,2014), with some events taking place inside Sochi National Park.Construction within national parks is restricted by RussianFederal Law. However, a special amendment to the Law was addedin 2006 allowing for the construction for ‘recreational activities’
within national parks (Federal Law of Russian Federation onNature Reserves, 2014). This amendment provided a legislativebase for the development of Olympic infrastructure, and this iswhy we were interested in analyzing the amount forest canopyremoval related to the Olympic Games.
The goal of our study was to estimate the effectiveness of theWestern Caucasus protected areas during 1985–2010 in terms ofsafeguarding forests within them from forest canopy removal. Inparticular, our aims were to (1) compare the forest canopy removalrate before the collapse of the Soviet Union, right after it, and in thelater post-Soviet period, (2) estimate forest canopy removal rateswithin and outside of protected areas of different IUCN categories,and (3) estimate forest canopy removal associated with the 2014Olympic Games.
2. Methods
2.1. Study area
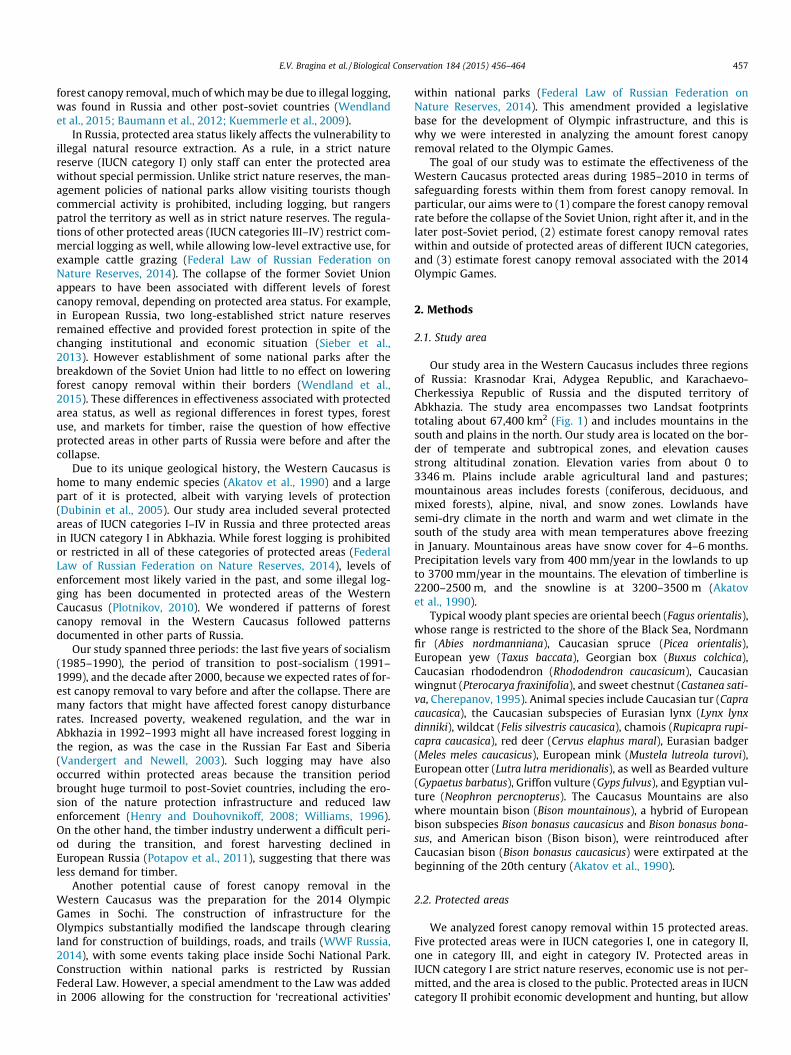
Our study area in the Western Caucasus includes three regionsof Russia: Krasnodar Krai, Adygea Republic, and Karachaevo-Cherkessiya Republic of Russia and the disputed territory ofAbkhazia. The study area encompasses two Landsat footprintstotaling about 67,400 km2 (Fig. 1) and includes mountains in thesouth and plains in the north. Our study area is located on the bor-der of temperate and subtropical zones, and elevation causesstrong altitudinal zonation. Elevation varies from about 0 to3346 m. Plains include arable agricultural land and pastures;mountainous areas includes forests (coniferous, deciduous, andmixed forests), alpine, nival, and snow zones. Lowlands havesemi-dry climate in the north and warm and wet climate in thesouth of the study area with mean temperatures above freezingin January. Mountainous areas have snow cover for 4–6 months.Precipitation levels vary from 400 mm/year in the lowlands to upto 3700 mm/year in the mountains. The elevation of timberline is2200–2500 m, and the snowline is at 3200–3500 m (Akatovet al., 1990).
Typical woody plant species are oriental beech (Fagus orientalis),whose range is restricted to the shore of the Black Sea, Nordmannfir (Abies nordmanniana), Caucasian spruce (Picea orientalis),European yew (Taxus baccata), Georgian box (Buxus colchica),Caucasian rhododendron (Rhododendron caucasicum), Caucasianwingnut (Pterocarya fraxinifolia), and sweet chestnut (Castanea sati-va, Cherepanov, 1995). Animal species include Caucasian tur (Capracaucasica), the Caucasian subspecies of Eurasian lynx (Lynx lynxdinniki), wildcat (Felis silvestris caucasica), chamois (Rupicapra rupi-capra caucasica), red deer (Cervus elaphus maral), Eurasian badger(Meles meles caucasicus), European mink (Mustela lutreola turovi),European otter (Lutra lutra meridionalis), as well as Bearded vulture(Gypaetus barbatus), Griffon vulture (Gyps fulvus), and Egyptian vul-ture (Neophron percnopterus). The Caucasus Mountains are alsowhere mountain bison (Bison mountainous), a hybrid of Europeanbison subspecies Bison bonasus caucasicus and Bison bonasus bona-sus, and American bison (Bison bison), were reintroduced afterCaucasian bison (Bison bonasus caucasicus) were extirpated at thebeginning of the 20th century (Akatov et al., 1990).
2.2. Protected areas
We analyzed forest canopy removal within 15 protected areas.Five protected areas were in IUCN categories I, one in category II,one in category III, and eight in category IV. Protected areas inIUCN category I are strict nature reserves, economic use is not per-mitted, and the area is closed to the public. Protected areas in IUCNcategory II prohibit economic development and hunting, but allow

Fig. 1. Study area with Russian and Abkhazian protected areas. 1 – the nature monument ‘Buiny Ridge’, 2 – Sochi sanctuary, 3 – sanctuary ‘Chernogor’e’, 4 – sanctuary‘Kamyshanova polyana’, 5 – sanctuary ‘Russkiy les’, 6 – Psebaiskiy hunting sanctuary, 7 – Tuapsinskiy sanctuary, 8 – Turinyi sanctuary, 9 – Dahovskiy sanctuary.
458 E.V. Bragina et al. / Biological Conservation 184 (2015) 456–464
certain economic activities inside them, such as ecotourism. In pro-tected areas in categories III–IV, forest logging is either prohibitedor restricted, but protection levels are generally lower (Federal Lawof Russian Federation on Nature Reserves, 2014; Law of Republic ofAbkhazia on environmental protection, 2010).
Strict nature reserves (IUCN category I) included two in Russiaand three in Abkhazia (Fig. 1). The Russian reserves were theCaucasus Federal Biosphere Nature Reserve (founded in 1924;2775 km2) and the western part of Teberda Federal BiosphereNature Reserve (1936; 189 km2). The Abkhazian reserves werePitsunda-Miussera nature reserve (1966; 38 km2), Ritsa naturereserve (1930; 164 km2), and Pskhu-Gumista nature reserve(1941; 388 km2). IUCN category II included only Sochi NationalPark (founded in 1983; 2033 km2). The nature monument ‘BuinyRidge’ (1990; 18 km2) was in IUCN category III. Protected areasin IUCN category IV were Sochi sanctuary (‘zakaznik’ in Russian,founded in 1993; 152 km2), sanctuaries ‘Chernogor’e’ (1986;54 km2), ‘Kamyshanova polyana’ (1987; 69 km2), ‘Russkiy les’(1977; 87 km2), Psebaiskiy hunting sanctuary (1971; 380 km2),Tuapsinskiy sanctuary (1986; 170 km2), Turinyi sanctuary (thearea held its protected status in 1993–1998; 56 km2), Dahovskiy
sanctuary (the area acquired its protected status in 1963–2002;222 km2). Several of the protected areas are part of the UNESCOWorld Heritage Site ‘Western Caucasus’ (UNESCO, 1999), but thisdoes not confer additional protective status.
We acquired protected area boundaries from the WorldDatabase on Protected Areas (protectedplanet.net), which is basedon the Digital Map of Protected Areas of the Russian Federation (FSI‘VNII prirody’ Minprirody of the Russian Federation, ProtectedAreas Laboratory, 1999–2001; www.RINPRO.RU). For protectedareas in IUCN categories III–IV, we used OpenStreetMap data(http://beryllium.gis-lab.info/project/osmshp/).
2.3. Satellite images
Our study area was covered by two Landsat footprints (path:173; rows: 29 and 30; 30 m resolution), for which we acquiredimagery from the archives of the United States Geological Survey.We chose cloud-free (<10%) images acquired during the growingseason (May–September) to classify land cover classes. Weacquired images from four time steps: (1) before the collapse ofthe Soviet Union (01 August 1985), (2) the point immediately at

E.V. Bragina et al. / Biological Conservation 184 (2015) 456–464 459
the start of the transition period a change point (1990), ten yearlater (15 July 1999 and 06 September 2001) and twenty years later(6 August 2010). We did not use the thermal bands in our analysis,and we excluded clouds and cloud shadows through on-screendigitizing.
2.4. Land use and forest canopy removal mapping
In a first step, we classified the 1985 image into five land coverclasses to increase the accuracy of our subsequent forest canopyremoval mapping: (1) agriculture, i.e., arable fields; (2) forests,including deciduous, coniferous and mixed forest; (3) grasslandsand meadows, including alpine meadows; (4) urban areas, includ-ing buildings, roads, etc.; (5) ‘other’, including water, bare soil,rock, glaciers. For each class, we manually collected 2000–20,000training pixels based on the Landsat imagery and, where available,Google™ Earth high-resolution imagery. The number of trainingpixels per class depended on our assumptions about the spectralcomplexity of the respective classes. For example, we collectedthe most pixels of agriculture and grassland to provide reliable dis-crimination of these classes as they can easily be confused (e.g.,27% of random grassland points, which we collected for accuracyassessment, were classified as agriculture). For the classification,we used imageRF, which is an IDL-based tool that implementsRandom Forests (Breiman, 2001) for the classification of satelliteimages (Waske et al., 2012).
Based on the 1985 land cover map, we selected the area coveredby forest for subsequent mapping of forest canopy removal. Foreach year, we created forest canopy removal index maps (Healeyet al., 2005). The forest canopy removal index is a linear transfor-mation of normalized tasseled cap indices (i.e., brightness, green-ness, and wetness). We calculated the forest canopy removalindex as a DI = nBr � (nGr + nWet) where nBr, nGr, and nWet isnormalized brightness, greenness, and wetness, respectively.When the forest canopy is disturbed, brightness increases due tosoil exposition, while greenness and wetness decline. Forestcanopy removal thus exhibit relatively higher disturbance indexvalues compared to undisturbed forest (Healey et al., 2005). Wesubtracted the forest canopy removal index map for 1985 fromthat for 1990, the index map for 1990 from that for 1999, andthe index map for 2001 from that for 2010. This resulted in threemaps of forest canopy removal index differences with 30-m resolu-tion, for which we determined thresholds to separate disturbancesfrom unchanged forest. As disturbance index values can vary forthe same area depending on atmospheric or phenological differ-ences (Healey et al., 2005), we determined a separate thresholdfor each map. For 1990–1985, a threshold value of 0.35 providedthe best separation of ‘forest canopy removal’ and ‘other’. For1990–1999, most disturbed forest pixels had values >6.8 and forthe 2001–2010 map, the threshold was 0.1. Using these thresholds,we mapped forest canopy removal as a land cover class.
We combined the three forest canopy removal maps, and themap of other land uses, into one change map displaying forestcanopy removal for our entire study period. Our final map thushad eight classes: stable forest, forest canopy removal in 1985–1990, forest canopy removal in 1990–1999, forest canopy removalin 2001–2010, agriculture, grassland, urban area, and other. If apixel was disturbed several times, we only considered it as dis-turbed in the first time period. In total, repeated disturbancewas <1% of all disturbed area in all three time periods.
In our initial results, varying phenology among images from dif-ferent years caused some false-positive forest canopy removal attimberline. Since the elevation of timber line in the study area is2200–2500 m (Akatov et al., 1990), we decided to maintain a con-servative estimation of forest canopy removal rates and did notanalyze area above 2300 m to avoid false-positive results.
2.5. Accuracy assessment
We generated a standard error matrix to estimate the accuracyof our map. We sampled 100 random points from each class, andassigned the true value for each of them manually based on visualinterpretation of the Landsat images. Whenever possible, we veri-fied Landsat interpretation of the points with Google Earth images,thus ensuring that our accuracy data was of higher quality than ourclassification (Olofsson et al., 2014). To make sure that Landsat andGoogle Earth provide consistent results, we compared two inter-pretations of 50 random points. Only 3 points out of 50 (6%) wereassigned differently. Then, we calculated user’s and producer’saccuracy for each class, as well as the overall accuracy of ourmap, while correcting for possible sampling bias (Olofsson et al.,2013). Producer’s accuracy refers to the land use class’ area onthe ground which was classified as that class and user’s accuracyis how much of classified as a certain class area was actually thatclass (Olofsson et al., 2013).
2.6. Comparing forest canopy removal inside and outside of protectedareas
The non-random placement of protected areas, for example inremote locations that do not have much conversion pressure, com-plicates the estimation of protected area effectiveness (Joppa andPfaff, 2009, 2010). For this reason, we used a statistical techniqueknown as ‘matching’ to create a sample of protected and not-pro-tected pixels equally distanced from settlements, roads, and otherpossible factors affecting the likelihood of forest canopy removal,see our covariate list below (Andam et al., 2008; Joppa and Pfaff,2010). With this new sample we can estimate the effect of protec-tion on forest cover without bias from the placement of protectedareas influencing the result. As we were interested in the effect ofprotected area status, we categorized protected areas into fourgroups according to their IUCN categories: (1) Caucasus andTeberda strict nature reserves, (2) the three Abkhazian naturereserves (Pitsunda-Miussera, Ritsa, and Pskhu-Gumista), (3) SochiNational Park (IUCN category II), and (4) other protected areas alto-gether (IUCN categories III–IV). We also estimated the effect of allprotected areas combined (i.e., categories I–IV, Abkhazian andRussian) and all Russian protected areas (i.e., categories I–IV above)to analyze trans-boundary variability of forest canopy removal.Below, ‘treatment’ means one of these protected area groups.
We randomly sampled 1% of forested pixels from each group ofprotected areas based on forest cover in the 1985 imagery. Wemaintained a 300-m minimum distance between random pointsto reduce spatial correlation, which reduced our final sample offorested pixels to slightly less than 1%. For control group, we sam-pled four times the number of forested pixels from outside as frominside protected areas. Our final sample consisted of 3453 forestedpixels from Russian strict nature reserves, 1238 from Abkhaziannature reserves, 3756 from Sochi National Park, 2099 from theother protected areas, and 22,938 from outside of protected areas.
To match pixels from inside and outside of protected areas weused propensity score matching. In propensity score matching, apropensity score is estimated for each pixel. Conceptually, apropensity score is the probability that a pixel will receive thetreatment (i.e., protected area status) based on measured covari-ates, for example, distance to roads and elevation (Guo andFraser, 2010). The propensity score is estimated using a binaryregression model, because each pixel can be located either insideor outside of a protected area.
Once the propensity score was estimated, we matched controlobservations (those not in protected status) to treatment observa-tions with similar scores. We matched propensity scores usingnearest neighbor 1-to-1 matching without replacement. To ensure

460 E.V. Bragina et al. / Biological Conservation 184 (2015) 456–464
good matches, we restricted the maximum distance betweenpropensity score values to one-fourth of the standard deviationof the estimated propensity scores (Guo and Fraser, 2010).
The next step was to estimate the effect of protected areas onforest canopy removal using this matched sample of protectedand not-protected pixels. As control observations never exactlyequal the treatment observation, matches in our resulting sampleswere never precise. For this reason, we further controlled for differ-ences in covariates by subjecting the matched sample to regressionanalysis. Specifically, we performed logistic regression on thematched sample of treatment and control observations where dis-turbed/not-disturbed was our response variable, and protected/not-protected pixels and the covariates listed below were indepen-dent variables. The logistic regression resulted in a set of marginaleffects. Marginal effects represent the predicted rate by which for-est canopy removal would change if an observation switched frombeing unprotected to protected. In other words, the marginal effectis the percent of forest canopy removal reduced by protected areastatus. For example if 3.4% of protected area is disturbed and 3.6%of non-protected area is disturbed, there is a marginal effect of 0.2%(Guo and Fraser, 2010). There were a number of available covari-ates in our study area which potentially could affect the likelihoodof logging, including: distance to the nearest road, settlement,building(s), river and railway station; distance to the city ofSochi, the largest city in the study area; distance to the BlackSea; slope and elevation. However, several of these variables werecorrelated, and we removed one of each pair of variables that had acorrelation coefficient greater than 0.5 to avoid multicollinearityissues in the propensity score regression or in the regression ofprotected areas on forest canopy removal. For this reason, we con-trolled for three covariates in our regression models that are mostcommonly considered in estimating factors causing forest loss: dis-tance to nearest road, distance to Sochi, and slope.
3. Results
3.1. Land use mapping
Our map had an overall accuracy of 87.5% while average user’saccuracy was 61.3% and producer’s accuracy was 88.1% (Table 1).Total adjusted (see Methods: Accuracy assessment) forested areawas 17,486 km2 which was 28.3% of the study area. Agricultureamounted to 17,286 km2 or 28.0% of the area; grasslands madeup 6619 km2 or 10.7%, urban area, cities and roads made up485 km2 or 0.8%, and the rest was class ‘other’ and included gla-ciers, water bodies etc., which occupied 19,944 km2 or 32.2%,mainly the large area of the Black Sea. Thus, forest area comprisedapproximately one third, or 36%, of the terrestrial area. Forestswere mainly centered in the mountainous areas of the south, cov-ering the slopes of the Greater Caucasus Range, and along the
Table 1Area-adjusted accuracy of land use and forest canopy removal (FCR) classes.
Producer’saccuracy (%)
User’saccuracy (%)
Adjustedarea
±CI(km2)
±CI(%)
Stable forest 90.7 95.0 17,486 1231 7%FCR, 1985–1990 66.1 27.0 7 2 35.1FCR, 1990–1999 100.0 16.0 7 3 46%FCR, 2001–2010 100.0 57.0 22 4 17%Agriculture 86.1 81.0 17,286 1605 9%Grassland 72.0 62.0 6619 1338 20%Urban 99.5 52.0 485 93 19%Others 90.7 95.0 19,944 994 5%
Average 88.1 61.3Overall accuracy 87.5
Kuban and Laba rivers in the north. Most of the north of our studyarea was covered by agriculture and grassland. Alpine meadowscovered large areas above timberline of the Greater CaucasusRange.
Total forest canopy removal in 1985–2010 amounted to95.8 km2, i.e., only 0.6% of the forested area. Average annual forestcanopy removal was 4.2 km2 or 0.03%. The adjusted canopyremoval areas in the different time periods were even smaller(Table 2), and translated to annual rates of 1.4 km2 in 1985–1990, 0.8 km2 in 1990–1999, and 2.4 km2 in 2001–2010 acrossour study area. In the following, we provide un-adjusted area esti-mates when reporting canopy removal rates within and outside ofthe protected areas and for each protected area. The reason for thisis that would have had to have accuracy estimates for each protect-ed area to do the adjustment, which was not feasible given the lackof canopy removals in several of them.
3.2. Forest canopy removal before and after the collapse of the SovietUnion
Annual forest canopy removal was 3.4 km2/year from 1985 to1990, 4.5 km2/year in the 1990s, and 4.2 km2/year in the 2000s,or 0.02, 0.03, and 0.03%, respectively. Thus, the rate of forestcanopy removal was low throughout the entire study period, butin post-Soviet time and during the 2000s the forest canopyremoval rate was higher than in 1985–1990. In protected areas,the average forest canopy removal rate was less than 0.08% peryear in 1985–1990. In the 1990s, the average forest canopyremoval rates declined for all categories of protected areas(Table 2). In the 2000s, Abkhazian protected areas and Russian pro-tected areas of categories I as well as III–IV witnessed an increasein forest canopy removal rate to approximately the level of 1985–1990s. Sochi National Park experienced an even larger rate of forestcanopy removal during the 2000s of 0.38% (Table 2).
The majority of forest canopy removal in Sochi National Park in2000s was due to construction associated with the Olympic Gamesin 2014. Total forest canopy removal in Sochi National Park in2000s was 7.4 km2. Most of it, 6 km2 or 81%, was related to theOlympic sites (Fig. 2). By comparison, the same area lost only0.05 km2 in 1985–1990 and 0.27 km2 in 1990–1999.
3.3. Effectiveness of protected areas
All protected areas together contained 670.9 km2 of forest in1985. Total forest canopy removal in all protected areas in 1985–2010 was 16.1 km2. To find annual forest canopy removal, wedivided 16.1 by 23 years, i.e. five year of 1985–1990, nine yearsof 1990–1999, and nine years of 2001–2010. Thus we found verylow annual rates of 0.7 km2, or 0.1% on average, in protected areas.
Table 2Forest canopy removal rate in protected areas before and after the collapse of thesocialism and in the last decade.
Category of PA Rate of forest canopy removal
1985–1990
1990–1999
2001–2010
Total,1985–2010
Russian strict naturereserves
0.79 km2/0.06%
0.70 km2/0.03%
3.63 km2/0.16%
5.12 km2/2.06%
Abkhazian strict naturereserves
0.04 km2/0.01%
0.03 km2/0.00%
0.11 km2/0.02%
0.18 km2/0.24%
Sochi National Park 0.84 km2/0.08%
1.11 km2/0.06%
7.37 km2/0.38%
9.32 km2/4.30%
Russian protected areas ofIUCN cat. III–IV
0.50 km2/0.08%
0.27 km2/0.02%
0.74 km2/0.06%
1.51 km2/1.16%

Fig. 2. Forest canopy removal in Sochi National Park around the site of the 2014 Olympic Games. Upper images show forest canopy removal in Sochi National Park, lowerright image is Google™ Earth high-resolution image of the area.
Table 3Estimates of protected area impact on forest canopy removal using propensity scorematching and logistic regression.
Year
1985–1990 (%)
1990–1999(%)
2001–2010(%)
Russian strict nature reserves(N = 4778)
�0.07 �0.10 �0.24*
Abkhazian strict nature reserves(N = 2368)
�0.08 �0.09 �0.07
Sochi National Park (N = 7512) �0.09 �0.06 �0.28Russian protected areas of IUCN cat.
III–IV (N = 4198)�0.14* �0.05 �0.05
All Russian protected areas (N = 6068) �0.04 �0.01 �0.11All protected areas (N = 8158) �0.10* �0.10* �0.07
* 90% significance level.
E.V. Bragina et al. / Biological Conservation 184 (2015) 456–464 461
At the same time, this rate was higher than the average forestcanopy removal rate of 0.03% in the study area (see above).
In general, Abkhazian strict nature reserves had less forestcanopy removal than Russian strict nature reserves, and also lessthan other Russian protected areas. Indeed, Abkhazian strict naturereserves had the lowest rate among all protected areas and lostonly 0.2% of forested canopy area in 1985–2010 compared to2.1% in Russian strict protected areas (Table 2). The annual forestcanopy removal rate was 0.01% in Abkhazian strict nature reservescompared to 0.09% in Russian strict nature reserves.
Among protected areas of all categories in both countries, weobserved the highest rate of forest canopy removal in SochiNational Park: 9.3 km2 or 4.3% in 1985–2010 (Table 2). Russianprotected areas of IUCN category III–IV lost 1.5 km2 or 1.2%. Theannual forest canopy removal rate was 0.19% in Sochi NationalPark and 1.2% in Russian protected areas of IUCN categories III–IV.
When we analyzed the effect of protected area status on forestcanopy removal rates using propensity score matching, we foundfew statistically significant differences (Table 3). Qualitatively theresults were promising because the negative sign on the marginaleffects indicated that protected areas reduced the likelihood of for-est canopy removal relative to similar control observations.However, the magnitude of these effects was small and subse-quently, only a few protected areas and time periods were statisti-cally significant at even a 90% confidence level. Only when allprotected areas were compared to areas outside of protected areas(last row, Table 3), did protected areas reduce forest canopyremoval by about 0.1% compared to unprotected areas in the years
1985–1990 and the 1990s, but not in the 2000s. To put this in con-text, in 1985–1990 canopy removal outside of protected areas wason average 0.12% and in 1990–1999 0.22%. Thus, if all of theseareas had been protected, the forest canopy removal rates wouldhave been 0.02% in 1985–1990 and 0.12% in the 1990s, accordingto our estimated treatment effect. The lack of statistical sig-nificance in the 2000s might be due to increased forest canopyremoval rates within protected areas, as indicated by the remotesensing analysis. While we did not conduct formal tests of spatialautocorrelation, if any correlation remained it would likely

462 E.V. Bragina et al. / Biological Conservation 184 (2015) 456–464
increase the standard error estimates, further reducing the likeli-hood of a statistically significant finding.
3.4. Forest canopy removal connected with Olympic Games of 2014
Many events of the 2014 Olympic Games were held withinSochi National Park close to the city of Krasnaya Polyana.Olympic construction started after 2007 when the city of Sochiwas chosen to host the Games, which means that forest canopyremoval connected with this construction falls in the third periodof our study, the 2000s. Forest canopy removal within this areawas 5.66 km2, which was 77% of all forest canopy removal inSochi National Park during the 2000s.
4. Discussion
How institutional and socioeconomic shocks affect protectedarea effectiveness is not well understood, particularly in the caseof the Soviet Union collapse. We analyzed forest canopy removalinside and around protected areas in the Western Caucasus from1985 to 2010. We found that forest canopy removal rates in thisarea were overall extremely low. These low rates were a surprisingfinding, because they were much lower than in other regions ofRussia and other post-Soviet states (Griffiths et al., 2012;Kuemmerle et al., 2007; Baumann et al., 2012). For example, forestcanopy removal in Ryazan oblast and Mordovia Republic was 0.15–0.45%/year (Sieber et al., 2013). Similarly, across European Russiathe gross forest loss in 2000–2005 was 1.5% i.e. 0.3% of annual for-est loss (Potapov et al., 2011), which is ten times more that wefound. Forests of the Western Caucasus include economically valu-able timber species. Especially, Nordmann fir is a dominant conif-erous species, and timber from Nordmann fir is highly prized(Eroglu et al., 2009; IUCN, 2014). Starting in the 1930s, our studyarea underwent substantial logging (Plotnikov, 2010). However,our results indicate that clear cut rates were very low in recentdecades. We suggest that there are several possible factors in playhere. First, the biogeographical history of the region has resulted inhigh endemism (Akatov et al., 1990), and many plant and animalspecies are included in the Red List of Russia. Russian legislationprohibits removal of Red Listed species’ habitat, which makes log-ging illegal in most of the Western Caucasus (Federal Law ofRussian Federation on Protection of Environment, 2014). Second,mountainous terrain of the Western Caucasus can make loggingcomplicated. Third, mapping at ten-year intervals, which we did,can result in instances where forest canopy removal may be missedif it occurs at the beginning of an interval (Masek et al., 2008).Hence, this may result in discrepancies when compared withresults obtained by mapping at annual intervals (Sieber et al.,2013; Griffiths et al., 2012) or five-year intervals (Baumann et al.,2012; Potapov et al., 2011). However, all these studies report annu-al canopy removal rates that are at least 5 times higher than ourrates (Sieber et al., 2013: 0.15–0.45%/year versus 0.03%/year, thisstudy), which is hard to explain solely due to missing removalsat the beginning of a period.
We want to stress, however, that our analysis is a conservativeestimate of forest canopy removal. Our satellite image analysiscaptured only stand-replacing forest canopy removal such as clear-cuts. The mapping of selective logging, which is also employed inour study area (Plotnikov, 2010), was beyond the scope of ourstudy. It is possible that selective logging is the dominant harvestpractice because the cost of timber transportation in this regionis very high, and loggers may cut only the most valuable trees tomaximize profits. Forest certification by outside organizations suchas The Forest Stewardship Council has not been conducted inWestern Caucasus so far, and the fact that there are no restrictions
on timber place of origin encourages opportunistic logging(Plotnikov, 2010). Also, we did not separate natural versus humanforest canopy removal in the study area. To approximate howmuch forest canopy removal in our study area was natural versushuman-caused, we visually inspected 46 random points classifiedas forest canopy removal. Among these points, 18 were causedby natural, and 28 (61%) by anthropogenic disturbance.Interestingly, the most common type of natural land use changewas the shifting location of river beds, and resulting erosion andtree fall. We found no evidence of insect outbreak or wildfireamong these 46 points.
The forest canopy removal rates were overall very low, andstayed low after the collapse of the Soviet Union in 1991. Theseresults differed from other data on timber harvesting in Russiaincluding official volumes of harvested timber declined in 1990s(Filiptchouk et al., 2001; Peterson et al., 2009; Potapov et al.,2011) and the same was found in estimates of forest canopy distur-bance based on remote sensing (Sieber et al., 2013). During thesame time, i.e., the 1990s, only few other regions had an increasingharvest trend (Lebedev, 2001; Vandergert and Newell, 2003). Wesuggest that the increase in forest canopy disturbance in theWestern Caucasus was probably related to the decline in theenforcement of environmental regulations in post-Soviet time(Simeone, 2013). We also suggest that forest canopy disturbancerates in the Western Caucasus were overall so low that the generaldecline of the timber industry in the 1990s did not affect the har-vesting rates that we detected in the Caucasus. Also, from amethodological point of view, it is less likely that we underesti-mated canopy disturbance in 1985–1990, when we used a five yearinterval, than in 1990s–2010, when our mapping interval was10 years (Masek et al., 2008). In general, it should be noted that for-est canopy disturbance was low in all three time periods, makingcomparisons difficult.
We did not find significant differences in forest canopy removalrates inside and outside protected areas of any protection category.The overall lack of significance in the matching analysis – indicat-ing no difference in forest canopy removal between observationswithin and outside of protected areas – is likely a result of theoverall low forest canopy removal rates in our study area. In manyprotected area categories and years the canopy removal rate was0% for both treatment and control groups. Given that the removalrate of both protected and non-protected forest was so low (onaverage only 0.03% annually), there was little data for matchingcomparisons. Such low removal rates within protected areas andoutside of protected areas that share similar observable character-istics make it hard to infer whether protected areas would be effec-tive at preventing canopy removal if logging pressure increases.
In spite of these low average forest canopy removal rates, wedid find some removals inside of protected forests. We expectedforest canopy removal rate to vary depending on the level of pro-tection. In the strict nature reserves only staff can visit a protectedarea without special permission, which should limit numbers ofillegal loggers as well as number of ignition and wildfires. Themanagement policies of national parks allow tourism, but prohibitcommercial development, including logging. The regulations ofother protected areas (IUCN categories III–IV) restrict logging aswell, but sometimes allow some other land uses, such as cattlegrazing (Federal Law of Russian Federation on Nature Reserves,2014). This is why we expected to find the highest forest canopyremoval rates in the least protected areas of IUCN categories III–IV. Interestingly, among all protected area we analyzed, we foundthe least forest canopy removal in Abkhazia, which contains threeIUCN category I PAs (0.24% for the entire study period). We hadanticipated that the chaos during and following Abkhazian warin the early 1990s might have been associated with illegal logging,but perhaps the economic decline after the Abkhazian war at the
E.V. Bragina et al. / Biological Conservation 184 (2015) 456–464 463
beginning of 1990s limited timber harvesting. All categories ofRussian protected areas lost more forest than Abkhazian ones.According to Russian and Abkhazian legislation, development isprohibited within strict nature reserves, and this includes loggingand construction. However, we did find 16.1 km2 of forest canopyremoval within Abkhazian protected areas. This is in line withreports of illegal logging in the study area. For example, loggingof Nordmann Fir was reported within UNESCO World HeritageSite ‘Western Caucasus’ in 2005–2009 (Plotnikov, 2010) and exten-sive forest logging was reported within Sochi National Park in the1980s (Akatov et al., 1990).
In spite of the low overall forest canopy disturbance rate, wefound some hotspots with relatively intensive canopy removal inthe latter years of our study. The most important of these hotspotswas due to construction of infrastructure for the Olympic Gameswithin Sochi National Park. Among all protected areas and timeperiods, the site of the Olympic Games had the highest annualcanopy disturbance rate in spite of its status as a national park.Furthermore, our findings are based on a Landsat image from2010, which is before the Olympic construction was finished.Hence, our estimation is conservative, and the actual area affectedby forest canopy removal is likely larger. This result is in line withother studies of forest canopy removal in the Western Caucasus(e.g., Hansen et al., 2013) which also show that Olympic construc-tion near the city of Sochi was the biggest source of forest canopydisturbance in the area.
In summary, we found that forest canopy removal rates in theWestern Caucasus before and after the collapse of the SovietUnion were surprisingly low, especially when compared with otherRussian regions. Largely because of these low removal rates, we didnot find a statistically significant effect of protected areas on forestremovals. We also found that the Olympic Games had a negativeeffect on forest integrity. Given the high number of endemic spe-cies, and the high value of Western Caucasus protected areas forconservation, further efforts are necessary to meet the intendedgoal of protected areas in this region, i.e., to eliminate or severelyrestrict anthropogenic forest canopy removal. However it isencouraging to see that the collapse of socialism did not result inwidespread logging in the Western Caucasus.
Acknowledgements
We gratefully acknowledge support by NASA’s Land Cover andLand Use Change Program, the German Science Foundation(DFG), and the Einstein Foundation Berlin, Germany. We are thank-ful to D. Helmers, M. Plotnikov, C. Ramirez, M. Dubinin, and twoanonymous reviewers for helpful advice and support.
References
Akatov, V.V, Golgofskaya, K.U., Gorcharuk, L.G., Durov, V.V, Kipiani, V.V, Kudaktin,A.N., Nemtsev, A.S., Pridnya, M.V, Tilba, P.A., Topilina, V.G., 1990. Caucasus StrictNature Reserve. In: Strict Nature Reserves of USSR (Zapovedniki SSSR). Mysl’,Moscow, Russia (in Russian).
Andam, K.S., Ferraro, P.J., Pfaff, A., Sanchez-Azofeifa, G.A., Robalino, J.A., 2008.Measuring the effectiveness of protected area networks in reducingdeforestation. Proc. Natl. Acad. Sci. USA 105, 16089–16094.
Baumann, M., Ozdogan, M., Kuemmerle, T., Wendland, K.J., Esipova, E., Radeloff, V.C.,2012. Using the Landsat record to detect forest-cover changes during and afterthe collapse of the Soviet Union in the temperate zone of European Russia.Remote Sens. Environ. 124, 174–184.
Bragina, E.V., Ives, A.R., Pidgeon, A.M., Kuemmerle, T., Baskin, L.M., Gubar, Y.P.,Piquer-Rodriguez, M., Keuler, N.S., Petrosyan, V.G., Radeloff, V.C., 2015. Rapiddeclines of large mammal populations after the collapse of the Soviet Union.Conservation Biology. http://dx.doi.org/10.1111/cobi.12450.
Brandt, R., 1992. Soviet down environment slips the agenda. Science 255, 22–23.Brashares, J.S., Arcese, P., Sam, M.K., Coppolillo, P.B., Sinclair, A., Balmford, A., 2004.
Bushmeat hunting, wildlife declines, and fish supply in West Africa. Science306, 1180–1183.
Breiman, L., 2001. Random forests. Mach. Learn. 45, 5–32.
Bruner, A.G., Gullison, R.E., Rice, R.E., da Fonseca, G.A., 2001. Effectiveness of parks inprotecting tropical biodiversity. Science 291, 125–128.
Cherepanov, S.K., 1995. Vascular Plants of Russia and Adjacent States (the formerUSSR). World and family-95, Saint Petersburg, Russia (in Russian).
DeFries, R., Hansen, A., 2005. Increasing isolation of protected areas in tropicalforests over the past twenty years. Ecol. Appl. 15, 19–26.
Dubinin, M.Y., Kiselev, R.V, Yanitskaya, T.O., 2005. A Map of Strict Nature Reserves,National Parks and Federal-Level Wildlife Refuges of Russia (2005). (in Russian).
Dudwick, N., Gomart, E., Marc, A., Kuehnast, K. (Eds.), 2003. When things fall apart.Qualitative studies of poverty in the former Soviet Union. The World Bank,Washington, DC.
Eroglu, H., Özkaya, M., Acar, H., 2009. Investigation on roundwood extraction of Fagusorientalis lipsky, Abies nordmanniana (Stew.) Spach. and Picea orientalis (L.) Link.by Urus M III forest skyline on snow. African J. Biotechnol. 8, 1082–1089.
Federal Law of Russian Federation on Nature Reserves, 2014. Moscow, Russia (inRussian).
Federal Law of Russian Federation on Protection of Environment, 2014. Moscow,Russia (in Russian).
Filiptchouk, A.N., Strakhov, V.V., Borisov, V.A., 2001. Forest and forest productscountry profile. Russian Federation. Geneva Timber For. Study Pap. 18.
Griffiths, P., Kuemmerle, T., Kennedy, R.E., Abrudan, I.V., Knorn, J., Hostert, P., 2012.Using annual time-series of Landsat images to assess the effects of forestrestitution in post-socialist Romania. Remote Sens. Environ. 118, 199–214.
Guo, S.Y., Fraser, M.W., 2010. Propensity Score Analysis: Statistical Methods andApplications (Advanced Quantitative Techniques in the Social Sciences). SAGEPublications Inc, Washington, D.C..
Hansen, M.C., Potapov, P.V., Moore, R., Hancher, M., Turubanova, S.A., Tyukavina, A.,Thau, D., Stehman, S.V., Goetz, S.J., Loveland, T.R., Kommareddy, A., Egorov, A.,Chini, L., Justice, C.O., Townshend, J.R.G., 2013. High-resolution global maps of21st-century forest cover change. Science 342, 850–853.
Healey, S., Cohen, W., Zhiqiang, Y., Krankina, O., 2005. Comparison of tasseled cap-based landsat data structures for use in forest disturbance detection. RemoteSens. Environ. 97, 301–310.
Henry, L., Douhovnikoff, V., 2008. Environmental issues in Russia. Annu. Rev.Environ. Resour. 33, 437–460.
Hocking, M., Stolton, S., Dudley, N., 2000. Evaluating Effectiveness: A Framework forAssessing Management Effectiveness of Protected Areas, second ed. IUCN,Gland, Switzerland, and Cambridge, UK.
Ioffe, G., Nefedova, T., 2004. Marginal farmland in European Russia. Eurasian Geogr.Econ. 45, 45–59.
IUCN (International Union for Conservation of Nature), 2014. The IUCN red list ofthreatened species. Version 2014.1. IUCN, Gland, Switzerland. <http://www.iucnredlist.org> (accessed November 2014).
Joppa, L.N., Pfaff, A., 2009. High and far: biases in the location of protected areas.PLoS ONE 4, e8273.
Joppa, L., Pfaff, A., 2010. Reassessing the forest impacts of protection: the challengeof nonrandom location and a corrective method. Ann. N. Y. Acad. Sci. 1185, 135–149.
Joppa, L.N., Pfaff, A., 2011. Global protected area impacts. Proc. R. Soc. B Biol. Sci.278, 1633–1638.
Knorn, J., Kuemmerle, T., Radeloff, V.C., Szabo, A., Mindrescu, M., Keeton, W.S.,Abrudan, I., Griffiths, P., Gancz, V., Hostert, P., 2012. Forest restitution andprotected area effectiveness in post-socialist Romania. Biol. Conserv. 146, 204–212.
Kolesnikov, S.V. (Ed.), 2003. Regions of Russia. Socio-economic variables 2003.Federal State Statistical Service, Moscow (in Russian).
Kuemmerle, T., Hostert, P., Radeloff, V.C., Perzanowski, K., Kruhlov, I., 2007. Post-socialist forest disturbance in the Carpathian border region of Poland, Slovakia,and Ukraine. Ecol. Appl 17, 1279–1295.
Kuemmerle, T., Chaskovskyy, O., Knorn, J., Radeloff, V.C., Kruhlov, I., Keeton, W.S.,Hostert, P., 2009. Forest cover change and illegal logging in the UkrainianCarpathians in the transition period from 1988 to 2007. Remote Sens. Environ113, 1194–1207.
Law of Republic of Abkhazia on environmental protection, 2010. Sukhumi, Abkhazia(in Abkhaz).
Lebedev, A., 2001. The Wild East: Trees in Transit. The Timber Trade BetweenSiberia, the Russian Far East and China.
Mas, J.-F., 2005. Assessing protected area effectiveness using surrounding (buffer)areas environmentally similar to the target area. Environ. Monit. Assess. 105,69–80.
Masek, J.G., Huang, C., Wolfe, R., Cohen, W., Hall, F., Kutler, J., Nelson, P., 2008. NorthAmerican forest disturbance mapped from a decadal Landsat record. RemoteSens. Environ. 112, 2914–2926.
Naughton-Treves, L., Alix-Garcia, J., Chapman, C.A., 2011. Lessons about parks andpoverty from a decade of forest loss and economic growth around KibaleNational Park, Uganda. Proc. Natl. Acad. Sci. USA 108, 13919–13924.
Olofsson, P., Foody, G.M., Stehman, S.V., Woodcock, C.E., 2013. Making better use ofaccuracy data in land change studies: estimating accuracy and area andquantifying uncertainty using stratified estimation. Remote Sens. Environ. 129,122–131.
Olofsson, P., Foody, G.M., Herold, M., Stehman, S.V., Woodcock, C.E., Wulder, M.A.,2014. Good practices for estimating area and assessing accuracy of land change.Remote Sens. Environ. 148, 42–57.
Peterson, L.K., Bergen, K.M., Brown, D.G., Vashchuk, L., Blam, Y., 2009. Forested land-cover patterns and trends over changing forest management eras in the SiberianBaikal region. For. Ecol. Manage. 257, 911–922.

464 E.V. Bragina et al. / Biological Conservation 184 (2015) 456–464
Plotnikov, M., 2010. Fur forests of the Western Caucasus. Research, Protection, andSustainable Use. ‘‘Quality’’, Maikop (in Russian).
Potapov, P., Turubanova, S., Hansen, M.C., 2011. Regional-scale boreal forest coverand change mapping using Landsat data composites for European Russia.Remote Sens. Environ. 115, 548–561.
Sieber, A., Kuemmerle, T., Prishchepov, A.V., Wendland, K.J., Baumann, M., Radeloff,V.C., Baskin, L.M., Hostert, P., 2013. Landsat-based mapping of post-Soviet land-use change to assess the effectiveness of the Oksky and Mordovsky protectedareas in European Russia. Remote Sens. Environ. 133, 38–51.
Simeone, J.C., 2013. Value-added Timber Processing in 21st Century Russia: anEconomic Analysis of Forest Sector Policies. University of Washington.
UNESCO, 1999. UNESCO World Heritage List. <http://whc.unesco.org/en/list/900>(accessed January 2014).
Vandergert, P., Newell, J., 2003. Illegal logging in the Russian Far East and Siberia.Intern. Forestry Rev. 5, 303–306.
Waske, B., van der Linden, S., Oldenburg, C., Jakimow, B., Rabe, A., Hostert, P., 2012.ImageRF – a user-oriented implementation for remote sensing image analysiswith Random Forests. Environ. Model. Softw. 35, 192–193.
Wells, M.P., Williams, M.D., 1998. Areas in transition: protected Russia’s reform ofperestroika, economic the impacts the democracy and move towards. Ambio 27,198–206.
Wendland, K., Baumann, M., Lewis, D., Sieber, A., Radeloff, V., 2015. Protected areaeffectiveness in European Russia: a post-matching panel data analysis. LandEcon. 91, 149–168.
Wilkie, D.S., Godoy, R.A., 2014. Income and price elasticities of bushmeat demand inlowland amerindian societies. Conserv. Biol. 15, 761–769.
Williams, M., 1996. Russia and Northern Eurasia: the last frontiers for biodiversityconservation. Nat. Areas News 1, 1–5.
WWF Russia, 2014. Mistakes of Sochi-2014. <http://www.wwf.ru/about/positions/sochi2014/eng> (accessed May 2014).


![Effectiveness of Nortel Networks Time to Market (TTM) - [email protected]](https://static.fdocuments.in/doc/165x107/620634108c2f7b1730056386/effectiveness-of-nortel-networks-time-to-market-ttm-emailprotected.jpg)
