Effectiveness of Circuit Breakers in Mitigating Parallel Arcing Faults ...

Investigation of Damage and Degradation of NM Cables
©2011 Underwrites Laboratories Inc. All rights reserved Page 1
Effectiveness of Circuit Breakers in Mitigating Parallel Arcing Faults in the Home Run
UL Corporate Research
333 Pfingsten Road
Northbrook, IL 60062 USA
Influence of Damage and Degradation on Breakdown Voltage of NM Cables
Final Report
Fan He, PhD, and Paul W. Brazis Jr., PhD
16 November 2012

Investigation of Damage and Degradation on Breakdown Voltage of NM Cables
©2012 Underwriters Laboratories LLC. All rights reserved Page 2
TABLE OF CONTENTS
Document Information ................................................................................................................................... 4
Disclaimer...................................................................................................................................................... 5
Acknowledgement ......................................................................................................................................... 6
Executive Summary ...................................................................................................................................... 7
Introduction ............................................................................................................................................... 9
Electrical Fire Incident Data ................................................................................................................. 9
Objective ............................................................................................................................................. 10
Scope ................................................................................................................................................. 11
Project Plan ........................................................................................................................................ 11
Research Report ..................................................................................................................................... 12
Task 1 — Literature Search ............................................................................................................... 12
Task 2 — NM Cable Sample Selection .............................................................................................. 18
Chemical Characterization – FTIR analysis ....................................................................................... 22
Insulation Breakdown Voltage Test .................................................................................................... 23
Assessment of the NM cable insulation breakdown voltage .............................................................. 25
Task 3 — Assessment of NM Cable Installation Damage ................................................................. 30
Overdriven Staple ............................................................................................................................... 32
Task 4 — Assessment of NM Cable Degradation .............................................................................. 41
Insulation Weight Loss under Different Temperatures ....................................................................... 44
Insulation Weight Loss and the Breakdown Voltage .......................................................................... 45
Task 5 — Assessment of Combined NM Cable Installation Damage and Aging Degradation .......... 49
Summary of Key Findings .................................................................................................................. 57
References ......................................................................................................................................... 60
Investigation of Damage and Degradation on Breakdown Voltage of NM Cables
©2012 Underwriters Laboratories LLC. All rights reserved Page 3

Investigation of Damage and Degradation on Breakdown Voltage of NM Cables
©2012 Underwriters Laboratories LLC. All rights reserved Page 4
Document Information
Release Type Internal External (Confidential) External (Public)
UL Distribution Corporate Research
External Distribution
Date: 12/16/2011
Keywords: NM cable, NM cable installation damage, NM cable
degradation, breakdown voltage
Title: Influence Of Damage And Degradation On Breakdown Voltage Of NM Cables
Author(s) Department Email
Fan He, Paul Brazis Corporate Research [email protected]
Reviewer(s) Department Email
Pravinray Gandhi Corporate Research [email protected]

Investigation of Damage and Degradation on Breakdown Voltage of NM Cables
©2012 Underwriters Laboratories LLC. All rights reserved Page 5
Disclaimer
In no event shall UL be responsible to anyone for whatever use or nonuse is made of the information
contained in this Report and in no event shall UL, its employees, or its agents incur any obligation or
liability for damages including, but not limited to, consequential damage arising out of or in connection
with the use or inability to use the information contained in this Report. Information conveyed by this
Report applies only to the specimens actually involved in these tests. UL has not established a factory
Follow-Up Service Program to determine the conformance of subsequently produced material, nor has
any provision been made to apply any registered mark of UL to such material. The issuance of this
Report in no way implies Listing, Classification or Recognition by UL and does not authorize the use of
UL Listing, Classification or Recognition Marks or other reference to UL on or in connection with the
product or system.

Investigation of Damage and Degradation on Breakdown Voltage of NM Cables
©2012 Underwriters Laboratories LLC. All rights reserved Page 6
Acknowledgement
Underwriters Laboratories LLC (UL) is grateful to Fire Protection Research Foundation for its help in
organizing a technical panel of experts to guide the UL research team in the investigation. The technical
panel provided important review of project plan as well provided feedback on the results developed.
The technical panel consisted of the following members:
John Allen, ATF Fire Research Laboratory
Vyto Babrauskas, Fire Science and Technology Inc.
Bill Burke, Electrical Division Director, NFPA
Anthony Hamins, Building and Fire Research Laboratory, NIST
Mark Hilbert, New Hampshire Department of Safety
Doug Lee, Consumer Product Safety Commission
Wei-Jen Lee, University of Texas at Arlington
Dave Mercier, Southwire Company
John Sleights, Travelers Insurance

Investigation of Damage and Degradation on Breakdown Voltage of NM Cables
©2012 Underwriters Laboratories LLC. All rights reserved Page 7
Executive Summary
According to the fire incident data from 2003 to 20075, there is an average of 50,900 fires annually in
homes related to electrical failure or malfunction. An NFPA analysis of home fire statistics shows that
electrical fires result in an average of 490 civilian deaths, 1140 injuries, and $1.3B in direct property
damage every year. Approximately 57% of these fires originate from wiring and related equipment1. Some
key causes of fires due to electrical wiring result from arcing and loose connections. These conditions
may develop from improper installation or maintenance and are exacerbated over time from exposure to
high temperature and humidity.
Currently, the National Electrical Code (NEC®) requires the use of arc fault circuit interrupters (AFCIs) in
the electrical panel of a dwelling unit to protect against arcing faults. The 2011 National Electric Code
(Article 210.12) allows the use of an AFCI located in the first electrical receptacle of a residential circuit in
lieu of an AFCI located inside the electrical panel as an exception. However, the wiring from the circuit
panel to the first receptacle (home run) is required to be protected from damage during installation per
code requirements.
In preparation for the 2014 Edition of the National Electrical Code® (NEC®), several proposals were
made to revise Section 210.12 for arc-fault circuit-interrupter protection to permit a listed outlet branch
circuit type arc-fault circuit interrupter (OBC AFCI) to be installed at the first outlet on the branch circuit
under certain conditions of installation. Two questions have arisen regarding the use of an OBC AFCI:
one, under what conditions, if any, would a conventional circuit breaker mitigate an arcing fault (with
respect to the criteria in UL 1699); and two, if carbonized path arcing may occur within the home run
given potential for installation damage and subsequent cable aging. The first question has been
addressed in three UL research reports2,3,28
; and the second question is addressed in this report.
This research investigation was undertaken to study the influence of damage (i.e., damage occurring
during installation of the electrical wiring) and subsequent degradation of the dielectric breakdown voltage
of the cable insulation. Dielectric breakdown is a primary cause of the formation of a carbonized path
between conductors, which can result in a carbonized path arcing fault.
This project investigated commercially available 14-gauge, two-conductor (14-2) type NM (NEC 334.2)
cables with bare ground conductor, from five different manufacturers. Two cables were selected after
characterizing their insulating materials using a combination of analytical techniques and measurement of
dielectric strength. The selected cable insulations had distinct plasticizer and additives, and measured
dielectric strength values.
Two types of damage scenarios were investigated in this work, representative of the information found in
the literature, associated with installation activities: (i) inadvertent hammer blow to the cable outer jacket;
and (ii) compression of the insulation from over-driving staples through the outer jacket. In both cases,
methods were developed to provide repeatable and controlled damage to the cable. Other types of
damage scenarios like pest infestation are not discussed in this report due to lack of data and quantitative

Investigation of Damage and Degradation on Breakdown Voltage of NM Cables
©2012 Underwriters Laboratories LLC. All rights reserved Page 8
test methods. The dielectric breakdown voltage of the cable insulation was tested after applying the
damage conditions. The results showed that such damage to cables during installation may reduce the
NM cable insulation breakdown voltage from over 20kV (in undamaged cables) to less than 1kV, and
below the 5kV failure threshold set by UL719 and other related safety standards. Though carbonized
arcing will not occur until the breakdown voltage falls below 170V, lowered breakdown voltage render the
NM cable susceptible to further breakdown damage from voltage surges, which occur more frequently at
or below 6kV. Thus, as the insulation breakdown voltage falls, the potential of a carbonized path and
subsequent parallel arcing fault forming in the cable increases.
Another focus of this project was the influence of thermal aging of NM cable on its dielectric breakdown
voltage. Selected cable samples were exposed to a range of elevated temperatures up to 150°C. This
maximum temperature was selected to ensure that the cable insulation (plasticized PVC) does not
undergo dehydrochlorination4, but will still induce plasticizer loss, which is a major degradation pathway.
The samples were weighed and dielectric breakdown voltage tests were performed at regular intervals.
The project also investigated the combined effect on initial damage followed by thermal aging on the
breakdown voltage. The influence of combined initial damage followed by thermal aging resulted in faster
reduction of dielectric breakdown voltage of the cable insulation.
To evaluate the probability of arcing when NM cables have lowered breakdown voltages, hammer-
damaged and aged NM cable samples were tested per UL1449 (Standard for Surge Protective Devices).
This test showed despite a breakdown voltage lower than the surge voltage (using 6kV surges on
samples with breakdown voltages below 5kV), 9% of the hammer-damaged and 2% of the hammer-
damaged and then aged samples exhibited arcing after the surge occurred. All of these observed arcs
were approximately 1.7ms in duration, meaning that the arcing was longer than the surge event (i.e.,
supplied by 120VAC), but self-extinguished within a single AC half-cycle. These events did not have
enough energy to ignite NM cable insulation and were not sustained for more than one half-cycle, a
duration that is not expected to trip an AFCI and is shorter than the UL1699 eight half-cycle criterion. To
evaluate whether subsequent damage would increase arcing duration or sustainability, samples were
tested using 300 voltage surges to understand how likely the repeated voltage surge and arcing may
result in sustainable arcing and ignite the NM cable insulation. But these tests did not show any sustained
arcing.
The test results indicate that the probability of sustained arcing and ignition is low for hammer-damaged
NM cable. The results also show that though a carbonized path may eventually be formed, this path
formation did not lead to subsequent ignition of the cable jacket or surrounding materials, and self-
extinguished after a short period of arcing.

Investigation of Damage and Degradation on Breakdown Voltage of NM Cables
©2012 Underwriters Laboratories LLC. All rights reserved Page 9
THE INFLUENCE OF DAMAGE AND DEGRADATION ON THE BREAKDOWN VOLTAGE OF NM CABLES
Introduction
Electrical Fire Incident Data
According to published reports and research articles, the number of residential electrical fires ranges from
28,300 to 60,000 per year5, depending on the source of the data. Since the terms ‘electrical fire’,
‘electrical wiring’, and ‘electrical equipment’ are not rigorously defined in literature, quantitative data varies
among sources. Approximately half of all electrical fires can be attributed to installed wiring and related
equipment6. Figure 1 shows the reported sources of electrical fires.
Figure 1 - Source of electrical fires
Table 1 provides a summary of the statistical data from a number of sources. Several investigations have
identified that key contributors to electrical fires are wire degradation, damage7, improper installation, and
excessive electrical circuit load8.
Table 1 - Electrical fire statistics
Source of data
Average number of
electrical fires per
year
% of fires caused by
wiring and equipment Reference
National Fire Protection
Association 50,900 57 1
US Fire Administration 28,300 47 5
Other 32,000 to 60,000 N/A 7

Investigation of Damage and Degradation on Breakdown Voltage of NM Cables
©2012 Underwriters Laboratories LLC. All rights reserved Page 10
Table 2 summarizes the causes of electrical fires and provides references for the data.
Table 2 – Possible faulty conditions of electrical fires
Faulty condition Description Reference
Wire degradation Aging over time under high temperature, high humidity and other
environmental exposures
6, 8
Excessive load Load greater than the rated current under specific temperature 8
Voltage surge High Voltage may result in arcing and cause fire 15
Bad connection High resistance connection in receptacles, junction boxes etc. 8
Mechanical damage in
installation
Over compression by stapling the NM cable with high pressure,
staple puncture, cracking by bending the NM cable with sharp
angle, abrasion and hammer impact
22, 23
Damage due to pest
infestation Damages caused by rodent and other pests 8
The National Electrical Code (NEC®) requires the use of arc fault circuit interrupters (AFCIs) in the home
electrical panel to protect against arcing faults. The 2011 NEC (Article 210.12) allows the use of an AFCI
built into the first electrical receptacle after the circuit panel in lieu of an AFCI in the electrical panel
provided the wiring from the circuit panel to the first receptacle (home run) is installed in a metal conduit
(or similar type of raceway) to protect it from damage during installation.
NM cable is used extensively in the USA, with approximately 8 billion feet of NM cable sold in 2007, and
is used in nearly 75% of new single family homes9. Thus, the NEC requirement would exclude the use of
the receptacle-based AFCI in many communities where NM cabling is permitted without the use of
protective metal conduit.
The research investigation described in this report was undertaken to study the influence of damage (i.e.,
from installation) and subsequent degradation on the dielectric breakdown voltage of NM cable insulation,
since this is an important electrical property relative to carbonization of electrical insulation and potential
for ignition.
Objective
The objective of this project was to develop data on the influence of damage during installation and
degradation of NM cable’s insulation relative to its dielectric breakdown voltage.

Investigation of Damage and Degradation on Breakdown Voltage of NM Cables
©2012 Underwriters Laboratories LLC. All rights reserved Page 11
Scope
This investigation was focused on commercially available NM cables in USA.
This investigation did not develop data to predict service life of the NM cables under installed field
conditions.
Project Plan
A technical plan to meet the research objectives was developed as follows:
Task 1. Literature search.
Task 2. Sample selection.
Task 3. Installation damage assessment.
Task 4. Aging and service life assessment.
Task 5. Combined installation and aging degradation.
Task 6. Technical report.
The research report is presented herein.

Investigation of Damage and Degradation on Breakdown Voltage of NM Cables
©2012 Underwriters Laboratories LLC. All rights reserved Page 12
Research Report
Task 1 — Literature Search
The literature search for this project focused on (i) types of electrical wiring used in homes; extensive use
of NM cable in the US; the typical construction of NM cable; and (ii) data for damage and degradation of
electrical wiring.
Electrical Wiring in US Homes10
There are several types of electrical wiring permitted in homes by the NEC. These include (i) separated
conductors; (ii) armored cable; and (iii) non-metallic (NM) cable. A brief background on these wiring
systems is presented herein.
Separated Conductors
Beginning in Thomas Edison’s timeframe, the original residential wiring systems used conductor
insulation made of gum-rubber. This “rubber” insulation was a mixture of ingredients including vulcanizing
agents containing sulfur for curing. These various additives, especially sulfur, had a very corrosive effect
on the copper conductor, so the copper had to be tin-coated.
During the 1950’s, the wire industry began transitioning residential wire insulation from rubber to the
newly developed polyvinyl chloride (PVC) thermoplastics with the extensive use of low molecular weight
ester plasticizers (typically based on phthalic or trimellitic anhydride and various short chain alcohols
(from C8 to C15). Plasticized PVC compounds have advantages over vulcanized rubbers in that they did
not suffer from the brittleness and cracking with age that was typical of the older rubber insulation. It also
did not contain sulfur additives that could damage the conductor, so the copper did not have to be tin-
coated. Another advantage of plasticized PVC compounds is that there were more options with color
pigmentations, and the color tended to hold its pigmentation better than rubber, which often had a painted
wrap that discolored with time. In the mid-1980’s, 90°C rated wire began replacing the 60°C and 75°C
wire typical of the earlier installations.
Today the separated conductor type of electrical wire is mostly used in the building electrical systems that
require metal tube or metal conduit for wire protection. The installation procedure is to first install the
metal tubes or conduits as the wire protection in the electrical distribution system, and then feed the
insulated electrical wires through the metal tubes or conduits for electrical connections.
Armored Cable
Armored cable (AC) was first Listed in 1899 for the Sprague Electric Co. of New York, and was originally
called “Greenfield Flexible Steel-Armored Conductors,” after one of its inventors, Harry Greenfield. There
were originally two experimental versions of this product, one called “AX” and the other “BX,” with the “X”
standing for “experimental.” The “BX” version became the one that eventually got produced, and hence

Investigation of Damage and Degradation on Breakdown Voltage of NM Cables
©2012 Underwriters Laboratories LLC. All rights reserved Page 13
the name “BX” stuck, which also became the registered trade name of armored cable for General Electric,
which later divested this business to Sprague Electric.
Armored cable, or BX, first appeared in the 1903 NEC, but did not start becoming popular until around
1930, and is still a popular wiring method today. AC cable is described in Article 320 of the NEC. The
armor of AC cable systems is tested for grounding and can provide a suitable equipment grounding path.
AC cable made after 1959 requires an aluminum bonding strip under the armor to help improve the
conductivity of this path. Although originally produced with steel armor, in the late 1980’s lightweight
aluminum armored AC cable first became Listed in accordance to NEC requirements.
Nonmetallic Cable
Nonmetallic-sheathed cable, or NM for short, was first Listed and described in the NEC in 1926, but it was
invented a few years earlier by Rome Wire Company in 1922 in Rome, NY, and marketed under the
trade name “Romex®.” Romex® is now a registered trademark of Southwire Company of Carrollton,
GA11
. Early NM cable had their individual conductor insulation wrapped in a cotton braid that was
impregnated with either a varnish or tar-like substance for moisture protection.
Around 1950, synthetic spun rayon was being permitted to replace the cotton thread in the jacket braid.
Then in the early 1960’s, thermoplastic began replacing the braided jacket altogether, and by about 1970,
most all NM cable had a compounded PVC outer jacket, even though a braid was still permitted until
1984. Also in 1984, NM-B cable was developed and required to have 90°C rated individual conductors,
and a 75°C outer jacket.
Until the early 1960’s, most NM cable for residential use did not have a grounding conductor. However,
changes in the 1962 Code that mandated equipment grounding for all branch circuits popularized the use
of NM cable with ground. Earlier versions of NM cable with ground permitted the grounding conductor to
be one or even two sizes smaller than the current carrying conductors. For example, a 16 AWG ground
wire was permitted for 14 and 12 gauge copper NM, and 14 AWG ground for 10 gauge copper NM. In
1969, new requirements no longer permitted an undersized grounding conductor for 14, 12 and 10 AWG
NM cable.
A survey of residential cable usage shows that NM cable is used extensively in the USA, with
approximately 8 billion feet of NM cable sold in 2007, and is used in nearly 75% of new single family
homes9.
Residential Electrical Cable Installation
In the United States, the indoor residential electric power wiring system is typically considered to start at
the electric power meter installed by the utility company, and includes all wiring within the home. Heavy
gauge cables (i.e., 2/0 AWG cable) connect the electric power meter to the service panel box. The
electric power is then distributed to each room through circuit breakers with NM cable or other types of
cables depending on the local Code.

Investigation of Damage and Degradation on Breakdown Voltage of NM Cables
©2012 Underwriters Laboratories LLC. All rights reserved Page 14
NM Cable Installation
1. A typical single-family house in US has about 2,500 feet of NM cable in the electrical power
system. Because the distance between the service panel box and any room in a house is much
longer than 5 feet, it is necessary12
to secure the NM cable when distributing the electric power to
different areas in the house. For the purpose to quantitatively assess the NM cable damage in the
installation process, this project follows the NEC and NEMA13,14
guidelines when installing the
NM cable test samples.NEMA RV2 2008. Protection for cable in concealed locations: where NM
cable is run through studs, joists or similar wooden members, the outer surface of the cable must
be kept at least 32 mm (1.25 inches) ( from the edges of the wooden members, or the cable
should be protected from mechanical injury. This latter protection can take the form of metal
plates (such as spare outlet box ends) or conduit
2. NEC 2011 300.4. In both exposed and concealed locations, where cables are installed through
bored holes in joists, rafters, or wood framing members, the holes shall be bored so that the edge
of the hole is not less than 1¼ inch from the nearest edge of the wood member. Where this
distance cannot be maintained, or where screws or nails are likely to penetrate the cable, it shall
be protected by a steel plate at least 1/16" thick and of appropriate length and width.
3. NEC 2011 334.30. NM cable shall be supported within 300 mm (1 foot) of every box or fitting, and
at intervals of no more than 1.4 m (4.5 feet).
4. 2- NEMA RV2 2008. Conductor NM cable should never be stapled on edge.
5. NEC 2011 334.12. NM cable should not be embedded in masonry, concrete, adobe, fill or plaster.
NEC 300.7. Portions of raceways and sleeves subject to different temperatures (where passing
from the interior to the exterior of a building) shall be sealed with an approved material to prevent
condensation from entering the service equipment.
6. NEC 300.22. Type NM cable shall not be installed in spaces used for environmental air, however
NM is permitted to pass through perpendicular to the long dimension of such spaces.
7. NEMA RV2 2008. Wire should be selected, but de-rated in current carrying capacity to 60°C.
8. NEC 2011 334.15. Cable shall be protected from physical damages when necessary by rigid
metal conduit, intermediate metal conduit, electrical metal tubing, Schedule 80 PVC conduit, Type
RTRC marked with suffix –XW, or other approved means.
9. NEC 2011 334.12. NM, NMC and NMS should not be used in wet and dump locations.
These guidelines were used to develop data on damage and degradation of the electrical performance of
NM cables in this project.
Potential of Damage to Cable Insulation from Common Installation Practices
The most common method of installing NM cable is to secure the NM cable with staples onto wooden
framing members. The tools used to install NM cable include hammer, manual staple gun, and electric
staple gun. Figure 2 shows a picture of some NM cable installation tools. Because of the accuracy and

Investigation of Damage and Degradation on Breakdown Voltage of NM Cables
©2012 Underwriters Laboratories LLC. All rights reserved Page 15
applied force of the NM cable installation tools, there is a potential of damage to the NM cable during a
home installation. According to the inspection reports22,23
, the most common types of cable damage
include cable puncture, cable over-compression and hammer impact. Electrical Code inspection
organizations record many NM cable installation code violations every year, but there are few quantitative
reports which provide details of how likely the NM cable can be damaged during installation, and what
level of damage the NM cable may suffer.
Figure 2 - NM cable installation tools
There are several kinds of staples used in the installation of NM cables as shown in Table 3. These
include bare metal staples, metal staples with plastic insulation, and plastic staples with metal pins.
Potential damage to the NM cable may occur during installation depending the staples and tools used
(Table 3).
Table 3 - NM cable installation tool and damage mechanisms

Investigation of Damage and Degradation on Breakdown Voltage of NM Cables
©2012 Underwriters Laboratories LLC. All rights reserved Page 16
Damage to Cable Insulation from Voltage Surges
Francois Martzloff investigated residential voltage surges in the 1960s and his research work is still used
as an important reference for expected surge voltages for residential electricity distribution system design
and test. Figure 3 shows frequency data on voltage surges from Francois Martzloff and other sources15
.
Figure 3 - Residential voltage surge statistics.15
According to the data, the probability of 6 kV and higher voltage surge is relatively low in the residential
electricity distribution system, with less than one surge event greater than 6kV expected per year. This
coincides with requirements in electrical wiring test standards for the dielectric breakdown voltage for
home electrical wiring insulation materials. It may be observed from the figure that the frequency of
voltage surge in the USA (blue line in Figure 3) of 2 kV is 15 per year and surges of 1 kV are more than
100 per year.
Cable Insulation Degradation
In addition to either mechanical damage or from voltage surges, the NM cable insulation may experience
subsequent degradation of electrical safety performance during its service life from a number of factors
that include the following:
High-temperature exposure due to overload and/or increased ambient temperature.
Exposing to elevated temperatures can cause accelerate loss of additives, including stabilizer(s)
and plasticizer(s). This is likely to reduce the dielectric strength of the insulation.
High humidity exposure. Exposure to humidity may result in moisture penetration into NM cable
insulation, which could increase the insulation leakage current and reduce the insulation
breakdown voltage.

Investigation of Damage and Degradation on Breakdown Voltage of NM Cables
©2012 Underwriters Laboratories LLC. All rights reserved Page 17
Exposure to salt and other contaminants. Salt and other contaminants or pollutants may
penetrate into the NM cable insulation and accelerate NM cable insulation decomposition and
thus will increase the insulation leakage current and reduce the insulation breakdown voltage.
UV exposure. Ultraviolet radiation has higher energy than visible spectrum photons. If the UV
photon energy is higher than the insulation additive activation energy, UV exposure will
accelerate the loss of insulation additives including stabilizer and plasticizer, and depending on
the temperature material decomposition may also occur.
It is assumed that thermal aging caused either by high ambient temperature or overload is a dominant
factor that accelerates cable insulation degradation over time. This degradation may be further
exacerbated by high humidity and exposure to salts, contaminants or pollutants. Based on the lack of
availability of field samples for calibration and the fact that little residential electrical wiring is exposed to
UV in the real world applications, the scope of this project was limited to investigating only the effect of
thermal degradation of cable insulation materials. UV/visible radiation exposure to conductor insulation is
more likely at splice points or junction boxes (where the outer jacket is removed), but this is also
considered outside the scope of this project.
There are many technical papers in the area of electrical insulation aging and degradation,16,26,17
but there
was lack of data on correlation between cable insulation degradation and electrical performance such as
reduction of the dielectric strength.
Literature Search Summary
Based upon the literature search, a focus for this research project was defined as follows:
Select NM cables in the investigation since NM cables are used commonly in residential buildings
in the USA, and that the insulation used in NM cable are the same or similar to the insulation
used in other types of electrical wiring (i.e., plasticized PVC).
Consider mechanical damage conditions encountered in installing NM cables, such as
inadvertent hammer blows and improper stapling.
Consider only temperature-related degradation conditions of the NM cable insulation materials
that may occur due to overload or high ambient temperature.

Investigation of Damage and Degradation on Breakdown Voltage of NM Cables
©2012 Underwriters Laboratories LLC. All rights reserved Page 18
Task 2 — NM Cable Sample Selection
Five major manufacturers of NM cables, commercially available in the USA, were selected initially for the
research project. The test cables were designated as A, B, C, D, and E, representing the five
manufacturers. The cables were screened using analytical techniques and dielectric breakdown testing to
select two NM cables with distinct cable characteristics.
NM Cable Insulation Characterization
NM cable insulation materials from five manufacturers were characterized with respect to their thermal,
chemical, and electrical properties. Based upon results, two cables with distinct properties were identified
for further evaluation in this research investigation.
Thermal Characterization – Thermogravimetric Analysis
Thermogravimetric analysis (TGA) was performed on the NM cable insulation materials to develop
information on the thermal degradation of cable insulation under controlled temperature conditions.
In the temperature scan mode, the TGA furnace temperature is increased at a constant rate in air or
nitrogen environment, and the insulation sample weight is monitored. Figure 4 through Figure 8 show the
TGA weight loss rate results in air environment and at 20 0C/min scan rate for ten different NM cable
insulation materials from the five NM cable samples. The results for white insulation material are on the
left hand side, and results for the black insulation are on the right hand side.
Figure 4 - TGA from Cable A Insulation

Investigation of Damage and Degradation on Breakdown Voltage of NM Cables
©2012 Underwriters Laboratories LLC. All rights reserved Page 19
Figure 5 - TGA from Cable B Insulation
Figure 6 - TGA from Cable C Insulation

Investigation of Damage and Degradation on Breakdown Voltage of NM Cables
©2012 Underwriters Laboratories LLC. All rights reserved Page 20
Figure 7 - TGA from Cable D Insulation
Figure 8 - TGA from Cable E Insulation
The TGA data from the insulation materials (white and black samples) of the NM cables depict some
distinct behavior. For example, Cables B, C, and D show a slight curvature in the first peak indicating that
the weight loss rate is a combination of thermal degradation from multiple insulation components. The
weight loss rate of Cable E is different from others as it displays three main peaks, and an earlier first
peak indicating a more volatile insulation component. Because the TGA profile can be a convolution of
thermal decomposition of many chemical compounds, these differences point to the presence of different
plasticizer compounds used in the different insulations. The thermogravimetric data from the selected NM
cables are summarized in Table 4, which indicates that Cable E is quite different from the others.

Investigation of Damage and Degradation on Breakdown Voltage of NM Cables
©2012 Underwriters Laboratories LLC. All rights reserved Page 21
Table 4 - Weight loss rate peak temperature
1st peak (°C) 2
nd peak (°C) 3
rd peak (°C)
Cable A white N/A 323.32 477.73
Cable A black N/A 321.44 477.10
Cable B white N/A 321.44 478.36
Cable B black N/A 330.86 473.97
Cable C white N/A 335.88 482.13
Cable C black N/A 331.48 481.50
Cable D white N/A 331.48 482.13
Cable D black N/A 329.60 482.75
Cable E white 294.45 330.23 472.08
Cable E black 295.08 333.99 477.73
The TGA equipment may also be programmed to obtain insulation weight loss data exposed to a constant
temperature (isothermal mode). The weight loss data acquired in this manner can be used in estimating
the activation energy of different chemical components in the insulation. It also aids in the understanding
of the temperature-dependent accelerated aging effects when using a thermal chamber to evaluate the
insulation material thermal degradation.
Figure 9 depicts weight loss of four different insulation materials. The chart shows that the insulation
material weight loss is a nonlinear function of time, and insulation materials from different brands of NM
cable have different weight loss rates at a particular TGA temperature. The nonlinear characteristic
observed in the weight loss data is indicative of multiple thermal decomposition processes in the
insulation material
Figure 9 - Constant temperature TGA data. The red trace is cable B white insulation weight loss, the
green trace is cable B black insulation weight loss, the purple trace is cable E black insulation weight loss,
and the orange trace is cable E white insulation weight loss.
02468
1012141618202224
0
37
74
11
1
14
8
18
5
22
2
25
8
29
5
33
2
36
9
40
6
44
3
48
0
51
7
55
4
59
1
62
8
66
5
70
2
73
9
77
6
81
2
84
9
88
6
92
3We
igh
t Lo
ss (
%)
Time (min)
200 0C constant temperature

Investigation of Damage and Degradation on Breakdown Voltage of NM Cables
©2012 Underwriters Laboratories LLC. All rights reserved Page 22
Chemical Characterization – FTIR analysis
The insulation materials from the NM cables were chemically analyzed with an FTIR (Fourier Transform
Infrared) analyzer using the attenuated total reflectance method.
Figure 10 shows the test results for Cable B and Cable E insulation (in blue) for the white insulation. The
black insulation also has similar IR characteristics. The plasticizers used in the cables were identified
through comparison to a chemical library (in red).18
The FTIR results indicate that Cable B has a
phthalate plasticizer, while Cable E has trimellitate plasticizer. These plasticizers exhibit significantly
different properties as will be discussed in the following sections. The plasticizer data for each NM cable
are summarized in Table 5.
Figure 10 - FTIR spectrum for Cable B and Cable E insulation
Table 5 – Cable Insulation Plasticizers
Cable Plasticizer
Cable A white Phthalate
Cable A black Phthalate
Cable B white Phthalate
Cable B black Phthalate
Cable C white Trimelliate
Cable C black Trimelliate
Cable D white Trimelliate
Cable D black Trimelliate
Cable E white Trimelliate
Cable E black Trimelliate

Investigation of Damage and Degradation on Breakdown Voltage of NM Cables
©2012 Underwriters Laboratories LLC. All rights reserved Page 23
Table 6 – Property Comparison of Selected Phthalate and Trimellitate Plasticizers Di-iso-nonyl phthalate
(DINP), Di-tri-decyl phthalate (DTDP), Tri-2-ethylhexyl Trimellitate (TOTM)
Plasticizer DINP DTDP TOTM
Molecular Formula C26H42O4 C34H58O4 C33H54O6
Appearance@25oC Clean liquid Clean liquid Clean liquid
Molar Mass (Molecular weight) 418.61 g/mol 530.82 g/mol 546.79 g/mol
Melting Point -43oC -37
oC -38
oC
Boiling Point at 760mm Hg 405.7oC 508.2
oC 414
oC
Vapor Pressure at 25oC 8.61 x 10
-7 mmHg 3.63 x 10
-8 mmHg 4.10 x 10
-14 mmHg
From Plastics Additives19
“trimellitate esters are distinguished by high thermal stability and low
volatility”. This is evidenced by the low vapor pressure in comparison to the two common phthalates
listed in the table. The trifunctional ester in trimellitates provides superior permanence and dispersion in
polar PVC formulations. Note that other properties of the phthalates and trimellitates are quite similar
(molecular weight, boiling point and water solubility) so the key property is vapor pressure.
Insulation Breakdown Voltage Test
As was shown in the literature discussion conducted in Task 1 and illustrated in Figure 3, significant surge
voltages are encountered in home wiring below 6 kV. There are several breakdown voltage test
standards for dielectric strength evaluations. Since the equipment used in the breakdown voltage test is
calibrated for RMS values at 60Hz, all breakdown voltage measurements cited in this report are RMS
values20
.
When performing breakdown voltage tests in air, it was observed that the air is ionized and generates a
corona when the electric field strength is greater than the air breakdown threshold of 3 kV/mm. Since high
speed particles in the corona can preheat the sample and weaken the wire insulation, it impacts the
measurement of the breakdown voltage. Thus, the test fixture was redesigned to reduce the impact of the
corona on the measurement, as it was anticipated that the breakdown voltage of the insulation materials
to be greater than 3 kV. The test fixture is depicted in Figure 11. The test fixture was designed to test a
single-insulation conductor (without the NM cable outer jacket).

Investigation of Damage and Degradation on Breakdown Voltage of NM Cables
©2012 Underwriters Laboratories LLC. All rights reserved Page 24
Figure 11 - Fixture for the NM cable breakdown voltage test
The sample preparation procedure was as follows:
1. Pull out the conductors from the NM cable outer jacket
2. Strip insulation by a half inch at one end of the conductor
3. Bend the conductor around a quarter inch diameter rod
4. Vary the voltage across the conductor until insulation breakdown occurs. Breakdown of the
insulator is detected when the leakage current reaches 10 mA.
A schematic of the cable sample under test and the test probe during the breakdown voltage test is
depicted in Figure 12.
Figure 12 – Cross-section of the Teflon fixture for the NM cable breakdown voltage test

Investigation of Damage and Degradation on Breakdown Voltage of NM Cables
©2012 Underwriters Laboratories LLC. All rights reserved Page 25
Assessment of the NM cable insulation breakdown voltage
To develop statistically significant data, 30 specimens were tested on both the black and white insulation
for each type of the NM cables, except for Cable C (29 white specimens and 29 black specimens). The
average, minimum, and maximum values of the breakdown voltage are depicted in Figure 13.
Figure 13 - Average breakdown voltage comparison
The average breakdown voltages along with the standard deviation are summarized in Table 7. Pearson
analysis21
was applied to determine if insulation thickness had an influence of breakdown voltage, and the
result showed that insulation thickness of the selected NM cables was not correlated to the measured
dielectric breakdown voltage.
The results of dielectric breakdown voltage were further analyzed to assess if the difference in
measurements were statistically significant. Figure 14 through Figure 18 show the breakdown voltage
distribution for the black and white insulation of Cables A, B, C, D and E, respectively. The breakdown
voltage results indicate that the distributions are normally distributed (i.e., Gaussian).

Investigation of Damage and Degradation on Breakdown Voltage of NM Cables
©2012 Underwriters Laboratories LLC. All rights reserved Page 26
Table 7 - Average breakdown voltage and standard deviation
Sample Type Average breakdown
voltage (kV)
Insulation
Thickness
(mm)
Number of
samples Standard Deviation (kV)
Cable A white 20.1 0.35 30 1.15
Cable A black 17.1 0.37 30 1.42
Cable B white 18.57 0.40 30 1.04
Cable B black 19.36 0.41 30 0.81
Cable C white 20.7 0.40 29 1.13
Cable C black 20.95 0.39 29 1.02
Cable D white 20.87 0.38 30 0.93
Cable D black 21.93 0.38 30 1.02
Cable E white 23.34 0.39 30 1.15
Cable E black 22.54 0.39 30 1.23
Pearson coefficient
0.096
P value 0.791
Figure 14 - Cable A breakdown voltage distribution

Investigation of Damage and Degradation on Breakdown Voltage of NM Cables
©2012 Underwriters Laboratories LLC. All rights reserved Page 27
Figure 15 - Cable B breakdown voltage distribution
Figure 16 - Cable C breakdown voltage distribution
Figure 17 - Cable D breakdown voltage distribution

Investigation of Damage and Degradation on Breakdown Voltage of NM Cables
©2012 Underwriters Laboratories LLC. All rights reserved Page 28
Figure 18 - Cable E breakdown voltage distribution
To verify if two different insulation materials may have different breakdown voltages21
, the following
equation was used to calculate the breakdown voltage difference between two different types of NM cable
insulation compositions:
( )
Where ΔVij is the difference between the two measured average breakdown voltages, Vi is the average
breakdown voltage for cable i, Vj is the average breakdown voltage for cable j, Ci is the 95.4% confidence
interval for cable i, and Cj is the 95.4% confidence interval for cable j. If ΔVij is larger than zero, there is no
overlap between the two measured average breakdown voltages, in other words, the two insulations have
different breakdown voltages. Table 8 shows the calculated results for the white insulation of five different
NM cables.
Table 8 - Differences in white insulation breakdown voltage
white A B C D E
A 0.73 kV -0.24 kV 0.01 kV 2.40 kV
B 0.73 kV 1.33 kV 1.58 kV 3.97 kV
C -0.24 kV 1.33 kV -0.59 kV 1.80 kV
D 0.01 kV 1.58 kV -0.59 kV 1.71 kV
E 2.40 kV 3.97 kV 1.80 kV 1.71 kV
The numbers in Table 8 are the differences between the measured average breakdown voltages with
95% confidence level for white insulation. For instance, the value in the cell at column A and row B shows
that the breakdown voltage difference between Cable A and Cable B white insulation is 0.73 kV with a
confidence level of 95%. Since the average breakdown voltage difference is greater than zero, Cable A
and Cable B white insulation may be considered to be statistically different. On the other hand, the
difference of the breakdown voltage between white insulation from Cable A and Cable C is minus 0.24
Investigation of Damage and Degradation on Breakdown Voltage of NM Cables
©2012 Underwriters Laboratories LLC. All rights reserved Page 29
kV. Since this is less than zero, there is no statistical difference between the breakdown voltages of Cable
A and C insulation materials.
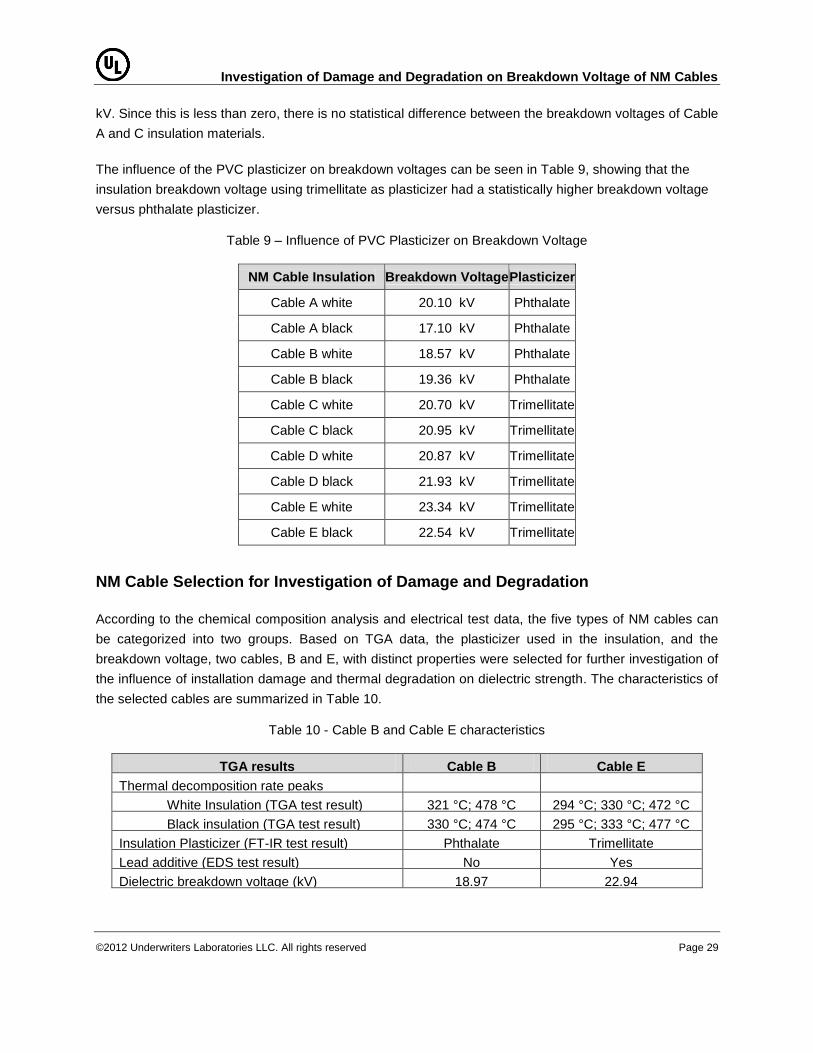
The influence of the PVC plasticizer on breakdown voltages can be seen in Table 9, showing that the
insulation breakdown voltage using trimellitate as plasticizer had a statistically higher breakdown voltage
versus phthalate plasticizer.
Table 9 – Influence of PVC Plasticizer on Breakdown Voltage
NM Cable Insulation Breakdown Voltage Plasticizer
Cable A white 20.10 kV Phthalate
Cable A black 17.10 kV Phthalate
Cable B white 18.57 kV Phthalate
Cable B black 19.36 kV Phthalate
Cable C white 20.70 kV Trimellitate
Cable C black 20.95 kV Trimellitate
Cable D white 20.87 kV Trimellitate
Cable D black 21.93 kV Trimellitate
Cable E white 23.34 kV Trimellitate
Cable E black 22.54 kV Trimellitate
NM Cable Selection for Investigation of Damage and Degradation
According to the chemical composition analysis and electrical test data, the five types of NM cables can
be categorized into two groups. Based on TGA data, the plasticizer used in the insulation, and the
breakdown voltage, two cables, B and E, with distinct properties were selected for further investigation of
the influence of installation damage and thermal degradation on dielectric strength. The characteristics of
the selected cables are summarized in Table 10.
Table 10 - Cable B and Cable E characteristics
TGA results Cable B Cable E
Thermal decomposition rate peaks
White Insulation (TGA test result) 321 °C; 478 °C 294 °C; 330 °C; 472 °C
Black insulation (TGA test result) 330 °C; 474 °C 295 °C; 333 °C; 477 °C
Insulation Plasticizer (FT-IR test result) Phthalate Trimellitate
Lead additive (EDS test result) No Yes
Dielectric breakdown voltage (kV) 18.97 22.94

Investigation of Damage and Degradation on Breakdown Voltage of NM Cables
©2012 Underwriters Laboratories LLC. All rights reserved Page 30
Task 3 — Assessment of NM Cable Installation Damage
Electrical code inspection organizations record a significant number of NM cable installation Code
violations every year22
, for the purpose of addressing improper installation issues and to improve
installation practices. To better understand potential damage to the NM cable qualitatively as well as
quantitatively, cables were installed using NEMA guidelines.
A series of scoping tests were conducting using common installation methods to assess the nature and
degree of possible damage to NM cable insulation. Cable segments were installed on wood studs using
NEMA the guidelines for installing the cables.
Figure 19 - NM cables installed on wood studs
Based upon field inspection reports23
, three types of damage scenarios were considered: (a) misaligned
staple; (b) over-driven staple; and (c) inadvertent hammer impact to the NM cable jacket. The staples
were driven into the wood studs using either a manual stapler; an electric stapler; or a hammer. At least
100 staples were used with each installation method. A typical installation of the NM cables is illustrated
in Figure 19. The test results from staple puncture, over-driven staple, and hammer impact are described
in the following sections.

Investigation of Damage and Degradation on Breakdown Voltage of NM Cables
©2012 Underwriters Laboratories LLC. All rights reserved Page 31
Staple Puncture
When installing NM cable with a hammer, it was observed that the user has to tap the staple into the
wood frame before hitting it hard and securing it. Therefore, it is unlikely to have staple puncture damage
when using a hammer to install the NM cable. However, when installing NM cable with a staple gun, the
view of the NM cable can be blocked to the installer by the staple gun. In this case, the staple gun may be
misaligned with the NM cable and the staple may damage the conductor insulation. Figure 20 shows a
picture of a misaligned staple and the conductor insulation damaged by the staple.
Figure 20 - NM cable damaged by misaligned staple
To estimate the potential for staple misalignment, using a stapler, and damage to the NM cable, 350 feet
of NM cable was installed in a simulated attic space with 452 staples. The distance between the adjacent
two staples is less than the maximum distance recommended by the NEMA NM cable installation
guideline. After installation, the cable segments around the stapes with visible damage to the jacket were
further examined for damage to the insulation. These segments were then tested for the breakdown
voltage. The results are summarized in Table 11.
Table 11- NM cable staple misalignment damage
Installation
method
Number of
samples
Samples with
visible jacket
puncture
Samples with
visible
insulation
puncture
Percentage of
samples with
insulation
puncture
Electric stapler 136 22 5 3.7%
Manual stapler 207 5 1 0.5%
Investigation of Damage and Degradation on Breakdown Voltage of NM Cables
©2012 Underwriters Laboratories LLC. All rights reserved Page 32
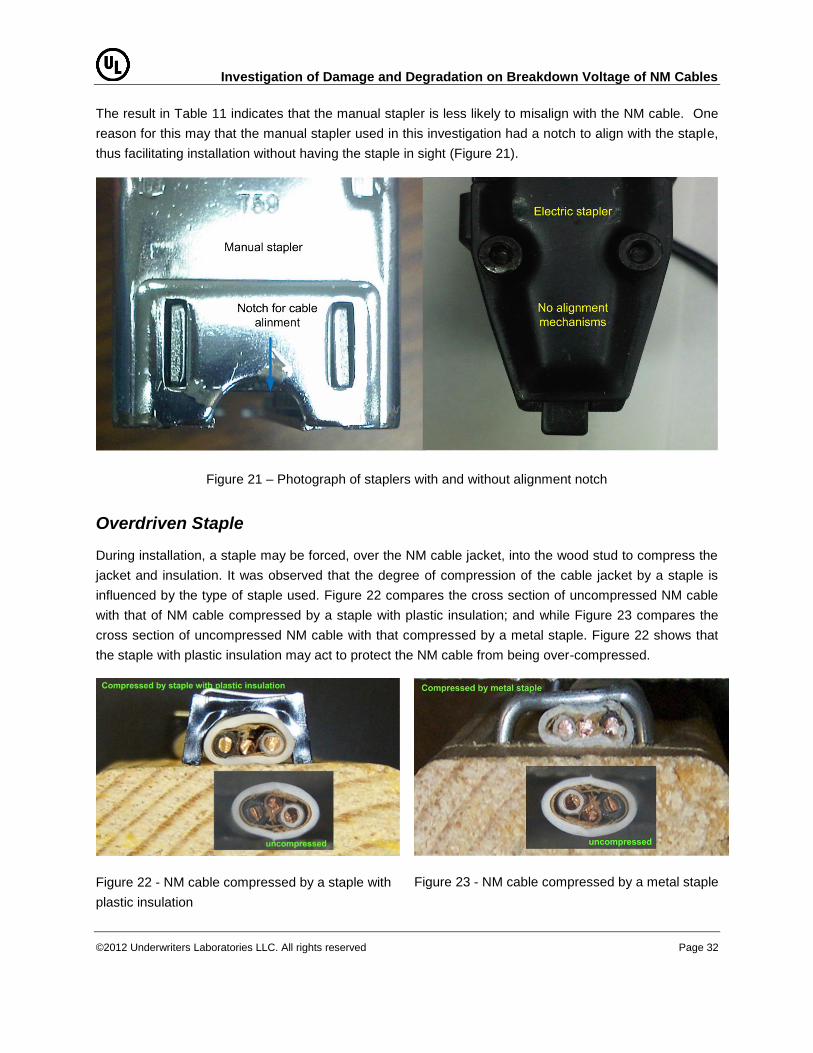
The result in Table 11 indicates that the manual stapler is less likely to misalign with the NM cable. One
reason for this may that the manual stapler used in this investigation had a notch to align with the staple,
thus facilitating installation without having the staple in sight (Figure 21).
Figure 21 – Photograph of staplers with and without alignment notch
Overdriven Staple
During installation, a staple may be forced, over the NM cable jacket, into the wood stud to compress the
jacket and insulation. It was observed that the degree of compression of the cable jacket by a staple is
influenced by the type of staple used. Figure 22 compares the cross section of uncompressed NM cable
with that of NM cable compressed by a staple with plastic insulation; and while Figure 23 compares the
cross section of uncompressed NM cable with that compressed by a metal staple. Figure 22 shows that
the staple with plastic insulation may act to protect the NM cable from being over-compressed.
Figure 22 - NM cable compressed by a staple with
plastic insulation
Figure 23 - NM cable compressed by a metal staple

Investigation of Damage and Degradation on Breakdown Voltage of NM Cables
©2012 Underwriters Laboratories LLC. All rights reserved Page 33
Figure 24 - Overdriven NM cable samples
Figure 24 depicts damage to NM insulation jackets by overdriven staples using various methods. Picture
1 shows NM cable damaged by staples overdriven by an electric stapler. Picture 2 shows NM cable
samples damaged by staples overdriven with a hammer. Picture 3 shows exposure of conductor from a
staple overdriven by an electric stapler. Picture 4 shows exposure of conductor from staples overdriven
by a hammer. The visual inspection of the conductor insulation reveals that installation damage
sometimes may generate visible damage to the jacket, but the same impact may not always generate
visible damage on the conductor insulation.
To quantify the damage due to overdriven staples, the insulation breakdown voltage of the overdriven NM
cable samples were measured as summarized in table 12.

Investigation of Damage and Degradation on Breakdown Voltage of NM Cables
©2012 Underwriters Laboratories LLC. All rights reserved Page 34
Table 12 - Breakdown voltage of overdriven NM cable samples for cable E
Installation method Compression
mark
Number of
damaged
samples
Breakdown voltage
(kV)
Number of
samples with
breakdown voltage
less than 6 kV after
damage
New No 60 19.05 to 22.91 0
Manual stapler No 10 19.3 to 21.8 0
Hammer Yes 2 16.3 to 20.1 0
Electric stapler Yes 11 10.51 to 20.1 0
The data in table 12 indicate that the staples overdriven by the hammer and electric stapler can
significantly reduce the breakdown voltage of the NM cable conductor insulation, but overdriven staples
with plastic insulation may not degrade the breakdown voltage of NM cable insulation. Table 12 also
shows that all the overdriven samples passed the 6 kV breakdown voltage threshold, but had shown
reduction in breakdown voltage from the undamaged values. Though initial damage from overdriven
stapes was not expected to pose a serious issue with respect to breakdown voltage, this project also
investigated whether breakdown voltage degraded further when overdriven NM cables were aged. This is
discussed in Task 5.
Hammer Impact Damage
Since hammer is a common tool used to install NM cables, the potential for damage from this common
practice was assessed. The depth to which the staple may be driven with a hammer into a wood stud was
first characterized using a 16 oz. hammer with a head of 1 inch in diameter. The staple was 0.5 inches in
height. Tests were conducted with one type of NM cable (Cable E) to measure the depth to which a metal
staple is driven into the wood stud. In each case, two hammer blows were used to drive the staple into
the wood stud. An illustration of the measurement is shown in Figure 25.
The measurements of the staple height, d, are presented in Table 13. The results were used to design a
mechanical hammer simulator that provided a repeatable staple driving capability. The data indicate that
the average distance between the top of the installed staple to the wood frame is 0.30 in. and the
distribution is normal as shown in Figure 26.

Investigation of Damage and Degradation on Breakdown Voltage of NM Cables
©2012 Underwriters Laboratories LLC. All rights reserved Page 35
Figure 25 – Illustration of staple depth by hammer blows
Table 13 - NM cable installation by hammer and metal staples
Number of
samples
Average distance from the
top of the staple to the
wood frame surface when
NM cable is not
compressed Ct (mm/in)
Average distance from the
top of the staple to the wood
frame surface
d (mm/in)
Standard
deviation
(mm/in)
119 6.95/0.27 7.62/0.3 1.78/0.07
Figure 26 - Distribution of the distance between the top of the installed staple to the wood frame.

Investigation of Damage and Degradation on Breakdown Voltage of NM Cables
©2012 Underwriters Laboratories LLC. All rights reserved Page 36
Hammer Impact Simulator Parameters
A hammer simulator shown in Figure 27 is designed for this project to test NM cable damage due to
hammer hit. The hammer simulator consists of a metal base, adjustable arm, an electromagnet, and a
power supply. Adjusting the height of the adjustable arm, or changing the weight of the hammer head
allows for the application of different amounts of force to the NM cable samples under the test.
The following procedure was used to develop the drop height for the hammer head to simulate a
repeatable staple driving depth of 0.30 inches with two or three drops.
1. Tap a metal staple on construction grade wood frame lumber and place it under the hammer
of the hammer simulator as shown in Figure 27.
2. Set the hammer head at an initial height (e.g., 3 ft.).
3. Release the hammer head.
4. Energize the electromagnet and set the hammer head.
5. Reposition the staple under the hammer head.
6. Release the hammer head.
7. Measure the distance between the top of the staple to the wood frame.
8. If the distance is less than 0.3 inches, reduce height of the hammer drop. If the distance is
greater than 0.3 inches, increase the height of the hammer drop.
9. Repeat step 1 to step 8 until a staple depth of 0.3 inches is obtained with two hammer blows.
With this procedure, it was found that a 7ft-lb force would provide the required staple depth with two
hammer drops; and a 5 ft-lb force would result in the required depth in three hammer blows.
Figure 27 - Hammer impact simulator

Investigation of Damage and Degradation on Breakdown Voltage of NM Cables
©2012 Underwriters Laboratories LLC. All rights reserved Page 37
Breakdown Voltage Distribution of Hammer Impact Damaged NM Cable
The selected cables (Cable B and Cable E) were subjected to direct hammer blows using the hammer
impact apparatus, which allows the ability to apply repeatable force to the cable jacket. The test cable
was placed below the apparatus head as shown in Figure 27. The height of the head was adjusted to
provide either 5 ft-lb or 7 ft-lb impact onto the test cable.
The hammer impact apparatus was released to provide a direct hit on the cable outer jacket. The black
and white insulations within the cable were labeled and electrical breakdown tests were conducted on
both the insulations. Figure 28 shows the procedure used. A total of 30 tests were conducted for each of
the selected cables.
Figure 28 - Step-by-step procedure for damage to NM cable through direct hammer hit
Figure 29 - Comparison of 7ft-lb and 5ft-lb damaged NM cable samples

Investigation of Damage and Degradation on Breakdown Voltage of NM Cables
©2012 Underwriters Laboratories LLC. All rights reserved Page 38
Figure 29 compares the NM cable samples damaged by 7 ft-lb and 5 ft-lb hammer drops. Figure 29
shows that the 7 ft-lb hammer impact is visible, while the 5 ft-lb hammer impact creates damage that is
difficult to detect visually. The hammer impact damage to both the black and the white conductor in the
same piece of the NM cable sample was characterized though breakdown voltage tests of both the black
and white conductors. The electrical breakdown voltages for Cable E are shown in Figure 30.
Figure 30 - Breakdown voltage distribution of hammer-damaged NM cable insulation
The breakdown voltages for the white and black insulation were combined to provide an assessment for
the whole cable. This is presented, as an example, for Cable E for data with 5 ft-lb hammer drop in Figure
31.
Figure 31 - Breakdown voltage distribution for combined black and white insulation (Example using Cable
E data from a 5 ft-lb hammer blow)
The combined (black and white insulation) breakdown insulation data for all 30 replicates of each sample,
and for 5 and 7 ft-lb hammer drops are shown in Figure 32 and Figure 33. The data in Table 14 show that

Investigation of Damage and Degradation on Breakdown Voltage of NM Cables
©2012 Underwriters Laboratories LLC. All rights reserved Page 39
a hammer impact can result in the NM cable insulation dielectric strength to fall well below the 6 kV
threshold value. In some cases, the 7 ft-lb hammer impact cracked the NM cable insulation, an example
of this is shown in figure 34.
Figure 32 - Breakdown voltage distribution of cable E damaged by hammer impact
Figure 33 - Breakdown voltage distribution of cable B damaged by hammer impact

Investigation of Damage and Degradation on Breakdown Voltage of NM Cables
©2012 Underwriters Laboratories LLC. All rights reserved Page 40
Table 14 provides a summary the average breakdown voltages, from 30 replicates for each cable and
hammer ft-lb values.
Table 14 - Breakdown voltage of hammer-damaged NM cable (measurement of the damaged portion)
Sample Minimum
breakdown voltage (kV)
Average breakdown voltage
(kV)
Maximum breakdown voltage
(kV)
% of samples below 6kV
Cable B 5ft-lb 0.71 1.40 2.70 100 Cable B 7ft-lb 0.13 1.25 2.68 100 Cable E 5ft-lb 0.08 8.79 21.38 37 Cable E 7ft-lb 0.64 2.42 6.89 93
Figure 34 - NM Cable insulation cracked by 7ft-lb hammer impact
Summary of Damage to NM Cable from Common Installation Practices
The findings of damage from common installation practices of the NM cable may be summarized as
follows:
Misalignment is an issue when installing NM cable with a stapler. The misaligned staple may
puncture the conductor insulation. Once punctured, the insulation breakdown voltage reduces to

Investigation of Damage and Degradation on Breakdown Voltage of NM Cables
©2012 Underwriters Laboratories LLC. All rights reserved Page 41
the level of an air gap comparable with the insulation thickness, which can be much lower than
1 kV (0.3 mm gap with a dielectric strength of air of 3 MV/m, which is approximately 900V).24,25,37
Overdriving a staple reduces the NM cable insulation breakdown voltage, but the dielectric
breakdown voltage was still above 6 kV for both types of NM cables under the test.
Typical hammer impact force during typical installation is estimated to vary from 5 ft-lb to 7 ft-lb.
Damage from a direct hammer impact to the cable jacket during installation may significantly
reduce the breakdown voltage of the insulation materials.
Task 4 — Assessment of NM Cable Degradation
Introduction
Over the service life, the NM cable may be exposed to a range of temperature and humidity conditions,
with the insulation materials degrading with time (i.e., age). This variation in insulation composition is
expected to change the dielectric breakdown voltage of the cable. If the insulation breakdown voltage falls
below 6 kV, the increased frequency of voltage surges occurring at these lower magnitudes (see Figure
3) may lead to an accelerated rate of carbonization of the insulation material, and therefore increased
potential for ignition from arcing. The insulation aging involves both chemical and physical processes
whose rates are correlated to the surrounding temperature. The insulation materials from all the selected
NM cables were found to be plasticized PVC-based compounds with a co-extruded nylon protective layer.
The PVC-based insulation has several components (e.g., plasticizer, thermal stabilizer) to provide the
appropriate mechanical and processing properties. The main aging mechanism that may lead to
insulation embrittlement and reduction of breakdown voltage is anticipated to be the loss of plasticizer as
this is typically present in PVC compounds in the range of 15 to 40%.
To study the effect of aging on materials, it is desirable to accelerate the aging process. A common
approach to achieve this is to assume that thermal aging follows Arrhenius type rate processes,26
where a
faster degradation rate may be achieved by increasing the exposure temperature. However, based upon
the polymer chemistry there is a practical upper limit of the temperature that may be utilized without
altering the degradation mechanism. Literature on compounded PVC degradation27
suggests that
dehydrochlorination may start at temperatures exceeding 150°C, a temperature which is not expected to
be reached in real-world applications and therefore would result in aging data that is not representative of
natural aging. Thus, to investigate the rate of loss of the plasticizer and the consequent reduction in
electrical breakdown voltage, an upper limit of 150°C was selected.
Test Procedures
Controlled Temperature Exposure Tests
The test specimens were prepared for the controlled temperature exposure tests as follows: (i) samples of
NM Cables B and E were cut into 18-inch long test specimens and the insulated conductors were

Investigation of Damage and Degradation on Breakdown Voltage of NM Cables
©2012 Underwriters Laboratories LLC. All rights reserved Page 42
separated from the outer cable jacket; (ii) a half-inch of the insulation was removed from each end, thus
exposing the copper conductor, and the copper conductor was bent into a hook to facilitate post-exposure
breakdown voltage testing. A total of 30 specimens of a particular cable type (either B or E) were loaded
into the exposure chamber. Each test specimen was weighed prior to elevated temperature exposure,
and the specimens were then looped and hung in a temperature-controlled chamber as shown in Figure
35. To understand the contamination from off-gassing from the insulation, the initial weight loss test had
only one black conductor sample and one white conductor sample placed in the temperature controlled
chamber at any time. Test specimens were removed at regular intervals, and reweighed to document
weight loss with time. The comparison of weight loss data indicates that there is no measurable weight
loss difference when aging small number of samples in the chamber and aging large number of samples
in the chamber.
Figure 35 - Black and white NM cable conductors in the test chamber for thermal aging
Accelerated Aging Insulation Weight Loss
The results from the accelerated aging and the subsequent breakdown voltage tests for the cable
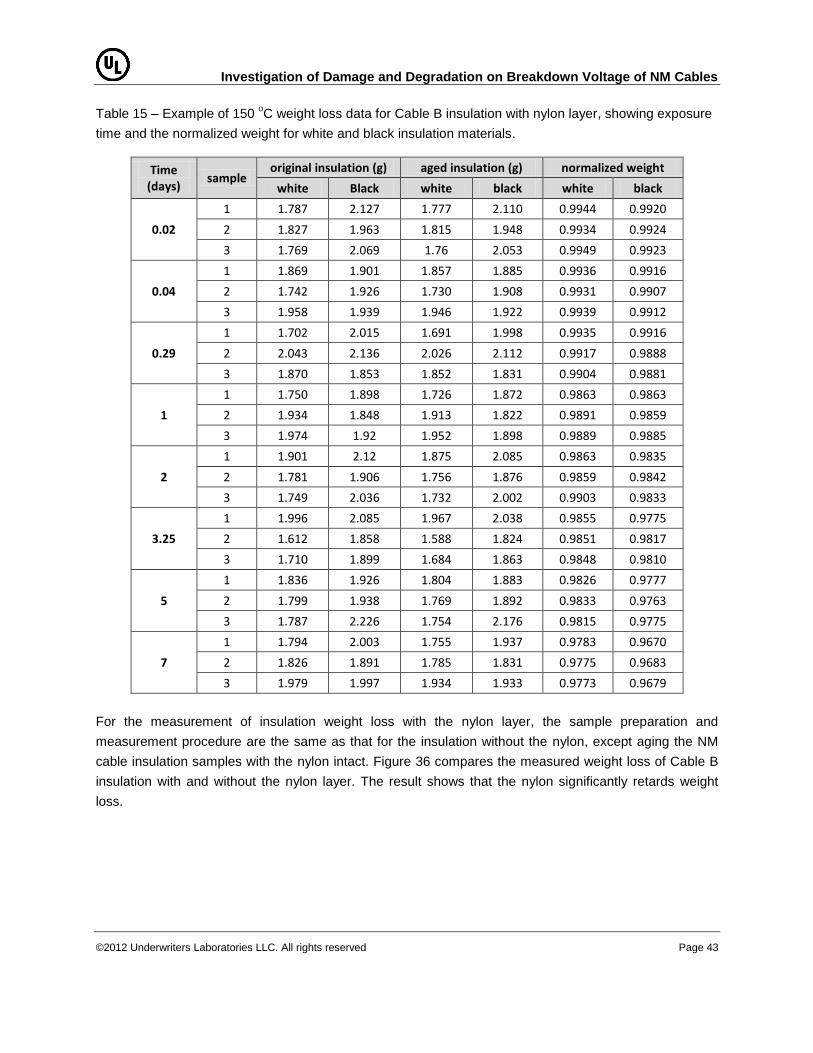
insulation materials are presented herein. Table 15 the weight loss data for Cable B wire insulation. The
normalized weight was calculated as the weight ratio of the aged wire insulation to the original wire
insulation. The data in the table shows that the normalized weight decreases over the time.
Investigation of Damage and Degradation on Breakdown Voltage of NM Cables
©2012 Underwriters Laboratories LLC. All rights reserved Page 43
Table 15 – Example of 150 oC weight loss data for Cable B insulation with nylon layer, showing exposure
time and the normalized weight for white and black insulation materials.
Time (days)
sample original insulation (g) aged insulation (g) normalized weight
white Black white black white black
0.02
1 1.787 2.127 1.777 2.110 0.9944 0.9920
2 1.827 1.963 1.815 1.948 0.9934 0.9924
3 1.769 2.069 1.76 2.053 0.9949 0.9923
0.04
1 1.869 1.901 1.857 1.885 0.9936 0.9916
2 1.742 1.926 1.730 1.908 0.9931 0.9907
3 1.958 1.939 1.946 1.922 0.9939 0.9912
0.29
1 1.702 2.015 1.691 1.998 0.9935 0.9916
2 2.043 2.136 2.026 2.112 0.9917 0.9888
3 1.870 1.853 1.852 1.831 0.9904 0.9881
1
1 1.750 1.898 1.726 1.872 0.9863 0.9863
2 1.934 1.848 1.913 1.822 0.9891 0.9859
3 1.974 1.92 1.952 1.898 0.9889 0.9885
2
1 1.901 2.12 1.875 2.085 0.9863 0.9835
2 1.781 1.906 1.756 1.876 0.9859 0.9842
3 1.749 2.036 1.732 2.002 0.9903 0.9833
3.25
1 1.996 2.085 1.967 2.038 0.9855 0.9775
2 1.612 1.858 1.588 1.824 0.9851 0.9817
3 1.710 1.899 1.684 1.863 0.9848 0.9810
5
1 1.836 1.926 1.804 1.883 0.9826 0.9777
2 1.799 1.938 1.769 1.892 0.9833 0.9763
3 1.787 2.226 1.754 2.176 0.9815 0.9775
7
1 1.794 2.003 1.755 1.937 0.9783 0.9670
2 1.826 1.891 1.785 1.831 0.9775 0.9683
3 1.979 1.997 1.934 1.933 0.9773 0.9679
For the measurement of insulation weight loss with the nylon layer, the sample preparation and
measurement procedure are the same as that for the insulation without the nylon, except aging the NM
cable insulation samples with the nylon intact. Figure 36 compares the measured weight loss of Cable B
insulation with and without the nylon layer. The result shows that the nylon significantly retards weight
loss.

Investigation of Damage and Degradation on Breakdown Voltage of NM Cables
©2012 Underwriters Laboratories LLC. All rights reserved Page 44
Figure 36 Comparison of Cable B insulation aging with and without nylon layer
Figure 37 shows a similar result for Cable E. The data indicate that the insulation weight loss occurs
approximately twice as fast when the nylon coat is removed compared to when it is present.
Figure 37– Comparison of Cable E insulation aging with and without nylon layer
Insulation Weight Loss under Different Temperatures
Because the insulation weight loss rates are different at different temperatures, weight loss data were
obtained at different temperatures. Figure 38 shows the Cable B normalized weight loss at 120°C, 135°C
and 150°C. Figure 39 shows the Cable E normalized weight loss at 120°C, 135°C and 150°C. The data
indicate that the Cable B weight loss rates at 150°C starts accelerating after about three days of aging,
while Cable E weight loss at 150°C starts accelerating after about seven days of aging. Cable B also has
higher weight loss rate than Cable E at 120°C and 135°C.

Investigation of Damage and Degradation on Breakdown Voltage of NM Cables
©2012 Underwriters Laboratories LLC. All rights reserved Page 45
Based on the NM cable insulation chemical composition analysis in Section 4, the lower weight loss rate
of Cable E may correlate to the trimellitate plasticizer, while the higher weight loss rate of Cable B may
correlate to the phthalate plasticizer.
Figure 38 – Cable B insulation weight loss under different temperatures. m150 is the data at 150oC, m135
is the data at 135oC, and m120 is the data at 120
oC.
Figure 39 – Cable E insulation weight loss under different temperatures. m150 is the data at 150oC, m135
is the data at 135oC, and m120 is the data at 120
oC.
Insulation Weight Loss and the Breakdown Voltage
The aged cable samples were tested for dielectric breakdown voltage to establish a correlation of
dielectric breakdown and insulation weight loss. Table 17 and Table 16 show the weight loss data for
Cable B and Cable E (with nylon layer), respectively.
0.92
0.93
0.94
0.95
0.96
0.97
0.98
0.99
1
0 5 10 15 20
No
rmal
ize
d w
eig
ht
Time (days)
Measured and Simulated Cable B Insulation Weight Loss
m150
m135
m120
0.88
0.9
0.92
0.94
0.96
0.98
1
0 5 10 15 20
No
rmal
ize
d w
eig
ht
Time (days)
Measured and Simulated Cable E Insulation Weight Loss
m150
m135
m120

Investigation of Damage and Degradation on Breakdown Voltage of NM Cables
©2012 Underwriters Laboratories LLC. All rights reserved Page 46
Table 17 – Weight loss data for Cable B insulation with nylon layer, showing exposure time, the
normalized weight and the corresponding breakdown voltage.
Cable B 150
0C
Breakdown Voltage (kV)
Normalized Weight Average Normalized
Weight Average Breakdown
Voltage (kV)
time white black white black white black white black
0 1 1 18.6 19.4
0.02 days
23.34 23.52 0.9944 0.9920
0.9942
0.9922
24.3
24.4 25.08 24.65 0.9934 0.9924
24.61 24.93 0.9949 0.9923
0.04 days
23.18 24.21 0.9936 0.9916
0.9935
0.9912
24.0
25.5 23.84 25.06 0.9931 0.9907
25.06 27.1 0.9939 0.9912
0.29 days
24.55 26.51 0.9935 0.9916
0.9919
0.9895
25.6
23.5 26.14 22.81 0.9917 0.9888
26.2 21.08 0.9904 0.9881
1.00 days
21.48 25.85 0.9863 0.9863
0.9881
0.9869
22.7
24.1 23.55 23.31 0.9891 0.9859
23.04 23.07 0.9889 0.9885
2.00 days
24.61 20.5 0.9863 0.9835
0.9875
0.9837
22.4
19.9 20.48 19.34 0.9860 0.9843
22.04 19.81 0.9903 0.9833
3.25 days
24.34 23.04 0.9855 0.9775
0.9851
0.9801
23.1
21.3 22.25 19.89 0.9851 0.9817
22.78 21.06 0.9848 0.9810
5.00 days
21.91 22.14 0.9826 0.9777
0.9825
0.9772
22.1
21.4 21.56 19.97 0.9833 0.9763
22.73 22.14 0.9815 0.9775
7.00 days
23.76 22.54 0.9783 0.9670
0.9777
0.9678
21.9
17.2 21.96 17.72 0.9775 0.9683
20.1 11.42 0.9773 0.9680
9.00 days
22.04 18.67 0.9738 0.9601
0.9757
0.9615
22.5
19.3 22.28 18.14 0.9745 0.9622
23.1 21.01 0.9789 0.9621
11.00 days
21.46 17.93 0.9706 0.9528
0.9697
0.9533
20.6
18.6 18.91 19.02 0.9688 0.9524
21.51 18.99 0.9696 0.9547
13.00 days
18.52 19.68 0.9644 0.9511
0.9649
0.9491
18.9
18.7 17.96 18.22 0.9652 0.9478
20.1 18.25 0.9650 0.9483
15.00 days 19.89 16.58 0.9564 0.9439
0.9561
0.9439
18.1
17.0

Investigation of Damage and Degradation on Breakdown Voltage of NM Cables
©2012 Underwriters Laboratories LLC. All rights reserved Page 47
Table 18 – Weight loss data for Cable E insulation with nylon layer, showing exposure time, the
normalized weight and the corresponding breakdown voltage.
Cable E 150
0C
Breakdown Voltage (kV)
Normalized Weight Average Normalized
Weight Average Breakdown
Voltage (kV)
time white black white black white black white black
0 1 1 23.3 22.5
0.02 days
28.82 26.06 0.9934 0.9938
0.9935
0.9935
25.5
26.7 19.73 25.27 0.9943 0.9931
27.97 28.69 0.9927 0.9935
0.04 days
26.38 24.48 0.9924 0.9920
0.9923
0.9923
26.4
26.3 26.38 28.77 0.9917 0.9927
26.46 25.64 0.9927 0.9923
0.21 days
27.2 27.2 0.9869 0.9904
0.9872
0.9872
26.9
26.4 27.36 27.92 0.9870 0.9877
26.22 23.97 0.9878 0.9833
1.00 days
25.98 27.81 0.9884 0.9852
0.9862
0.9870
26.5
26.4 26.28 27.52 0.9864 0.9890
27.31 23.95 0.9837 0.9870
2.00 days
21.14 24.66 0.9846 0.9834
0.9847
0.9843
23.7
24.3 23.71 24.45 0.9848 0.9839
26.20 23.92 0.9846 0.9858
3.25 days
24.29 23.89 0.9825 0.9820
0.9837
0.9828
23.8
23.8 21.40 21.75 0.9855 0.9827
25.59 25.69 0.9831 0.9837
5.00 days
23.65 23.97 0.9823 0.9821
0.9823
0.9819
22.6
21.8 23.71 22.57 0.9818 0.9822
20.45 18.89 0.9828 0.9814
7.00 days
22.94 21.88 0.9775 0.9762
0.9777
0.9767
22.8
21.1 21.53 20.13 0.9774 0.9776
23.95 21.30 0.9782 0.9762
9.00 days
22.28 23.07 0.9725 0.9705
0.9718
0.9703
21.9
22.2 21.61 23.20 0.9724 0.9704
21.91 20.29 0.9706 0.9700
11.00 days
21.01 21.40 0.9625 0.9597
0.9616
0.9603
20.5
21.8 18.70 22.12 0.9615 0.9603
21.67 21.77 0.9609 0.9609
13.00 days
23.20 21.06 0.9542 0.9610
0.9540
0.9514
21.1
20.9 19.92 21.75 0.9537 0.9524
20.24 19.97 0.9542 0.9407
15.00 days
20.34 20.42 0.9442 0.9469
0.9445
0.9460
20.9
20.0 21.91 19.5 0.9453 0.9453
20.53 20 0.9441 0.9460
The influence of weight loss for NM cable B insulation from thermal aging on breakdown voltage is presented in Figure 40. The degradation data for cable E is under development and will be added to the final report shortly.

Investigation of Damage and Degradation on Breakdown Voltage of NM Cables
©2012 Underwriters Laboratories LLC. All rights reserved Page 48
Figure 40 - Breakdown voltage and normalized insulation weight from samples aged at 120 oC, 135
oC
and 150oC. The error bars indicate the range of the test data.
The aged insulation breakdown voltage was initially seen to increase when the weight loss was less than 2%. But when the weight loss exceeded 4%, the aged insulation breakdown voltage trended lower. When the weight loss exceeds 8%, the aged insulation average breakdown voltage was less than 10kV. A breakdown voltage distribution for Cable B is depicted in Figure 41; and shows that 30% of the samples aged at 150
0C for 29 days have breakdown voltage less than 6kV.
201612840-4
4
3
2
1
0
Breakdown Voltage (kV)
Fre
qu
en
cy
Mean 8.723
StDev 5.333
N 12
Normal
Breakdown Voltage Distribution
Figure 41 – Cable B insulation breakdown voltage distribution after aged at 150 0C for 29 days

Investigation of Damage and Degradation on Breakdown Voltage of NM Cables
©2012 Underwriters Laboratories LLC. All rights reserved Page 49
Summary of Thermal Degradation of NM Cables
Weight loss is found to be a good aging indicator, since weight loss occurs due to loss of PVC
plasticizer.
Weight loss rate increases with the temperature.
Breakdown voltage of the NM cable conductor insulation initially increases with the loss of weight
but then trends lower. The reason for this behavior is under the investigation for the final report.
The nylon layer was found to retard the rate of weight loss for both cable B and cable E.
Task 5 — Assessment of Combined NM Cable Installation Damage and
Aging Degradation
Task 3 discussed potential causes and consequences of NM cable damage during installation. The test
results showed that hammer impact can result in immediate NM cable breakdown voltage failure, while
over-compression may only reduce the NM cable breakdown voltage, instead of causing immediate
failure of the NM cable. Because hammer impact results in NM cable failure without the need for an aging
effect, this section focuses only on the thermal aging impact to the over-compressed NM cable.
Breakdown Voltage Measurement of the NM Cable with Jacket
Measuring the thermal aging impact to NM cable damaged through over-compression required the
measurement of the breakdown voltage of the NM cable with its jacket intact. The challenge of testing the
complete NM cable is that the corona formed at the test voltages above 3 kV may short the electrodes
before insulation breakdown is achieved. To reduce the impact of the corona, a longer NM cable sample
was used and the cable jacket opening was sealed with silicone based sealant. Figure 42 shows the
prepared sample inside the chamber of the high-voltage tester.
Figure 42 – Setup for the breakdown voltage test for intact NM Cable

Investigation of Damage and Degradation on Breakdown Voltage of NM Cables
©2012 Underwriters Laboratories LLC. All rights reserved Page 50
Since most of the experiments conducted in this work use short segments of NM cable as test samples,
and samples with relatively high breakdown voltage (e.g., in excess of 15 kV), the effect of corona
discharge required that breakdown voltage testing be conducted by testing the black and white
conductors separately. As it was necessary to use intact cable to evaluate the effect of over-compression
on breakdown voltage, and since corona discharge was found to still be an issue over 20 kV with the
intact NM cable even after test modifications were made, it was possible to use only samples from Cable
B for the test. This was because Cable B exhibited breakdown voltage values for undamaged, intact
cable less than 20 kV. Samples from Cable E therefore were not evaluated for the influence of combined
damage and degradation on dielectric breakdown voltage.
To check if the two different breakdown voltage test methods are consistent, or at least correlate, with
one another, the breakdown voltage of 30 undamaged, intact NM Cable B samples were characterized
and the results were compared with those from the breakdown voltage of the separated NM Cable B
conductors. Table 19 is a comparison of Cable B breakdown voltages from the two different test methods.
The result shows that the intact NM cable breakdown voltage is statistically identical to the single
conductor.
Table 19 - Breakdown voltage comparison
Cable B with jacket White conductor Black conductor
19.1 ± 0.9kV 18.6 ± 1kV 19.4 ± 0.8kV
Test Sample Preparation and Test Results
Two sets of test specimens were prepared for this study. One set of samples were damaged through
over-compression, the other set were subjected to both over-compression damage and subsequent
thermal degradation.
The preparation of the over-compressed samples is as follows:
1. Cut the NM cable into two-foot long samples
2. Remove three quarters of the NM cable jacket from the sample
3. Tie the two ends of the ground wire together
4. Remove about one half-inch of insulation from the end of the black and the white conductors
5. Twist the black and white conductors together
6. Use the hammer simulator to staple the sample onto the wood stud
7. Measure the distance from the top of the staple to the top surface of the wood stud
8. Label the sample and record the measured distance between the top of the staple to the top
surface of the stud
9. Seal the cable jacket openings with silicone

Investigation of Damage and Degradation on Breakdown Voltage of NM Cables
©2012 Underwriters Laboratories LLC. All rights reserved Page 51
The procedure to prepare the over-compressed and thermally aged sample is the same as above, but the
samples were then aged in the thermal chamber at a constant temperature using the same method as
described in Task 4. Figure 43 shows a prepared over-compressed sample. Figure 44 shows a prepared
over-compressed sample that was subsequently aged at 150°C for three days.
Figure 43 - Over-compressed NM cable B
sample for breakdown test
Figure 44 - Over-compressed and thermally aged
NM cable B sample for breakdown test
Table 20 - Comparison of new, aged, and over-compressed Cable B samples
Cable with
jacket
Over-compressed
cable with jacket
Over-compressed
and aged at 150°C
for 3 days
Un-compressed
and aged at 150°C
for 3 days
Average breakdown
voltage 19.1±0.9kV 18.6±0.5kV 12.7±7kV 20.7±1.2kV
Distance from the stud
to the staple top > 5.4 mm 4.44±0.44mm 4.80±0.27mm N/A
To obtain statistically significant data, 30 samples were prepared for each of the four different sample
conditions. Table 20 is a comparison of the measured results. The first row in Table 20 shows the
breakdown voltages of different samples. The second row of Table 20 shows the distance from the top
the staple to the top surface of the wood stud, which indicates how hard the NM cable is compressed.
The staple distance measurements show that the over-compressed and aged cable samples were
compressed by 0.6 mm, comparable with the intact cable samples, but not as severe as the over-
compressed cable samples.

Investigation of Damage and Degradation on Breakdown Voltage of NM Cables
©2012 Underwriters Laboratories LLC. All rights reserved Page 52
The data in Table 20 also show that the over-compressed and aged NM cable samples have significantly
lower breakdown voltage compared with other samples, which indicates that the service life of the over-
compressed NM cable can potentially be much shorter than the intact NM cable in a hot environment.
NM Cable Voltage Surge Test
The damage and degradation work conducted in this report demonstrates that the insulation breakdown
voltage of NM cable can be significantly reduced, which increases the potential of formation of a
carbonized path and arcing. However, this does not yet show the propensity of insulation breakdown to
cause sufficient arcing to ignite the cable insulation. Therefore, to understand whether reduced
breakdown voltages may lead to ignition of the damaged and aged NM cables, 100 hammer-damaged
NM cable samples and 100 aged NM cable samples were tested per the UL1449 voltage surge standard.
Figure 45 shows the samples prepared for voltage surge test. The hammer-damaged samples were
prepared as follows:
Samples were cut to a length of about 18 inches.
The sample is secured to a piece of pinewood with two metal staples.
A test fixture is used to damage the NM cable by dropping a two-pound steel hammer head on
the test sample from a height of 3.5 ft. This is the same method described in the prior hammer
impact studies.
Figure 45 – Hammer-damaged and aged NM cable samples for the UL1449 test.
The test setup was as follows:
• Line and neutral of the tested samples were energized with 120VAC during the voltage surge.

Investigation of Damage and Degradation on Breakdown Voltage of NM Cables
©2012 Underwriters Laboratories LLC. All rights reserved Page 53
• 6kV positive surge was applied from both line and neutral to ground, 1.2μs rise time, 50μs fall
time, 500A, triggered at 120VAC phase angle of 90° (wave form in Figure 46).
• 6kV negative surge was applied from both line and neutral to ground, 1.2μs rise time, 50μs fall
time, 500A, triggered at 120VAC phase angle of 270°.
• Each sample was tested with one positive 6kV surge and one negative 6kV surge.
The hammer-damaged NM cable samples exhibited arcing for nine of the 100 damaged samples during
the tests. Because the electrical arcing was of a very short duration and generated little damage to the
samples, the same 100 hammer damaged samples were placed into a temperature chamber and aged at
145°C (145 oC was used for the purpose to collect thermal aging data at an additional temperature point,
in addition to the purpose of aging for the surge testing) for eight days. Figure 46 shows the schematic for
the test and Table 21 summarizes the test results.
Figure 46 – NM cable voltage surge test schematic.

Investigation of Damage and Degradation on Breakdown Voltage of NM Cables
©2012 Underwriters Laboratories LLC. All rights reserved Page 54
Table 21 – Summary of the UL1449 test results.
Hammer damaged Hammer damaged and aged
Total number of samples 100 100
Number of samples arced due to
hammer damage 9 2
Number of samples arced due to
over compression 0 0
Number of samples triggered
120VAC breaker 0 0
Number of samples with smoke
and fire 0 0
During the voltage surge test, a high-speed camcorder was used to record the arcing events. Since the
frame rate was 600 fps and only two frames captured arcing in an arcing event, the duration of the arc
was estimated to be approximately 1.7ms, or one-tenth of the 60Hz 120VAC voltage cycle. Figure 47
shows the two frames arc captured in an arc event.
Figure 47 – Voltage surge generated electrical arc. On the left is the 1st image with arc, on the right is the
2nd
image with arc.
In the tests, the maximum voltage and current applied to the NM cable sample through the circuit breaker
are 120VAC and 100A to provide a maximum arcing power of 12kW. With an arc duration of 1.7ms, the
maximum energy released in this arcing event was less than 200 Joules. Previous research has
estimated that the minimum energy to ignite the NM cable insulation is 2000 Joules28
. Since a single
arcing event is unlikely to ignite the NM cable, data were developed on arcing and subsequent ignition of
the NM cable insulation from one hundred 6kV surges using the UL 1499 transient waveform.
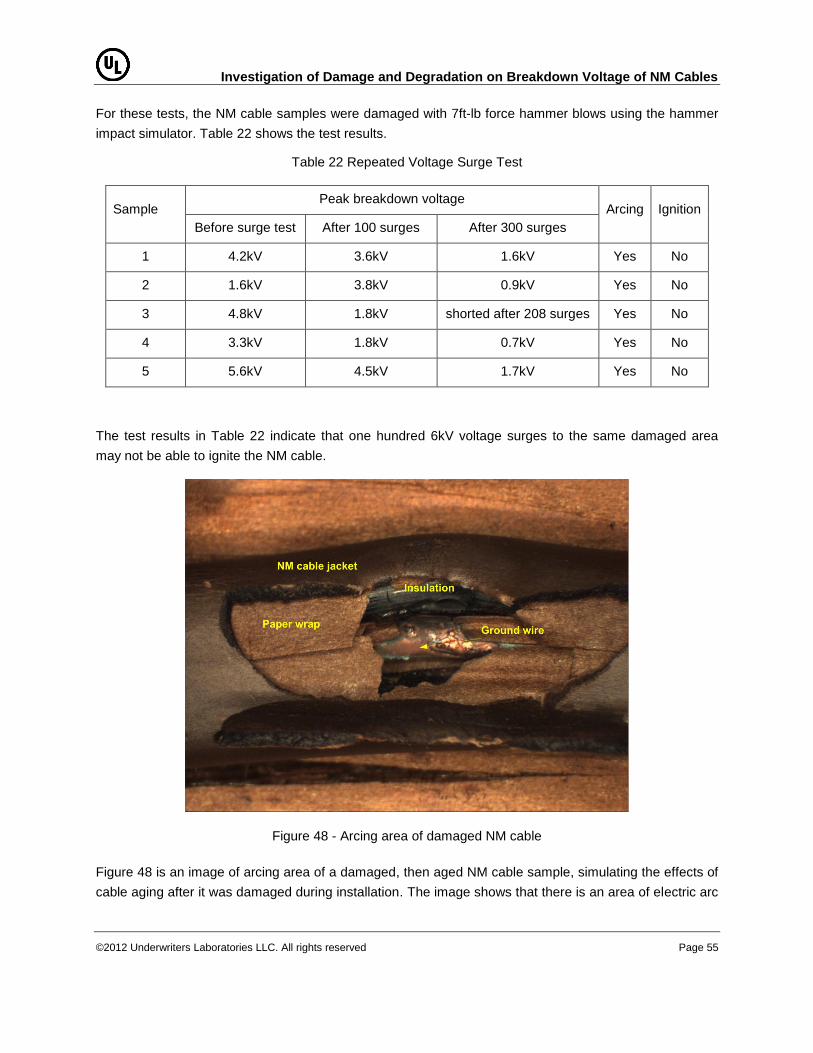
Investigation of Damage and Degradation on Breakdown Voltage of NM Cables
©2012 Underwriters Laboratories LLC. All rights reserved Page 55
For these tests, the NM cable samples were damaged with 7ft-lb force hammer blows using the hammer
impact simulator. Table 22 shows the test results.
Table 22 Repeated Voltage Surge Test
Sample Peak breakdown voltage
Arcing Ignition
Before surge test After 100 surges After 300 surges
1 4.2kV 3.6kV 1.6kV Yes No
2 1.6kV 3.8kV 0.9kV Yes No
3 4.8kV 1.8kV shorted after 208 surges Yes No
4 3.3kV 1.8kV 0.7kV Yes No
5 5.6kV 4.5kV 1.7kV Yes No
The test results in Table 22 indicate that one hundred 6kV voltage surges to the same damaged area
may not be able to ignite the NM cable.
Figure 48 - Arcing area of damaged NM cable
Figure 48 is an image of arcing area of a damaged, then aged NM cable sample, simulating the effects of
cable aging after it was damaged during installation. The image shows that there is an area of electric arc
Investigation of Damage and Degradation on Breakdown Voltage of NM Cables
©2012 Underwriters Laboratories LLC. All rights reserved Page 56
erosion on the ground wire and there is a crack on the conductor insulation. However, ignition was not
observed for these tests.
Summary of Combination Effect of Damage and Thermal Degradation
Over-driven staples may not initially reduce the conductor insulation breakdown voltage significantly,
but the test result in Table 20 indicates that it leads to faster aging degradation for Cable B.
No electrical arcing was observed from the over-compressed areas on the NM cable samples during
the voltage surge testing.
Electrical arcing was observed on 9 out of100 hammer-damaged NM cable samples.
Electrical arcing was observed on 2 out of100 hammer-damaged and thermally aged NM cable
samples.
The test data indicate that the duration of the electrical arcing in the hammer-damaged area was
about 1.7ms and the single electric arc event observed did not ignite the NM cable insulation
materials.
No sustained arcing and insulation ignition were observed during the repeated voltage surge test of
300 6kV voltage surges in parallel with 120VAC applied to the NM cable sample under the test.
The test data indicate that the arcing event may further reduce the breakdown voltage (Table 22).
One of the five samples in the test was shorted after 208 arcing events induced by the voltage
surges. This short circuit blew a 20A fuse in the 120VAC test system, but it did not trigger the 20A
circuit breaker in the system.

Investigation of Damage and Degradation on Breakdown Voltage of NM Cables
©2012 Underwriters Laboratories LLC. All rights reserved Page 57
Summary of Key Findings
1. Commercially available NM cables in the USA have plasticized PVC-based cable insulation
materials and may differ in the type of plasticizer used. The dielectric breakdown of new NM
cables sampled had electrical breakdown voltage in excess of 15kV.
2. Common NM cable installation tools such as hammers or staple drivers can result in damage to
the cable insulation.
a. A misaligned staple may puncture the conductor insulation. Once punctured, the
insulation breakdown voltage is down to the level of an air gap comparable with the
insulation thickness, which is around 1.5kV.
b. Overdriving a staple does not significantly reduce the NM cable breakdown voltage
initially.
c. A hammer blow of 7 ft-lb is 90% to 100% likely to reduce the insulation breakdown
voltage below 6 kV, depending on the type of the cable. A hammer blow of 5 ft-lb is 37%
to 100% likely to reduce the insulation breakdown voltage below 6 kV, depending on the
type of the cable.
3. It was found that NM cables may age during their service life resulting in reduced electrical
breakdown voltage due to the loss of plasticizer. This aging process was accelerated using
elevated temperatures and a relationship was found between breakdown voltage and weight loss
(primarily from loss of plasticizer). The results showed that thermal aging of an over-compressed
NM cable from installation can lead to faster reduction of the electric breakdown voltage.
However, these results were only based on Cable B data.
4. Electrical arcing was observed in the hammer-damaged area of NM cable samples under the
voltage surge test (UL1449). The duration of these electrical arcs were about 1.7ms, and test
result showed that the single arc event did not ignite the NM cable insulation materials. The
number of arcing events compared to surge events was small (9 out of 100 for hammer-damaged
cables).
5. Since the energy associated with the 1.7ms arc in the voltage surge test is only about 200 Joules,
a single voltage surge event is unlikely to ignite the NM cable insulation material at room
temperature. However, this damage will remain and therefore could increase the likeliness of
forming a new and stronger carbonized path according to the test results shown in Table 22 (i.e.,
more conducive to sustain arcing).
6. The repeated voltage surge tests however showed that a hammer-damaged NM cable could not
be ignited with three hundred 6kV voltage surges using UL1499.
Discussion and Conclusions
This work shows that NM cable damage and/or aging can reduce the breakdown voltage of the cable
insulation. Of the damage mechanisms tested, it is observed that hammer impact can inflict the most
significant immediate damage to NM cable insulation. The thermal aging data indicate that as cable is
aged its breakdown voltage will tend to fall, eventually falling below 6 kV. The concern is that lowered
breakdown voltages increase the probability of formation of carbonized paths and arcing, since lower-

Investigation of Damage and Degradation on Breakdown Voltage of NM Cables
©2012 Underwriters Laboratories LLC. All rights reserved Page 58
voltage surges occur more frequently. This suggests that a combination of impact damage to NM cable
during installation, followed by aging of the cable, may lead to a fire hazard over long periods of time.
However, the results from this investigation did not demonstrate the formation of sustained electrical
arcing.
In addition of a need to break down the cable insulation and formation of a carbonized path to initiate
arcing, ignition of the cable insulation and/or surrounding material typically requires sustained arcing with
sufficient energy release. To understand whether voltage surges can induce sustained electrical arcing,
100 damaged and aged NM cable samples were tested per the UL1449 (Standard for Surge Protective
Devices). The test result showed that despite breakdown of the dielectric, there was no sustained arcing
or ignition of the insulation. This is because the voltage surge is of a very short duration (50 s) followed
by 120VAC arcing that stopped before the zero crossing (1.7 ms). The zero crossing in an AC supply
tends to extinguish the arcing event, with a re-strike requiring the continued presence of a well-defined
carbonized path. The short arcing events found in the UL1449 tests show that the carbonized paths
formed tend to be small and are destroyed during the arcing event (since no re-strike of the arc was
observed).
In order to evaluate whether subsequent voltage breakdown occurrences further lower dielectric
performance, 300 voltage surges (in parallel with 120VAC supply. Figure 46) were applied to each of five
selected hammer-damaged NM cable samples and the breakdown voltages were measured before and
after the voltage surges. The test result shows that the hammer-damaged NM cable samples did not
ignite after 300 arcing events.
Since the plasticized PVC compounds exhibit time-dependent, viscoelastic behavior, the response of the
NM cable structure (external jacket and insulation) to external damage may not manifest itself for months
or years after the time of initial damage. This effect was reflected in the aging experiments with NM
cables secured with over-driven staples, where the breakdown voltages continued to degrade with time.
Though characterized through these aging studies, the time-dependent effects of plasticized PVC
compounds could be evaluated by Dynamic Mechanical Analysis (DMA) under various conditions of
temperature and frequency (isochron or Master Curve analysis). The effects of different plasticizer
loadings, type and even filler level may affect the relaxation process and ultimately breakdown behavior.
This would add a more fundamental understanding to the physical mechanisms involved when NM cable
is subjected to sustained compressive stresses, such as through stapling or being compressed within a
wall.
The data included in this work demonstrates a relationship between breakdown voltage and insulation
weight loss. Leveraging these data from the accelerated aging tests, may allow for the development of a
mathematical model that characterizes insulation aging with electrical performance in the field. This
model would support an ability to predict aged cable performance under a variety of conditions, including
damaged cable and undamaged cable in elevated-temperature environments.
In summary, the work described here shows that damage and degradation of a residential NM cable can
lead to an arcing event, through voltage surges that break down the cable insulation and ignite arcing.

Investigation of Damage and Degradation on Breakdown Voltage of NM Cables
©2012 Underwriters Laboratories LLC. All rights reserved Page 59
However, the test results also indicate that the breakdown event is unlikely to initiate arcing that is
sustained long enough to ignite the cable insulation or surrounding materials. In this study, arcing for
hammer-damaged cable exhibited arcing during less than 10% of the surge events, and exhibited arcing
that lasted over a single half-cycle. The arcing observed in this study is much shorter than what is
required for an AFCI to react to the event (eight arcing half-cycles within 0.5 seconds, per UL1699);
however, the energy released in that short event is not expected to ignite the cable insulation.
Investigation of Damage and Degradation on Breakdown Voltage of NM Cables
©2012 Underwriters Laboratories LLC. All rights reserved Page 60
References
1 “Home Electrical Fires”. National Fire Protection Association, May 2010.
2 Evaluation of Run Length and Available Current on Breaker Ability to Mitigate Parallel Arcing Faults,
Part I: Effect of Panelboard Current for 50 Foot Run Lengths,” P. Brazis and D. Dini, UL Research Report,
July 2012.
3 “Evaluation of Run Length and Available Current on Breaker Ability to Mitigate Parallel Arcing Faults,
Part II: Effect of Run Length with 500A Available at the Panelboard,” P. Brazis, D. Dini, and F. He, UL
Research Report, October 2012.
4 “Dehydrochlorination of PVC materials at high temperature”. X. Zheng et al. Energy and Fuels 2003, 17,
896-900.
5 “Residential Building Electrical Fires”. US fire administration. March, 2008.
6 “Aged Electrical Systems Research Application Symposium Keynote Address”. John Wafer. October,
2006.
7 “Aging Residential Wiring Issues: Concerns for Fatalities, Personal Injuries, and Loss of Property”.
Joyce Rasdall. Annual Household Equipment Technical Conference. October, 2005.
8 “Identifying Causes for Certain Types of Electrically Initiated Fires in Residential Circuits”. John Shea.
Fire and Materials, 2010.
9 “Wire and Cable Insulation and Jacketing: Life Cycle Assessments for Selected Applications”. Office of
Pollution Prevention and Toxics, US EPA. June, 2008.
10 “Some History of Residential Wiring in the US”. David Dini, Underwriters Laboratories Inc. 2006.
11 “Wire Company Wages Long War to Win Approval for Romex”. Daily Sentinel, Rome, N.Y. Wednesday
Evening, March 24, 1928.
12 “Installation of Wiring Methods in Modular Homes”. Richard M. Flynn, et al. State of New Hampshire
Department of Safety. September, 2006.
13 “Application and Installation Guidelines for Nonmetallic-Sheathed Cable and Underground Feeder and
Branch Circuit Cable”. NEMA RV2, 2008.
14 NEC 2011. ISBN: 978-087765914-3.
15 “Transient Over voltages in Secondary Systems”. Francois Martzloff. GE technical report 81CRD121

Investigation of Damage and Degradation on Breakdown Voltage of NM Cables
©2012 Underwriters Laboratories LLC. All rights reserved Page 61
16 “Aging of NMD-7 Wire Insulation.” D. J. Stonkus. Ontario Hydro Report. December, 1989.
17 “Prediction of Insulation Degradation of Distribution Power Cables Based on Chemical Analysis and
Electrical Measurements”. Doctoral Dissertation, Petri Hyvonen. Helsinki University of Technology.
Espoo, Finland. 2008.
18 “Pyrolysis GC/MS spectra from NIST 08 Mass Spectral Library”. IR spectra are in-house spectra
developed by Thermo Scientific Company; the source of DTDP and TOTM were provided by VELSICOL
Chemical and EASTMAN companies, respectively.
19 “Plastics Additives Handbok”. R. Gachter and H. Muller. Hanser Publishers, 1983.
20 ASTM D149 Test Method for Dielectric Breakdown Voltage and Dielectric Strength of Solid Electrical
Insulating Materials at Commercial Power Frequencies.
21 “Introduction to Mathematical Statistics”. R. Hogg et al. Prentice Hall, 2005.
22 “Oregon Electrical and Elevator Board License Enhancement Report”. March, 2007.
23 “Violations of Stapling NM-B on Edge Persist”. NEMA document. 2005.
24 Tipler, Paul A., College Physics. Worth, 1987: 467.
25 Rigden, John S., Macmillan Encyclopedia of Physics. Simon & Schuster, 1996: 353.
26 “Electrical Aging of Extruded Dielectric Cables”. C. Dang, et al. IEEE Transaction on Dielectrics and
Electrical Insulation. April, 1996.
27 “Mechanisms and modes for ignition of low-voltage, PVC-insulated electrical products”. Vytenis
Babrauskas. Fire and Materials 30, 2006.
28 “Effectiveness of Circuit Breakers in Mitigating Parallel Arcing Faults in the Home Run, 2nd Edition”.
Paul Brazis and Fan He. UL Research Report, January 2012.