Effectiveness and Acceptance of Enhanced Seat Belt ...
98
DOT HS 811 097 February 2009 Effectiveness and Acceptance of Enhanced Seat Belt Reminder Systems: Characteristics of Optimal Reminder Systems Final Report This document is available to the public from the National Technical Information Service, Springfield, Virginia 22161
Transcript of Effectiveness and Acceptance of Enhanced Seat Belt ...

DOT HS 811 097 February 2009
Effectiveness and Acceptance of EnhancedSeat Belt Reminder Systems:Characteristics of Optimal Reminder Systems
Final Report
This document is available to the public from the National Technical Information Service, Springfield, Virginia 22161

DISCLAIMER
This publication is distributed by the U.S. Department of Transportation, National Highway Traffic Safety Administration, in the interest of information exchange. The opinions, findings, and conclusions expressed in this publication are those of the authors and not necessarily those of the Department of Transportation or the National Highway Traffic Safety Administration. The United States Government assumes no liability for its contents or use thereof. If trade names, manufacturers’ names, or specific products are mentioned, it is because they are considered essential to the object of the publication and should not be construed as an endorsement. The United States Government does not endorse products or manufacturers.

1. Report No. DOT HS 811 097
2. Government Accession No. 3. Recipient’s Catalog No.
4. Title and Subtitle Effectiveness and Acceptance of Enhanced Seat Belt Reminder Systems: Characteristics of Optimal Reminder Systems
5. Report Date February 2009
6. Performing Organization Code
7. Author(s) Mark Freedman, Neil Lerner, Paul Zador, Jeremiah Singer, and Sharon Levi
8. Performing Organization Report No.
9. Performing Organization Name and Address Westat, Inc. 1650 Research Blvd. Rockville, MD 20850
10. Work Unit No. (TRAIS)n code
11. Contract of Grant No. DTNH22-05-D-01002/001
12. Sponsoring Agency Name and Address National Highway Traffic Safety Administration 1200 New Jersey Avenue SE. Washington, DC 20590
13. Type of Report and Period Covered Final Report
14. Sponsoring Agency Code
15. Supplementary Notes Contracting Officer’s Technical Representative (COTR): Stephanie Binder
16. Abstract This report summarizes and synthesizes the findings of two complementary studies conducted to investigate factors related to enhanced seat belt reminder (ESBR) effectiveness and acceptance. It also provides recommendations for ESBR design and suggests a conceptual rating system for ESBRs. A field observational study found that belt use rates of drivers in vehicles with most types of ESBR systems was about 3 to 4 percentage points higher than drivers in vehicles without ESBRs, whose observed belt use rate was 85 percent. The most significant increases in belt use were found among occupant groups with the lowest belt use propensities. A separate system feature study experimentally compared alternative seat belt reminder systems and displays to determine which systems and components drivers find to be most effective, attention-getting, annoying, and desirable. Systems with more aggressive reminder displays and more frequent repetition patterns were perceived to be the most effective, and sounds were perceived to be more effective than visual displays. Perceived effectiveness and annoyance of individual displays were strongly correlated. There is good agreement between the two studies on the association of a greater likelihood of seat belt use with ESBR systems in general and the importance of including an auditory component to the system. Belt use rates based on averaging estimates for age/gender groups were strongly correlated according to system features. Based on the findings of these two studies, together with other literature, a set of recommendations for effective ESBR design are provided. Based on these criteria, a conceptual rating scheme was developed to provide a numeric figure-of-merit for ESBR systems. The rating scheme is preliminary and will require validation before use.
17. Key Words Occupant protection, seat belt, enhanced reminder, ESBR, consumer acceptance, in-vehicle displays
18. Distribution Statement This report is free of charge from the NHTSA Web site at www.nhtsa.dot.gov
19. Security Classif. (of this report) Unclassified
20. Security Classif. (of this page) Unclassified
21. No of Pages 98
22. Price
Form DOT F 1700.7 (8-72) Reproduction of completed page authorized
i

Acknowledgements The authors thank Michael Perel and Stephanie Binder of the National Highway Traffic Safety Administration (NHTSA) for their support throughout this work. The authors also gratefully acknowledge the contributions of Elisha Lubar, Jeremy Walrath, Shelley Boyd, Diane Snow, and Marla Zinni.
The authors also acknowledge the support and cooperation of the following agencies during the observational study:
Arizona Motor Vehicle Division
California Department of Motor Vehicles
Iowa Office of Vehicle Services
Missouri Department of Revenue
Maryland Department of Motor Vehicles
Virginia Department of Motor Vehicles
Florida Division of Motor Vehicles
Texas Department of Transportation
Kansas Division of Motor Vehicles
ii

Table of Contents Summary ....................................................................................................................................... vii
1 Introduction ........................................................................................................................... 1 1.1 Problem Background ...................................................................................................... 1 1.2 Task Objective ................................................................................................................ 2 1.3 Report Organization........................................................................................................ 2
2 Summary of Previous Studies Under This Project................................................................ 3 2.1 System Feature Acceptability and Potential Effectiveness............................................. 3
2.1.1 Method .................................................................................................................... 3 2.1.2 Key Findings........................................................................................................... 7
2.2 Observational Field Study............................................................................................. 14 2.2.1 Method .................................................................................................................. 14 2.2.2 Key Findings......................................................................................................... 20
3 Additional Analyses of Observational Field Study Data .................................................... 26 3.1 Data ............................................................................................................................... 26 3.2 Methods......................................................................................................................... 31 3.3 Findings......................................................................................................................... 32
3.3.1 General Overview ................................................................................................. 32 3.3.2 Results for All Drivers .......................................................................................... 35 3.3.3 Results for Drivers With Passengers..................................................................... 40 3.3.4 Results for Passengers........................................................................................... 43 3.3.5 Effects of Individual ESBR Characteristics.......................................................... 46
3.4 Conclusions................................................................................................................... 48
4 Summary of Key Findings .................................................................................................. 50 4.1 Agreement Between Studies ......................................................................................... 50 4.2 Integrated Findings ....................................................................................................... 56
4.2.1 Enhanced Seat Belt Reminder System Effectiveness ........................................... 56 4.2.2 System Features Related to Enhanced Seat Belt Use ........................................... 57 4.2.3 Annoyance and Acceptability ............................................................................... 58 4.2.4 Driver Characteristics ........................................................................................... 58
5 Characteristics of Optimal ESBR Systems ......................................................................... 60 5.1 Features Associated With High Seat Belt Use.............................................................. 60 5.2 Annoyance and Acceptance.......................................................................................... 60 5.3 Approaches Suggested in the Literature ....................................................................... 63 5.4 Recommended System Characteristics ......................................................................... 67
6 Suggested Rating System for ESBR ................................................................................... 69 6.1 Positive and Negative Features of ESBR Systems ....................................................... 69 6.2 Rating ESBR Effectiveness .......................................................................................... 72 6.3 Rating ESBR Acceptance ............................................................................................. 76 6.4 Rating System – Summary ........................................................................................... 78
References..................................................................................................................................... 79
Appendix A: ESBR System Characteristics ................................................................................. 81
iii

List of Figures Figure 1. Seat belt reminder displays (clockwise from top left: dashboard display, center console
display, passenger display, rearview mirror display).............................................................. 4 Figure 2. Scatterplot of mean stationary vehicle ratings of display effectiveness and annoyance
.............................................................................................................................................. .10 Figure 3. On-road system effectiveness rating versus annoyance rating by self-reported seat belt
use category .......................................................................................................................... 10 Figure 4. Stationary vehicle ratings of effectiveness versus annoyance rating by self-reported seat
belt use category Figure 3 ..................................................................................................... 11 Figure 5. Mean on-road effectiveness rating for five reminder systems ...................................... 11 Figure 6. Mean on-road annoyance rating for five reminder systems .......................................... 12 Figure 7. Post-drive ratings for five reminder systems................................................................. 12 Figure 8. Mean stationary-vehicle ratings of display effectiveness.............................................. 13 Figure 9. Mean stationary-vehicle ratings of display annoyance ................................................. 13 Figure 10. Scatterplot of post drive ESBR system ratings and percent belt use rates based on
averaging counterfactual estimates for age/gender groups ................................................... 56
iv

List of Tables Table 1. Prototypical reminder systems for on-road ratings........................................................... 5 Table 2. Auditory and visual displays used for stationary-vehicle ratings of potential enhanced
belt reminder display components .......................................................................................... 6 Table 3. Observation records ........................................................................................................ 15 Table 4. List of variables used for initial analysis ........................................................................ 16 Table 5. Seat belt use model predictor variables .......................................................................... 18 Table 6. Collapsed system groupings details................................................................................ 19 Table 7. Observed percentage belt use by ESBR system and occupant group............................. 20 Table 8. Effect of ESBR systems on seat belt use by ESBR system and occupant group (driver,
passenger, overall) ................................................................................................................ 22 Table 9. Individual characteristic effects on driver seat belt use within propensity stratum,
compared to base systems..................................................................................................... 24 Table 10. Individual characteristic effects on driver seat belt use within propensity stratum,
excluding base systems from the comparison....................................................................... 25 Table 11. List of variables used for additional analysis................................................................ 27 Table 12. Frequency and percentage of ESBR system vehicles in sample, by vehicle year ........ 28 Table 13. Frequency of ESBR in the additional analysis sample ................................................. 29 Table 14. Frequency of collapsed system groupings .................................................................... 30 Table 15. Percent distribution of ESBR systems by vehicle type................................................. 31 Table 16. Covariates included in the logistic regression for estimating driver belt use ............... 32 Table 17. Observed percentage belt use by ESBR system and occupant group (all drivers, drivers
with passengers, and passengers).......................................................................................... 34 Table 18. Significant predictor variables of belt use among drivers, drivers with passengers, and
passengers ............................................................................................................................. 35 Table 19. Effect (OR) of ESBR systems on seat belt use for drivers, drivers with passengers, and
passengers (belt use odds by ESBR system relative to base system) ................................... 35 Table 20. Type 3 analysis of effects for stepwise model of driver belt use – all drivers.............. 36 Table 21. Odds ratios for parameters with a significant Type 3 effect – all drivers..................... 37 Table 22. ESBR contrasts and odds ratios – all drivers................................................................ 38 Table 23. Significant reminder system contrasts – all drivers ...................................................... 39 Table 24. Average reminder system characteristics for systems SIMP = 5, 7, and other............. 39 Table 25. Frequency of vehicles with system SIMP = 7, by vehicle type.................................... 40 Table 26. Type 3 analysis of effects for stepwise model of driver belt use drivers with passengers
............................................................................................................................................... 40 Table 27. Odds ratios for parameters with a significant Type 3 effect drivers with passengers .. 41 Table 28. ESBR contrasts and odds ratios – drivers with passengers .......................................... 42 Table 29. Significant reminder system contrasts – drivers with passengers................................. 42 Table 30. Average reminder system characteristics for systems SIMP = 5, 7, and other............. 42
v

Table 31. Type 3 analysis of effects for stepwise model of driver belt use – passengers ............ 43 Table 32. Odds ratios for parameters with a significant Type 3 effect – passengers ................... 43 Table 33. ESBR contrasts and odds ratios – passengers............................................................... 44 Table 34. Significant reminder system contrasts .......................................................................... 45 Table 35. Average reminder system characteristics for systems SIMP = 8, 7, and other............. 45 Table 36. Odds ratio estimates and chi-square significance tests for individual ESBR
characteristics representing icon displays, text messages, and sound signals ...................... 47 Table 37. Agreement of findings between the observational study and the system feature study
.............................................................................................................................................. .51 Table 38. Reminder system categories for the prototype systems used in the system feature study
............................................................................................................................................... 54 Table 39. Correlation of on-road experiment “likelihood” measures with “all driver” belt use
indices from the observational study .................................................................................... 55 Table 40. Schematic representation of adaptive seat belt reminder system (chart is adapted from
Eby et al., 2004) .................................................................................................................... 64 Table 41. Positive and negative factors for ESBR effectiveness and acceptance ........................ 71 Table 42. Points associated with plus and minus effectiveness factors........................................ 74 Table 43. Points associated with plus and minus acceptance factors ........................................... 77
vi

Summary Seat belt nonuse is a serious highway safety problem in the United States. Despite a steady increase in seat belt use rates, nearly one in five front seat passenger vehicle occupants was not wearing a seat belt in 2007 (Glassbrenner & Ye, 2007). Individuals who do not wear seat belts are far more likely to be killed or seriously injured in a crash. In fact, more than half of fatally injured passenger vehicle drivers were not wearing seat belts at the time of the crash (Traffic Safety Facts: Occupant Protection, 2007).
All passenger vehicles sold in the United States are required to provide a seat belt reminder upon vehicle startup to encourage the driver to use the seat belt. The minimum required reminder provides an auditory signal for four to eight seconds after vehicle startup and a visual signal for one minute following vehicle startup (if the driver is unbelted). In an effort to provide more effective seat belt reminders, some automotive manufacturers have implemented enhanced seat belt reminder systems that continue to alert drivers and passengers to use seat belts beyond the initial seconds following vehicle startup.
Although evidence indicates that enhanced seat belt reminders (ESBRs) are more effective in eliciting seat belt use than basic reminders (e.g., Freedman et al., 2007; Regan et al., 2006), little is known about the particular system features that are most effective in eliciting seat belt use. Furthermore, ideal enhanced seat belt reminder systems must effectively encourage occupants to use seat belts without causing such great annoyance that consumers reject vehicle models with these systems or take action to disable the vehicle’s seat belt reminder systems.
The present report summarizes and synthesizes the findings of two complementary studies (an observational study and a system feature study) conducted to investigate factors related to ESBR effectiveness and acceptance, provides additional detailed analyses of the observational study data, provides recommendations for ESBR design, and suggests a conceptual rating system for ESBRs.
The field observational study investigated seat belt use of front seat occupants in nearly 40,000 passenger vehicles in nine States. The study found that belt use rates of drivers in vehicles with most types of ESBR systems was about 3 to 4 percentage points higher than drivers in vehicles without ESBRs, whose observed belt use rate of 85 percent in the present study is similar to the national average reported by NHTSA (Glassbrenner & Ye, 2007). Significant positive effects of ESBRs were more often found among the lowest belt use propensity groups. ESBR features were found individually and in combinations to have significant effects on driver seat belt use. The findings suggest that ESBRs may be most effective in converting seat belt nonusers if they incorporate the features found to have positive effects among lowest belt use propensity groups.
The system feature study compared alternative seat belt reminder systems and displays to determine which systems and components drivers find to be most effective, attention-getting, annoying, and desirable. Forty-eight individuals who were self-reported seat belt nonusers completed a three-part study. First, participants drove a vehicle along a designated route as they experienced five seat belt reminder systems. Second, while the vehicle was stationary, participants experienced 27 individual auditory and visual seat belt reminder display components. Third, participants described features that they would like to see in an “ideal” enhanced seat belt reminder system. All of the enhanced seat belt reminder systems were perceived to be more
vii
effective in encouraging seat belt use than the minimum required reminder, and the systems with more aggressive reminder displays and more frequent repetition patterns were perceived to be the most effective. Sounds were perceived to be more effective than visual displays. System components that drivers considered to be effective also tended to be considered annoying, though drivers’ opinions differed on whether effective/annoying systems are desirable or undesirable.
Further analysis was undertaken to estimate the effects of reminder systems and components while controlling for other factors that could affect belt use. Westat analyzed driver and passenger belt use for 28,665 model year 1998-2005 vehicles from nine States and many sites within each State. Seat belt observation data were analyzed using logistic regression. The effects of the significant model parameters were summarized using odds ratios.
Additional analyses found that the reminder system with the highest belt use rate has the longest average single-cycle duration and the highest maximum sound frequency. The reminder systems with neither the lowest nor the highest driver belt use rates have the longest single-cycle icon duration and a maximum icon frequency of 4.06 hertz (Hz). The reminder system with the lowest driver belt use rate has very short average single-cycle duration, zero length single-cycle icon duration and a single-cycle text duration of 27 seconds with a maximum text repeat frequency of 1.5 Hz.
Additional factors that were associated with increased seat belt use, regardless of the particular ESBR, included recent model year vehicles, female drivers, locations other than shopping centers, higher driver age, nonurban sites, and State (California had the highest belt use rates in the sample; Florida had the lowest rates).
Qualitatively, the observational study and the system feature study are in generally good agreement on the relative effectiveness of seat belt reminder systems and system attributes. There is good agreement on the association of a greater likelihood of seat belt use with ESBR systems in general and the importance of including an auditory component to the system. Systems that have frequent periodic reminders and more extended reminder program durations appear to have higher rates of belt use. The studies agree in finding more effect for flashing than steady visual elements, at least when they are the primary display components. There was not agreement in the relative benefits of text versus icon visual displays, but there were data limitations in both studies that make comparisons problematic. Both studies also suggest that an ESBR system may have more influence on drivers with relatively low belt use rates, although the system feature study indicated that “occasional” seat belt users were more influenced than “rare” seat belt users. There is also good quantitative agreement between the observational study and the system feature study. Belt use rates based on averaging estimates for age/gender groups were strongly correlated according to system features.
Based on the experimental findings of the project, together with other literature, a set of recommendations for effective ESBR design are provided. Based on these criteria, a conceptual rating scheme was developed to provide a numeric figure-of-merit for ESBR systems. The rating scheme is preliminary and will require validation before use.
In summary, ESBR systems were generally observed to meaningfully enhance the likelihood of seat belt use, and the degree of enhancement varies with system features.
viii

1 Introduction
1.1 Problem Background The use of a seat belt increases survivability and reduces injury severity for motor vehicle occupants involved in traffic crashes. Although the national observed seat belt usage rate was 82 percent in 2007 (Glassbrenner & Ye, 2007), individuals who do not wear seat belts are overrepresented in fatal crashes. In 2006, of the 28,141 passenger vehicle driver fatalities for which restraint use was known, an estimated 15,523 (55%) were unrestrained (Traffic Safety Facts: Occupant Protection, 2007). The reasons drivers indicate most often as to why they do not use a seat belt include short trips, forgetfulness, in a rush, and discomfort (Boyle & Vanderwolf, 2004).
Congress and the National Highway Traffic Safety Administration (NHTSA) have initiated a number of activities to develop in-vehicle technologies to increase belt use. One method to increase seat belt use is installation of various types of seat belt reminders in vehicles to prompt occupants to use their belts. Currently, Federal standards require all new vehicles be equipped with a “basic” seat belt reminder system – a warning light and audible signal which is activated immediately after the vehicle is started and continues for four to eight seconds if a driver is not belted, with the light persisting for at least 60 seconds.
The extent to which the basic seat belt reminder increases seat belt use is unknown. With the goal of further increasing seat belt use, a number of automobile manufacturers have designed enhanced seat belt reminders (ESBRs) that exceed the Federally mandated basic system by providing a more persistent warning to alert drivers when they are not belted. Research suggests that at least some ESBRs can increase seat belt use rates (Krafft, Kullgren, Lie, & Tingvall, 2006; Buckling Up: Technologies to Increase Seat Belt Use, 2003; Williams, Wells, & Farmer, 2002). Public attitudes towards the ESBRs are generally positive, as those drivers whose main reasons for nonuse of seat belts relate to forgetfulness or trip type say that the ESBR alerts are beneficial (Eby, Molnar, Kostyniuk, & Shope, 2005; Harrison, Senserrik, & Tingvall, 2000).
In order to further develop and increase the penetration of ESBRs in motor vehicles, NHTSA has contacted the major vehicle manufacturers encouraging the installation of systems that extend beyond the basic seat belt reminder requirements. These systems differ considerably from one another in terms of the visual and auditory displays they use; the rules that trigger a display; the manner in which the display changes with time, distance, or speed; the aggressiveness of the system (in terms of urgency and annoyance); and the use of sensing and displays for occupants other than the driver. NHTSA also continues to compile information on each ESBR system since each manufacturer has designed a unique system with distinctive acoustic and or visual displays.
In addition to currently implemented systems, there have also been a variety of prototypes, experimental concepts, and design recommendations. These ESBRs range from very simple displays (e.g., flashing icon) to complex, multistage systems triggered by driving status (e.g., speed, travel distance) and featuring multiple types of visual, acoustic, voice, and possibly even haptic (tactile) displays, as well as interlocks, delays, or limitations on some aspect of vehicle performance (e.g., gear shifting, speed, entertainment system).
Although improvements in seat belt use rates appear to result from ESBRs, there is not yet good evidence concerning what works best and why a given system may influence occupant behavior.
1

There is also the related concern regarding user acceptance. A system could be made so intrusive or interfering that virtually every driver would use the seat belt (or find a way to defeat or remove the system). However, this would engender problems of consumer rejection. The experience with mandatory ignition interlock systems in the 1970s reflects the importance of considering the public acceptance aspect along with potential effectiveness (Transportation Research Board, 2003). Due to various issues with the interlock system design, sensor accuracy, and belt design, the ignition interlock system elicited strong opposition, with the result that Congress enacted legislation prohibiting an interlock requirement.
Thus there is a need to understand what features of seat belt reminder systems are most effective, why they are effective, and how they relate to annoyance and user acceptance. Based on this, systems or features that are highly effective in promoting seat belt use, while remaining acceptable to the broad range of drivers, can be recommended.
1.2 Task Objective The overall objectives of the Effectiveness and Acceptance of Enhanced Seat Belt Reminder Systems project are to strengthen NHTSA’s basis for encouraging manufacturers to voluntarily install ESBRs and for recommending ESBR design characteristics that provide an appropriate balance between effectiveness in getting occupants to wear seat belts and consumer acceptability. Earlier stages of this project conducted the empirical research to support these goals and the studies are fully described in separate project task reports (Freedman, Levi, Zador, Lopdell, & Bergeron, 2007; Lerner, Singer, Huey, & Jenness, 2007). The present document is a synthesis report that describes the findings and provides recommendations.
The activities described in this report cover four primary objectives:
• Refine and expand the original analyses of the field observational study, including control for potentially confounding variables.
• Integrate the overall findings of the observational study and the study of system feature acceptability and potential effectiveness.
• Provide recommendations for enhanced seat belt reminder system design.
• Develop a numerical rating system for assigning NCAP (New Car Assessment Program) points to vehicles with enhanced seat belt reminder systems, which incorporates both system effectiveness (enhanced seat belt use) and user acceptability.
1.3 Report Organization Section 2 provides a summary overview of the methods and key findings of the two empirical research studies. Section 3 provides a refined and expanded analysis of the observational study results. Section 4 integrates the key findings from all of the project research and analysis. Section 5 provides recommendations for designing the optimal seat belt reminder system. Section 6 suggests a numerical rating system for ESBRs that may be adapted for use by NCAP.
2

2 Summary of Previous Studies Under This Project Two independent, but complementary, studies were undertaken to address issues of ESBR effectiveness. One study was a controlled experiment in a specially modified vehicle in which a variety of belt reminder visual and/or auditory displays could be presented. Driver ratings and other responses were collected regarding potential effectiveness, annoyance, and acceptability of various system design features. The other study was a field observational study of actual seat belt use, as related to the seat belt reminder systems associated with specific vehicles. Belt use rates were determined for both drivers and front seat passengers, across a variety of geographic locations. Both of these studies have been fully documented in previous documents (Freedman et al., 2007; Lerner et al., 2007). In this section, summary descriptions of the methods and key findings of the two experiments are provided.
2.1 System Feature Acceptability and Potential Effectiveness
2.1.1 Method This study compared the annoyance, potential effectiveness, and acceptability of different reminder system design features. In contrast to the observational study, which looked at actual seat belt use in real-world settings, this study looked at subjective driver opinion in an experimental setting. Reminder system display elements were systematically manipulated and evaluated. Full details of the methods, analyses, and results are provided in a separate project task report (Lerner et al., 2007). A summary of the general method and key findings is provided here.
The study included 48 individuals who reported frequent or occasional seat belt nonuse while driving. The participant sample included equal numbers of males and females and equal numbers of young (ages 19 to 25), middle-age (ages 37 to 59), and older (ages 60 to 85) drivers. Equal numbers of participants were categorized (based on self-reported belt use) as rare seat belt users (up to 20% use; mean of 8%), occasional users (35-75%; mean of 54%), and frequent users (80% and up; mean of 90%). Participants were recruited through local advertising in the greater Washington, DC, metropolitan area and were reimbursed for participation.
The experimental session was comprised of three parts. During the first part, participants drove a vehicle along a designated route on public roadways as they experienced five seat belt reminder systems (four prototypical enhanced systems and one basic reminder). The prototypical systems included a range of typical features found in commercially available ESBRs. Although participants actually wore the seat belt during the drives, the reminder systems were presented as if the seat belt was not in use. At prescribed times during the drives, participants were prompted to rate on a numerical (1 to 10) scale the likelihood that they would buckle the seat belt (assuming they were not currently using it), the degree to which the system drew their attention, and the annoyingness of the reminder displays. Additional ratings and opinion were also collected at the completion of each drive, related to perceived effectiveness, system desirability, good and bad features of the system, and suggested improvements to the system. During the second part of the study, while the vehicle was stationary, participants experienced 27 individual auditory (sound and speech) and visual seat belt reminder display components. Each display had a duration of six seconds, except for voice messages, which were briefer and depended on message wording. For each component display, participants rated on a 1-to-10 scale the
3

likelihood that they would buckle the seat belt in response to the display, the annoyingness of the display, and the desirability of the display as part of a seat belt reminder system. During the third part of the study, participants answered questions about features that they would like to see in an “ideal” ESBR.
The study was conducted in a 2006 Ford Taurus in which an experimenter in the rear seat controlled the display system in effect via a software program installed on a laptop computer. Figure 1 shows the location of the various seat belt reminder visual displays within the vehicle. These include a driver side icon (red), a driver side “BUCKLE SEAT BELT” message (red), a rearview mirror icon + “BUCKLE SEAT BELT” message (red), center console “BUCKLE SEAT BELT” message (green), center console “WARNING! BUCKLE SEAT BELT” message (green), and passenger side icon + “PASSENGER” (red). These displays could be presented in steady or flashing modes and (for some) at increased intensity. Auditory displays were normally presented from a driver side speaker below the dashboard, although some used another speaker installed just behind the driver-side seat belt retractor.
Figure 1. Seat belt reminder displays (clockwise from top left: dashboard display, center console display, passenger display, rearview mirror display)
The first portion of the procedure (on-road drives) used five different reminder systems, summarized in Table 2. The second portion of the procedure (stationary vehicle ratings of potential display components) employed 15 auditory and 12 visual displays, summarized in Table 2.
4

Table 1. Prototypical reminder systems for on-road ratings
Reminder System System Characteristics
Basic Reminder • First 6 s: slow chime and steady dashboard icon • Icon remains on for total of 1 minute • No additional reminders
Continuous Flashing
• First 6 s: slow chime and rapid flashing dashboard icon (3 Hz) • Flashing icon continues as long as driver is unbelted; no sound after 6 s
Periodic Reminder • First 6 s: slow chime and steady dashboard icon • Steady icon remains on • After 30 s of silence, 6 s of fast chime and flashing (3 Hz) icon,
assuming vehicle speed > 5 mph • Cycle of 30 s silence and 6 s reminder is repeated twice more • All displays inactive following third cycle
Aggressive Reminder
• Like the Periodic Reminder system but with additional features • Initial alert is 4 s slow chime and flashing (1 Hz) dashboard/rear view
mirror icons, followed by 2 s of fast chime while icons continue to flash
• For next 30 s, visual displays remain on (steady) and no auditory alerts • 6 s of fast chime and flashing (3 Hz) dashboard/rearview mirror icons • The two previous stages (30 s silence, 6 s fast chime) continue to cycle
for the duration of the trip. The center console BUCKLE SEATBELT message remains steadily lit.
One Long Reminder Phase
• Like the Continuous Flashing system but with a single aggressive auditory phase
• First 6 s: slow chime and rapid flashing dashboard icon (3 Hz) • Flashing icon continues as long as driver is unbelted • 30 s after ignition, if vehicle speed > 5 mph, slow beep for 6 s followed
by fast beep for 24 s
5

Table 2. Auditory and visual displays used for stationary-vehicle ratings of potential enhanced belt reminder display components
Display Descriptive Comments
Visual Displays Luminance of 70 cd/m2, unless specified other Dashboard icon Steady image, seat belt icon Dashboard text Steady image, “BUCKLE SEAT BELT” Dashboard icon & text Steady image, icon and “BUCKLE SEAT BELT” Dashboard icon flashing 1 Hz duty cycle, 0.5 s on/0.5 s off Dashboard text flashing 1 Hz duty cycle, 0.5 s on/0.5 s off Dashboard icon bright Steady image, 700 cd/m2
Dashboard text bright Steady image, 700 cd/m2
Center console “BUCKLE SEAT BELT” message Center console urgent “WARNING! BUCKLE SEAT BELT” message Center console urgent flashing Urgent message, 1 Hz duty cycle, 0.5 s on/off Center console urgent bright Urgent message, 700 cd/m2
Rear view mirror icon & text Steady image, icon and “BUCKLE SEAT BELT”
Auditory Displays 78 dB(A) peak, driver side speaker, unless specified Slow chime 0.83 Hz, slow decay Fast chime 2.5 Hz, slow decay Slow chime loud Slow chime at 90 dB(A) Slow chime at belt retractor Slow chime from speaker near driver belt retractor Slow beep 1 Hz duty cycle, 0.65 s on/0.35 s off Fast beep 3 Hz duty cycle, 0.22 s on/0.11 s off High urgency sound Four-pulse bursts of 0.4 s, 0.1 between bursts Male voice polite “Buckle seat belt” in pleasant tone Male voice urgent “Buckle seat belt” in urgent tone Male voice urgent loud Male voice urgent at 90 dB(A) Male voice at belt retractor Male voice polite from belt retractor speaker Male voice warning “Warning, buckle seat belt” in urgent tone Male voice warning loud Male voice warning at 90 dB(A) Female voice polite “Buckle seat belt” in pleasant tone Female voice urgent “Buckle seat belt” in urgent tone
6

2.1.2 Key Findings Given the variety of procedures, dependent measures, and independent variables manipulated in this experiment, the complete findings are rather extensive and complex. The full presentation of analyses and results is available in the project task report (Lerner et al., 2007). In this section, selected findings are highlighted. The focus is on results that are of potential importance for the design and evaluation of enhanced seat belt reminder systems. Some of the results of this experiment parallel findings of the observational field study. The relationship and agreement between the findings of the two experiments is discussed in Section 4, following the presentation of the additional observational study analyses presented in Section 3.
Relationship among subjective measures
• As anticipated, there was a strong positive relationship among perceived effectiveness, annoyance, and attention-getting. Systems or displays judged highly likely to get the driver to use the seat belt were also judged to be most annoying. Figure 2 illustrates this for the relationship between stationary-vehicle ratings of annoyance and effectiveness. There were some displays that appeared to be relatively effective, or relatively ineffective, given their degree of annoyance, but for the most part these were minor deviations.
• The details of the relationship between subjective effectiveness and annoyance are related to the seat belt use practices of the participants. For a given degree of annoyance, frequent seat belt users consider the system or display more effective than do occasional seat belt users, who in turn consider it more effective than do rare seat belt users. This is shown in the scatterplots of Figure 3 (on-road ratings) and Figure 4 (stationary vehicle ratings). There is some indication (from the on-road comparison of systems) that occasional seat belt users show a somewhat steeper function in the annoyance/effectiveness relationship; that is, their likely use of a seat belt is more strongly influenced by a given change in annoyance than that of frequent or rare seat belt users.
• The relationship of preference or desirability for a system or display to its subjective effectiveness and annoyance is weaker and more complex. For some individuals, highly effective/annoying systems or displays were rated as most desirable/preferable, while for other individuals, such systems or displays were least desirable/preferable. There was much more consensus among participants regarding what was effective and annoying than regarding what was desirable or preferable.
Key findings from comparison of prototype reminder systems
• The five reminder systems clearly differed from one another, both for judgments made during the drives (Figure 5 and Figure 6) and for judgments made after completing the drives (Figure 7).
• The “continuous flashing” system was not judged much differently than the basic system (where the steady icon terminated after a minute), both during the drive and for post-drive ratings (Figure 5 and Figure 7). The other three reminder systems, which all included enhanced auditory elements as well as visual elements, were rated considerably more effective and annoying.
• The on-road ratings were sensitive to the display elements that were in effect at about the
7

time of the rating. Effects for sustained elements were maintained, and “carryover” effects from terminated elements were not evident later in the drive (Figure 5 and Figure 6).
• For the on-road ratings of attention-getting, there was a seat belt use-by-rating point interaction, such that rare seat belt users found the initial displays less attention-getting than other seat belt use groups. This suggests that rare seat belt users are relatively insensitive to the initial displays typical of seat belt reminder systems and require some more conspicuous or assertive early reminder.
• The aggressive seat belt reminder system, which continued to cycle auditory and visual displays throughout the drive, clearly stood out as the most subjectively effective system when all four rating points were considered (Figure 5). It was also the most highly rated in terms of desirability and preference, though this was not a consensus among all participants.
• The scatterplots of annoyance versus effectiveness of on-road ratings showed only minimal overlap in effectiveness ratings for frequent seat belt users and rare seat belt users. In other words, the most effective seat belt reminder displays for the rare seat belt users were rated about the same as the least effective displays for the frequent seat belt users (Figure 3). To achieve moderate subjective effectiveness for the rare seat belt user group, annoyance levels must be quite high, and are perceived as very high by the frequent and occasional seat belt users.
Key findings from comparison of display elements
• The set of auditory and visual displays that participants experienced while the vehicle was stationary varied considerably in terms of rated effectiveness and annoyance, and these two attributes were strongly correlated (Figure 2). There was minimal relationship of these two factors with the group mean ratings of desirability.
• Auditory displays (sounds and speech) were rated as more effective and more annoying than visual displays. There was very little overlap among the display modes, with only the most effective/annoying visual display (center console, urgent, flashing) achieving the levels of the least effective/annoying auditory displays (Figure 8 and Figure 9).
• The group mean ratings of the effectiveness of auditory displays did not vary as greatly as the ratings of annoyance. Twelve of the 15 auditory displays were rated between 5 and 6 on the 10-point scale for effectiveness, with a maximum of 7.3. The comparable range of annoyance ratings was 4.2 to 8.9. Except for the loud speech messages, the voice messages generally were rated as less annoying than the sounds.
• Loud displays were rated as more effective and annoying than normal volume and fast patterns were rated as more effective and annoying than slow patterns.
• For voice messages, no evident effects were seen related to the speaker’s gender or tone (polite versus urgent).
• As a group, the visual displays were at best judged as moderate in effectiveness, with group mean ratings ranging from 2.7 to 5.7 on the 10-point rating scale. This is consistent with the findings from the comparisons of the on-road systems, where the visual-only enhancement was not very effective.
8

• The center console visual display location appeared more effective than the dashboard location. However, it should be noted that the center console display also had a larger character size than the dashboard display and characters were green rather than red. The design of the experiment precluded any further parsing of the influence of design features on participants’ ratings.
• Flashing displays were more effective than steady displays and flashing appeared to be a somewhat more effective way to enhance the display than increasing the brightness.
• Text displays were rated as more effective and more annoying than icon displays.
• No pronounced main effects of age and gender on ratings were observed, but age and gender appeared more substantially related to ratings for auditory displays than for visual displays.
• In terms of rated desirability of the display, there was not good consensus between subjects and no display stood out as exceptional. The group mean ratings across all 27 displays had a range of only 1.9 units (2.8 to 4.7) on the 10-point scale. However these group means obscure strong opinions (extremes of the rating scale) for individual participants. The group mean ratings of desirability showed little association with the group mean ratings of annoyance or effectiveness.
• The overall rated level of desirability for the displays was lowest for the rare seat belt users and highest for the frequent seat belt users.
• As was the case for the reminder system ratings, details of the relationship between subjective effectiveness and annoyance for the displays were related to the seat belt use practices of the participants. For a given degree of annoyance, frequent seat belt users considered the display more effective than did occasional seat belt users, who in turn considered it more effective than did rare seat belt users (Figure 4).
Other findings
• After each drive with a prototype reminder system, the participants indicated their willingness to have the hypothetical system removed from their vehicle. Given the premise that their car dealer or mechanic could legally uninstall the reminder system, participants indicated whether they would prefer to keep the system, remove it if only if removal was free, or pay to remove it (and how much they would be willing to pay). In general (across all five systems), rare seat belt users were considerably more willing to pay to remove systems (41% versus 26% for occasional seat belt users and 2% for frequent seat belt users). However, the differences among systems were relatively small and not statistically significant.
• At the conclusion of the session, when asked for the “best way” to provide visual and auditory seat belt reminders, the most frequently chosen best way to present a visual reminder was a system in which the visual reminder gets progressively brighter or flashes faster as time goes on. The auditory presentation chosen most frequently was a voice message that comes on periodically, followed closely by a non-voice sound that comes on periodically.
9

• In response to a question explicitly asking about the idea of customization, participants frequently indicated a desire to be able to customize their reminder sound. Of the 48 participants, 60.4 percent responded favorably to the idea, 27.1 percent negatively, and 12.5 percent were undecided or unclear.
Figure 2. Scatterplot of mean stationary-vehicle ratings of display effectiveness and annoyance
3
4
5
6
7
8
9
10
Effe
ctiv
enes
s
Rare Users Occasional Users Frequent Users
2
1
1 2 3 4 5 6 7 8 9 10
Annoyance
Figure 3. On-road system effectiveness rating versus annoyance rating by self-reported seat belt use category
10

10 Rare Users Occasional Users 9
Effe
ctiv
enes
s
8
7
6
5
4
3
2
1
Frequent Users
1 2 3 4 5 6 7 8 9 10 Annoyance
Figure 4. Stationary-vehicle ratings of effectiveness versus annoyance rating by self-reported seat belt use category
1
2
3
4
5
6
7
8
9
10
Rat
ing
Basic reminder Continuous flashing Periodic reminder Aggressive reminder One long reminder phase
1 2 3 4
Rating Point
Figure 5. Mean on-road effectiveness rating for five reminder systems
11

1
2
3
4
5
6
7
8
9
10
Rat
ing
Basic reminder Continuous flashing Periodic reminder Aggressive reminder One long reminder phase
1 2 3 4
Rating Point
Figure 6. Mean on-road annoyance rating for five reminder systems
Mea
n R
atin
g
10
System effectiveness rating
9 System desirability rating
System preference rating
8
7
6
5
4
3
2
1
Basic reminder Continuous Periodic seat Aggressive seat One longflashing belt reminder belt reminder reminder phase
Figure 7. Post-drive ratings for five reminder systems
12

Effe
ctiv
enes
s R
atin
g
Slo
w c
him
e
Fast
chi
me
Slo
w c
him
e (lo
ud)
Slo
w c
him
e (b
elt)
Slo
w b
eep
Fast
bee
p
Hig
h ur
genc
y
Mal
e po
lite
Mal
e ur
gent
Mal
e ur
gent
(lou
d)
Mal
e po
lite
(bel
t)
Mal
e w
arni
ng
Mal
e w
arni
ng (l
oud)
Fem
ale
polit
e
Fem
ale
urge
nt
10
9
8
7
6
5
4
3
2
1
Das
hboa
rd ic
on
Das
hboa
rd te
xt
Das
hboa
rd ic
on &
text
Das
hboa
rd ic
on (f
lash
ing)
Das
hboa
rd te
xt (f
lash
ing)
Das
hboa
rd ic
on (b
right
)
Das
hboa
rd te
xt (b
right
)
Cen
ter c
onso
le
Cen
ter c
onso
le u
rgen
t
Cen
ter c
onso
le u
rgen
t (br
ight
)
Cen
ter c
onso
le u
rgen
t (fla
shin
g)
Rea
r vie
w m
irror
icon
& te
xt
Figure 8. Mean stationary-vehicle ratings of display effectiveness
Ann
oyan
ce R
atin
g
Slow
chi
me
Fast
chi
me
Slo
w c
him
e (lo
ud)
Slow
chi
me
(bel
t)
1
2
3
4
5
6
7
8
9
10
Slow
bee
p
Fast
bee
p
Hig
h ur
genc
y
Mal
e po
lite
Mal
e ur
gent
Mal
e ur
gent
(lou
d)
Mal
e po
lite
(bel
t)
Mal
e w
arni
ng
Mal
e w
arni
ng (l
oud)
Fem
ale
polit
e
Fem
ale
urge
nt
Das
hboa
rd ic
on
Das
hboa
rd te
xt
Das
hboa
rd ic
on &
text
Das
hboa
rd ic
on (f
lash
ing)
Das
hboa
rd te
xt (f
lash
ing)
Das
hboa
rd ic
on (b
right
)
Das
hboa
rd te
xt (b
right
)
Cen
ter c
onso
le
Cen
ter c
onso
le u
rgen
t
Cen
ter c
onso
le u
rgen
t (br
ight
)
Cen
ter c
onso
le u
rgen
t (fla
shin
g)
Rea
r vie
w m
irror
icon
& te
xt
Figure 9. Mean stationary-vehicle ratings of display annoyance
13

The observational seat belt use study was undertaken to investigate the effectiveness and acceptability of all known ESBR systems among vehicles in every-day use on public highways and to better understand which ESBR characteristics are the most effective in influencing occupants to use seat belts. A complete report of the observational study methods and initial findings were previously reported (Freedman et al., 2007). The following summarizes the methods, analyses, and initial findings of the observational study.
2.2.1 Method Data collection
The primary objective of the observational study was to determine the effect of ESBRs on seat belt use rates in non-commercial passenger cars, pickups, SUVs, and passenger vans relative to similar vehicles without ESBRs. An observational study measuring seat belt use by drivers and right front seat passengers of these vehicles was conducted in eight urban centers across the United States. The analysis assessed the overall effects of each of the various ESBR systems (differentiated by their auditory and visual characteristics) on seat belt use, relative to the basic seat belt reminder system required by the Federal Motor Vehicle Safety Standard (FMVSS) No. 208. A secondary research objective was to examine the relative effectiveness of different ESBR system characteristics, such as warning sound duration, interval between displays, change in amplitude, and icon versus text.
The observational survey was conducted in September to October 2005. Seat belt use and license plates were observed unobtrusively by teams of two data collectors positioned at the roadside. Data collection normally took place between 8 a.m. and 4 p.m. The paper data collection form included driver and right front passenger seat belt use, driver and right front passenger age (Young/16-24, Adult/25-69, Senior/70+) and gender, and vehicle license plate number and registration State.
The study was limited to occupants of privately owned passenger cars, pickups, vans, and SUVs only – vehicles that appeared to be commercial vehicles (based on presence of commercial markings) and medium-large trucks were not included. The survey population consisted of drivers and front seat passengers and the vehicles they occupied while observed driving into the parking areas of office parks, shopping malls, shopping centers, other commercial and business activity centers and public parking lots with high volumes of traffic. The survey was conducted in the Metropolitan Statistical Areas associated with eight targeted cities - one in each of eight States representing four geographical quadrants of the United States - with one primary and one secondary seat belt use law State in each quadrant. The eight States were Arizona, California, Iowa, Missouri, Maryland, Virginia, Florida, and Texas.
Vehicle plate numbers were recorded and the corresponding vehicle identification number (VIN), make, model, and year of each observed vehicle were then identified from data supplied by each State department of motor vehicles (DMV). At this stage an additional State was added, Kansas, due to the large number of vehicles from the State observed in Kansas City, Missouri. PC VINA (a VIN decoder program) was used to verify the make, model and year, which were needed to match the vehicles with their corresponding ESBR characteristics. The ESBR icon, sound and text display characteristics of passenger vehicles in the fleet were provided by NHTSA with the
2.2 Observational Field Study
14

Initial data analysis
The initial analytical approach focused on two questions:
1. What is the effect on seat belt use of having an ESBR system, relative to the base system? Analysis was done for ESBR systems overall, and for individual groupings of ESBR systems.
2. What is the effect of individual ESBR system characteristics (sound, icon, and text features) on belt use?
Table 4 shows the variables available for the initial analysis.
cooperation of many of the vehicle manufacturers, and supplemented by Westat measurements, for the majority of makes/models/years since ESBR systems were introduced in 1998.
The ESBR characteristics of interest include information on:
• presence of ESBR by make, model, and year;
• activation onset threshold for vehicle speed, time, and travel distance;
• auditory display including sound type, cadence, and duration;
• visual display including icon type, appearance, and duration;
• text display including content and duration;
• duration of the system until timeout;
• post ESBR display state; and
• ability to permanently deactivate the system.
Nearly 55,000 vehicles were initially observed; 39,013 were included in the analysis. Table 3 shows the impact of various stages of data cleaning and matching to VINs on the sample data ultimately available for analysis.
Table 3. Observation records
Raw Observations N=54,554 Vehicles
Cleaned and Matched to VINS N=45,253 Vehicles
Matched to ESBR systems and No Missing Values for Key Predictor Variables N=39,013 Vehicles
15

Table 4. List of variables used for initial analysis
VARIABLE VALUES TYPE
Driver Seat Belt Use 1=Yes 2=No Outcome
Passenger Seat Belt Use 1=Yes 2=No Outcome
Presence of an ESBR 1=Yes 2=No Treatment
Type of ESBR System (collapsed – see Table 6) Treatment
Day of Week Day Potential Confounder
Type of Site (collapsed)
1,2=Shopping Mall, Shopping Center 3=Office Park 4=Parking Lot 5, 6=Sports Arena & Other
Potential Confounder
Weather Conditions (collapsed) 1,2=Light Precipitation, Light Fog 3=Clear
Potential Confounder
Type of Area (collapsed) 1=Urban 2, 3=Suburban, Rural
Potential Confounder
Driver Sex 1=Male 2=Female
Potential Confounder
Driver Age 1=Young (16-24) 2=Adult (25-69) 3=Senior (70+)
Potential Confounder
Presence of Front Seat Passenger 1=Yes 2=No
Potential Confounder
Passenger Sex 1=Male 2=Female
Potential Confounder
Passenger Age 1=Young (16-24) 2=Adult (25-69) 3=Senior (70+)
Potential Confounder
State AZ, CA, FL, IA, KS, MD, MO, TX, VA Potential Confounder
Seat Belt Use Law in State 1=Primary 2=Secondary
Potential Confounder
Year of Vehicle Manufacture Initial analysis: 1994 and earlier were collapsed into one group*
Potential Confounder
* Assumed there was little change in effect of vehicle age on belt use for vehicles more than 10 years old at time of observation.
16

Effect of ESBR system presence and type on belt use
The effect of ESBR system presence and type on belt use was addressed with respect to the effects on both driver and passenger belt use, and belt use overall. To avoid confounding of the treatment effect (i.e., type of ESBR) with the effect of one or more covariates (e.g., driver age) on the outcome (i.e., belt use), the effect of the potential confounders was statistically controlled by grouping the observations on their propensity for having the treatment (Rosenbaum et al., 1983). The propensity for belt use was defined as the probability that the driver or passenger of the observed vehicle wore a seat belt. With this approach, the propensity for wearing a seat belt was estimated as a function of the potential confounders of the effect of ESBRs on belt use. The approach has been fully described in Freedman et al. (2007). The method involved the following steps:
Step 1. Stepwise logistic regression was used to estimate the probability of seat belt use, using the potential confounder variables shown in Table 4 and as assigned to an occupant group of interest as shown in Table 5.
Step 2. Each of the occupant groups (drivers, passengers, and all occupants) were partitioned into five approximately equal-sized groups, or quintiles, with the assumption that if an ESBR in a vehicle has no effect on seat belt use, the proportion of vehicles with an ESBR would be the same in each quintile as the proportion of vehicles with a base system.
Step 3. The propensity models were tested for the property of balance. After balance was achieved, seat belt use was treated as if it had been randomly assigned within quintiles.
Step 4. Estimated seat belt use proportions assuming all vehicles had a base system (p1) were computed as the weighted average of belt use rates in quintiles 1, 2, 3, 4, and 5 using the proportions of vehicles with a base system in these quintiles. Estimated seat belt proportions assuming all vehicles had an ESBR (p2) were calculated as the weighted average of belt use rates in quintiles 1, 2, 3, 4, and 5 using the proportion of vehicles with an ESBR in these quintiles.
Step 5. Finally, the difference between the two proportions (p2-p1) was computed to estimate the effect of having an ESBR in every vehicle relative to having a base system in every vehicle.
17

Predictor Variables Modeled group
Overall Driver Passenger Year of Manufacture X X X
Age (Driver) X X X
Gender (Driver) X X X
Law X X
State (AZ) X X
State (CA) X
State (FL) X X X
State (IA) X X X
State (KS) X
State (MD) X
State (MO) X
State (TX) X X X
State (VA) X
Area X X
Site Type X X
Passenger Present X X
Driver (Yes/No) X
Effect of ESBR system characteristics on belt use
Separate analysis was conducted to compare the effects on belt use of different combinations of ESBR sound, icon, and text characteristics as well as the effects of individual characteristics of these features, such as the complete duration of the sound, icon and text features, the type of sound, and the icon appearance. The full list of individual ESBR characteristics considered in this analysis is shown in Appendix A.
Many of the systems occurred only rarely in the sample. For the purposes of this analysis, collapsing was done to form one set of 6 simple grouping that are relatively homogeneous with respect to their features, and a second set of 12 more detailed groupings, as shown in Table 6. Note that SIMP = 7 and DETL= 9 are identical because there was only one ESBR system with that unique set of both simple or detailed characteristics.
Table 5. Seat belt use model predictor variables
18

Table 6. Collapsed system groupings details
System Group Name Basic Characteristics SIMP1 Base System
SIMP2 Enhanced Icon Only
SIMP5 Enhanced Icon and Sound Only
SIMP6 Enhanced Icon and Text Only
SIMP7 Enhanced Sound and Text Only
SIMP8 Enhanced Icon, Sound and Text
DETL1 Base System
DETL2 Enhanced Icon Only • Icon is Continuous
DETL3 Enhanced Icon Only • Icon is Flashing
DETL4 Enhanced Icon and Sound Only
• Icon is Continuous • Sound is Chime
DETL5 Enhanced Icon and Sound Only
• Icon is Flashing • Sound is Chime
DETL6 Enhanced Icon and Sound Only
• Icon is Flashing • Sound is Buzzer
DETL7 Enhanced Icon and Sound Only
• Icon is Continuous and Flashing
• Sound is Chime
DETL8 Enhanced Icon and Text Only
• Icon is Continuous • Passenger Text
DETL9 Enhanced Sound and Text Only
• Sound is Chime • Driver and Passenger Text
DETL10 Enhanced Icon, Sound and Text
• Icon is Continuous • Sound is Chime • Driver and Passenger Text
DETL11 Enhanced Icon, Sound and Text
• Icon is Flashing • Sound is Chime • Driver Text
DETL12 Enhanced Icon, Sound and Text
• Icon is Flashing • Sound is Buzzer • Passenger Text
19

2.2.2 Key Findings Effect of ESBR system presence and type on belt use
Front seat occupants in vehicles with ESBRs were associated with higher seat belt use than vehicles without ESBRs. Observed (unweighted) overall belt use was 86.2 percent, which is slightly higher than the national average of 82-83 percent but not unexpected since half of the sites had primary belt use laws and only one site was in a rural area where belt use is typically lower than the national average (Glassbrenner, 2005). Occupants of vehicles without ESBRs (base system) were belted in 84.9 percent of observations, while belt use in ESBR vehicles ranged from 84.6 to 94.5 percent depending on system type. All systems except SIMP7/DETL9 had higher belt use than the Base System. Note that many SIMP7/DETL9 vehicles were pickup trucks, which are typically associated with relatively lower belt use rates regardless of the type of belt reminder system (Glassbrenner & Ye, 2007). Table 7 shows the belt use rates obtained from the sample.
Drivers (1) Passengers (2) All (1+2)
System % N % N % N
Overall 86.5 39,013 84.9 8,784 86.2 47,797
Base System 85.3 27,477 83.3 6,118 84.9 33,595
DETL2 87.0 1,721 82.9 340 86.4 2,061
DETL3 90.9 3,356 91.5 739 91.0 4,095
DETL4 *98.2 56 *100 10 *98.5 66
DETL5 89.6 4,060 87.7 980 89.2 5,040
DETL6 *93.8 96 *100 14 94.5 110
DETL7 91.6 1,056 89.0 301 91.0 1,357
DETL8 *90.0 20 . . *90.0 20
DETL9 84.3 829 85.9 206 84.6 1,035
DETL10 91.4 209 *93.5 46 91.8 255
DETL11 *90.9 88 *95.0 20 91.7 108
DETL12 *91.1 45 *80.0 10 *89.1 55
SIMP2 89.6 5,077 88.8 1,079 89.5 6,156
SIMP5 90.1 5,268 88.2 1,305 89.8 6,573
SIMP6 *90.0 20 . . *90.0 20
SIMP7 84.3 829 85.9 206 84.6 1,035
SIMP8 91.2 342 *92.1 76 91.4 418 * Estimates are not reliable because of the small sample size.
Table 7. Observed percentage belt use by ESBR system and occupant group
20

The effect of ESBRs on seat belt use was expressed as the estimated increase in the proportion of seat belt users if all vehicles had an ESBR system, compared to the case where none of the vehicles had an ESBR system, based on propensity analysis and modeling. The estimated belt use rates of drivers in vehicles with most types of ESBR systems were about 3-4 percentage points higher than drivers in vehicles without ESBRs. The presence of ESBR systems would increase driver seat belt use by an estimated 3.2 percentage points, and passenger seat belt use by 3.0 percentage points. Each of the ESBR systems has a positive and statistically significant (p<0.001) effect on seat belt use, for both drivers and passengers. Note that many SIMP7/DETL9 vehicles were pickup trucks, which made the observed rate relatively low. The estimated effect of the SIMP7/DETL9 system, however, was modeled and based on the assumption that all vehicles (including passenger cars that are normally associated with higher belt use rates) would be represented in their normal fleet proportions and would be equipped with that system. Thus the estimated effect is higher than the observed effect. The effects are summarized below and shown in Table 8.
Drivers:
• The overall effect of ESBRs was to increase driver seat belt use by 3.2 percentage points compared to vehicles without ESBRs. Depending on ESBR system, the increases ranged from 2.5 to 3.9 percentage points.
Front right passengers:
• The overall effect of ESBRs was to increase front passenger seat belt use by 3.0 percentage points compared to vehicles without ESBRs. Depending on the ESBR system, the increases ranged from 1.8 to 4.1 percentage points.
Front seat occupants
• The overall effect of ESBRs was to increase front seat occupant seat belt use by 3.3 percentage points compared to vehicles without ESBRs. Most ESBRs increased the rate of belt use by about 3-4 percentage points over the non-ESBR rate of belt use. Depending on ESBR system, the increases ranged from 2.6 to 4.1 percentage points.
Effect of ESBR system characteristics on belt use – relative to non-ESBR vehicles
The estimated effects of individual ESBR system features on seat belt use by drivers (not examined for passengers due to relatively small sample size) were analyzed using propensity quintile (P-group) modeling, comparing driver seat belt use in ESBR vehicles having a particular characteristic to non-ESBR (base system) vehicles. A positive ‘estimate’ (coefficient of that feature in the model) indicates that the presence of the feature had a positive effect on driver seat belt use, while a negative value indicates a negative effect. The results are shown in Table 9. The statistically significant results are shaded in the table.
21

Table 8. Effect of ESBR systems on seat belt use by ESBR system and occupant group (driver, passenger, overall)
System Driver Effect Passenger Effect Occupant Effect SIMP2 3.2% 2.8% 3.3%
SIMP5 3.1% 3.0% 3.2%
SIMP7* 3.9% 4.1% 4.1%
DETL2 2.5% 1.8% 2.6%
DETL3 3.6% 3.2% 3.7%
DETL5 2.9% 2.8% 2.9%
DETL7 3.9% 3.6% 4.1%
DETL9* 3.9% 4.1% 4.1%
Overall** 3.2% 3.0% 3.3% *SIMP7 and DETL9 refer to the same ESBR system group.
**ESBR system groups with small sample sizes were not analyzed separately, but were included in the “Overall” system.
The greatest effects on driver seat belt use are in P-Group=1, which is the group of vehicles and their drivers with the lowest percentage of seat belt use, and therefore has the most potential for improvement. Seven of the ten ESBR feature groups showed significant effects in P-Group 1, with six of the effects positive relative to drivers in non-ESBR vehicles (SOUND_TEXT_ONLY had a negative effect). In P-Group 2, there were four ESBR feature groups with significant effects (again SOUND_TEXT_ONLY was negative). P-Group 3 had three ESBR feature groups with significant effects (TEXT, SOUND_TEXT, and SOUND_TEXT_ONLY), all of which were negative. Note that text was a feature on certain full-size pickup trucks, which are known to have lower belt use rates, thus the vehicle type may have confounded the results. The results of this analysis are summarized below.
• ESBR features (icon, sound, text) and the characteristics of each feature (e.g., interval between displays, change in amplitude, etc.) were found individually and in various combinations to have significant (p<.05) effects on driver seat belt use.
• Positive significant effects were more often found among the lowest belt use propensity groups, suggesting that ESBRs help increase belt use among people who are relatively more resistant to wearing them.
• Relatively larger significant positive effects were found for systems having at least sound and icon components (Sound and Icon) and sound and icon with no other component (Sound and Icon Only).
• Significant negative effects were found for the combination of sound and text only (Sound and Text Only); however, the effect of text may be confounded with the effect of vehicle type, which was not a control variable in this analysis.
Effect of ESBR system characteristics on belt use – relative to other ESBR vehicles
The effect on driver seat belt use of individual ESBR characteristics was compared to that of all other ESBR vehicles, excluding base system vehicles from the analysis. The results are shown in
22

Table 10, with statistically significant results shaded. As with the previous table, all of the significant effects on driver seat belt use occur in the lower P-Groups.
In the lowest P-group, ESBR vehicles with both Sound and Icon features more effectively increase seat belt use than other ESBR vehicles. The principal findings are summarized below.
• All significant (p<.05) effects on driver seat belt use occurred in the lowest three belt use propensity groups.
• Sound and icon together, complete duration of sound, maximum frequency (rate) of the sound, and icon appearance had significant positive effects, thus were associated with higher belt use relative to other ESBR characteristics in the lowest belt use propensity group.
• Sound and text together, sound density (proportion of time sound is emitted), and maximum frequency of icon display had significant negative effects, thus were associated with lower seat belt use relative to other ESBR characteristics in the lowest belt use propensity group.
Effects shown in Table 9 and Table 10 often differ because the effects in Table 9 are relative to vehicles without ESBR features (base system), and those in Table 10 are relative to vehicles with other ESBRs.
The effects of individual ESBR features (e.g., visual icon or sound display duration, sound type, presence of text, etc.) varied, but a number of characteristics were more often significantly positive among the population with the lowest propensity to wear seat belts. This finding suggests that ESBRs may be most effective in converting belt use resistors if they incorporate the characteristics that showed significant positive effects among the lower propensity groups.
Note that the focus of the propensity analysis was on the relationship between ESBR characteristics and likelihood of belt use, but not on identifying population characteristics associated with higher or lower belt use. The estimates of belt use probability and effects of ESBR characteristics are based on modeling to control for confounders, including measures of the vehicle age, driver age, and gender; State and belt use law type (primary or secondary) where the observation was made; location characteristics; and passenger presence. The characteristics of the population in each propensity group vary greatly and cannot be readily summarized. Inferences regarding the characteristics of drivers and passengers exhibiting high or low belt use are more readily available from analyses of annual national seat belt surveys such as NOPUS (e.g., Glassbrenner & Ye, 2007).
Need for additional analysis
The estimated effects of specific ESBR system characteristics and components on belt use in this analysis were viewed as limited and tentative for several reasons. First, it was impossible to separate the ESBR features that might have had an effect on belt use from the set of coupled features that might not have had such an effect. Further, some of the ESBR features were present in only few makes and models. Finally, the propensity analysis method had certain limitations. These limitations caused us to focus attention on an improved analysis method, which was undertaken and is described in Chapter 3 of this report.
23

Vehicles With
Feature
1
Est
(73.6%)
P-Val n
2 (83.1%)
Est
Freq of Quintile (Driver Belt Use Percentage for ALL vehicles)
P-Val n
3 (88.5%)
Est P-Val n
4 (92.1%)
Est P-Val n
5 (95.4%)
Est P-Val n
ESBR features
0. esbrANY 11,536 0.29 <.05 1325 0.13 >.05 1988 0.01 >.05 2304 0.02 >.05 2240 -0.04 >.05 3679
1. ICON 10,707 0.35 <.05 1258 0.18 <.05 1846 0.09 >.05 2109 0.06 >.05 2091 -0.05 >.05 3403
2. SOUND 6,439 0.36 <.05 651 0.14 >.05 1171 0.01 >.05 1439 -0.04 >.05 1224 -0.13 >.05 1954
3. TEXT 1,191 -0.27 >.05 100 -0.21 >.05 210 -0.48 <.05 248 -0.26 >.05 218 -0.13 >.05 415
4. ICON_ONLY 5,077 0.22 <.05 672 0.11 >.05 814 0.02 >.05 859 0.11 >.05 1011 0.07 >.05 1721
5. SOUND_ICON
6. SOUND_ICON_ONLY
7. SOUND_TEXT
8. SOUND_TEXT_ONLY
9. SOUND_ICON_TEXT
5,610
5,268
1,171
829
342
0.52
0.51
-0.30
-0.64
0.67
<.05
<.05
>.05
<.05
>.05
584
553
98
67
31
0.24
0.23
-0.22
-0.41
0.27
<.05
<.05
>.05
<.05
>.05
1029
964
207
142
65
0.14
0.14
-0.48
-0.62
0.34
>.05
>.05
<.05
<.05
0.5224
1244
1197
242
195
47
0.03
0.01
-0.23
-0.46
0.57
>.05
>.05
>.05
>.05
>.05
1075
1011
213
149
64
-0.16
-0.13
-0.14
0.03
-0.43
>.05
>.05
>.05
>.05
>.05
1678
1543
411
276
135
Table 9. Individual characteristic effects on driver seat belt use within propensity stratum, compared to base systems
24

Variable >.05 672 -0.04 >.05 814 0.01 >.05 859 0.15 >.05 1011 0.20 >.05 1721
584 0.21 >.05 1029 0.27 <.05 1244 0.02 >.05 1075 -0.22 >.05 1678 31 0.14 >.05 65 0.33 >.05 47 0.56 >.05 64 -0.40 >.05 13598 -0.40 <.05 207 -0.56 <.05 242 -0.29 >.05 213 -0.11 >.05 411
651 -0.003 <.05 1171 -0.004 <.05 1439 -0.003 >.05 1224 -0.0001 >.05 1954 651 0.01 <.05 1171 0.004 >.05 1439 0.005 >.05 1224 0.003 >.05 1954 651 0.0003 >.05 1171 0.001 >.05 1439 0.0002 >.05 1224 -0.001 >.05 1954
0.20 >.05 1171 0.01 >.05 1439 0.39 >.05 1224 0.48 >.05 1954 0.01 >.05 1171 0.03 >.05 1439 0.01 >.05 1224 -0.03 >.05 1954
-0.61 >.05 1171 -0.11 >.05 1439 9.92 >.05 1224 9.40 >.05 1954 0.50 >.05 1171 -0.39 >.05 1439 0.31 >.05 1224 9.41 >.05 1954
-0.005 >.05 1846 0.001 >.05 2109 -0.002 >.05 2091 -0.002 >.05 3403 -0.0002 >.05 1846 -0.0001 >.05 2109 0.0001 >.05 2091 0.0002 >.05 3403
0.38 >.05 1846 0.01 >.05 2109 0.48 >.05 2091 0.62 >.05 3403 -0.0003 >.05 1846 -0.0003 >.05 2109 0.0002 >.05 2091 0.001 >.05 3403
0.22 >.05 1846 0.17 >.05 2109 0.04 >.05 2091 0.17 >.05 3403 >.05 1846 0.01 >.05 2109 0.02 >.05 2091 -0.001 >.05 3403 >.05 210 -0.002 >.05 248 -0.004 >.05 218 -0.001 >.05 415
>.05 210 0.002 >.05 248 0.004 >.05 218 -0.01 >.05 415
>.05 210 0.0002 >.05 248 -0.001 >.05 218 -0.0002 >.05 415
>.05 210 0.26 >.05 248 0.61 >.05 218 0.16 >.05 415
>.05 210 0.0001 >.05 248 -0.001 >.05 218 0.01 >.05 415
Quintile (Driver Belt Use Percentage for ESBR vehicles) 1 (78.0%) 2 (84.5%) 3 (88.6%) 4 (92.2%) 5 (95.4%)
Freq of Vehicles
With Feature Est P-Val n Est P-Val n Est P-Val n Est P-Val n Est P-Val n
ICON_ONLY Group 1. OVERALL
SOUND_ICON 5,077 -0.15
342 0.39 >.05 1,171 -0.65 <.05 6,439 -0.001 >.05 6,439 -0.001 >.05 6,439 0.002 <.05
5,610 0.39 <.05 SOUND_ICON_TEXT SOUND_TEXT IBSNDCYL 2. SOUND SCSNDDUR SNDDURAT SNDDensity
6,439 0.07 <.05 651 6,439 10.98 >.05 651 6,439 10.99 >.05 651
10,707 0.01 >.05 1258 10,707 -0.0004 >.05 1258 10,707 -0.55 >.05 1258 10,707 -0.001 <.05 1258 10,707 0.31 <.05 1258
6,439 -0.72 <.05 651 SNDMaxFreq SND_CAD SND_TYP IBICNCYL 3. ICON ICNDURAT ICNDensity ICNMaxFreq ICONAPPR SCICNDUR
1,191 0.002 >.05 100 -0.001
1,191 -0.02 >.05 100 -0.003
1,191 0.002 >.05 100 0.001
1,191 -0.77 >.05 100 -0.05
1,191 0.08 >.05 100 0.03
10,707 -0.004 >.05 1258 0.001 IBTXTCYL4. TEXT
SCTXTDUR
TXTDURAT
TXTDensity
TXTMaxFreq
Table 10. Individual characteristic effects on driver seat belt use within propensity stratum, excluding base systems from the comparison
25

3 Additional Analyses of Observational Field Study Data
3.1 Data The initial analysis had focused on estimating seat belt use as a function of ESBR system characteristics and identifying the ESBR characteristics most likely to influence belt use among various propensity groups. The analysis did not fully investigate the belt use differences associated with different ESBR systems, nor did it estimate the effects of each individual ESBR characteristic on belt use. In addition, initial analyses showed that the distribution of characteristics affecting belt use is not independent of the belt use reminder system. For instance, the base system is more common among older models while ESBRs are more common among newer ones, and among drivers of small trucks, males are more common than females, and so on. Thus, differences in belt use among vehicles with different reminder systems may be due to the distributional differences in these related factors.
Further analysis was undertaken to estimate the effects of reminder systems and components while controlling for other factors that could affect belt use. The analysis was confined to model year 1998-2005 vehicles because those are the years in which ESBRs were available and because the effect of vehicle age on belt use for them was expected to be more predictable.
Westat analyzed driver and passenger belt use for 28,665 model year 1998-2005 vehicles from 9 States and many sites within each State. The initial dataset consisted of 54,554 observations (see Table 3). The final dataset for additional analysis contained 28,665 vehicle observations, after removing 25,889 observations for various reasons (VIN not matched to license tag, unknown seat belt reminder system, year of manufacture outside of the range 1998 to 2005, driver or passenger belt use not ascertained, or missing values for key predictor variables such as driver age and gender, and passenger age and gender).
In addition to driver and passenger belt use, the data set for the additional analysis included variables for many of the characteristics that affect belt use, shown in the last two rows of Table 11. Seat belt observations were analyzed for only model years in which both the base system and one or more of the ESBRs were installed in at least some of the observed vehicles, as shown in Table 12.
The type of seat belt reminder system installed in the vehicle, and the details of each system, in terms of sound, text, and icon features, were obtained by combining records of each observed vehicle’s make, model, and year obtained from DMV license plate matches with the records of ESBR system characteristics by make, model, and year obtained from manufacturers and other sources. Table 13 shows the frequencies of occurrence of each seat belt reminder system in the sample. Several manufacturers have multiple systems, each with different characteristics, so the systems must be considered separately. Each system has its own designation in Table 13. Manufacturers’ names are encoded in keeping with confidentiality agreements. Details of each ESBR system’s characteristics are shown in Appendix A.
26

Table 11. List of variables used for additional analysis
VARIABLE VALUES TYPE
Driver Seat Belt Use 1=Yes 2=No Outcome
Passenger Seat Belt Use 1=Yes 2=No Outcome
Presence of an ESBR 1=Yes 2=No Treatment
Type of ESBR System (collapsed – see Table 6) Treatment
Day of Week Day Potential Confounder
Type of Site (collapsed)
1,2=Shopping Mall, Shopping Center 3=Office Park 4=Parking Lot 5, 6=Sports Arena & Other
Potential Confounder
Weather Conditions (collapsed) 1,2=Light Precipitation, Light Fog 3=Clear
Potential Confounder
Type of Area (collapsed) 1=Urban 2, 3=Suburban, Rural
Potential Confounder
Driver Sex 1=Male 2=Female
Potential Confounder
Driver Age 1=Young (16-24) 2=Adult (25-69) 3=Senior (70+)
Potential Confounder
Presence of Front Seat Passenger 1=Yes 2=No
Potential Confounder
Passenger Sex 1=Male 2=Female
Potential Confounder
Passenger Age 1=Young (16-24) 2=Adult (25-69) 3=Senior (70+)
Potential Confounder
State AZ, CA, FL, IA, KS, MD, MO, TX, VA Potential Confounder
Seat Belt Use Law in State 1=Primary 2=Secondary
Potential Confounder
Year of Vehicle Manufacture
Initial analysis: 1994 and earlier were collapsed into one group* Additional analysis: Only model years 1998 to 2005 were included in this analysis
Potential Confounder
Vehicle Type (used for additional analysis only)
1=Car 2=Minivan 3=SUV 4=Small Truck
Potential Confounder
Price of Vehicle (used for additional analysis only)
1=Up to $20k 2=$20k to $25k 3=$25k to $30k 4=$30k and Greater
Potential Confounder
* Assumed there was little change in effect of age on belt use for vehicles more than 10 years old at time of observation.
27

Table 12. Frequency and percentage of ESBR system vehicles in sample, by vehicle year
Vehicle Year Sample Size
ESBR System
Yes No
1980-1994 4,948 0 0.00
4,948 100.00
1995 1,613 0 0.00
1,613 100.00
1996 1,724 0 0.00
1,724 100.00
1997 2,237 0 0.00
2,237 100.00
1998 2,737 365 13.34
2,372 86.66
1999 3,447 735 21.32
2,712 78.68
2000 4,690 1,601 34.14
3,089 65.86
2001 3,698 599 16.20
3,099 83.80
2002 5,739 3,323 57.90
2,416 42.10
2003 3,190 822 25.77
2,368 74.23
2004 2,873 2,005 69.79
868 30.21
2005 2,033 2,002 98.48
31 1.52
2006 79 79 100.00
0 0.00
2007 5 5 100.00
0 0.00
Total 39,013 11,536 27,477
28

Table 13. Frequency of ESBR in the additional analysis sample
SYSTEM NAME Frequency Percent Cumulative Frequency
Cumulative Percent
Base System 17,576 61.32 17,576 61.32
Manuf. A System 1 46* 0.16 17,622 61.48
Manuf. A System 2 40* 0.14 17,662 61.62
Manuf. B System 1 918 3.20 18,580 64.82
Manuf. C System 1 3,070 10.71 21,650 75.53
Manuf. D System 1 366 1.28 22,016 76.80
Manuf. D System 2 374 1.30 22,390 78.11
Manuf. D System 3 38* 0.13 22,428 78.24
Manuf. D System 4 17* 0.06 22,445 78.30
Manuf. E System 1 883 3.08 23,328 81.38
Manuf. E System 2 88* 0.31 23,416 81.69
Manuf. F System 1 49* 0.17 23,465 81.86
Manuf. F System 2 38* 0.13 23,503 81.99
Manuf. G System 1 1,689 5.89 25,192 87.88
Manuf. G System 2 0* 0.00 25,192 87.88
Manuf. H System 1 20* 0.07 25,212 87.95
Manuf. H System 2 9* 0.03 25,221 87.99
Manuf. I System 1 3,271 11.41 28,492 99.40
Manuf. I System 2 50* 0.17 28,542 99.57
Manuf. J System 1 81* 0.28 28,623 99.85
Manuf. J System 2 42* 0.15 28,665 100.00 * Belt use rates can’t be reliably estimated because of small sample size.
As can be seen in Table 13, many of the systems occur only rarely in the sample. For the purposes of both the initial and additional analyses, collapsing was done to form one set of 6 simple groupings that are relatively homogeneous with respect to their features, and a second set of 12 more detailed groupings. The basis for the collapsed groupings was shown in Table 6 earlier in this report. Table 14 shows which systems are represented in each collapsed grouping and the frequency of the systems.
29

Table 14. Frequency of collapsed system groupings
SIMPLE GROUP
DETAILED GROUP Systems in Group Frequency Percent Cumulative
Frequency Cumulative Percent
SIMP1 DETL1 Base System 17,576 61.32 17,576 61.32
SIMP2 DETL2 Manuf. D System 4, Manuf. G System 1, Manuf. G System 2, Manuf. H System 2
1,715 5.98 19,291 67.30
SIMP2 DETL3 Manuf. I System 1 3,271 11.41 22,562 78.71
SIMP5 DETL4 Manuf. A System 1* 46 0.16 22,608 78.87
SIMP5 DETL5 Manuf. C System 1, Manuf. E System 1
3,953 13.79 26,561 92.66
SIMP5 DETL6 Manuf. F System* 1, Manuf. I System 2*
99 0.35 26,660 93.01
SIMP5 DETL7 Manuf. B System 1, Manuf. D System 3
956 3.34 27,616 96.34
SIMP6 DETL8 Manuf. H System 1* 20 0.07 27,636 96.41
SIMP7 DETL9 Manuf. D System 1, Manuf. D System 2
740 2.58 28,376 98.99
SIMP8 DETL10 Manuf. A System 2, Manuf. J System 1, Manuf. J System 2
163 0.57 28,539 99.56
SIMP8 DETL11 Manuf. E System 2* 88 0.31 28,627 99.87
SIMP8 DETL12 Manuf. F System 2* 38 0.13 28,665 100.00 * Belt use rates can’t be reliably estimated because of small sample size.
The number and proportion among the analyzed sample of vehicle types equipped with ESBR systems SIMP2, SIMP5, SIMP6, SIMP7, and SIMP8 are shown in Table 15.
30

Vehicle Type SIMP Total
Frequency Row Pct 2 5 6 7 8
Car (1) 2891 51.94
2344 42.11
20 0.36
39 0.70
272 4.89
5566 100.00
SUV (2) 354 41.94
450 53.32
0 0.00
40 4.74
0 0.00
844 100.00
Minivan (3) 1610 44.55
1541 42.64
0 0.00
445 12.3
1
18 0.50
3614 100.00
Small truck (4) 149 14.08
690 65.22
0 0.00
219 20.7
0
0 0.00
1058 100.00
Unknown (9) 0 0.00
44 100.00
0 0.00
0 0.00
0 0.00
44 100.00
Total 5004 5069 20 743 290 11126
Table 15. Percent distribution of ESBR systems by vehicle type
3.2 Methods Seat belt observation data were analyzed using logistic regression.1 Separate analyses were conducted for all drivers, for drivers with a front seat occupant, and for front seat occupants. With this method, belt use probability is directly related to ESBR characteristics and to covariates that might also affect driver belt use. For the base model, the covariates, defined in terms of the variables shown earlier in Table 4, are listed in Table 16.
Logistic regression was used to estimate belt use probability in the three occupant groups as a function of the covariates listed in Table 16. This was done in the stepwise mode. The primary interest was to estimate the effect of each ESBR on belt use probability relative to the baseline system. The other covariates with data were allowed into the regression models in an attempt to remove their potential effect on belt use probability estimates.
Once the models were determined, model parameter estimates were used to estimate belt use probabilities and describe belt use differences between an ESBR and the base line reminder system. Odds ratios (OR) were calculated for comparing belt use probability estimates for a selected ESBR system to belt use probability estimates for either the base line system or another ESBR, based on what was observed in the sample population.
In the simplest terms, odds compare the probability of an event (e.g., belt use) to the probability of the corresponding non-event (no belt use) by taking the ratio of the two probabilities. Of particular interest were the odds ratios for comparing belt use probability with one reminder system to belt use probability with another. By definition, the larger such an OR is, the higher the odds for belt use with the ESBR relative to the baseline system.
1 In contrast to the initial analysis, these estimates were generated without propensity stratification.
31

Variables in Logistic Regression Definition
SIMP 6-level categorical variable with levels 2, 4-8 identifying ESBR = 2, 4-6 and level 10 the baseline reminder system
Year Model year centered on 2001
Vehicle_type 5-level classification variable (passenger car, van, SUV, pickup truck and vehicle type not known)
Year by vehicle type interaction
Male = 1 if driver is male, 0 if driver is female
Typecat2 = 1 if site type is other than 1 or 2, 0 if site type is 1 or 2
Dage2 = -1, 0, 1 for drivers in the young, middle, and old groups
Urban = 1 if in urban area, 0 otherwise
Weekend = 1, if weekend, 0 otherwise
State 9-level State identifier
pr2
1= Up to $20k 2= $20k to $25k 3= $25k to $30k 4= $30k and Greater
Table 16. Covariates included in the logistic regression for estimating driver belt use
Unadjusted belt use percentages for all drivers, drivers with passengers and passengers were computed for each of the 6 basic ESBR systems and 12 detailed ESBR systems. Covariate-adjusted belt use probabilities, odds ratios and differences by reminder system were estimated for the observed population. The objective was to assess the relative effectiveness in promoting seat belt use of each ESBR system relative to the baseline, and to each other, to help identify the particular sets of characteristics that either promote or detract from ESBR effectiveness.
3.3 Findings
3.3.1 General Overview Table 17 presents the sample sizes and observed percentage of seat belt use for all observations included in the analysis, for base system (non-ESBR) vehicles and for each of the ESBR system groups.
The results are presented in Table 17 for all drivers, and separately for drivers with passengers, and for passengers. The first row at the top of the table presents the belt use rates for all vehicles, before excluding vehicles that were not manufactured between 1998 and 2005 inclusive. The second row presents belt use rates for base system vehicles that were not manufactured between 1998 and 2005. The system names in Table 17 correspond to the system groupings in Table 6 and Table 7.
Overall driver belt use was 86.7 percent, which is slightly higher than the national average of 82-83 percent but not unexpected since half of the sites had primary belt use laws and only one site
32

was in a rural area where low belt use pulls down the national average. Of those vehicles included in the analysis, drivers of vehicles without ESBRs (base system) were belted in 86.3 percent of observations, while driver belt use in ESBR vehicles was in the 83-98 percent range depending on system type.
Table 18 identifies the predictor variables that were included in stepwise logistic regressions for all drivers, drivers with an occupant, and passengers and also the predictor variables that were selected as statistically significant predictors of belt use.
Model parameters were used to estimate belt use probabilities in the observed population. Table 19 displays the ratios of belt use odds for vehicles with an ESBR relative to belt use odds with the base system. The odds ratios in the table are adjusted for significant belt use predictors. Statistically significant odds are highlighted in bold. Except for SIMP = 7 for all drivers, ESBRs increased belt use for all drivers, for drivers with passengers, and for passengers. The increases were statistically significant for all occupant groups only for SIMP = 5. For SIMP = 2, the effect was statistically significant for drivers and passengers when a passenger was present. For SIMP = 8, the effects were large, but significant only for passengers. For SIMP = 6, there were not enough observations for vehicles that included a passenger.
An odds ratio (OR) greater than 1 is associated with increased belt use; an OR less than 1 is associated with decreased belt use. In Table 19, for instance, the OR for drivers in vehicles equipped with ESBRs classified as SIMP = 5 was 1.275. This means that driver belt use OR in those vehicles was 1.275 times larger than driver belt use OR in vehicles with a baseline system. (Crude belt use odds are defined as the ratio of the number of belted drivers divided by the number of unbelted drivers. Belt use OR estimates in Table 19 were adjusted for covariates included in the logistic regression model for driver belt use.)
33

All Drivers Drivers with Passengers Passengers
System % N % N % N Overall (all observed
vehicles) 86.7 40,567 87.4 9,907 85.3 9,911
Excluded (not model years 1998-2005)
Base System 84.1 10,950 84.0 2,726 82.1 2,727
Included (model years 1998-2005)
Overall 87.5 28,665 88.3 6,845 86.7 6,845
Base System 86.3 17,576 86.6 4,117 85.4 4,117
DETL2 87.0 1,715 86.1 359 83.6 359
DETL3 90.8 3,271 93.4 772 92.4 772
DETL4 *97.8 46 *100 10 *100 10
DETL5 90.0 3,953 91.1 1,037 87.8 1,037
DETL6 *93.9 99 *94.4 18 *100 18
DETL7 91.2 956 91.2 285 88.8 285
DETL8 *90.0 20 . . . .
DETL9 82.8 740 86.5 178 86.0 178
DETL10 92.0 163 *92.3 39 *94.9 39
DETL11 *92.0 88 *85.0 20 *95.0 20
DETL12 *92.1 38 *90.0 10 *80.0 10
SIMP2 89.5 4,986 91.1 1,131 89.6 1,131
SIMP5 90.3 5,054 91.3 1,350 88.2 1,350
SIMP6 *90.0 20 . . . .
SIMP7 82.8 740 86.5 178 86.0 178
SIMP8 92.0 289 *89.9 69 *92.8 69 * Estimates are not reliable because of the small sample size.
Table 17. Observed percentage belt use by ESBR system and occupant group (all drivers, drivers with passengers, and passengers)
34

Table 18. Significant predictor variables of belt use among drivers, drivers with passengers, and passengers
Predictor Drivers Drivers with passenger Passengers
Variable Included Selected Included Selected Included Selected
State X X X X X X SIMP X X X X X X Year of Manufacture X X X X Vehicle Type X X X X X X Year * Vehicle Type X X X Price X X X Area X X X X Site Type X X X X Weekend X X X Age (Driver) X X X X X X Gender (Driver) X X X X X Age (Passenger) X X Gender (Passenger) X X X X
Table 19. Effect (odds ratio) of ESBR systems on seat belt use for drivers, drivers with passengers, and passengers (belt use odds by ESBR system relative to base system)
Drivers with a System All Drivers Passenger Passengers SIMP2 1.093 1.574 1.491 SIMP5 1.275 1.702 1.349 SIMP6 1.124 . .SIMP7 0.651 1.144 1.128 SIMP8 1.350 1.577 2.742
3.3.2 Results for All Drivers Logistic regression was fitted in the stepwise mode to estimate driver belt use. Significant effects were found for the variables listed in Table 20. Year by vehicle type interaction, weekend, and approximate sales price were eliminated by the stepwise selection procedure as not significant driver belt use predictors.
35

Table 20. Type 3 analysis of effects for stepwise model of driver belt use – all drivers
EFFECT DF Wald ChiSq Prob ChiSq
SIMP 5 41.4275 <.0001
YEAR 7 29.0122 <.0001
VEHICLE_TYPE 4 71.6973 <.0001
MALE 1 105.6219 <.0001
TYPECAT2 1 5.2215 0.0223
DAGE2 1 78.0045 <.0001
URBAN 1 10.4548 0.0012
STATE 8 973.8961 <.0001
The effects of the significant model parameters were summarized using odds ratios. An odds ratio (OR) greater than 1 is associated with increased belt use, an OR less than 1, with decreased belt use. An OR indicates a significant effect, if the lower and upper confidence limits exclude the value 1. It indicates a non-significant effect if the lower and upper limits bracket the value 1. Thus, for instance, since the lower and upper OR confidence limits for comparing Year = 2 and Year = -2 excluded the value 1, and the corresponding OR = 1.176 exceeded 1, one can conclude that belt use was in general higher in year 2 than in year -2. (For model year 2001, Year was set to 0. Thus, model year 2003 vehicles have Year = 2 = 2003-2001, etc.). The main findings, shown in Table 21, are as follows:
• Driver belt use generally increased between model year 1999 and model year 2004 vehicles. However, only vehicles from the last two model years had a significantly higher belt use rate than those from year 1999.
• Female drivers (Male = 1 for females), had a significantly higher belt use rate than male drivers.
• Belt use was significantly higher at sites other than shopping malls or shopping centers.
• Belt use increased significantly with driver age.
• Belt use was significantly lower at urban than at other sites.
• State belt use rates of drivers varied across States in the sequence (from lowest to highest): FL, MO, VA, KS, IO, TX, MD, AZ, and CA.
• Driver belt use rates increased with belt use reminder system in the sequence (from lowest to highest): SIMP = 7, Base, 2, 6, 5, 8.
36

Table 21. Odds ratios for parameters with a significant Type 3 effect - all drivers
EFFECT Odds Ratio Est Lower CL Upper CL
SIMP 2 VS 10 1.093 0.974 1.228
SIMP 5 VS 10 1.275 1.114 1.460
SIMP 6 VS 10 1.124 0.253 5.003
SIMP 7 VS 10 0.651 0.512 0.826
SIMP 8 VS 10 1.350 0.858 2.123
YEAR 0 VS -2 1.062 0.938 1.202
YEAR 1 VS -2 1.125 0.990 1.279
YEAR 2 VS -2 1.176 1.032 1.340
YEAR 3 VS -2 1.458 1.259 1.688
YEAR -1 VS -2 1.019 0.901 1.153
VEHICLE_TYPE 1 VS 9 0.892 0.640 1.244
VEHICLE_TYPE 2 VS 9 1.293 0.905 1.845
VEHICLE_TYPE 3 VS 9 0.851 0.607 1.192
VEHICLE_TYPE 4 VS 9 0.602 0.426 0.853
MALE 1.478 1.372 1.592
TYPECAT2 1.112 1.015 1.219
DAGE2 1.580 1.427 1.748
URBAN 0.834 0.747 0.931
STATE AZ VS VA 3.902 3.290 4.628
STATE CA VS VA 3.958 3.283 4.772
STATE FL VS VA 0.603 0.532 0.683
STATE IA VS VA 1.570 1.362 1.809
STATE KS VS VA 1.114 0.920 1.348
STATE MD VS VA 2.485 2.130 2.901
STATE MO VS VA 0.900 0.760 1.067
STATE TX VS VA 1.974 1.673 2.331
The results from a more detailed set of comparisons, including main effects and contrasts for belt use reminder systems, are shown in Table 22.
37

Table 22. ESBR contrasts and odds ratios – all drivers
Contrast Estimate Lower Limit Upper Limit Prob ChiSq
Main effect: SIMP2 1.037 0.788 1.364 0.797
Main effect: SIMP5 1.209 0.919 1.590 0.175
Main effect: SIMP6 1.066 0.307 3.700 0.920
Main effect: SIMP7 0.617 0.451 0.845 0.003
Main effect: SIMP8 1.280 0.821 1.994 0.276
Main effect, baseline 0.948 0.720 1.248 0.704
SIMP 2 vs. baseline 1.093 0.974 1.228 0.131
SIMP 5 vs. baseline 1.275 1.114 1.460 0.000
SIMP 6 vs. baseline 1.124 0.253 5.003 0.878
SIMP 7 vs. baseline 0.651 0.512 0.826 0.000
SIMP 8 vs. baseline 1.350 0.858 2.123 0.194
SIMP 2 v 5 0.858 0.746 0.986 0.031
SIMP 2 v 6 0.973 0.218 4.330 0.971
SIMP 2 v 7 1.680 1.328 2.127 0.000
SIMP 2 v 8 0.810 0.516 1.271 0.360
SIMP 5 v 6 1.134 0.255 5.050 0.869
SIMP 5 v 7 1.960 1.562 2.458 0.000
SIMP 5 v 8 0.945 0.603 1.479 0.803
SIMP 6 v 7 1.728 0.384 7.782 0.476
SIMP 6 v 8 0.833 0.176 3.931 0.817
SIMP 7 v 8 0.482 0.298 0.781 0.003
As shown in Table 23, all reminder systems, except for SIMP = 6, were associated with significantly higher driver belt use rates than SIMP = 7. Similarly, all reminder systems, except for SIMP = 6 and SIMP = 8, were associated with significantly lower driver belt use rates than SIMP = 5. (Reminder systems in Table 23 are listed in decreasing order of associated belt use rates. Significant belt use rate differences between system pairs were indicated by ‘>’ .)
Table 24 summarizes the number of observations (FREQ), single cycle durations (seconds) of sound (SCSNDDUR), icon (SCICNDUR), and text (SCTXTDUR); and maximum single cycle frequencies (number of repetitions of warning cycles before time out) of sound (SNDMaxFreq), icon (ICNMaxFreq), and text (TXTMaxFreq) for the best (SIMP5) and the worst (SIMP7) simple systems and for the baseline system.
38

Table 23. Significant reminder system contrasts – all drivers Reminder system
Reminder system
8 5 6 2 Base 7
SIMP8 * - - - - >
SIMP5 * - > > >
SIMP6 * - - -
SIMP2 * - >
Base * >
SIMP7 *
Table 24. Average reminder system characteristics for systems SIMP = 5, 7, and other
SIMP FREQ SCSNDDUR SNDMaxFreq SCICNDUR ICNMaxFreq SCTXTDUR TXTMaxFreq
0 (Other) 5,295 0.95 0.53 341.19 4.06 2.30 0.39 SIMP5 (Best) 5,054 23.35 8.42 11.14 10.24 0.00 0.00 SIMP7 (Worst) 740 3.00 1.49 0.00 0.00 27.00 1.49
The main findings were:
• Best systems. The reminder system with the highest driver belt use rate, SIMP = 5, has the longest average single-cycle duration and the highest maximum sound frequency.
• Average systems. The reminder systems with neither the lowest nor the highest driver belt use rates have the longest single-cycle icon duration and a maximum icon frequency of 4.06.
• Worst systems. The reminder system with the lowest driver belt use rate, SIMP = 7, has very short average single-cycle duration, zero length single-cycle icon duration and a single cycle text duration of 27 seconds with a maximum text repeat frequency of 1.5.
It is reasonable to conclude that sound is the most effective reminder, followed by icons, and text is the least effective. Long single-cycle durations, and high maximum repeat frequencies also increase driver belt use.
It is noteworthy that vehicles with SIMP = 7 showed a negative effect on belt use. Only one manufacturer’s vehicles had SIMP = 7. Table 25 shows that nearly all of them were SUVs or small trucks.
39

Table 25. Frequency of vehicles with system SIMP = 7, by vehicle type
Vehicle_Type Frequency Cumulative Frequency
1 Car 39 39
2 Minivan 40 79
3 SUV 445 524
4 Small Truck 219 743
3.3.3 Results for Drivers With Passengers Logistic regression was fitted in the stepwise mode to estimate driver belt use, for drivers with a front seat passenger. Significant effects were found for the variables listed in Table 26. Year, year by vehicle type interaction, approximate sales price, passenger age, urban/rural indicator, a weekend indicator, and location type were eliminated by the stepwise selection procedure as not significant driver belt use predictors. Note that SIMP = 6 was not included because there were too few observations with passengers to support analysis.
Table 26. Type 3 analysis of effects for stepwise model of driver belt use drivers with passengers
Effect DF Wald ChiSq Prob ChiSq
SIMP 4 33.1419 <.0001
Vehicle_Type 4 20.2636 0.0004
male 1 9.8585 0.0017
dage2 1 20.1033 <.0001
PGENDER 1 15.2746 <.0001
State 8 256.6671 <.0001
The effect of the significant model parameters are summarized using odds ratios. The main findings were:
• Female drivers (Male = 1 for female), had a significantly higher belt use rate than male drivers.
• Belt use increased significantly with driver age.
• Drivers with a female passenger had a significantly higher belt use rate than those with a male passenger.
• Belt use rates of drivers varied across States in the sequence (from lowest to highest): FL, VA, MO, KS, IA, TX, MD, CA, and AZ.
• Driver belt use rates increased with belt use reminder system in the sequence (from lowest to highest): SIMP = Base, 7, 2, 8, 5.
40

The results in terms of odds ratios are shown in Table 27. For a more detailed set of comparisons, the main effects and contrasts for belt use reminder systems are presented in Table 28.
Table 27. Odds ratios for parameters with a significant Type 3 effect drivers with passengers
Effect Odds Ratio Est Lower CL Upper CL
SIMP 2 vs 10 1.574 1.249 1.984
SIMP 5 vs 10 1.702 1.371 2.113
SIMP 7 vs 10 1.144 0.719 1.821
SIMP 8 vs 10 1.577 0.698 3.562
Vehicle_Type 1 vs 9 0.916 0.457 1.836
Vehicle_Type 2 vs 9 1.516 0.725 3.167
Vehicle_Type 3 vs 9 0.891 0.440 1.805
Vehicle_Type 4 vs 9 0.667 0.322 1.382
male 1.286 1.099 1.504
dage2 1.553 1.281 1.883
PGENDER 1.398 1.182 1.653
State AZ vs VA 4.658 2.738 7.926
State CA vs VA 3.568 2.547 4.996
State FL vs VA 0.511 0.404 0.646
State IA vs VA 1.570 1.196 2.060
State KS vs VA 1.392 0.986 1.965
State MD vs VA 2.327 1.662 3.259
State MO vs VA 1.178 0.871 1.594
State TX vs VA 2.315 1.737 3.085
Table 29 shows that only reminder systems SIMP = 2 or 5 were associated with significantly higher driver belt use rates than the base system. There were no other significant effects. Notably for drivers with passengers, vehicles with SIMP = 7 did not have significantly lower belt use than base system vehicles. (Reminder systems in Table 29 were listed in decreasing order of associated belt use rates. Significant belt use rate differences between system pairs were indicated by ‘>’.) The detailed characteristics of single cycle sound, icon and text durations and maximum frequencies for SIMP = 5, 7 and other are shown in Table 30.
It is reasonable to conclude that sound is the most effective reminder, followed by icons, and text is the least effective. Long single cycle durations, and high maximum repeat frequencies also increase driver belt use.
41

Table 28. ESBR contrasts and odds ratios – drivers with passengers
Contrast Estimate Lower Limit Upper Limit Prob ChiSq
Main effect: SIMP 2 1.149 0.891 1.481 0.285
Main effect: SIMP 5 1.242 0.972 1.587 0.083
Main effect: SIMP 7 0.835 0.557 1.250 0.381
Main effect: SIMP 8 1.151 0.596 2.222 0.676
Main effect, baseline 0.730 0.593 0.899 0.003
SIMP 2 vs. baseline 1.574 1.249 1.984 0.000
SIMP 5 vs. baseline 1.702 1.371 2.113 0.000
SIMP 7 vs. baseline 1.144 0.719 1.821 0.571
ESBESIMP 8 vs. baseline 1.577 0.698 3.562 0.274
ESBESIMP 2 vs. 5 0.925 0.693 1.234 0.595
ESBESIMP 2 vs. 7 1.376 0.832 2.274 0.213
ESBESIMP 2 vs. 8 0.998 0.433 2.302 0.997
SIMP 5 vs. 7 1.488 0.912 2.428 0.112
SIMP 5 vs. 8 1.079 0.469 2.485 0.857
SIMP 7 vs. 8 0.726 0.285 1.846 0.501
Table 29. Significant reminder system contrasts – drivers with passengers Reminder System 5 8 2 7 Base
SIMP5 * - - - >
SIMP8 * - - -
SIMP2 * - >
SIMP7 * -
Base *
Table 30. Average reminder system characteristics for systems SIMP = 5, 7 and other
SIMP _FREQ_ SCSNDDUR SNDMaxFreq SCICNDUR ICNMaxFreq SCTXTDUR TXTMaxFreq
Not 5 or 7 1200 1.04 0.55 340.22 4.18 1.02 0.40
5 1350 24.71 8.16 11.03 10.14 0.00 0.00
7 178 3.00 1.51 0.00 0.00 27.00 1.51
42

3.3.4 Results for Passengers Logistic regression was fitted in the stepwise mode to estimate driver belt use, for drivers with a front seat passenger. Significant effects were found for the variables listed in Table 31. Year, year by vehicle type interaction, approximate sales price estimate, passenger age, urban/rural indicator, a weekend indicator, and location type were eliminated by the stepwise selection procedure as not significant driver belt use predictors. Note that SIMP6 was not included because there were too few observations with passengers to support analysis. The effect of the significant model parameters are summarized using odds ratios, shown in Table 32.
Table 31. Type 3 analysis of effects for stepwise model of driver belt use - passengers
Effect DF Wald ChiSq Prob ChiSq SIMP 4 21.5240 0.0002 Vehicle_Type 4 14.4050 0.0061 dage2 1 10.9357 0.0009 PGENDER 1 69.6418 <.0001 State 8 395.2042 <.0001
Table 32. Odds ratios for parameters with a significant Type 3 effect - passengers
Effect Odds Ratio Est Lower CL Upper CL
SIMP 2 vs. 10 1.491 1.196 1.859 SIMP 5 vs. 10 1.349 1.108 1.643 SIMP 7 vs. 10 1.128 0.710 1.795 SIMP 8 vs. 10 2.742 1.061 7.083 Vehicle_Type 1 vs. 9 1.235 0.664 2.297 Vehicle_Type 2 vs. 9 1.846 0.957 3.560 Vehicle_Type 3 vs. 9 1.254 0.667 2.358 Vehicle_Type 4 vs. 9 0.987 0.510 1.909 dage2 1.376 1.139 1.663 PGENDER 1.953 1.669 2.285 State AZ vs. VA 5.060 2.983 8.585 State CA vs. VA 2.952 2.188 3.983 State FL vs. VA 0.457 0.366 0.572 State IA vs. VA 1.687 1.298 2.193 State KS vs. VA 0.810 0.605 1.085 State MD vs. VA 2.848 2.033 3.991 State MO vs. VA 0.917 0.697 1.207 State TX vs. VA 5.770 4.031 8.258
43

The main findings were:
• Female passengers had significantly higher belt use rate than male passengers.
• State belt use rates of passengers varied across States in the sequence (from lowest to highest): FL, KS, MO, VA, IA, MD, CA, AZ, and TX.
• Belts use increased significantly with passenger age.
• Passenger belt use rates increased with belt use reminder system in the sequence (from lowest to highest): SIMP = Base, 7, 5, 2, 8.
Main effects and contrasts for belt use reminder systems are shown in the more detailed set of comparisons in Table 33.
Table 33. ESBR contrasts and odds ratios - passenger
Contrast Estimate Lower Limit Upper Limit Prob ChiSq
Main effect: SIMP 2 1.034 0.793 1.349 0.804
Main effect: SIMP 5 0.936 0.726 1.207 0.610
Main effect: SIMP 7 0.783 0.517 1.185 0.247
Main effect: SIMP 8 1.902 0.886 4.084 0.099
Main effect, baseline 0.694 0.552 0.871 0.002
SIMP 2 vs. baseline 1.491 1.196 1.859 0.000
SIMP 5 vs. baseline 1.349 1.108 1.643 0.003
SIMP 7 vs. baseline 1.128 0.710 1.795 0.610
SIMP 8 vs. baseline 2.742 1.061 7.083 0.037
SIMP 2 vs. 5 1.105 0.847 1.441 0.462
SIMP 2 vs. 7 1.321 0.803 2.173 0.272
SIMP 2 vs. 8 0.544 0.207 1.426 0.216
SIMP 5 vs. 7 1.196 0.739 1.936 0.467
SIMP 5 vs. 8 0.492 0.188 1.287 0.148
SIMP 7 vs. 8 0.412 0.144 1.179 0.098
Only reminder system SIMP = 7 was not associated with significantly higher passenger belt use rates than the base system. Significant reminder system contrasts are shown in Table 34. (Reminder systems in Table 34 are listed in decreasing order of associated belt use rates. Significant belt use rate differences between system pairs were indicated by ‘>’.) The detailed characteristics of single-cycle sound, icon, and text durations and maximum frequencies for SIMP = 7, SIMP = 8, and other are shown in Table 35.
44

Table 34. Significant reminder system contrasts Reminder System 8 2 5 7 Base
SIMP8 * - - - >
SIMP2 * - - >
SIMP5 * - >
SIMP7 * -
Base *
Table 35. Average reminder system characteristics for systems SIMP = 7, 8, and other
0
1
4
Freq
0.0
1.5
6.9
SIMP _FREQ_ SCSNDDUR SNDMaxFreq SCICNDUR ICNMaxFreq SCTXTDUR TXTMax
Not 7 or 8 2481 13.45 4.44 170.11 5.98 0.00
7 178 3.00 1.51 0.00 0.00 27.00
8 69 18.03 9.57 15.93 56.23 17.74
The main findings were:
• Best systems. The reminder system with the highest passenger belt use rate, SIMP = 8, has the longest average single-cycle sound duration and the highest maximum sound frequency.
• Average systems. The reminder systems with neither the lowest nor the highest passenger belt use rates have the longest single-cycle icon duration and a maximum icon frequency of 5.98.
• Worst systems. The reminder system with the lowest passenger belt use rate, SIMP = 7, has very short average single-cycle sound duration, zero length single-cycle icon duration, and a single-cycle text duration of 27 seconds with a maximum text repeat frequency of 1.51.
It is reasonable to conclude that sound is the most effective reminder, followed by icons, and text is the least effective. Long single-cycle durations and high maximum repeat frequencies also increase passenger belt use.
45

3.3.5 Effects of Individual ESBR Characteristics Logistic regression analysis was conducted to determine the effect on belt use probability of the individual ESBR characteristics of Sound, Icon, and Text. The logistic regression parameter and the corresponding odds ratio estimates and chi-square significance tests are shown in Table 36 for the maximum frequencies and single-cycle durations of individual ESBR characteristics representing icon displays, text messages, and sound signals.2 Estimates are presented separately for three groups: all drivers, drivers with passengers, and passengers. The findings are as follows:
• Sound. Maximum sound signal frequency is associated with belt use increase in all three groups, and significantly so for all drivers and for drivers with passengers. Single-cycle sound signal duration is associated with belt use increase in all three groups, but the statistical significance for the effect was reached for all drivers only.
• Icon. Single-cycle icon display duration is significantly associated with belt use increase in all three groups. Maximum icon display frequency is not significantly associated with belt use change in any of the groups.
• Text. For text messages, neither single-cycle duration nor maximum display frequency was associated with a statistically significant belt use change in any of the three groups.
2 The numeric values of a logistic regression parameter estimate scales inversely with the characteristics scale of measurement. The number of passenger observations was smaller than the total number of drivers and sample size affects statistical significance.
46

Table 36. Odds ratio estimates and chi-square significance tests for individual ESBR characteristics representing icon displays, text messages, and sound signals
Variable*, ** Occupant
Estimate
Sum
-0.0001
Standard Error
Sum
0.0028
Wald Chi-
Square
Sum
0.0010
Pr > Chi-Square
Sum
0.9753
Odds Ratio
Estimate
Sum
0.9999
Lower 95% Confidence Limit for
Odds Ratio
Sum
0.9944
Upper 95% Confidence Limit for
Odds Ratio
Sum
1.0054 ICNMaxFreq All drivers
Drivers with passengers 0.0025 0.0059 0.1854 0.6668 1.0025 0.9911 1.0141
Passengers 0.0078 0.0068 1.2984 0.2545 1.0078 0.9944 1.0213
SCICNDUR All drivers 0.0004 0.0002 6.2581 0.0124 1.0004 1.0001 1.0007
Drivers with passengers 0.0012 0.0003 14.3435 0.0002 1.0012 1.0006 1.0019
Passengers 0.0011 0.0003 13.0018 0.0003 1.0011 1.0005 1.0017
SCSNDDUR All drivers 0.0039 0.0014 7.8814 0.0050 1.0039 1.0012 1.0066
Drivers with passengers 0.0042 0.0024 2.9518 0.0858 1.0042 0.9994 1.0089
Passengers 0.0030 0.0023 1.6946 0.1930 1.0030 0.9985 1.0076
SCTXTDUR All drivers -0.0018 0.0015 1.3551 0.2444 0.9982 0.9952 1.0012
Drivers with passengers 0.0011 0.0078 0.0208 0.8853 1.0011 0.9860 1.0165
Passengers 0.0054 0.0082 0.4282 0.5129 1.0054 0.9894 1.0216
SNDMaxFreq All drivers 0.0258 0.0072 12.7162 0.0004 1.0261 1.0117 1.0407
Drivers with passengers 0.0463 0.0136 11.5623 0.0007 1.0474 1.0198 1.0758
Passengers 0.0157 0.0127 1.5362 0.2152 1.0158 0.9909 1.0414
TXTMaxFreq All drivers -0.0081 0.0210 0.1501 0.6984 0.9919 0.9520 1.0335
Drivers with passengers
Passengers
-0.0360
0.0247
0.0401
0.0450
0.8035
0.3009
0.3701
0.5833
0.9647
1.0250
0.8917
0.9384
1.0436
1.1196 *SCSNDDUR, SCICNDUR, SCTXTDUR = Single-cycle durations (seconds) of sound, icon, and text.
**SNDMaxFreq, ICNMaxFreq, and TXTMaxFreq = maximum single-cycle frequencies (number of repetitions of warning cycles before time out) of sound, icon, and text.
47

3.4 Conclusions The initial analysis (described in Section 2 of this report) found that ESBR systems are associated with increased seat belt use of about 2 to 4 percentage points above usage rates for vehicles with the base system consisting of a seat belt icon and brief warning sound. Such a change is quite meaningful considering the number of occupants and vehicle miles of exposure that are affected.
The additional analyses (described in Section 3 of this report) augment the initial analysis by estimating the effects of reminder systems and components that could affect belt use with additional data and a larger set of independent variables. The effects of significant model parameters were summarized using odds ratios. A summary of the most important findings from the additional analyses follows:
Drivers
• Best systems. The reminder system with the highest driver belt use rate, SIMP = 5, has the longest average single-cycle duration and the highest maximum sound frequency.
• Average systems. The reminder systems with neither the lowest nor the highest driver belt use rates have the longest single-cycle icon duration and a maximum icon frequency of 4.06.
• Worst systems. The reminder system with the lowest driver belt use rate, SIMP = 7, has very short average single-cycle duration, zero length single-cycle icon duration, and a single-cycle text duration of 27 seconds with a maximum text repeat frequency of 1.49.
• Components. Sound is the most effective reminder, followed by icons, and text is the least effective. Long single-cycle durations, and high maximum repeat frequencies also increase driver belt use.
Drivers with passengers
• Systems. Driver belt use rates increased with belt use reminder system in the sequence (from lowest to highest): SIMP = Base, 7, 2, 8, 5.
• Components. Sound is the most effective reminder, followed by icons, and text is the least effective. Long single-cycle durations and high maximum repeat frequencies also increase driver belt use.
Passengers
• Best systems. The reminder system with the highest passenger belt use rate, SIMP = 8, has the longest average single-cycle sound duration and the highest maximum sound frequency.
• Average systems. The reminder systems with neither the lowest nor the highest passenger belt use rates have the longest single-cycle icon duration and a maximum icon frequency of 5.98.
• Worst systems. The reminder system with the lowest passenger belt use rate, SIMP = 7, has very short average single-cycle sound duration, zero length single-cycle icon duration,
48

and a single-cycle text duration of 27 seconds with a maximum text repeat frequency of 1.51.
Individual ESBR components (for all groups)
• Sound. Maximum sound signal frequency is associated with higher belt use rates in all three groups, and significantly so for all drivers and for drivers with passengers. Single-cycle sound signal duration is associated with higher belt use rates in all three groups, but the statistical significance for the effect was reached for all drivers only.
• Icon. Single-cycle icon display duration is significantly associated with higher belt use rates in all three groups. Maximum icon display frequency is not significantly associated with belt use change in any of the groups.
• Text. For text messages, neither single-cycle duration nor maximum display frequency was associated with a statistically significant belt use change in any of the three groups.
Explanatory comments
While an attempt was made in this study to estimate the effects of specific ESBR system characteristics on belt use, the resulting estimates must be viewed as tentative. It was not possible to reach definitive conclusions about the contribution of specific ESBR system components to increased belt use for three major reasons. The typical ESBR system included a range of components, and this made it impossible to separate the features that might have had an effect on belt use from the set of coupled features that might not have had such an effect. In addition, some of the ESBR features were present in only few makes and models, and relevant sample sizes were often very small.
49
4 Summary of Key Findings
4.1 Agreement Between Studies The observational field study and the system feature study used very different methods, each with its own advantages and disadvantages. Since the only dependent measure in the observational study was seat belt use, the appropriate comparison from the system feature study is with the reported likelihood of seat belt use. Other measures from the system feature study, such as annoyance or preference, do not have an analog in the observational study. To the extent that the two studies show agreement on their overlapping research questions, one may have additional confidence in the validity of their respective findings. The observational study quantified actual belt use with various systems but, as in any such observational study, interpretation is complicated by the fact that the reminder system characteristics are confounded with other vehicle attributes and the users of each reminder system are self-selected (and therefore may differ to begin with). The statistical techniques used in analyzing the observational study account for a number of the known major vehicle and driver factors that are associated with belt use (e.g., driver age and gender, vehicle type, vehicle age) but cannot eliminate this concern entirely. In contrast, the system feature study used an experimental procedure, whereby each participant experienced all belt reminder conditions in the same vehicle. Thus, differences found among systems are attributable to the system features and are not confounded by driver or vehicle factors. However, this method also suffers limitations: it measures self-reported likelihood of seat belt use, not actual use; it does not provide a direct estimate of actual belt use rates; the research participants may not be representative of the actual driving population; and participants do not experience the systems under the range of real-world conditions under which seat belt use takes place.
Qualitatively, the two studies are in generally good agreement on the relative effectiveness of seat belt reminder systems and system attributes. Table 37 lists a number of aspects of ESBR systems that were addressed in both the observational study and the system feature study. Capsule descriptions of the general findings are presented for the observational study and for the on-road system ratings and/or the stationary vehicle display element ratings of the system feature study. The final column of the table summarizes the degree of agreement between the two studies. Note that the “findings” as used for this table are qualitative and not always based on statistically significant differences. Also, in some cases the conclusions are based on inferences about the effects of some factor based on the performance of systems that share common characteristics. This is not as strong a conclusion as when the individual attribute was experimentally manipulated in a controlled manner. In this sense, various findings must be considered tentative, but they are useful here for comparing the outcomes of the two very different research methods.
50

Topic
Observational Study System Feature Study
AgreementObserved Belt Use Rates On-Road System Ratings
Stationary Vehicle Display Ratings
General benefit of ESBR
All ESBR systems, with a single exception, had higher “all driver” belt use rates than the Base system (10 of 11 “detailed” ESBR types and 4 of 5 “simple” ESBR types); the only exception may be due to a confound with vehicle type.
All five ESBR systems tested received higher likelihood of belt use ratings than the base system. This was true for both ratings made while driving and for the post-drive ratings.
Agreement that ESBR systems in general are associated with greater likelihood of seat belt use.
Visual-only displays
The category of ESBR systems that use only visual displays (enhanced icon) showed only moderately higher belt use rates than the base system (89.5% versus 86.3) and lower rates than systems using sounds.
The ESBR system that used only a visual display (continuous flashing icon) was rated only marginally more likely to promote belt use than the base system, and was rated substantially lower than systems using sound.
Visual displays were rated as less effective than auditory (sounds or speech) displays. The visual displays rated most effective only achieved the level of the least effective auditory displays.
Agreement that visual displays, by themselves, are not very effective, even if they are of long duration and flashing.
Temporal aspects of enhanced displays
The duration of the sound and the maximum repetition rate of the sound were associated with higher belt use rates.
The “Periodic” and “Aggressive” reminder systems differed in that the Periodic system cycled through the reminder sequence three times (total reminder period of 2 minutes), while the Aggressive system
The studies agree in suggesting the importance of the duration that the enhanced reminder system remains in effect, as well as the repetition rate of the cycle. In both cases, the inference is drawn based on general system characteristics, but there are confounds with other specific
Table 37. Agreement of findings between the observational study and the system feature study
51

continued to cycle throughout the drive. The Aggressive system’s effectiveness was rated substantially higher. The Periodic system was rated very similar to the “One Long Reminder” system, even though the total duration of sound-on time was much longer for the One Long Reminder system (18 s versus 30 s).
system features. For example, the comparison of the Periodic and Aggressive systems was confounded by the fact that the Aggressive system also included an additional visual text display on the console. The comparison of the Periodic system and One Long Reminder system was confounded by the use of different sounds (chime or beep).
Flashing versus steady displays
The ESBR category with flashing icon only had higher belt use rate than the category with steady icon only (90.8% versus 87%). However, findings were ambiguous when the comparison was made for conditions that also included sound (DETL4 versus DETL5, DETL10 versus DETL11), with one estimate in each pair being unreliable because of small sample size.
Flashing visual displays were rated higher than their steady counterparts (for icons, text, console displays).
Agreement that flashing visual displays are more effective than steady displays, at least when used alone.
Text versus icon displays
The effect of providing text was ambiguous and complicated because for every comparison at least one estimate for a detailed system was unreliable due to small
Dashboard text messages were rated higher than dashboard icon displays, for steady displays, flashing displays, and bright displays. Center console
The two studies did not reach the same conclusion about text messages. However, in the observational study, many of the estimates were unreliable and the differences in belt use rates
52
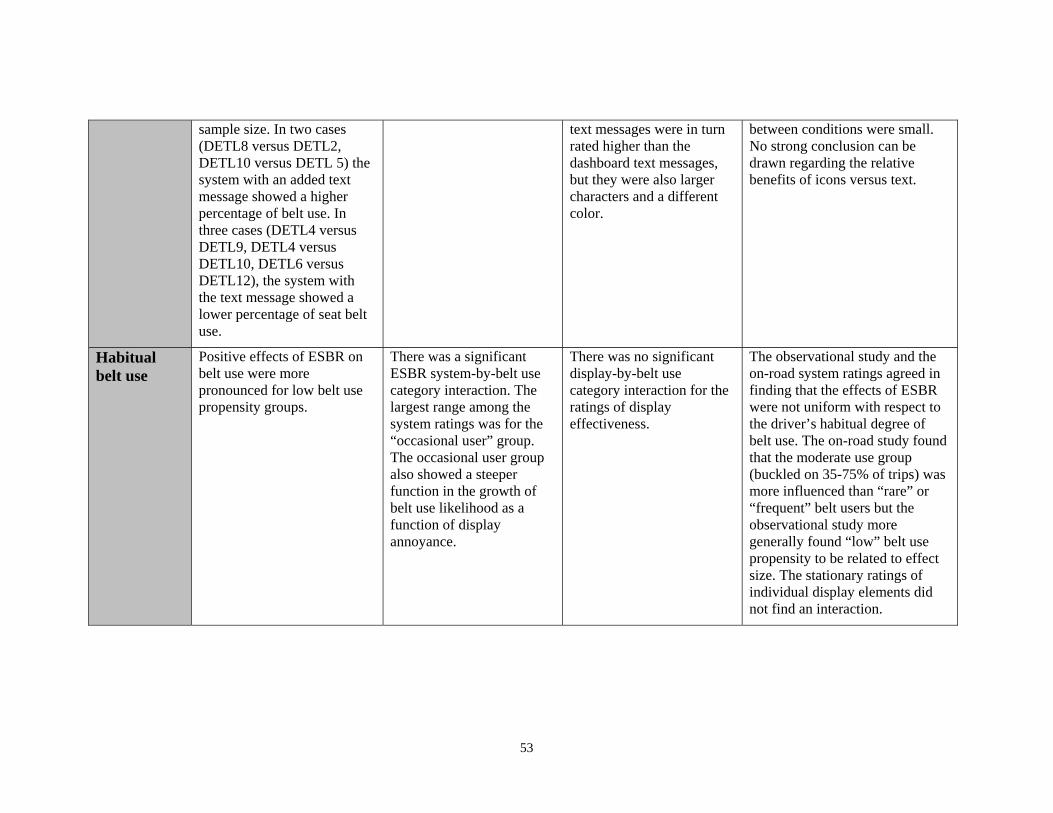
sample size. In two cases (DETL8 versus DETL2, DETL10 versus DETL 5) the system with an added text message showed a higher percentage of belt use. In three cases (DETL4 versus DETL9, DETL4 versus DETL10, DETL6 versus DETL12), the system with the text message showed a lower percentage of seat belt use.
text messages were in turn rated higher than the dashboard text messages, but they were also larger characters and a different color.
between conditions were small. No strong conclusion can be drawn regarding the relative benefits of icons versus text.
Habitual belt use
Positive effects of ESBR on belt use were more pronounced for low belt use propensity groups.
There was a significant ESBR system-by-belt use category interaction. The largest range among the system ratings was for the “occasional user” group. The occasional user group also showed a steeper function in the growth of belt use likelihood as a function of display annoyance.
There was no significant display-by-belt use category interaction for the ratings of display effectiveness.
The observational study and the on-road system ratings agreed in finding that the effects of ESBR were not uniform with respect to the driver’s habitual degree of belt use. The on-road study found that the moderate use group (buckled on 35-75% of trips) was more influenced than “rare” or “frequent” belt users but the observational study more generally found “low” belt use propensity to be related to effect size. The stationary ratings of individual display elements did not find an interaction.
53

As the table indicates, there was good agreement on the association of a greater likelihood of seat belt use with ESBR systems in general and the importance of including an auditory component to the system. Systems that have frequent periodic reminders and more extended reminder program durations appear to have higher rates of belt use. The studies agree in finding more effect for flashing than steady visual elements, at least when they are the primary display components. There was not agreement in the relative benefits of text versus icon visual displays, but there were data limitations in both studies that make comparisons problematic. Both studies also suggest the ESBR system may have more influence on drivers with relatively low belt use rates, although the system feature study indicated that “occasional” seat belt users were more influenced than “rare” seat belt users.
The two studies may also be compared quantitatively. In the on-road portion of the system feature study, five prototype reminder systems were evaluated. These systems may be mapped against the system groupings that were defined for the observational study. The five prototype systems matched four of the observational study simple category groups and five of the detailed groupings. Table 38 shows this mapping. Although the limited number of reminder systems constrains the degree to which the studies can be compared, it is possible to correlate the measures of system effectiveness in promoting belt use for the two studies.
Table 38. Reminder system categories for the prototype systems used in the system feature study
Prototype Reminder System Observational Study Groupings
Name Simple Categories Detailed Categories
System 1 Basic Reminder Base Base
System 2 Continuous Flashing 2 3
System 3 Periodic Belt Reminder 5 5
System 4 Aggressive Belt Reminder 8 11
System 5 One Long Reminder Phase 5 7
To compare the findings of the studies, two measures of reminder system effectiveness were used from the system feature study. These were: (1) the mean of the four on-road ratings of the likelihood of buckling up; and (2) the post-drive rating of how effective the system would be in getting the participant to buckle up for the situations in which the participant is most likely to be unbuckled. Three measures of belt use rate were used from the observational study. The “all drivers” observations were used for these analyses. The measures were: (1) the observed percentages of belt use for 1998-2005 vehicles (from Table 17); (2) the odds ratio (from Table 19); and (3) the mean of the six age/gender category belt use rates for the counterfactual model (from Appendix B). The third measure was used because it paralleled the experimental design of the system feature study, in which there were equal numbers of participants in each age/gender category (although the age group definitions differed some in the two studies). The odds ratio and counterfactual model findings are only applicable for the “simple” ESBR categories, while the observed belt use rates are applicable for both detailed and simple ESBR system categories.
54

Table 39 shows the correlations between the observational study measures and the on-road experiment measures.
Table 39. Correlation of on-road experiment “likelihood” measures with “all driver” belt use indices from the observational study
Detailed ESBR System Categories Simple ESBR System Categories
On-road experiment measure
Observed percentage of belt use
Observed percentage of belt use
Odds ratio
Mean of counterfactual age & gender belt use rates
Mean on-road rating 0.757 0.912 0.941 0.922
Post-drive rating 0.751 0.892 0.988 0.975
The correlation of the on-road experiment ratings with the observed belt use rates for the various detailed belt reminder system categories used in the observational study was moderately good, with r = 0.75 for either rating type. However, the number of observations for some of the detailed systems was small (particularly for System 11), and confounds with vehicle characteristics are probable. Furthermore, correlations could not be computed for the alternative measures of the odds ratio and the counterfactual estimates. When the correlations are based on the observed belt use rates for the broader simple system categories, the correlations were substantially higher: r = 0.912 for the mean on-road ratings and r = 0.892 for the post-drive ratings. When the analytic techniques of the observational study analysis are used to eliminate the effects of key confounding factors, the results of the two studies are in very strong agreement. As seen in Table 39, the various correlations ranged from r = 0.922 to r = 0.988. Thus although the quantitative comparisons are limited to only five seat belt reminder systems, the degree of agreement between the studies is exceptionally strong. Figure 10 illustrates the relationship in scatterplot form, for the comparison of the post drive ESBR system ratings and percent belt use rates based on averaging counterfactual estimates for age/gender groups. This may be the most direct basis for comparison of the two studies, since the age and gender composition of the comparison groups are most similar. The strength of the linear relationship is evident, with the on-road system feature experiment ratings very closely predicting observed belt use rates.
55

89.0
89.5
90.0
90.5
91.0
91.5
92.0
92.5
Cou
nter
fact
ual %
Bel
t Use
1 2 3 4 5 6 7 8
Post Drive Rating
Figure 10. Scatterplot of post-drive ESBR system ratings and percent belt use rates based on averaging counterfactual estimates for age/gender groups
4.2 Integrated Findings This section provides an overview listing of key findings from the two studies. The findings are organized under the headings of ESBR system effectiveness, system features, annoyance and acceptability, and driver characteristics.
4.2.1 Enhanced Seat Belt Reminder System Effectiveness • The enhanced reminder systems evaluated in the two studies generally increased actual or
likely belt use above the level with the base system. Ten of the 11 “detailed” ESBR system categories in the observational study had observed belt use rates greater (though not necessarily statistically significant) than that of the base system.
• The increased belt use rates are seen with reference to all drivers, for only those drivers with passengers present, and for passengers.
• The various enhanced systems differed among themselves in effectiveness. The observed driver belt use rates for the five simple ESBR categories ranged from 82.8 percent to 92 percent. Observed rates for the detailed ESBR categories ranged up to 97.8 percent, but estimates were often not reliable due to small sample sizes. For passengers, the range for the simple categories was 86.0 percent to 92.8 percent and the range for the detailed categories was 80.0 percent to 100 percent.
• Systems with only visual enhanced reminders were not particularly effective. The simple ESBR category with a visual ESBR only had an observed driver belt use rate of 89.5
56

percent, versus 86.3 percent for the base system. While an increase of about 3 percent is meaningful, it is small relative to the 4- to 5-percent increases associated with some other categories. The on-road rating study also found the visual-only system less effective. Based on the linear relationship of the two studies (Figure 10), the associated increase in belt use rate would be less than 1 percent for the continuous flashing icon system, compared to projections of several times that for other systems tested.
• The more effective systems led to quite substantial increases in belt use rates. For some systems, the “all driver” or passenger observed belt use rates went up over 5 percent compared to the base system, accounting for one-third or more of the baseline system unbuckled occupant rate.
• The model-based belt use probability estimates suggest stronger benefits for certain driver groups. For example, the model suggests an increase in belt use with the better systems of about 7 percent for young male small truck drivers in Florida, compared to essentially indiscernible changes for adult minivan drivers in California.
• The model-based belt use probability estimates suggest especially large benefits for certain passenger groups. For example, the projected increases in belt use are about 20 percent for some ESBR systems for young male passengers in Florida.
• The greatest increases in the likelihood of belt use are for the most “aggressive” systems, which combine multiple display modalities, frequent repetition rates, and long duration of the ESBR component.
4.2.2 System Features Related to Enhanced Seat Belt Use Temporal aspects
• High repetition rates and longer periods in which the ESBR remained in effect were associated with higher belt use rates.
• In the on-road drive experiment, the system that continued to cycle auditory/visual reminders throughout the drive was rated as more effective than systems that cycled for a limited number of times.
Display modality
• Auditory displays are more effective than visual displays. Although there is a considerable range of perceived effectiveness among alternative auditory displays and among alternative visual displays, there is little overlap between their ranges. The most highly rated visual displays only reached the level of the lowest rated auditory displays.
• There was no notable or consistent difference among the effectiveness ratings of speech messages and non-speech auditory signals.
Visual display characteristics
• Flashing displays are more effective than steady displays.
• Brighter displays are more effective than normal-brightness displays, but flashing appears to be more effective than brightness changes.
57

• Large center console displays were rated as more effective than dashboard displays (location and display size covaried).
• The relative effectiveness of text displays versus icon displays was ambiguous and was inconsistent between the observational study and the system feature study.
• A commonly expressed opinion about the “best” way to present visual reminders was for a system that gets progressively more intense (brighter or higher flash rate) as time goes on.
Auditory display characteristics
• Fast repetition rates were rated more effective than slower repetition rates.
• Loud displays were rated as more effective than normal volume displays.
• There appear to be minimal effects of speaker gender or voice tone for voice messages.
• The highest rated auditory display elements for effectiveness were chimes presented at either a fast repetition rate (2.5 Hz) or a higher volume (90 dB(A)).
4.2.3 Annoyance and Acceptability • Annoyance is strongly related to the perceived effectiveness of the system/display.
• While there is good consensus among participants on how annoying a system or display is, there is not good consensus on the systems or features that are most desirable or preferred. Some participants rate highly effective/highly annoying systems or features as the most preferable, while others rate these as least preferable.
• Auditory displays are more annoying than visual displays. Although there is a considerable range of rated annoyance among alternative auditory displays and among alternative visual displays, there is little overlap between their ranges. The most annoying visual displays only reached the level of the least annoying auditory displays.
• Voice messages were generally rated as less annoying than the non-speech sounds used in the study.
• A majority of participants were favorable about the idea of allowing some degree of customization of reminder sounds.
4.2.4 Driver Characteristics • Drivers who rarely wear seat belts judge a given display as less effective than occasional
seat belt users, who in turn judge it as less effective than frequent seat belt users. These differences are large enough so that the rated effectiveness of the most effective displays for the rare seat belt users corresponds to about the same ratings of effectiveness that frequent belt users give to the least effective displays.
• The influence of belt reminder system characteristics on the likelihood of seat belt use appears stronger for lower belt use groups than for frequent belt use groups. The system feature study found that the effect of the reminder system was largest for the occasional seat belt users. For the less effective systems, the occasional users rate likelihood similar
58

to the ratings of the rare belt users; for the more effective systems, their ratings are more similar to those of the frequent belt users. The observational study found that the positive effects of ESBR on belt use were more pronounced for the low belt use propensity groups.
• Rare seat belt users rate a given system or display feature more annoying than do occasional seat belt users, who in turn rate them more annoying than frequent seat belt users.
• The growth of perceived effectiveness as a function of annoyance may be steeper for occasional seat belt users than for rare or frequent seat belt users. This was observed for ratings of ESBR systems, but not for ratings of individual display elements.
• Rare seat belt users found the initial phase of reminder systems less attention-getting than other seat belt use groups. This was not the case for later stages of enhanced reminder systems.
• Rare seat belt users are substantially more willing to pay to (legally) remove reminder systems from their vehicles. Although the data are for hypothetical situations, the percentage of rare seat belt users who say they would be willing to pay to remove a system is quite high (average of 41 percent across the various systems studied).
• The observational study found that females had higher belt use rates than males and belt use increased with age, for both drivers and passengers.
• While there were no strong overall effects of age or gender in terms of reminder display perceived effectiveness or annoyance, such effects appear more substantial for auditory than visual displays.
• Observed belt use rates were lower for drivers at shopping malls or shopping centers than at other sites (office parks, parking lots, sports arena, other).
59

5 Characteristics of Optimal ESBR Systems
5.1 Features Associated With High Seat Belt Use Both the observational study and the system feature study found that ESBR systems in general promoted greater seat belt use. Beyond this, certain features of systems were associated with greater improvements. Systems using only visual displays were not as effective as systems using a combination of visual and auditory features. The observational study found that a combination of sounds and icon, high repetition rate, and a long enhanced reminder period were associated with higher rates of belt use. The on-road evaluation of model systems in the system feature study confirmed the importance of the auditory component of the display and the benefits of an extended enhanced warning period over one that only remained in effect for a limited number of cycles.
Additional findings on effective features come from the direct comparison of display elements in the system feature study. Although there was a range of rated effectiveness for both auditory and visual displays, auditory displays were rated more effective than visual displays. Features of auditory displays that contribute to higher rated effectiveness include a faster repetition rate and louder volume. There was no overall difference between speech messages in general and non-speech auditory signals in general. There were no meaningful effects of speaker gender and voice tone for the voice messages. Of the set of auditory signals tested, the ones rated most effective were the slow chime at the louder volume, the fast chime at normal volume, and the male warning voice at the louder volume.
While the visual displays were only rated moderately on the scale of effectiveness, some features clearly contributed to greater effectiveness. Both flashing and greater brightness increased the rated likelihood of seat belt use. Flashing appeared somewhat more effective than increasing the brightness, as used in this study. Text displays were rated as more effective than icon displays, although the observational study suggested the opposite. The visual display that was rated highest in effectiveness was the center console display with the urgent, flashing message.
5.2 Annoyance and Acceptance The system feature study collected subjective response data on the annoyance and the acceptability of ESBR systems and display elements. The strong observed correlation between system effectiveness and annoyance creates challenges for designing a system that both increases seat belt use and is generally acceptable to the driving public and the vehicle purchaser. The correlation of on-road system ratings of annoyance and effectiveness was r= 0.97. The correlation of stationary vehicle ratings of display element annoyance and effectiveness was r=0.94. This close coupling means that it will be difficult to identify a visual or acoustic display element that is highly effective but not very annoying. To further complicate the issue, annoyance and acceptability are themselves not well correlated, at least in terms of group mean ratings. Some individuals rated annoying systems as quite acceptable, because they feel these can motivate compliance. Others rated annoying systems or features as quite undesirable. Furthermore, in terms of public response or consumer acceptance, simply finding a system that is acceptable to a “typical” user may not be adequate. A small but vocal minority who will find a system objectionable could damage public or political acceptability. Furthermore, highly annoyed people might remove or defeat ESBR systems, resulting in less overall safety benefit.
60

The drivers who are most annoyed, and who are most likely to remove or defeat systems, are also those who are likely to have the most exposure to the ESBR displays. The system feature study found those participants who reported the lowest rates of seat belt were also most annoyed by the displays and were much more likely to act to have the hypothetical systems removed. At the same time, rare seat belt users required a system or display to be considerably more annoying in order to achieve a given level of effectiveness.
The features that make an ESBR system annoying are virtually a parallel image of the features that make it likely to be effective in promoting belt use. Visual displays are considerably less annoying than sounds or voice messages. Voice messages were rated somewhat less annoying than sounds (chimes, beeps). Flashing displays were more annoying than steady ones and bright displays were more annoying than normal brightness. Loud acoustic displays were more annoying than normal loudness and fast repetition rates were more annoying than slow rate. Text messages were more annoying than icons. The general relationship of annoyance and effectiveness is not surprising, but the hope is that there are some display elements for which there is a relatively small increment in annoyance for a given increment in effectiveness. Some features were identified as potentially preferable in this sense, but none of the differences were dramatic.
There are several strategies for minimizing annoyance while maintaining effectiveness. As noted, one approach is to find acoustic or visual displays that, while they may produce some annoyance, produce less annoyance to achieve a given level of effectiveness than alternative displays. For the displays included in this study, the benefits are somewhat marginal, but still may be worth exploiting. In particular, a fast chime appears less annoying than a loud chime or a fast beep or the “high urgency” sound, in order to be comparably effective. Also, for the occasional belt use group (which may be the group most susceptible to ESBR effects), some center console and male voice displays appeared relatively effective, for their degree of annoyance. Other studies in the literature that more specifically target the annoyance attributes of a wide array of warning sounds might help identify specific sounds that optimize the benefits for a given degree of annoyance. Tan and Lerner (1995) identified certain candidate sounds as good warning alternatives because of their relatively low annoyance relative to other attributes, such as urgency, appropriateness, and conspicuity. More recent work by Lee and his colleagues (e.g., Marshall, Lee, & Austria, 2007) has focused on acoustic stimulus dimensions that differentially influence subjective response dimensions of urgency and annoyance. Such systematic research may point to the most promising sounds or visual displays, but this appears to be only a partial answer to the problem of annoyance.
Another approach, which may have greater potential, is to design the system so that the increase in annoyance is incremental and the greatest levels of annoyance are only experienced after longer periods or more serious conditions of seat belt nonuse. This strategy is explicit in some proposed model approaches (discussed in Section 5.3) and evident in some current reminder algorithms. Shortly after ignition, or before the vehicle has traveled far or reached higher speeds, the display is viewed as a “reminder” and thus does not need to motivate compliance. However, as the driving sequence progresses, the effectiveness of the display no longer comes from reminding the driver, but rather motivating him or her to act. Therefore the display becomes more aggressive, but only if it is needed. Of course, it is the rare seat belt users who will most frequently experience the aggressive displays, and these are the people who are least willing to accept the annoying displays. Also, the system feature study found rare seat belt users rated the
61

initial phase of reminder systems as less attention-getting than other groups, so they may have less benefit from this strategy.
An interesting strategy that has been raised but, to our knowledge, never evaluated is the concept of allowing drivers to select or customize their reminder sound(s). This might result in more acceptable reminders and perhaps even more personally salient ones. It is interesting to note that when asked about the option of customizing the reminder sound, participants were in favor of the idea (about 60% thought it a good idea, 27% thought not). However, there are some concerns with this approach. It could conceivably lead to some abuse of the system, such as some drivers not wearing their seat belts because they want to hear the sound or display it to others. It could lead some people to select sounds of low salience that could be easily ignored, if there were no constraints on what could be customized. Since a customized display is also by definition not a standardized one, it could also lead to confusion if an unfamiliar driver is operating the vehicle. However, since the current enhanced reminders also are not standardized from vehicle model to vehicle model, this may not be a new concern. Some form of reminder display customization may be an interesting idea to explore, especially for rare seat belt user acceptance, but its potential effectiveness is unclear.
A final, and perhaps controversial, approach to dealing with annoyance and acceptance is to allow the vehicle owner/driver to have some latitude to disable the reminder system, or some aspect of it, for either individual trips or indefinitely. It might also be possible to disable the seat belt reminder system for a particular driver, in the same way that some current vehicles store in memory preferred seat positions for multiple drivers. Presumably this would most often be taken advantage of by consistent, intentional non-users of seat belts or by occupants who deliberately wish to not use a seat belt for a particular trip. System design options might include the ability to disable all, or only some part, of the system (e.g., highest level of warning); long-term or individual trip decisions; choice of seat locations to exclude from warning; and the means of disabling the system (difficulty; owner, driver, or dealer). The European New Car Assessment Programme (Euro NCAP, 2004) seat belt reminder assessment protocol specifically states “To avoid the danger that dedicated non-users would try to tamper with the system, it should be possible for it to be deactivated. Long-term deactivation would cover this requirement. The system could also incorporate short-term deactivation for individual journeys.” If a vehicle owner or driver is allowed to disable the enhanced reminder, either transiently or permanently, then obviously the motivational (as opposed to the reminder) aspect of the system is weakened, but as a consumer choice. If some intentional response is required to disable a system on a given trip, then clearly the non-use is not attributable to forgetting, but rather is intentional. The degree of latitude given to vehicle owners or drivers is a policy decision and it is not known to what extent drivers would make use of this option. It might represent a means of limiting public complaint from a small but vocal group of dedicated non-users of seat belts. If any provision is made for allowing users to disable ESBR functions, this still should not allow them to disable the basic reminder system, or probably even enhanced displays aimed at improving the early reminder aspect of the sequence.
62

5.3 Approaches Suggested in the Literature Various approaches to ESBR system design have been suggested in the literature. Four suggestions are described here: graded displays; improved message timing; passenger displays; and various types of interlocks.
Graded displays
One common strategy for various proposed, prototype, and actual product ESBR systems is to increase the intensity of the warning as a function of time and/or speed and/or distance traveled. In this way, the most intrusive and annoying displays are only experienced by those few occupants who have not responded to earlier, more moderate reminders. Typically the initial enhanced warning aspect does not start until some time after the basic warning. The enhanced portion may also be staged from that point, increasing in frequency, volume, or qualitatively. Speed may be part of the algorithm, in two ways. First, there may be some minimum speed below which the reminder system does not activate; this prevents nuisance displays when the vehicle is stopped or operating in low-speed locations other than roadways. Second, the intensity of the display may be linked to speed itself. For example, the Australian TAC SafeCar project (Regan et al., 2005) studied a prototype system in which the repetition rate of the auditory warning increased through four levels as a function of travel speed: 0-9 km/h (flashing icon, no auditory component); 10-25 km/h (visual warning plus auditory warning every 2 seconds); 25-50 km/h (visual warning plus auditory warning every 1 second); and >50 km/h (visual warning plus auditory warning twice per second). This study reported very substantial improvements in seat belt usage. However, the comparison was with baseline and it is not known to what extent the speed-linked aspect of the display was important. One concern with speed-based warning algorithms is that for some people, seat belt use is situation-dependent and many decline to use seat belts on short, lower speed trips (Boyle & Vanderwolf, 2004; Westat, 2005). Observed seat belt use is lower in general on surface streets (81%) than freeways (89%) (Glassbrenner & Ye, 2007). Thus it might be argued that based on probability of belt use, more effective warnings are needed for low-speed trips than high-speed.
A suggested “optimal” system proposed by Eby, Molnar, Kostyniuk, Shope, and Miller (2004) is a useful example of a graded system because they make quite explicit the intended target occupant and rationale of each stage of the reminder system. They proposed a system structured on the logic that the system should be adaptive to the features that are most effective for different driver groups. They distinguish five driver groups: full-time users, part-time users due to comfort/convenience reasons, part-time users due to cognitive/personal reasons, part-time users due to low perceived risk, and full-time nonusers. Cognitive/personal part-time users were categorized as users who forget to use the seat belt or are not in the habit of wearing the seat belt. Low-perceived-risk part-time users do not wear their seat belts when driving a short distance or when not driving on public roads. Comfort/convenience part-time users were not addressed in their framework because those issues are best addressed through changes to seat belt design. Working under the assumption that these categories of users are motivated by different factors, the framework was designed to target these groups through the use of different features. Table 40 schematically summarizes the concept and design.
63

Table 40. Schematic representation of adaptive seat belt reminder system (chart is adapted from Eby et al., 2004)
Example metrics Car not started 0 seconds Start of trip
Car started, not in gear <10 mph 4-8 seconds
Car starts moving 11-25 mph 2-3 minutes
Car on patrolled roadways >25 mph 5 minutes
Seat belt use group
Full-time user Part-time user: cognitive/personal
Part-time user: low perceived risk
Full-time nonuser
Type of system engaged
No system engaged
Reminder system Annoyance system Interlock system
Driver No signal If driver not belted: user-selected signal that repeats at constant interval If passenger not belted: flashing pictograph showing seat location
If driver not belted: buzzer that increases in intensity the faster the vehicle moves If passenger not belted: flashing pictograph showing seat location
If driver not belted: a warning signal, then entertainment interlock If passenger not belted: flashing pictograph showing seat location
Passenger No signal Light or “unbelted” pictograph that flashes at a constant interval
Light or “unbelted” pictograph that flashes at a constant interval
A warning signal followed by entertainment system interlock
In this framework, different levels of intrusiveness of the system are used for each user group. The system determines the type of seat belt user operating the vehicle based on time or distance driven before the user buckles the seat belt. The system first assumes that the driver is a full-time user until some criterion is reached where it assumes that the user has forgotten to buckle up, at which point a reminder system is activated (person is classified as a cognitive/personal part-time user). It was recommended based on focus group findings that the reminder should be a flashing light or user-selectable voice message or auditory reminder that repeats at a constant interval. At some further criterion, the system assumes that the driver has chosen not to buckle up and an annoyance system is then activated (person is classified as a low-perceived-risk part-time user). A buzzer that gets more intense the faster the vehicle travels was suggested for this user group due to high annoyance ratings for this feature and the likelihood of maximizing system effectiveness. If the driver still does not buckle, the system assumes that a full-time non-user is operating the vehicle and an interlock system is then engaged which disables the entertainment system. This system is designed to eliminate annoyance for full-time users while encouraging part-time users to buckle the seat belt.
64

Improved message timing
The current FMVSS No. 208 requirement for the basic belt reminder is for a 4- to 8-second duration audible sound when the ignition is turned on and a warning light for no less than 60 seconds if the driver seat belt is not buckled. The timing of the display is not related in any way to the behavioral sequence of typical drivers as they enter the vehicle, start the ignition, and engage their seat belts. About two-thirds of drivers engage their seat belts after turning on the ignition (Malenfant & Van Houten, 2005, 2008). So for many drivers, the reminder display may be perceptually lost in the clutter of displays, sounds, and driver and passenger actions that may accompany start-up. Drivers initially may be distracted by such activities as stowing items (handbag, briefcase, computer, groceries, etc.), operating the entertainment system, adjusting the seat, clearing the windshield, and so forth. Furthermore, the normal time it takes many drivers to buckle their seat belts means that they typically buckle the seat belt after the seat belt reminder has terminated; therefore, the display does not serve as a reminder on those occasions when the driver forgets or has his or her routine disrupted. With some understanding of the way drivers time their behaviors, it may be possible to devise timing strategies that are effective without being overly intrusive. The most extensive observational data on this were collected by Malenfant and Van Houten (2005, 2008), based on recording the behavior of 1600 drivers in Pinellas County, Florida; and Halifax, Nova Scotia. Slightly less than one-third (31.4%) of the observed drivers buckled their seat belts before turning on the ignition. About 45 percent of drivers buckled after turning on the ignition but before placing the vehicle in gear, and slightly less than one-fourth (23.5%) of the drivers buckled up after putting the vehicle into gear. Roughly 80 percent of those who buckled after putting the vehicle into gear buckled after the vehicle began to move. The study also recorded latencies to buckling. For those drivers who buckled after turning on the ignition but before putting the vehicle in gear, the latency from ignition to buckling was a mean of 6.1 seconds and an 85th percentile value of 8.0 seconds. For those drivers that buckled the seat belt after engaging the vehicle in gear, the latency was timed from engaging the gear, not ignition. The mean latency from gear shift to buckling was 12.6 seconds and the 85th percentile was 19.9 seconds.
Based on these observations, some display timing strategies may be suggested. Malenfant and Van Houten (2008) suggest prompts approximately 30 seconds after the vehicle is placed in gear. We feel that this, by itself, may be rather late and many drivers may already be in traffic. Our interpretation of the data suggests an alternative timing. For the 45 percent of drivers who buckled their seat belts after ignition but before gear shift, the mean latency was 6.1 seconds and the 85th percentile was 8.0 seconds. For the approximately 23 percent who buckled up after gear shift, the latency from gear shift to seat belt buckling had a mean of 12.6 seconds and an 85th
percentile of 19.9 seconds. Malenfant and Van Houten do not report latencies from ignition time for those drivers who engaged the seat belt after gear shift. If we add an estimate of about 2 seconds as a typical time between ignition on and gear shift, then the latency from ignition for these drivers would be in the range of 14.6 seconds for the mean and 21.9 seconds for the 85th
percentile. Taken together, all of these data suggest that the initial reminder display should extend beyond 8 seconds, or that a new display should occur shortly after 8 seconds, and also another reminder should occur at around 20 seconds. This would help address the occasions of nonuse that are due to forgetting or distraction from routine. Drivers rarely buckle the seat belt more than 20 seconds after ignition or gear shift, so it may be assumed that drivers who have not buckled up by this point, despite a salient reminder, probably are intentionally not using their seat belts. More aggressive reminders are therefore probably required to address this group.
65

Passenger displays
One design issue for ESBR systems is the consideration of vehicle occupants other than the driver. Should the system provide an alert if passengers are not buckled? If so, should the alert be presented to the driver and/or the passenger? Should a belted passenger be alerted if the driver, or some other occupant, is unbuckled? There has been some reluctance to employ reminders for passengers, especially rear seat passengers, because of concerns over nuisance alarms where the seat is actually occupied by cargo or pets. However, others have suggested the inclusion of passenger displays. For example, Euro NCAP (2004) recommends both audio and visual components for both front seat positions, but rear seating signals need only be visual, and visible to both the driver and the relevant passenger. The model system proposed by Eby et al. (2004) includes passenger displays and suggests that an ideal system would consist of a diagrammatic display of seating positions with flashing lights at unbuckled locations. Certainly the observational study conducted in the present project observed benefits of ESBR systems on passenger belt use, but it is not evident to what extent that may be due to direct message effects on the passenger and to what extent it may be due to more complex social dynamics.
The social dynamic of the interaction among vehicle occupants may be a very important determinant of seat belt use for both drivers and passengers. Seat belt use rate varies as a function of the presence, number, and characteristics of passengers, in a manner that interacts with the age and gender of the driver (e.g., Nuyts & Vesentini, 2005; Williams & Shabavona, 2002). For some conditions, passengers increase the rate of seat belt use. However, under other conditions, particularly for teen peers or groups of males, seat belt use rates may be lower with passengers. One observation from Nuyts and Vesentini (2005) is that whatever the general trend of influence, “drivers and passengers often behaved the same. They both wore or did not wear a seat belt.” Nambisan and Vasudevan (2007) collected extensive observational data on driver and passenger seat belt use over a three year period for 50 sites in Nevada. Seat belt use by drivers and passengers was not independent and the effects were quite large. Under various conditions (age and gender mixes, rural/urban, etc.), when the driver was belted, the observed rate of belt use for passengers was usually over 90 percent. When the driver was unbelted, the observed rate of belt use for passengers was usually under 35 percent. While observational studies do not establish causality or the direction of influence, such findings certainly suggest that motivating one occupant to buckle up may help induce the other occupants to buckle up as well.
Some research has documented the reluctance of vehicle occupants to comment on the safety behavior of other occupants, and in particular of passengers to say something to the driver (Ulleberg & Must, 2005). It should be kept in mind that seat belt reminder systems will operate within this social context, and in turn may influence it. Reminder displays that are perceivable by all occupants may provide an opportunity for communication among them and a justification for prompting seat belt use. Displays that specify the unbelted user(s) might promote this. However, social stigma or annoyance of all occupants might also limit consumer acceptance. The general point here is that the social dynamic of occupant interaction should be given consideration in the design and evaluation of reminder systems. Effects on seat belt use and acceptability seen for unaccompanied drivers may not be representative of various passenger situations.
66

Various types of interlocks
The focus of the research in this project has been on visual and auditory displays presented to the driver and perhaps other vehicle occupants. Another approach is to use an interlock which prevents some vehicle function from operating when the seat belt is not engaged. Mandatory ignition interlock systems were required in the 1970s and the resulting public outcry led Congress to prohibit the further use of such devices (Transportation Research Board, 2003). Another approach that has been experimentally examined is the use of a gear shift interlock delay. Van Houten, Malenfant, Austin, and Lebon (2005) conducted a small study (five van drivers, from a university campus maintenance group or a department of transportation) in which the time between applying the brake and the time the vehicle could be shifted into gear was programmable over a range of 1-20 seconds. The programmed delay was only in effect if the driver was not belted. Delays led to increases in belt use, and longer delays led to greater belt use, but the results varied among individuals and were not always maintained over time.
One complaint about interlocks and delays heard in focus groups is that drivers have security concerns. They feel there may be situations in which they need to move quickly and do not want to be constrained to put on a belt in these situations.
There have also been suggestions that non-essential vehicle features, such as the entertainment system, be locked out if the driver is unbuckled. No empirical evaluation of this concept was found. However, this strategy may become increasingly less effective as nomadic devices, such as portable media players, become more ubiquitous. There is a risk that determined non-wearers of seat belts might use portable entertainment devices that are less well-designed for operation while driving than the original equipment in the vehicle.
5.4 Recommended System Characteristics ESBR systems have demonstrated benefits in increasing driver and passenger seat belt use rates. Enhancing seat belt reminder systems beyond the minimum FMVSS No. 208 requirement is strongly recommended. Based on the findings of this project, as well as other literature, we suggest that an ESBR system have the characteristics that follow. These recommendations include general characteristics as well as more specific best-judgment attributes based on the available findings.
• The display includes both visual and auditory components.
• The display is graded so that initial phases serve as effective, but not highly annoying, reminders. Later phases are more aggressive.
• An enhanced reminder signal, distinct from the mandatory FMVSS No. 208 display, should occur beginning about 8 to 10 seconds following engine ignition. The function is to provide a reminder shortly after the period when most drivers who buckle after ignition should have already buckled. The reminder should include a visual component and a low-annoyance acoustic component (sound or voice).
• A somewhat more aggressive signal should occur once (single-cycle) after the point at which nearly all drivers who are going to buckle up have done so. A good estimate of this is about 20 seconds after ignition (regardless of whether the vehicle is in gear or in motion). Drivers at this point may still be assumed to have forgotten or been distracted from seat belt use, but not necessarily actively resistant.
67

• Drivers who do not respond to the 20 second reminder should receive a flashing visual display and high-repetition rate sound and/or voice message at periodic intervals (e.g., 5-6 seconds of signal, every 30 seconds, as in detailed system DETL5). This should continue indefinitely until the seat belt is buckled. The timing algorithm should be interrupted while the vehicle is stopped or moving below 3-5 mph.
• We do not suggest that the signal characteristics be tied to travel speed (above the minimum onset level), since seat belt use tends to be lower on low-speed local trips and therefore also requires adequate motivation to buckle up. The signal intensity should be effective at all speeds.
• A center console display may be a salient place to present visual displays, both because of its location and because it may allow larger size icons or text. It may also permit a diagrammatic display of belt use by seat location.
• The driver should receive an indication when a passenger is not buckled.
• A visual display should be visible to an unbuckled occupant in any seating position. We suggest that displays intended for passengers continuously flash for greater effectiveness, provided the flashing is not visible to drivers. If flashing or audible to drivers, passenger displays might be overly annoying or distracting to drivers, given that they might not be able to control the passenger’s belt use or that the signal might be a false alarm due to cargo or pets. Therefore it is not evident that having a driver-perceptible passenger display continually flash, or be audible, would be acceptable.
• Consideration should be given to driver-selectable reminder sounds (within constraints), for the initial stages of the ESBR. These may be highly salient for individuals, but not excessively annoying, and thus serve as effective reminders. However, selectable signals should not be permitted for the latter stages of the ESBR sequence, where motivational aspects of the signal are paramount. The concept of driver-selected reminders was favorably viewed by research participants in this project but has not been evaluated and any implementation of this approach should preclude rewarding aspects of failure to buckle the seat belt.
• The ESBR system should not be easily removed or defeated by the user. However, it may improve public acceptance if dealers or authorized repair specialists were allowed to remove the system at owner request. We do not know the effects of this option, and neither endorse nor oppose it.
• If a transient override of the ESBR system is permitted (turn off the system for a given trip), the amount of time and effort required to override the system should be clearly and substantially greater than the time and effort required to buckle the seat belt. This is especially so for the driver seat position.
68

6 Suggested Rating System for ESBR It would be useful to have some form of numerical rating procedure for describing the relative merit of alternative ESBR systems. Such a procedure would need to incorporate both the effectiveness of the system in promoting seat belt use and the acceptability of the system to occupants. Rating systems provide a succinct means of summarizing merit across a range of attributes and presenting the outcome in a simple way.
This section presents an approach to rating ESBR systems, based on the findings of this project. This approach should be viewed as preliminary and conceptual, since it has not been systematically evaluated and its various weightings are based on best-judgment rather than strong empirical tests. Some ambiguities may remain in applying the methods and will need to be worked out more thoroughly through exercising the methods with a range of systems. However, we feel that the conceptual approach provides a relatively simple and reasonable means of deriving a figure-of-merit for ESBR systems. The method is based on identifying a set of positive and negative factors and awarding or subtracting points according to the presence of these factors in a particular ESBR system. Factors influencing effectiveness and acceptance are treated separately. We fully recognize that the set of rating factors, details of their definitions, and the weights given to various factors are somewhat arbitrary or subjective at this point. Refinement and validation will be required if the concept is felt to have merit and is pursued further.
In developing this approach, we felt that it was important to develop separate ratings for ESBR effectiveness and for user acceptance. A given attribute (e.g., intensity of the sounds) might enhance the likelihood of buckling, but might also cause some users to find the system less acceptable. Conversely, a given attribute (e.g., ability to override the enhanced reminder) might make the system more appealing to some users, but if improperly designed, could degrade the effectiveness of the system. Because the System Feature Acceptability Study found little consensus among participants regarding what system was most desirable, even though there was good consensus on what was effective and on what was annoying, we therefore felt it was most appropriate to provide users with parallel information on effectiveness and acceptability.
6.1 Positive and Negative Features of ESBR Systems Based on the empirical findings of the project (Section 4) and the recommendations derived from the findings and other literature (Section 5), various factors can be enumerated that influence effectiveness (more likely seat belt use) and acceptance. We have developed a set of these factors, shown in Table 41. The table is in matrix form. The columns show positive (green columns) and negative (red columns) factors for both effectiveness (left side of table) and acceptance (right side of table). The factors are grouped (rows) under four general ESBR features: reminder phase, motivator phase, passenger reminder, and driver/owner control. “Reminder Phase” refers to the initial portion of an enhanced system, immediately following the four-to-eight second basic reminder, that covers the period when most seat belt buckling occurs, and is directed at the occupant who forgot or neglected to buckle their seat belt. “Motivator Phase” refers to the subsequent portion of the enhanced system, following the reminder phase, for which it is assumed that the occupant is aware that they are not belted and the function of the display is to motivate the user to buckle up. As a simple working operational definition, we take 30 seconds
69

from ignition as the approximate transition point from the reminder to the motivator phase. “Passenger Reminder” refers to those displays specifically indicating the status of belt use for a passenger, either front or rear seat. “Driver/owner Control” refers to those features of a system that allow the vehicle owner or current driver to modify operational aspects of the system. Basically this means suppressing some aspect of function, such as disabling the enhanced reminder system or eliminating passenger reminders. The set of attributes in Table 41 provides the basis for deriving ESBR system ratings.
70

ESBR Feature Effectiveness Factors Acceptance Factors Postive Factors Negative Factors Positive Factors Negative Factors
Distinct from initial standard reminder
Rewarding/enjoyable Limited duration Annoying
Detectable and salient Driver control outside bounds Driver/owner display selectable
Reminder Phase Reminder around 8-10 s from ignition
Driver/owner parameter control
Reminder around 20 s from ignition Auditory and visual signals
Auditory plus visual display Visual display only Suspend below minimum speed Occurrs prior to reminders Difficult to defeat Driver/owner parameter control Occurs prior to typical buckling
response times Indefinite cycling Terminates after time or cycles Continuous auditory signal Frequent cycle repetition rate Infrequent repetition Interlocks and delays
Motivator Phase Continuous visual display Interference with other displays Visual display attributes: flashing, larger, console location
Constrained by travel speed or trip distance
Auditory display attributes: fast rate (2.5-3 Hz), louder Audible to passengers
Front passenger display Driver control/override Flashing in driver view Rear passenger display Audible to driver
Passenger Reminder Visible to passenger Inaccurate passenger detection Flashing to passenger Visible to driver Seat position indicated to driver
ESBR status display Easy driver system disconnect Disconnect by authorized service
Driver/owner control Transient override more convenient than buckling
Transient (single trip) override
Non-transient override (stays in effect until cancelled)
Table 41. Positive and negative factors for ESBR effectiveness and acceptance
71

6.2 Rating ESBR Effectiveness The observational study found clear differences in effectiveness among different types of seat belt reminder systems. While enhanced reminder systems in general resulted in higher rates of seat belt use, those with visual-and-auditory displays were more effective than those with only visual displays. Using the odds ratios (for “all drivers”) as an index of performance:
Base condition (no ESBR) 1.000
Sim2 (Icon) 1.093 Visual Only
Sim6 (Icon & Text) 1.124 approx. 1.10
Sim5 (Icon & Sound) 1.275 Visual & Sound
Sim8 (Icon, Sound, Text) 1.350 approx 1.30
Using this metric, the visual-only ESBR is approximately 10-percent more effective than the base system and the visual-plus-auditory is about 30-percent more effective. However, since the observed visual-plus-auditory systems typically included a number of “positive factors” (from Section 6.1), we take the effectiveness of a “basic” visual-plus-auditory system as something around 25 percent. Therefore the effectiveness rating procedure begins with the following allocation of rating points:
Basic system 0 points
Visual-only ESBR 10 points
Visual-plus-auditory ESBR 25 points
For any system, this initial score is modified by adding points for positive effectiveness factors and subtracting points for negative effectiveness factors. Some factors are more critical than others and are assigned two points rather than one. Table 42 lists the factors and the associated number of points for each. As noted above, the allocation of points to factors is somewhat arbitrary and subjective at this point and the specific numbers in the table should be treated as tentative. The maximum number of points available in Table 42 is 25. Thus the highest possible total number of points for an ESBR is 50 (visual-plus-auditory ESBR [25 points] plus maximum effectiveness factors [25 points]).
The effectiveness rating for an ESBR system is the percentage of the maximum possible points (50) that it earns. Thus if a visual-plus-auditory system had 10 positive factor points and 5 negative factor points, it would have a net total of 25+10-5=30 total points. This represents 30/50, or 60 percent, of the maximum possible points, or a rating of 60. Likewise if some visual-only system had 4 positive points and 6 negative points, it would have a net total of 10+4-6=8 total points. This would yield a ratio of 8/50, for a rating of 16. Effectiveness ratings therefore range from 0 (no improvement from a basic system) to 100 (all potential positive effectiveness attributes and no negative effectiveness attributes). It is recognized that the allocation of points is rather crude, with the relative weights of factors being 0, 1, or 2, but this system is a reasonable approximation that at least incorporates the recognized factors.
72

If this approach is considered promising, three important further steps will be required. First, some of the definitions or criteria for certain factors are vague and must be more thoroughly operationalized. Second, a more systematic basis must be provided for the allocation of points to factors. Ideally, this would be based on empirical data, but in fact this may not prove feasible, at least for all factors. Another approach might be to derive weights based on a range of expert opinion using systematic techniques, such as the Delphi Method. Finally, the approach needs to be exercised with a variety of systems, to ensure its general applicability and to verify the reasonableness of the outcomes.
It should also be noted that even using the same set of plus and minus factors as a basis, various effectiveness rating formulas different from the one proposed above could be devised. For example, we could just work with the point total itself (0 to 50). Or we could divide the point total by 10 to derive the number of “stars” a system gets (0 to 5 stars). Various approaches might all be reasonable, especially given that the generation of a figure-of-merit is relatively crude in any case. We favor the approach shown above because the metric has an inherent meaning – it is the proportion of the maximum possible degree of improvement beyond a basic system. While this is undoubtedly an oversimplification, and not actually empirically based, it gives the scale some rationale.
73

Table 42. Points associated with plus and minus effectiveness factors ESBR Feature Factor Points Comment
Reminder Phase Distinct from initial basic reminder +2 Different sound, image, location; time gap
[following standard reminder, continuing until approximately 30 seconds from ignition; additional speed criterion may also be included]
Detectable and salient +1 Refers to conspicuity in vehicle environment. Will need specific procedures to classify this.
Reminder occurs 8-10 s from ignition +1 Some reminder is initiated around this time Reminder occurs about 20 s from ignition +1 Some reminder is initiated around this time Both auditory and visual components +2 Components of the reminder phase include some visual and
some auditory elements Display is rewarding/enjoyable -1 Should not encourage some users to intentionally evoke
display; factor is subjective at this point Driver can control or adjust outside reasonable bounds
-2 If adjustable or selectable, must still remain salient and distinct
Motivator Phase
[following Reminder Phase]
Both auditory and visual components +2 Components of the motivator phase include some visual and some auditory elements
Difficult to defeat system +1 For example, unbuckling during drive should re-initiate system Indefinite cycling +1 Continues until occupant is belted Frequent cycle repetition rate +1 Every 30 s or less Continuous visual display +1 Some element of the visual display always present Visual display attributes +1-2 Flashing, larger display, console location, multiple displays Auditory display attributes +1-2 Fast rate (2.5-3 Hz), louder Audible to passengers +1 Signal is reliably audible to occupant(s) in addition to driver Driver/owner parameter control -1 User can adjust display intensity, temporal aspects, triggers Terminates after limited cycle or time -1 Less than 3 minutes or 3 cycles Infrequent repetition -1 Less frequent than once per minute Interference with other displays -1 The display should not preclude the presentation of other
driver-relevant information and should not distract attention from urgent safety-critical information
Speed or distance modulated signal -1 Beyond minimum speed to activate system, display intensity should not be reduced due to travel speed or distance
74

ESBR Feature Factor Points Comment
Passenger Reminder
Front passenger display +1 Display is activated by unbelted front seat passenger Rear passenger display +1 Display is activated by unbelted rear seat passenger Visible to passenger +1 Display is visible to the unbelted passenger Flashing to passenger +1 Display visible to unbelted passenger is dynamic, not static. Visible to driver +1 Driver is informed there is an unbelted passenger Seat position indicated to driver +1 Driver indication of location(s) of unbelted occupant(s)
Driver/Owner Control
ESBR status display +1 If there are user-selectable controls and options, driver should be aware of system status
Easy driver ESBR system disconnect -2 The ESBR system should not be easily disconnected by the vehicle owner or driver (this factor refers to actual disconnect of the ESBR, as opposed to some action to temporarily defeat the functioning of the belt reminder)
Transient override more convenient than buckling
-2 If a system override is allowed, the time and effort required must clearly exceed that associated with buckling the seat belt
Non-transient override -2 Any override of the ESBR should not remain in effect the next time the vehicle is started; must be a trip-specific selection
Table 42. Points associated with plus and minus effectiveness factors (continued)
75

6.3 Rating ESBR Acceptance The acceptance dimension of an ESBR is not as readily associated with an empirical data point from the study as was the case for the effectiveness dimension. Acceptance was not “observed” for actual systems, as was belt use. Furthermore, the system feature study found weak consensus among participants in what systems or features they found to be “desirable” or “preferable.” People agreed quite well on the degree of effectiveness, attention-getting value, and annoyance, but not on the level of desirability. Furthermore, public acceptance of an ESBR system is not reflected in some simple averaging of all users. Different drivers may have very different experiences with the system, depending on their belt use habits. Infrequent belt users will be most exposed to ESBR displays and a small but vocal minority who find a system objectionable might damage public acceptance or limit consumer appeal. Therefore deriving some metric for the acceptance dimension of an ESBR system is more problematic.
Given these difficulties, the approach here to ESBR acceptance is not to try to assign a particular acceptance “value” to a given system, but to note positive and negative factors for a given system and derive a net acceptance bonus or penalty. As with the effectiveness dimension, a number of positive and negative factors for acceptance were identified and presented in Table 41. These factors were then assigned weights (1 or 2 points). Table 43 lists the acceptance factors and the points, in the same format as Table 42. There are seven acceptance-positive factors, with a potential total of 10 points. There are eight acceptance-negative factors, with a potential total of -10 points.
By summing all of the points (positive and negative) for a given system, a net acceptance adjustment is derived that conceptually can range from +10 to -10. We suggest this value be used directly as the acceptance component. It could also be divided by two for use as a five-star system. The acceptance figure could also be combined in some way with the effectiveness figure (e.g., adding the acceptance figure as an adjustment to the effectiveness figure, or multiplying a percentage of maximum possible acceptance points times the acceptance value). However, it is difficult to justify any of these procedures, particularly since they must implicitly assume some relative weighting of importance between effectiveness and acceptance. We know of no good way to assume the relative weights, and in fact, this weighting may be a complex policy matter and not one of an empirical safety outcome.
We therefore suggest that the ratings of effectiveness and acceptance remain separate, rather than integrated. The effectiveness rating is intended to provide a figure-of-merit rating that allows some comparison among alternative ESBR systems. The acceptance figure is not viewed as a score that directly allows comparison of systems that may be very different, but rather as a supplemental index of acceptance-related factors that modify the acceptability inherent in a given ESBR system.
76

ESBR Feature Factor Points Comment Reminder Phase
Limited duration +2 The reminder(s) should be brief (e.g., 3-5 seconds); they may be repeated periodically, but do not need extensive total on-time.
Driver/owner selectable display
+1 Users may select or program an auditory and/or visual reminder of their own choice (for the reminder phase only).
Driver/owner parameter control
+1 Users can adjust display intensity parameters – brightness, volume, temporal.
Annoying reminder -2 A reminder must be salient but does not need to be annoying. This factor is important, but an objective means of defining it will need to be determined.
Reminder too early -1 Enhanced reminders that occur at a time prior to typical seat belt buckling latencies may be inappropriate and ineffective. A value of about 6-7 seconds from ignition is suggested for “early,” based on Malenfant and VanHouten (2008).
Motivator Phase
Suspend operation below minimum speed
+2 The motivator phase should not operate when the vehicle is at speeds low enough to suggest the vehicle may not be operating on a roadway (around 10 mph). Ideally, there would be some timing of the algorithm so that the system is not suspended for brief stops/slows at Stop signs, merges, exits, etc.
Aggressive too early -1 Motivator stage activates without a preceding reminder or before approximately 30 s or before roadway speeds.
Continuous auditory signal
-1 A continuous auditory signal may interfere with communications, other vehicle displays, and infotainment systems.
Interlocks and delays -2 Ignition interlocks are not permitted in the United States. Other possibilities for interfering with vehicle functions or communications include sound system interrupt, gear shift delay, climate control lockout, and jamming of cell phones.
Passenger Reminder
Driver control/override +1 Driver can eliminate displays generated by system detection (accurate or inaccurate) of an unbuckled passenger.
Flashing in driver view -1 Intrusive visual display when the driver cannot directly control the event. Audible to driver -1 Intrusive acoustic display when the driver cannot directly control the event. Inaccurate passenger detection
-1 Activation of passenger reminders when there is no passenger or the passenger is properly restrained; potential problems include cargo, pets. An objective means of defining “inaccurate” it will need to be determined.
Driver/Owner Control
Disconnect procedures +2 Authorized procedures are available to disable all or part of the enhanced reminder system (base reminder must remain).
Transient override +1 The driver can take an action that will provide a transient override of the ESBR, deactivating it for the current trip.
Table 43. Points associated with plus and minus acceptance factors
77

6.4 Rating System – Summary Through this project, a number of factors have been identified that contribute to the effectiveness and acceptability of an ESBR system. Various methods might be devised to use these factors to derive some form of rating to summarize the merit of a particular ESBR system. This section put forth a conceptual approach to doing this that provides a numeric index of effectiveness for directly comparing different systems, and a more limited and separate approach for noting acceptance contributors. The methods require refinement, and the quantitative aspects are to a substantial degree subjective at this point. For example, how important is a passenger reminder feature, relative to some other feature? The factor weightings contain several that are related to passenger reminders, and a system with no passenger reminder could not earn any of the associated points. Thus, there is the issue of the relative weight of various aspects of the passenger reminder display (e.g., front passenger display, rear passenger display, visibility to driver, etc.) as well as the total number of points possible, which speaks to the total relative importance of the passenger reminder feature.
The method as described here is thus seen as a reasonable approximation. If the conceptual approach is viewed positively, it will need further refinement, both for establishing validity and precision of the method and for establishing consensus and acceptance among potential users of the rating method (e.g., manufacturers, regulators, informational programs, consumers).
An empirical establishment of validity may face difficulties. Conceptually, one would wish to compare the effectiveness ratings among a set of ESBR systems with the observed rates of actual seat belt use for those systems and observe a strong relationship between the two measures. That is, the effectiveness rating ideally would accurately predict the degree of belt use. The difficulties in doing this include: limited numbers of observations for any particular system, and associated wide error bands for estimates; some factors remain difficult to quantify; observed belt use rates associated with an ESBR may be confounded with a variety of vehicle factors and/or occupant demographic factors; there are various potential measures of seat belt use rates, based on all drivers, drivers alone, all occupants, all passengers, front or rear seat passengers, etc.; observed rates may depend on the types of sites at which observations are made (e.g., the relative performance of some systems may different on low-speed roads versus freeways). Therefore, the expectations for establishing a basis for any sort of rating system must be realistic and some form of expert judgment or consensus may be required. Nonetheless, as long as they are treated as approximations and not precise measures, ratings of the sort proposed here or other reasonable methods may provide useful summary indices of the likely performance of ESBR systems.
78

References Boyle, J.M., & Vanderwolf, P. (2004). 2003 motor vehicle occupant safety survey (DOT HS 809
789). Washington, DC: National Highway Traffic Safety Administration.
Buckling up: Technologies to increase seat belt use (2003). TRB Special Report 278. Washington, DC: Transportation Research Board.
Eby, D.W., Molnar, L.J., Kostyniuk, L.P., & Shope, J.T. (2005). Developing an effective and acceptable safety belt reminder system. Proceedings of the 19th International Technical Conference on the Enhanced Safety of Vehicles.
Eby, D.C., Molnar, L.J., Kostyniuk, L.P., Shope, J.T., & Miller, L.L. (2004). Developing an Optimal In-Vehicle Safety Belt Promotion System (Report No. UMTRI 2004-29). Ann Arbor, MI: University of Michigan Transportation Research Institute.
Euro NCAP. (2004). European new car assessment programme (Euro NCAP): Seat belt reminder protocol (Version 1.0b). Brussels, Belgium: European New Car Assessment Programme.
Freedman, M., Levi, S., Zador, P., Lopdell, J., & Bergeron, E. (2007). The effectiveness of enhanced seat belt reminder systems. Observational field data collection methodology and findings (DOT HS 810 844). Washington, DC: National Highway Traffic Safety Administration.
Glassbrenner, D. (2005). Safety belt use in 2005: Overall results (DOT HS 809 932). Washington, DC: National Highway Traffic Safety Administration.
Glassbrenner, D., & Ye, T.J. (2007). Seat belt use in 2007 – overall results (DOT HS 810 841). Washington, DC: National Highway Traffic Safety Administration.
Harrison, W.A., Senserrik, T.M., & Tingvall, C. (2000). Development and trial of a method to investigate the acceptability of seat belt reminder systems. MUARC and Vagverket Swedish National Road Administration.
Krafft, M., Kullgren, A., Lie, A., & Tingvall, C. (2006). The use of seat belts in cars with smart seat belt reminders – Results of an observational study. Traffic Injury Prevention, 7(2).
Lerner, N., Singer, J., Huey, R., Jenness, J. (2007). Acceptability and potential effectiveness of enhanced seat belt reminder system features (DOT HS 810 848).
Malenfant, J., & Van Houten, R. (2005). Behavioral analysis of the drivers’ seat belt behavior chain in Pinellas County Florida and Halifax Regional Municipality. Proceedings of the Transportation Research Board 84th Annual Meeting. Washington, DC: Transportation Research Board.
Malenfant, J.E.L., & Van Houten, R. (2008). Observations of how drivers fasten their seatbelts in relation to various startup tasks. Accident Analysis & Prevention, 40(1), 309-314.
Marshall, D., Lee, J., & Austria, P. (2007). Alerts for in-vehicle information systems: Annoyance, urgency, and appropriateness. Human Factors, 49(1), 145-157.
Nambisan, S.S., & Vasudevan, V. (2007). Is seat belt usage by front seat passengers related to seat belt usage by their passengers? Journal of Safety Research, 38(5), 545-555.
79

Nuyts, E., & Vesentini, L. (2005). The relation between seat belt use of drivers and passengers. In D. de Waard, K.A. Brookhuis, & T. Boersema (Eds.), Human Factors in Design, Safety, and Management. Maastricht, the Netherlands: Shaker Publishing.
Regan, M., Triggs, T., Young, K., Tomasevic, N., Mitsopoulos, E., Stephan, K., & Tingvall, C. (2006). On-road evaluation of intelligent speed adaptation, following distance warning and seatbelt reminder systems: Final results of the TAC SafeCar project. Volume 1, Final Report (Report No. 253). Victoria, Australia: Monash University, Accident Research Centre.
Regan, M., Young, K., Triggs, T., Tomasevic, N., Mitsopoulos, E., Tierney, P., Connelly, K., & Tingvall, C. (2005). Effects on driving performance of in-vehicle intelligent transport systems: Final results of the Australian TAC SafeCar project. Proceedings of the 2005 Australasian Road Safety Research, Policing, and Education Conference, Wellington, New Zealand.
Rosenbaum, O. & Rubin, D. (1983). The central role of the propensity score in observational studies for causal effects. Biometrika, 70, 41-55.
Tan, A.K., & Lerner, N.D. (1995). Multiple attribute evaluation of auditory warning signals for in-vehicle crash avoidance warning systems (DOT HS 808 535). Washington, DC: National Highway Traffic Safety Administration.
Traffic safety facts: Occupant protection (2007) (DOT HS 810 807). Washington, DC: National Highway Traffic Safety Administration.
Transportation Research Board (2003). Buckling up: Technologies to increase seat belt use (TRB Special Report 278). Washington, DC: Transportation Research Board.
Ulleberg, P., & Must, T. (2005). Young car passengers as guardian angels: Factors influencing adolescent passengers’ willingness to influence young drivers (Report No. 776/2005). Oslo, Norway: Institute of Transport Economics.
Van Houten, R., Malenfant, J., Austin, J., & Lebon, A. (2005). The effects of a seatbelt-gearshift delay prompt on the seatbelt use of motorists who do not regularly wear their seatbelt. Journal of Applied Behavioral Analysis, 38(2), 195-203.
Westat (2005). Teen driver seat belt reminder focus group: Focus group summary (Report under Contract DTNH22-05-D-01002, Task Order 1). Washington, DC: National Highway Traffic Safety Administration.
Williams, A.F., & Shabanova, V.I. (2002). Situational factors in seat belt use by teenage drivers and passengers. Traffic Injury Prevention, 3(3), 201-204.
Williams, A.F., Wells, J.K., & Farmer, C.M. (2002). Effectiveness of Ford’s enhanced belt reminder system in increasing seat belt use. Injury Prevention, 8, 293-296.
80

Base Manuf. A Manuf. A Manuf. B Manuf. C Manuf. D Manuf. D Manuf. D Manuf. D Manuf. E Manuf. E System Name System System 1 System 2 System 1 System 1 System 1 System 2 System 3 System 4 System 1 System 2
Simple Grouping SIMP1 SIMP5 SIMP8 SIMP5 SIMP5 SIMP7 SIMP7 SIMP5 SIMP2 SIMP5 SIMP8 Name Variable
Detailed DETL1 DETL4 DETL10 DETL7 DETL5 DETL9 DETL9 DETL7 DETL2 DETL5 DETL11 Grouping Name
Driver Belt 1=Yes 2=No 1 1 1 1 1 1 1 1 1 1 1 Use Passenger 1=Yes, 2=No 2 1 1 2 2 1 1 2 1 2 2 Belt Use Activation MPH 0 0 0 5.6 3 4.97 4.97 4.97 4.97 4.35 4.35 Speed 0=Not Applicable
1=Start of Ignition 2=Immediately Activation after base system 1 15 15 30 30 2 2 30 2 30 30 Time N=Seconds after base system
Activation Feet 0 656 656 0 0 0 0 0 0 0 0 Distance 0=Not Applicable 1=Chime 2=Buzzer Sound Type 0 1 1 1 1 1 1 1 0 1 1 3=Chime or Buzzer 0=Not Applicable 1=Uniform 2=Rise Sound 3=Uniform or 0 1 1 1 1 1 1 1 0 1 1 Cadence Intermittent 0=Not Applicable
Single Cycle Seconds Sound 0 90 90 96 6 3 3 7 0 6 6 0=Not Applicable Duration
Appendix A: ESBR System Characteristics Table A1. ESBR system characteristics
81

Base Manuf. A Manuf. A Manuf. B Manuf. C Manuf. D Manuf. D Manuf. D Manuf. D Manuf. E Manuf. E System Name System System 1 System 2 System 1 System 1 System 1 System 2 System 3 System 4 System 1 System 2
Simple Grouping SIMP1 SIMP5 SIMP8 SIMP5 SIMP5 SIMP7 SIMP7 SIMP5 SIMP2 SIMP5 SIMP8 Name Variable
Detailed DETL1 DETL4 DETL10 DETL7 DETL5 DETL9 DETL9 DETL7 DETL2 DETL5 DETL11 Grouping Name
Interval Between Seconds 0 0 0 0 30 204 0 248 0 30 30 Sound 0=Not Applicable Cycles Complete Seconds Sound 0 90 90 96 300 210 3 262 0 540 540 0=Not Applicable Duration
1=Time Out Sound 2=Buckle 0 1 1 1 1 1 1 1 0 1 1 Cessation 0=Not Applicable 1=Standard ISO Icon Type 1 1 1 1 1 1 1 1 1 1 1 0=None 1=Continuous 2=Flashing Icon 3=Continuous and 0 1 1 3 2 0 0 3 1 2 2 Appearance Flashing 0=Not Applicable
Single Cycle 1=Continuous Icon N=Seconds 0 90 90 8 6 0 0 75 1 6 6 Duration 0=Not Applicable Interval 1=No Interval Between N=Seconds 0 1 1 1 30 0 0 180 1 30 30 Icon Cycles 0=Not Applicable
Number of Complete Seconds Icon 0 90 90 96 300 0 0 330 999 540 540 999=Continuous Duration until Buckle Up Fasten Driver Text Buckle Buckle Fasten 0=Not Applicable 0 0 Safety 0 0 0 0 0 Content Seatbelt Seatbelt Seatbelt Belt
Table A1. ESBR system characteristics (continued)
82

Table A1. ESBR system characteristics (continued)
Base Manuf. A Manuf. A Manuf. B Manuf. C Manuf. D Manuf. D Manuf. D Manuf. D Manuf. E Manuf. E System Name System System 1 System 2 System 1 System 1 System 1 System 2 System 3 System 4 System 1 System 2
Simple Grouping SIMP1 SIMP5 SIMP8 SIMP5 SIMP5 SIMP7 SIMP7 SIMP5 SIMP2 SIMP5 SIMP8 Name Variable
Detailed Grouping DETL1 DETL4 DETL10 DETL7 DETL5 DETL9 DETL9 DETL7 DETL2 DETL5 DETL11 Name
Fasten Passenger Buckle Buckle 0=Not Applicable 0 0 Safety 0 0 0 0 0 0 Text Content Passenger Passenger Belt
Single Cycle 1=Continuous Text N=Seconds 0 0 90 0 0 27 27 0 0 0 5 Duration 0=Not Applicable
Interval Seconds Between 0 0 0 0 0 180 0 0 0 0 30 0=Not Applicable Text Cycles
Complete Seconds Text 999=Continuous 0 0 90 0 0 234 27 0 0 0 540 Duration until Buckle Up
1=Continuous Icon Post ESBR 2=Flashing Icon 3 1 1 1 3 3 3 3 1 1 1 State 3=Nothing
Post ESBR 0=NA Same as 1=Same 0 1 1 2 0 0 0 0 1 2 2 ESBR 2=Different
Permanent 1=Yes 2 2 2 1 1 2 2 2 2 2 2 Deactivation 2=No
83

Table A1. ESBR system characteristics (continued)
Manuf. F Manuf. F Manuf. G Manuf. G Manuf. H Manuf. H Manuf. I Manuf. I Manuf. J Manuf. J System Name System 1 System 2 System 1 System 2 System 1 System 2 System 1 System 2 System 1 System 2
Simple Grouping Variable SIMP5 SIMP8 SIMP2 SIMP2 SIMP6 SIMP2 SIMP2 SIMP5 SIMP8 SIMP8 Name
Detailed Grouping DETL6 DETL12 DETL2 DETL2 DETL8 DETL2 DETL3 DETL6 DETL10 DETL10 Name
Driver Belt Use 1=Yes 2=No 1 1 1 1 1 1 1 1 1 1
Passenger Belt 1=Yes, 2=No 2 1 2 1 1 2 1 2 1 1 Use
Activation MPH 4.97 4.97 0 0 0 0 0 9 0 15 Speed 0=Not Applicable
1=Start of Ignition 2=Immediately after
Activation Time base system 60 60 2 2 2 2 2 2 24 24 N=Seconds after base system
Activation Feet 0 0 0 0 0 0 0 0 0 0 Distance 0=Not Applicable
1=Chime 2=Buzzer Sound Type 2 2 0 0 0 0 0 2 1 1 3=Chime or Buzzer 0=Not Applicable
1=Uniform 2=Rise
Sound Cadence 3=Uniform or 1 1 0 0 0 0 0 2 1 1 Intermittent 0=Not Applicable
Single Cycle Seconds 5 5 0 0 0 0 0 30 6 6 Sound Duration 0=Not Applicable
84

Variable
System Name Manuf. F System 1
Manuf. F System 2
Manuf. G System 1
Manuf. G System 2
Manuf. H System 1
Manuf. H System 2
Manuf. I System 1
Manuf. I System 2
Manuf. J System 1
Manuf. J System 2
Simple Grouping Name SIMP5 SIMP8 SIMP2 SIMP2 SIMP6 SIMP2 SIMP2 SIMP5 SIMP8 SIMP8
Detailed Grouping Name DETL6 DETL12 DETL2 DETL2 DETL8 DETL2 DETL3 DETL6 DETL10 DETL10
Interval Between Sound Cycles
Seconds 0=Not Applicable 3 3 0 0 0 0 0 0 24 24
Complete Sound Duration
Seconds 0=Not Applicable 93 93 0 0 0 0 0 30 300 120
1=Time Out Sound Cessation 2=Buckle 1 1 0 0 0 0 0 1 1 1
0=Not Applicable
Icon Type 1=Standard ISO 0=None 1 1 1 1 1 1 1 1 1 1
Icon Appearance
1=Continuous 2=Flashing 3=Continuous and Flashing 0=Not Applicable
2 2 1 1 1 1 2 2 1 1
Single Cycle Icon Duration
1=Continuous N=Seconds 0=Not Applicable
5 5 1 1 1 1 1 1 1 1
Interval 1=No Interval Between Icon N=Seconds 3 3 1 1 1 1 1 1 1 1 Cycles 0=Not Applicable
Complete Icon Duration
Number of Seconds 999=Continuous until Buckle Up
93 93 999 999 999 999 999 999 300 120
Driver Text Content 0=Not Applicable 0 0 0 0 0 0 0 0
Driver Fasten
Seatbelt
Driver Fasten
Seatbelt
Table A1. ESBR system characteristics (continued)
85

Table A1. ESBR system characteristics (continued)
Variable
System Name Manuf. F System 1
Manuf. F System 2
Manuf. G System 1
Manuf. G System 2
Manuf. H System 1
Manuf. H System 2
Manuf. I System 1
Manuf. I System 2
Manuf. J System 1
Manuf. J System 2
Simple Grouping Name SIMP5 SIMP8 SIMP2 SIMP2 SIMP6 SIMP2 SIMP2 SIMP5 SIMP8 SIMP8
Detailed Grouping Name DETL6 DETL12 DETL2 DETL2 DETL8 DETL2 DETL3 DETL6 DETL10 DETL10
Passenger Text Content 0=Not Applicable 0 Passenger 0 0 Passenger 0 0 0 Fasten
Seatbelt Fasten
Seatbelt
Single Cycle Text Duration
1=Continuous N=Seconds 0=Not Applicable
0 5 0 0 1 0 0 0 6 6
Interval Between Text Cycles
Seconds 0=Not Applicable 0 3 0 0 0 0 0 0 0 0
Complete Text Duration
Seconds 999=Continuous until Buckle Up
0 93 0 0 999 0 0 0 6 6
Post ESBR State 1=Continuous Icon 2=Flashing Icon 3=Nothing
1 1 1 1 1 1 2 2 1 1
Post ESBR Same as ESBR
0=NA 1=Same 2=Different
2 2 1 1 1 1 1 1 1 1
Permanent Deactivation
1=Yes 2=No 2 2 1
86


DOT HS 811 097February 2009