
EFFECTIVELY TRANSFORMING IMC FLIGHT INTO … · EFFECTIVELY TRANSFORMING IMC FLIGHT INTO VMC...
14
EFFECTIVELY TRANSFORMING IMC FLIGHT INTO VMC FLIGHT: AN SVS CASE STUDY Louis J. Glaab, Monica F. Hughes, NASA Langley Research Center, Hampton, VA Russell V. Parrish, Raytheon, Hampton, VA Mohammad A. Takallu, Lockheed Martin, Hampton, VA Abstract A flight-test experiment was conducted using the NASA LaRC Cessna 206 aircraft. Four primary flight and navigation display concepts, including baseline and Synthetic Vision System (SVS) concepts, were evaluated in the local area of Roanoke Virginia Airport, flying visual and instrument approach procedures. A total of 19 pilots, from 3 pilot groups reflecting the diverse piloting skills of the GA population, served as evaluation pilots. Multi-variable Discriminant Analysis was applied to three carefully selected and markedly different operating conditions with conventional instrumentation to provide an extension of traditional analysis methods as well as provide an assessment of the effectiveness of SVS displays to effectively transform IMC flight into VMC flight. Introduction Synthetic Vision Systems (SVS) displays provide pilots with a continuous view of terrain, and when combined with integrated advanced guidance symbology, have been shown to significantly increase situation awareness (SA) and pilot performance while decreasing workload during operations in Instrument Meteorological Conditions (IMC) [1-11]. It has been hypothesized that SVS displays may improve safety and operational flexibility of flight in IMC to a level comparable to clear-day Visual Meteorological Conditions (VMC), regardless of actual visibility [1-11]. Significant progress has been made towards evolving SVS displays, establishing their potential overall benefits and refining intended uses [1-11]. While a substantial amount of data has been accumulated demonstrating the capabilities of SVS to improve SA and reduce workload, a fundamental in-flight comparison to current day general aviation (GA) “round dials” cockpit instrumentation was warranted to further quantify those improvements and translate them into meaningful potential safety and operational benefits. Multi-variable Discriminant Analysis (MVDA) was applied to the resulting data as a complement to existing traditional human factors analysis methods as well as provide an assessment of the effectiveness of SVS displays to effectively transform IMC flight into VMC flight. Flight Test A coordinated simulation and flight-test experiment series was conducted using the NASA LaRC Integrated Flight Deck simulator (IFD) [11] and the NASA LaRC Cessna 206 aircraft. This report presents results from the flight test effort. Four information display concepts (DC) ranging from a baseline “round dials” (BRD) through a dual-display fully integrated SVS package that included terrain, pathway-based guidance, and a strategic navigation display, were investigated using the NASA LaRC Cessna C-206 (C-206) aircraft. A total of 19 pilots, from 3 pilot groups reflecting the diverse piloting skills of the GA population, were employed for testing to provide a comprehensive assessment. Pilots performed basic visual flight rules (VFR), instrument landing system (ILS), and advanced VFR-like approaches to Roanoke Regional Airport/Woodrum Field (ROA) in Roanoke, Virginia. Flight Test Aircraft and Experimental Apparatus The C-206 aircraft (see Figure 1) provided ample payload carrying capability and power to accommodate the required research equipment, crew, and mission duration. https://ntrs.nasa.gov/search.jsp?R=20080014170 2018-07-06T23:03:44+00:00Z
Transcript of EFFECTIVELY TRANSFORMING IMC FLIGHT INTO … · EFFECTIVELY TRANSFORMING IMC FLIGHT INTO VMC...

EFFECTIVELY TRANSFORMING IMC FLIGHT INTO VMC FLIGHT: AN SVS CASE STUDY
Louis J. Glaab, Monica F. Hughes, NASA Langley Research Center, Hampton, VA Russell V. Parrish, Raytheon, Hampton, VA
Mohammad A. Takallu, Lockheed Martin, Hampton, VA
Abstract A flight-test experiment was conducted using
the NASA LaRC Cessna 206 aircraft. Four primary flight and navigation display concepts, including baseline and Synthetic Vision System (SVS) concepts, were evaluated in the local area of Roanoke Virginia Airport, flying visual and instrument approach procedures. A total of 19 pilots, from 3 pilot groups reflecting the diverse piloting skills of the GA population, served as evaluation pilots. Multi-variable Discriminant Analysis was applied to three carefully selected and markedly different operating conditions with conventional instrumentation to provide an extension of traditional analysis methods as well as provide an assessment of the effectiveness of SVS displays to effectively transform IMC flight into VMC flight.
Introduction Synthetic Vision Systems (SVS) displays
provide pilots with a continuous view of terrain, and when combined with integrated advanced guidance symbology, have been shown to significantly increase situation awareness (SA) and pilot performance while decreasing workload during operations in Instrument Meteorological Conditions (IMC) [1-11]. It has been hypothesized that SVS displays may improve safety and operational flexibility of flight in IMC to a level comparable to clear-day Visual Meteorological Conditions (VMC), regardless of actual visibility [1-11]. Significant progress has been made towards evolving SVS displays, establishing their potential overall benefits and refining intended uses [1-11]. While a substantial amount of data has been accumulated demonstrating the capabilities of SVS to improve SA and reduce workload, a fundamental in-flight comparison to current day general aviation (GA) “round dials” cockpit instrumentation was warranted to further quantify those improvements
and translate them into meaningful potential safety and operational benefits. Multi-variable Discriminant Analysis (MVDA) was applied to the resulting data as a complement to existing traditional human factors analysis methods as well as provide an assessment of the effectiveness of SVS displays to effectively transform IMC flight into VMC flight.
Flight Test A coordinated simulation and flight-test
experiment series was conducted using the NASA LaRC Integrated Flight Deck simulator (IFD) [11] and the NASA LaRC Cessna 206 aircraft. This report presents results from the flight test effort.
Four information display concepts (DC) ranging from a baseline “round dials” (BRD) through a dual-display fully integrated SVS package that included terrain, pathway-based guidance, and a strategic navigation display, were investigated using the NASA LaRC Cessna C-206 (C-206) aircraft. A total of 19 pilots, from 3 pilot groups reflecting the diverse piloting skills of the GA population, were employed for testing to provide a comprehensive assessment. Pilots performed basic visual flight rules (VFR), instrument landing system (ILS), and advanced VFR-like approaches to Roanoke Regional Airport/Woodrum Field (ROA) in Roanoke, Virginia.
Flight Test Aircraft and Experimental Apparatus
The C-206 aircraft (see Figure 1) provided ample payload carrying capability and power to accommodate the required research equipment, crew, and mission duration.
https://ntrs.nasa.gov/search.jsp?R=20080014170 2018-07-06T23:03:44+00:00Z

Figure 1. NASA LaRC C-206 aircraft.
Figure 2. BRD display concept.
Figure 3. SVS display concept.
The C-206 was modified for this flight test through installation of a 10.4” LCD research display on the right side of the instrument panel, a 6.4” LCD research display in the top of the radio stack, 2 general purpose computers, and air data attitude and heading reference system.
In the conventional display configuration, a total of seven 3”-diameter BRDs displayed airspeed, attitude, altitude, turn and bank, directional gyro, vertical speed, and localizer (LOC)/glideslope (G/S) course deviation indicators
(CDIs) to the evaluation pilot (EP). In the advanced display concepts configuration, the research display system enabled evaluations of dual 6.4” advanced displays, such as a Navigation Display (ND) and Primary Flight Display (PFD). The configuration could be changed rapidly. The installations are shown in Figures 2 and 3 for the BRD and SVS configurations, respectively. As configured for this flight test, the EP occupied the front right seat of the aircraft, and the safety pilot (SP) occupied the front left seat.
SVS Terrain Database The SVS terrain database representation used
for this study is referred to as the Elevation-Based Generic (EBG) terrain portrayal concept, developed and evaluated in [1-4, 11]. The Digital Elevation Model (DEM) included 3 arc-second resolution (approximately 90m post-spacing) terrain data. Based on results from [1, 2] this level of DEM provides very good results for increases in pilots’ SA.
The EBG texturing concept consisted of twelve equal-height coloring bands. These bands corresponded to different absolute terrain elevation levels. The coloration bands were based on VFR sectional charts and applied to the various local-area altitude elevation bands, where lower terrain levels were colored with darker colors, while higher terrain levels were assigned lighter colors. A specific shade of green was set to the field elevation (1175 MSL). The lightest VFR sectional color was set to the highest terrain within 50 nm of ROA, approximately 4000 ft MSL. Cultural features, such as roads and rivers, were included as objects in the terrain database.
The ROA airport model included runways with markings along with most significant airport buildings. All models were placed on top of the underlying terrain database. Objects greater than 200 ft high within 20 nm of ROA were represented by narrow rectangular barber-striped pole objects portraying their height and location, as provided within the FAA-published obstacle database.
Display Concepts Four display concepts (Figure 4) were
developed for evaluation: 1) BRD, 2) ND and PFD
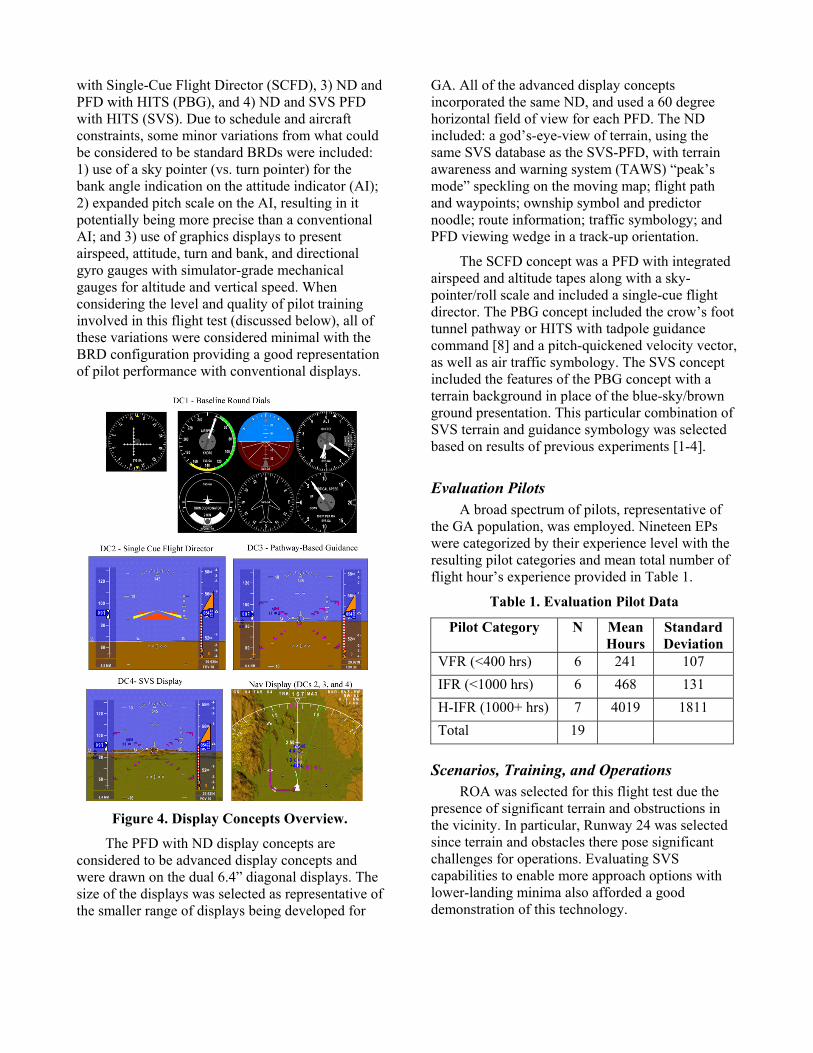
with Single-Cue Flight Director (SCFD), 3) ND and PFD with HITS (PBG), and 4) ND and SVS PFD with HITS (SVS). Due to schedule and aircraft constraints, some minor variations from what could be considered to be standard BRDs were included: 1) use of a sky pointer (vs. turn pointer) for the bank angle indication on the attitude indicator (AI); 2) expanded pitch scale on the AI, resulting in it potentially being more precise than a conventional AI; and 3) use of graphics displays to present airspeed, attitude, turn and bank, and directional gyro gauges with simulator-grade mechanical gauges for altitude and vertical speed. When considering the level and quality of pilot training involved in this flight test (discussed below), all of these variations were considered minimal with the BRD configuration providing a good representation of pilot performance with conventional displays.
Figure 4. Display Concepts Overview.
The PFD with ND display concepts are considered to be advanced display concepts and were drawn on the dual 6.4” diagonal displays. The size of the displays was selected as representative of the smaller range of displays being developed for
GA. All of the advanced display concepts incorporated the same ND, and used a 60 degree horizontal field of view for each PFD. The ND included: a god’s-eye-view of terrain, using the same SVS database as the SVS-PFD, with terrain awareness and warning system (TAWS) “peak’s mode” speckling on the moving map; flight path and waypoints; ownship symbol and predictor noodle; route information; traffic symbology; and PFD viewing wedge in a track-up orientation.
The SCFD concept was a PFD with integrated airspeed and altitude tapes along with a sky-pointer/roll scale and included a single-cue flight director. The PBG concept included the crow’s foot tunnel pathway or HITS with tadpole guidance command [8] and a pitch-quickened velocity vector, as well as air traffic symbology. The SVS concept included the features of the PBG concept with a terrain background in place of the blue-sky/brown ground presentation. This particular combination of SVS terrain and guidance symbology was selected based on results of previous experiments [1-4].
Evaluation Pilots A broad spectrum of pilots, representative of
the GA population, was employed. Nineteen EPs were categorized by their experience level with the resulting pilot categories and mean total number of flight hour’s experience provided in Table 1.
Table 1. Evaluation Pilot Data
Scenarios, Training, and Operations ROA was selected for this flight test due the
presence of significant terrain and obstructions in the vicinity. In particular, Runway 24 was selected since terrain and obstacles there pose significant challenges for operations. Evaluating SVS capabilities to enable more approach options with lower-landing minima also afforded a good demonstration of this technology.
Pilot Category N Mean Hours
Standard Deviation
VFR (<400 hrs) 6 241 107 IFR (<1000 hrs) 6 468 131 H-IFR (1000+ hrs) 7 4019 1811 Total 19
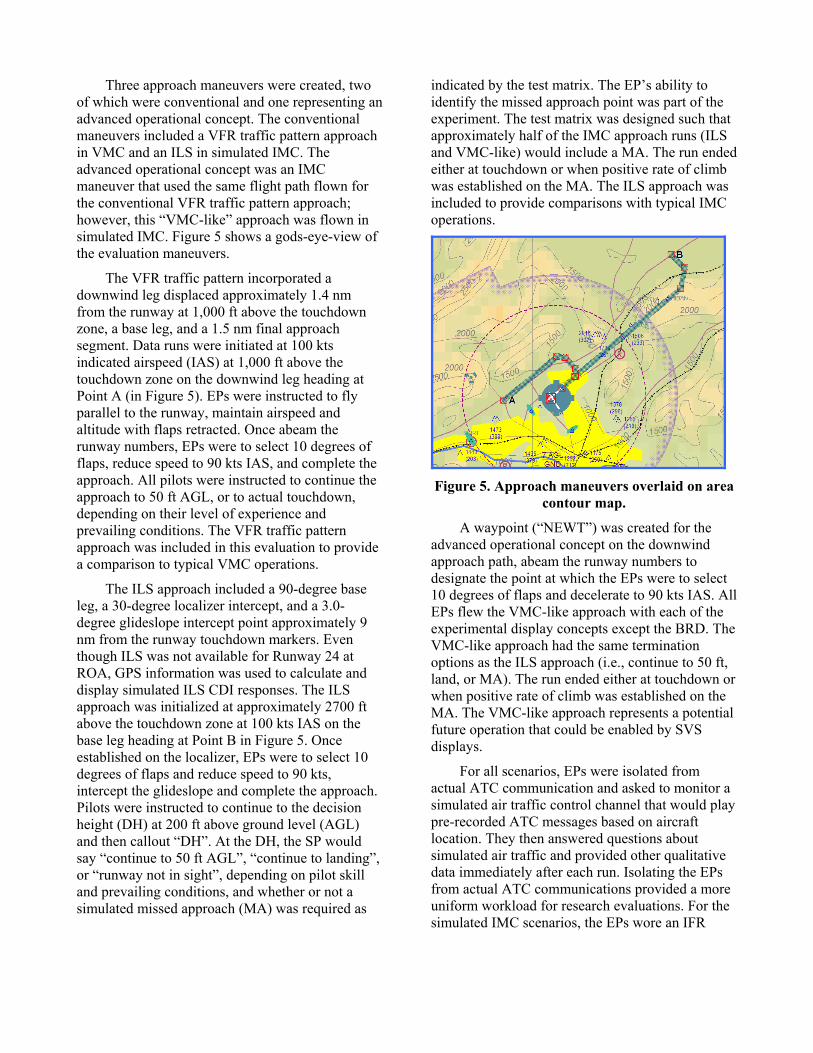
Three approach maneuvers were created, two of which were conventional and one representing an advanced operational concept. The conventional maneuvers included a VFR traffic pattern approach in VMC and an ILS in simulated IMC. The advanced operational concept was an IMC maneuver that used the same flight path flown for the conventional VFR traffic pattern approach; however, this “VMC-like” approach was flown in simulated IMC. Figure 5 shows a gods-eye-view of the evaluation maneuvers.
The VFR traffic pattern incorporated a downwind leg displaced approximately 1.4 nm from the runway at 1,000 ft above the touchdown zone, a base leg, and a 1.5 nm final approach segment. Data runs were initiated at 100 kts indicated airspeed (IAS) at 1,000 ft above the touchdown zone on the downwind leg heading at Point A (in Figure 5). EPs were instructed to fly parallel to the runway, maintain airspeed and altitude with flaps retracted. Once abeam the runway numbers, EPs were to select 10 degrees of flaps, reduce speed to 90 kts IAS, and complete the approach. All pilots were instructed to continue the approach to 50 ft AGL, or to actual touchdown, depending on their level of experience and prevailing conditions. The VFR traffic pattern approach was included in this evaluation to provide a comparison to typical VMC operations.
The ILS approach included a 90-degree base leg, a 30-degree localizer intercept, and a 3.0-degree glideslope intercept point approximately 9 nm from the runway touchdown markers. Even though ILS was not available for Runway 24 at ROA, GPS information was used to calculate and display simulated ILS CDI responses. The ILS approach was initialized at approximately 2700 ft above the touchdown zone at 100 kts IAS on the base leg heading at Point B in Figure 5. Once established on the localizer, EPs were to select 10 degrees of flaps and reduce speed to 90 kts, intercept the glideslope and complete the approach. Pilots were instructed to continue to the decision height (DH) at 200 ft above ground level (AGL) and then callout “DH”. At the DH, the SP would say “continue to 50 ft AGL”, “continue to landing”, or “runway not in sight”, depending on pilot skill and prevailing conditions, and whether or not a simulated missed approach (MA) was required as
indicated by the test matrix. The EP’s ability to identify the missed approach point was part of the experiment. The test matrix was designed such that approximately half of the IMC approach runs (ILS and VMC-like) would include a MA. The run ended either at touchdown or when positive rate of climb was established on the MA. The ILS approach was included to provide comparisons with typical IMC operations.
Figure 5. Approach maneuvers overlaid on area
contour map.
A waypoint (“NEWT”) was created for the advanced operational concept on the downwind approach path, abeam the runway numbers to designate the point at which the EPs were to select 10 degrees of flaps and decelerate to 90 kts IAS. All EPs flew the VMC-like approach with each of the experimental display concepts except the BRD. The VMC-like approach had the same termination options as the ILS approach (i.e., continue to 50 ft, land, or MA). The run ended either at touchdown or when positive rate of climb was established on the MA. The VMC-like approach represents a potential future operation that could be enabled by SVS displays.
For all scenarios, EPs were isolated from actual ATC communication and asked to monitor a simulated air traffic control channel that would play pre-recorded ATC messages based on aircraft location. They then answered questions about simulated air traffic and provided other qualitative data immediately after each run. Isolating the EPs from actual ATC communications provided a more uniform workload for research evaluations. For the simulated IMC scenarios, the EPs wore an IFR
training vision restriction device. No vision restriction was used for the VFR runs.
Evaluation pilots received training prior to data collection to preclude learning effects in the data. Training included a one hour briefing regarding the characteristics of the experiment along with a description of all display concepts, evaluation maneuvers, and subjective and objective measures. Next, EPs received approximately 2.5 hours of training using a desktop simulator where all test conditions were rehearsed. Pilots could elect to retry test conditions until they were comfortable with all aspects of the experiment. In general, EPs did not elect to retry training runs and were able to demonstrate acceptable performance. Once the simulation was completed, EPs received approximately 1.2 hours of flight training in the C-206 to become familiar with the aircraft, flight crew protocol, research apparatus and scenarios.
During the experiments, the SPs would establish the aircraft approximately 1.0 nm from the start waypoint (i.e., Waypoint A for the VFR/VMC-like approaches or Waypoint B for the ILS approach) on the appropriate heading and altitude at which time control would be transferred to the EP. The EP would then complete the maneuver setup and perform the evaluation maneuver. Once the maneuver was completed, the SP would resume control of the aircraft and the EP would then answer the post-run questionnaires using an electronic questionnaire tool implemented on a pocket personal computer.
The order of test condition presentation was randomized (subject to some operational efficiencies) to further minimize learning, fatigue, and environmental effects. Generally, data collection was performed during two approximately 1.2 hour flights to avoid fatigue, though a few pilots completed the entire test matrix in one 2-hour flight. EP participation in the flight test usually spanned two days. A substantial effort was made to conduct the formal research evaluations within 4 hours after sunrise in order to reduce atmospheric variability effects within the resulting data. All flight operations were conducted in clear-day VMC.
Dependent Measures Post-run questionnaire results analyzed in this
paper consisted of the 3-D Situation Awareness Rating Technique (SART, [12]), 6-D Task Load Index (TLX, [13]), and Display Readability Rating (DRR, [14]) measures. Quantitative data recorded included flight path and airspeed errors.
To characterize their flight performance, the FAA Practical Test Standards (PTS) were applied. To earn an instrument rating, pilots must demonstrate the ability to maintain flight path and airspeed errors within the acceptable limits outlined in the PTS. As a result, the accepted and desired IMC performance conditions were based on the FAA PTS criteria as defined in [15]. The resulting “IFR PTS boundary”, used for both the ILS and the VMC-like maneuvers, began at a specified entry gate and ended at the DH. It was bounded by ¾-scale maximum deflections (1.5 dots) of localizer and glideslope indicators, and +/-10 kts of IAS error. For the VFR-like maneuver, vertical linear flight path error was used along with the distance along flight path to touchdown to generate ILS glideslope-like deviation data. Lateral linear flight path error, combined with the distance along the flight path to a point 1,000 beyond the departure end of Runway 24, was used to generate ILS localizer-like deviation data. While exceeding the IFR PTS does not directly infer an imminent accident, boundary violation does provide an indication of accident risk, or exposure.
For the VFR maneuver, the VFR PTS criteria was based on the VFR PTS, described in [16], and also recommended practices for operations at non-towered airports, [17], to develop assumed acceptable lateral and vertical errors for VFR operations. The resulting “VFR PTS boundary” was defined with dimensions of +/-0.5 nm laterally and +/-250 ft vertically, and +/-10 kts of IAS error at the start of the maneuver. The VFR PTS boundary linearly tapered from its full size during the final approach segment, with the tapering beginning at approximately 1.5 nm from the touchdown zone, narrowing from its nominal size down to 150 ft laterally and 0 ft vertically at the runway touchdown location. Analysis of the “VFR PTS boundary” ended at the same DH point as the other two approaches. While exceeding the VFR PTS boundary would not directly be a precursor to an
accident, boundary conformation does provide less exposure to accident risk.
Definition of Descriptive Method As previously stated, one objective of this
effort was to more fully define the effects from SVS displays and to test the hypothesis that SVS displays can effectively transform IMC into VMC flight. Application of MVDA classification techniques offered the potential to associate research results from the advanced display concepts with various significant reference condition results from conventional displays, prevalent within today’s GA operations. By including the significant reference conditions within the data set, a limited relationship between VMC and IMC flight was considered feasible. These significant reference conditions were represented by groups of data for specific combinations of display concept (BRD), pilot skill level (VFR, IFR, and High IFR), maneuver (ILS and VFR), and visibility (IMC or VMC) and were used as input data for the MVDA technique.
Classification of information is an important analysis tool in many industries (Ref. 18). One example is the classification of loan applicants as low- or high-credit risks based on elements of certain accounting metrics to provide a rapid, reasonably accurate expectation of results. MVDA is one such classification method and was employed for this study, combined with several common significantly different risks of pilot error situations, in an attempt to add increased dimension and clarity to the description of the effects of SVS displays.
Two different reference conditions under IMC were considered as reference conditions for classification: one condition (Group 1) was intended to represent an unacceptable risk for IFR operations while Group 2 was intended to represent an acceptable risk for IFR operations. A VMC condition was defined Group 3 for VFR operations and was intended to represent a very low-risk condition. Establishing these three groups of data within the MVDA provided an alternative method to describe the effects from SVS displays. For example, results from the advanced display concepts could be described as grouping more with one significant reference condition or another. In addition, through evaluation of the classification
capability of various MVDA configurations, assessments of the effectiveness of traditional measures to describe effects similar to those of SVS could be accomplished.
Group 1 was associated with the VFR pilots flying an ILS approach with the BRD display concept. VFR pilots lack the skills acquired through IFR training to integrate the information provided by the BRD display concept to safely perform ILS approaches. The resulting risk is unquestionably high for this test condition. Reference 19 states that 68% of fatal weather related accidents were attributed to “attempted VFR flight into IMC” mostly involving VFR pilots.
Group 2 was defined as the instrument-rated pilots also performing the ILS approach with the BRD display concept. This test condition reflects nominally accepted risk since instrument-rated pilots have received the required training and have demonstrated the ability to operate the aircraft via BRDs in IMC. While Group 2 is a nominally accepted operational concept, Reference 19 indicates that 1.63 fatal accidents per 100,000 flight hours occurred during day IMC flight producing approximately 20 percent fewer total accidents per 100,000 hours but almost three times the rate of fatal accidents as VMC.
Group 3 was defined as the H-IFR pilots performing a basic VFR traffic pattern with the BRD display concept. This condition was considered to have a very low risk due to the level of pilot skill, inferred by their large number of flight hours and commensurate training, as well as the benign nature of the VFR traffic pattern maneuver. Reference 19 indicates that 0.7 fatal accidents per 100,000 flight hours occurred in VMC. The above group designations defined the subset of runs (the discriminating conditions) to be utilized in the initial step of the MVDA.
Test Matrix The test matrix is provided in Table 2. Note
that the BRD display concept was not included in the test matrix for the VMC-like approach because of anticipated very poor performance. In Table 2, VMC indicates that no vision restriction device was used to restrict the EP’s visibility. Sim IMC

indicates that a standard IFR training vision restriction device was used by the EPs.
Table 2. Test Matrix
Test Condition
Maneuver Display Concept
Visibility
1 VFR BRD VMC 2 VFR SCFD VMC 3 VFR PBG VMC 4 VFR SVS VMC 5 ILS BRD Sim IMC 6 ILS SCFD Sim IMC 7 ILS PBG Sim IMC 8 ILS SVS Sim IMC 9 VMC-Like SCFD Sim IMC
10 VMC-Like PBG Sim IMC 11 VMC-Like SVS SIM IMC
The VFR and IFR pilots evaluated the BRD display concept for the ILS approach twice while the H-IFR pilots evaluated the BRD display concept for the VFR traffic pattern twice. The repeat evaluations of these test conditions were done to provide more data to the MVDA development process. For other data analyses (i.e., besides the MVDA), the repeat runs were not included. Overall, each EP flew 12 total data collection runs to complete the run matrix (4 VFR traffic patterns, 4 ILS approaches, 3 VMC-like approaches, 1 MVDA repeat).
Data Analyses and Results Results presented and discussed in this paper
focus on the aspects of the development and application of MVDA and the evaluation of advanced display concepts. A complete publication of all results is planned for a subsequent NASA technical paper.
Analysis of Group 1, Group 2, and Group 3 data Using Traditional Methods
The results of an initial analysis independent of the MVDA using traditional HF tools applied to the Group 1, Group 2, and Group 3 data are provided in this section. Analysis of these specific test conditions are included to provide insight into the MVDA results, which will follow.
An ANOVA conducted on the SART data for the Group 1, 2, and 3 conditions revealed the main effect as being highly significant statistically (F(2,31)=19.9, p<0.001). Mean pilots’ SA for the Group 1, 2, and 3 conditions are presented in Figure 6 which shows that Group 1 and 2 SA scores are similar to each other. Subsequent post-hoc analysis yielded no separation of Group 1 from Group 2. This similarity implies that the extensive training required to become an instrument-rated pilot is not significantly reflected in the SA data. Even though the instrument-rated pilots successfully acquired their IFR rating, their ability to decipher and interpret information from the BRD display concept and maintain their mental model was very low, especially when compared to the SA of Group 3 (note the statistically significant increase in SA of approximately 100 units because of VMC visibility).
1 2 3MVDA Input Group
-50
0
50
100
150SA
RT
Figure 6. Mean SART data for the MVDA input
groups with standard deviation bars.
Mean pilot workload, as defined by the TLX data for Groups 1, 2, and 3 are presented in figure 7. An ANOVA conducted on the TLX data revealed the main effect as being significant statistically (F(2,31)=7.383, p<.002). However, subsequent post-hoc analysis did not separate Group 1 from Group 2, a result similar to the SART data. This lack of separation implies that the extensive training required to become an instrument-rated pilot is not reflected in the TLX data either. Although the IFR pilots were able to maintain localizer, glideslope, and airspeed error to within acceptable limits, the TLX data indicates that their workload was still

very high, especially when compared to that of the statistically separable Group 3 data. And like the SA data, the TLX separation primarily only reflected the large differences between the VFR and ILS approaches.
1 2 3MVDA Input Group
0
25
50
75
TLX
Figure 7. Mean TLX data for the MVDA inputs groups with standard deviation bars.
1 2 3MVDA Input Group
0
2
4
6
DRR
Figure 8. Mean DRR data for MVDA input
groups with standard deviation bars.
Unlike the SART and TLX data, DRR data (Figure 8) actually seem to indicate a difference in the means between each of the three groups. Note that DRR scores of 4 require the pilot to answer no to decision tree question “Is it satisfactory without improvement?” and thus, indicate that deficiencies warrant improvement. For the DRR results, it is not surprising that Group 1 results indicated that achieving desired performance was challenging. Group 2 results indicated somewhat better ratings, resulting in a decrease in DRR scores by 1 unit with
a 2.5 unit decrease for Group 3. An ANOVA conducted on the DRR data revealed that the main effect was statistically significant (F(2,31)=4.8, p<0.015). However, subsequent post-hoc analysis could only differentiate Group 1 from Group 3, with Group 2 data being similar to both Group 1 and Group 3.
The mean percentages of time EPs were able to achieve appropriate PTS criteria are presented in Figure 9. Note that for Group 1 and Group 2 conditions, the IFR PTS was applied. For Group 3 condition, the VFR PTS was applied.
1 2 3MVDA Input Group
40
60
80
100
120
% T
ime
PTS
Figure 9. Mean percent time within appropriate PTS boundary with standard deviation bars.
As was the case for the DRR data, there seems to be a substantial difference between all three groups. Group 1 results indicate a capability to be within the IFR PTS boundaries approximately 58% of the time, reflecting the inability of the VFR pilots to continually decipher information and control the aircraft to within acceptable limits for the ILS in IMC. Group 2 data indicates that instrument-rated pilots were able to satisfy the IFR PTS standards approximately 83% of the time. Group 3 data indicate that the H-IFR pilots were able to be within the VFR PTS boundaries approximately 95% of the time. This is not surprising since the VFR lateral and vertical PTS boundaries were so large, combined with the pilots’ higher degree of skill achieved over thousands of hours of flight in addition to operating in clear-day VMC. An ANOVA performed on the PTS data revealed highly significant results (F(2,31)=13.7, p<0.001). However, subsequent post-hoc analysis placed the

Group 2 and 3 results together and was only able to separate Group 1 data from the others. The VFR pilots performed significantly worse than the instrument-rated pilots while flying the ILS approach with BRD display concept and the H-IFR pilots performing the VFR traffic pattern with BRD display concept.
The data analyses provided in this section were generated using traditional analysis tools and techniques that are common to the HF test discipline. From these results, it can be seen that various measures were able to distinguish differences resulting from the different groups of data. However, none of the metrics, taken individually, could adequately separate all three groups from each other. If the objective of this paper were to compare the results from Groups 1, 2, and 3, an inference from SART, TLX, DRR, and PTS results would be required.
Some observations that resulted from this type of analysis when applied to the advanced display concepts and maneuvers are merely summarized herein: 1) The advanced display concepts were significantly better compared to the BRD, in terms of SART, TLX, DRR and PTS (lateral and vertical flight path error primarily); 2) the PBG guidance resulted in significantly better lateral FTE than did the SCFD due to the turn anticipation provided by the tadpole guidance and pathway presentation; 3) the incorporation of terrain in the SVS display concept significantly improved SART, TLX and DRR results as compared to those of the PBG display concept, generating results similar to those of the VFR evaluations of the BRD; and 4) results for the SVS display concept indicated no effect of maneuver condition (VFR, ILS, VMC-like approaches) for all metrics considered, essentially removing much of the effect of limited visibility. The removal of significant effects of limited visibility and maneuver condition was only true for the SVS display concept.
Multi-Variable Discriminant Analysis The objective of the MVDA application was to
assess and blend the strengths of the various individual data measures, both qualitative and quantitative, and endeavor to establish a more comprehensive metric tool. This tool might be particularly critical to SVS applications due to the
profound effects that continuously-available computer-generated visibility may have on safety and operational capabilities.
The MVDA development process employed the three reference groups, discussed previously as input data. The DA tool in the SPSS® statistical analysis software package was used to generate MVDA functions of the various research measures. The DA performs linear discriminant analysis for two or more groups. The goal of discriminant analysis is to classify cases into one of several mutually exclusive groups based on their values for a set of predictor variables. In the analysis phase, a classification rule is developed using cases for which group membership is known. In the classification or prediction phase phase, the rule is used to classify cases for which group membership is not known. The grouping variable must be categorical, and the independent (predictor) variables must be interval or dichotomous, since they will be used in a regression-type equation. In general, the DA tool created coefficients for the various research measures (i.e., SART, TLX, DRR, and PTS), group centroids, and region boundaries, to optimize the correct classification capability of the input data.
Through evaluations of all various combinations of the four primary research measures, an optimization of the classification capability of the MVDA was performed, ultimately achieving the desired levels of classification capability of the input data. Two linear MVDA functions of the research measures were created. In general, Function 1 (F1) provided capability to differentiate between the Group 1 and Group 3. Function 2 (F2) helped to separate the Group 1 from the Group 2, although both F1 and F2 combined to separate all three from each other.
Table 3 provides the results of the MVDA classification optimization process indicating the best for each number and combination of MVDA variables (i.e., 1, 2, 3, or 4 measurement variables). For example, the 3-variable MVDA case considered all possible combinations of 3 of the 4 variables (i.e., TLX, SART, DRR, and PTS) to maximize the correct classification of the input data.
The PTS data provided the best single-variable classification of the input data, but only correctly

classified 58.5% of the three Groups. As more variables were added, the number of input cases correctly classified increased. The important results from Table 3 are: 1) if only a single variable MVDA could be used, then time within the PTS criteria provided the best choice; 2) the most-powerful classification variable to be added to PTS was SART, providing a 21% addition in capability to PTS alone; 3) TLX and DRR added to the capability of the classification, but only approximately 3% was added by each above what was already provided by PTS and SART.
Table 3 MVDA Classification
# Variables % Correctly Classified
1 PTS 58.5 2 SART+PTS 79.4 3 TLX+SART+PTS 82.4 4 DRR+TLX+SART+PTS 85.3
The 4-variable MVDA functions are:
F1=0.004*TLX+0.017*SART-0.017*DRR +0.0269*PTS-3.281
F2=0.012*TLX-0.018*SART+0.11*DRR-0.04954*PTS+1.989
Figure 10 presents the F1 values plotted against the F2 values for the Group 1, 2, and 3 data runs. In addition, the centroids of the 3 regions are also indicated by the solid symbols. Lines are provided that denote the boundaries of each region. From Figure 10, it can be seen that some cases that were expected to be classified as Group 2 evaluations actually were classified as Group 1 runs and vice versa. As indicated in Table 3 above, 85.3 percent of the 34 input data cases were correctly classified (only 5 were incorrectly classified, including a BRD ILS run flown and rated well enough by a VFR pilot to be classified as Group 3). Figure 10 represents a relationship between the three Groups, in terms of HF measurements, that enables a visualization of the effects of limited visibility conditions, IFR pilot training, and pilot experience.
-3
-2
-1
0
1
2
3
-5 -4 -3 -2 -1 0 1 2 3
Group 1Group 2Group 3Group 1 CentroidGroup 2 CentroidGroup 3 Centroid
F1 Figure 10. The MVDA input cases with region
centroids.
When considering the equations for F1 and F2 along with MVDA classification space in Figure 10, some observations are evident relative to the Group 1 centroid (intended to represent unacceptable risk). Increases in SART increase F1 while also decreasing F2 an almost equal amount. Both of these create a vector oriented towards the nexus of the Group 2 (intended to represent acceptable risk) and Group 3 (intended to represent low risk) regions. Decreases in TLX decrease F2 but also decrease F1, but to a much lesser extent. This indicates that workload is more associated with differentiating between Group 1 and Group 2 cases. Decreases of DRR decrease F2 and increase F1, again a smaller extent. This effect generates results that migrate towards the Group 2 region. Improved pilot performance, as indicated by PTS scores, also facilitate data migration into the Group 3 region (i.e., increase F1, decrease F2).
Application of MVDA The MVDA technique described in the
previous section was subsequently applied to data for each of the display concepts. Figure 11 illustrates the results for the BRD display concept for each type of pilot performing the ILS approach. Figure 11 indicates that a substantial portion of
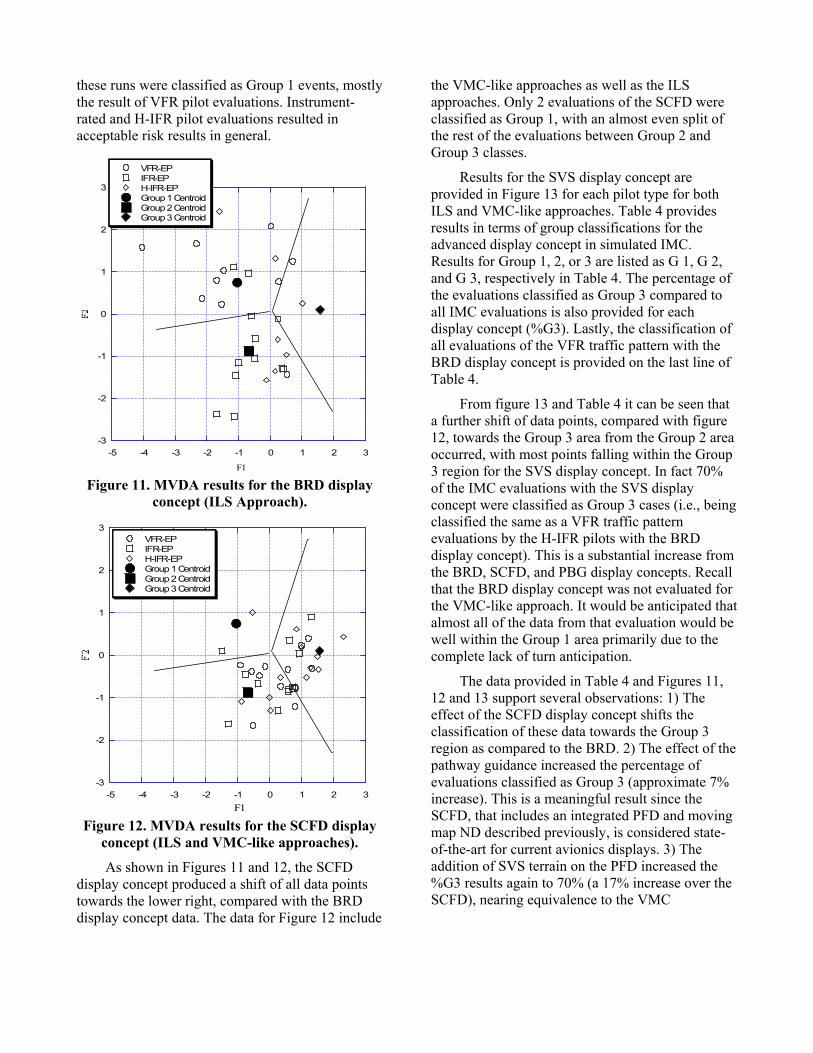
these runs were classified as Group 1 events, mostly the result of VFR pilot evaluations. Instrument-rated and H-IFR pilot evaluations resulted in acceptable risk results in general.
-3
-2
-1
0
1
2
3
-5 -4 -3 -2 -1 0 1 2 3
VFR-EPIFR-EPH-IFR-EPGroup 1 CentroidGroup 2 CentroidGroup 3 Centroid
F1
Figure 11. MVDA results for the BRD display concept (ILS Approach).
-3
-2
-1
0
1
2
3
-5 -4 -3 -2 -1 0 1 2 3
VFR-EPIFR-EPH-IFR-EPGroup 1 CentroidGroup 2 CentroidGroup 3 Centroid
F1
Figure 12. MVDA results for the SCFD display concept (ILS and VMC-like approaches).
As shown in Figures 11 and 12, the SCFD display concept produced a shift of all data points towards the lower right, compared with the BRD display concept data. The data for Figure 12 include
the VMC-like approaches as well as the ILS approaches. Only 2 evaluations of the SCFD were classified as Group 1, with an almost even split of the rest of the evaluations between Group 2 and Group 3 classes.
Results for the SVS display concept are provided in Figure 13 for each pilot type for both ILS and VMC-like approaches. Table 4 provides results in terms of group classifications for the advanced display concept in simulated IMC. Results for Group 1, 2, or 3 are listed as G 1, G 2, and G 3, respectively in Table 4. The percentage of the evaluations classified as Group 3 compared to all IMC evaluations is also provided for each display concept (%G3). Lastly, the classification of all evaluations of the VFR traffic pattern with the BRD display concept is provided on the last line of Table 4.
From figure 13 and Table 4 it can be seen that a further shift of data points, compared with figure 12, towards the Group 3 area from the Group 2 area occurred, with most points falling within the Group 3 region for the SVS display concept. In fact 70% of the IMC evaluations with the SVS display concept were classified as Group 3 cases (i.e., being classified the same as a VFR traffic pattern evaluations by the H-IFR pilots with the BRD display concept). This is a substantial increase from the BRD, SCFD, and PBG display concepts. Recall that the BRD display concept was not evaluated for the VMC-like approach. It would be anticipated that almost all of the data from that evaluation would be well within the Group 1 area primarily due to the complete lack of turn anticipation.
The data provided in Table 4 and Figures 11, 12 and 13 support several observations: 1) The effect of the SCFD display concept shifts the classification of these data towards the Group 3 region as compared to the BRD. 2) The effect of the pathway guidance increased the percentage of evaluations classified as Group 3 (approximate 7% increase). This is a meaningful result since the SCFD, that includes an integrated PFD and moving map ND described previously, is considered state-of-the-art for current avionics displays. 3) The addition of SVS terrain on the PFD increased the %G3 results again to 70% (a 17% increase over the SCFD), nearing equivalence to the VMC

performance by all pilots with BRD display concept.
Table 4 MVDA Classifications for All IMC Evaluations
All G-1 G-2 G-3 Total %G3 BRD 12 15 2 29 6.9 SCFD 2 15 19 36 52.8 PBG 3 11 21 35 60.0 SVS 1 11 28 40 70.0
VMC BRD All Pilots BRD 1 5 18 24 75.0
-3
-2
-1
0
1
2
3
-3 -2 -1 0 1 2 3
VFR-EPIFR-EPH-IFR-EPGroup 1 CentroidGroup 2 CentroidGroup 3 Centroid
F1 Figure 13. MVDA results for the SVS display
concept (ILS and VMC-like approaches).
Predictions from Results As stated previously, one objective of this
effort was to develop a classification method whereby several traditional human factors measures could be combined to add increased dimension and clarity for the evaluation of advanced avionics displays for conventional and advanced IMC operations. If it can be assumed that Groups 1, 2, and 3 results represent largely different risks of pilot error and can be associated with IMC and VMC flight, results from the MVDA, which includes both quantitative and qualitative measures support the following predictions: 1) The SCFD display concept compared to the BRD display concept data suggest a large reduction in the risk of pilot error. The resulting risk of pilot error falls
somewhat evenly between the Group 2 and Group 3 categories. 2) The risk of pilot error may be substantially reduced through the combination of pathway-based guidance and SVS terrain, as these results more closely resemble Group 3 than those of Group 2. Both of these predictions were based on operational concepts that include contemporary ILS as well as advanced VMC-like approaches including VFR pilots flying in simulated IMC. 3) SVS display concept IMC runs approached those for VMC operations using the BRD display concept; thus, suggesting that SVS display concepts may mitigate the effect of limited visibility.
The majority of accidents — 70.2 percent of all accidents and 67.8 percent of fatal accidents — were the result of pilot-related causes (Ref. 19). The multi-variable discriminant analysis for classification of the risk of pilot error for the various display concepts suggest the potential for safety as well as operational benefits existing for the advanced display concepts, and especially for the SVS display concept. It could be inferred through this analysis that the rate and type of accidents for SVS display concepts in IMC would resemble those of VMC flight.
Limitations of Current Study Within this report an attempt was made to
estimate and predict the ability of SVS displays to effectively transform IMC flight into VMC flight. Discussion employed comparisons of research data for advanced display concepts to results for known operating conditions with assumed levels of risk of pilot error. Much of the results rely on the ability of the Group 1, 2, and 3 MVDA input cases to accurately reflect and represent flight in VMC and IMC. Since the flight test was of limited duration, group representation by only 6 pilots, with 2 replicates, was possible. Another more basic limitation of the study is the ability of current HF tools (e.g., SART, TLX, DRR that were used in this analysis) to accurately measure the profound effects of all of the factors associated with pilot error, including the effects of outside visibility, display features, stress, training, etc. However, MVDA holds promise as a methodology from which these assessments may be possible particularly if more sensitive measurements of the construct are discovered and utilized. Future research should

evaluate other dependent variables for their efficacy in discriminating the multivariate construct of pilot error and risk.
Lastly, and perhaps most challenging, was the development of appropriate flight performance metrics, particularly for VFR flight. In future MVDA analysis, flight technical error, instead of PTS, may be attempted. Further, since the only real unquestionable performance metric for VFR approaches is to land on the runway and to not violate any airspace restrictions in doing so, performance boundaries are more challenging to establish. However, due to the administration of the test that set pilots precisely at the start point on downwind leg combined with the instructions to setup a 1 mile final approach, the assumed VFR PTS criteria used herein are somewhat reasonable. In addition, Reference 17 describes proper VFR approach procedures, which were incorporated in the VFR and VMC-like approach maneuvers.
Concluding Remarks A flight-test evaluation comparing
conventional instrumentation with several advanced display concepts was performed, for current and advanced IMC operations, across a range of pilot skill levels. Three reference conditions, consisting of display, simulated weather, and pilot proficiency combinations, were assumed to equate to different levels of the risk of pilot error. Using assessments from traditional HF tools that have been employed for a majority of SVS research to date, multi-variable discriminant analysis was employed to classify the flight test data from these reference conditions into potential risk areas associated with pilot error. The risk of pilot error classes included Group 1 operations, intended to represent an unacceptable risk such as those associated with VFR-rated pilots attempting to fly in IMC with BRD instrumentation; Group 2, intended to represent an acceptable risk as represented by IFR-rated pilots flying in IMC with BRD instrumentation; and Group 3, intended to represent a low risk such as that encountered when highly-trained pilots fly basic VFR traffic patterns.
Traditional analysis methods using HF data metrics (SA, pilot workload, display readability and PTS performance) could not statistically differentiate all three risk cases from one another.
Multi-variable discriminant analysis was performed that included a variation of combinations of the metrics to optimize the capability to discriminate among the three groups. Ultimately, the use of 4 HF data metrics provided 85% classification. This process highlighted the value of using a multi-variable approach that included situation awareness, among others, to attempt to quantify the profound and confounding significant effects of VMC visibility.
Based on the MVDA results, the following statements can be made: 1) Modern-day dual-display concepts that feature moving-map navigation displays with TAWS and route information along with integrated primary flight displays with single-cue flight directors improve performance and likely reduce the risk of pilot error; and 2) The incorporation of SVS terrain on PFDs along with highway-in-the-sky guidance purports to adds to the effectiveness of these advanced displays as indicated by the fact that 70% of the IMC evaluations of the SVS display concept grouped with the VMC Group 3 results. This increase in effectiveness may reduce the risk of pilot error for SVS displays in IMC operations to more resemble that of flight conducted in VMC with conventional avionics. It should be noted that these increases due to SVS displays concepts were achieved with relatively small 6.4” displays. Therefore, further improvements are hypothesized with larger displays (References 5 and 9).
The current effort evaluated scenarios in which all systems were functioning nominally over a small range of conditions and with a small representative sample of the pilot population. Extrapolations to other systems or operational environments may not be accurate or appropriate and requires further study. Future work should evaluate potential critical failure modes of SVS displays and compare and contrast those conditions with both failed conditions of current avionics and nominally functioning SVS displays. This type of effort would provide insight into the required reliability of various elements of synthetic vision display systems.
References [1] Glaab, L.; and Hughes, M., Terrain Portrayal for Head-Down Displays Flight Test, 22nd Annual Digital Avionics Systems Conference, 2003.

[2] Hughes, M.; and Glaab, L., Terrain Portrayal for Head-Down Displays Simulation Experiment Results, 22nd Digital Avionics Systems Conference, 2003.
[3] Takallu, M.; Wong, D.; Bartolone, A.; Hughes, M.; and Glaab, L., Interaction between Various Terrain Portrayals and Guidance/Tunnel Symbology Concepts for General Aviation Synthetic Vision Displays During a Low En-Route Scenario, Proceedings of the 23rd Digital Avionics Systems Conference, 2004.
[4] Wong, D.; Takallu, M.; Hughes, M.; Bartolone, A.; and Glaab, L., Simulation Experiment for Developing the Symbology for the Approach and Missed Approach Phases of Flight for Head-Down Synthetic Vision Systems Displays, Proceedings of the AIAA Modeling and Simulation Technologies Conference, 2004.
[5] Kramer, L., Prinzel, L., Bailey, R., & Arthur, J., Synthetic Vision Enhances Situation Awareness and RNP Capabilities for Terrain-Challenged Approaches, Proceedings of the AIAA Third Aviation Technology, Integration, and Operations Technical Forum, AIAA 2003-6814, 2003.
[6] Lemos K., Schnell T., Synthetic Vision Systems: Human Performance Assessment of The Influence of Terrain Density And Texture, In Proceedings of 22nd Digital Avionics Systems Conference, October 2003.
[7] Schnell T., Etherington T., Vogl T., Postnikov A., Field Evaluation of A Synthetic Vision Information System Onboard the NASA ARIES 757 at Eagle County Regional Airport, In Proceedings of 21st Digital Avionics Systems Conference, October 2002.
[8] Prinzel, L., Arthur, J., Kramer, L., and Bailey, R.: Pathway Concepts Experiment for Head-Down Synthetic Vision Displays, Proceedings- SPIE, The International Society For Optical Engineering, Proceedings of SPIE, Vol. 5424, Enhanced and Synthetic Vision 2004, Jacques G. Verly, Editors.
[9] Glaab, L. J., Kramer, L. J., Arthur, J. J., III, and Parrish, R. V., Flight Test Evaluation of Synthetic Vision Display Concepts at Dallas/Fort-Worth Airport, NASA-2003-TP212177, 2003.
[10] Bailey, R.; Kramer, L.; and Prinzel, L. III, Crew and Display Concepts Evaluation for
Synthetic / Enhanced Vision Systems. Proceedings- SPIE, The International Society For Optical Engineering, Proceedings of SPIE -- Volume 6226, Enhanced and Synthetic Vision 2006, Jacques G. Verly, Jeff J. Guell, Editors.
[11] Bartolone, A.; Glaab, L.; Hughes, M; Parrish, R., Initial development of a metric to describe the level of safety associated with piloting an aircraft with Synthetic Vision Systems (SVS) displays, Proceedings- SPIE, The International Society For Optical Engineering, Volume 5802, Enhanced and Synthetic Vision 2005, Jacques G. Verly, Editor, May 2005, pp. 112-126.
[12] AIAA (1993), Guide to Human Performance Measurement, Washington D.C., American Institute of Aeronautics and Astronautics.
[13] Hart, S., and Staveland, L., Development of the NASA Task Load Index (TLX): Results of Empirical and Theoretical Research, In P.A. Hancock & N. Meshkati (Eds.), Human Mental Workload, Elsevier Publishing, Amsterdam, Holland, 1988.
[14] Chiappetti, C., Evaluation of the Haworth-Newman Avionics Display Readability Scale, Naval Postgraduate School Thesis, Monterey, CA, 1994.
[15] FAA Flight Standards Service: Instrument Rating Practical Test Standards for Airplane, Helicopter and Powered Lift, April 2004.
[16] FAA Flight Standards Service: Private Pilot Practical Test Standards for Airplane (SEL, MEL, SES, MES., August 2002.
[17] AOPA Air Safety Foundation: Safety Advisory Operations and Proficiency, Number 3, Operations at Non-Towered Airports, 2006.
[18] Kiang, M., A Comparative Assessment of Classification Methods, California State University, CA, May 2002.
[19] AOPA Air Safety Foundation: 2001 Nall Report, General Aviation Accident Trends and Factors for 2000.