Effective Tax Rates under IP Tax Planningftp.zew.de/pub/zew-docs/dp/dp14111.pdf · Effective Tax...
50
Discussion Paper No. 14-111 Effective Tax Rates under IP Tax Planning Lisa Evers and Christoph Spengel
Transcript of Effective Tax Rates under IP Tax Planningftp.zew.de/pub/zew-docs/dp/dp14111.pdf · Effective Tax...

Dis cus si on Paper No. 14-111
Effective Tax Rates under IP Tax Planning
Lisa Evers and Christoph Spengel

Dis cus si on Paper No. 14-111
Effective Tax Rates under IP Tax Planning
Lisa Evers and Christoph Spengel
Download this ZEW Discussion Paper from our ftp server:
http://ftp.zew.de/pub/zew-docs/dp/dp14111.pdf
Die Dis cus si on Pape rs die nen einer mög lichst schnel len Ver brei tung von neue ren For schungs arbei ten des ZEW. Die Bei trä ge lie gen in allei ni ger Ver ant wor tung
der Auto ren und stel len nicht not wen di ger wei se die Mei nung des ZEW dar.
Dis cus si on Papers are inten ded to make results of ZEW research prompt ly avai la ble to other eco no mists in order to encou ra ge dis cus si on and sug gesti ons for revi si ons. The aut hors are sole ly
respon si ble for the con tents which do not neces sa ri ly repre sent the opi ni on of the ZEW.

Dis cus si on Paper No. 14-111
Effective Tax Rates under IP Tax Planning
Lisa Evers and Christoph Spengel
Download this ZEW Discussion Paper from our ftp server:
http://ftp.zew.de/pub/zew-docs/dp/dp14110.pdf
Die Dis cus si on Pape rs die nen einer mög lichst schnel len Ver brei tung von neue ren For schungs arbei ten des ZEW. Die Bei trä ge lie gen in allei ni ger Ver ant wor tung
der Auto ren und stel len nicht not wen di ger wei se die Mei nung des ZEW dar.
Dis cus si on Papers are inten ded to make results of ZEW research prompt ly avai la ble to other eco no mists in order to encou ra ge dis cus si on and sug gesti ons for revi si ons. The aut hors are sole ly
respon si ble for the con tents which do not neces sa ri ly repre sent the opi ni on of the ZEW.

Effective Tax Rates under IP Tax Planning
Lisa Evers · Christoph Spengel
Abstract: Tax planning with intangibles has become one of the most popular and most vividly debated topics in international taxation. We incorporate various intellectual property (IP) tax planning models into forward-looking measures of effective tax rates, namely the disposal of intangibles to low-tax subsidiaries, intra-group licensing arrangements, and intra-group contract R&D. In doing so, we draw upon the methodology put forward by Devereux and Griffith and amend this model by considering a research & development (R&D) investment which is carried out by a parent company, whereby the resulting intangible is exploited by a foreign subsidiary. We point out analytically under which conditions IP tax planning achieves the objective of reducing the effective average tax rate of the group. We find that the disposal of intangibles to low-tax subsidiaries does not achieve this tax planning objective, if the true value of the asset is subject to tax upon the disposal. We show to what extent the parent must understate the value of the intangible in order to reduce the group’s tax burden. We furthermore point out that contract R&D may generally achieve a significant lower effective tax burden. We present cost of capital and effect average tax rates to illustrate these findings.
JEL: F23, H25, H32, H87, K34
Keywords: corporate taxation, effective tax rate, tax planning, profit shifting, transfer pricing, intellectual property, intangible assets, contract R&D
________________________
We gratefully acknowledge financial support from the federal state of Baden-Württemberg within the scope of the research programme "Strengthening Efficiency and Competitiveness in the European Knowledge Economies" as well as from the Leibniz Association within the scope of the research programme “Tax Policy in the EU in an Environment of new Fiscal Institutions and Coordination Procedures”. We thank Martina Baumann, Jost Heckemeyer, Helen Miller Ulrich Schreiber and Johannes Voget for their valuable comments. Any errors remain the responsibility of the authors.
Lisa Evers (corresponding author) Centre for European Economic Research (ZEW), and University of Mannheim, Germany Address: ZEW GmbH, L 7, 1, 68161 Mannheim, Germany Email: [email protected], phone: +49 (0)621 1235 168, fax: +49 (0)621 1235 223
Christoph Spengel University of Mannheim, Germany, and Centre for European Economic Research (ZEW)

Evers and Spengel (2014) Effective Tax Rates under IP Tax Planning
1
1 Introduction
Intangible assets constitute a major value-driver for multinational companies.
The related intellectual property (IP), most notably patents, trademarks, and
copyrights, usually does not have a fixed geographical nexus and can be
relocated without significant (non-tax) costs. By allocating valuable IP to group
companies resident in low-tax countries multinational companies can use this
flexibility to reduce their overall tax burden.1 Indeed, recent empirical evidence
indicates that patent applications are responsive to corporation tax2 and that
intangible assets are more likely to be held by low-taxed subsidiaries.3
Tax planning involving intangible assets has become increasingly popular and
recently received widespread attention, as it has been associated with strikingly
low effective tax rates on foreign profits of high-tech multinationals such as
Google and Apple.4 For example by way of allocating valuable intangible assets
to an intra-group IP holding company resident in a low-tax country, which
subsequently licenses out these intangible to operating group companies,
profits may be shifted from high-tax to low-tax countries. Within the European
Union (EU), the Interest & Royalties Directive ensures that such intra-group
royalty payments are not subject to any additional source country withholding
tax in case certain participation requirements are met. Transfer pricing rules aim
to ensure that the transfer of valuable intangible assets triggers taxation. It is,
however, difficult to determine the ‘true value’ of intangibles for transfer pricing
purposes as they are rarely traded on external markets due to their uniqueness
and their central role in the generation of excess profits.
As an alternative to the disposal of IP, IP may be allocated to IP holding
companies by way of (intra-group) contract R&D. This involves that an IP holding
1 See Darby and Lernaster (2007), Fuest et al. (2013), p. 308, Kang and Ngo (2012), Verlinden
and Smits (2009). 2 See Griffith et. al. (2014), Karkinsky and Riedel (2012). 3 See Dischinger and Riedel (2011). 4 See Sullivan (2012), p. 655.

Evers and Spengel (2014) Effective Tax Rates under IP Tax Planning
2
company commissions another group entity to perform R&D activity. As a
consequence, the commissioning party obtains the legal ownership and
reimburses the R&D company through a contract R&D fee which is usually
determined on a cost-plus basis.5 The IP holding company then licenses out the
IP to operating group companies.
The above sketched-out IP tax planning models allow for locating the R&D
activity and the income flows from the commercialisation of the resulting
intangible assets in different jurisdictions. This way, multinational companies
can make use of an attractive research infrastructure and generous R&D tax
incentives in one country and benefit in another from low tax rates on the
income from exploiting intangible assets.
The contribution of this paper is to analyse popular IP tax planning models
drawing on effective tax rates. For this purpose, we incorporate IP tax planning
models into forward-looking measures of the cost of capital and the effective
average tax rate (EATR). In doing so, we build upon the methodology of Devereux
and Griffith6 but focus on investments in self-developed intangible assets. By
extending the analytical tools available for determining effective tax burdens to
incorporate cross-border IP tax planning,7 we pursue the following objectives.
Our first aim is to point out the effect of IP tax planning models on the effective
tax burden. Disregarding tax planning opportunities when determining effective
rates may overstate the effective tax burden of multinational companies.
Strikingly low effective tax rates reported on the balance sheets of certain
multinational companies such as Apple, Google, and Cisco point to this.8
Furthermore we compare the effective tax burdens of cross-border investments
involving tax planning with the effective tax burdens of a purely domestic
5 See OECD (2010), para 7.41, Russo (2007), p. 172. 6 See Devereux and Griffith (1999, 2003). 7 The OECD also proposes a model for determining effective tax rates that incorporates cross-
border tax planning. In some respects (e.g. the calculation of the EATR), this model differs from the Devereux and Griffith model (see OECD (2013a), pp. 135 et seq.).
8 See Sullivan (2012), p. 655.

Evers and Spengel (2014) Effective Tax Rates under IP Tax Planning
3
investments. That way, competitive advantages of multinationals associated
with tax planning opportunities become evident.
Second, our interest is to point out which features of the tax system drive the
effective tax burden when companies may make use of IP tax planning. In
particular, we highlight under which conditions the IP tax planning models are
associated with a tax advantage compared to domestic investment. This also
provides some orientation on which features of tax systems are most relevant
when it comes to reducing the tax planning leeway of multinational companies.
Third, by drawing on effective tax measures, we aim towards highlighting and
analysing potential incentive effects of taxes on investment decisions, such as
where to create and exploit intangible assets, in case multinational companies
face IP tax planning opportunities.
The remainder of this paper is structured as follows: section 2 briefly introduces
the Devereux & Griffith model. In section 3, we adapt this model to incorporate
popular IP tax planning models and provide an analytical analysis of the effects
of these models on the effective tax burden. In section 4 we present cost of
capital and effective average tax rates to illustrate the findings of section 3.
Section 5 finally summarises the main findings.

Evers and Spengel (2014) Effective Tax Rates under IP Tax Planning
4
2 The Devereux & Griffith model for calculating effective tax rates
We apply the methodology put forward by Devereux and Griffith9 when modelling
the impact of IP Boxes on the effective tax burden. This model is based on the
assumption that companies invest in capital as long as the (decreasing)
marginal returns cover the marginal costs, the cost of capital. The cost of capital
is the minimum required pre-tax real rate of return on the investment, given a
post-tax real rate of return of an alternative investment on the capital market
required by the investor (‘financial investment’ in what follows). In line with
neoclassical investment theory, this approach rests on the assumption of a
perfect capital market under certainty and that the real investment is successful.
The cost of capital is used to analyse the effects of tax on marginal investment
decisions, and therefore on the scale of investment. In turn, the effective
average tax rate (EATR) demonstrates the effects of tax on a profitable
investment project. The EATR is calculated as the percentage difference in the
net present value (NPV) of an investment in both the absence and presence of
tax. This measure is therefore relevant for exploring how tax affects companies’
choices between different profitable investment opportunities. Discreteness of
investment decisions can arise for example when investment funds are limited,
so that not all profitable investments can be carried out. Deciding in which
country to carry out a profitable investment project i.a. constitutes a discrete
investment decision. A comparison of the EATR therefore allows for assessing
the attractiveness of countries in terms of a location for investment in R&D
giving rise to intangible assets and in terms of a location for the exploitation of
such assets.
The model refers to a hypothetical investment that takes place in one period and
generates a return in the next period. The standard case of the Devereux &
Griffith Model refers to an investment project comprising five different kinds of
assets. These are machinery, industrial buildings, inventory, financial assets,
9 See Devereux and Griffith (1999, 2003). They build on the work of Jorgenson (1963), Hall
and Jorgensen (1967) and King and Fullerton (1984).

Evers and Spengel (2014) Effective Tax Rates under IP Tax Planning
5
and acquired patents.10 Here, we focus on an R&D investment giving rise to a
self-developed patent thereby only considering one asset. In doing so, we
assume that R&D investment expenditures fully constitute current R&D expenses
such as labour expenses for R&D personnel. This simplifying assumption reflects
the fact that by far the biggest share of R&D expenditures generally constitutes
current expenses.11
Equation (1) represents the after-tax NPV of the R&D investment giving rise to a
patent financed with equity. In line with previous literature, the R&D investment
is modelled based on the decisive assumption that the R&D expenditures’ value
is not realised immediately but accrues over several periods.12 The tax treatment
generally deviates from this: in most EU countries, current R&D expenses are
immediately deductible from the tax base and generally do not have to be
capitalised for tax purposes when giving rise to an intangible asset.13
In what follows, we take the perspective of a large multinational company which
raises investment funds on the international capital market. Therefore the
taxation of the individual investors is disregarded in what follows.14 In addition,
we assume that the investment is financed by means of equity.
1
1
1
(1)
10 For a more detailed discussion of the model, see Devereux and Griffith (1999, 2003),
Schreiber et al. (2002), Spengel (2003), pp. 68 et seq. 11 See Cameron (1996), Dougherty et al. (2007), OECD (2012a). 12 See Hall and van Reenen (2000), p. 451, McKenzie (2008). 13 Only Cyprus, Estonia, Portugal, Slovenia and Sweden stipulate the capitalisation of self-
developed patents and certain other intangible assets provided certain recognition conditions are fulfilled. In Estonia, profit determination under the distribution tax follows IAS 38 of the International Financial Reporting Standards which stipulates the capitalisation of self-developed intangible assets if certain requirements are fulfilled. For an overview of the treatment of R&D expenses and capitalisation of self-developed intangible assets see Endres et al. (eds.) (2007), pp. 36 et seq., Spengel and Zöllkau (2012), pp. 57 et seq., 65.
14 In this case, it is reasonable to assume that due to the lack of information concerning the tax treatment of the marginal shareholder the taxation at the shareholder level is not taken into account for investment decisions.
Evers and Spengel (2014) Effective Tax Rates under IP Tax Planning
6
Profit taxes, most notably corporate income taxes, affect the NPV of the R&D
investment in two ways. First, the tax allowance granted for R&D expenses acts
as a tax shield which shields part of the investment return from taxation. This is
because most countries allow current R&D expenses incurred in the creation of a
self-developed intangible asset to be expensed immediately when they are
incurred. This reduces the investment outlay in period 1 (first term of equation
(1)).
⋯
(2)
Equation (2) denotes the NPV of tax allowances in case of capitalisation of the
self-developed patent. The second term of equation (2) depicts the
capitalisation of the patent if this is stipulated by the tax code. Among the EU
member states this is rarely the case.15 This compensates for the immediate
deduction of the R&D expenditures depicted by the first term of equation (2)
(variable reflects the share of R&D expenditures which may be immediately
deducted, usually 100%). Please note that we make the simplifying assumption
that the immediate deduction and subsequent capitalisation occur in the same
period.16 Hence, the first two terms of equation (2) cancel each other. The third
term accounts for the subsequent depreciation of the patent (applying the
straight-line depreciation method). Variable represents the depreciation rate
and denotes the useful life of the asset. Variable i depicts the nominal capital
market interest rate.
15 See footnote 13. 16 As a consequence, there are no timing effects resulting from the fact that R&D expenses
remain deductible until a self-developed intangible asset is created. Within this two-period framework, the alternative is to assume that capitalisation and exploitation happen in the second period. However, this would not lead to significantly different results. Since the model considers a perturbation of the capital stock assuming that an investment is antedated by one period, the actual length of the R&D investment is irrelevant.

Evers and Spengel (2014) Effective Tax Rates under IP Tax Planning
7
If self-developed intangibles do not have to be capitalised, the NPV of the tax
allowances equals the first term of equation (2). In this case the NPV of the tax
allowances is equal to the profit tax rate ( ).
As second tax consequence, the return generated from exploiting the patent
which accrues in the second period is subject to profit tax at the rate τ (second
term of equation (1)). This return comprises the real financial return of the
investment (p) and the one-period cost of depreciation (δ). The variable π
denotes the inflation rate. The third term of equation (1) finally reflects that the
model considers a one-period perpetuation of the capital stock instead of a
permanent capital stock increase.17
The cost of capital denoted by equation (3) is derived by setting the after-tax
NPV of the investment (equation (1)) equal to zero, and rearranging the equation
to isolate the rate of return p.
(3)
Another way of expressing the distortions which taxation exerts on investment
decisions at the margin is the effective marginal tax rate (EMTR). If personal
taxes are ignored, the EMTR is just a simple monotonous transformation of the
cost of capital. It represents the tax wedge between the cost of capital and the
real market interest rate, denoted by , divided by the cost of capital. Put
differently, it is the share of the cost of capital which is taxed away. The EMTR is
illustrated by equation (4). Please note that the real capital market interest rate
is derived from the nominal capital market interest rate assuming the ‘Fisher
effect’ which implies the following equation: 1 1 ∗ 1 .18
(4)
The EATR is finally defined as the difference between the NPV of the investment
in the absence of taxes (denoted by ∗ where ∗ 1⁄ ) and in the
17 For a more detailed discussion of the methodology, see Devereux and Griffith (1999, 2003),
Spengel and Lammersen (2001), and Schreiber et al. (2002). 18 See Fisher (1930).

Evers and Spengel (2014) Effective Tax Rates under IP Tax Planning
8
presence of taxes ( ) put in relation to the NPV of the pre-tax total income
stream net of depreciation (the rate of return). This is depicted by equation (5).
∗ / (5)

Evers and Spengel (2014) Effective Tax Rates under IP Tax Planning
9
3 Incorporating cross-border IP tax planning into measures of effective
tax rates
Here, we further develop the model framework to cover cross-border R&D
investments where a parent company creates a patent through R&D activity
which is subsequently exploited by an operative subsidiary resident in another
jurisdiction. Such a separation of functions may be driven by non-tax factors
(e.g. location factors) and tax factors (e.g. tax planning opportunities). With
regard to location factors, such as infrastructure and market access, the ideal
R&D location might not also be the preferred location for exploiting the created
intangible asset. When it comes to taxes, different aspects are relevant in order
to determine the tax efficient location for R&D investment on one hand and the
exploitation of intangible assets on the other hand. Whereas maximising the
value of tax deductions for R&D expenses is at the heart of the first decision
(including making use of input-oriented R&D tax incentives), low profit tax rates
for income from exploiting intangible assets are pivotal to the second.
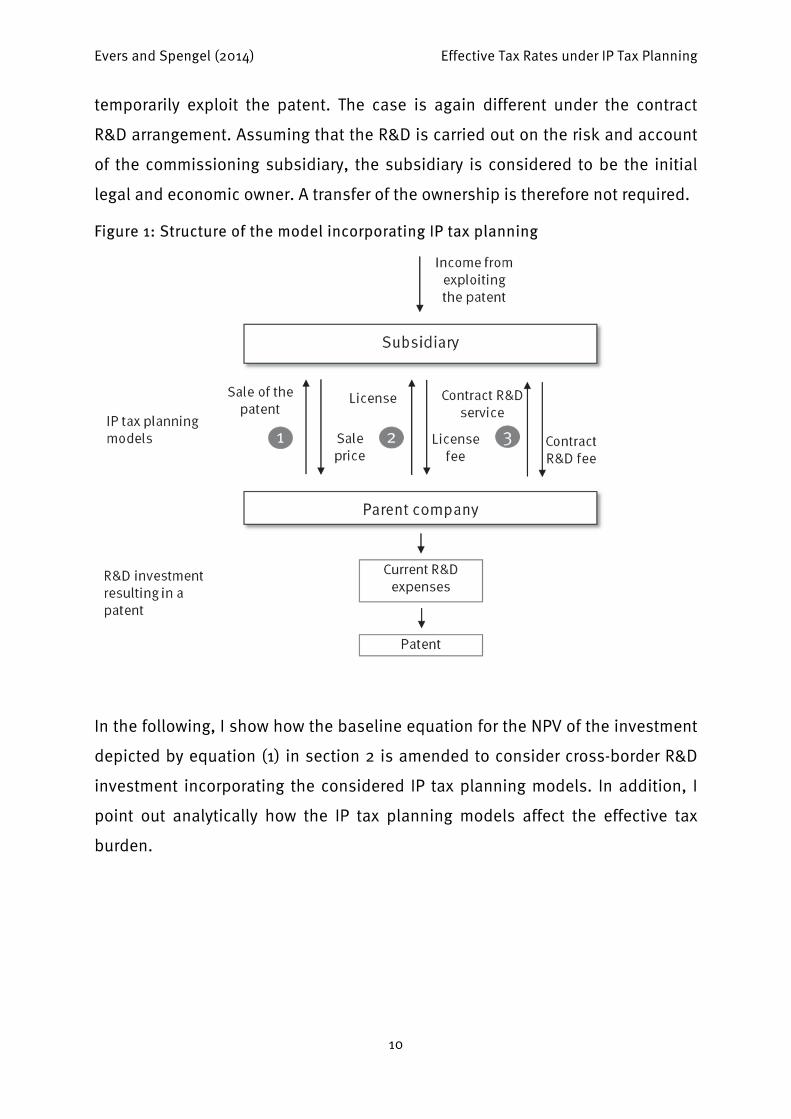
We consider three different IP tax planning models which make use of valuable
intangible assets and are characterised by locating R&D activity and exploitation
in different jurisdictions. These include (i) the intra-group disposal of IP from the
parent to an operating subsidiary, (ii) intra-group licensing, and (iii) intra-group
contract R&D where the operating subsidiary commissions the parent to perform
R&D activity on the subsidiary’s risk and account. Figure 1 illustrates the
structure of the model for calculating effective tax burdens incorporating these
three IP tax planning models.
In all of these three IP tax planning models it is the parent company which
performs the R&D activity and the subsidiary which exploits the patent within
the scope of its operating activity. However, with respect to the ownership of the
patent the models differ. The disposal involves that the legal and economic
ownership is transferred from the parent to the subsidiary. In contrast to this,
the licensing arrangement involves that the parent retains the legal ownership of
the patent and that the subsidiary solely obtains a license constituting a right to
Evers and Spengel (2014) Effective Tax Rates under IP Tax Planning
10
temporarily exploit the patent. The case is again different under the contract
R&D arrangement. Assuming that the R&D is carried out on the risk and account
of the commissioning subsidiary, the subsidiary is considered to be the initial
legal and economic owner. A transfer of the ownership is therefore not required.
Figure 1: Structure of the model incorporating IP tax planning
In the following, I show how the baseline equation for the NPV of the investment
depicted by equation (1) in section 2 is amended to consider cross-border R&D
investment incorporating the considered IP tax planning models. In addition, I
point out analytically how the IP tax planning models affect the effective tax
burden.

Evers and Spengel (2014) Effective Tax Rates under IP Tax Planning
11
3.1 Disposal of a patent to an operating subsidiary
3.1.1 Incorporating the disposal in the model
Equation (6) illustrates the after-tax NPV of an equity-financed R&D investment
giving rise to a patent, which is subsequently transferred to an operating
subsidiary. Please note that we assume that dividends are exempt from
withholding tax at source. This assumption in particular holds true for
multinational groups of companies resident in the EU where the Parent &
Subsidiary Directive ensures that dividends are exempt from withholding taxes
upon meeting certain participation requirements. In addition, we assume that
dividends are also exempt from corporate income tax in the hands of the parent
company.19
1
1
(6)
The disposal has three tax consequences. First, it triggers taxation of the sales
price (denoted by TP) paid by the subsidiary on the level of the parent (second
term of equation (6)). This is referred to as ‘exit taxation’ in what follows.
Second, the sales price forms the basis for tax depreciation in the source
country, provided the source country accepts the sales price. This involves a
‘step-up’ if the sales price exceeds the historical costs of creating the patent
(depicted by variable in the first term of equation (6)). Third, the income
from exploiting the patent is subject to the source country tax rate instead of to
the residence country tax rate (third term of equation (6).
We discuss these three elements in detail below. As in the domestic case, the
last term of equation (6) reflects that the model considers a one-period
perpetuation of the capital stock instead of a permanent increase of the capital
stock.
19 With the exception of Ireland, all EU member states exempt foreign dividends in relation to
substantial participations from corporate income tax (see Spengel et al. (2014), Table A-9, p. A-23 et seq.).

Evers and Spengel (2014) Effective Tax Rates under IP Tax Planning
12
3.1.1.1 First tax consequence: exit taxation at the level of the parent company
The disposal triggers taxation of the sales price received by the parent in the
residence country, denoted by (second term of equation (6)). This ‘exit tax’
reduces the NPV of the investment project. Assuming that the self-developed
patent does not have to be capitalised for tax purposes (which is the case in
most EU countries)20 and therefore has a tax book value of zero, the tax base of
the exit tax equals the sales price. If the sales price does not fall below the initial
investment expenditures incurred by the parent, the exit tax exactly offsets the
original deduction of the R&D investment expenditures (depicted by in the
first term of equation (6)). In order to integrate the disposal of the patent in the
two-period framework of the Devereux & Griffith model, we assume that the
transfer occurs in the same period as the creation of the asset by way of the R&D
investment.21
3.1.1.2 Second tax consequence: step-up at the level of the subsidiary
Variable in the first term of equation (6) depicts the second tax consequence
of the disposal. Provided the subsidiary’s residence country (‘source country’ in
what follows) accepts the price paid for the patent, this transfer price will form
the basis for tax depreciation in the source country. This involves that the
disposal is associated with a ‘step-up’ in the depreciable base in cases where
the sales price exceeds the R&D investment expenditures. Hence, transferring
the patent to the subsidiary offers the possibility to deduct more than the
historical costs from the source country tax base by means of tax depreciation.22
In case the patent is transferred to a low-tax country, this effect is, however, 20 See footnote 13 in section 2 for details. 21 See footnote 16 in section 2 for details. 22 We assume that the parent as well as the subsidiary generate sufficient other income so
they may immediately fully make use of any tax deductions (i.e. taxpayers are not tax-exhausted). This assumption is most appropriate in the case of large mature companies that generate income from other investment projects. If, in contrast to this, the taxpayer is tax-exhausted, the tax benefits associated with tax allowances are delayed. As a consequence, the NPV of tax allowances is lower and thereby the effective tax rates are higher as in the case of no tax-exhaustion. See Devereux et al. (2002).

Evers and Spengel (2014) Effective Tax Rates under IP Tax Planning
13
mitigated by the fact that the tax value of the depreciation allowances is
determined by the lower source country tax rate.
Equation (7) illustrates the NPV of the tax allowance granted by the source
country, assuming straight-line depreciation.23 Variable denotes the
periodical depreciation rate and variable depicts the useful life for tax
purposes where 1⁄ .
, ∗ ∗ ∗ ⋯ ∗ ∗ 1 (7)
Equation (7) is further simplified (equation (7’)) by making use of the present
value factor c. For the case of straight-line depreciation, the present value factor
is reflected by equation (8).24
∗ ∗ (7’)
1 (8)
Analogous to the immediate deduction of the R&D investment expenditures
granted by the residence country (denoted by the term in the first term of
equation (6)), the step-up increases the after-tax NPV of the investment project.
In fact, the step-up may partly compensate for the exit tax’s negative effect on
the NPV. This is analysed in more detail in section 3.1.3.
It is interesting to note that the recapture of the immediate deduction of the R&D
investment expenses caused by the exit taxation and the subsequent step-up in
the source country involves a switch from a cash-flow tax (immediate deduction
of investment expenditures) to a profit tax (periodical depreciation of investment
expenditures).
23 This is the most common tax depreciation method for intangibles. For the EU member
states, see Spengel et al. (2014), Table A-8, pp. A-21 set seq. For additional countries see CBT Tax Database, download: http://www.sbs.ox.ac.uk/ideas-impact/tax/publications/data.
24 Corresponding factors may be derived for other depreciation methods such as declining-balance depreciation. See Devereux et al. (2008), p. B-2.

Evers and Spengel (2014) Effective Tax Rates under IP Tax Planning
14
3.1.1.3 Third tax consequence: taxation of the investment returns in the residence country of the subsidiary instead of in the parent country
As a third tax consequence of the disposal, the returns from exploiting the
patent are subject to corporate income tax in the source country at the rate .
This is reflected by the third term of equation (6). Hence, by transferring the
patent to a subsidiary resident in a lower-tax country, the multinational company
is able to reduce the tax burden on the returns from exploiting the patent. This
positively affects the after-tax NPV of the investment project.
3.1.2 Determining the transfer price and the exit tax base
Transfer pricing rules generally require that the sale price paid by the subsidiary
is in line with the arm’s length principle. This involves that the intra-group
disposal of the patent must be set by reference to what would have been agreed
by unrelated parties in identical or at least comparable transactions.25 However,
due to the uniqueness of intangible assets, comparable prices from transactions
with unrelated parties as required by the arm’s length principle are rarely
available.26 The ‘cost approach’ and the ‘income approach’ constitute two
alternative approaches to the ‘market approach’, on which transfer pricing rules
are based. The ‘cost approach’ approximates the value of an asset by referring to
the costs of its creation (increased by the costs of its disposal). However, it is
widely perceived that the costs incurred in the creation of an intangible asset are
no suitable indicator for their value.27 The ‘income approach’ estimates the value
of an intangible asset by referring to the estimated value of the future economic
benefits which the asset is expected to generate during its economic lifetime.28
25 See Article 9 (1) OECD Model Tax Convention on Income and on Capital, Boos (2003), p. 3,
Cottani (2011), pp. 19 et seq., Henshall (2013), pp. 5 et seq. and 14 et seq. 26 We will not address the theoretical issues associated with the arm’s length principle here.
For details, see Boos (2003), p. 12, Biegalskie (2010), Durst (2010), p. 249, Devereux and Keuschnigg (2009).
27 See Boos (2003), p. 77. 28 See Boos (2003), p. 81.

Evers and Spengel (2014) Effective Tax Rates under IP Tax Planning
15
According to the recent discussion draft of chapter six of the OECD transfer
pricing guidelines,29 income-based techniques such as valuation techniques
drawn from financial valuation practice may, depending on the circumstances,
be used as part of one of the methods approved by the OECD30 or as an
independent transfer pricing method.31
We do not address the complex issues associated with the choice and the
application of the various transfer pricing methods proposed in the OECD
transfer pricing guidelines to intangible assets32. Instead we generalise this
issue by assuming that the transfer price is based on the earnings value (EV) of
the patent. This value can be determined based on the economic parameters of
the model.33 As depicted by equation (9), the earnings value is determined as
the present value of the sum of future cash-flows generated by exploiting the
patent, which is equal to the sum of the investment return ( ) and the economic
depreciation rate ( ).34
∑ (9)
29 See OECD (2013b). The version of the draft of chapter six of the OECD transfer pricing
guidelines published in July 2013 still constitutes a working document and does not yet reflect a consensus among OECD member states.
30 In general, the transfer pricing methods put forward in chapter two of the OECD transfer pricing guidelines also pertain to transactions involving intangible assets: the ‘comparable uncontrolled price method’ (CUP), the ‘resale price method’, the ‘cost-plus method’, the ‘transactional net margin method’, and the ‘transactional profit split method’. See OECD (2010), para 6.13, OECD (2013b), para 125.
31 See OECD (2012b), para 109. 32 See Boos (2003), p. 11-14. 33 The transfer price stipulated by tax provisions may also exceed the earnings value as
determined from the perspective of the selling party. To give an example, the business restructuring provisions introduced in Germany in 2008 require that when determining transfer prices for whole business units, synergies generated by the acquiring party as well as profits associated with lower operating costs in the residence country of the acquiring party also have to be taken into account. See Wolter (2011), p. 356.
34 Drawing on Klemm (2012).
Evers and Spengel (2014) Effective Tax Rates under IP Tax Planning
16
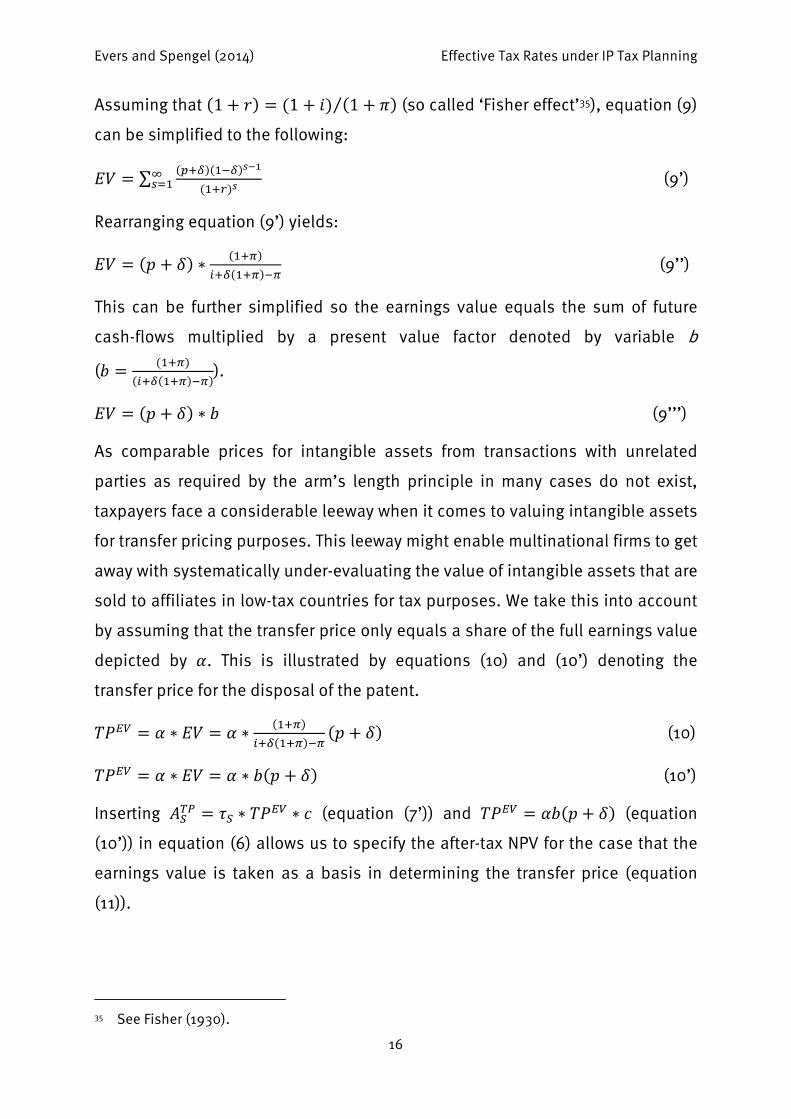
Assuming that 1 1 1⁄ (so called ‘Fisher effect’35), equation (9)
can be simplified to the following:
∑ (9’)
Rearranging equation (9’) yields:
∗ (9’’)
This can be further simplified so the earnings value equals the sum of future
cash-flows multiplied by a present value factor denoted by variable b
( ).
∗ (9’’’)
As comparable prices for intangible assets from transactions with unrelated
parties as required by the arm’s length principle in many cases do not exist,
taxpayers face a considerable leeway when it comes to valuing intangible assets
for transfer pricing purposes. This leeway might enable multinational firms to get
away with systematically under-evaluating the value of intangible assets that are
sold to affiliates in low-tax countries for tax purposes. We take this into account
by assuming that the transfer price only equals a share of the full earnings value
depicted by . This is illustrated by equations (10) and (10’) denoting the
transfer price for the disposal of the patent.
∗ ∗ (10)
∗ ∗ (10’)
Inserting ∗ ∗ (equation (7’)) and (equation
(10’)) in equation (6) allows us to specify the after-tax NPV for the case that the
earnings value is taken as a basis in determining the transfer price (equation
(11)).
35 See Fisher (1930).

Evers and Spengel (2014) Effective Tax Rates under IP Tax Planning
17
1 ∗ ∗1
11
∗ ∗ (11)
From this, the cost of capital is derived by setting equation (11) equal to zero and
isolating the rate of return yielding equation (12). This deviates from the
standard formula for a domestic investment where the parent both creates and
exploits the patent depicted by equation (3) with respect to the second term of
the denominator.
(12)
The EATR is finally determined by drawing on equation (11) following the same
approach as in section 2 for domestic investments.
3.1.3 Disentangling the tax effects associated with the disposal
The three tax consequences of the disposal of the patent - the exit tax, the step-
up and taxing of the returns at the source country tax rate - all affect the after-tax
NPV of the cross-border investment and consequentially the effective tax burden
in different ways. The exit tax negatively affects the after-tax NPV of the
investment, whereas the step-up granted by the source country affects it
positively. The effect of the application of the source country (instead of the
residence country) tax rate on the patent income tax burden depends on the tax
rate differential. If the source country tax rate is lower than the residence country
tax rate, the after-tax NPV is positively affected by the application of the source
country tax rate. A higher source country tax rate has the opposite effect.
In the following section, we examine the individual tax effects in order to point
out the conditions under which the disposal of a patent to a low-tax country
achieves its tax planning objective of reducing the group’s overall tax burden
compared to a domestic investment of the parent. We show that in case the
disposal of a patent to a lower-tax country triggers an exit tax on the full earnings
value, the overall effect on the after-tax NPV of the investment is generally
negative. This implies that the disposal does not achieve the tax planning

Evers and Spengel (2014) Effective Tax Rates under IP Tax Planning
18
objective. In contrast to this, if only a share of the earnings value is subject to
the exit tax, the disposal may result in a lower after-tax NPV compared to a
domestic investment of the parent company indicating that the disposal
achieves its tax planning objective.
3.1.3.1 Effects of the disposal of a patent which triggers an exit tax on the full earnings value
In order to point out whether the disposal positively or negatively affects the
after-tax NPV and thereby the effective tax burden, we determine the difference
between the after-tax NPV of a cross-border investment and the after-tax NPV of
a purely domestic investment of the parent. This is denoted by variable ∆ and
illustrated by equation (13). Drawing on the equation for the EATR,36 a positive
effect of the disposal on the after-tax NPV (illustrated by ∆ 0) leads to a
reduction of the effective average tax burden due to the disposal.
∆ (13)
∆
(13’)
By replacing by ∗ ∗ (equation (7’)), equation (13’) can be further
simplified to the following:
∆ ∗ ∗ 1 (14)
In the following, we assume that the full earnings value is taken as a basis for
the sale price of the patent. Inserting equation (10’) where 1 results in
equation (15).
∆ ∗ ∗ 1 (15)
This can be further simplified to equations (15’) and (15’’).
∆ ∗ ∗ (15’)
36 See equation (5) in section 2.

Evers and Spengel (2014) Effective Tax Rates under IP Tax Planning
19
∆ 0 (15’’)
Equation (15’’) shows that the disposal of a patent triggering an exit tax on the
full earnings value reduces the after-tax NPV of the investment as opposed to a
domestic investment of the parent (recall ∈ 0; 1 )37. This finding is
independent from whether the tax rate differential is positive or negative. Hence,
the disposal also reduces the NPV if the source country tax rate exceeds the
residence county tax rate. The after-tax NPV is only unaffected by the disposal in
case the source country tax rate is zero.
The reason for the general negative effect of the disposal on the NPV is that the
negative effect of an exit tax on the full earnings value of the patent
overcompensates the positive effect of a lower on-going tax burden on the
patent income (considering a transfer to a low-tax country) and of a higher
depreciable base in the source country due to a ‘step-up’.
In summary, if the full earnings value is subject to the exit tax, the disposal of a
patent to a low-taxed subsidiary does not achieve the tax planning objective of
reducing the group’s effective average tax burden compared to a domestic
investment of the parent. In fact, the opposite is the case: the disposal
increases the effective average tax burden. This finding is independent from the
tax rate differential.
3.1.3.2 Effects of the disposal of a patent if the transfer price falls below the full earnings value
However, the disposal may result in a higher after-tax NPV in case the transfer
price only corresponds to a fraction of the earnings value (implying 1). The
reason for this is that the lower the transfer price, the smaller the (negative)
effect of the exit tax. If the transfer price is low enough, the combined effect of
the step-up and the application of lower source country tax rate on the
investment return may over-compensate the exit tax effect.
37 As a consequence, according to the amount, the first term of equation (15’’) is smaller than
the second term, rendering equation (15’’) negative.

Evers and Spengel (2014) Effective Tax Rates under IP Tax Planning
20
This indicates that if the tax administration of the parent company’s residence
country is not able to enforce a transfer price which equals the full earnings
value upon the disposal of intangible assets, it is possible for multinational
groups to reduce their overall tax burden by shifting intangible assets and
thereby profits to low-tax countries.
In the following, we determine the share of the earnings value which leaves the
after-tax NPV of the investment unaffected from the disposal (implying ∆ 0).
This is denoted by variable which is derived by inserting equation (10’) in
equation (14) (yielding equation 16) and then isolating variable .
∆ 0 (16)
(17)
For , the disposal to a lower-tax country is associated with a positive effect
on the after-tax NPV and thereby a reduction of the effective tax burden of the
group. The larger the (positive) tax rate differential, the larger the share of the
earnings value which is still associated with a tax advantage of the disposal.
3.2 Licensing-out the patent to an operating subsidiary
Instead of transferring the legal ownership of the patent, the parent may transfer
the right to temporarily exploit the asset by way of a licensing-arrangement,
thereby retaining the legal ownership. Equation (18) illustrates the after-tax NPV
of an equity-financed cross-border R&D investment giving rise to a patent, which
is then licensed-out to a foreign subsidiary.
1
1
1
1
(18)38
38 As in the domestic case, the last term of equation (18) (term five) reflects that the model
considers a one-period perpetuation of the capital stock instead of a permanent increase of the capital stock.

Evers and Spengel (2014) Effective Tax Rates under IP Tax Planning
21
The licensing arrangement has the following tax consequences. First, the royalty
payment (denoted by ) is tax deductible at the level of the subsidiary
(second term of equation (18)). This deduction gives rise to a tax shield equal to
the product of the royalty payment and the profit tax rate. Here, variable
denotes the share of the royalties that may be deducted. If royalty payments are
fully tax deductible, is one and the value of the royalty tax shield equals the
source country tax rate.
Second, on the level of the parent the royalty payment is subject to corporate
income tax (third term). We assume that the royalties are not subject to source
country withholding tax. This assumption in particular holds true for
multinational groups of companies resident in the EU where the Interest &
Royalty Directive ensures that royalties are exempt from withholding taxes upon
meeting certain participation requirements.
Third, the return from exploiting the patent is subject to corporate income tax in
the source country at the rate (fourth term). As in the case of the disposal of
the patent, the licensing arrangement enables the multinational company to
make use of lower foreign tax rates. Also with respect to the first and the second
tax consequences, parallels can be drawn between the disposal of a patent and
licensing-out of a patent. The taxation of the royalty income in the residence
country corresponds to the exit tax levied upon the disposal of a patent,
whereas the deduction of the royalty payment from the source country profit tax
base corresponds to the step-up in the depreciable base granted by the source
country. There is, however, a timing difference between these two tax planning
strategies. Whereas the royalties are taxed on a staggered basis, the exit tax is
generally fully due upon disposal.
As illustrated by equation (19), the license fee ( ) is determined as a share of
the overall return, analogous to the case of a disposal of the patent. This leads
to equation (20).
1 (19)
1 (20)

Evers and Spengel (2014) Effective Tax Rates under IP Tax Planning
22
When abstracting from any current expenses that might be incurred at the level
of the subsidiary in the course of its business, the overall return denoted by
1 equals the turnover from exploiting. Hence, determining the license
fee as a share of the overall return from exploiting the patent corresponds to
determining the license fee based on turnover as promoted by the OECD transfer
pricing guidelines.39
In the following, we examine in which cases the licensing-out of a patent to a
low-taxed subsidiary increases the after-tax NPV of investment (∆ 0) and
thereby reduces the effective average tax burden of the group. Equation (21)
denotes the difference between the after-tax NPV of a cross-border investment
involving the licensing-out of a patent to the subsidiary and the after-tax NPV of
a domestic investment of the parent. The first term illustrates the combined
effect of the royalty tax shield on the level of the subsidiary and the tax burden
on the royalties in the hands of the parent. The effect of the licensing-
arrangement on the on-going tax burden of the patent income is reflected by the
second term of equation (21).
∆ (21)
If the royalty is fully deductible from the source country profit tax base ( 1)
and the royalty equals the full return ( 1), this difference is zero as depicted
by equation (22). From this follows that a licensing arrangement leaves the after-
tax NPV unaffected if it involves that the overall return from exploiting the patent
is fully shifted from the subsidiary to the parent through a royalty payment. This
furthermore implies that the licensing arrangement does not achieve its tax
planning objective of reducing the group’s overall tax burden compared to a
domestic investment of the parent.
∆ 0 (22)
In turn, if the royalty equals only a share of the overall return generated by
exploiting the patent ( 1), the effect of the licensing arrangement depends
39 See OECD (2010), para 6.16.

Evers and Spengel (2014) Effective Tax Rates under IP Tax Planning
23
on the tax rate differential between the source and the residence country.
Licensing-out the patent to a lower-tax country increases the after-tax NPV of the
investment. Thereby it reduces the group’s effective tax burden compared to a
domestic investment of the parent. In the opposite case, the licensing
arrangement reduces the after-tax NPV and thereby increases the effective tax
burden.
As a result, if the goal is to reduce the group’s overall effective average tax
burden by means of licensing intangible assets to low-taxed subsidiaries, it is
necessary to set the royalty payment to less than the overall return generated
from exploiting the patent ( 1).
Equation (23) finally depicts the cost of capital for the case of intra-group
licensing. This equation deviates from the standard formula for a domestic
investment where the parent both creates and exploits the patent depicted by
equation (3) with respect to the second term of the denominator.
(23)
The EATR is determined by drawing on equation (20) following the same
approach as in section 2 for domestic investments.
3.3 Contract R&D
As a third tax planning model, we finally look at the case that the subsidiary
commissions the parent to perform R&D activity on its behalf giving rise to a
patent. As a consequence, the subsidiary becomes the legal owner of the patent.
In turn, the parent receives a contract R&D fee from the subsidiary as
reimbursement for its services.
From the perspective of the subsidiary, the contract R&D fee constitutes the
production costs for creating a self-developed intangible asset.40 As these
expenses are current in nature, they are generally immediately tax deductible.
Among the EU member states, the vast majority of countries does not require the
40 See Vögele (ed.) (2011), p. 1303, para 115.

Evers and Spengel (2014) Effective Tax Rates under IP Tax Planning
24
capitalisation of self-developed intangible assets.41 Hence, the tax treatment of
the contract R&D fee equals the treatment of current expenses incurred with
respect to internal R&D activity.42
3.3.1.1 Application of the cost-plus method when reimbursing the contractor
Equation (24) illustrates the after-tax NPV of an equity-financed cross-border
R&D investment which gives rise to a patent by way of contract R&D. In case the
principal bears the risks relating to the success of the R&D activity and the
commercial exploitation of the intangible assets, the cost-plus method is
generally considered to be appropriate to determine the contract R&D fee,
provided a comparable uncontrolled price is not available.43 This requires that
the principal manages and controls the party carrying out the R&D activity.44 In
order to do so, the principal must have the appropriate resources, including
adequately educated staff.45
1
1
1
(24)
The cost-plus method involves that this contract R&D fee equals the sum of the
R&D costs incurred by the contract R&D service provider and a mark-up. The
latter should reflect an appropriate profit earned by the contractor, taking into
account the functions performed by him as well as the market conditions.46
41 See footnote 13. 42 See Vögele (ed.) (2011), p. 1303, para 115. 43 See OECD (2010a), para 2.55, Russo (2007), p. 172. The OECD transfer pricing guidelines
specify under which condition a party is considered to have control over the risks associated with the creation and exploitation of intangible assets (see OECD (2010a), paras 9.23-9.24 and 9.26). For the legal situation in Germany, see Vögele (ed.) (2011), p. 1305, para 121.
44 See Sporken and Gommers (2006), p. 267. 45 See Russo (2007), p. 175. 46 OECD (2010a), para 2.39.

Evers and Spengel (2014) Effective Tax Rates under IP Tax Planning
25
Variable d in equation (24) denotes this mark-up. The contract R&D fee therefore
amounts to 1 .
The contract R&D arrangement has the following tax consequences. First, the
contract R&D fee is subject to corporate income tax in the residence country.
Second, the fee is tax deductible at the level of the subsidiary. These two
aspects are reflected by the second term of equation (24). Third, the returns from
exploiting the patent are subject to corporate income tax in the source country at
the rate instead of at the parent country tax rate (see term three of equation
(24)).47
In the following, we point out in which cases the contract R&D arrangement
increases the after-tax NPV of investment and thereby reduces the effective
average tax burden of the group. Equation (25) depicts the difference between
the after-tax NPV of a cross-border investment involving contract R&D and the
after-tax NPV of a domestic investment of the parent. The first term reflects the
net effect of the taxation of the contract R&D fee in the residence country and the
tax deduction of the contract R&D fee in the source country.
∆ 1 1 (25)
Whether the contract R&D arrangement positively or negatively affects the after-
tax NPV of the investment depends on the mark-up which enters the contract
R&D fee, and on the tax rate differential between the source and the residence
country.
In case of a positive tax rate differential (denoted by ∆ ), the contract
R&D arrangement results in a lower on-going tax burden as opposed to a
domestic investment of the parent (illustrated by the second term of equation
(25)). In contrast to this, the net effect of the taxation of the contract R&D fee in
the residence country and the tax deduction granted by the source country
47 Again, the last term of equation (24) reflects that the model considers a one-period
perpetuation of the capital stock instead of a permanent increase.

Evers and Spengel (2014) Effective Tax Rates under IP Tax Planning
26
(illustrated by the first term of equation (25)) is negative. In case the tax rate
differential is negative, the effects have the opposite algebraic sign.
It depends on the size of the mark-up which effect finally prevails and whether
the contract R&D arrangement as a consequence results in an overall negative or
positive effect on the after-tax net present value. Equation (26) defines the mark-
up for which both effects exactly offset each other and thereby leave the after-
tax NPV of the investment unaffected. Please note that this is independent from
the tax rates in the source and the residence country.
1 (26)
In case the mark-up falls below the critical mark-up denoted by , a positive tax
rate differential ( ) is generally associated with a positive effect of the
contract R&D arrangement on the after-tax NPV of the investment which implies
that the contract R&D arrangement achieves a reduction of the group’s overall
effective tax burden.
Equation (27) finally illustrates the cost of capital in case the parent is
reimbursed for its contract R&D services based on the cost-plus method. In the
following, we additionally consider the case that the profit split method is
applied instead.
(27)
Equation (27) deviates from the standard formula for a domestic investment
where the parent both creates and exploits the patent (depicted by equation (3))
with respect to the second term in the numerator.
3.3.1.2 Application of the profit split method when reimbursing the contractor
According to the OECD transfer pricing guidelines, the transactional profit split
method is generally considered to be the most appropriate method to determine
an arm’s length price in case of transactions concerning intangible assets where
both parties contribute unique and valuable intangibles and both perform
relevant functions relating to developing, enhancing, maintaining, and

Evers and Spengel (2014) Effective Tax Rates under IP Tax Planning
27
protecting intangible asset and make decisions regarding whether to pursue or
terminate particular R&D projects. In contrast, the profit split method should not
be used if one party to the transaction only contributes simple functions without
providing a unique contribution.48
Hence, the advocates of the profit split method generally claim that in the
situation at hand contract R&D does not merely constitute a ‘routine function’
but rather also economically significant functions. To give an example, the
Indian Department of Revenue has promoted the application of the profit split
method instead of the cost-plus method with respect to the pricing of contract
R&D services arguing that the R&D service providers perform economically
significant functions.49 Drawing on the OECD transfer pricing guidelines, the
crucial point in assessing the appropriateness of the profit split method in the
context of contract R&D is whether the contract R&D is carried out on the risk
and account and under the direction and supervision of the principal or whether
the contractor carries out the essential functions for creating the intangible
assets.
In the following, we point out how the application of the profit split method
affects the after-tax NPV of investment and thereby the incentive to create
intangible assets by way of intra-group contract R&D on behalf of a low-taxed
subsidiary. In order to incorporate the profit split method, the same approach is
applied as in the case of disposal of the patent.
Equation (28) presents the after-tax NPV for the case of contract R&D assuming
that gross profits from exploiting the patent (amounting to 1 ),
instead of the operating profits, are split between the parent and the
subsidiary.50 Variable denotes the share of gross profit attributed to the parent
company carrying out the R&D activity by means of the profit split. This equation
48 See OECD (2010), para 2.109, OECD (2013b), para 80 and examples 13 and 14 on pp. 61 et
seq. 49 See Chakravarty and Ray (2013), p. 404, Mitra et al. (2013), Prakash (2013), p. 376. 50 See OECD (2010), para 2.131, Vögele (ed.), p. 338, para 332.

Evers and Spengel (2014) Effective Tax Rates under IP Tax Planning
28
largely corresponds to the after-tax NPV in case of a domestic investment of the
parent denoted by equation (1) in section 2. The only difference is that part of
the overall return is subject to the source country tax rate.
1 1 1 (28)
A contract R&D arrangement where the contract R&D fee equals the full return of
the patent (implying 1) leaves the after-tax NPV of the investment
unaffected because the return earned on the level of the subsidiary is fully
shifted to the parent company by means of the contract R&D fee. This is
analogous to the finding for the case of licensing-out analysed in the previous
section.
If the profit is in fact split between the parent and the subsidiary (implying
1), the contract R&D arrangement always reduces the after-tax NPV of the
investment compared to a domestic investment of the parent. This is
demonstrated by equation (29) which depicts the difference between the after-
tax NPV of a cross-border investment involving contract R&D and the after-tax
NPV of a domestic investment of the parent. For positive tax rate differentials
), this difference is always positive.
∆ 1 (29)
Equation (30) finally illustrates the cost of capital in case the parent is
reimbursed for its contract R&D services based on the profit split method. It
deviates from the standard formula for a domestic investment (depicted by
equation (3)) with respect to the denominator.
(30)

Evers and Spengel (2014) Effective Tax Rates under IP Tax Planning
29
4 Effective Tax Rates under IP Tax Planning
Here, we present cost of capital and effective average tax rates (EATR) for an
equity-financed cross-border investment in a self-developed patent involving the
IP tax planning models discussed above. As a benchmark for analysing the
effects of the IP tax planning strategies on the effective tax burden, we present
figures for purely domestic investment of the parent. The effective tax measures
serve to illustrate the conclusions drawn in the analytical analysis presented in
sections 3.1 to 3.3 above. In addition, we point out in detail the tax parameters
which are associated with a lower overall tax burden of the multinational
company, implying that the tax planning objective is achieved. We focus on the
scenario that the source country tax rate is lower than the residence country tax
rate. In doing so, we only vary the tax rate levied by the source country and keep
the residence country tax rate fixed.
Table 1: Economic parameters and tax parameters of the numerical example
Economic parameters Tax parameters
7.1% 20% 30%
2% 15.35% 10%
5% 174% 10 years
The economic and tax parameters applied are presented in Table 1. We assume
that current R&D expenses51 are subject to immediate deduction in both the
residence and the source country and that self-developed intangible assets do
not have to be capitalised in both countries. This holds true for the majority of
EU Member States.52 We furthermore assume that the source country does not
51 Recall, in modelling the investment giving rise to a self-developed patent we assume that
all investment costs are current in nature (e.g. wages for R&D staff or materials) as current expenses generally account for the largest share of R&D expenditures (see Cameron (1996), Dougherty et al. (2007), OECD (2012a)).
52 Cyprus, Estonia, Portugal, Slovenia, and Sweden are an exception to this. For details, see footnote 13 in section 2.
Abbreviations: – nominal interest rate, – inflation rate, – real interest rate, – rate of return, – economic depreciation rate, – earnings value, – residence country tax rate, –
straight-line depreciation rate, – useful life for tax purposes.

Evers and Spengel (2014) Effective Tax Rates under IP Tax Planning
30
levy any withholding tax on dividends or royalties paid to the parent company
due to the application of the Parent & Subsidiary Directive and the Interest &
Royalty Directive and that the residence country exempts foreign dividends from
profit tax.53
4.1 Disposal
Table 2 reports the cost of capital and the EATR for cases in which the patent is
transferred from the parent to the subsidiary and therefore triggers exit taxation.
Recall that the cost of capital demonstrates the effect of tax on a marginal
investment (one that just breaks even). The immediate deduction of the R&D
investment expenditures, which are presumably fully current in nature, leads to
cost of capital equal to the real market interest rate of 5%. This indicates that
taxation does not affect the scale of the investment. In turn, cost of capital
above the real interest rate of 5% implies that the respective investment (here
the R&D investment) is treated in a less-beneficial way than a financial
investment which serves as a benchmark for analysing the incentive effects of
taxes on real investment (such as R&D investment).
Table 2: Cost of Capital and EATRs (%) in case of disposal of the patent (equity-financing)
Cost of Capital Effective average tax rate (EATR)
Domestic investment
Domestic investment
1 0.8 0.6 1 0.8 0.6
0 5.00 5.00 3.39 2.02 22.50 22.50 11.90 1.29
5 5.00 5.45 3.95 2.66 22.50 25.16 15.79 6.42
10 5.00 5.91 4.55 3.35 22.50 27.82 19.68 11.55
20 5.00 6.91 5.85 4.89 22.50 33.14 27.47 21.81
30 5.00 8.01 7.34 6.71 22.50 38.45 35.26 32.07
Abbreviations: – source country tax rate, – share of the earnings value which is taken as a basis when determining the transfer price for the exit tax.
53 Among the EU-28 Member States, Ireland is the only country which does not exempt
dividends from substantial participations in the hands of corporate shareholders (see Spengel et al. (2014), table A-9, pp. A-23 et seq).

Evers and Spengel (2014) Effective Tax Rates under IP Tax Planning
31
The EATR demonstrates the effects of tax on profitable investment. This measure
is therefore relevant when exploring how profit taxation influences a
multinational company’s decision on where to carry out a profitable investment
project and how to structure cross-border investment (e.g. by way of the IP tax
planning models).
In the following, we analyse the effects of a potential leeway in determining the
earnings value of the patent for transfer pricing purposes and of a variation in
the strictness of transfer pricing rules which govern the transfer of valuable IP. In
order to do so, we vary the share of the earnings value which is taken as a
basis when determining the transfer price and forms the tax base of the exit tax
levied on the level of the parent company.
The results presented in Table 2 confirm the hypotheses drawn in section 3.1.3.
The disposal of the patent which triggers an exit tax on the full earnings value
(implying 1), is associated with higher cost of capital and a higher EATR than
a purely domestic investment of the parent, except if the source country tax rate
is zero. In that case, the cost of capital and the EATR are unaffected by the
disposal because the effect of the lower on-going tax burden exactly offsets the
exit tax burden.
The results furthermore confirm that the parent faces an incentive to underreport
the value of the patent when transferring it to a lower-taxed subsidiary (implying
1). This is because the parent may thereby achieve a lower effective tax
burden compared to the domestic investment. To cite an example, if the source
tax rate amounts to 10% as opposed to a residence country tax rate of 30%, the
disposal of a patent which triggers an exit tax on 60% of the earnings value
( 0.6) is associated with an EATR of 11.55% as opposed to 22.50% in the
domestic case.
These results point to the attractiveness of transferring the patent at an early
stage of the development process when its value is still uncertain. The
intangible could then subsequently be further developed on the risk and
account of the acquiring low-taxed subsidiary. The results also show that if the

Evers and Spengel (2014) Effective Tax Rates under IP Tax Planning
32
source country tax rate is significantly lower than the residence country tax rate,
transfer prices close to the full earnings value are nevertheless associated with
lower effective tax burdens. For example, in case of a source country tax rate of
5%, as opposed to a residence country tax rate of 30%, the disposal of the
patent triggering an exit tax on 80% of the earnings value is associated with an
effective average tax burden of the R&D investment of 15.79%, as opposed to
22.50% in case of a domestic investment of the parent. IP Box regimes offer
such low tax rates for royalty income (e.g. 0% in Malta, 2% in Cyprus, 2.5% in
Liechtenstein, 5% in the Netherlands, and 5.84% in Belgium).54
Table 3 reports the values of for different tax rates differentials. Recall, this is
the share of the earnings value that leaves the after-tax NPV of the investment
unaffected by the disposal. The larger the tax rate differential, the higher the
share of the earnings value in which case the disposal still results in a reduction
of the EATR compared to the domestic investment.
Table 3: Share of the earnings value which leaves the effective tax burden unaffected of the disposal
(%) 0 5 10 15 20 25 30
(%) 100.00 96.49 91.65 84.59 73.30 52.34 0.00
4.2 Licensing-out
Table 4 reports the cost of capital and the EATR for the case that the patent is
licensed-out to the subsidiary instead of transferred on a permanent basis. The
results show that, similar to the case of disposal, licensing arrangements only
reduce the effective tax burden of the group if the royalty only corresponds to a
faction of the return generated by exploiting the patent. In turn, if the royalty
corresponds to the full return (implying 1), the individual tax consequences
54 For details, see Evers et al. (2014), table 1.
Abbreviations: – source country tax rate, – share of the earnings value taken as a basis when determining the transfer price for the exit tax which leaves the effective tax measures unaffected.

Evers and Spengel (2014) Effective Tax Rates under IP Tax Planning
33
of the licensing arrangement55 exactly offset each other and thereby leave the
effective tax burden unaffected. As a consequence, the cost of capital and the
EATR equal the cost of capital and the EATR of a domestic investment of the
parent, namely 5% and 22.5%, respectively.
Table 4: Cost of Capital and EATRs (%) in case the patent is licensed-out (equity-financing)
Cost of Capital Effective average tax rate (EATR)
Domestic investment
Domestic investment
1 0.8 0.6 1 0.8 0.6
0 5.00 5.00 3.39 2.02 22.50 22.50 11.90 1.29
5 5.00 5.00 3.64 2.46 22.50 22.50 13.66 4.83
10 5.00 5.00 3.90 2.91 22.50 22.50 15.43 8.36
20 5.00 5.00 4.44 3.90 22.50 22.50 18.97 15.43
30 5.00 5.00 5.00 5.00 22.50 22.50 22.50 22.50
Abbreviations: – source country tax rate, – share of the overall return generated by exploiting the patent which is taken as a basis when determining the license fee.
In this regard, the effects of the licensing arrangement on the effective tax
burden are fundamentally different from the effects of the disposal. Recall, the
tax effects of the disposal (exit tax, step-up, and lower on-going taxation) do not
offset each other if the sales price corresponds to the full earnings value
(implying 1). The disposal involves that the immediate deduction of R&D
expenses incurred for the creation of the patent is offset as the R&D expenses
form part of the exit tax base (provide the transfer price does not fall below the
R&D costs) and the patent is subsequently subject to periodical depreciation in
the source country. As opposed to this, the royalties are immediately deductible
in the source country. This ensures that the licensing arrangement does not
affect the effective tax burden provided that the royalty corresponds to the
overall return. As a consequence, the licensing arrangements is generally
55 Recall, these are the taxation of the royalty in the hands of the parent, the royalty tax shield
on the level of the subsidiary and the lower on-going tax burden on the patent income because this income is subject to tax in the source country instead of in the residence country.

Evers and Spengel (2014) Effective Tax Rates under IP Tax Planning
34
associated with lower cost of capital and lower EATRs than the disposal (except
in case the source country tax rate is zero). To give an example, assuming that
the source country tax rate is 20% and that alpha is 60%, the licensing
arrangement is associated with an EATR of 15.43% whereas the EATR in case of
disposal is 21.81%.
In economic terms, the disposal and licensing-out of a patent only differ insofar
as, due to the change in legal ownership, in case of disposal all future value
increases/decreases accrue to the subsidiary, whereas they remain with the
creator of the patent if they are licensed out.
4.3 Contract R&D
Table 5 finally reports the cost of capital and the EATRs for the scenario of a
contract R&D arrangement. This tax planning model differs from the case of a
disposal insofar as the application of the cost-plus method for determining the
contract R&D fee is widely accepted, provided certain conditions are fulfilled.
This is of importance because in case the contract R&D performer is reimbursed
on a cost-plus basis, the returns generated from exploiting the patent largely
accrue to the subsidiary instead of being shifted to the parent. As a result, the
parent only receives a small share of the profits corresponding to the mark-up on
the R&D investment expenses. The application of the cost-plus method when
determining fees for contract R&D services requires that the subsidiary exercises
control over the development, enhancement, maintenance or protection of
intangible assets and bears the risks and cost associated with these functions.56
56 For details, see section 3.3.1.

Evers and Spengel (2014) Effective Tax Rates under IP Tax Planning
35
Table 5: Cost of Capital and EATRs (%) in case of intra-group contract R&D (application of the cost-plus method, equity-financing)
Cost of Capital Effective average tax rate (EATR)
D 0.05 0.1 0.15 0.2 0.3 D 0.05 0.1 0.15 0.2 0.3
0 5.00 5.31 5.61 5.92 6.22 6.83 22.50 1.53 3.05 4.58 6.11 9.16
5 5.00 5.27 5.54 5.80 6.07 6.61 22.50 5.02 6.29 7.57 8.84 11.38
10 5.00 5.23 5.45 5.68 5.90 6.36 22.50 8.52 9.54 10.55 11.57 13.61
20 5.00 5.13 5.25 5.38 5.51 5.76 22.50 15.51 16.02 16.53 17.04 18.05
30 5.00 5.00 5.00 5.00 5.00 5.00 22.50 22.50 22.50 22.50 22.50 22.50
In order to point out the effect of the size of the mark-up on the cost of capital
and the EATR, the mark-up is varied between 5% and 30%. We consider this to
be a reasonable range of possible mark-ups due to the following considerations.
Drawing on a survey carried out by PricewaterhouseCoopers, the EU Joint
Transfer Pricing Forum (JTPF) indicates that the mark-ups for low value-adding
services generally fall within a range of 3 to 10%, and often amount to around
5%.57 Tax administrations may argue that contract R&D services do not
constitute low-value services and thereby apply higher mark-ups than the ones
indicated by the EU JTPF in practice.58 The Indian Finance Ministry’s Central
Board of Direct Taxes recently issued safe harbour rules for intra-group contract
R&D services carried out on behalf of non-resident associated enterprises.
Taxpayers may apply for the application of the safe harbour ratios, provided that
the contractor only assumes insignificant risks.59 For contract R&D services that
57 See EU Commission (2010), para 67, Suffer and Reichl (2010). Vögele claims that the
bandwidths of mark-ups determined through database research often range between 1.5% and 12%. See Vögele (ed.) (2011), p. 1306, para 122.
58 See Schoppe and Voltmer-Darmanyan (2012), p. 1254. 59 Circular No. 6/2013, issued on 29 June 2013, specifies the conditions for identifying
development centres engaged in contract R&D services with insignificant risk. For further details, see Chakravarty and Ray (2013), p. 405, Prakash (2013), pp. 376 et seq., Stewart (2013a).
Abbreviations: D – Domestic investment of the parent company, – source country tax rate, – mark-up applied to the R&D investment expenditures for determining the contract R&D fee applying the cost-plus method.

Evers and Spengel (2014) Effective Tax Rates under IP Tax Planning
36
wholly or partly relate to software development, the safe haven ratio is 30% of
operating expenses. The respective ratio is 29% for contract R&D services that
wholly or partly relate to generic pharmaceutical drugs.60 Tax practitioners stress
that the safe harbour ratios issued by the Indian Finance Ministry’s Central
Board of Direct Taxes may considerably exceed mark-ups which correspond to
the arm’s length principle.61 Nevertheless, we apply a mark-up of 30% as the
upper boundary of plausible mark-ups when determining the contract R&D fee.
As depicted in Table 5, for marginal investments a contract R&D arrangement
where the contractor is reimbursed based on the R&D costs results in an
increase in the cost of capital compared to domestic investments. The reason for
this is that the residence country levies tax on the mark-up even if the
investment turns out to be unprofitable.
For profitable investment projects, the contract R&D arrangement is associated
with a reduction of the effective tax burden if the source country tax rate falls
below the residence country tax rate. For example, in case of a source country
tax rate of 10% as opposed to a residence country tax rate of 30%, a mark-up of
10% is associated with an EATR of 9.54% as opposed to an EATR of 22.50% in
case of a domestic investment of the parent. A mark-up as high as 30% is still
associated with an EATR which is significantly lower than the EATR for domestic
investment projects, namely 13.61% as opposed to 22.50%.
Whether the contract R&D arrangement results in a reduction of the EATR of the
group as a whole depends on the size of the mark-up applied. Drawing on
equation (26) in Section 3.3 which defines the mark-up that leaves the after-tax
NPV of the investment unaffected (denoted by ) and assuming the economic
parameters depicted in Table 1, the contract R&D arrangement is associated with
60 See Articles 10TA-10TG Indian Income Tax Rules 1962 as amended on 19 September 2013,
Gandhi (2013), p. 1261. 61 See Stewart (2013b), Chawla (2013), p. 247.

Evers and Spengel (2014) Effective Tax Rates under IP Tax Planning
37
lower EATRs compared to the domestic investment of the parent if the mark-up is
lower than approximately 73.7%.62
This shows that contract R&D arrangements, whereby the commissioning party
is considered to be entitled to the intangible-related returns according to
transfer pricing rules, as it legally and economically exercises control over the
R&D activity and bears the risks and the costs associated with the R&D
investment, involve a significant potential to shift profits to low-taxed
subsidiaries.
Table 6: Cost of Capital and EATRs (%) in case the profit split method is applied to determine the contract R&D fee (equity-financing)
Cost of Capital Effective average tax rate (EATR)
Domestic investment
Domestic investment
1 0.8 0.6 1 0.8 0.6
Disposal 5.00 3.39 2.02 22.50 11.90 1.29
0 License 5.00 5.00 3.39 2.02 22.50 22.50 11.90 1.29
Contract R&D 5.00 3.39 2.02 22.50 11.90 1.29
Disposal 5.45 3.95 2.66 25.16 15.79 6.42
5 License 5.00 5.00 3.64 2.46 22.50 22.50 13.66 4.83
Contract R&D 5.00 3.64 2.46 22.50 13.66 4.83
Disposal 5.91 4.55 3.35 27.82 19.68 11.55
10 License 5.00 5.00 3.90 2.91 22.50 22.50 15.43 8.36
Contract R&D 5.00 3.90 2.91 22.50 15.43 8.36
Disposal 6.91 5.85 4.89 33.14 27.47 21.81
20 License 5.00 5.00 4.44 3.90 22.50 22.50 18.97 15.43
Contract R&D 5.00 4.44 3.90 22.50 18.97 15.43
Disposal 8.01 7.34 6.71 38.45 35.26 32.07
30 License 5.00 5.00 5.00 5.00 22.50 22.50 22.50 22.50
Contract R&D 5.00 5.00 5.00 22.50 22.50 22.50
62 As illustrated by equation (26) in section 3.3.1.1, the mark-up which leaves the after-tax NPV
of the investment unaffected is independent from the size of the tax rate differential.
Abbreviations: – source country tax rate, – share of the earnings value and the overall return generated by exploiting the patent, respectively, which is taken as a basis when determining the transfer price, the license fee, and the contract R&D fee, respectively.

Evers and Spengel (2014) Effective Tax Rates under IP Tax Planning
38
The situation is different when assuming that the contractor does not merely
perform a ‘routine function’ but instead performs economically significant
functions. In this case, the profit split method is generally considered more
appropriate than the cost-plus method.63 In this case, the cost of capital and the
EATR correspond to the measures presented for the licensing arrangement as
illustrated by the results presented in Table 6. It gives a comparison of the cost
of capital and the EATRs under the three different tax planning scenarios when
determining the transfer price, the license fee, and the contract R&D fee based
on the return from exploiting the patent.
Even if a larger share of the profit is attributed to the parent company carrying
out the R&D activity than to the subsidiary commissioning the R&D activity, this
would still be associated with a considerable reduction of the EATR, provided
that the source country tax rate is significantly lower than the parent company
tax rate. For example, in case of a source country tax rate of 10% and a 60/40
profit split ( 0.6) attributed to the parent company, the EATR is 8.36% in
contrast to 22.50% in case of a domestic investment of the parent. The contract
R&D arrangement is still associated with a considerable reduction of the EATR
from 22.5% to 15.43% if as much as 80% of the profit is allocated to the parent
(again given a source country tax rate of 10%).
63 See section 3.3.1.2.

Evers and Spengel (2014) Effective Tax Rates under IP Tax Planning
39
5 Conclusion
By means of IP tax planning, multinational companies may make use of a
beneficial research infrastructure in one country and at the same time benefit
from low tax rates on income from exploiting IP in another country (e.g. due to an
IP Box regime). Popular IP tax planning models are the disposal of IP to
subsidiaries resident in low-tax countries, intra-group licensing, and intra-group
contract R&D. The underlying reasoning is to shift (future) profits from exploiting
IP to a low-tax country, and thereby to reduce the overall tax burden of the
multinational, without having to shift the R&D activity as well.
Countries in which IP is created usually limit the leeway for such kind of profit
shifting by means of transfer pricing rules. The analytical and quantitative
findings presented above show that the disposal of a patent to a lower-taxed
subsidiary does not achieve its profit shifting objective, if the transfer price
reflects the true value of IP. In fact, the disposal of IP triggering an exit tax on the
full earnings value of the IP increases the group’s effective tax burden. Hence,
the disposal of IP to a lower-taxed subsidiary only achieves its tax planning
objective of reducing the effective tax burden of a multinational group, if the
multinational is able to understate the value of the asset when it is transferred.
This implies that if the country in which the IP was created succeeds in levying
an exit tax on the full earnings value of the IP upon its disposal, multinational
groups of companies do not face an incentive to relocate IP to subsidiaries
resident in low-tax countries. Though, in theory and in practice, identifying the
‘true value’ of IP this is a difficult task if not impossible.
Analogous to this, licensing-out a patent to a low-taxed subsidiary does not
achieve a lower effective average tax burden of the group if the full return from
exploiting the patent in the hands of the subsidiary is siphoned off to the owner
of the patent, the parent company, through a royalty payment. Licensing-out a
patent to a low-taxed subsidiary only results in a reduction of the group’s
effective tax burden if the royalty payment corresponds only to a fraction of the
return from exploiting the patent.

Evers and Spengel (2014) Effective Tax Rates under IP Tax Planning
40
By contrast, contract R&D arrangements may generally achieve a reduction of the
group’s effective average tax burden if the contractor is reimbursed on a cost-
plus basis. According to transfer pricing rules, the cost-plus method is indeed an
appropriate method for determining an arm’s length contract R&D fee under the
condition that the commissioning party bears the risks and the costs of the R&D
investment and directs and supervises the R&D activity.
In such a setting, the allocation of functions and risks fundamentally differs from
the case of disposals and licensing arrangements as in these cases the parent
assumes the risk associated with the R&D investment. My findings support the
notion that by rearranging functions and risks among the members of the group,
multinational companies may shift profits to low-tax countries and achieve a
reduction of their overall EATR.
If, by contrast, the residence country of the parent company requires that the
parent is reimbursed based on the profit-split method, the picture is
fundamentally different and largely corresponds to the case of the disposal of
the asset or the licensing arrangement. We demonstrate above, that applying
the profit-split method for determining contract R&D fees significantly reduces
the leeway for profit shifting by means of intra-group contract R&D
arrangements. These findings are of importance given a possible move towards
the profit split method in certain countries such as India64 or even under the
OECD transfer pricing rules for intangible assets which are currently under
revision.65
Summing up, the leeway for shifting profits to low-tax subsidiaries is widest
under contract R&D arrangements, in particular if the cost-plus method is
applied when determining the fee for intra-group contract R&D. In contrast,
transferring intangible assets to low-taxed subsidiaries, whether on a permanent
64 For details, see section 3.3.1.2. 65 According to some commentators, the draft of chapter six of the guidelines on the transfer
pricing rules for intangible assets encourages a broader use of the profit split method compared to the transfer pricing guidelines published in 2010. See Silberztein et al. (2013), p. 63, Sullivan (2013), p. 15.

Evers and Spengel (2014) Effective Tax Rates under IP Tax Planning
41
or a temporary basis, only achieves a reduction of the effective tax burden if the
value of the patent is understated thereby falling below its earnings value.

Evers and Spengel (2014) Effective Tax Rates under IP Tax Planning
42
References
Biegalskie, A. (2010), The ALP: Fiscalism or Economic Realism?, Intertax, vol. 38(3), 177–186.
Boos, M. (2003), International Transfer Pricing: The Valuation of Intangible Assets, The Hague.
Cameron, G. (1996), On the measurement of real R&D: Divisia price indices for UK business enterprise R&D, Research Evaluation, vol. 6(3), pp. 215-219.
Chakravarty, A. and S. Ray (2013), Circulars on Transfer Pricing of Contract R&D Centres: The Road Ahead, International Transfer Pricing Journal, vol. 20(11/12), pp. 404-406.
Chawla, A. (2013), India’s Safe Harbor Regulations: An Unlikely Sunset On Transfer Pricing Disputes, Tax Notes International, October 21, 2013, 245-247.
Cottani, G. (2011), Transfer Pricing, IBFD online book.
Darby, J.B. II and K. Lernaster (2007), Double lrish More than Doubles the Tax Saving: Hybrid Structure Reduces lrish, U.S. and Worldwide Taxation, Practical US/International Tax Strategies, vol. 11(9), pp. 2, 11-16.
Devereux, M.P. and R. Griffith (1999), The taxation of discrete investment choices, The Institute for Fiscal Studies Working Paper Series, W98/16 (Revision 2), London.
Devereux, M.P. and R. Griffith (2003), Evaluating tax policy for location decisions, International Tax and Public Finance, vol. 10(2), 107-126.
Devereux, M.P. and C. Keuschnigg (2009), The Distorting Arm’s Length Principle”, OUCBT Working Paper, WP 09/10.
Devereux, M.P., R. Griffith and A. Klemm (2002), Corporate income tax – Reforms and tax competition, Economic Policy, vol. 17(35), 451-495.
Devereux, M.P., C. Elschner, D. Endres, J.H. Heckemeyer, M. Overesch, U. Schreiber, and C. Spengel (2008), Project for the EU Commission TAXUD/2005/DE/3 10, Final Report, Mannheim and Oxford, download: http://ec.europa.eu/taxation_customs/resources/documents/taxation/gen_info/economic_analysis/economic_studies/effective_levels_report.pdf.
Dischinger, M. and N. Riedel (2011), Corporate taxes and the location of intangible assets within multinational firms, Journal of Public Economics, vol. 95(7-8), 691–707.

Evers and Spengel (2014) Effective Tax Rates under IP Tax Planning
43
Dougherty, S.M., R. Inklaar, R.H. McGuckin, and B. van Ark (2007), International Comparisons of R&D Expenditure - Does an R&D PPP Make a Difference?, in: Berndt E.R. and CR. Hulten (eds.), Hard-to-Measure Goods and Services: Essays in Honor of Zvi Griliches, Chicago.
Durst, M.C. (2010), It’s Not Just Academic: The OECD Should Reevaluate Transfer Pricing Laws, Tax Notes International, January 18, 2010, pp. 247-256.
Endres, D., A. Oestreicher, W. Scheffer, C. Spengel, S. Alt, H, Koehler, H. Riesselmann, and C. Wendt (2007), The Determination of Corporate Taxable Income in the EU Member States, Alphen aan den Rijn.
EU Commission (2010), EU Joint Transfer Pricing Forum, JTPF Report: Guidelines to low value adding intra-group services, doc. JTPF/020/REV3/2009/EN, Meeting of 4th February 2010, Brussels.
Evers, L, C. Spengel and H. Miller (2014), Intellectual Property Box regimes: effective tax rates and tax policy considerations, International Tax and Public Finance, DOI: 10.1007/s10797-014-9328-x.
Fisher, I. (1930), The Theory of interest: As determined by impatience to spend income and opportunity to invest it, New York.
Fuest, C., C. Spengel, K. Finke, J.H. Heckemeyer, and H. Nusser (2013), Profit Shifting and “Aggressive” Tax Planning by Multinational Firms: Issues and Options for Reform, World Tax Journal, vol. 4(3), pp. 307-324.
Gandhi, S. (2013), India Issues Final Safe Harbor Rules, Tax Notes International, September 30, 2013, 1259-1262.
Griffith, R., H. Miller and M. O'Connell (2014), Ownership of intellectual property and corporate taxation, Journal of Public Economics, vol. 112(1), pp. 12–23.
Hall, R.E. and D.W. Jorgensen (1967), Tax Policy and Investment Behaviour, American Economic Review, vol. 59(3), pp. 391 414.
Hall, B. and J. van Reenen (2000), How effective are fiscal incentives for R&D? A review of the evidence, Research Policy, vol. 29(4-5), 449-469.
Henshall, J. (2013), Global transfer pricing: principles and practice, Haywards Heath.
Jorgenson, D.W. (1963), Capital Theory and Investment Behaviour, American Economic Review, vol. 53(2), pp. 247-259.

Evers and Spengel (2014) Effective Tax Rates under IP Tax Planning
44
Kang, S.S and T. Ngo (2012), Tech Untaxed: Tax Avoidance in Silicon Valley, and How America’s Richest Company Pays a Lower Tax Rate than You Do, Berkeley, download: http://greenlining.org/wp-content/uploads/2013/02/TechUntaxedReport.pdf.
Karkinsky, T. and N. Riedel (2012), Corporate Taxation and the Location of Patents within Multinational Firms, Journal of International Economics, vol. 88(1), pp. 176–185.
King, M.A. and D. Fullerton (1984), The Taxation of Income from Capital, Chicago.
Klemm, A. (2010), Causes, benefits, and risks of business tax incentives, International Tax and Public Finance, vol. 17(3), pp. 315-336.
McKenzie, K.J. (2008), Measuring tax incentives for R&D, International Tax and Public Finance, vol. 15(5), pp. 563-581.
Mitra, R., D. Anjaria, and I. Chaudhury (2013), Transfer Pricing and the Profit-Split Method in India, Tax Notes International, April 8, 2013, 114-116.
OECD (2010), Transfer Pricing Guidelines for Multinational Enterprises and Tax Administrations, Paris.
OECD (2012a), Research and Development Statistics: Gross Domestic Expenditure on R-D by sector of performance and type of cost, OECD Science, Technology and R&D Statistics (database), doi: 10.1787/data-
00190-en, download:
http://stats.oecd.org/Index.aspx?DataSetCode=GERD_COST,accessed on
7 February 2014.
OECD (2012b), Discussion Draft. Revision of the Special Considerations for Intangibles in Chapter VI of the OECD Transfer Pricing Guidelines and Related Provisions, download: http://www.oecd.org/tax/transfer-
pricing/50526258.pdf.
OECD (2013a), Supporting Investment in Knowledge Capital, Growth and Innovation, download: http://dx.doi.org/10.1787/9789264193307-en.
OECD (2013b), Revised Discussion Draft on Transfer Pricing Aspects of Intangibles, July 30, 2013, download: http://www.oecd.org/ctp/transfer-
pricing/revised-discussion-draft-intangibles.pdf.

Evers and Spengel (2014) Effective Tax Rates under IP Tax Planning
45
Oestreicher, A. (2011), Valuation Issues in Transfer Pricing of intangibles: Comments on the Scoping of an OECD Project, Intertax, vol. 39(3), pp. 126-131.
Russo, R. (ed.) (2007), Fundamentals of International Tax Planning, Amsterdam.
Schoppe, C. and L. Voltmer-Darmanyan (2012), Konzerndienstleistungsverträge in der (steuerlichen) Praxis, Betriebs Berater, vol. 67(20), 1251-1258.
Schreiber, U., C. Spengel and L. Lammersen (2002), Measuring the Impact of Taxation on Investment and Financing Decisions, Schmalenbachs Business Review, vol. 54(1), 2-23.
Silberztein, C., M.C. Bennett, and G.D. Lemein (2013), The OECD Discussion Draft on the Transfer of Intangibles (Revision of Chapter VI of the OECD Transfer Pricing Guidelines) – Main Comments, Intertax, vol. 41(2), pp. 60-65.
Spengel, C. (2003), Internationale Unternehmensbesteuerung in der Europäischen Union, Steuerwirkungsanalyse – Empirische Befunde – Reformüberlegungen, Mannheim.
Spengel, C. and L. Lammersen (2001), Methoden zur Messung und zum Vergleich von internationalen Steuerbelastungen, Steuer und Wirtschaft, vol. 31(3), 222-238.
Spengel, C. and Y. Zöllkau (eds.) (2012), Common Corporate Tax Base (CC(C)TB) and Determination of Taxable Income: An International Comparison, Heidelberg.
Spengel, C., D. Endres, K. Finke, and J. Heckemeyer (2014), Effective Tax Levels using the Devereux/Griffith Methodology, Project for the EU Commission TAXUD/2013/CC/120 Final Report 2014, Mannheim.
Sullivan, M.A. (2012), Economic Analysis: Should Tech and Drug Firms Pay More Tax?, Tax Notes International, February 27, 2012, 655-656.
Sullivan, M.A. (2013), Economic Analysis: Example 13 of the OECD Revised Intangibles Draft, Tax Notes International, August 26, 2013, 769-772.
Stewart, D.D. (2013a), Government Updates Transfer Pricing Guidance on R&D, Tax Notes International, July 9, 2013, 125-127.
Stewart, D.D. (2013b), Transfer Pricing Safe Harbors Draw Limited Appeal, Tax Notes International, September 9, 2013, 976.

Evers and Spengel (2014) Effective Tax Rates under IP Tax Planning
46
Treasury Department and Internal Revenue Service (IRS) (eds.) (1988), A Study of Intercompany Pricing, ‘The White Paper’, prepared by Treasury Department, Office of International Tax Counsel, Office of Tax Analysis, Internal Revenue Service, Office of Assistant Commissioner (International), Office of Associate Chief Counsel (International), October 18, 1988, download: https://ia600305.us.archive.org/17/items/studyofintercomp00unit/studyofintercomp00unit.pdf.
Verlinden, I. and A. Smits (2009), Mastering the Intellectual Property Life Cycle. A global perspective on the tax-efficient management of IP rights, 2nd edition, Sint-Stevens-Woluwe.
Vögele, A. (2011), Verrechnungspreise, 3rd edition, München.