Effective Surfactants Blend Concentration … Surfactants Blend Concentration Determination for O/W...
9
© 2015 Indian Journal of Pharmaceutical Sciences | Published by Wolters Kluwer - Medknow 461 *Address for correspondence E-mail: [email protected] Effective Surfactants Blend Concentration Determination for O/W Emulsion Stabilization by Two Nonionic Surfactants by Simple Linear Regression A. K. HASSAN* Grand Pharma for Pharmaceutical Industries Company, Industrial Zone B4, 10th of Ramadan City, Sharkia, Egypt Hassan: Effective Surfactants Blend Concentration In this work, O/W emulsion sets were prepared by using different concentrations of two nonionic surfactants. The two surfactants, tween 80(HLB=15.0) and span 80(HLB=4.3) were used in a fixed proportions equal to 0.55:0.45 respectively. HLB value of the surfactants blends were fixed at 10.185. The surfactants blend concentration is starting from 3% up to 19%. For each O/W emulsion set the conductivity was measured at room temperature (25±2°), 40, 50, 60, 70 and 80°. Applying the simple linear regression least squares method statistical analysis to the temperature‑conductivity obtained data determines the effective surfactants blend concentration required for preparing the most stable O/W emulsion. These results were confirmed by applying the physical stability centrifugation testing and the phase inversion temperature range measurements. The results indicated that, the relation which represents the most stable O/W emulsion has the strongest direct linear relationship between temperature and conductivity. This relationship is linear up to 80°. This work proves that, the most stable O/W emulsion is determined via the determination of the maximum R² value by applying of the simple linear regression least squares method to the temperature–conductivity obtained data up to 80°, in addition to, the true maximum slope is represented by the equation which has the maximum R² value. Because the conditions would be changed in a more complex formulation, the method of the determination of the effective surfactants blend concentration was verified by applying it for more complex formulations of 2% O/W miconazole nitrate cream and the results indicate its reproducibility. Key words: ESBC, Emulsions, Nonionic, Linear regression, Coefficient of determination The objective of this work is the assignment of a suitable reproducible procedure for the determination of the effective surfactants blend concentration (ESBC) required for preparing the most stable O/W emulsion stabilized by two nonionic surfactants in pharmaceuticals, cosmetics and other field of industries to reduce cost and to save time. The hydrophilicity of nonionic surfactants changes with temperature, the emulsion inverts from O/W to W/O type when the temperature is slowly raised. The phase inversion temperature (PIT), at which the hydrophilic–lipophilic properties of the surfactant are in balance (also called HLB temperature), may be detected conduct metrically [1] . This property was used to determine PIT. PIT is a valuable method for ranking the emulsions in order of relative stability, its general applicability for predicting long–term stability is limited when phase changes occur on heating. There is also a qualitative relationship between PIT and the degree of creaming and cracking of the emulsions on long-term storage at 20°, it is evident that the greater the inversion temperature the lower was the degree of separation of phases [2] , in addition to, there is a linear relationship between emulsion stability and PIT Research Paper This is an open access article distributed under the terms of the Creative Commons Attribution-NonCommercial-ShareAlike 3.0 License, which allows others to remix, tweak, and build upon the work non-commercially, as long as the author is credited and the new creations are licensed under the identical terms. For reprints contact: [email protected] Accepted 04 August 2015 Revised 25 January 2015 Received 25 June 2014 Indian J Pharm Sci 2015;77(4):461-469
-
Upload
nguyenthien -
Category
Documents
-
view
249 -
download
5
Transcript of Effective Surfactants Blend Concentration … Surfactants Blend Concentration Determination for O/W...

© 2015 Indian Journal of Pharmaceutical Sciences | Published by Wolters Kluwer - Medknow 461
*Address for correspondence E-mail: [email protected]
Effective Surfactants Blend Concentration Determination for O/W Emulsion Stabilization by Two Nonionic Surfactants by Simple Linear RegressionA. K. HASSAN*Grand Pharma for Pharmaceutical Industries Company, Industrial Zone B4, 10th of Ramadan City, Sharkia, Egypt
Hassan: Effective Surfactants Blend Concentration
In this work, O/W emulsion sets were prepared by using different concentrations of two nonionic surfactants. The two surfactants, tween 80(HLB=15.0) and span 80(HLB=4.3) were used in a fixed proportions equal to 0.55:0.45 respectively. HLB value of the surfactants blends were fixed at 10.185. The surfactants blend concentration is starting from 3% up to 19%. For each O/W emulsion set the conductivity was measured at room temperature (25±2°), 40, 50, 60, 70 and 80°. Applying the simple linear regression least squares method statistical analysis to the temperature‑conductivity obtained data determines the effective surfactants blend concentration required for preparing the most stable O/W emulsion. These results were confirmed by applying the physical stability centrifugation testing and the phase inversion temperature range measurements. The results indicated that, the relation which represents the most stable O/W emulsion has the strongest direct linear relationship between temperature and conductivity. This relationship is linear up to 80°. This work proves that, the most stable O/W emulsion is determined via the determination of the maximum R² value by applying of the simple linear regression least squares method to the temperature–conductivity obtained data up to 80°, in addition to, the true maximum slope is represented by the equation which has the maximum R² value. Because the conditions would be changed in a more complex formulation, the method of the determination of the effective surfactants blend concentration was verified by applying it for more complex formulations of 2% O/W miconazole nitrate cream and the results indicate its reproducibility.
Key words: ESBC, Emulsions, Nonionic, Linear regression, Coefficient of determination
The objective of this work is the assignment of asuitable reproducible procedure for the determinationof the effective surfactants blend concentration(ESBC) required for preparing themost stableO/Wemulsion stabilized by two nonionic surfactantsin pharmaceuticals, cosmetics and other field ofindustries to reduce cost and to save time.
The hydrophilicity of nonionic surfactants changeswith temperature, the emulsion inverts fromO/WtoW/O typewhen the temperature is slowly raised.The phase inversion temperature (PIT), atwhich thehydrophilic–lipophilic properties of the surfactant arein balance (also calledHLB temperature),may bedetected conductmetrically[1].Thispropertywasusedto determinePIT.
PIT is a valuablemethod for ranking the emulsionsin order of relative stability, its general applicabilityfor predicting long–term stability is limitedwhenphase changes occur on heating. There is also aqualitative relationshipbetweenPITand thedegreeofcreaming and crackingof the emulsionson long-termstorage at 20°, it is evident that the greater theinversion temperature the lowerwas the degree ofseparationofphases[2], in addition to, there is a linearrelationship between emulsion stability and PIT
Research Paper
This is an open access article distributed under the terms of the Creative Commons Attribution-NonCommercial-ShareAlike 3.0 License, which allows others to remix, tweak, and build upon the work non-commercially, as long as the author is credited and the new creations are licensed under the identical terms.
For reprints contact: [email protected]
Accepted 04 August 2015Revised 25 January 2015
Received 25 June 2014Indian J Pharm Sci 2015;77(4):461-469

462 Indian Journal of Pharmaceutical Sciences July - August 2015
www.ijpsonline.com
of liquid paraffin-in-water emulsions stabilized bysorbitan derivatives.This relationshipwas linear uptoPITof 80°.Measurements above this temperatureexhibited adeviation from linearity, apparentlydue toevaporationofwaterphase[3], soPITwasmeasuredupto80°only.PITwasused for ranking the testedO/Wemulsions in order of relative stability aswell as thephysical stability centrifugation testing.
It is important to consider that thepresenceof certainhydrophilic or lipophilic surfactants, at amountin excess of the quantities required for optimumemulsification, can sometimes results indegradationofO/Wemulsions[4] and also the stabilitymeasurementsshowed that the concentration of hydrophilic andlipophilic surfactantwerevery important parameter[5],in addition to, only nonionic polyethoxylatedsurfactants will allow to perform the emulsioninversion, but the affinities of the surfactant for theaqueous and oily bulk phases have to be relativelybalanced, right from the start[6], so it isvery importanttoadjust theconcentrationof surfactants right from thestartwhich is theobjectiveof thiswork.
MATERIALS AND METHODS
The following Instrumentswere used:RZR1 stirringpaddle (Heidolph InstrumentsGmbh and Co.KG,Germany);A Jenwaymodel 4510 conductivity/TDSmeter (UK);K centrifuge harmonic series (Taiwan);thermometer 150 (76 mm 1 mm, N2 filled GH,Zeal, Ltd, England); 100ml and 600ml glass-warebeakers gradeA (IlmaborTGI, Germany); burette(0.1/DIN/AS50ml,Germany);100mlvialsof type1(Bormioli, Italy)with ready for sterilization rubber;MS-H-Pro digital hotplatemagnetic stirrer (USA);PGW453e, 750.0g, d=0.001gADAMbalance (UK).All equipmentswere calibrated, approved and readyfor use.
The following chemicalswere used in formulation,miconazole nitrate (JiangsuNhwa PharmaceuticalCo. Ltd. China), paraffin oil (Apar industries Co.Ltd. India), softparaffin (JellPharmaceuticalsPvtCo.Ltd. India) andbeeswax (CismeCo. Italy),Tween80andSpan80 (KolbCo.Switzerland), propyl parabenbase (Salycylates and Chemicals Co. Ltd. India)andmethyl paraben base (Wuhu Huahai BiologyEngineering Co. Ltd. China), sorbitol (RoquetteLestremCo. France) andwater for injection (Grandpharma for pharmaceutical industriesCo.Egypt).
Emulsions composition:Paraffin oil was used as oil phase, nonionicemulsifiers tween 80 and span 80 (Kolb Co.Switzerland) were used as surfactants blend withdifferent proportions and their ratios were fixedat 5%[4,7-9], water for injection was used as waterphase.Emulsions compositions, average of responsesof conductivities at room temperature (25±2º) andtype of emulsionswere recorded inTable 1.Theseemulsion setswere used to determine the effectivesurfactants blend (ESB).
Other sets of O/W emulsions were prepared withdifferentconcentrationsof the twononionic surfactants.The two surfactants, tween80and span80wereusedinfixedproportions equal to0.55:0.45 (HLB=10.185)respectively. The surfactants blend concentration(SBC) is starting from3% to19%with2% increment(asknown that, theemulsioncontainsvaryingamountsof surfactants ranging from2-15or1-20%)[4,10].Sincethe preparedO/W emulsion setswith SBC startingfrom 11% to 19% have a physical gel consistencyappearance, soanother three additionalO/Wemulsionsetswith 9.5%, 10%and10.5%concentrationswereprepared to indicate the concentration atwhich thegel consistencywas actually appeared (in betweenthe two concentrations of 9% and 11%). Emulsionscompositionswere recorded inTable 2.TheseO/Wemulsion setswereused todetermine theESBC.
Themethod of the determination of the ESBCwasverifiedbyapplying it formorecomplex formulationsof 2%O/Wmiconazole nitrate cream.Thesemorecomplexformulationsarecomposedof:2%Miconazolenitratewasusedasactive ingredient,16.5-18%Paraffinoil,11.5-13%Softparaffinand5%beeswaxwereusedas oil phase, 0.5-4.5% tween 80 and 0.5-4.5% span80were used as emulsifiers, 0.02%Propyl parabenbase and 0.15%Methyl paraben basewere used aspreservatives,5%Sorbitoland50.83-53.83%water forinjectionwereusedaswaterphase.Allmaterialsareofpharmaceutical grade.TheseO/Wemulsion setswereused to determine the ESB and ESBC of themorecomplex formulationsof 2%O/Wmiconazolenitratecream.
Preparation of emulsions:The emulsionswere prepared by the sudden phaseinversion method. The water phase was heatedto 80±2° and added portion wise to the oilyphase containing both emulsifiers at 80±2°within
July - August 2015 Indian Journal of Pharmaceutical Sciences 463
www.ijpsonline.com
30 seconds,while stirringwithRZR1 stirring paddleat speed of 664 rpm.The emulsionwasmixed for20minute as a fixed time.Different emulsionsweremade in triplicate.Allparametersweremeasuredafter24hours[4,6-12].
Centrifugation:Emulsion was tested for physical stabilityby centrifugation using K centrifuge Harmonicseries for 1 hour at speed of 3500 rpm and theemulsionwas examined for any phase separation.Four centrifugation tubeswere filledwith 8.0ml ofemulsion and centrifuged at speed of 3500 rpm for1 hour[5].
Conductivity and PIT range determination:Conductivity and PIT ranges were determined bymeasuring the specific conductivity and temperatureof60mlofemulsion thatwascontinuouslyagitatedat
100 rpmwithsmallpropeller stirrer.Theemulsionwasheatedata steady rateusingMS-H-Prodigitalhotplatemagnetic stirrer.The specific conductivity of eachO/Wemulsionwasmeasureddirectly, as it is,withoutdilution at room temperature (25±2), 40, 50, 60, 70and 80°.A conductivity value lower than 10 uS/cmand essentially zeromeans that the continuous phaseis oil,whereas the conductivity value higher than10uS/cmmeans that the continuousphase iswater[6,13].
PITs rangewere detected as a fall of the specificconductivity between any two successive temperaturevalues or theymaybe detectedwhen two successiveconductivity values are nearly equal (steady state ofconductivityvalues).The resultsquotedare themeansof threedeterminations[1,2,6,14].
RESULTS
Determination the ESB:Nine sets of emulsions were prepared by usingparaffin oil,water for injection and different blendsof two nonionic surfactants, tween 80 (HLB=15.0)and span 80 (HLB=4.3).The two surfactantswereused in different proportions and their ratioswerefixedat5%concentration.[4,7-9]This concentrationdoesnot prove theESBC but it predicts theESB.Thesesurfactants blends haveHLB values ranging from5.370 to13.930.Wecalculated theHLBvalueof thesurfactants blend according to the formula:
HLB=xA+(1–x)B Eq. (1)
Where x is the proportion of a surfactant havingan HLB value ofA and the other surfactant hasa value of B[15]. Since the HLB system predicts
TABLE 1: EMULSIONS COMPOSITIONS AND CONDUCTIVITYExperiment number
A B Q of A Q of B Paraffin oil in gram
Water for injection in gram
HLB value
Average of responses of conductivities at 25°
Type of emulsion
1 0.1 0.9 0.5 4.5 30.0 65.0 5.370 Zero W/O2 0.2 0.8 1.0 4.0 30.0 65.0 6.440 Zero W/O3 0.3 0.7 1.5 3.5 30.0 65.0 7.510 Zero W/O4 0.4 0.6 2.0 3.0 30.0 65.0 8.580 Zero W/O5 0.5 0.5 2.5 2.5 30.0 65.0 9.650 0.49 µS/cm W/O6 0.6 0.4 3.0 2.0 30.0 65.0 10.720 50.27 µS/cm O/W7 0.7 0.3 3.5 1.5 30.0 65.0 11.790 50.13 µS/cm O/W8 0.8 0.2 4.0 1.0 30.0 65.0 12.860 Separation Separation9 0.9 0.1 4.5 0.5 30.0 65.0 13.93 Separation Separation10 0.55 0.45 2.75 2.25 30.0 65.0 10.185 51.1 µS/cm O/WEmulsions compositions, the two surfactants were used in different proportions and their ratios were fixed at 5%, HLB values of the surfactants blends and average of responses of conductivities in µS/cm at 25±2° were recorded. A: Proportion of tween 80, B: proportion of span 80, Q of A: quantity of tween 80 in grams, Q of B: quantity of span 80 in grams, HLB: hydrophilic‑lipophilic balance
TABLE 2: EMULSIONS COMPOSITIONEmulsions with different SBC (%)
Q of A in g
Q of B in g
Paraffin oil in g
Water for injection in g
HLB value of SB
3 1.65 1.35 30.63 66.37 10.1855 2.75 2.25 30.0 65.0 10.1857 3.85 3.15 29.37 63.63 10.1859 4.95 4.05 28.74 62.26 10.18511 6.05 4.95 28.11 60.89 10.18513 7.15 5.85 27.48 59.52 10.18515 8.25 6.75 26.85 58.15 10.18517 9.35 7.65 26.22 56.78 10.18519 10.45 8.55 25.59 55.41 10.1859.5 5.23 4.27 28.58 61.92 10.18510.0 5.50 4.50 28.42 61.58 10.18510.5 5.77 4.73 28.26 61.24 10.185Different concentrations of tween 80 and span 80 were used in fixed proportions equal to 0.55:0.45 respectively and the HLB value of the SB were fixed at 10.185. SBC: Surfactants blend concentration, HLB: hydrophilic‑lipophilic balance, SB: surfactants blends

464 Indian Journal of Pharmaceutical Sciences July - August 2015
www.ijpsonline.com
the optimum emulsion stabilitywhenmatches therequiredHLB of the oil/water system[9] and as theRHLBoil/water systemofparaffin-in-water emulsionsstabilized by sorbitan derivatives is 10 as stated inthe literature[7], so another additional emulsion setexperiment 10was preparedwith surfactants blendofHLB value equal to 10.185 to verify the results.Tween 80 and span 80with proportions 0.55:0.45respectively have HLB value equals to 10.185.As in case of the determination of ESBCwhichwill be discussed later in details. The maximumR² value=0.981 of the relation which representsO/W emulsion of experiment 10 indicates that thisrelation has the strongest direct linear relationshipbetween temperature and conductivity. So theO/Wemulsion of experiment 10 is themost stable one ofthe tested emulsion sets (experiments 6, 7 and 10).Its surfactants blendwithHLBvalue correspondingto 10.185 is the ESB (tween 80 and span 80withproportions 0.55:0.45, respectively).TheHLBvalueof the ESB is the RHLB value of the emulsionsystem.Average responsesof conductivities at (25±2),40, 50, 60,70 and80ºwere recorded inTable3.Thestatistical analysis resultswere revealed infig. 1.Theabove resultwasconfirmedby subjectingall theO/Wemulsion sets (experiments 6, 7 and 10) to physicalstability centrifugation testing and by comparing theresults of the PIT rangemeasurements.The resultswere recorded inTable 4. The difference betweentheRHLB of paraffin-in-water emulsions stabilizedby sorbitan derivatives in thiswork and theRHLBvalues in the literaturespublishedbyPrinderreet al.[7]and Lin TJ et al.[8] that equal to 10.0 and 10.5,respectively,maybedue to the experimental errors.
Determination of the ESBC:Asmentionedbefore, the conductivities of eachO/Wemulsion set with SBC starting from 3% to 19%weremeasured at room temperature (25±2), 40, 50,60, 70, 80° and a relation between the temperature
vs. conductivity up to 80°was plotted by applyingthe simple linear regression (least squaresmethod)statistical analysis. Temperatures and average ofresponsesof conductivitieswere recorded inTable5.
We can find the line of best fit graphically byapplying simple linear regression (least squaresmethod) statistical analysis. The least squaresregression line equation calculates the slope b (thechange inY for unit change in X), the intercepta (the predicted value of Y when X=0) andR² (known as the coefficient of determination). R²is equal to the square of the correlation coefficientbetween the response variableY and the predictorXor to the squareof the correlationcoefficientbetweenthe response variableY and the fitted valuesY. R²is known as the coefficient of determination becauseit gives us an idea of how the predictor variableXaccounts for (determines) the responsevariableY.Theleast squares regression line is givenby:
Y=a+bX…Eq. (2)
The results indicated that, thebestfittingdirect linearrelationship up to 80° was fitted only to the dataobtained from the relation which represents O/Wemulsionwith5%concentrationof theESB.This linearrelationshiphas themaximumdeterminationcoefficientR²which isequal to0.981.Asknown that, in thecase
TABLE 3: CONDUCTIVITY AT DIFFERENT TEMPERATURESTemperature Average of responses of conductivities
Experiment 6 Experiment 7 Experiment 1025±2 50.27 50.13 51.140 56.7 61.0 63.050 71.4 68.0 74.360 79.7 78.0 76.070 89 91.0 90.080 90 88.0 96.4Values are expressed in uS/cm
Fig. 1: A relation between the temperatures versus conductivities for experiments 6, 7 and 10.A relation between the temperatures versus conductivities up to 80° for each O/W emulsion set of the experiments 6, 7 and 10 (ESB determination of the simple formulae of paraffin-in-water emulsions stabilized by sorbitan derivatives). Experiment 6 ( ) y=0.807x+29.09, R2=0.958; Experiment 7 ( ) y=0.771x+30.88, R2=0.951; Experiment 10 ( ) y=0.824x+30.47, R2=0.981.
July - August 2015 Indian Journal of Pharmaceutical Sciences 465
www.ijpsonline.com
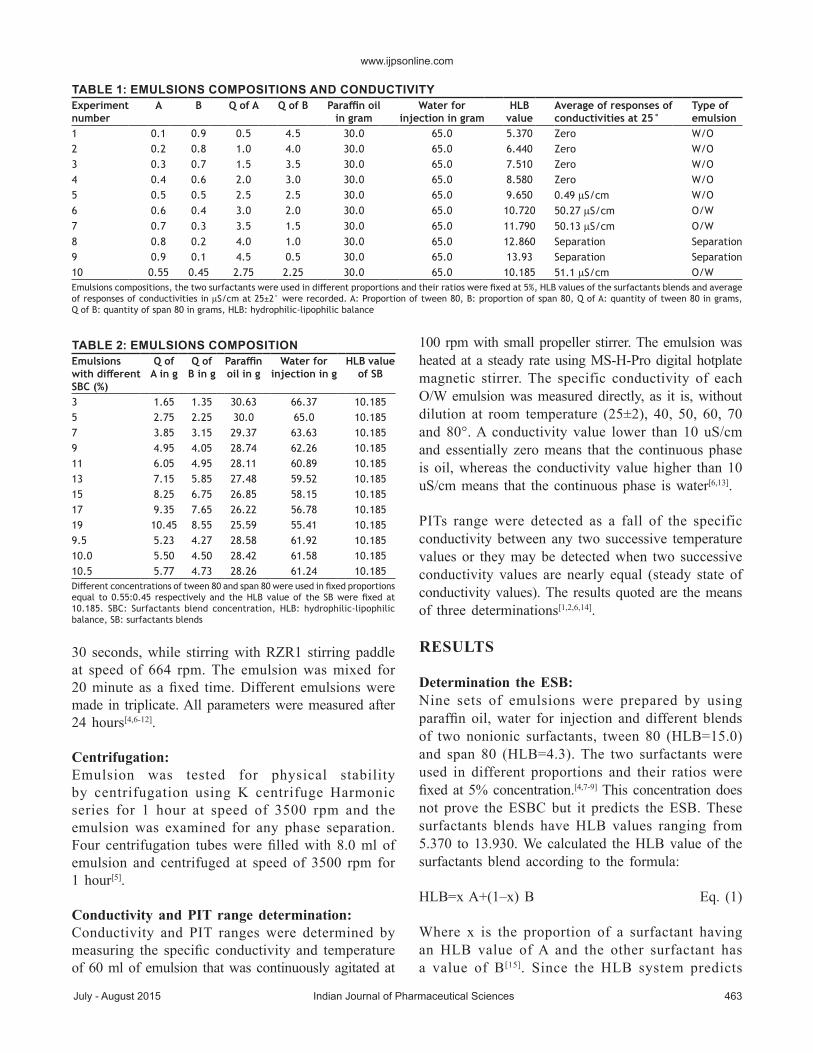
ofmodelswith an intercept,R² canbe interpreted astheproportionof thevariation inY that is accountedfor by the predictor variable X after adjustingY by itsmean. It runs from 0 to 1,with 1 indicatingperfect Prediction ofY fromX[16]. ThemaximumR²value=0.981of the relationwhich representsO/Wemulsionwith5%concentrationof theESB indicatesthat 98.1% of the total variability in the responsevariable conductivity is accounted forby thepredictorvariable temperaturewhichmeans that this relationhasthe strongest linear relationship between temperatureandconductivity.Datawere revealed infig.2.
So theO/W emulsionwith 5% concentration of theESB is themost stable one and consequently its 5%concentration is the ESBC.The above result wasconfirmed by subjecting all theO/W emulsion setswith SBC starting from 3% to 19% to the physicalstability centrifugation testing for 1 hour at speed of3500 rpm and by comparing the results of the PITrangemeasurements.The least squares regression lineequationswere revealed infigs. 3 and4.The resultswere recorded inTable 6 and indicated that:
O/Wemulsionwith5%concentrationof theESBhasthe highest PITwhich ismore than 80° (due to theabsence of abrupt change in the conductivity up to80°) and it has no phase separation up on applyingthe centrifugation testing.
O/W emulsions with SBC of 3, 7, 9 and 10.5%have aPITs ranging from70-80° (less than80°) and
showed a phase separationwhen subjected to thecentrifugation testing.So their resultswere excluded.
Although the O/W emulsions with SBC of 9.5%and 10% have not got any phase separation uponapplying the centrifugation testing but their resultswereexcludedbecause theyhaveaPITs ranging from70-80° (less than 80°) and containmuchmore SBCwhich is not acceptable.
Although theO/WemulsionswithSBCstarting from11% to 19% have not got any phase separation upon applying the centrifugation testing but they haveeither descending PITs (DPIT) equal toD80° (lessthan 80°) as in the cases of O/W emulsions with
TABLE 4: EMULSIONS PHYSICAL STABILITY RESULTSExperiments number
Centrifugation at speed of 3500 rpm for 1
PIT measurements
6 Partial phase separation 70–80°7 Partial phase separation 70–80°10 Ok. No phase separation >80°PIT: Phase inversion temperature
TABLE 5: CONDUCTIVITIES OF DIFFERENT FORMULATIONS AT VARIOUS TEMPERATURESTemperature Emulsion
with ESB 3%
Emulsion with ESB
5%
Emulsion with ESB
7%
Emulsion with ESB
9%
Emulsion with ESB
11%
Emulsion with ESB
13%
Emulsion with ESB
15%
Emulsion with ESB
17%
Emulsion with ESB
19%
Emulsion with ESB
9.5%
Emulsion with ESB
10%
Emulsion with ESB
10.5%25±2 32.6 51.1 65.5 78.8 97.8 100.4 103.7 110.4 108.4 75.9 82.35 83.5440 43.4 63.0 76.2 95.0 57.2 110.0 85.0 93.6 107.6 98.9 102.0 149.250 48.2 74.3 88.3 105.0 85.0 107.0 95.7 85.2 105.1 120.2 123.8 158.860 57.5 76.0 94.7 112.0 96.9 111.0 74.0 72.1 101.3 122.2 126.0 160.570 60.9 90.0 105.0 115.0 95.0 111.0 18.0 77.9 99.5 160.1 164.5 169.480 52.5 96.4 90.0 93.0 66.0 89.0 3.6 28.3 104.0 144.0 151.2 169.0Average responses of conductivities (uS/cm) at 25±2, 40, 50, 60, 70 and 80° for each O/W emulsion set with SBC starting from 3% up to 19% were recorded. ESB: Effective surfactants blend, SBC: surfactants blend concentration
Fig. 2: A relation between temperatures versus conductivities for emulsions with different concentrations of the ESB.A relation between temperatures versus conductivities up to 80° for all the tested O/W emulsions with different concentrations of the ESB starting from 3% up to 19%. R² value for each relation was recorded. Co. stands for concentration of the ESB (the figure determines the ESBC of the simple formulae of paraffin-in-water emulsions stabilized by sorbitan derivatives). 3% Co ( ) R2=0.743; 5% Co ( ) R2=0.981; 7% Co ( ) R2=0.711; 9% Co ( ) R2=0.341; 11% Co ( ) R2=0.019; 13% Co ( ) R2=0.068; 15% Co ( ) R2=0.811; 17% Co ( ) R2=0.813; 19% Co ( ) R2=0.600; 9.5% Co ( ) R2=0.879; 10% Co ( ) R2=0.894; 10.5% Co ( ) R2=0.713.

466 Indian Journal of Pharmaceutical Sciences July - August 2015
www.ijpsonline.com
SBC of 15% and 17% where the conductivitydecreases by increasing the temperature orunidentified PITs as in the cases ofO/W emulsionswithSBCof 11%,13%and19%as the conductivityis not affectedproperlyby increasing the temperaturewhich indicates the absence of the relation betweentemperature and conductivity. So their resultswereexcluded.
These results confirmed that, theO/Wemulsionwith5% concentration of theESB is themost stable oneand consequently its 5%concentration is theESBC.
Verifying the reproducibility of the method:Because the conditionswould be changed in amorecomplexformulations, themethodofthedeterminationoftheESBCwasverifiedbyapplying it formorecomplexformulationsof2%O/Wmiconazolenitratecream.
Proceeding in the same sequencesandprocedures thatmentioned in the determination of the ESB of thesimpleparaffin-in-wateremulsions, the results indicatedthat, themaximumR² value=0.871 of the relationwhich represents O/W emulsion of experiment 5indicates that this relationhas thestrongestdirect linearrelationship between temperature and conductivity.
Fig. 3: A relation between the temperatures versus conductivities with no gel consistency and concentrations of the ESB.A relation between the temperatures versus conductivities up to 80° for each O/W emulsion with no gel consistency and with concentrations of the ESB starting from 3% up to 10.5%. The least squares regression line equation for each relation was recorded. Co. stands for concentration of the ESB. 3% Co ( ) y=0.440x+25.34, R2=0.743; 5% Co ( ) y=0.824x+30.47, R2=0.981; 7% Co ( ) y=0.584x+54.93, R2=0.711; 9% Co ( ) y=0.393x+78.49, R2=0.341; 9.5% Co ( ) y=1.411x+43.76, R2=0.879; 10% Co ( ) y=1.426x+47.70, R2=0.894; 10.5% Co ( ) y=1.371x+74.09, R2=0.713.
Fig. 4: A relation between the temperatures versus conductivities with gel consistency and concentrations of the ESB.A relation between the temperatures vs. conductivities up to 80° for each O/W emulsion with gel consistency and with concentrations of the ESB starting from 11% up to 19%. The least squares regression line equation for each relation was recorded. Co. stands for concentration of the ESB. 11% Co ( ) y=-0.12x+89.48, R2=0.0.019; 13% Co ( ) y=-0.113x+110.8, R2=0.068; 15% Co ( ) y=-1.889x+165.6, R2=0.811; 17% Co ( ) y=-1.245x+145.3, R2=0.813; 19% Co ( ) y=-0.134x+111.5, R2=0.600.
TABLE 6: O/W EMULSIONS RESULTSEmulsions with different concentrations of the ESB (%)
R2 Slope values
PIT range Centrifugation testing results
Type of emulsion/appearance
3 0.743 0.440 70–80° Phase separation O/W emulsion5 0.981 0.824 >80° Ok. No phase separation O/W emulsion7 0.711 0.584 70–80° Phase separation O/W emulsion9 0.341 0.393 70–80° Phase separation O/W emulsion11 0.019 −0.120 Unidentified Ok. No phase separation O/W emulsion with gel consistency13 0.068 −0.113 Unidentified Ok. No phase separation O/W emulsion with gel consistency15 0.811 −1.889 D80° Ok. No phase separation O/W emulsion with gel consistency17 0.813 −1.245 D80° Ok. No phase separation O/W emulsion with gel consistency19 0.600 −0.134 Unidentified OK. No phase separation O/W emulsion with gel consistency9.5 0.879 1.411 70–80° Ok. No phase separation O/W emulsion10 0.894 1.426 70–80° Ok. No phase separation O/W emulsion10.5 0.713 1.371 70–80° Partial phase separation O/W emulsionO/W emulsions with different SBC and the corresponding R2 values, slope values, results of physical stability centrifugation testing, PITs range measurement values, the emulsion type and their appearance were recorded. D: Descending. PITs: phase inversion temperatures, ESB: effective surfactants blend, SBC: surfactants blend concentration

July - August 2015 Indian Journal of Pharmaceutical Sciences 467
www.ijpsonline.com
So theO/W emulsion of experiment 5 is themoststable one of the tested emulsion sets (experiments5, 6 and 7). Its surfactants blendwithHLB valuecorresponding to9.65 is theESB (tween80and span80 in proportions equal to 0.5:0.5, respectively).TheHLB value of the ESB is the RHLB value of theemulsion system.The statistical analysis resultswererevealed in fig. 5. Regarding the determination ofthe ESBC, the results indicated that, themaximumR² value=0.935 of the relation which representsO/W emulsionwith 7% concentration of the ESBindicates that this relationhas thestrongestdirect linearrelationshipbetween temperature andconductivity.SotheO/Wemulsionwith7%SBCis themoststableoneand consequently its 7% concentration is theESBC.The theoretically calculatedRHLBofO/Wemulsionsystemwith7%ESBC is9.236.
The statistical analysis resultswere revealed infig. 6.The above results were confirmed by subjectingall the O/W emulsion sets of the more complexformulations to physical stability centrifugationtesting and PITmeasurement asmentioned before.These results confirmed theabove results and indicatethe reproducibility of themethod in case ofmorecomplex formulations.
Suitability of the linear regression analysis-Bingham model:In the beginning let us to say that, all the testedemulsionswere prepared by the same instruments
and same method. Regarding the emulsionscompositions,Tables 1 and 2 revealed that the twosurfactants were used in different concentrations.As the R2 value is in strong dependence on theexperimental condition (different concentrations ofthe two surfactants).Therefore, the recorded greatvariability of R2 values are due to the presence ofawide range of different concentrations of the twosurfactantswhich is the principal up onwhich thestudy built.This assumption is correct because theresults obtained from the linear regression analysiswere confirmed practically by subjecting all thetestedO/W emulsion sets to the physical stabilitycentrifugation testing andby comparing the results ofthePIT rangemeasurements.Practical confirmationofthese results represents a very important factorwhichindicates the suitability andprecisionof theR2 results.
In my opinion, it is better of using the linearregression analysis to evaluate the results of theemulsions and this is because, as known, theliquid and solid heterogeneous dispersions such ascolloidal solutions, emulsions, liquid suspensions,ointments and similar products are following theNon-Newtonian’equationofflow.TheNon-Newtonianplasticflowcurves of emulsions donot pass throughtheoriginbut rather intersect the shear stress axis (orwill if the straight part of the curve is extrapolatedto the axis) at a particular point referred to as theyield value[17]. It is clear from the abovementioned
Fig. 5: A relation between the temperatures vs. conductivities for experiments 5, 6 and 7.A relation between the temperatures vs. conductivities up to 80° for each O/W emulsion set of the experiments 5, 6 and 7 (determination of the ESB of the complex formulae of 2% miconazole nitrate O/W creams). Experiment 5 ( ) y=11.44x-319.7, R2=0.871; Experiment 6 ( ) y=7.033x-164.2, R2=0.850; Experiment 7 ( ) y=0.494x+42.46, R2=0.343.
Fig. 6: A relation between the temperatures vs. conductivities for emulsion with SBC.A relation between the temperatures vs. conductivities up to 80° for each O/W emulsion with SBC starting from 3% up to 9% (determination of the ESBC of the complex formulae of 2% miconazole nitrate O/W creams). 3% Conc ( ) y=32.49x-1120, R2=0.752; 5% Conc ( ) y=11.44x-319.7, R2=0.871; 7% Conc ( ) y=10.59x-229.0, R2=0.935; 9% Conc ( ) y=21.64x-674.5, R2=0.841.

468 Indian Journal of Pharmaceutical Sciences July - August 2015
www.ijpsonline.com
criteria that the linear regression analysis is therelation that will give us the yield valuewhich isvery important factor in studying emulsions. Newapproach of the yieldwill be explained in details inmynextmanuscript.
The reliabilityof the experimental resultspresented infigs. 1-6was evaluated using regression analysis.R2runs from0 to1,with1 indicatingperfectPredictionof Y from X. So the trendline is most reliablewhen its coefficient, R2, is at or near 1[16,18]. In thiswork, determination of ESB andESBCwere basedon the determination of the maximum R2 valueswhichwere approximately equal 1 (equal 0.981 and0.981, respectively). In the case ofmore complexformulations, the determination of ESB and ESBCwere based on the determination of themaximumR2 valueswhichwere approximately near 1 (0.871and0.935, respectively).These resultsmean that thetrendlines are reliable andprecise as their coefficient,R2 values, are at or near 1[16,18].
In addition, all the above results were confirmedpractically.RashaidaAA, in his PhD discussed andstudied the effect ofwax concentration on the shearstress-shear rate curve.He studied also the effect oftemperature on thewax-oilmixture and the shearstress-shear rate curve for thedilutedgelmixtures for12.5,25and50wt%gel concentration.Heconfirmedthe suitability of theBinghammodel and he statedthat the trendline ismost reliablewhen its coefficient,R2, is at or near 1[16,18]. It is important to denote thatRashaida does confirm his linear regression resultspractically.The reliabilityof the trendline inhisworkdependsmainlyon thehighvalues of theR2.
DISCUSSION
The relation that represents themost stable O/Wemulsion has the strongest direct linear relationshipbetween temperature and conductivity. Thisrelationship is linear up to 80°. The statisticalanalysis gives themaximumR² value only to thedata obtained from the relation which representsthemost stableO/Wemulsion, directly, andwithoutany interference.The recordedmaximumR² valuerepresents actually the true maximum R² valueand is affected by the SBC.We concluded that,the most stable O/W emulsion is determined viathe determination of the maximum R² value byapplyingof the simple linear regression (least squares
method) to the temperature–conductivity obtaineddata up to 80°. Since the results ofO/W emulsionswith SBC of 9.5, 10 and 10.5% were excludedas mentioned before, so the slope value equal to0.824 of the relation which represents the moststable O/W emulsion is the maximum slope.Asthe slope is the change inY for unit change inX.Also, an equivalent definition is the change inY divided by the change in X for any segmentof the line. Thismeans that, themost stableO/Wemulsion has the highest predictive difference in theconductivity associatedwith the one unit increasesin temperature or in otherwordwe can say, it hasthe highest change in conductivity for unit change intemperature.
Statistical analysis does not give the maximumslope value to the data obtained from the relationthat represents the most stable O/W emulsiondirectly; it always needs verification, confirmationand explanations. The slope values were affectedby changing the SBC.The highest recorded slopevalue equal to 1.426 does not represent actually thetruemaximum slope valuewhich is equal to 0.824.This indicates that, to judge the stability of theO/Wemulsion, themaximumR² value ismore précisedand ismost important parameter than themaximumslope value.We concluded that, for any related setsof data the truemaximum slope value is representedby the relation (equation)of setofdatawhichhas themaximumR²value.
Wecandifferentiatebetween theO/Wemulsionswithno gel consistency and theO/W emulsionswith gelconsistency by the type of linearity and also can bedifferentiatedbyPITmeasurements.
The statistical analysisproved that theO/WemulsionsetswithSBC stating from11%up to 19%are not atypicalO/W emulsions as they have indirect linearrelationship.TheymaybeO/Wemulsiongel orO/Wmicro emulsiongel.Whichneedsmore investigation?
Verificationof themethod indicates its reproducibilityin the case of the complex formulations containingdrugs.
Acknowlegements:The authorwould like to thankGrand pharma forpharmaceutical industriesCo., 10th ofRamadan city,industrial zoneB4,Sharkia,Egypt.

July - August 2015 Indian Journal of Pharmaceutical Sciences 469
www.ijpsonline.com
Financial support and sponsorship:Nil.
Conflicts of interest:There are no conflicts of interest.
REFERENCES
1. Marszall L. The effective hydophile-lipophile balance and thestructuralmodifications of nonionic surfactants.Acta PharmTechnol1981;27:137-44.
2. EneverRP.Correlationofphase inversion temperaturewithkineticsofglobulecoalescence for emulsions stabilizedbyapolyoxyethylenealkylether. JPharmSci 1976;65:517-20.
3. ParkinsonCJ,SbermanP.Measurementofphase inversion temperatureabove 100, and their relevance to emulsion stability at ambienttemperature.ColloidPolymSci 1977;255:172-3.
4. LinTJ.Adverse effects of excess surfactants upon emulsification.CosmetToiletries 1991;106:71-81.
5. Tirnaksiz F, Kalsin O. A topical w/o/w multiple emulsionsprepared with Tetronic 908 as a hydrophilic surfactant:Formulation, characterization and release study. J PharmPharmSci2005;8:299-315.
6. Anton N, Gayet P, Benoit JP, Saulnier P. Nano-emulsions andnanocapsules by the PITmethod:An investigation on the role of thetemperature cycling on the emulsion phase inversion. Int J Pharm2007;344:44-52.
7. Prinderre P, Piccerelle PH, Cauture E, Kalantzis G, Reynier JP.Formulation and evaluation of o/w emulsions using experimentaldesign. Int JPharm1998;163:73-9.
8. LinTJ,KuriharaH,OhtaH.Effects of phase inversion and surfactantlocation on the formation ofO/W emulsions. J Soc Cosmet Chem1975;26:121-39.
9. RaiN, Pandey IP. Study of somephysiochemical factors determiningemulsion stability with mixed emulsifiers. J Ind Res Technol2013;3:12-6.
10. BagweRP,Kanicky JR, PallaBJ, Patanjali PK, ShahDO. Improveddrug delivery usingmicroemulsions:Rationale, recent progress, andnewhorizons.CritRevTherDrugCarrierSyst 2001;18:77-140.
11. Sevcikova P, KasparkovaV,VltavskaL P, Krejci J. The InfluenceofColloids on Stability and the Particle Size ofO/WEmulsions inthe Presence of Nonionic Surfactants. Nanocon, 4th InternationalConference,Brno,CzechRepublic,October 23-25, 2012.
12. Allouche J,TyrodeE,SadtlerV,ChoplinL,Salager JL.Simultaneousconductivity and viscosity measurements as a technique to trackemulsion inversion by the phase-inversion-temperature method.Langmuir 2004;20:2134-40.
13. ChoiE, JinK,RhimS,KimM.MicroemulsionswithPITsnear roomtemperature.CosmetToiletries 1997;112:85-90.
14. ShinodaK,SaitoH.The stabilityofO/W type emulsions as functionsof temperature and theHLB of emulsifiers: The emulsification byPIT-method. JColloidSci 1969;30:258-63.
15. Wilkinson JB,MooreRJ, editors.Harry’sCosmeticology.GreatBritain:LongmanScientific andTechnical; 1994.
16. ChatterjeeS,HadiAS.RegressionAnalysis byExample. 4th ed.NewJersey: JohnWiley andSons Inc.; 2006.
17. Sinko PJ, Singh Y, editors. Martin’s Physical Pharmacy andPharmaceutical Sciences.Baltimore: LippincottWilliams&Wilkins,WoltersKluwerBusiness; 2011.
18. RashaidaAA.Flowof a non-NewtonianBinghamplasticfluid over arotating disk. Saskatchewan:Department ofMechanicalEngineering,University ofSaskatchewan; 2005.