
Effective statistical features for coding and non-coding...
21
Int. J. Bioinformatics Research and Applications, Vol. 1, No. 2, 2005 181 Copyright © 2005 Inderscience Enterprises Ltd. Effective statistical features for coding and non-coding DNA sequence classification for yeast, C. elegans and human Alan Wee-Chung Liew* Department of Computer Science and Engineering, The Chinese University of Hong Kong, Shatin, Hong Kong E-mail: [email protected] *Corresponding author Yonghui Wu Agenica Research Pte Ltd, 11 Hospital Drive Singapore 169610 E-mail: [email protected] Hong Yan Department of Computer Engineering and Information Technology, City University of Hong Kong, Kowloon, Hong Kong School of Electrical and Information Engineering, University of Sydney, NSW 2006, Australia E-mail: [email protected] Mengsu Yang Department of Chemistry and Biology, City University of Hong Kong, Kowloon, Hong Kong E-mail: [email protected] Abstract: This study performs a quantitative evaluation of the different coding features in terms of their information content for the classification of coding and non-coding regions for three species. Our study indicated that coding features that are effective for yeast or C. elegans are generally not very effective for human, which has a short average exon length. By performing a correlation analysis, we identified a subset of human coding features with high discriminative power, but complementary in their information content. For this subset, a classification accuracy of up to 90% was obtained using a simple kNN classifier. Keywords: exon-intron classification; coding statistics; feature selection; information content; DNA sequence; correlation analysis. Reference to this paper should be made as follows: Liew, A.W-C, Wu, Y., Yan, H. and Yang, M. (2005) ‘Effective statistical features for coding and non-coding DNA sequence classification for yeast, C. elegans and human’, Int. J. Bioinformatics Research and Applications, Vol. 1, No. 2, pp.181–201.
Transcript of Effective statistical features for coding and non-coding...

Int. J. Bioinformatics Research and Applications, Vol. 1, No. 2, 2005 181
Copyright © 2005 Inderscience Enterprises Ltd.
Effective statistical features for coding and non-coding DNA sequence classification for yeast, C. elegans and human
Alan Wee-Chung Liew* Department of Computer Science and Engineering, The Chinese University of Hong Kong, Shatin, Hong Kong E-mail: [email protected] *Corresponding author
Yonghui Wu Agenica Research Pte Ltd, 11 Hospital Drive Singapore 169610 E-mail: [email protected]
Hong Yan Department of Computer Engineering and Information Technology, City University of Hong Kong, Kowloon, Hong Kong
School of Electrical and Information Engineering, University of Sydney, NSW 2006, Australia E-mail: [email protected]
Mengsu Yang
Department of Chemistry and Biology, City University of Hong Kong, Kowloon, Hong Kong E-mail: [email protected]
Abstract: This study performs a quantitative evaluation of the different coding features in terms of their information content for the classification of coding and non-coding regions for three species. Our study indicated that coding features that are effective for yeast or C. elegans are generally not very effective for human, which has a short average exon length. By performing a correlation analysis, we identified a subset of human coding features with high discriminative power, but complementary in their information content. For this subset, a classification accuracy of up to 90% was obtained using a simple kNN classifier.
Keywords: exon-intron classification; coding statistics; feature selection; information content; DNA sequence; correlation analysis.
Reference to this paper should be made as follows: Liew, A.W-C, Wu, Y., Yan, H. and Yang, M. (2005) ‘Effective statistical features for coding and non-coding DNA sequence classification for yeast, C. elegans and human’, Int. J. Bioinformatics Research and Applications, Vol. 1, No. 2, pp.181–201.
182 A.W-C. Liew, Y. Wu, H. Yan and M. Yang
Biographical notes: Alan Wee-Chung Liew received his BEng with first class honours in Electrical and Electronic Engineering from the University of Auckland, New Zealand, in 1993 and PhD in Electronic Engineering from the University of Tasmania, Australia, in 1997. He is currently an Assistant Professor in the Department of Computer Science and Engineering, The Chinese University of Hong Kong. His current research interests include computer vision, medical imaging, pattern recognition and bioinformatics. He has served as a technical reviewer for a number of international conferences and journals in IEEE Transactions, IEE proceedings, bioinformatics and computational biology. Dr. Liew is a member of the Institute of Electrical and Electronic Engineers (IEEE), and his biography is listed in the 2005 Marquis Who’s Who in the World and Marquis Who’s Who in Science and Engineering.
Yonghui Wu obtained her PhD from Xi’an Jiaotong University in Bio-Manufacturing Engineering in 2001. She then worked as a Research Assistant in the City University of Hong Kong where she studied gene visualisation and the algorithms to recognise protein coding sequences. In 2003, she worked as a Research Fellow in the National University of Singapore where she studies phylogenetic footprinting and transcription factor Binding Sites finding algorithms. Since 2004, she is working as Senior Bioinformatics Specialist in Agenica Research Pte Ltd where she studied the microarray data analysis and mining of Cancers.
Hong Yan received a BE degree from Nanking Institute of Posts and Telecommunications in 1982, an MSE degree from the University of Michigan in 1984, and a PhD degree from Yale University in 1989, all in electrical engineering. In 1982 and 1983, he worked on signal detection and estimation as a graduate student and research assistant at Tsinghua University. From 1986 to 1989, he was a research scientist at General Network Corporation, New Haven, CT, USA, where he worked on design and optimisation of computer and telecommunication networks. He joined the University of Sydney in 1989 and became Professor of Imaging Science in 1997. He is currently Professor of Computer Engineering at City University of Hong Kong. His research interests include image processing, pattern recognition and bioinformatics. He is the author or coauthor of one book and over 200 refereed technical papers in these areas. Professor Yan is a fellow of the International Association for Pattern Recognition (IAPR), a Fellow of the Institution of Engineers, Australia (IEAust), a senior member of the Institute of Electrical and Electronic Engineers (IEEE) and a member of the International Society for Computational Biology (ISCB).
Mengsu Yang received his BSc Degree in Chemistry from Xiamen University, China (1984), MSc Degree in Organic Chemistry from Simon Fraser University, Canada (1989) and PhD Degree in Analytical Chemistry from the University of Toronto, Canada (1993). He obtained his Postdoctoral training in molecular biology in The Scripps Research Institute, USA (1993–1994). He joined the City University of Hong Kong in 1994 and is currently Professor of Chemistry and Director of the Applied Research Centre for Genomics Technology at City University of Hong Kong. Professor Yang has published over 90 peer-reviewed scientific papers on the development of novel analytical techniques for biomedical applications and the studies of biomolecular interactions in cellular processes. His work has been recognised by the Best Paper Awards in the Eurasia Chemical Conference (1996) and the Asia-Pacific Conference of Tumor Biology (2001). Professor Yang was awarded the K.C. Wong Education Foundation Scholar Award in 2003. He is a member of the International Advisory Committee of ‘The Analyst’ (a Royal Society of

Effective statistical features for coding and non-coding DNA sequence 183
Chemistry publication) and a member of the Editorial Board of Life Science Instruments (a Chinese Society of Chemistry publication). He holds honorary professorships in The University of Hong Kong and Zhejiang University, China.
1 Introduction
The prediction of genes and the classification of coding and non-coding DNA sequences are unsolved and popular research problems in bioinformatics. During the past twenty years, numerous advanced gene-finding algorithms have been developed and several review papers haven been published (Fickett and Tung, 1992; Fickett, 1996; Guigo, 1999). Although powerful machine learning algorithms, such as neural networks and hidden Markov models (HMMs), are used in these algorithms, their performances are highly dependent on the coding statistics that are used to characterise the sequence. A coding statistic describes the likelihood that a DNA sequence is coding for a protein. Many such statistics have been proposed in the past, and some examples of these coding statistics are: codon usage bias (Staden and McLachlan, 1982), base compositional bias between codon positions (Fickett, 1982) and periodicity in base occurrence (Tiwari et al., 1997). Although many coding statistics have been proposed for coding and non-coding sequence classification, a quantitative comparison of their performance (especially independent of the classifier used) is lacking in the literature. Since the use of a good set of coding statistics can directly impact the classification accuracy, the selection of a set of optimal coding features for classification is a very important problem (Liew et al., 2004).
It is known that not all types of coding statistics are equally powerful for any species. Choosing the right coding statistics that have the most discriminative power for the species concerned would lead to better recognition results. It would be interesting to see whether a set of features that are good for a species would still be good for another species, and to what extent they are species-dependent or species-independent. This is especially relevant for the case of human genome due to its short average exon length.
Recognition of coding regions or ORFs in human genome based on coding statistics is always a difficult problem since the average length of exons of vertebrate gene is only 137 base pair (bp) (Hawkins, 1988). Although good accuracy can be achieved in the recognition of coding and non-coding regions in yeast genome (Zhang and Wang, 2000), statistical features alone are generally not sufficient to identify human exons due to their short length. Additional information is required. For example, the use of splicing signal such as stop codons together with the coding statistics has resulted in better prediction power (Wang et al., 2002; Zhang and Zhang, 1994).
This paper reports our study on several coding features that are often used for coding and non-coding DNA sequence classification. The features were compared based on their information content. A total of 22 features, which can be divided into six groups, are analysed. They are:

184 A.W-C. Liew, Y. Wu, H. Yan and M. Yang
• two ATG triplet features
• two stop codon features
• three asymmetric features of distribution of nucleotides at the three triplet positions
• nine Z-curve features
• three simple Z-curve (SZ) features
• three periodic features of correlations between nucleotide positions.
The objective of our study is two-fold. First, we would like to study the species-specificity of the various features. In other words, is a feature that is effective for one species also effective for another species? Or is the set of effective features species-dependent? To answer these questions, we performed a quantitative evaluation on the information content of the 22 features for the discrimination of coding and non-coding sequences in three species, i.e., human, yeast and C. elegans. Unlike in a classification experiment, this evaluation is independent of the classifier used. Our second goal is to identify a subset of features from the 22 features that is effective in the classification of coding and non-coding sequence of human. We believe that such a study would provide useful guidelines to the choice of good coding features for a classification algorithm.
2 Methods
2.1 Database
The Yeast ORFs dataset came from ftp://genome-ftp.stanford.edu/pub/yeast/yeast_ORFs, and the Yeast No-Feature dataset came from ftp://genome-ftp.stanford.edu/pub/yeast/ yeast_NotFeature. The C. elegans coding sequences and small non-coding RNAs datasets came from ftp://ftp.sanger.ac.uk/pub/wormbase/current_release/. The Human exons and introns datasets came from http://bit.uq.edu.au/altExtron/.
Six thousand Yeast ORFs and 6,000 Yeast NoFeature sequences, 3,000 C. elegans coding sequences and 3,000 small non-coding RNAs, 1,500 Human exons and 1,500 introns whose length is less than 140bp (We choose 140 bp since the average length of exons of vertebrate gene is 137 bp) are extracted from these databases. The exons are not frame-specific. Although introns in human can be very long, short introns were selected to avoid introducing any bias in recognition due to length. The exons or ORFs are used as positive samples and introns or no-feature sequences are used as negative samples.
2.2 Coding features
Based on the sequence information they contained, the 22 features can be classified into six groups as shown below:

Effective statistical features for coding and non-coding DNA sequence 185
• Two ATG triplet features.
Note that the ATG triplet that is involved in the initiation of translation is also called the start codon (Saito and Tomita, 1999).
• Let the total number of the ATG triplet contained in all three frames in a sequence be denoted by n. The number of frames containing the triplet ATG in a sequence is denoted by K, i.e., K = 0, 1, 2, 3. The ATG triplet statistic is defined by
f1 = (1 + k2) × n (1)
f2 = n
• Two stop codon features.
The number of triplets TAA, TAG, and TGA occurring in all three frames of the sequence is counted and is denoted by nTAA, nTAG and nTGA, respectively.
• Similar to f1, the stop codon feature is defined by f3 = (1 + k2) × n, where n = nTAA + nTAG + nTGA. This feature has been used in Wang et al. (2002).
f4 = max(nTAA, nTAG, nTGA) (2)
• Three asymmetric features of distribution of nucleotides at the three triplet positions. • The Position Asymmetry (PA) of the sequence (Guigo, 1999).
Let f(b, r) be the relative frequency of nucleotide b at triplet position r. Let ( ) 3
1( ) 1 3 ( , )
rf b f b r
== ∑ be the average frequency of nucleotide b at the
three triplet positions, and define the asymmetry in the distribution of nucleotide b as the variance of this frequency, i.e., 3 2
1asym( ) [ ( , ) ( )] ,
ib f b i f b
== −∑ the PA of a sequence is defined as
f5 = PA = asym(A) + asym(C) + asym(G) + asym(T) (3) • One Purine feature
It is well known that the predominant bases at the first codon position in the reading frame are purines and this fact is independent of species (Guigo, 1999), whereas bases in non-coding regions tend to be randomly distributed. The occurrence frequencies of purines in the three reading frames are denoted by (ai + gi), I = 1, 2, 3 and the purine feature is defined as
f6 = maxi(ai + gi), I = 1, 2, 3 (4) • One Pyrimidine feature.
It is well known that the predominant bases at the third codon position in the reading frame are pyrimidines and this fact is independent of species (Guigo, 1999). The occurrence frequencies of pyrimidines in the three frames are denoted by (ci + ti), I = 1, 2, 3. The pyrimidine feature is defined by
f7 = maxi(ci + ti), i=1, 2, 3 (5)
• Nine Z-curve features (Zhang and Zhang, 1994; Zhang, 1997a).
The Z-curve features are based on the differences of single nucleotide frequencies at the three codon positions between the protein coding ORFs and the non-coding ones.

186 A.W-C. Liew, Y. Wu, H. Yan and M. Yang
The frequencies of bases A, C, G and T occurring in an ORF or a fragment of DNA sequence with bases at positions 1, 4, 7, …; 2, 5, 8, … and 3, 6, 9, … are denoted by a1, c1, g1, t1; a2, c2, g2, t2; a3, c3, g3, t3, respectively. They are actually the frequencies of bases at the first, second and third codon position. Let x1, y1, z1; x2, y2, z2; x3, y3, z3 be given by
( ) ( )( ) ( ), 1,2,3( ) ( )
i i i i i
i i i i i
i i i i i
x a g c ty a c g t iz a t g c
= + − + = + − + = = + − +
(6)
The nine Z-curve features, f8 to f16, are defined by
f8 = x1, f9 = y1, f10 = z1
f11 = x2, f12 = y2, f13 = z2 (7)
f14 = x3, f15 = y3, f16 = z3
• Three Simple Z-curve (SZ) features (Wu et al., 2003).
The SZ features, f17 to f19, are defined by
f17 = maxi[(ai + gi) – (ci + ti)]
f18 = maxi[(ai + ci) – (gi + ti)], i = 1, 2, 3 (8)
f19 = maxi[(ai + ti) – (gi + ci)]
It is known that the value (ai + gi) – (ci + ti), (i = 1, 2, 3) in f17 indicates the number of bases of the Purine or Pyrimidine types in the i reading frame, the value (ai + ci) – (gi + ti) in f18 indicates the number of bases of the amino or keto (M = A, C/K = G, T) types in the i reading frame and the value (ai + ti) – (gi + ci) in f19 indicates the number of bases of strong H-bonds (S = G, C) or weak H-bonds (W = A, T) in the i reading frame (Zhang, 1997a).
• Three periodic correlation features between nucleotide positions (Fickett, 1982; Guigo, 1999).
• Periodic Asymmetry Index (PAI). Given a sequence, Konopka (1994) considers three distinct probabilities, the probability Pin of finding pairs of the same nucleotide at distances k = 3, 6, 9, …, the probability 1
outP of finding pairs of the same nucleotide at distances k = 1, 4, 7, … and the probability 2
outP of finding pairs of the same nucleotide at distances k = 2, 5, 8, …. Note that nucleotide pairs at a distance of k = 3, 6, 9, … nucleotides are at the same codon position, whereas nucleotide pairs at other distances are not. Because of the 3-base periodic pattern, Pin is larger than the other two probabilities in coding regions. In non-coding regions, the three probabilities are similar. The tendency to cluster homogeneous di-nucleotides in a three-base periodic pattern can be measured by the Periodic Asymmetry Index
1 2in out out
20 1 2in out out
max( , , )PAI =min( , , )
P P PfP P P
= (9)

Effective statistical features for coding and non-coding DNA sequence 187
• Average Mutual Information (AMI) (Herzel and Grosse, 1995). It is well known that coding sequence exhibits a 3-base periodicity due to the non-uniform codon usage and this periodicity shows up in the correlation between nucleotide i and nucleotide j at a distance of k nucleotides. For each distance k, 16 different individual correlations can be calculated. A measure that summarises all individual correlations at a given distance k is the mutual information function,
2, { , , , }
( )( ) ( ) log ij
iji j A C G T i j
P kI k P k
PP∈
=
∑ (10)
I(k) quantifies the amount of information that can be obtained from one nucleotide about another nucleotide at a distance k. For the coding sequence, I(k) has larger values for k = 3, 6, 9, … and the three-base periodic pattern in coding sequences is obvious. Thus, in coding DNA, I(k) oscillates between two values, while in non-coding DNA, I(k) is rather flat. Herzel and Grosse (1995) called the two values between which I(k) oscillates in coding DNA the in-frame mutual information Iin at distances k = 3, 6, 9, … and the out-of-frame mutual information Iout at k = 4, 5, 7, 8, …. In order to reduce the pair of numbers Iin and Iout to a single quantity, they compute the average mutual information (AMI) as (Grosse et al., 2000)
in out21
2AMI =3
I If += (11)
• Fourier spectral feature. Periodic correlations in DNA sequences can also be examined by means of Fourier analysis (Tiwari et al., 1997). DNA coding regions reveal the characteristic three-base periodicity, which shows up as a distinct peak at the frequency index k = N/3, where N is the length of the sequence. No such peak is apparent for non-coding sequences. The Fourier spectral feature f22 is defined as follows. Let Ad(t), Cd(t), Gd(t) and Td(t) be the number of distinct pairs of nucleotide bases A, T, G and C, respectively, in a DNA sequence separated by a distance t, where t ranges from 1 to N. Let s(t) = Ad(t) + Cd(t) + Gd(t)+ Td(t). Let S(k) be the discrete Fourier transform (DFT) of s(t), i.e.,
12 /
0
( ) ( )N
j kt N
t
S K s t e π−
−
=
= ∑ (12)
For three-base periodicity, S(k) should exhibit a strong peak at the frequency index k = N/3. Let 2( ) ( )P K S K= be the power spectrum of S(k), then the Fourier Spectrum feature f22 is defined as
22( )
(1/ 2 1) ( )j k w
j k w
P kfw P j= +
= −
=+ ∑
(13)
where k = N/3 and 2w + 1 are the window used to obtain the average power spectrum within the window. We set w = 5 in our experiment.

188 A.W-C. Liew, Y. Wu, H. Yan and M. Yang
2.3 Information content of coding features
Altogether 22 coding features are studied. Their discriminating power for coding and non-coding sequences is compared using the information-theoretic measure called mutual information, which essentially measures the information the feature gives us about the two classes (i.e., coding vs. non-coding). The mutual information of the j-th feature with respect to the class ωi is given by (Shannon, 1948; Haykin, 1988)
1 1
( ( ))( , ( )) log
( )
jvmi j
j i ji k i
p f kG p f k
pω
ωω= =
= ∑∑ (14)
where each feature fj has vj discrete values, which are obtained by histogram. The mutual information Gj measures the information that fj gives us about the class label. Since
p(ωi, fj(k)) = p(ωi) p(fj(k)ωi) = p(ωifj(k))p(fj(k)), (15)
equation (14) can be written as
1 1
( ( )( ) ( ( ) ) log .
( ( )
jvmj i
j i j ii k j
p f kG p p f k
p f kω
ω ω= =
= ∑∑ (16)
For coding and non-coding classification, we have two classes, so m = 2. We set the prior probabilities p(ωi) to be equal for both classes since we have equal number of positive and negative samples.
To estimate the probability density function in equation (16) using the histogram approach, the selection of number of histogram bins is a critical issue. If the number of histogram bins is too large, it would result in over-fitting and overestimation of the MI value. There are formal rules for deciding on the appropriate number of bins in a histogram (Venables and Ripley, 1994). If the data are Gaussian distributed, the proper number of bins is log2N + 1. For non-Gaussian data, the proper number of bins is
2 2log 1 log (1 / 6)N Nκ+ + + , where N is the number of data point and κ is the estimated kurtosis. To test the Gaussianity of the features, we tested the normalised skewness and normalised kurtosis (Stuart and Ord, 1994). The null hypothesis is that the set of observations follows the Gaussian distribution if the normalised skewness and normalised kurtosis of the data follow the standard Gaussian distribution N(0, 1). The normalised skewness (S) and normalised kurtosis (K) are defined as:
33
1
1 ( )6
N
ii
S x xNσ =
= −∑ (17)
44
1
1 3( )824
N
ii
NK x xNσ =
= − −∑ (18)
where N, x and σ are the sample size, sample mean and sample standard deviation, respectively. At the significance levels of α = 0.05 and α = 0.01, the critical values for N(0, 1) are ±1.96 and ±2.58, respectively. The results for such a test are shown in Figure 1 for α = 0.05, where the biggest of either K or S of each feature is displayed. The K or S value of most features is well above the critical value, indicating that they are highly non-Gaussian.

Effective statistical features for coding and non-coding DNA sequence 189
Figure 1 Test of Gaussianity for the 22 features for Human (top), Yeast (middle) and C.elegans (bottom). The largest of S or K for the 22 features is shown. The white horizontal line shows the critical value for 05.0=α . All values are log-transformed for display purpose
3 Results
3.1 Comparison of mutual information of 22 features for three species
The mutual information (MI) of every feature has been computed in the 6,000 Yeast ORFs and 6,000 Yeast NoFeature sequences, 3,000 C. elegans coding sequences and 3000 small non-coding RNAs, 1,500 Human exons and 1,500 introns, respectively. The results are tabulated in Table 1 and shown in Figure 2. The following observations can be summarised from Table 1:
• In general, the discriminating power of most coding features, with the exception of PA, PAI, AMI and the last SZ feature, is significantly lower for human than for yeast or C. elegans.
• The MI value of the two stop codon features (f3 and f4) of yeast and C. elegans is significantly smaller than that of the two ATG triplet features f1 and f2. For human, the MI value of f3 is significantly higher than that of the two ATG triplet features, whereas the MI value of f4 is the smallest among all 22 features studied.

190 A.W-C. Liew, Y. Wu, H. Yan and M. Yang
• The MI value of the PA feature (f5) of human is the highest. In contrast, the MI value of the PA feature of yeast and C. elegans is at the lower end. So, while PA is a good feature for human, it is a poor choice for yeast and C. elegans.
• The MI value of purine feature (f6) and pyrimidine feature (f7) in yeast and C. elegans is higher than the mean value, while the MI value of purine feature and pyrimidine feature in human is smaller than the mean value. It was noted that the most frequent codons were of the form RNY(R = A or G, Y = C or T, N = any nucleotide) (Shepherd, 1981). Our experiment seems to indicate that this is obvious in the longer coding sequences of yeast and C. elegans, while less obvious in the coding sequences of human.
• The MI value of the Z-curve features (f8 – f16) varies greatly among the three species. The MIs of f9, f10, f11, f14, f15 and f16 are all smaller than the mean value in all three species. For yeast, only f8 and f12 have MI value higher than the mean value, while for C. elegans, f8, f12 and f13 have MI value higher than the mean value. Nevertheless, the MI value of f8 is the highest among all 22 features in yeast and C. elegans, and hence is the most discriminating feature for classifying coding and non-coding sequences for both organisms. For human, only f13 has MI value slightly higher than the mean value. While two and three of the Z-curve features have high MI value for yeast and C. elegans, all Z-curve features generally have low MI value for human.
• The MI value of the three SZ features (f17 to f19) also varies greatly among the three species. The feature f17 mainly reflects the fact that the predominant bases at the first codon position are purines and the predominant bases at the third codon position are pyrimidines. This feature is one of the only two features that have MI value higher than the mean value for all three species. It indicates that this feature is fairly independent of species.
• The MI value of the second SZ features (f18) is significantly higher than the mean value for yeast, while slightly higher than the mean value for C. elegans and slightly lower than the mean value for human. The MI value of the third SZ features (f19) is slightly smaller than the mean value for yeast, slightly higher than the mean value for C. elegans and significantly higher than the mean value for human. In fact, it is the second highest among the 22 features for human.
• The MI values of PAI and AMI features (f20 and f21) are significantly higher than the mean value for human. They are significantly smaller than the mean value for both yeast and C. elegans.
• The MI value of Fourier spectral feature (f22) is higher than the mean value for all three species, indicating that this feature is fairly independent of species. Together with f17, they are the only two features that are higher than their respective mean value for all three species.
• To sum up, we see that the information content of different coding features varies greatly for different species and is generally highly species-dependent.

Effective statistical features for coding and non-coding DNA sequence 191
Figure 2 The MI of 22 features for Human (top), Yeast (middle) and C.elegans (bottom), the horizontal line in each plot denotes the mean value for the 22 features
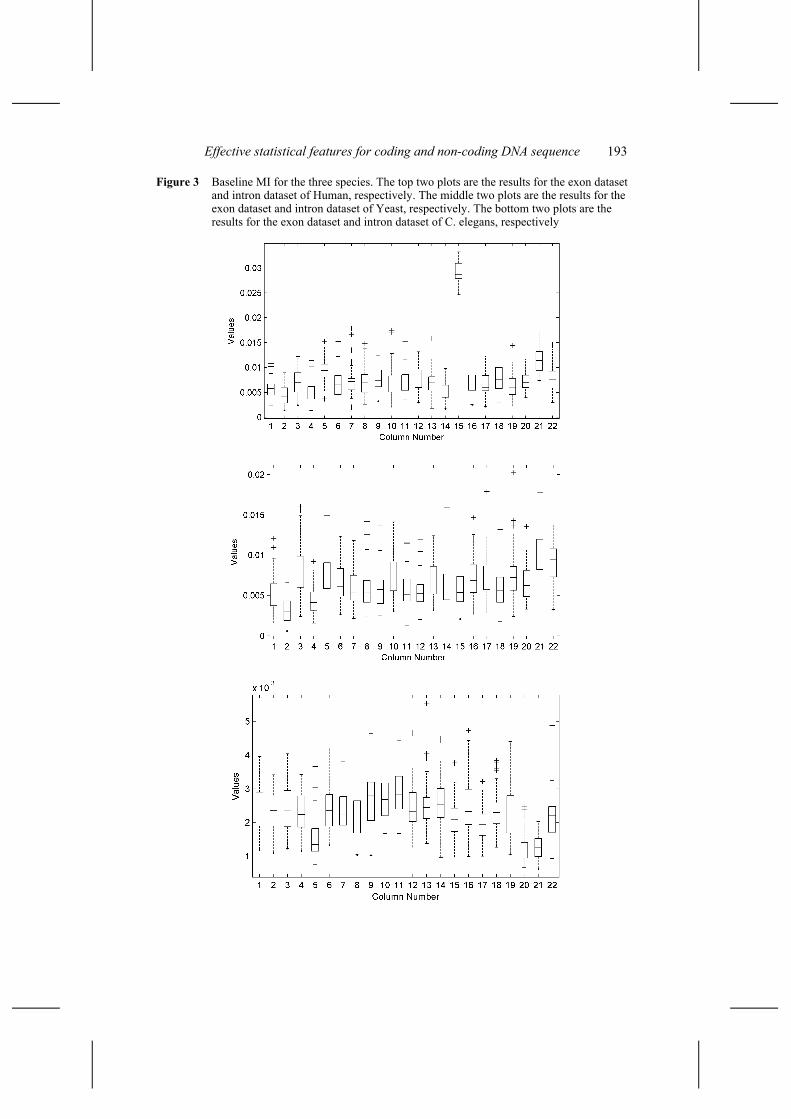
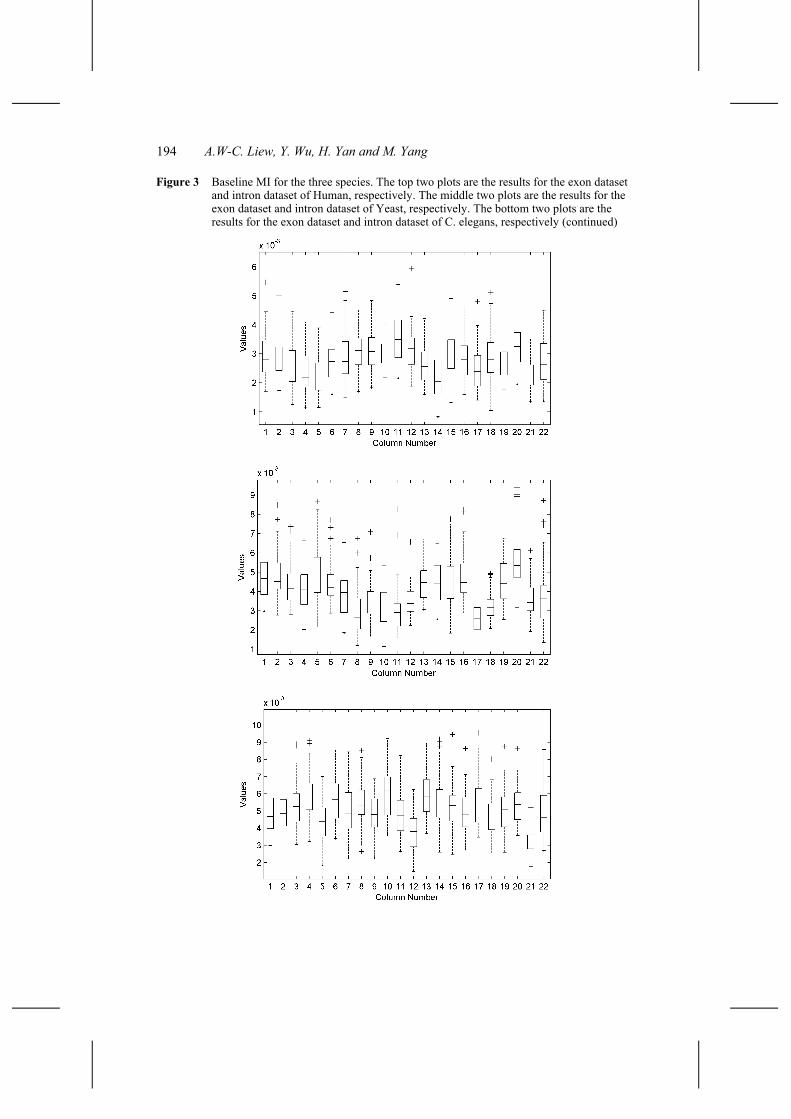
To provide a baseline comparison, we have also computed the features’ MI for samples randomly selected from the exon database and samples randomly selected from the intron database, for all three species. For example, for the exon dataset of Human with 1,500 samples, 750 randomly selected samples are assumed to be of class 1 (i.e., exon) and the other 750 samples are assumed to be of class 2 (i.e., intron), and the MIs of all 22 features are computed. Since both sets of randomly selected samples are actually of the same class, the MIs should be of very low values. The baseline results for all three species are shown in Figure 3. The experiment was repeated 50 times, and the results are shown graphically using box-and-whisker plots, where the box shows the median, upper and lower quartiles. The top two plots are the results for the exon dataset and intron dataset of Human, the middle two plots are the results for the exon dataset and intron dataset of yeast and the bottom two plots are the results for the exon dataset and intron dataset of C. elegans. We see that the baseline MIs are below 0.02 (except for f15 for the Human exon dataset) for Human, below 0.006 for yeast and below 0.01 for C. elegans. The baseline MIs can be used to rule out uninformative features, i.e. (f4, f15) for Human and f21 for yeast.
192 A.W-C. Liew, Y. Wu, H. Yan and M. Yang
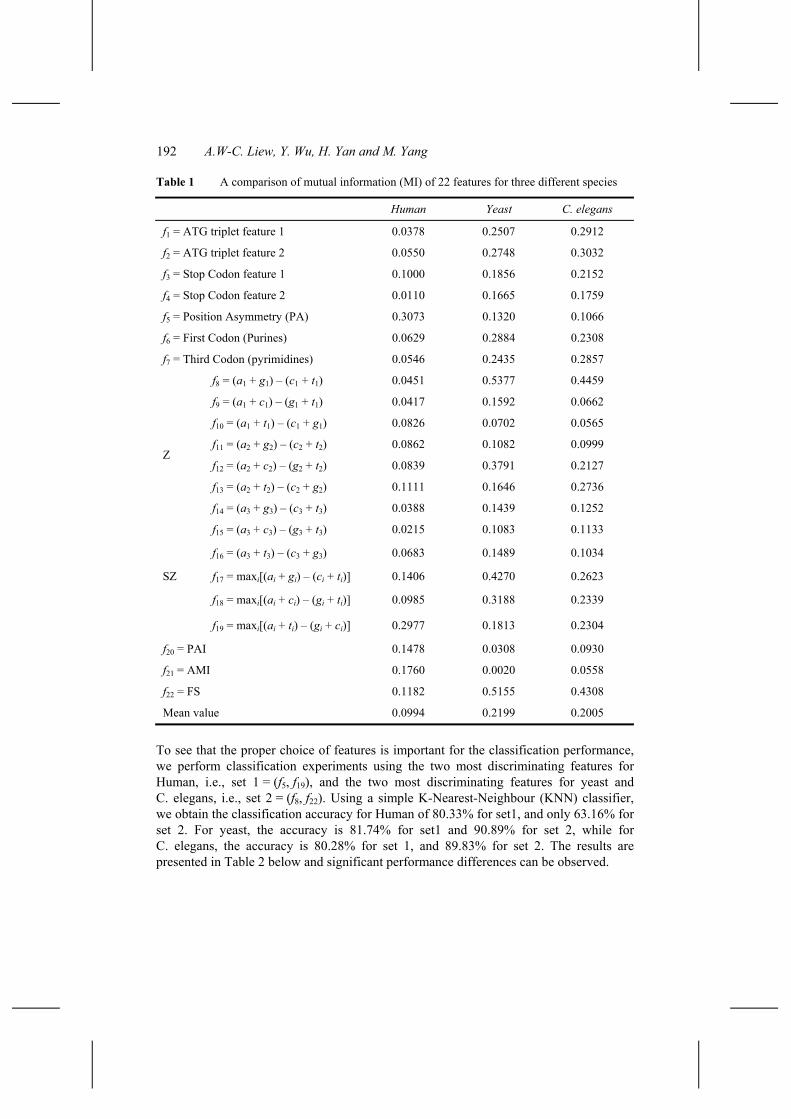
Table 1 A comparison of mutual information (MI) of 22 features for three different species
Human Yeast C. elegans
f1 = ATG triplet feature 1 0.0378 0.2507 0.2912
f2 = ATG triplet feature 2 0.0550 0.2748 0.3032
f3 = Stop Codon feature 1 0.1000 0.1856 0.2152
f4 = Stop Codon feature 2 0.0110 0.1665 0.1759
f5 = Position Asymmetry (PA) 0.3073 0.1320 0.1066
f6 = First Codon (Purines) 0.0629 0.2884 0.2308
f7 = Third Codon (pyrimidines) 0.0546 0.2435 0.2857
f8 = (a1 + g1) – (c1 + t1) 0.0451 0.5377 0.4459
f9 = (a1 + c1) – (g1 + t1) 0.0417 0.1592 0.0662
f10 = (a1 + t1) – (c1 + g1) 0.0826 0.0702 0.0565
f11 = (a2 + g2) – (c2 + t2) 0.0862 0.1082 0.0999
f12 = (a2 + c2) – (g2 + t2) 0.0839 0.3791 0.2127
f13 = (a2 + t2) – (c2 + g2) 0.1111 0.1646 0.2736
f14 = (a3 + g3) – (c3 + t3) 0.0388 0.1439 0.1252
Z
f15 = (a3 + c3) – (g3 + t3) 0.0215 0.1083 0.1133
f16 = (a3 + t3) – (c3 + g3) 0.0683 0.1489 0.1034
SZ f17 = maxi[(ai + gi) – (ci + ti)] 0.1406 0.4270 0.2623
f18 = maxi[(ai + ci) – (gi + ti)] 0.0985 0.3188 0.2339
f19 = maxi[(ai + ti) – (gi + ci)] 0.2977 0.1813 0.2304
f20 = PAI 0.1478 0.0308 0.0930
f21 = AMI 0.1760 0.0020 0.0558
f22 = FS 0.1182 0.5155 0.4308
Mean value 0.0994 0.2199 0.2005
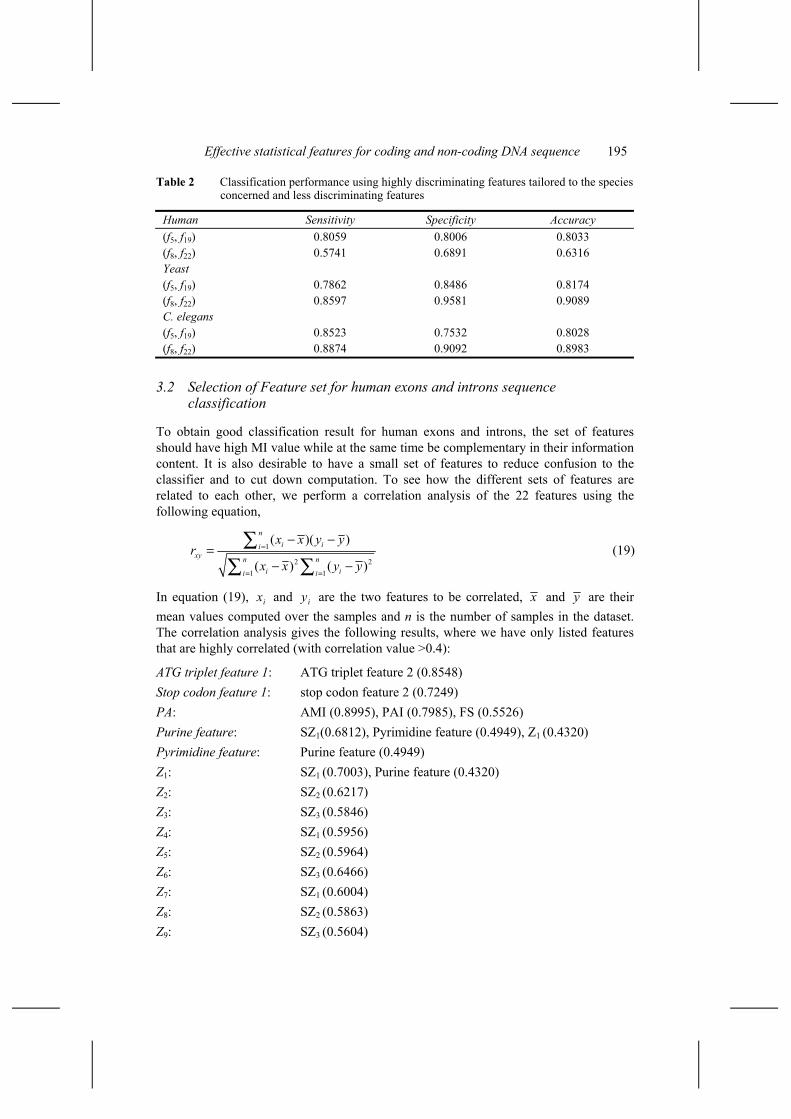
To see that the proper choice of features is important for the classification performance, we perform classification experiments using the two most discriminating features for Human, i.e., set 1 = (f5, f19), and the two most discriminating features for yeast and C. elegans, i.e., set 2 = (f8, f22). Using a simple K-Nearest-Neighbour (KNN) classifier, we obtain the classification accuracy for Human of 80.33% for set1, and only 63.16% for set 2. For yeast, the accuracy is 81.74% for set1 and 90.89% for set 2, while for C. elegans, the accuracy is 80.28% for set 1, and 89.83% for set 2. The results are presented in Table 2 below and significant performance differences can be observed.
Effective statistical features for coding and non-coding DNA sequence 193
Figure 3 Baseline MI for the three species. The top two plots are the results for the exon dataset and intron dataset of Human, respectively. The middle two plots are the results for the exon dataset and intron dataset of Yeast, respectively. The bottom two plots are the results for the exon dataset and intron dataset of C. elegans, respectively
194 A.W-C. Liew, Y. Wu, H. Yan and M. Yang
Figure 3 Baseline MI for the three species. The top two plots are the results for the exon dataset and intron dataset of Human, respectively. The middle two plots are the results for the exon dataset and intron dataset of Yeast, respectively. The bottom two plots are the results for the exon dataset and intron dataset of C. elegans, respectively (continued)
Effective statistical features for coding and non-coding DNA sequence 195
Table 2 Classification performance using highly discriminating features tailored to the species concerned and less discriminating features
Human Sensitivity Specificity Accuracy (f5, f19) 0.8059 0.8006 0.8033 (f8, f22) 0.5741 0.6891 0.6316 Yeast (f5, f19) 0.7862 0.8486 0.8174 (f8, f22) 0.8597 0.9581 0.9089 C. elegans (f5, f19) 0.8523 0.7532 0.8028 (f8, f22) 0.8874 0.9092 0.8983
3.2 Selection of Feature set for human exons and introns sequence classification
To obtain good classification result for human exons and introns, the set of features should have high MI value while at the same time be complementary in their information content. It is also desirable to have a small set of features to reduce confusion to the classifier and to cut down computation. To see how the different sets of features are related to each other, we perform a correlation analysis of the 22 features using the following equation,
1
2 21 1
( )( )
( ) ( )
ni ii
xy n ni ii i
x x y yr
x x y y=
= =
− −=
− −
∑∑ ∑
(19)
In equation (19), ix and iy are the two features to be correlated, x and y are their mean values computed over the samples and n is the number of samples in the dataset. The correlation analysis gives the following results, where we have only listed features that are highly correlated (with correlation value >0.4):
ATG triplet feature 1: ATG triplet feature 2 (0.8548) Stop codon feature 1: stop codon feature 2 (0.7249) PA: AMI (0.8995), PAI (0.7985), FS (0.5526) Purine feature: SZ1(0.6812), Pyrimidine feature (0.4949), Z1 (0.4320) Pyrimidine feature: Purine feature (0.4949) Z1: SZ1 (0.7003), Purine feature (0.4320) Z2: SZ2 (0.6217) Z3: SZ3 (0.5846) Z4: SZ1 (0.5956) Z5: SZ2 (0.5964) Z6: SZ3 (0.6466) Z7: SZ1 (0.6004) Z8: SZ2 (0.5863) Z9: SZ3 (0.5604)

196 A.W-C. Liew, Y. Wu, H. Yan and M. Yang
SZ1: Z1 (0.7003), Purine feature (0.6812), Z7 (0.6004), Z4 (0.5956) SZ2: Z2 (0.6217), Z5 (0.5964), Z8 (0.5863) SZ3: Z6 (0.6466), Z3 (0.5846), Z9 (0.5604) PAI: AMI (0.8247), PA (0.7985), FS (0.6600) AMI: PA (0.8995), PAI (0.8247), FS (0.4385) FS: PAI (0.6600), PA (0.5526), AMI (0.4385)
Based on the correlation analysis, we can group the 22 features approximately into four classes:
• class 1 consists of the nine Z-curve features, three SZ features, Purine feature and Pyrimidine feature
• class 2 consists of the two ATG triplet features
• class 3 consists of the two stop codon features and finally
• class 4 consists of the PA, PAI, AMI and FS features.
By examining the correlation values and the MI values, we can select features that are effective for the classification task.
For the class 1 features, we see that SZ1 is highly correlated with Z1, purine feature, Z7 and Z4. Among the four features, SZ1 has the highest MI. So, SZ1 is selected as a feature to be used in the classification task. Similarly, SZ2 and SZ3 are selected. The pyrimidines feature is also selected since it is not highly correlated with the purine feature. For the two class 2 features, their MIs are of fairly low value. However, f2 is still significantly higher than the baseline value of 0.02 and hence is selected. For the class 3 features, the first stop codon feature is selected. For the class 4 features, the PA feature is selected.
We perform classification experiments using the seven selected features {f2, f3, f5, f7, f17, f18, f19}. The classifier we used is the k-nearest-neighbour (kNN) classifier, where k is chosen to be ten experimentally. Unlike the Fisher discriminant classifier, the kNN classifier does not require the decision surface to be linear and tends to produce superior results for the exon-intron classification task (Wu et al., 2003). Theoretically, the asymptotic classification error of the kNN classifier is less than twice the Bayes’ error. The sensitivity, specificity and accuracy of each classification experiment are calculated. The sensitivity (Sn) and specificity (Sp) are as defined in (Burset and Guigo, 1996), where Sn is the proportion of coding sequences that have been correctly classified as coding, i.e.,
TPSn =TP + FN
(20)
and Sp is the proportion of non-coding sequences that have been correctly classified as non-coding, i.e.,
TNSp =TN + FP
(21)
Effective statistical features for coding and non-coding DNA sequence 197
and the accuracy (Acu) is defined as the average of Sn and Sp. In equations (20) and (21), TP denotes the number of coding sequences that have been correctly predicted as coding (the true positives), TN denotes the number of non-coding sequences correctly predicted as non-coding (the true negatives), FN denotes the number of coding sequences predicted as non-coding (the false negatives) and FP denotes the number of non-coding sequences predicted as coding (the false positives).
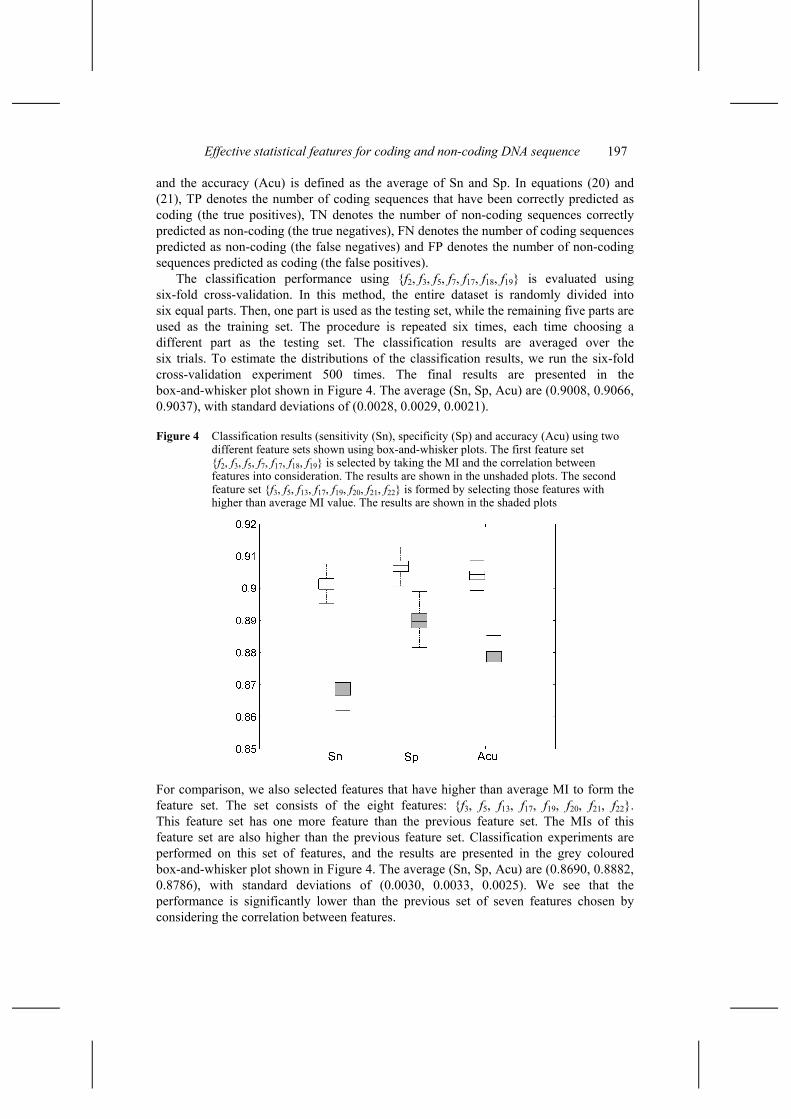
The classification performance using {f2, f3, f5, f7, f17, f18, f19} is evaluated using six-fold cross-validation. In this method, the entire dataset is randomly divided into six equal parts. Then, one part is used as the testing set, while the remaining five parts are used as the training set. The procedure is repeated six times, each time choosing a different part as the testing set. The classification results are averaged over the six trials. To estimate the distributions of the classification results, we run the six-fold cross-validation experiment 500 times. The final results are presented in the box-and-whisker plot shown in Figure 4. The average (Sn, Sp, Acu) are (0.9008, 0.9066, 0.9037), with standard deviations of (0.0028, 0.0029, 0.0021).
Figure 4 Classification results (sensitivity (Sn), specificity (Sp) and accuracy (Acu) using two different feature sets shown using box-and-whisker plots. The first feature set {f2, f3, f5, f7, f17, f18, f19} is selected by taking the MI and the correlation between features into consideration. The results are shown in the unshaded plots. The second feature set {f3, f5, f13, f17, f19, f20, f21, f22} is formed by selecting those features with higher than average MI value. The results are shown in the shaded plots
For comparison, we also selected features that have higher than average MI to form the feature set. The set consists of the eight features: {f3, f5, f13, f17, f19, f20, f21, f22}. This feature set has one more feature than the previous feature set. The MIs of this feature set are also higher than the previous feature set. Classification experiments are performed on this set of features, and the results are presented in the grey coloured box-and-whisker plot shown in Figure 4. The average (Sn, Sp, Acu) are (0.8690, 0.8882, 0.8786), with standard deviations of (0.0030, 0.0033, 0.0025). We see that the performance is significantly lower than the previous set of seven features chosen by considering the correlation between features.

198 A.W-C. Liew, Y. Wu, H. Yan and M. Yang
4 Discussion
This paper reports our study on 22 coding features that are proposed for coding and non-coding DNA sequence classification. The first part of our study quantitatively compares the discriminative power of 22 coding features for human, yeast and C. elegans based on their information content as measured by their mutual information (MI). We observed that the information content of different coding features varies greatly for different species, as is expected. We have found that features that are effective for yeast and C. elegans are generally not very effective for human and vice versa. For example, PA, which is the most discriminating feature among all 22 features for human, is among the less discriminating feature for both yeast and C. elegans. For human, features that measure the asymmetry in nucleotide distribution at the three codon positions (i.e., PA) and those that measure the periodic structure (i.e., PAI, AMI, FS) in the sequence have high discriminative power. The three SZ features also perform well for the classification of human exons/introns, with the third SZ feature having the second highest MI value. On the other hand, the nine Z-curve features generally have lower MI value than the SZ features although the two sets of features are quite closely related. Of the nine Z-curve features, only one (f13) has MI value that is above the mean value for human, indicating that this set of features is not as powerful as some of the other features for the classification of human exons and introns. For yeast and C.elegans, the first Z-curve feature and the FS feature have the highest MI values and are good for intron/exon classification. The SZ features are quite informative for both species as well. There are very few features (i.e., only the first SZ feature (f17) and the FS feature (f22), out of the 22 features investigated) that are effective for all three species. These two features are good for yeast and C. elegans, and are also fairly good for human. They are therefore useful for the classification of coding and non-coding sequences when species information is not available. Our study indicates that a careful selection of coding features tailored to the species of interest is important to ensure good classification.
In the second part of our study, we attempt to find a set of coding features that are effective for the classification of human exons and introns. This classification task is a difficult one due to the short average exon length for human. Many of the features we studied have low MI value for human. By performing correlation analysis of the features with high information content, we are able to select an effective set of seven features, which consists of the second ATG feature, the first stop codon feature, the PA feature, the pyrimidine feature and the three SZ features, which gives a classification accuracy of up to 90% using a kNN classifier. In comparison, when we selected features that have higher than average MI values (eight features in total), without regard to the redundancy in information between features, we only manage to get about 88% classification accuracy.
We note that there are many powerful classification algorithms for gene finding. Some of these algorithms are: GeneScan (Tiwari et al., 1997), Glimmer (Salzberg et al., 1998), GlimmerHMM (Majoros et al., 2004), GeneMark.hmm (Lukashin and Borodovsky, 1998), MZEF (Zhang, 1997b), interpolated Markov Model (Salzberg et al., 1999), TIGRScan (Burge and Karlin, 1997; Majoros et al., 2004), TWAIN (http://www.tigr.org/software/pirate/twain/twain.html). Many of these gene-finding methods use variants of HMMs as the core algorithm. Nevertheless, we choose to use the simple kNN classifier here since our main purpose is to illustrate the importance of choosing a good set of features for classification, independent of possible
Effective statistical features for coding and non-coding DNA sequence 199
bias introduced in classifier design, tuning and testing. We would expect that better classification result could be obtained using a more sophisticated classifier. Having said that, a recent study by Gao and Zhang (2004) shows clearly the benefit of having a good set of features for coding sequence recognition. Their results indicated that by simply extending the Z-curve features to the di-nucleotides and tri-nucleotides settings, the recognition accuracy can significantly outperform the much more complicated Markov chain model (Borodovsky and McIninch, 1993) even when a relatively simple Fisher discriminant classifier is used.
Future work would be to investigate rigorous methods for choosing the optimal subset of features for intron/exon classification. Currently, the subset of features is selected based on ad-hoc consideration and is suboptimal. Although the linear correlation criterion has shown some success in reducing redundancy, it nevertheless assumes a linear relationship between features. Such linear criterion would not be able to capture non-linear relationships between features. In contrast, the concept of mutual information measures the general statistical dependence between variables, and makes no assumption about the nature of the relationship between variables. Hence, just like mutual information generalises the linear dependency between a feature and the class label, one could also in principle use the concept of conditional mutual information to find a subset of features that provides the most information gain with respect to the class label. Moreover, such a subset of features would naturally satisfy the least redundancy requirement. One statistical technique appropriate for such task is the concept of joint mutual information (Yang and Moody, 1999). Our future effort would be to develop such a rigorous feature selection framework and to verify its performance improvement over the more ad-hoc criteria.
Acknowledgements
This work is supported by an interdisciplinary grant (Project 9010003) and a strategic research grant (Project 7001706) from City University of Hong Kong.
References Borodovsky, M. and McIninch, J. (1993) ‘Genmark: parallel gene recognition for both DNA
strands’, Comput. Chem., Vol. 17, pp.123–133. Burge, C. and Karlin, S. (1997) ‘Prediction of complete gene structures in human genomic DNA’,
J. Mol. Biol., Vol. 268, pp.78–94. Burset, M. and Guigo, R. (1996) ‘Evaluation of gene structure prediction programs’, Genomic,
Vol. 34, pp.353–367. Fickett, J.W. (1982) ‘Recognition of protein coding regions in DNA sequences’, Nucleic Acids
Res., Vol. 10, pp.5303–5318. Fickett, J.W. and Tung, C.S. (1992) ‘Assessment of protein coding measures’, Nucleic Acids Res.,
Vol. 20, pp.6641–6450. Fickett, J.W. (1996) ‘Finding genes by computer: the state of the art’, Trends Genet., Vol. 12,
pp.316–320. Gao, F. and Zhang, C.T. (2004) ‘Comparison of various algorithms for recognizing short coding
sequences of human genes’, Bioinformatics, Vol. 20, pp.673–681.

200 A.W-C. Liew, Y. Wu, H. Yan and M. Yang
Grosse, I., Buldyrev, S.V., Stanley, H.E., Holste, D. and Herzel, H. (2000) ‘Average mutual information of coding and noncoding DNA’, Pacific Symposium on Biocomputing, Vol. 5, pp.611–620.
Guigo, R. (1999) ‘DNA composition, codon usage and exon prediction’, in Bishop, M. (Ed.): Genetic Databases, Academic Press, pp.53–80.
Hawkins, J.D. (1988) ‘A survey on intron and exon lengths’, Nucleic Acids Res., Vol. 16, pp.9893–9908.
Haykin, S. (1988) Digital Communications, John Wiley & Sons, Inc. Herzel, H. and Grosse, I. (1995) ‘Measuring correlations in symbol sequences’, Physica A,
Vol. 216, pp.518–542. Konopka, A.K. (1994) ‘Structure and methods: VI’, Human Genome Initiative and DNA
Recombination, Chapter Towards Mapping Functional Domains in Indiscriminantly Sequenced Nucleic Acids: A Computational Approach, Adenine Press, Guilderland, New York.
Liew, A.W.C., Wu, Y. and Yan, H. (2004) ‘Selection of statistical features based on mutual information for classification of human coding and non-coding DNA sequences’, Proceedings of the 17th International Conference on Pattern Recognition, August 23–26, Cambridge, United Kingdom.
Lukashin, A.V. and Borodovsky, M. (1998) ‘GeneMark.hmm: new solutions for gene finding’, Nucleic Acids Res., Vol. 26, pp.1107–1115.
Majoros, W.H., Pertea, M. and Salzberg, S.L. (2004) ‘TigrScan and GlimmerHMM: two open-source ab initio eukaryotic gene-finders’, Bioinformatics, doi:10.1093/bioinformatics/ bth315.
Saito, R. and Tomita, M. (1999) ‘On negative selection against ATG triplets near start codons in eukaryotic and prokaryotic genomes’, J. Mol. Evol., Vol. 48, pp.213–217.
Salzberg, S.L., Delcher, A.L., Kasif, S. and White, O. (1998) ‘Microbial gene identification using interpolated Markov models’, Nucleic Acids Res., Vol. 26, pp.544–548.
Salzberg, S.L., Pertea, M., Delcher, A.L., Gardner, M.J. and Tettelin, H. (1999) ‘Interpolated Markov models for eukaryotic gene finding’, Genomics, Vol. 59, pp.24–31.
Shannon, C.E. (1948) ‘A mathematical theory of communication’, The Bell System Technical Journal, Vol. 27, pp.379–423.
Shepherd, J.C. (1981) ‘Method to determine the reading frame of a protein from the purine/pyrimidine genome sequence and its possible evolutionary justication’, Proceedings National Academy Sciences, USA, Vol. 78, pp.1596–1600.
Staden, R. and McLachlan, A.D. (1982) ‘Codon preference and its use in identifying protein coding regions in long DNA sequences’, Nucleic Acids Research, Vol. 10, pp.141–156.
Stuart, A. and Ord, J.K. (1994) Kendall’s Advanced Theory of Statistics, Edward Arnold, Paris, Chapter 3, Vol. 1.
Tiwari, S., Ramachandran, S., Bhattacharya, A., Bhattacharya, S. and Ramaswamy, R. (1997) ‘Prediction of probable genes by Fourier analysis of genomic sequences’, Computer Applications in Biosciences, Vol. 13, pp.263–270.
Venables, W.N. and Ripley, B.D. (1994) Modern Applied Statistics with S-Plus, Springer, New York.
Wang, Y., Zhang, C.T. and Dong, P. (2002) ‘Recognizing shorter coding regions of human genes based on the statistics of stop codons’, Biopolymers, Vol. 63, pp.207–216.
Wu, Y., Liew, A.W.C., Yan, H. and Yang, M. (2003) ‘Classification of short human exons and introns based on statistical features’, Physical Review E, Art. No. 061916, Vol. 67, No. 6, pp.1–7.
Effective statistical features for coding and non-coding DNA sequence 201
Yang, H.H. and Moody, J. (1999) ‘Feature selection based on joint mutual information’, Advances in Intelligent Data Analysis (AIDA), Computational Intelligence Methods and Applications (CIMA), International Computer Science Conventions, June 22–25, Rochester, New York.
Zhang, R. and Zhang, C.T. (1994) ‘Z curves, an intuitive tool for visualizing and analyzing DNA sequences’, Journal Biomolecular Structure Dynamics, Vol. 11, pp.767–782.
Zhang, C.T. (1997a) ‘A symmetrical theory of DNA sequences and its application’, J. Theoretical Biol., Vol. 187, pp.297–306.
Zhang, C.T. and Wang, J. (2000) ‘Recognition of protein coding genes in the yeast genome at better than 95% accuracy based on the Z curve’, Nucleic Acids Res., Vol. 28, pp.2804–2814.
Zhang, M.Q. (1997b) ‘Identification of protein coding regions in the human genome by quadratic discriminant analysis’, Proc. Natl. Acad. Sci., USA, Vol. 94, pp.565–568.