Effective Public Management - Brookings Institution Institution, and the National Bureau of Economic...
49
Effective Public Management F or generations, most Americans have believed that the United States will pro- vide almost everyone real opportunities to earn an income that rises steadily and substantially over time. Such broad-based upward mobility is one of the reasons that Americans have been generally optimistic and willing to extend opportunity to succes- sive minority groups. The current conventional wisdom argues that wages have stagnated and most Americans have made, at best, modest income progress since the 1970s. These views are based on studies that rely on aggregate median household income data. But the true picture is more complex. Using new Census Bureau statistics, this paper will examine household incomes by age cohort and follow these cohorts as they age. 1 Using this meth- od, the study will show that income progress was broad and robust through the Reagan and Clinton years, and stopped abruptly in the Bush and Obama years. Understanding the income paths of Americans as they have aged over the last 35 years is important to under- standing the policies of recent presidents and the politics that have resulted. To gain an accurate understanding of the income progress of average households over this period, we track the median incomes of households from four age cohorts — those headed by people who were 25-to-29 years old in 1975, 1981, 1991, and 2001. It shows that through the 1980s and 1990s, households of virtually every type experienced large, steady income gains, whether they were headed by men or women, by blacks, whites or Hispanics, or by people with high school diplomas or college degrees. These data also show that this broad income progress stopped around the turn of this century: From 2002 to 2013, the incomes of most households stagnated or declined even as they aged through nine years of expansion and two years of recession. The only types of households with rising incomes were those headed by people in their mid-to-late 20s in 2002 and 1 U.S. Census Bureau, Current Population Survey, Annual Social and Economic Supplement, 2014. Robert J. Shapiro is the chairman and chief executive of Sonecon, LLC. Dr. Shapiro also served as the principal economic advisor to President Bill Clinton in his 1991-1992 campaign, and as economic advisor in the presidential campaigns of Barack Obama, John Kerry, Al Gore and Michael Dukakis. He has been a Fellow of Harvard University, the Brookings Institution, and the National Bureau of Economic Research. INTRODUCTION Income growth and decline under recent U.S. presidents and the new challenge to restore broad economic prosperity By Robert J. Shapiro March 2015
Transcript of Effective Public Management - Brookings Institution Institution, and the National Bureau of Economic...

Effective Public Management
F or generations, most Americans have believed that the United States will pro-vide almost everyone real opportunities to earn an income that rises steadily and substantially over time. Such broad-based upward mobility is one of the reasons
that Americans have been generally optimistic and willing to extend opportunity to succes-sive minority groups. The current conventional wisdom argues that wages have stagnated and most Americans have made, at best, modest income progress since the 1970s. These views are based on studies that rely on aggregate median household income data. But the true picture is more complex. Using new Census Bureau statistics, this paper will examine household incomes by age cohort and follow these cohorts as they age.1 Using this meth-od, the study will show that income progress was broad and robust through the Reagan and Clinton years, and stopped abruptly in the Bush and Obama years. Understanding the income paths of Americans as they have aged over the last 35 years is important to under-standing the policies of recent presidents and the politics that have resulted.
To gain an accurate understanding of the income progress of average households over this period, we track the median incomes of households from four age cohorts — those headed by people who were 25-to-29 years old in 1975, 1981, 1991, and 2001. It shows that through the 1980s and 1990s, households of virtually every type experienced large, steady income gains, whether they were headed by men or women, by blacks, whites or Hispanics, or by people with high school diplomas or college degrees. These data also show that this broad income progress stopped around the turn of this century: From 2002 to 2013, the incomes of most households stagnated or declined even as they aged through nine years of expansion and two years of recession. The only types of households with rising incomes were those headed by people in their mid-to-late 20s in 2002 and
1 U.S. Census Bureau, Current Population Survey, Annual Social and Economic Supplement, 2014.
Robert J. Shapiro is the chairman and chief
executive of Sonecon, LLC. Dr. Shapiro also served
as the principal economic advisor to President Bill
Clinton in his 1991-1992 campaign, and as economic
advisor in the presidential campaigns of Barack
Obama, John Kerry, Al Gore and Michael Dukakis.
He has been a Fellow of Harvard University, the
Brookings Institution, and the National Bureau of
Economic Research.
IntroductIon
Income growth and decline under recent U.S. presidents and the new challenge to restore broad economic prosperity
By Robert J. Shapiro
March 2015

Income growth and decline under recent U.S. presidents 2Effective Public Management
those headed by college graduates — and their gains were much smaller than those achieved by young or college-educated households in the 1980s and 1990s. Figure 1 charts the income paths of the four age cohorts as they aged over this period, as well as a time series of the aggregate median household income statistic.
This evidence contradicts the narrative told by those who track the value of aggregate median income from the 1970s to the present and claim that most Americans have made little progress for decades. That time series cannot convey the income path of an average household because the set of households used in that series changes so drastically over any extended period. By contrast, the data used here report the median incomes of cohorts of households based on the age of the heads of those households each year, as those household-heads age. The data set for such “age-cohort” series does not change much over time.
Let’s consider how the time series of aggregate median income distorts the path and history of household incomes in America, focusing on the beginnings and ends of recent business cycles. (All data are expressed in constant 2013 dollars.) Aggregate median household income was $49,063 in 1979, $49,515 in 1992, $56,814 in 2000, $56,177 at the end of the 2002-2007 expansion, and $51,816 in 2013. According to these data, the average household earned just $2,753 more in 2013 than in 1979, a 5.6 percent gain over 34 years. But the age-cohort data show, for example, that the median income of households headed by people who were ages 25-to-29 in 1982 increased from $45,440 to $60,580 in the 1982-1989 expansion, and from $61,817 to $76,874 in the 1992-2000 expansion — gains of 69 percent over 18 years — and then fell by $3,389 in the 2002-2007 expansion and by $9,396 more in the first four years of this expansion. Table I, below, compares the median household income for four age cohorts over time with the conventional aggregate measure.

Income growth and decline under recent U.S. presidents 3Effective Public Management
table 1: aggregate MedIan HouseHold IncoMe, coMpared to tHe MedIan IncoMe of HouseHolds Headed by people WHo Were ages 25-29
In 1975, 1982, 1991 and 2001, tHrougH expansIons and recessIons froM 1975 to 2013 ($ 2013)
Year
Aggregate Median
Household Income
Households headed by people
ages 25-29 in 1975
Households headed by people
ages 25-29 in 1982
Households headed by people
ages 25-29 in 1991
Households headed by people ages 25-29 in 2001
1975 $46,058 $48,499 -- -- --
1976 $46,918 $50,458 -- -- --
1979 $49,063 $57,263 -- -- --
1980 $47,545 $54,769 -- -- --
1982 $46,367 $55,640 $45,440 -- --
1983 $45,993 $56,249 $46,142 -- --
1989 $52,306 $71,463 $60,580 -- --
1990 $51,556 $69,553 $60,484 -- --
1991 $50,032 $71,045 $60,038 $47,397 --
1992 $49,515 $71,574 $61,817 $48,800 --
2000 $56,814 $78,458 $76,874 $68,718 --
2001 $55,426 $75,655 $76,505 $67,369 $53,389
2002 $54,886 $73,124 $77,543 $67,343 $55,688
2007 $56,177 $66,786 $74,154 $70,918 $63,218
2008 $54,100 $61,457 $69,248 $69,279 $63,838
2009 $53,836 $57,554 $69,497 $68,846 $62,113
2010 $52,454 $54,352 $66,408 $67,036 $61,962
2011 $51,780 $51,704 $64,076 $65,242 $61,543
2012 $51,041 $50,834 $62,778 $67,523 $62,907
2013 $51,816 $50,017 $60,100 $67,350 $65,000
This age-cohort analysis also highlights a distinct life cycle in the income progress that most Americans experience as they age. Throughout this period and across all of our tested demographic groups, households headed by people in their mid-20s to mid-30s experience the largest percentage gains in median income, after which those increases generally slow and finally stop when they reach their 50s. The meager income growth seen in the later years of most people’s working lives may contribute to the persistent, strong public opposition to cuts in social security and Medicare benefits throughout this period.

Income growth and decline under recent U.S. presidents 4Effective Public Management
Most important, the data tell us that the incomes problems that most households face today are not a long-standing feature of the American economy, but rather reflect the particular conditions and policies of the last decade or so. A program to restore broad income progress, which we will sketch, must address those current conditions, including certain aspects of globalization and the spread of information and Internet technologies, while also drawing on those policy approaches which worked well in the 1980s and 1990s.
America’s income dynamic and politics An understanding of the actual income paths of American households over recent decades can provide new insights into our politics. To begin, the incomes story varies widely when the data are broken down by presidential administrations. In addition to analyzing incomes through the business cycles of the last 35 years, we also track income progress under the last five presidents. To do so, we analyze the median incomes of households headed by people who were ages 25-to-29, 35-to-39, and 45-to-49 in the beginning of presidency, as they aged through those terms. The results show that the greatest gains occurred under Clinton, followed by Reagan, while income progress under Bush-2 and in Obama’s first term was much weaker.2 Furthermore, the strong income gains of the Clinton and Reagan administrations extended to all households, whether headed by women or men, by blacks, Hispanics or whites, and by high school graduates or those with college degrees. Similarly, the weak income growth under Bush-2 and Obama (as well as Bush-1) extended to nearly all demographic groups. Figure 2, below, presents the average annual income gains of the three age groups under each of the last five presidents.
2 Throughout this paper, “Bush-1” will be used to refer to President George Herbert Walker Bush and “Bush-2” will be used to refer to President George Walker Bush.
...[T]he greatest gains
occurred under Clinton,
followed by Reagan, while
income progress under Bush-
2 and in Obama’s first term
was much weaker.

Income growth and decline under recent U.S. presidents 5Effective Public Management
The broad and strong income progress achieved under the Clinton and Reagan presidencies may well suggest that the major differences in their economic policies, as in tax policy, did not greatly affect the income paths of most Americans. These data also may help us understand some of the striking political developments of recent decades. For example, the gender-based results could well provide an economic basis for the gender gap: Households headed by women made greater progress under Democrats than Republicans (Clinton compared to Reagan, and Obama compared to Bush-2), while households headed by men made more progress under Reagan than Clinton and suffered smaller losses under Bush-2 than under Obama. Further, the abrupt end of broad income progress since 2002 may illuminate the deep political disaffection that so many Americans have felt in recent years, especially among non-college graduates. As we will see, the median income of households headed by people without high school diplomas fell an average of 1.9 percent per year, year after year, as they aged from 2002 to 2013; and the median income of households headed by high school graduates fell by nearly one percent per year, year after year, over those 11 years. These data show, therefore, that the incomes of nearly two-thirds of American households have fallen for more than a decade. Even among households headed by college graduates, their median incomes since 2002 increased at less than half the rate of comparable households in the 1980s and 1990s. If the American economy and government can no longer ensure that most people who work hard will get ahead, we should expect to see broad popular anger and distrust of government and business.

Income growth and decline under recent U.S. presidents 6Effective Public Management
II. tHe IncoMe patHs of aMerIcan HouseHolds froM 1975 to 2013
The age-cohort data show conclusively that most American households achieved strong and steady income gains as they aged through the expansions of the 1990s and 1980s. (Table 2, below)3 These data further show that this progress ended abruptly in the 2002-2007 expansion, followed by large income losses in the 2008-2009 recession, and income losses or stagnation for most age-cohorts in the first four years of the current expansion.
table 2: tHe annual groWtH of tHe MedIan IncoMes of HouseHolds Headed by people ages 25-to-29 In 1975, 1982, 1991 and 2001, as tHey aged
tHrougH expansIons and recessIons froM 1976 to 2013
YearHouseholds headed
by people ages 25-29 in 1975
Households headed by people ages 25-29
in 1982
Households headed by people ages 25-29
in 1991
Households headed by people ages 25-29 in
2001
1976-1979 4.2% -- -- --
1980-1982 -1.0% -- -- --
1983-1989 3.6% 4.2% -- --
1990-1991 -0.3% -0.4% -- --
1992-2000 1.1% 2.8% 4.2% --
2001 -3.6% -0.5% -2.0% --
2002-2007 -2.1% -0.5% 0.9% 2.9%
2008-2009 -- -3.2% -1.5% -0.9%
2010-2013 -- -3.6% -0.5% 1.1%
We begin by examining the path of median household income for each of the four age-cohorts. As noted earlier, the largest percentage gains in income normally occur when people are relatively young, and rates of income growth slow substantially as they age. For example, the median incomes of households headed by people who were 25-to-29 years old in 1975 increased 4.2 percent per yearper year in the 1976-1979 expansion, 3.6 percent per yearper year in the 1983-1989 expansion, and just 1.1 percent per yearper year in the 1992-2000 expansion — and then fell 2.1 percent per yearper year in the 2002-2007 expansion. (Table 2, above) The data also document, however, the sharp slowdown in income growth for even younger age-cohorts. Focusing in each case on the two younger cohorts, we see that median household income grew by an average of 3.9 percent per year in the 1983-1989 expansion and 3.5 percent per year in the 1992-2000 expansion — as compared to just 1.9 percent per year in the 2002-2007 expansion and 0.3 per year in the first four years of the current expansion (2010-2013). Older age cohorts fared even worse. Averaging across households
3 All rates of income growth or loss are geometric averages. The results are similar using arithmetic averaging.

Income growth and decline under recent U.S. presidents 7Effective Public Management
headed by people who were ages 25-to-29 in 1982 and in 1991, we find that their median income grew just 0.2 percent per year in the 2002-2007 expansion, fell nearly 2.4 percent per year in the 2008-2009 recession, and continued to fall at a rate of nearly 2.1 percent per year in the first four years of the current expansion.
The income records of the five presidents from 1981 to 2013
The analysis above focuses on business cycles by comparing income gains through successive economic expansions. But since economic policies often change with changes in the White House, we also compare the income gains and losses of successive administrations. In tracking the income record of each president, we make one adjustment: Since economic conditions in the first year of any new administration are set by the policies and conditions of the preceding president, we adjust each president’s term accordingly. For example, the record of the Reagan administration here covers 1982 through 1989, and the record of the Clinton administration covers 1994 through 2001. We continue to examine the records
of several age groups but from a new perspective: For each administration, we track the income progress of households headed by people in their mid-to-late 20s, mid-to-late 30s, and mid-to-late 40s at the beginning of the administration, as they aged over the next four or eight years. In particular, we examined the following:
• Households headed by people 25-to-29 years old when each president took office, tracking their incomes from year two of each president’s term as they aged over the next four years (Bush-1 and Obama) to ages 29-to-34, or as they aged over the next eight years (Clinton, Reagan, and Bush-2) to ages 34-to-37;
• Households headed by people 35-to-39 years old when each president took office, tracking their incomes from year two of a president’s term as they aged over the next four years to ages 39-to-44 or over the next eight years to ages 44-to-47; and
• Households headed by people 45-to-49 years old when each president took office, tracking their incomes from year two of a president’s term as they aged over the next four years to ages 49-to-54 or over the next eight years to ages 53-to-57.
These data show clearly that the largest average annual gains in median household income occurred during the Clinton and Reagan administrations, with a clear edge to Clinton. (Table 3, below) For example, the median income of households headed by people in their mid-to-late 20s
...[T]he largest average annual
gains in median household
income occurred during
the Clinton and Reagan
administrations, with a
clear edge to Clinton.

Income growth and decline under recent U.S. presidents 8Effective Public Management
grew on average by 5.3 percent per year under Clinton, compared to 4.0 percent per year under Reagan. By contrast, the median income of the same age group grew by 1.4 percent per year under Bush-1, 1.9 percent per year under Bush-2, and 3.3 percent per year in Obama’s first term (2010-2013). Because Clinton and Reagan both served two full terms, their large annual gains compounded and accumulated: The median household income of this age group rose 51.0 percent as they aged under Clinton, compared to 37.1 percent for the comparable group under Reagan — and just 16.3 percent over the two terms of Bush-2.
table 3: total and annual groWtH of MedIan IncoMe of HouseHolds Headed by people ages 25-29, 35-39 and 45-49 WHen eacH presIdent took
offIce (adjusted), as tHey aged
PresidentHouseholds Headed by People Ages 25-29, from Year Two of
each President’s Term
Households Headed by People Ages 35-39, from Year Two of
each President’s Term
Households Headed by People Ages 45-49, from Year Two of
each President’s Term
Reagan 37.1% (4%) 25% (2.8%) 2.8% (0.3%)
Bush-1 5.9% (1.4%) 2.8% (0.7%) -5.4% (-1.4%)
Clinton 51.0% (5.3%) 22.3% (2.5%) -1.2% (-0.1%)
Bush-2 16.3% (1.9%) 2.2% (0.3%) -9.1% (-1.2%)
Obama 13.8% (3.3%) 2.5% (0.6%) -7.5% (-1.9%)
These data also illustrate, once again, the life-cycle of income gains. In the Clinton and Reagan administrations, the average annual income gains of households headed by people in their mid-to-late 30s from the second year of each president’s first term were one-third to one-half smaller than the average annual gains of the younger age-group. (Table 3 above) Further, as this older group aged through Reagan’s presidency, their median household incomes grew an average of 2.8 percent per year, followed by average annual gains of 2.5 percent for households of the same ages under Clinton. The contrast with Bush-2 and Obama is stark: The median income of households headed by people in their mid-to-late 30s grew by 0.3 percent per year under Bush-2 and 0.6 percent per year over Obama’s first four years (2010-2013).
Across the five presidencies, we also see that income progress virtually ends when people reach their mid-to-late 40s. The median income of households headed by people in this age group managed to rise by 0.3 percent per year under Reagan and declined 0.1 percent per year over the Clinton presidency. Once again, the income record under Bush-2 and Obama was much worse. The median income of households headed by people in this age group from year two of the Bush-2 presidency fell by an average of 1.2 percent per year in his presidency and by 1.9 percent per year in Obama’s first term.

Income growth and decline under recent U.S. presidents 9Effective Public Management
III. HoW gender affects tHe patH of HouseHold IncoMes
Next, we compared the income progress of male and female-headed households. As expected, female-headed households across age-cohorts consistently earn less than those headed by men of the same ages. However, male and female-headed households of the same ages made comparable percentage gains in the 1983-1989 expansion, and female-headed households made much greater income progress in the 1992-2000 expansion than their male counterparts. Further, while income gains by both male and female-headed households slowed sharply in the 2002-2007 expansion, most female-headed households fared worse than their male counterparts. Finally, male-headed households lost more ground than female-headed households of the same ages in the 2008-2009 recession but fared better than female-headed households in the first four years of the current expansion (2010-2013).
As shown in Tables 4-A and 4-B below, the median income of households headed by men 25-to-29 years old in 1975 grew 3.9 percent per year from 1983 to 1989, and 1.1 percent per year from 1992 to 2000. Households headed by women of the same ages achieved modestly greater gains in the 1980s and much larger gains in the 1990s: Their median incomes increased 4.1 percent per year from 1983 to 1989, and 3.6 percent per year from 1992 to 2000. Similarly, the median income of households headed by men who were 25-to-29 years old in 1982 increased 4.1 percent per year from 1983 to 1989, and 2.5 percent per year from 1992 to 2000, when they were 43-to-47 years old. The median income of households headed by women of the same ages increased at about the same rate as their male counterparts in the 1980s, with gains of 4.0 percent per year. But in the 1990s, this age-cohort of female-headed households made much larger gains than men, averaging 5.3 percent compared to 2.5 percent. Graphs of the income progress of these age-cohorts, by gender, are provided in Appendix 2, Figures A2-1 and A2-2.

Income growth and decline under recent U.S. presidents 10Effective Public Management
table 4-a: total and annual groWtH of MedIan HouseHold IncoMe In tHe expansIons and contractIons of 1980 to 2013, Male-Headed
HouseHolds ages 25-to-29 In 1975, 1982, 1991 & 2001
YearHouseholds headed
by people ages 25-29 in 1975
Households headed by people ages 25-29 in
1982
Households headed by people ages 25-29 in
1991
Households headed by people ages 25-29 in
2001
1980-1982 -1.5% (-0.5%) -- -- --
1983-1989 30.5% (3.9%) 32.3% (4.1%) -- --
1990-1991 -1.1% (-0.6%) -1.3% (-0.7%) -- --
1992-2000 10.8% (1.1%) 25.2% (2.5%) 39.4% (3.8%) --
2001 -3.50% 0.70% 0.70% --
2002-2007 -8.3% (-1.4%) 2.7% (0.4%) 4.9% (0.8%) 14.7% (2.3%)
2008-2009 -- -11.6% (-6%) -7.5% (-3.8%) 2.5% (1.2%)
2010-2013 -- -10.4% (-2.7%) 3.4% (0.8%) -4.8% (-1.2%)
table 4-b. total and annual gaIns In MedIan HouseHold IncoMe In tHe expansIons and contractIons of 1980 to 2013, feMale-Headed
HouseHolds ages 25-to-29 In 1975, 1982, 1991 & 2001
YearHouseholds headed by people ages 25-29 in
1975
Households headed by people ages 25-29
in 1982
Households headed by people ages 25-29
in 1991
Households headed by people ages 25-29 in
2001
1980-1982 4.1% (1.4%) -- -- --
1983-1989 32.4% (4.1%) 31.2% (4%) -- --
1990-1991 2.5% (1.2%) 5.4% (2.7%) -- --
1992-2000 37.3% (3.6%) 59% (5.3%) 78.9% (6.7%) --
2001 -1.1% 0.7% -0.5% --
2002-2007 -14.4% (-2.6%) -7.1% (-1.2%) 8% (1.3%) 18.1% (2.8%)
2008-2009 -- 0.3% (0.2%) 0.7% (0.3%) -3.4% (-1.7%)
2010-2013 -- -14.9% (-3.9%) -7.8% (-2.0%) 12.6% (3%)
As expected, income progress by both genders slowed sharply or reversed in the 2002-2007 expansion, with female-headed households bearing larger losses. (Table 4-B, above) Households headed by older women (those ages 25-to-29 in 1975 and 1982) fell by 2.6 percent per year and 1.2 percent per year, respectively, from 2002 to 2007, while those headed by men of the same

Income growth and decline under recent U.S. presidents 11Effective Public Management
ages declined 1.4 percent per year and rose 0.4 percent per year, respectively. (Table 4-A) The two younger cohorts for both genders made modest income progress from 2002 to 2007. In the 2008-2009 recession, households headed by men had larger income losses than those headed by women; while both male and female headed households in the two older age-cohorts continued to lose major ground in the first four years of the current expansion.
These dynamics dramatically slowed progress in closing the income gap between male and female-headed households of the same ages. (Appendix 2, A2-2) Across the age-cohorts, the incomes gender gap narrowed modestly in the 1980s, averaging 43.1 percent in 1983 and 42.8 percent in 1989. In the 1990s, however, the gap then fell sharply, averaging less than 23 percent in 2000. Seven years later, at the end of the 2002-2007 expansion, gender-based differences in median household income across the age cohorts still averaged about 24 percent and edged down to about 21 percent in 2013. See Appendix-2, Table A2-2, for yearly values.
Income progress by gender under five presidents
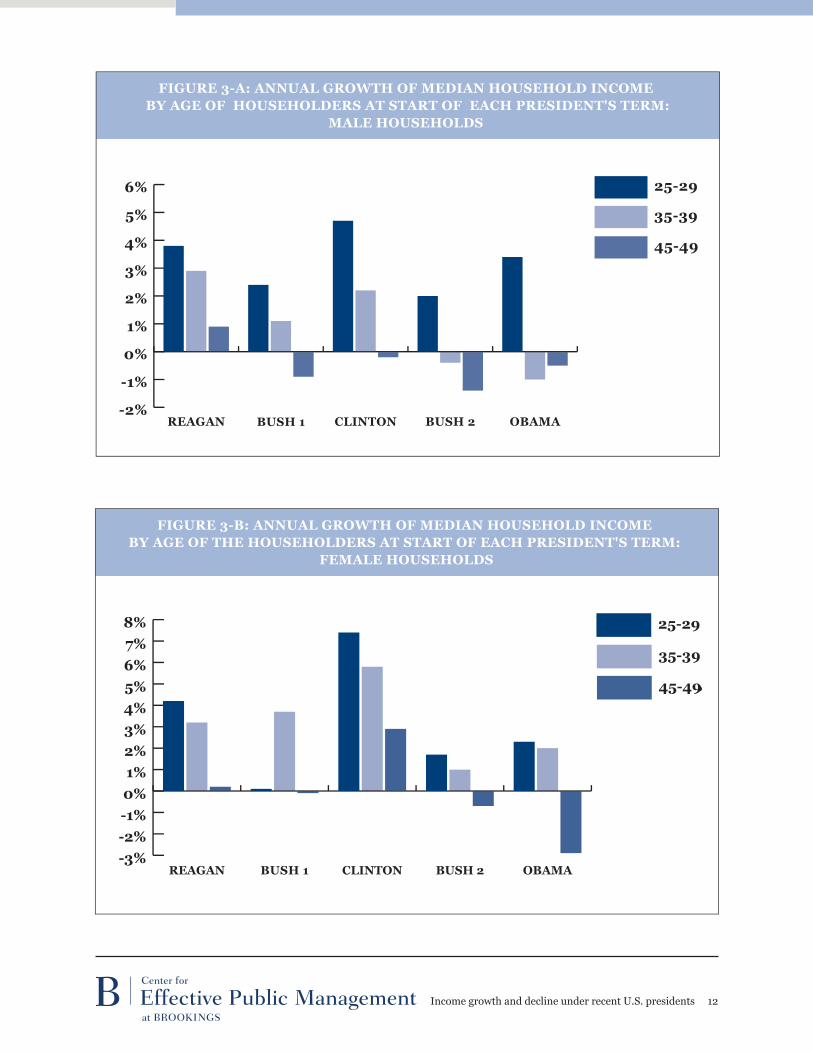
Next, we compare the income progress of male and female-headed households in three age groups during the five presidencies since 1981. As we will see, the persistent gender gap in presidential elections may well rest, in part, on these income dynamics: Female-headed households have generally made greater progress under Democratic presidents than Republican presidents, while male-headed households generally have fared better under Republican presidents.
We turn first to Reagan and Clinton, female-headed households made larger percentage income gains than male-headed households under both presidents, with the exception of the oldest age group under Reagan. The income progress of female-headed households was greater under Clinton than under Reagan in all three age groups, while male-headed households made faster progress under Reagan than under Clinton in the two older age groups. Averaging across the three age groups, the median incomes of male-headed households grew 22.6 percent as they aged through Reagan’s presidency, compared to 20.5 percent under Clinton; while the median incomes of female-headed households increased an average of 53.4 percent as they aged through Clinton’s presidency, compared to 26.4 percent under Reagan. As expected, the Bush-2 presidency and Obama’s first term did not produce large income gains for either female or male-headed households. Averaging across the three age groups, the median income of male-headed households virtually stagnated through the Bush-2 presidency, growing an average of 0.15 percent per year, while Obama’s record is marginally better at 0.64 percent gains per year in his first term. However, across the age groups, the median incomes of female-headed households grew 0.66 percent per year as they aged through Bush-2’s terms compared to 0.48 percent per year under Obama.
The average annual income gains for each age group, by gender, under each president are presented in Figures 3-A and 3-B below. The underlying data are provided in Appendix 2, Tables A2-3 and A2-4.
Income growth and decline under recent U.S. presidents 12Effective Public Management

Income growth and decline under recent U.S. presidents 13Effective Public Management
Iv. HoW race and etHnIcIty affects tHe patH of HouseHold IncoMes
Our age-cohort analysis also tracks major differences in the paths of household income based on the race and ethnicity — white, black and Hispanic — of the household heads. As expected, households headed by Hispanics and by blacks consistently earn less than those headed by whites of the same ages. Nevertheless, the median household incomes of all three groups, across age cohorts, went up sharply in the expansions of the 1980s and 1990s. Moreover, households headed by blacks in most age cohorts made greater income progress in the 1980s and 1990s expansions than households of the same ages headed by whites or Hispanics.
Also as expected, these income dynamics shifted sharply in the 2002-2007 expansion. First, median income in the two older age-cohorts fell steadily across white, black and Hispanic-headed households. In the two younger age-cohorts, household income grew slowly from 2002 to 2007, with the gains by white households outpacing those by black households, who in turn outpaced the gains of Hispanic households. As a result, race and ethnicity-based income differences widened in the 2002-2007 expansion. Moreover, these differences continued to grow in the 2008-2009 recession and the first four years of the current expansion (2010-2013), as the median income of households headed by blacks and Hispanics in all three age-cohorts declined further. Table 8, below, presents the annual rates of income gains and losses for each group in the expansions and recessions from 1980 to 2013. Graphs tracking the income paths of the four age cohorts of households headed by whites, blacks and Hispanics are provided in Appendix 2.
table 5: annual groWtH of MedIan HouseHold IncoMes In expansIons and contractIons, 1980-2013, HouseHolds Headed by WHItes, blacks and HIspanIcs, ages 25-to-29 In 1975, 1982, 1991 and 2001, as tHey aged
YearAges 25-29 in 1975 Ages 25-29 in 1982 Ages 25-29 in 1991 Ages 25-29 in 2001
White Black Hisp White Black Hisp White Black Hisp White Black Hisp
1980-82 -0.2% -2.0% -3.1% -- -- -- -- -- -- -- -- --
1983-89 3.5% 5.5% 3.7% 4.4% 4.7% 2.2% -- -- -- -- -- --
1990-91 0.1% -0.7% -5.0% -0.3% -1.6% 2.2% -- -- -- -- -- --
1992-00 1.3% -0.1% 2.1% 3.0% 3.6% 2.9% 4.7% 5.0% 3.7% -- -- --
2001 -3.8% 1.3% -6.3% -0.7% -3.7% -1.2% 0.4% -1.4% -4.6% -- -- --
2002-07 -2.0% -2.9% -1.2% -0.1% -0.9% 0.0% 0.8% 1.4% 1.1% 3.3% 2.0% 1.3%
2008-09 -- -- -- -4.0% -2.9% -2.4% -2.2% -6.6% -2.2% -0.5% 0.9% -3.8%
2010-13 -- -- -- -3.2% -2.0% -3.6% -0.2% -1.1% -0.3% 1.4% 0.2% 0.4%
...[R]ace and ethnicity-based
income differences widened in
the 2002-2007 expansion.
Income growth and decline under recent U.S. presidents 14Effective Public Management
Turning to the details, this analysis shows that the median incomes of households headed by blacks grew faster in the expansion of the 1980s (averaging 5.1 percent per year) than households headed by whites (4.0 percent per year) or Hispanics (3.0 percent per year) of the same ages. Moreover, these patterns continued in the 1990s expansion for the two younger age-cohorts. However, black and Hispanic-headed households generally lost more ground than white households of the same ages in the recessions that followed those two expansions (1990-1991 and 2001). Moreover, since 2002, white-headed households generally have seen greater income gains or smaller income losses than black-headed households of the same ages. In addition, black and Hispanic households generally have continued to lose ground in the first four years of the current expansion, while white-headed households made modest progress.
As a result of these dynamics, the gaps between the median income of households headed by whites and those headed by blacks or Hispanics of the same ages have been fairly stable or widened modestly over the entire period. Across age cohorts, the gap in median incomes between households headed by whites and blacks averaged 41.1 percent in 1983, 40.1 percent in 2000 and 43.2 percent in 2013. Similarly, the between in median incomes between households headed by whites and by Hispanics across age cohorts averaged 33.6 percent in 1983, 35.6 percent in 2000 and 39.0 percent in 2013. The data are for each expansion and recession, by age-cohort and race and ethnicity, are provided in Appendix 2, Table A2-5.
Income progress by race and ethnicity under five presidents
Next, we assess income progress under each of the last five presidents, tracking the median incomes of households headed by white, blacks and Hispanics in their mid-to-late 20s, mid-to-late 30s, and mid-to-late 40s at the start of each presidency, as they aged through each administration. (Again, we calculate income gains under each presidency by starting in the president’s second year in office, through the first year of the next presidency.) The data show that under Clinton, minority-headed households made faster income gains than white-headed households of the same ages, while under Reagan and Bush-1, white-headed households generally made greater income progress than minority-headed households of the same ages. However, there is no clear race or ethnicity-based income pattern under Bush-2; and under Obama, white-headed households generally fared better than minority-headed households.

Income growth and decline under recent U.S. presidents 15Effective Public Management
table 6: annual groWtH In MedIan IncoMes of HouseHolds Headed byWHItes, afrIcan-aMerIcans and HIspanIcs, ages 25-29, 35-39, and 45-49
froM year tWo of eacH presIdent’s terM, as tHey aged
PresidentAges 25-to-29 Ages 35-to-39 Ages 45-to-49
White Black Hisp White Black Hisp White Black HispReagan 4.0% 3.8% 1.6% 2.9% 3.3% 2.2% 0.5% 1.2% 0.6%Bush-1 2.6% -2.5% 0.7% 1.5% -2.6% -1.1% -0.8% -0.8% -3.9%Clinton 5.2% 7.3% 4.2% 2.9% 4.2% 3.1% -0.2% 0.8% 2.8%Bush-2 2.3% 1.8% 0.0% 0.1% -0.7% 0.3% -1.1% -0.7% -0.7%Obama 4.0% 0.1% 2.0% 0.9% 0.9% 0.1% -1.4% -2.8% -2.8%
Turning first to Reagan, Bush-1 and Clinton, we find that black and Hispanic households made greater income progress under Clinton than under Reagan for two of the three age groups and
greater progress under Clinton than under Bush-1 in all three age groups. (Table 9, above) The differences are largest among younger households: Households headed by blacks ages 25-to-29 when each president took office saw their real income increase 7.3 percent per year under Clinton, compared to 3.8 percent per year under Reagan; and households headed by Hispanics of the same ages gained 4.2 percent per year under Clinton compared to 1.6 percent under Reagan. Moreover, the annual income gains of black-headed households under Clinton exceeded those of white-headed households in all three age groups, as did gains by Hispanic households in two of the three age groups. By contrast, annual gains by white-headed households exceeded those of black and Hispanic-headed households in two of the three age groups under Reagan and all three age groups in Bush-1’s administration.
As expected, the current income problem is clear in the data tracking income growth by race and ethnicity under Bush-2 and Obama, especially for minority-headed households. Among households headed by people ages 25-to-29 when each president took office — the age group with consistently the greatest income progress — annual income gains by black-headed households fell from 7.3 percent under Clinton to 1.8 percent under Bush-2 and 0.1 percent under Obama. Similarly, the annual gains
...[U]nder Clinton, minority-
headed households made
faster income gains than
white-headed households of
the same ages, while under
Reagan and
Bush-1, white-headed
households generally made
greater income progress than
minority-headed households
of the same ages. Under
Obama, white-headed
households generally
fared better than minority-
headed households.

Income growth and decline under recent U.S. presidents 16Effective Public Management
by Hispanic-headed households fell from 4.2 percent under Clinton to zero under Bush-2 and 2.0 percent under Obama. Among white-headed households, annual income growth fell from 5.2 percent under Clinton to 2.3 percent under Bush-2, but rebounded to 4.0 percent under Obama. This general slowdown in annual income progress across race and ethnicity is also clear among households headed by people 35-to-39 when each president took office; and among households headed by people ages 45-to-49 when each president took office, incomes declined under both Bush-2 and Obama across race and ethnicity. In fact, across the two older age groups under Bush-2, median household income fell by an average of 0.5 percent per year among white-headed households, 0.7 percent per year among black-headed households, and 0.2 percent per year among Hispanic-headed households. Similarly, across the two older age groups in Obama’s first term (2010-2013), median income losses averaged 0.2 percent per year among white-headed households, 0.9 percent per year among black-headed households, and 1.3 percent per year among Hispanics-headed households. Graphs tracking the growth or decline of median income for households headed by whites, blacks, and Hispanics for each age group and over the course of each presidency are provided in Appendix 2, Figures A2-6, A2-7 and A2-8.
v. HoW educatIonal acHIeveMent affects tHe patH of HouseHold IncoMe
Our age-cohort income analysis also shows, as expected, important differences in income levels and progress based on the education of household heads and how the income differences between households headed by college graduates, high school graduates, and people without high school diplomas have increased since the 1980s. However, the data also show that the expansions of the 1980s and 1990s brought substantial income gains to households at every level of education and, similarly, that the current problems with income progress affect households at every level of education.
Education was simply not a barrier to income progress in the 1980s and 1990s. For example, the median income of households headed by people 25-to-29 years old in 1982 and without a high school diploma grew by 2.4 percent per year from 1983 to 1989, when they were 32-to-36 years old, and by 2.6 percent per year from 1992 to 2000 when they were 43-to-47 years old. As a result their incomes, their annual median income grew over this period from $25,123 to $37,876. Households headed by high school graduates of the same ages made larger or comparable gains: Their median incomes increased 3.4 percent per year from 1983 to 1989 and 2.3 percent per year from 1992 to 2000, rising from $44,466 to $64,544.
...[T]he expansions of the 1980s
and 1990s brought substantial
income gains to households
at every level of education
and, similarly, that the current
problems with income progress
affect households at every level
of education.

Income growth and decline under recent U.S. presidents 17Effective Public Management
As expected, households headed by college graduates in the same age-cohort made the largest gains: Their median incomes grew 5.9 percent per year from 1983 to 1989, and 3.0 percent per year from 1992 to 2000, or, all told, from $60,251 to $112,832. (See Table 10, below, for rates of income growth. The data on median household income levels by age cohort and education are presented in Appendix 2, Table A2-6. )
However, while households headed by college graduates also weathered the recessions of this period, those headed by high school dropouts and graduates lost significant ground in those downturns. Across the two youngest age-cohorts, the median income of households headed by people without high school diplomas fell an average of 3.0 percent per year in the 1980-1982 downturn and 4.5 percent per year in the 1990-1991 recession, followed by modest losses of 0.4 percent in 2001. The median income of households headed by high school graduates of the same ages declined 3.6 percent per year in the 1980-1982 recession, 0.4 percent per year in the 1990-1991 downturn, and 0.4 percent again in 2001. These recessions enhanced the income advantages of college graduates: For the same age cohorts, the median income of households headed by college graduates rose, on average, 1.4 percent per year in the 1980-1982 recession, 0.3 percent per year in the 1990-1991 recession, and 0.8 percent in the 2001 recession.
table 7: annual gaIns or losses In MedIan HouseHold IncoMe In expansIons and contractIons, 1980-2013, by HouseHolds Headed by
college graduates (college) HIgH scHool graduates (Hs) and people WItH no HIgH scHool dIploMa (no-d), as tHey aged
YearAges 25-29 in 1975 Ages 25-29 in 1982 Ages 25-29 in 1991 Ages 25-29 in 2001
NO-D HS College NO-D HS College NO-D HS College NO-D HS College
1980-82 -3.0% -3.6% 1.4% -- -- -- -- -- -- -- -- --
1983-89 3.3% 3.0% 4.3% 2.4% 3.4% 5.9% -- -- -- -- -- --
1990-91 -7.6% 1.4% -0.3% -1.3% -2.1% 0.8% -- -- -- -- -- --
1992-00 -0.2% 0.7% 2.0% 2.6% 2.3% 3.0% 4.3% 2.8% 5.3% -- -- --
2001 7.0% -6.8% -0.6% -0.2% -0.1% -1.6% -0.5% -0.6% 3.1% -- -- --
2002-07 -6.0% -2.2% -2.0% -2.3% -1.3% 0.8% -1.5% 0.5% 1.1% -1.9% 2.3% 3.8%
2008-09 -- -- -- -2.4% -3.7% -3.3% -2.0% -2.5% -1.7% -1.7% -0.6% 2.6%
2010-13 -- -- -- -7.1% -2.9% -2.2% -0.2% -2.1% 0.1% 2.5% -0.2% 0.5%
The data also show that as income growth generally has slowed since 2001, the income penalty for those without a college degree has been devastating. Across the three younger age-cohorts, the median income of households headed by people without high school diplomas fell an average of 1.9 percent per year as they aged through the 2002-2007 expansion; and over the entire period from 2002 to 2013, their median incomes fell by an average of 1.8 percent per year as they aged.

Income growth and decline under recent U.S. presidents 18Effective Public Management
The median income of households headed by high school graduates in the three younger cohorts grew an average of 0.5 percent per year in the 2002-2007 expansion; but over the entire period from 2002 to 2013, their median incomes declined an average of 1.0 percent per year. For example, the median income of households headed by people age 36-to-40 and without a diploma fell from $35,018 in 2002 to $32,122 in 2013, when they were 46-to-49 years
old. Similarly, the median income of households headed by high school graduates of the same ages fell from $54,413 in 2002 to $50,000 in 2013. Only households headed by college graduates made progress, and even their gains have been modest. Averaging again across the three younger age-cohorts, the median income of households headed by college graduates grew 1.9 percent per year in the 2002-2007 expansion — decent gains, but much less than the 3.4 percent average annual gains by comparable households in the 1992-2000 expansion. And over the entire period from 2002 to 2013, the median household incomes of these college-educated households grew by an average of just 0.5 percent per year. (Graphs tracking the household income paths of the four age cohorts, based on their education, are provided in Appendix 2, Figures A2-9, A2-10 and A2-11.)
These dynamics have produced steadily widening gaps in median income, over time and across age cohorts, based on education. (Table 11, below) For households headed by people 25-to-29 years old in 1982, the difference in median household income between those headed by people without high school diplomas and those headed by college graduates widened from 58.3 percent in 1983 to 66.4 percent in 2000 and 71.7 percent in 2007, and the high school graduate-college graduate gap increased from 26.2 percent in 1983 to 42.8 percent in 2000 and 48.7 percent in 2007. Similarly, for households headed by people 25-to-29 years old in 1991, the no diploma-college graduate gap grew from 62.5 percent in 1992 to 70.5 percent in 2013, and the gap between high school graduates and college graduates in same age-cohort widened from 39.7 percent in 1992 to 54.1 percent in 2013. The dramatic widening of these differences over the last decade has intensified income inequalities inside the middle class.
The income penalty for those
without a college degree
has been devastating.

Income growth and decline under recent U.S. presidents 19Effective Public Management
table 8: gap betWeen tHe MedIan IncoMes of HouseHolds Headed by college graduates, coMpared to HouseHolds Headed by HIgH scHool
graduates (Hs) and HouseHolds Headed by people WItHout HIgH scHool dIploMas (no-d), by age coHort and year
YearAges 25-29 in 1975 Ages 25-29 in 1982 Ages 25-29 in 1991 Ages 25-29 in 2001
No-D HS NO-D HS NO-D HS NO_D HS
1980 52.6% 26.7% -- -- -- -- -- --
1983 59.4% 38.6% 58.3% 26.2% -- -- -- --
1989 59.2% 39.6% 63.9% 36.0% -- -- -- --
1992 69.5% 39.8% 64.7% 39.7% 62.5% 39.7% -- --
2000 71.1% 44.5% 66.4% 42.8% 63.7% 45.2% -- --
2002 69.8% 48.1% 67.3% 41.6% 66.3% 47.6% 59.7% 43.6%
2007 75.8% 48.5% 71.7% 48.7% 70.0% 49.0% 69.9% 48.2%
2010 -- -[- 75.1% 50.0% 71.0% 54.4% 71.5% 53.5%
2013 -- -- 76.6% 50.5% 70.5% 54.1% 70.0% 52.6%
Income progress by educational level under five presidents
The same patterns are evident when we examine income progress under the last five presidents by educational level for our three age-groups — households headed by people in their mid-to-late 20s, their mid-to-late 30s, and their mid-to-late 40s at the start of each presidency. We turn first to the Reagan and Clinton presidencies, the last administrations during which households headed by people without college degrees made healthy progress. In 1980, this covered 83 percent of U.S. households — 31.4 percent headed by people without a high school diploma and 51.6 percent headed by high school graduates (Table 8, below). By 1990, almost 72 percent of the country still lacked a college degree: 22.4 percent of Americans age 25 and over lacked a high school diploma, and another 49.5 percent had only a high school diploma.
...[T]o the Reagan and
Clinton presidencies, the last
administrations during which
households headed by people
without college degrees made
healthy progress.
Income growth and decline under recent U.S. presidents 20Effective Public Management
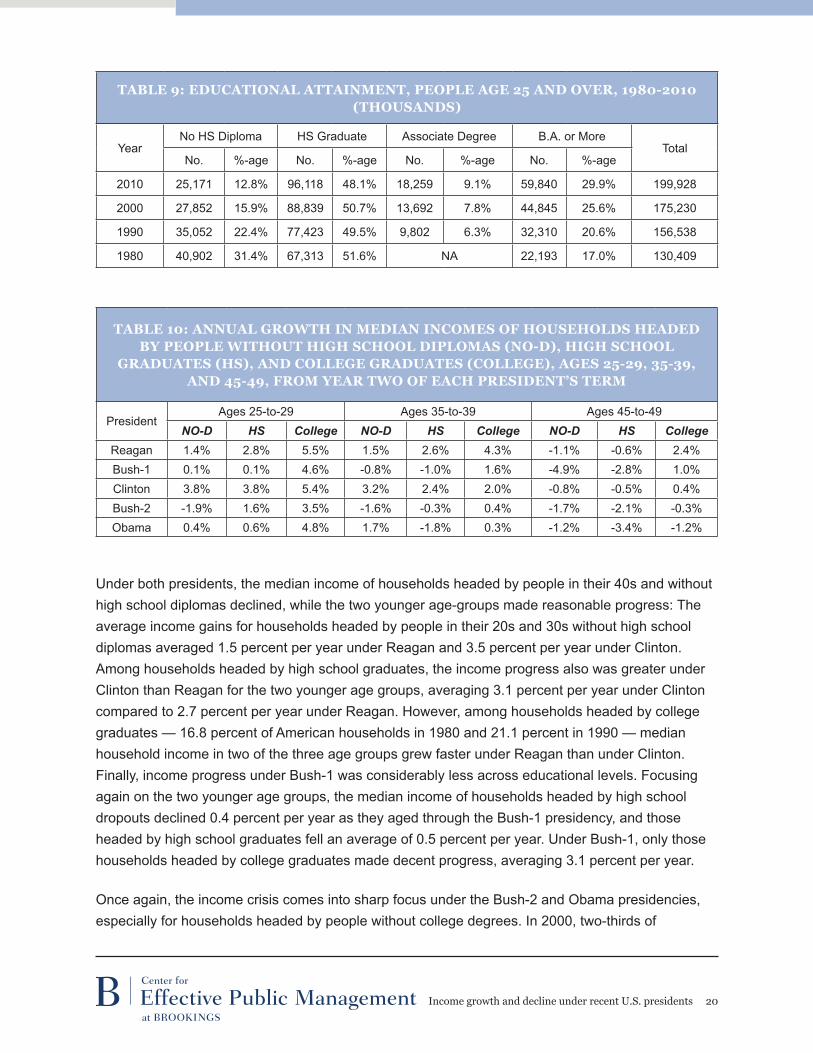
table 9: educatIonal attaInMent, people age 25 and over, 1980-2010 (tHousands)
YearNo HS Diploma HS Graduate Associate Degree B.A. or More
TotalNo. %-age No. %-age No. %-age No. %-age
2010 25,171 12.8% 96,118 48.1% 18,259 9.1% 59,840 29.9% 199,928
2000 27,852 15.9% 88,839 50.7% 13,692 7.8% 44,845 25.6% 175,230
1990 35,052 22.4% 77,423 49.5% 9,802 6.3% 32,310 20.6% 156,538
1980 40,902 31.4% 67,313 51.6% NA 22,193 17.0% 130,409
table 10: annual groWtH In MedIan IncoMes of HouseHolds Headed by people WItHout HIgH scHool dIploMas (no-d), HIgH scHool
graduates (Hs), and college graduates (college), ages 25-29, 35-39, and 45-49, froM year tWo of eacH presIdent’s terM
PresidentAges 25-to-29 Ages 35-to-39 Ages 45-to-49
NO-D HS College NO-D HS College NO-D HS CollegeReagan 1.4% 2.8% 5.5% 1.5% 2.6% 4.3% -1.1% -0.6% 2.4%Bush-1 0.1% 0.1% 4.6% -0.8% -1.0% 1.6% -4.9% -2.8% 1.0%Clinton 3.8% 3.8% 5.4% 3.2% 2.4% 2.0% -0.8% -0.5% 0.4%Bush-2 -1.9% 1.6% 3.5% -1.6% -0.3% 0.4% -1.7% -2.1% -0.3%Obama 0.4% 0.6% 4.8% 1.7% -1.8% 0.3% -1.2% -3.4% -1.2%
Under both presidents, the median income of households headed by people in their 40s and without high school diplomas declined, while the two younger age-groups made reasonable progress: The average income gains for households headed by people in their 20s and 30s without high school diplomas averaged 1.5 percent per year under Reagan and 3.5 percent per year under Clinton. Among households headed by high school graduates, the income progress also was greater under Clinton than Reagan for the two younger age groups, averaging 3.1 percent per year under Clinton compared to 2.7 percent per year under Reagan. However, among households headed by college graduates — 16.8 percent of American households in 1980 and 21.1 percent in 1990 — median household income in two of the three age groups grew faster under Reagan than under Clinton. Finally, income progress under Bush-1 was considerably less across educational levels. Focusing again on the two younger age groups, the median income of households headed by high school dropouts declined 0.4 percent per year as they aged through the Bush-1 presidency, and those headed by high school graduates fell an average of 0.5 percent per year. Under Bush-1, only those households headed by college graduates made decent progress, averaging 3.1 percent per year.
Once again, the income crisis comes into sharp focus under the Bush-2 and Obama presidencies, especially for households headed by people without college degrees. In 2000, two-thirds of

Income growth and decline under recent U.S. presidents 21Effective Public Management
Americans age 25 and over did not hold college degrees; and by 2010, 61 percent of Americans still lacked a college degree. The least educated households have fared better under Obama than Bush-2: Across the three age groups, the median income of households headed by people without high school diplomas grew an average of 0.3 percent per year in Obama’s first term, compared to income losses averaging 1.7 percent per year as they aged under Bush-2. However, households headed by high school graduates lost more ground under Obama than under Bush-2: Across the three age-cohorts, their median household incomes fell by an average of 0.3 percent per year as they aged under Bush-2, compared to average income losses of 1.5 percent per year in Obama’s first term.
Only those households headed by college graduates made progress under Bush-2 and Obama, and their gains were modest. Across the three age groups, the median income of those households grew an average of 1.2 percent per year under Bush-2 and 1.3 percent per year in Obama’s first term. By contrast, the median income of households headed by college graduates of the same ages grew 4.0 percent per year under Reagan and 2.6 per year percent under Clinton.
Tables presenting the data on the cumulative rates of income gains or losses for each group are provided in Appendix 2, Table A2-7. Figures depicting the income paths of the three age groups under each president, for households headed by people without high school diplomas, those headed by high school graduates, and those headed by college graduates are also provided in Appendix 2, Figures A2-13A, A2-13B, and A2-13C.
vI. WHat We can do about tHe IncoMes crIsIs
The analysis of these extensive data establishes that our current problems with incomes are neither a long-term feature of the U.S. economy nor merely an after-effect of the 2008-2009 financial upheaval. Our analysis further shows that these problems also are not driven by economic impediments based on gender, race and ethnicity, or even education. To promote strong, broad-based income progress again, policymakers will have to draw on both historical memory and new analysis. In this effort, we will first identify the economic strategies and policies that helped support the broad, steady income gains of the Clinton and Reagan presidencies. Second, we will assess the economic developments and policies of the last decade which have contributed to the deep erosion of normal income gains and suggest how policymakers could better respond to those conditions. Only by carefully analyzing all of these matters can we build a new program that can help restore income progress and broader economic prosperity.
Income growth and decline under recent U.S. presidents 22Effective Public Management
What worked in the 1990s and 1980s would help today
Three elements of this program are familiar features from Clinton and Reagan’s economic programs. First, both presidents pursued basically sensible macroeconomic policies by raising substantial new revenues and slowing the growth of certain areas of spending. To be sure, Clinton pursued this approach from the beginning, back-loaded their impact while the economy was fragile, and eventually produced large budget surpluses. Reagan jolted a depressed economy with huge tax cuts and large military spending increases, and then came around to fiscal consolidation with four rounds of tax increases and steps to stabilize military spending. By contrast, Bush-2 treated the brief 2001 downturn with large, permanent tax cuts, and compounded that fiscal mistake with open-ended spending increases for the Iraq and Afghanistan conflicts and a new entitlement (Medicare Part D) with no provisions to finance it. Obama downsized the huge deficits he inherited from Bush-2 and the financial crisis, drawing on both new revenues and spending restraints — and the health care reforms put a modest dent in long-term
Medicare and Medicaid spending — but the premature timing of the austerity measures slowed the economic recovery.
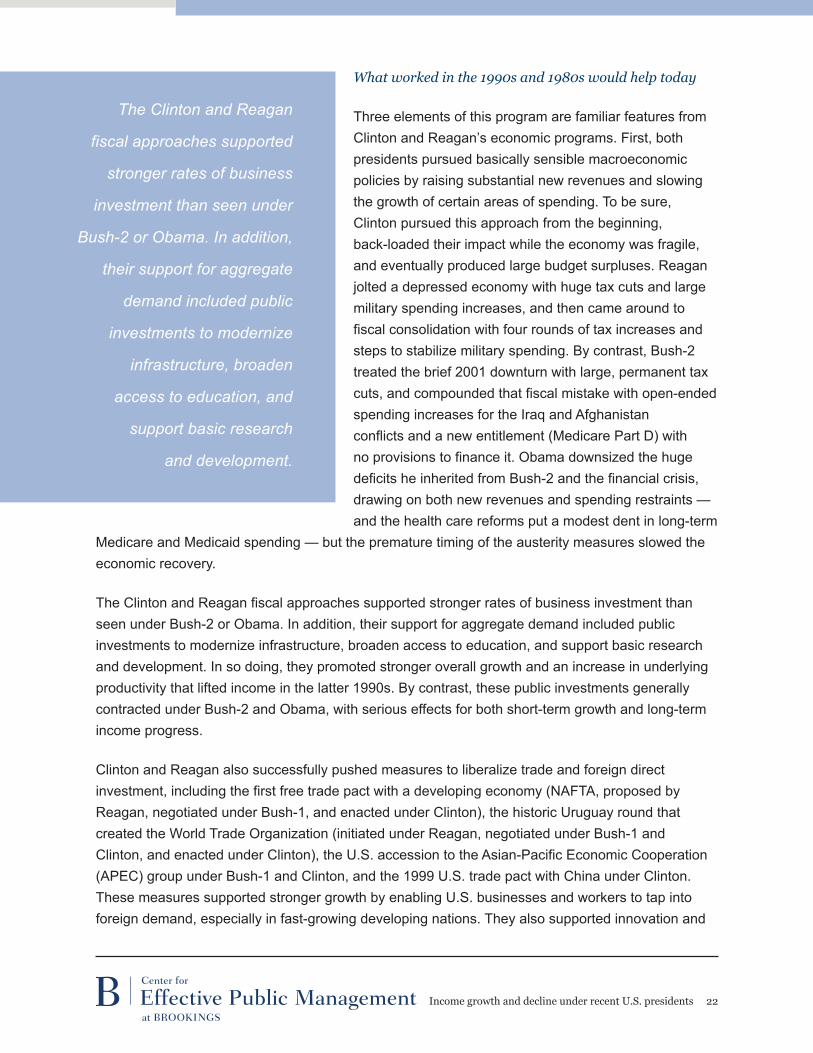
The Clinton and Reagan fiscal approaches supported stronger rates of business investment than seen under Bush-2 or Obama. In addition, their support for aggregate demand included public investments to modernize infrastructure, broaden access to education, and support basic research and development. In so doing, they promoted stronger overall growth and an increase in underlying productivity that lifted income in the latter 1990s. By contrast, these public investments generally contracted under Bush-2 and Obama, with serious effects for both short-term growth and long-term income progress.
Clinton and Reagan also successfully pushed measures to liberalize trade and foreign direct investment, including the first free trade pact with a developing economy (NAFTA, proposed by Reagan, negotiated under Bush-1, and enacted under Clinton), the historic Uruguay round that created the World Trade Organization (initiated under Reagan, negotiated under Bush-1 and Clinton, and enacted under Clinton), the U.S. accession to the Asian-Pacific Economic Cooperation (APEC) group under Bush-1 and Clinton, and the 1999 U.S. trade pact with China under Clinton. These measures supported stronger growth by enabling U.S. businesses and workers to tap into foreign demand, especially in fast-growing developing nations. They also supported innovation and
The Clinton and Reagan
fiscal approaches supported
stronger rates of business
investment than seen under
Bush-2 or Obama. In addition,
their support for aggregate
demand included public
investments to modernize
infrastructure, broaden
access to education, and
support basic research
and development.

Income growth and decline under recent U.S. presidents 23Effective Public Management
productivity gains by intensifying competition, and reduced many consumer prices by attracting lower-price imports. By contrast, multilateral trade talks failed to produce new agreements under Bush-2 or Obama, although Obama continues to press for new accords with the European Union and 11 Pacific Rim nations, including Japan.
First, a program to revive broad income progress should begin by reinvigorating sensible, bipartisan approaches to contain budget deficits without undermining growth, mainly by reforming health care spending and raising additional revenues; second, reinvigorate public investment, especially in modern infrastructure networks and universal access to advanced skills; and third, extend trade liberalization to services, advanced manufacturing, and agriculture.
The impact of globalization on incomes
A new program to restore broad income progress also must address a set of more recent developments that have weakened normal income gains. The first such development is globalization itself, which has accelerated sharply since the late 1990s. Consider, for example, that worldwide exports increased nearly four-fold from 1995 to 2013, rising from $4.8 trillion to $16.7 trillion; and over the same period, the stock of worldwide foreign direct investment (FDI) grew more than seven-fold, from about $3.4 trillion in 1995 to $25.5 trillion in 2013.4 Behind these increases are tens of thousands of new businesses across the world, as well as thousands of new foreign operations by established companies. The first order effect of such rapid growth of new enterprises engaged in global trade, along with the vast expansion of global investments by established companies, is competitive pressures become much more intense. Greater competition is good economically — it drives growth and productivity by forcing businesses to come up with better or cheaper goods and services, and it gives everyone more access to the world’s lowest-priced goods and services. As a result, an intensification of competition exerts downward pressures on prices, which is why inflation has been historically low here and across most of the world since the mid-1990s, despite very expansionary monetary policies and strong demand in many places.
Recent developments show that these dynamics, promoted by the historic trade liberalization of the 1980s and 1990s, also have a dark side, when businesses face rising costs and the intense competition promoted by globalization limits their ability to pass along those costs by raising their prices. As globalization gained steam around the turn of this century, and American businesses faced higher costs for energy, employee health care and pensions, many of them found they had to cut back on other costs. It is now clear that thousands of them responded by cutting wages and jobs, especially since most businesses were also reorganizing their operations to take greater advantage of the new information and Internet technologies. Since we cannot insulate ourselves from the
4 World Bank (2015). “World Integrated Trade Solution.” http://wits.worldbank.org/CountryProfile/Country/CHN/Year/2013/SummaryText; United Nations Conference on Trade and Investment (2015). Table on FDI Inward Stock by Region and Country. http://unctad.org/en/pages/DIAE/World%20Investment%20Report/Annex-Tables.aspx

Income growth and decline under recent U.S. presidents 24Effective Public Management
competitive pressures associated with globalization — and if we could, it would cost us more than we could possibly gain — policymakers will have to address rising costs on businesses.
There is good news on one front, as the increases in health care and insurance premium costs have been relatively modest since 2011. However, we do not know if this moderation is a one-time adjustment to the Affordable Care Act (ACA), as seems likely, or a permanent reduction in the trend growth rate of medical care costs. In either case, policymakers should consider strengthening and expanding provisions of the ACA directed to slowing cost increases. They can start by beefing up regulations to encourage hospitals and practitioners to adopt the most efficient practices of other hospitals and practitioners. Furthermore, the government could actively promote the development of such best practices by holding competitions to come up with effective, new cost-saving approaches, and awarding the winners contracts to apply their approaches to Medicare and the veterans’ health system.
The next president also could target three aspects of medical costs unaddressed by the ACA — malpractice tort reform, a public insurance option for places with little market competition among insurers, and a requirement that physicians with privileges at hospitals that accept Medicare and private insurance plans also accept patients with that coverage. Finally, if these measures prove inadequate or out-of-reach politically, policymakers could consider ways to directly reduce the health care costs of businesses and individuals. For example, firms or households that purchase insurance plans which raise their annual premiums, copayments and deductibles by no more than overall inflation plus one percent, without cutting back coverage, could receive an additional tax credit. This approach would channel consumer demand to insurers that succeed in holding down price increases, and channel insurer demand to hospitals and practitioners that also make those efforts.
Energy costs rose sharply and remained high from 2002 to 2008 and again from 2010 to 2013, before falling sharply since mid-2014. It won’t last. When oil prices declined at comparable rates in the mid-1980s, in the late 1990s, and in the Great Recession of 2008-2009, they bounced back in one-to-three years. Within a comparable period, U.S. energy prices will rise sharply again, exerting renewed pressures on jobs and wages. The president and Congress can help relieve those cost pressures on businesses by encouraging greater production and use of those fuels such as natural gas, nuclear energy, solar and wind power whose prices fall when their domestic production expands, because their prices are set by domestic supply and demand rather than by world markets. Since those forms of energy also produce much less carbon than coal or oil, the best way to promote their increased production and use is a carbon-based tax. Such a tax also could be linked to payroll tax reductions that would offset the additional burden on households and businesses. This type of tax shift could help address not only energy-related cost pressures on wages but also the growing risks of climate change, without slowing the economy and destroying jobs on a net basis.
Job creation is such a basic aspect of income progress that it deserves additional, targeted initiatives. Compared to the 1990s and 1980s, job creation in the 2002-2007 expansion slowed

Income growth and decline under recent U.S. presidents 25Effective Public Management
substantially relative to economic growth, as it has to a lesser degree in the current expansion. While unemployment fell substantially in the last two years, job creation remains a serious problem: Nearly half of the recent progress with the unemployment rate reflects declining labor force participation, or more precisely, the share of that decline unrelated to baby boomer retirements. A new job creation initiative should begin with young businesses, because young firms in their early expansion phases create a disproportionate number and share of all new jobs. Since rates of new business survival have slowed since the 1990s, measures to strengthen business creation and survival should also bolster job creation. The president and the Federal Reserve Board could encourage or require that banking institutions that draw on low-cost credit from the Fed dedicate a specified increment of their new credit creation to young enterprises. In addition, the President and Congress could allow multinational companies to bring back their foreign-source profits at a reduced tax rate if they dedicate a reasonable share of those profits to expanding their U.S. workforces.
The impact of information and Internet technologies
Beyond slow job creation and the incomes pressures associated with globalization, the recent slowdown in income progress also can be traced to the spread of advanced information and Internet technologies. Much like globalization, the wide application of these technologies has intensified competition and its attendant pressures on jobs and wages. The extraordinarily broad adoption of information technologies across countries as well as industries has given thousands of domestic and foreign businesses much greater access to all parts of the U.S. market, directly increasing competition. In addition, the Internet sharply reduces the cost of comparison shopping by both businesses and consumers, further heightening price competition. These developments cannot be reversed. However, the data show that incomes have continued to rise, albeit modestly, among well-educated people with IT and Internet-related skills. This suggests policy reforms to provide access for all adults to serious training in the use of these technologies.
To deliver that access, especially for young people from low-income families, America should join the world’s other advanced countries in providing higher education at low cost. President Obama’s recent proposal for two years of free tuition at community colleges is a good start, although many of those institutions already are starved for the funds needed to handle their current enrollments. The next administration could go further, broader and deeper: Shift the funds now devoted to student grants and loans to a new program that will cover tuition at any public colleges and universities for all in-state students that meet their requirements. This approach, at once, would broaden access to a college degree and dramatically reduce the debt burdens of future college students. Moreover, mastering these technologies is equally important for current workers and their efforts to earn higher wages and larger salaries. One strategy adopted by then-British Prime Minister Tony Blair provides grants to community colleges to defray the costs of keeping their computer labs open and staffed every evening and on weekends, so any adult can walk in and receive free training in the efficient use of these technologies.

Income growth and decline under recent U.S. presidents 26Effective Public Management
Inequality and Incomes Globalization and advanced technologies also can contribute to rising inequality by increasing the returns to capital. The connection is simple and direct: The top 20 percent of American households own 93 percent of all U.S. financial assets, and the top one percent own more than 40 percent of those assets. Moreover, when an extended period of slow growth accompanies historically high returns to capital, the combination can hold down income gains for many people. Yet, we cannot limit or reduce the returns to capital without also weakening the economy’s efficiency and capacity to innovate. Nevertheless, when those returns are abnormally high, as they have been for some time, we can claim some of those outsized returns to finance the initiatives to promote stronger growth and greater income progress. For example, President Obama has proposed higher capital gains taxes and a new tax on large financial institutions to finance more public investment and tax relief for middle-class families. Unfortunately, large investors already manage their capital gains in ways that avoid most tax, and financial institutions would pass along most of the burden of any new tax to their customers.
Instead, policymakers should consider more fundamental reforms of the way we tax businesses. To begin, these reforms should cover all firms, including entities such as LLCs and partnerships that generate more than half of all business revenues and profits but are not subject to the federal corporate tax. The owners of those businesses currently take advantage of numerous capital-based tax preferences, such as carried interest, and pay sharply-lower total tax on their profits under their personal income tax. To promote both greater efficiency and fairness, we should abolish the corporate tax and, instead, tax all business and capital income at the same rates as salaries and wages, regardless of the type of business that produced the income, with no capital-related tax preferences. Moreover, all business owners including shareholders of all public and private companies would have to pay the tax on their business or capital income in the year in which it is generated, whether or not the taxpayer has “cashed in” those annual gains. This approach should eliminate the economic distortions associated with scores of corporate and non-corporate tax preferences; and in a period of high returns to capital, it should also raise the revenues needed to fund many of the economic initiatives discussed earlier and, just possibly, a lower top personal tax rate.
The challenge of secular stagnation
Finally, there is some evidence that the United States and other advanced economies are experiencing “secular stagnation,” which occurs when large fiscal stimulus and zero interest rates do not produce the overall growth and business investment that expand employment and production. If this diagnosis is correct, the reasons would include our falling labor force growth and participation
Another decade like the
last 12 years will change
American politics and society
in unpredictable and almost
certainly disturbing ways.

Income growth and decline under recent U.S. presidents 27Effective Public Management
rates (blame the baby bust and the retirement of millions of Baby Boomers) and the recent slowdown in productivity gains (blame reduced business formation, R&D cuts, and the deficiencies of current public education). In addition, key industries here and abroad have significant overcapacity (blame China’s excessive investment boom and years of low interest rates here and in Europe and Japan), and businesses and households everywhere continue to focus resources on lowering their debt levels (blame the bubble).
If secular stagnation has taken hold, many of the approaches we have laid out can help address it, including increased public investments in R&D and education, more access to capital for new and young businesses, and continued trade liberalization. If the problem persists, policymakers can consider two more initiatives. First, immigration reforms that allow millions of undocumented people to participate fully in the labor force would boost growth; and second, a dose of higher inflation — 3 percent to 4 percent — would drive real interest rates negative for a period and so spur more investment.
Taken together, these various initiatives comprise a program aimed directly at stagnating and declining incomes. We cannot permit our current conditions to go unaddressed. From 2002 to 2013, through nine years of economic expansion and two years of recession, the median income of American households, across age cohorts, fell an average of 5.5 percent as they aged. The median incomes of households headed by people in their late-30s to mid-40s stagnated as they through this period, and the median incomes of households headed by people in their 50s fell by 22.5 percent. Across age cohorts, households headed by people without college degrees — covering two-thirds of all households — saw their median incomes fall by 9.4 percent (high school graduates) to 17.3 percent (no diploma). Households headed by college graduates and by people in their late-20s to mid-30s eked out modest income gains as they aged over this period, but those gains were a fraction of the progress that households of comparable education or age achieved in the 1990s and 1980s. Another decade like the last 12 years will change American politics and society in unpredictable and almost certainly disturbing ways. Such an outcome should be unacceptable to liberals, conservatives and moderates alike. Together, we must find ways to carry forward the reforms needed to restore the broad income progress that Americans earned in the 1980s, 1990s and most of the postwar era.

Income growth and decline under recent U.S. presidents 28Effective Public Management
appendIx 1THE USE OF MEDIAN HOUSEHOLD INCOME BY AGE COHORT, vERSUS AGGREGATE MEDIAN HOUSEHOLD INCOME, TO TRACK INCOME PROGRESS
To explore the differences between these two approaches to income growth and the conclusions they support, we start with typical statistics on aggregate median household income over time. For example, the measure increased during the 1983-1989 expansion by a little more than 12 percent. In contrast, the median income of households headed, for instance, by people who were 33-to-38 years old in 1983 increased by more than 28 percent from 1983 to 1989, when those same people reached 39-to-44 years old. Over the same years, the median income of households headed by people ages 26-to-30 in 1983, and ages 32-to-36 in 1989, increased more than 33 percent. All told, the median household income of these age cohorts as they grew older through the expansion of 1983-1989 increased by 2.2 times to 2.6 times faster than suggested by comparing levels of aggregate median household income in 1983 and 1989.
Such differences are also apparent in the recessions of the 1980s and 1990s, since the median income of households headed by people of various ages, as they aged through those recessions, fell much less than suggested by the dips in aggregate median household income. For example, aggregate median household income declined more than 4 percent in the 1990-1991 recession, from $52,306 in 1989 to $50,032 in 1991. The median income of the households headed by people 33-to-38 years old in 1983 fell from $71,463 in 1989 to $71,045 in 1991, when they were 41-to-46 years old, or by 0.6 percent. The results are similar for younger age cohorts in the 1990-1991 recession and for all age-cohorts in the 2001 recession (Table 1, above).
Both approaches define “median income” in the same way, to cover all salary and wage income, and all other “regular cash payments” such as those from pensions, social security, interest on bonds, and rental income. The measure does not include more irregular forms of income such as capital gains and dividends, claimed mainly by very high-income people, or regular noncash benefits such as food stamps and health benefits received disproportionately by lower-income people.
However, the two approaches cover very different sets of households. The conventional measure of aggregate median income covers all households headed by people ages 15-to-64. This approach, therefore, includes millions of households comprised or headed by people still in school (students ages 15-to-24 who head their own households) and millions of households headed by people partially or totally retired (many heads of households ages 60 and above). Since both groups have relatively lower incomes and bear larger costs in recessions, this helps to explain why this approach produces lower levels of median income. By contrast, our age-cohort analysis focuses on households headed by people ages 25-to-59, and therefore provides a more accurate picture of the income paths of households headed by people of working age.

Income growth and decline under recent U.S. presidents 29Effective Public Management
More important, the time series of aggregate median household income used in conventional analyses cannot accurately track the paths of household income over time, because the sample changes dramatically over any extended period. In 1980, the United States was comprised of some 81 million households; and the median household income was the one in the middle, with 40.5 million households earning more and 40.5 million households earning less. By 2013, there were 118 million U.S. households, and the median income was the level with 59 million households earning more and 59 million households earning less. From 1980 to 2013, the composition of the set of American households used in this measure changed dramatically, as millions of heads of households from the 1980s retired or died, many millions of younger people became old enough to enter the sample, and millions more were born and similarly aged into the sample. All of those changes make comparisons from one time to another statistically and analytically problematic.
The new age-cohort analysis avoids these problems by focusing on the incomes of various age-cohorts as they grow older over time, so the composition of the sample remains largely stable. This approach reveals the actual income dynamics obscured by using a time series of aggregate median income — namely, that as most Americans aged and gained more working experience and responsibility in the 1980s and 1990s, their incomes grew at strong and steady rates. It also reveals that this long period of income progress stopped around 2000 or 2002. Through the 2002 to 2007 expansion, for the first time on record, the incomes of most American households declined, stagnated or increased little even as they aged through that expansion. The incomes of most households also fell more sharply in the 2008-2009 recession than in earlier downturns, and continued to fall sharply in the early years of the current expansion. By 2012 and 2013, the incomes of many households appear to have leveled off and in some cases began to rise again.
What happened to incomes during the expansions of the late-1970s, 1980s, and 1990s
For the reasons stated, the typical time series of aggregate median household income systematically distorts what has happened to most Americans’ incomes. Figure A-1, below, further illustrates these differences for the years 1975 to 2000.
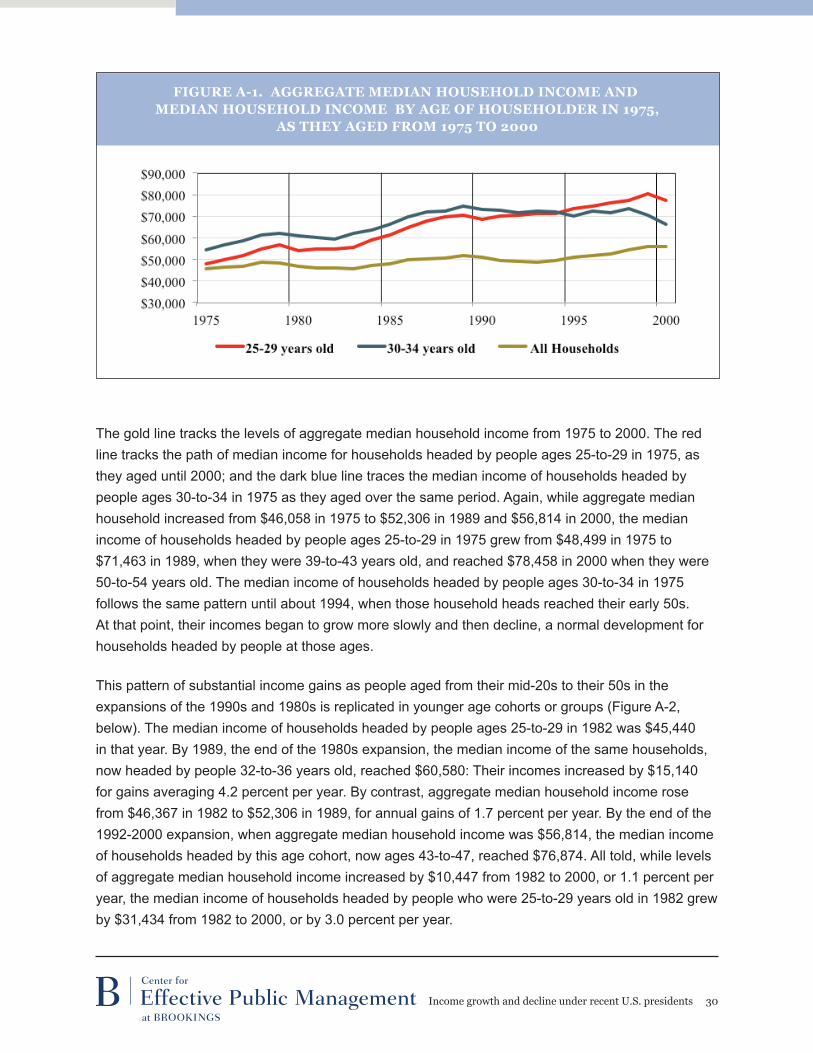
Income growth and decline under recent U.S. presidents 30Effective Public Management
The gold line tracks the levels of aggregate median household income from 1975 to 2000. The red line tracks the path of median income for households headed by people ages 25-to-29 in 1975, as they aged until 2000; and the dark blue line traces the median income of households headed by people ages 30-to-34 in 1975 as they aged over the same period. Again, while aggregate median household increased from $46,058 in 1975 to $52,306 in 1989 and $56,814 in 2000, the median income of households headed by people ages 25-to-29 in 1975 grew from $48,499 in 1975 to $71,463 in 1989, when they were 39-to-43 years old, and reached $78,458 in 2000 when they were 50-to-54 years old. The median income of households headed by people ages 30-to-34 in 1975 follows the same pattern until about 1994, when those household heads reached their early 50s. At that point, their incomes began to grow more slowly and then decline, a normal development for households headed by people at those ages.
This pattern of substantial income gains as people aged from their mid-20s to their 50s in the expansions of the 1990s and 1980s is replicated in younger age cohorts or groups (Figure A-2, below). The median income of households headed by people ages 25-to-29 in 1982 was $45,440 in that year. By 1989, the end of the 1980s expansion, the median income of the same households, now headed by people 32-to-36 years old, reached $60,580: Their incomes increased by $15,140 for gains averaging 4.2 percent per year. By contrast, aggregate median household income rose from $46,367 in 1982 to $52,306 in 1989, for annual gains of 1.7 percent per year. By the end of the 1992-2000 expansion, when aggregate median household income was $56,814, the median income of households headed by this age cohort, now ages 43-to-47, reached $76,874. All told, while levels of aggregate median household income increased by $10,447 from 1982 to 2000, or 1.1 percent per year, the median income of households headed by people who were 25-to-29 years old in 1982 grew by $31,434 from 1982 to 2000, or by 3.0 percent per year.

Income growth and decline under recent U.S. presidents 31Effective Public Management
The same pattern holds again for households headed by people ages 25-to-29 in 1991, just before the 1992-2000 expansion (Figure A-3, below). Their median income increased from $47,397 in 1991 to $68,718 in 2000, for gains of $21,321 or an average of 4.2 percent per year. Over the same period, aggregate median household income levels rose from $50,032 to $56,814, for gains of $6,782 or 1.4 percent per year.

Income growth and decline under recent U.S. presidents 32Effective Public Management
Table A-1, below, summarizes the data on the growth rates of household income as the heads of those households age using the two approaches. For example, the median income of households headed by people ages 25-to-29 in 1975 grew at average annual rates of 4.2 percent in the expansion of 1975-1979 and 3.67 percent per year in the expansion of 1982-1989, when those people were in their 20s and 30s. According to the aggregate median income series, incomes grew at 1.6 percent and 1.7 percent per year, respectively, in those expansions. Similarly, the median income of households headed by those ages 25-to-29 in 1982 grew by 4.2 percent per year through the 1982-1989 expansion, when they were in their 20s and 30s; and the median income of households headed by people 25-to-29 years old in 1991 grew at the same 4.2 percent annual rate through the 1992-2000 expansion. By the conventional approach, median income increased 1.7 percent and 1.4 percent per year, respectively, in those expansions.
table a-1: total and annual groWtH of IncoMes In expansIons and contractIons, 1976-2012, Measured by aggregate MedIan HouseHold
IncoMe and tHe MedIan IncoMe of HouseHolds Headed by people ages 25-to-29 In 1975, 1982, 1991 and 2001, as tHey aged
YearAggregate Median
Income
Households headed by people ages 25-29 in 1975
Households headed by people
ages 25-29 in 1982
Households headed by
people ages 25-29 in 1991
Households headed by
people ages 25-29 in 2001
1976-1979 6.5% (1.6%) 18.1% (4.2%) -- -- --
1980-1982 -5.5% (-1.9%) -2.8% (-1.0%) -- -- --
1983-1989 12.8% (1.7%) 28.4% (3.6%) 33.3% (4.2%) -- --
1990-1991 -4.3% (-2.2%) -0.6% (-0.3%) -0.9% (-0.4%) -- --
1992-2000 13.6% (1.4%) 10.4% (1.1%) 28% (2.8%) 45% (4.2%) --
2001 -2.4% -3.6% -0.5% -2.0% --
2002-2007 1.4% (0.2%) -11.7% (-2.1%) -3.1% (-0.5%) 5.3% (0.9%) 18.4% (2.9%)
2008-2009 -4.2% (-2.1%) -13.8% (-7.2%) -6.3% (-3.2%) -2.9% (-1.5%) -1.7% (-0.9%)
2010-2013 -3.8% (-1.0%) -13.1% (-3.4%) -13.5% (-3.6%) -2.2% (-0.5%) 4.6% (1.1%)
The age-cohort data also show that the median incomes of most households declined by much less through the recessions of the 1990s and 1980s than suggested by series of aggregate median household income. For example, while aggregate median household income fell 5.0 percent in the recession of 1980-1982 (from $49,063 in 1979 to $46,367 in 1982), the median income of households headed by people ages 25-to-29 in 1975 declined 1.0 percent over the same years (from $57,263 in 1979 to $55,640 in 1982) (Table A-1, above). Similarly, aggregate median household income fell 4.3 percent in the 1990-1991 recession, while the median income of households headed by people ages 25-to-29 in 1975 edged down just 0.6 percent from 1989 ($71,463) to

Income growth and decline under recent U.S. presidents 33Effective Public Management
1991($71,045),5 and the median income of households headed by people ages 25-to-29 in 1982 declined by just 0.9 percent (from $60,580 in 1989 to $60,038 in 1991).
This pattern changed in the 2001 recession. As in earlier downturns, while aggregate median household income fell by 2.4 percent in the 2001 recession (from $56,814 in 2000 to $55,426 in 2001), the median income of households headed by people ages 25-to-29 in 1982 fell by 0.5 percent (from $76,874 in 2000 to $76,505 in 2001). Similarly, the median income of households headed by people ages 25-to-29 in 2001 gained 3.9 percent in that year. However, older cohorts faced unusually large income losses in 2001 by historic standards: The median income of households headed by people ages 25-to-29 in 1975 fell by 3.6 percent in the 2001 recession, from $78,458 in 2000 to $75,655 in 2001. While this large drop reflected in part the slowdown in income progress typical of people in their 50s, that dynamic does not explain why the median incomes of households headed by people ages 25-to-29 in 1991 fell by 2.0 percent in the 2001 recession (from $68,718 in 2000 to $67,369 in 2001), when they were in their mid-to-late 30s. This was an early sign of the troubling income dynamics that have dominated the last decade.
What happened to incomes since 2000
The aggregate median household income series has continued to provide a distorted picture of most people’s income paths since 2000, even as the steady income gains achieved by most age-cohorts of households in the expansions of the 1970s, 1980s, and 1990s largely ended. In the expansion of 2002-2007, aggregate median household income inched up 1.4 percent, rising from $55,426 in 2001 to $56,177 in 2007. Using age-cohort analysis, we find that households headed by people ages 25-to-29 in 1982 experienced a modest decline in median income from 2002 to 2007: Their incomes fell from $76,505 in 2001, when they were 44-to-49 years old, to $74,154 in 2007 when they were ages 50-to-55, or by an average of 0.5 percent per year. Those of comparable ages in the 1992-2000 expansion, including households headed by people age 25-29 in 1975, had seen their incomes grow by 1.1 percent per year from 1992 to 2000. Younger cohorts fared better, but their income gains were both quite different from those suggested by the conventional approach and much smaller than those achieved by comparable age-cohorts groups in the expansions of the 1980s and 1990s. From 2002 to 2007, the median income of households headed by people ages 25-to-29 in 1991 increased by 0.9 percent per year, and 4.5 times greater than the 0.2 percent annual increase in aggregate median household income. In addition, their modest gains of 0.9 percent per year were less than one-third of the 2.8 percent average annual gains achieved by those in their mid-30s to mid-40s in the 1992-2000 expansion.
5 Demographics may explain part of the difference. While both measures focus mainly on earnings and therefore ex-clude most people who lost their jobs in the recession and remained unemployed for at least one year, this phenom-enon may be more common among those ages 15-to-24, who are included in aggregate median household income but not in our measure of household income as those heading those households age.

Income growth and decline under recent U.S. presidents 34Effective Public Management
As expected, the youngest age-cohort recorded the largest gains: The median incomes of households headed by people ages 25-to-29 in 2001 increased from $55,688 in 2002 to $63,218 in 2007, for average annual gains of 2.9 percent. While those incomes gains were substantial, they also were significantly smaller than the average annual income growth of households headed by people of the same ages, 25-to-29 years old, in the 1983-1989 expansion (4.2 percent) and the 1992-2000 expansion (4.2 percent). Of course, they also were much larger than the annual 0.2 percent gains using the aggregate median household income series.
In the 2008-2009 recession, every age group lost substantial ground. The median income of households headed by those age 25-to-29 in 1982, who were 51-to-55 years old in the Great Recession, fell 3.2 percent per year. Strikingly, those annual losses were less than the 3.6 percent annual losses by the comparable age cohort in the 2001 recession. Those losses were also substantially larger than the 2.1 percent annual decline derived from the aggregate median household income time series from 2007 to 2009. Younger cohorts fared better in the Great Recession, but still lost significant ground: Households headed by people ages 25-to-29 in 1991, who were 42-to-47 years old in the 2008-2009 recession, gave back an average of 1.5 percent per year of their median household incomes -- four times larger, as a share of income, than those experienced by households of comparable ages in the 1990-1991 recession. Even the youngest cohort, those 25-to-29 years old in 2001 and 32-to-37 years old during the 2008-2009 recession, saw their median household incomes fall 0.9 percent per year — again, compared to losses of 2.1 percent a year using aggregate median household income.
Moreover, the median incomes of many American households have continued to decline as they aged through the first four years of this expansion (2010-2013). The aggregate median household income series suggests that a typical American household lost about one percent of income per year over those four years. Age-cohort analysis shows, for example, that among the oldest cohort, households headed by those ages 25-to-29 in 1982 and 53-to-57 years old in 2010, median income declined 3.6 percent per year — losses also much greater than those experienced by older households in earlier expansions (Table A-1, above). The median incomes of households headed by people ages 25-to-29 in 1991, and thus 44-to-48 years old in 2010, also fell over this period by 2.2 percent or an average of 0.5 percent per year from 2010 to 2013. By comparison, the median incomes of households headed by people of comparable age during the 1992-2000 expansion increased 1.1 percent per year in that expansion. Even households headed by people age 25-to-29 in 2001, and thus 34-to-38 years old when the current expansion began in 2010, experienced relatively small income gains from 2010 to 2013. The recent 1.1 percent annual gains in median household income by the youngest cohort in 2010-2013 are about 30 percent of the size of the 3.6 percent annual growth in the median incomes of households headed by people of comparable ages in the 1983-1989 expansion, and about 40 percent of the 2.8 percent annual gains in the 1992-2000 expansion.

Income growth and decline under recent U.S. presidents 35Effective Public Management
The overall pattern of income growth
The following figures depict the income paths of the three age cohorts examined in detail above, as their heads of households aged from 25 years old to their late 50s, compared to the income path suggested by the aggregate median household income series.
Figure A-4, above, depicts the general patterns described in this analysis. While aggregate median household income (the gold line) moves only modestly, up or down, from 1982 to 2012, the income paths of households headed by people age 25-to-29 in 1982 (the red line) and of those household heads 30-to-34 years old in 1982 (the dark blue line) move up sharply and fairly steadily as they aged from 1982 to 2000. Similarly, aggregate median household income shows a gradual modest decline since 2000, while the age-cohort analysis shows much larger losses over that period.
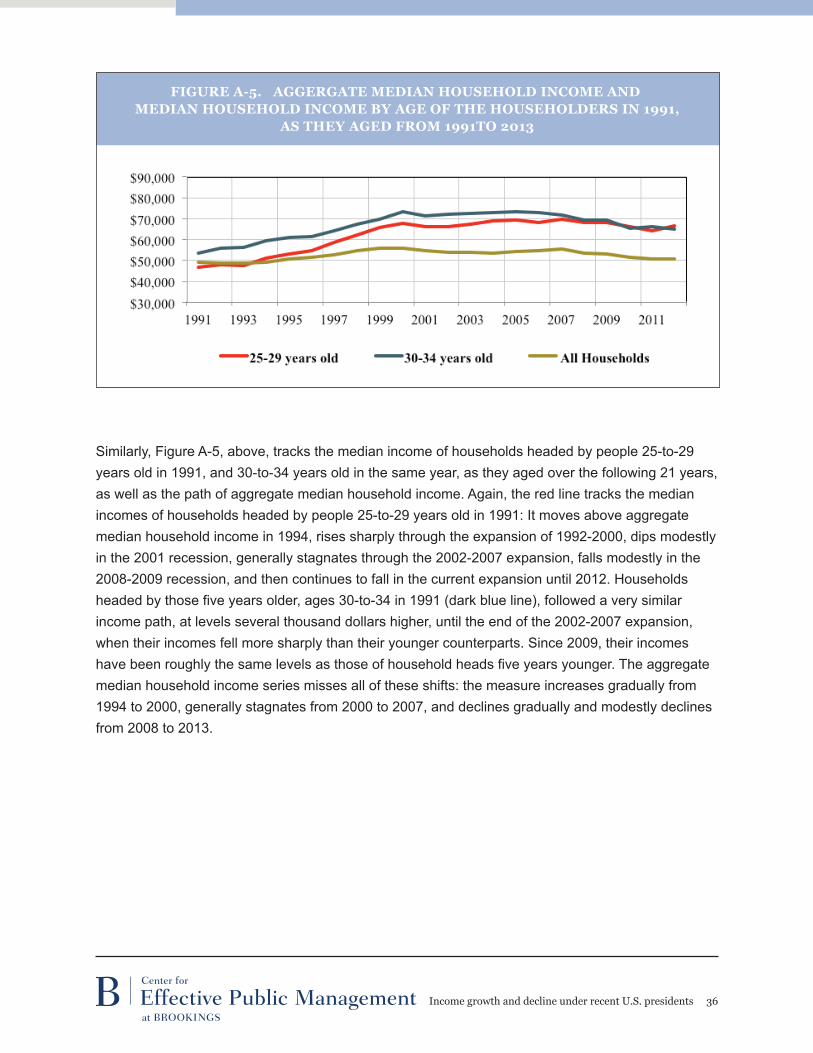
Income growth and decline under recent U.S. presidents 36Effective Public Management
Similarly, Figure A-5, above, tracks the median income of households headed by people 25-to-29 years old in 1991, and 30-to-34 years old in the same year, as they aged over the following 21 years, as well as the path of aggregate median household income. Again, the red line tracks the median incomes of households headed by people 25-to-29 years old in 1991: It moves above aggregate median household income in 1994, rises sharply through the expansion of 1992-2000, dips modestly in the 2001 recession, generally stagnates through the 2002-2007 expansion, falls modestly in the 2008-2009 recession, and then continues to fall in the current expansion until 2012. Households headed by those five years older, ages 30-to-34 in 1991 (dark blue line), followed a very similar income path, at levels several thousand dollars higher, until the end of the 2002-2007 expansion, when their incomes fell more sharply than their younger counterparts. Since 2009, their incomes have been roughly the same levels as those of household heads five years younger. The aggregate median household income series misses all of these shifts: the measure increases gradually from 1994 to 2000, generally stagnates from 2000 to 2007, and declines gradually and modestly declines from 2008 to 2013.

Income growth and decline under recent U.S. presidents 37Effective Public Management
The final figure, A-6 above, tracks the median income of households headed by the youngest age cohort, people ages 25-to-29 in 2001 and ages 30-to-34 in the same year, as they aged over the 12 years from 2001 to 2013. The red line tracks that the median incomes of households headed by people 25-to-29 years old in 1991: It moved above aggregate median household income by 2002, rose modestly through the 2002-2007 expansion, declined only slightly through the 2008-2009 recession and the first two years of the current expansion, and then turned up modestly in 2012. Their counterparts five years older (dark blue line), with incomes some $6,000 to $7,000 higher, registered little income change from 2002 to 2004, modest gains in 2005-2006, modest losses in the 2008-2009 recession, and more modest gains in 2010 and 2012. The aggregate median household income series (the gold line) remains basically unchanged from 2001 to 2007, and then declines gradually from 2008 to 2013.
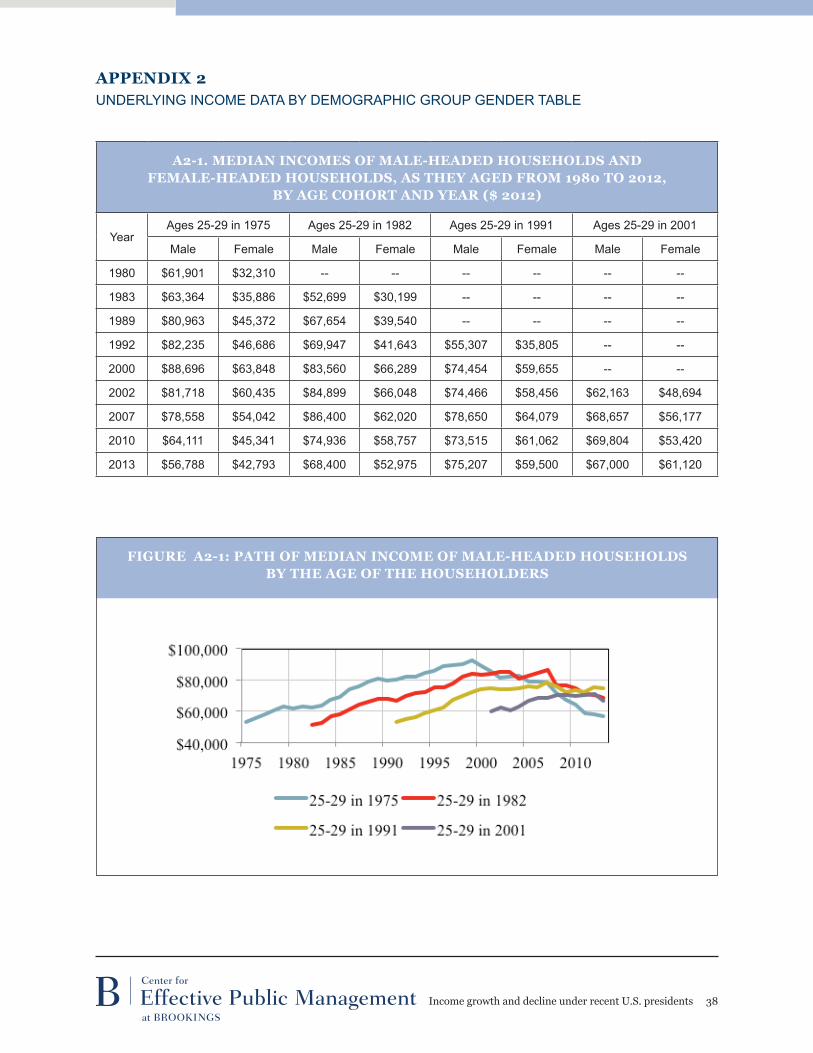
Income growth and decline under recent U.S. presidents 38Effective Public Management
appendIx 2 UNDERLYING INCOME DATA BY DEMOGRAPHIC GROUP GENDER TABLE
a2-1. MedIan IncoMes of Male-Headed HouseHolds and feMale-Headed HouseHolds, as tHey aged froM 1980 to 2012,
by age coHort and year ($ 2012)
YearAges 25-29 in 1975 Ages 25-29 in 1982 Ages 25-29 in 1991 Ages 25-29 in 2001
Male Female Male Female Male Female Male Female
1980 $61,901 $32,310 -- -- -- -- -- --
1983 $63,364 $35,886 $52,699 $30,199 -- -- -- --
1989 $80,963 $45,372 $67,654 $39,540 -- -- -- --
1992 $82,235 $46,686 $69,947 $41,643 $55,307 $35,805 -- --
2000 $88,696 $63,848 $83,560 $66,289 $74,454 $59,655 -- --
2002 $81,718 $60,435 $84,899 $66,048 $74,466 $58,456 $62,163 $48,694
2007 $78,558 $54,042 $86,400 $62,020 $78,650 $64,079 $68,657 $56,177
2010 $64,111 $45,341 $74,936 $58,757 $73,515 $61,062 $69,804 $53,420
2013 $56,788 $42,793 $68,400 $52,975 $75,207 $59,500 $67,000 $61,120

Income growth and decline under recent U.S. presidents 39Effective Public Management
table a2-2: gap betWeen tHe MedIan IncoMes of Male-Headed HouseHolds and feMale-Headed HouseHolds, by age coHort and year
Year Ages 25-29 in 1975 Ages 25-29 in 1982 Ages 25-29 in 1991 Ages 25-29 in 2001
1980 47.8% -- -- --
1983 43.4% 42.7% -- --
1989 44.0% 41.6% -- --
1992 43.2% 40.5% 35.3% --
2000 28.0% 20.7% 19.9% --
2002 26.0% 22.2% 21.5% 21.7%
2007 31.2% 28.2% 18.5% 18.2%
2010 -- 21.6% 16.9% 23.5%
2013 -- 22.6% 20.9% 18.8%

Income growth and decline under recent U.S. presidents 40Effective Public Management
table a2-3: total and annual groWtH In tHe MedIan IncoMe of Male-Headed HouseHolds ages 25-29, 35-39 and 45-49 WHen eacH
presIdent took offIce (adjusted), as tHey aged
PresidentHouseholds headed by Men
ages 25-29 in Year Two of each President’s Term
Households headed by Men ages 35-39 in Year Two of each
President’s Term
Households headed by Men ages 45-49 in Year Two of each
President’s Term
Reagan 34.8% (3.8%) 25.5% (2.9%) 7.4% (0.9%)
Bush-1 9.8% (2.4%) 4.5% (1.1%) -3.6% (-0.9%)
Clinton 44.9% (4.7%) 18.7% (2.2%) -2.1% (-0.3%)
Bush-2 17.6% (2.0%) -3% (-0.4%) -9.3% (-1.2%)
Obama 14.4% (3.4%) -3.8% (-1.0%) -2.1% (-0.5%)
table a2-4: total and annual groWtH In tHe MedIan IncoMe of feMale-Headed HouseHolds ages 25-29, 35-39 and 45-49 WHen eacH presIdent
took offIce (adjusted), as tHey aged
PresidentHouseholds headed by Women ages 25-29 in Year Two of each
President’s Term
Households headed by Women ages 35-39 in Year Two of each
President’s Term
Households headed by Women ages 45-49 in Year Two of
each President’s Term
Reagan 39.3% (4.2%) 36.2% (3.9%) 3.5% (0.4%)
Bush-1 1.2% (0.3%) 15.7% (3.7%) -0.9% (-0.2%)
Clinton 77.1% (7.4%) 57.4% (5.8%) 25.6% (2.9%)
Bush-2 14.2% (1.7%) 8.7% (1.0%) -5.5% (-0.7%)
Obama 9.7% (2.3%) 8.2% (2.0%) -11.1% (-2.9%)

Income growth and decline under recent U.S. presidents 41Effective Public Management
RACE AND ETHNICITY

Income growth and decline under recent U.S. presidents 42Effective Public Management
table a2-5: gap betWeen tHe MedIan IncoMes of non-HIspanIc WHIte-Headed HouseHolds and afrIcan-aMerIcan-Headed and HIspanIc
HouseHolds, by age coHort and year
YearAges 25-29 in 1975 Ages 25-29 in 1982 Ages 25-29 in 1991 Ages 25-29 in 2001
Black Hispanic Black Hispanic Black Hispanic Black Hispanic
1980 35.7% 31.9% -- -- -- -- -- --
1983 39.6% 33.8% 42.6% 33.4% -- -- -- --
1989 33.2% 33.3% 42.3% 39.4% -- -- -- --
1992 40.5% 41.4% 44.0% 37.4% 48.9% 33.9% -- --
2000 42.2% 35.1% 40.7% 36.5% 37.3% 35.2% -- --
2002 43.6% 38.7% 45.5% 40.9% 39.2% 39.6% 45.3% 35.2%
2007 42.6% 33.8% 45.1% 36.2% 36.4% 37.5% 43.6% 38.1%
2010 -- -- 44.9% 35.9% 44.7% 39.7% 49.4% 42.2%
2013 -- -- 41.1% 35.2% 44.0% 37.7% 44.5% 44.2%

Income growth and decline under recent U.S. presidents 43Effective Public Management

Income growth and decline under recent U.S. presidents 44Effective Public Management
EDUCATION
table a2-6: MedIan IncoMes of HouseHolds Headed by college graduates (college), HIgH scHool graduates (Hs) and people WItH no
HIgH scHool dIploMa (no-d), as tHey aged froM 1980 to 2013 ($ 2013)
YearAges 25-29 in 1975 Ages 25-29 in 1982 Ages 25-29 in 1991 Ages 25-29 in 2001
NO-D HS College NO-D HS College NO-D HS College NO-D HS College
1980 $33,184 $51,270 $69,975 -- -- -- -- -- -- -- -- --
1983 $31,157 $47,134 $76,753 $25,123 $44,466 $60,251 -- -- -- -- -- --
1989 $40,164 $59,510 $98,524 $30,834 $54,640 $85,363 -- -- -- -- -- --
1992 $31,387 $61,895 $102,761 $31,314 $53,518 $88,778 $26,320 $42,294 $70,167 -- -- --
2000 $33,818 $64,930 $116,948 $37,876 $64,544 $112,832 $37,037 $56,000 $102,130 -- -- --
2002 $33,679 $57,795 $111,412 $36,611 $65,401 $112,023 $35,018 $54,413 $103,856 $32,377 $45,327 $80,384
2007 $24,922 $52,995 $102,916 $32,852 $59,588 $116,186 $33,706 $57,301 $112,354 $28,089 $48,312 $93,254
2010 -- -- -- $26,708 $53,723 $107,366 $31,009 $48,724 $106,853 $27,092 $44,228 $95,088
2013 -- -- -- $23,300 $49,225 $99,532 $32,122 $50,000 $109,000 $30,000 $47,459 $100,162

Income growth and decline under recent U.S. presidents 45Effective Public Management

Income growth and decline under recent U.S. presidents 46Effective Public Management
table a2-7: total groWtH In MedIan IncoMes of HouseHolds Headed by people WItHout HIgH scHool dIploMas (no-d), HIgH scHool
graduates (Hs), and college graduates (college), ages 25-29, 35-39, and 45-49, froM year tWo of eacH presIdent’s terM
PresidentAges 25-to-29 Ages 35-to-39 Ages 45-to-49
NO-D HS College NO-D HS College NO-D HS College
Reagan 11.8% 24.7% 52.9% 12.3% 23.1% 39.9% -8.1% -4.7% 20.7%
Bush-1 0.3% 0.4% 19.8% -3.1% -3.8% 6.6% -18.2% -10.8% 4.1%
Clinton 34.7% 34.6% 52.4% 28.5% 20.6% 17.5% -6.3% -3.9% 3.0%
Bush-2 -14.0% 13.1% 31.7% -12.2% -2.1% 3.2% -12.6% -15.3% -2.6%
Obama 1.5% 2.3% 20.8% 6.9% -6.9% 1.3% -4.6% -12.8% -4.8%

Income growth and decline under recent U.S. presidents 47Effective Public Management

Income growth and decline under recent U.S. presidents 48Effective Public Management

Effective Public Management
eMaIl your coMMents to [email protected]
This paper is distributed in the expectation that it may elicit useful comments and is subject to subsequent revision. The views expressed in this piece are those of the authors and should not be attributed to the staff, officers or trustees of the Brookings Institution.
governance studies The Brookings Institution1775 Massachusetts Ave., NWWashington, DC 20036Tel: 202.797.6090Fax: 202.797.6144brookings.edu/governance
editorChristine JacobsBeth Stone
production & layoutBeth StoneNick McLellan